initiation and early kinematic evolution of solar eruptions
TRANSCRIPT
Initiation and Early Kinematic Evolution of Solar Eruptions
X. Cheng1,2,3 , J. Zhang4, B. Kliem5 , T. Török6 , C. Xing1,3, Z. J. Zhou7, B. Inhester2, and M. D. Ding1,31 School of Astronomy and Space Science, Nanjing University, Nanjing 210023, People’s Republic of China; [email protected]
2 Max Planck Institute for Solar System Research, Gottingen, D-37077, Germany3 Key Laboratory of Modern Astronomy and Astrophysics (Nanjing University), Ministry of Education, Nanjing 210093, People’s Republic of China
4 Department of Physics and Astronomy, George Mason University, Fairfax, VA 22030, USA5 Institute of Physics and Astronomy, University of Potsdam, D-14476 Potsdam, Germany6 Predictive Science Inc., 9990 Mesa Rim Road, Suite 170, San Diego, CA 92121, USA
7 School of Atmospheric Sciences, Sun Yat-sen University, Zhuhai, Guangdong, 519000, People’s Republic of ChinaReceived 2019 October 7; revised 2020 March 24; accepted 2020 April 7; published 2020 May 8
Abstract
We investigate the initiation and early evolution of 12 solar eruptions, including six active-region hot channel andsix quiescent filament eruptions, which were well observed by the Solar Dynamics Observatory, as well as by theSolar Terrestrial Relations Observatory for the latter. The sample includes one failed eruption and 11 coronal massejections, with velocities ranging from 493 to 2140kms−1. A detailed analysis of the eruption kinematics yieldsthe following main results. (1) The early evolution of all events consists of a slow-rise phase followed by a main-acceleration phase, the height–time profiles of which differ markedly and can be best fit, respectively, by a linearand an exponential function. This indicates that different physical processes dominate in these phases, which is atvariance with models that involve a single process. (2) The kinematic evolution of the eruptions tends to besynchronized with the flare light curve in both phases. The synchronization is often but not always close. A delayedonset of the impulsive flare phase is found in the majority of the filament eruptions (five out of six). This delay andits trend to be larger for slower eruptions favor ideal MHD instability models. (3) The average decay index at theonset heights of the main acceleration is close to the threshold of the torus instability for both groups of events(although, it is based on a tentative coronal field model for the hot channels), suggesting that this instabilityinitiates and possibly drives the main acceleration.
Unified Astronomy Thesaurus concepts: Solar coronal mass ejections (310); Stellar coronal mass ejections (1881);Solar storm (1526)
Supporting material: animation
1. Introduction
Coronal mass ejections (CMEs) are the largest explosivephenomena in the solar system. Occurring in the solaratmosphere, they can eject a large quantity of plasma andmagnetic flux into the interplanetary space. When themagnetized plasma arrives at the Earth, it will interact withthe magnetosphere, potentially producing severe space weathereffects, thus affecting the safety of human high-tech activities,especially in outer space (Gosling 1993; Webb et al. 1994).
White-light coronagraph observations revealed that CMEs oftenhave a three-part structure: a bright front followed by a brightcore embedded in a dark cavity (Illing & Hundhausen 1983).The bright front originates from plasma pile-up at the front of theexpanding CME (e.g., Vourlidas et al. 2003; Cheng et al. 2014a).The cavity, or its central part, is usually interpreted to be acoherent helical flux rope (e.g., Dere et al. 1999; Gibson &Fan 2006; Riley et al. 2008; Song et al. 2017). The brightcore represents dense plasma usually attributed to an eruptingfilament/prominence, which is suspended in magnetic dips of aflux rope or in a sheared arcade prior to the eruption (e.g., Guoet al. 2010; Inoue et al. 2013; Jiang et al. 2014; Su et al. 2015;Yan et al. 2015), but it can also consist of swept-up loops(Veronig et al. 2018). Sometimes, a fourth component, a shock,
appears at the front and flanks of the CME, if its expansionvelocity exceeds the local Alfvén speed (Vourlidas et al. 2003;Kwon et al. 2014).The kinematic evolution of CMEs is usually comprised of
three phases: a slow-rise phase of approximately uniformvelocity, an impulsive main-acceleration phase, and a propaga-tion phase with only slowly varying velocity (Zhang et al.2001, 2004). The slow-rise and main-acceleration phases areoften also displayed by an associated filament/prominenceeruption (e.g., Sterling et al. 2007, 2011).To understand the initiation and early evolution of CMEs,
the relationship between their kinematic evolution and the lightcurve of their associated flares has been studied extensively.The three CME evolution phases were found to correspond to,respectively, the pre-flare phase, rise phase, and decay phase ofthe associated flare in soft X-rays (SXRs; Neupert et al. 2001;Zhang et al. 2001, 2004; Cheng et al. 2010; Bein et al. 2012).This is further supported by a statistical study of a sample of 22CMEs performed by Maričić et al. (2007). However, thoseauthors pointed out that the onset of the flare rise phase wasdelayed with respect to the onset of the CME main-accelerationphase in some of their events. In addition, Qiu et al. (2004) andTemmer et al. (2008, 2010) uncovered that the acceleration ofCMEs and the hard X-ray flux of the associated flares are oftensynchronized as well. These results strongly suggest that CMEsand flares are two distinct manifestations of the same process(or processes), which is a violent disruption of the coronalmagnetic field (e.g., Forbes 2000).
The Astrophysical Journal, 894:85 (20pp), 2020 May 10 https://doi.org/10.3847/1538-4357/ab886a© 2020. The Author(s). Published by the American Astronomical Society.
Original content from this work may be used under the termsof the Creative Commons Attribution 4.0 licence. Any further
distribution of this work must maintain attribution to the author(s) and the titleof the work, journal citation and DOI.
1

The kinematic evolution of a CME low in the corona can beobtained by following the eruption of features of the pre-eruptive configuration. The most common tracers of pre-eruptive configurations are filaments/prominences, which arecool and dense plasma embedded in the hot and tenuous corona(Mackay et al. 2010). Statistically, over 70% of CMEs areassociated with erupting filaments/prominences (e.g., Munroet al. 1979; Webb & Hundhausen 1987; Gopalswamy et al.2003). In addition to the association with erupting filaments/prominences, Cheng et al. (2011) and Zhang et al. (2012)discovered that the pre-eruptive configuration can also manifestas a hot plasma channel (or hot blob when viewed along itsaxis) in the Atmospheric Imaging Assembly (AIA; Lemenet al. 2012) 131 and 94Å passbands. Interestingly, hotchannels keep a coherent structure throughout the eruption(Zhang et al. 2012; Cheng et al. 2013b; Patsourakos et al. 2013;Nindos et al. 2015). This ensures that their heights (e.g., theirdistance from the solar surface) can be measured continuouslyand reliably in the whole AIA field of view.
When studying CME kinematics, the CME bright front isusually used to infer the CME height. This is, however,inappropriate when studying the early evolution of CMEs.Through analyzing a limb CME event, Patsourakos et al.(2010a) found that the CME originated from the fast expansionof a plasma bubble (also see Patsourakos et al. 2010b; Wanet al. 2016). They showed that the kinematic evolution of theCME actually included two components, one being associatedwith the lifting of the CME centroid (the geometric center ofthe bubble), and the other with the expansion of the CMEbubble. Furthermore, Cheng et al. (2013b) investigated theformation of two CMEs from erupting hot channels and foundthat the expansion of the channels coincided in time with theexpansion of the CME bubbles. Moreover, they found that thehot channel rose faster than the front of the CME bubble duringthe main-acceleration phase (also see Veronig et al. 2018).These results suggest that hot channels behave as a centralengine that drives the formation and acceleration of CMEsduring their early stage, and they are therefore a better tracer ofthe CME kinematics in this phase.
Several mechanisms have been suggested to explain theinitiation of CMEs (e.g., Green et al. 2018). One category ofmechanisms includes tether-cutting reconnection (Moore et al.2001) and breakout reconnection (Antiochos et al. 1999;Karpen et al. 2012). The former takes place in the center ofsigmoids low in the corona and transforms sheared arcades intoa flux rope, which then lifts off, driven by the rope’s magneticpressure, as a consequence of reduced line tying (e.g., Liuet al. 2010; Chen et al. 2014). The breakout mechanism resortsto reconnection at a high-lying X-line (or null point) locatedbetween central sheared flux and overlying flux connecting theouter polarities in a quadrupolar magnetic configuration. Byremoving the constraint of the overlying flux, the downwardtension is reduced, allowing the central flux to escape (e.g.,Gary & Moore 2004; Shen et al. 2012).
A second category invokes ideal MHD instabilities such asthe torus instability (Kliem & Török 2006; Olmedo &Zhang 2010) and the helical kink instability (Sakurai 1976;Fan & Gibson 2003; Kliem et al. 2004). The torus instabilityrefers to the expansion instability of a toroidal current channel(flux rope), which commences if the decay index of thebackground field exceeds the critical value of ∼1.5 (Kliem &Török 2006). Considering a more realistic flux rope structure
that resembles a line-tied partial torus, Olmedo & Zhang (2010)pointed out that the critical value depends on the ratio of the arclength of the partial torus and the circumference of a circulartorus with equal radius. Démoulin & Aulanier (2010) and Kliemet al. (2014) demonstrated that the torus instability is equivalentto a catastrophic loss of equilibrium in the MHD framework(Forbes & Isenberg 1991; Lin & van Ballegooijen 2002). Inaddition to the torus instability, the helical kink instability canalso initiate the eruption of a flux rope, if its twist numberexceeds a certain threshold (Fan & Gibson 2004; Török et al.2004). The latter varies for different flux rope configurations(Baty 2001). Once the helical kink instability takes place, theflux rope axis will writhe and present a distinct inverse-γ or Ωmorphology (e.g., Ji et al. 2003; Williams et al. 2005; Töröket al. 2010; Hassanin & Kliem 2016; Song et al. 2018).However, the observations indicate that this instability isunlikely a universal onset mechanism for solar eruptions,because a critical twist appears to be reached only in a minorityof their source regions. Moreover, this instability is not generallysuited as a mechanism for the main CME acceleration over alarge height range, because it tends to saturate quickly.The height–time profile of CMEs, h(t), in the early phase of an
eruption, and its association with the SXR flare light curve, orflux temporal profile, FSXR(t), can help to differentiate betweeninitiation models in three ways, which will be addressed in thepresent paper. First, the existence of a break between the slow-rise and main-acceleration phases argues against the suggestionthat a single process (e.g., “runaway reconnection”) is theprimary driver of the whole eruption. Second, any temporaloffset between h(t) and FSXR(t) favors ideal MHD models if h(t)is preceding, while it favors reconnection models if FSXR(t) ispreceding and the relevant flare onset is not masked by precursoractivity. Third, any correlation between the onset of eruptions,either of the slow-rise or main-acceleration phases, and thethreshold of the torus or helical kink instability favors the idealMHD model, because the threshold should not play any role inthe reconnection models.There have been many investigations of CME height–time
curves. Most have found an amplifying acceleration in the main-acceleration phase in basic agreement with all models, i.e., withinstability, both ideal and resistive, and with the idea of runawayreconnection. Acceleration profiles close to an exponential(Vršnak 2001; Gallagher et al. 2003; Williams et al. 2005) orclose to a power law (Kahler et al. 1988; Vršnak 2001; Alexanderet al. 2002; Schrijver et al. 2008) were typically found. Schrijveret al. (2008) demonstrated that both functional forms can resultfrom an ideal instability, with the exponential and power lawindicating small and sizable perturbations of an initial equili-brium, respectively. This implies that the specific form of themain acceleration has little bearing on the debate about eruptionmodels but rather on the magnitude of the perturbation thattriggers the onset of an eruption. Some authors obtainedsatisfactory fits to prominence height–time data assuminguniform acceleration (e.g., Gilbert et al. 2000; Gopalswamyet al. 2003). However, this assumption implies a discontinuity inthe acceleration at the onset of the main-acceleration phase,which is unphysical, and so, it only allows one to characterizethis phase roughly and in a global sense. The slow rise is oftenfound to be nearly linear (e.g., Sterling et al. 2007, 2011;Schrijver et al. 2008). Consequently, a break in characteristicbehavior between the slow-rise and main-acceleration phases isindicated by the majority of the previous studies.
2
The Astrophysical Journal, 894:85 (20pp), 2020 May 10 Cheng et al.
Quantitative investigations of whether the slow-rise andmain-acceleration phases show the same or different functionalforms were, to our knowledge, presented only by Kahler et al.(1988), who suggested a common power law for both, andSchrijver et al. (2008), who suggested different functions. Here,we first address the different findings by Kahler et al. (1988)and Schrijver et al. (2008) by studying the kinematics of alarger sample of 12 events observed with high resolution and athigh cadence (similar to those in Schrijver et al. 2008). Toaccount for the broad range of CME speeds, and to permitdisclosing potential differences between slow and fast CMEs,we have carefully chosen six eruptions from active regions andsix from the quiet Sun. The best fits of the h(t) data yield arelatively precise timing of the kinematic evolution, which isthen compared with the flare light curve for each event. Thismight either yield a discrimination between the ideal MHD andresistive eruption models, or provide information on how earlyand closely the feedback between flux rope instability andreconnection is established, thereby adding to the substantialexisting knowledge, which has not yet established a definitepicture (Zhang & Dere 2006; Maričić et al. 2007; Bein et al.2012). Similarly, a relatively precise height of the onset of boththe slow-rise and main-acceleration phases is obtained, whichwe utilize to determine whether one of these onsets is related tothe threshold of the torus instability.
We introduce the instruments in Section 2. The criteria forchoosing the sample are explained in Section 3, which isfollowed by the results in Section 4. The methods and resultsare discussed in Section 5, and the conclusions are summarizedin Section 6.
2. Instruments
The data sets are mainly from the AIA on board the SolarDynamics Observatory (SDO; Pesnell et al. 2012), which imagesthe corona almost simultaneously at temperatures from 0.06 to20 MK in 10 different passbands. The temporal cadence andspatial resolution are 12 s and 1 2, respectively. The two AIAhigh-temperature passbands, 131 and 94Å, with peak responsesat temperatures of ∼11 MK and ∼7 MK, respectively, are usedfor identifying hot channels and tracking their evolution in thelow corona; the AIA 304Å passband is for analyzing quiescentfilaments. In order to determine the height of filaments in 3D, theEUVI 304Å images of the Sun Earth Connection Coronal andHeliospheric Investigation (SECCHI; Howard et al. 2008) onboard the Solar Terrestrial Relations Observatory (STEREO) arealso utilized, although with a low cadence (10 minutes) andresolution (2 4). The 720 s line-of-sight magnetograms of thefull disk and daily updated synoptic maps provided by theHelioseismic and Magnetic Imager (HMI; Schou et al. 2012),also on board SDO, are taken as the bottom boundary conditionfor computing a 3D coronal magnetic field model byextrapolation. We also use the Large Angle and SpectrometricCoronagraph (LASCO; Brueckner et al. 1995) on board theSolar and Heliospheric Observatory to inspect the properties ofCMEs. The 1–8Å SXR flux of associated flares is provided bythe Geostationary Operational Environmental Satellite (GOES).
3. Event Selection
In this study, we collect 12 eruptive events including six hotchannel eruptions and six quiescent filament eruptions. Hotchannels originate from active regions with strong magnetic
fields and are prone to produce fast CMEs. The visibilityof the hot channels only in the AIA 131 and 94Å passbandsbut not in other cooler passbands proves their high-temperaturenature. Quiescent filaments are from long-time decayed activeregions with weak magnetic fields and usually give rise toslow CMEs.We select hot channels that are mostly located at or near the
solar limb. The low level of background and foregroundemission ensures that the edge of the hot channels is sharpenough to allow their height to be reliably tracked. The highcadence of the AIA data (compared to EUVI data) yields alarge number of data points, even though the hot channelsevolve rapidly. This results in the most accurate height–timedata currently available, which turns out to be crucial for thereliability of the fits and the derived break points and onsetheights. On the other hand, reliable magnetograms can thenonly be obtained 3–4 days before or after the eruptions, whichaffects the estimates of the decay index of the coronal field ateruption onset. Therefore, we selected only events thatoccurred at least several days after the emergence phase ofthe corresponding active regions, at which time the photo-spheric magnetic field evolved gradually.The quiescent filaments are selected using the catalog
compiled by McCauley et al. (2015) from a longitude rangeof ±60°. This permits daily updates of the eruption sourceregion in the synoptic magnetograms to be taken, which areused for the computation of the potential coronal field model.We require that the filaments have clear moving fronts duringthe eruption process, so that their height can be measuredcontinuously and reliably. To allow for the true height to bedetermined, we only select filaments with simultaneousobservations of the AIA and the EUVI from two perspectives,at least during part of the rise.Table 1 shows the basic properties of the 12 events. One can
see that all hot channel eruptions have an associated SXR flareand a corresponding CME, except the H2 event. Cheng et al.(2014b) and Tripathi et al. (2013) analyzed the H2 event in detailand found that its eruption was eventually confined by theoverlying field in the high corona and, thus, did not produce aCME. However, it still experienced a slow-rise phase and then amain-acceleration process during the beginning of the eruption.From Table 1, it can also be seen that the CMEs from the hotchannel eruptions do have a relatively high velocity in the rangeof ≈700–2100kms−1. For the CMEs from the quiescentfilaments, the velocity is inclined to be smaller, with a range of≈500–1400kms−1. Most of them lack detectable GOES SXR1–8Å flux, except the F1 and F5 eruptions, which produce tworelatively fast CMEs with velocities above 1100kms−1.Overall, the velocities of the CMEs constituting our samplecover a large range of CMEs (e.g., Yashiro et al. 2006; Zhang &Dere 2006). In this sense, the results from our small sample areapplicable to a broad range of events. Note that the velocity hererefers to an average projected value in the LASCO field of view.
4. Results
4.1. Early Kinematics of Solar Eruptions
4.1.1. Temporal Evolution of Height, Velocity, and Acceleration
We take the hot channel H3 and quiescent filament F1 asexamples to illustrate our analysis procedure. Figures 1(a) and(b) display the 131Å image of H3 and the 304Å image of F1,respectively. From the online, animated version of Figure 1,
3
The Astrophysical Journal, 894:85 (20pp), 2020 May 10 Cheng et al.
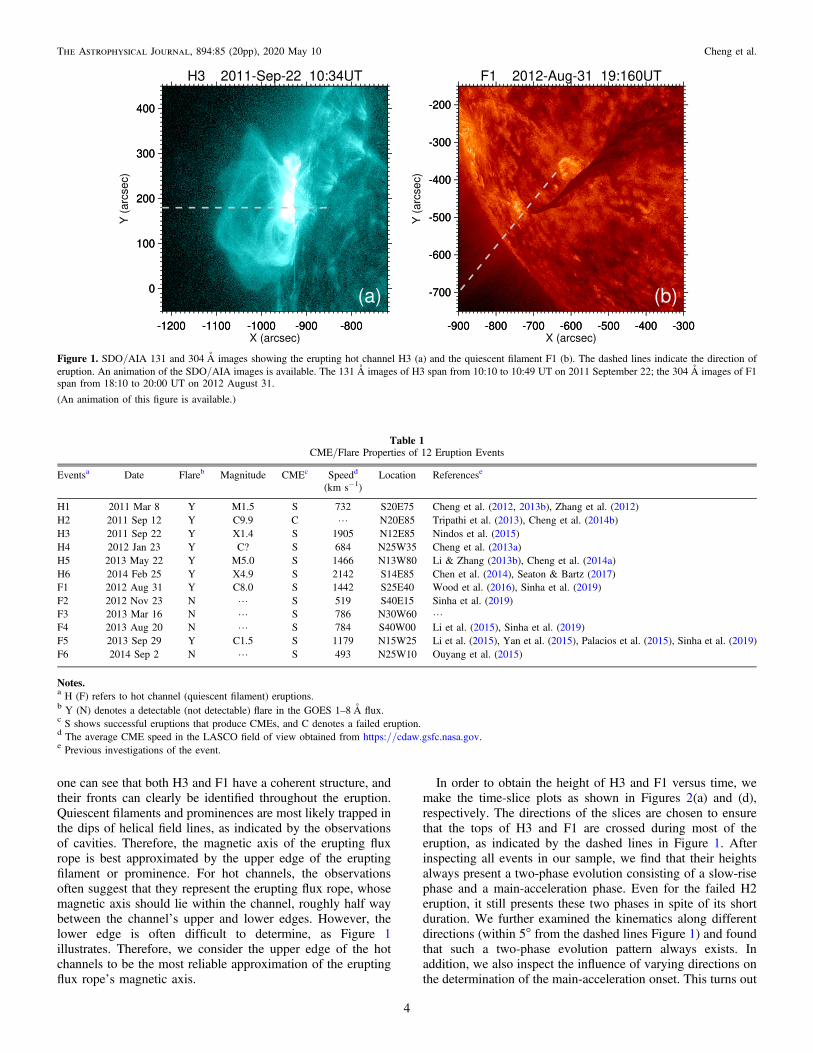
one can see that both H3 and F1 have a coherent structure, andtheir fronts can clearly be identified throughout the eruption.Quiescent filaments and prominences are most likely trapped inthe dips of helical field lines, as indicated by the observationsof cavities. Therefore, the magnetic axis of the erupting fluxrope is best approximated by the upper edge of the eruptingfilament or prominence. For hot channels, the observationsoften suggest that they represent the erupting flux rope, whosemagnetic axis should lie within the channel, roughly half waybetween the channel’s upper and lower edges. However, thelower edge is often difficult to determine, as Figure 1illustrates. Therefore, we consider the upper edge of the hotchannels to be the most reliable approximation of the eruptingflux rope’s magnetic axis.
In order to obtain the height of H3 and F1 versus time, wemake the time-slice plots as shown in Figures 2(a) and (d),respectively. The directions of the slices are chosen to ensurethat the tops of H3 and F1 are crossed during most of theeruption, as indicated by the dashed lines in Figure 1. Afterinspecting all events in our sample, we find that their heightsalways present a two-phase evolution consisting of a slow-risephase and a main-acceleration phase. Even for the failed H2eruption, it still presents these two phases in spite of its shortduration. We further examined the kinematics along differentdirections (within 5° from the dashed lines Figure 1) and foundthat such a two-phase evolution pattern always exists. Inaddition, we also inspect the influence of varying directions onthe determination of the main-acceleration onset. This turns out
Table 1CME/Flare Properties of 12 Eruption Events
Eventsa Date Flareb Magnitude CMEc Speedd Location Referencese
(km s−1)
H1 2011 Mar 8 Y M1.5 S 732 S20E75 Cheng et al. (2012, 2013b), Zhang et al. (2012)H2 2011 Sep 12 Y C9.9 C L N20E85 Tripathi et al. (2013), Cheng et al. (2014b)H3 2011 Sep 22 Y X1.4 S 1905 N12E85 Nindos et al. (2015)H4 2012 Jan 23 Y C? S 684 N25W35 Cheng et al. (2013a)H5 2013 May 22 Y M5.0 S 1466 N13W80 Li & Zhang (2013b), Cheng et al. (2014a)H6 2014 Feb 25 Y X4.9 S 2142 S14E85 Chen et al. (2014), Seaton & Bartz (2017)F1 2012 Aug 31 Y C8.0 S 1442 S25E40 Wood et al. (2016), Sinha et al. (2019)F2 2012 Nov 23 N L S 519 S40E15 Sinha et al. (2019)F3 2013 Mar 16 N L S 786 N30W60 LF4 2013 Aug 20 N L S 784 S40W00 Li et al. (2015), Sinha et al. (2019)F5 2013 Sep 29 Y C1.5 S 1179 N15W25 Li et al. (2015), Yan et al. (2015), Palacios et al. (2015), Sinha et al. (2019)F6 2014 Sep 2 N L S 493 N25W10 Ouyang et al. (2015)
Notes.a H (F) refers to hot channel (quiescent filament) eruptions.b Y (N) denotes a detectable (not detectable) flare in the GOES 1–8 Å flux.c S shows successful eruptions that produce CMEs, and C denotes a failed eruption.d The average CME speed in the LASCO field of view obtained from https://cdaw.gsfc.nasa.gov.e Previous investigations of the event.
Figure 1. SDO/AIA 131 and 304 Å images showing the erupting hot channel H3 (a) and the quiescent filament F1 (b). The dashed lines indicate the direction oferuption. An animation of the SDO/AIA images is available. The 131 Å images of H3 span from 10:10 to 10:49 UT on 2011 September 22; the 304 Å images of F1span from 18:10 to 20:00 UT on 2012 August 31.
(An animation of this figure is available.)
4
The Astrophysical Journal, 894:85 (20pp), 2020 May 10 Cheng et al.
to be smaller than that of varying the number of height–timedata points, as illustrated in Section 4.1.2.
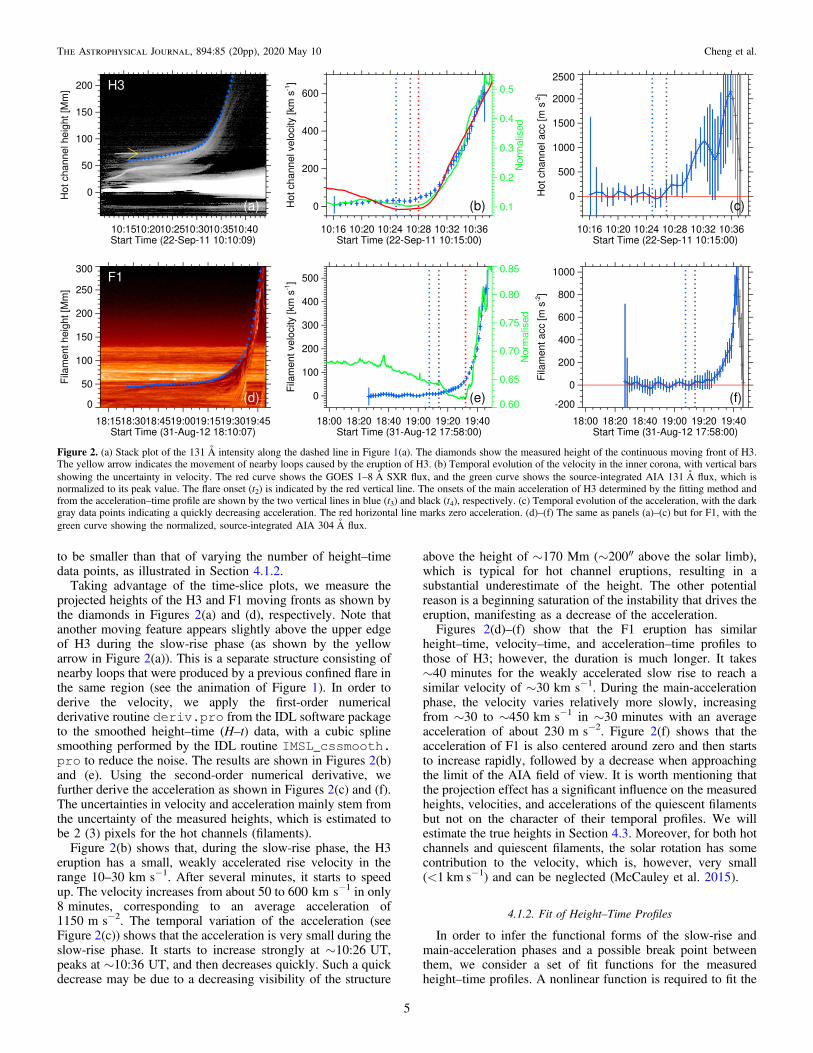
Taking advantage of the time-slice plots, we measure theprojected heights of the H3 and F1 moving fronts as shown bythe diamonds in Figures 2(a) and (d), respectively. Note thatanother moving feature appears slightly above the upper edgeof H3 during the slow-rise phase (as shown by the yellowarrow in Figure 2(a)). This is a separate structure consisting ofnearby loops that were produced by a previous confined flare inthe same region (see the animation of Figure 1). In order toderive the velocity, we apply the first-order numericalderivative routine deriv.pro from the IDL software packageto the smoothed height–time (H–t) data, with a cubic splinesmoothing performed by the IDL routine IMSL_cssmooth.pro to reduce the noise. The results are shown in Figures 2(b)and (e). Using the second-order numerical derivative, wefurther derive the acceleration as shown in Figures 2(c) and (f).The uncertainties in velocity and acceleration mainly stem fromthe uncertainty of the measured heights, which is estimated tobe 2 (3)pixels for the hot channels (filaments).
Figure 2(b) shows that, during the slow-rise phase, the H3eruption has a small, weakly accelerated rise velocity in therange 10–30kms−1. After several minutes, it starts to speedup. The velocity increases from about 50 to 600kms−1 in only8minutes, corresponding to an average acceleration of1150ms−2. The temporal variation of the acceleration (seeFigure 2(c)) shows that the acceleration is very small during theslow-rise phase. It starts to increase strongly at ∼10:26UT,peaks at ∼10:36UT, and then decreases quickly. Such a quickdecrease may be due to a decreasing visibility of the structure
above the height of ∼170 Mm (∼200″ above the solar limb),which is typical for hot channel eruptions, resulting in asubstantial underestimate of the height. The other potentialreason is a beginning saturation of the instability that drives theeruption, manifesting as a decrease of the acceleration.Figures 2(d)–(f) show that the F1 eruption has similar
height–time, velocity–time, and acceleration–time profiles tothose of H3; however, the duration is much longer. It takes∼40minutes for the weakly accelerated slow rise to reach asimilar velocity of ∼30kms−1. During the main-accelerationphase, the velocity varies relatively more slowly, increasingfrom ∼30 to ∼450kms−1 in ∼30minutes with an averageacceleration of about 230ms−2. Figure 2(f) shows that theacceleration of F1 is also centered around zero and then startsto increase rapidly, followed by a decrease when approachingthe limit of the AIA field of view. It is worth mentioning thatthe projection effect has a significant influence on the measuredheights, velocities, and accelerations of the quiescent filamentsbut not on the character of their temporal profiles. We willestimate the true heights in Section 4.3. Moreover, for both hotchannels and quiescent filaments, the solar rotation has somecontribution to the velocity, which is, however, very small(<1 km s−1) and can be neglected (McCauley et al. 2015).
4.1.2. Fit of Height–Time Profiles
In order to infer the functional forms of the slow-rise andmain-acceleration phases and a possible break point betweenthem, we consider a set of fit functions for the measuredheight–time profiles. A nonlinear function is required to fit the
Figure 2. (a) Stack plot of the 131 Å intensity along the dashed line in Figure 1(a). The diamonds show the measured height of the continuous moving front of H3.The yellow arrow indicates the movement of nearby loops caused by the eruption of H3. (b) Temporal evolution of the velocity in the inner corona, with vertical barsshowing the uncertainty in velocity. The red curve shows the GOES 1–8 Å SXR flux, and the green curve shows the source-integrated AIA 131 Å flux, which isnormalized to its peak value. The flare onset (t2) is indicated by the red vertical line. The onsets of the main acceleration of H3 determined by the fitting method andfrom the acceleration–time profile are shown by the two vertical lines in blue (t3) and black (t4), respectively. (c) Temporal evolution of the acceleration, with the darkgray data points indicating a quickly decreasing acceleration. The red horizontal line marks zero acceleration. (d)–(f) The same as panels (a)–(c) but for F1, with thegreen curve showing the normalized, source-integrated AIA 304 Å flux.
5
The Astrophysical Journal, 894:85 (20pp), 2020 May 10 Cheng et al.
main-acceleration phase; here, we include the exponential andthe power law, as suggested by previous work (see Section 1).We do not include the often-used tanh function (e.g., Sheeleyet al. 2007) because this extends the fitting into the propagationphase after the main acceleration, which is beyond the scope ofthe present investigation. Moreover, a linear or quadraticfunction appears appropriate for the slow-rise phase, as theacceleration in this phase is typically much weaker (Figure 2).A constant term includes the initial height for each event. Inorder to determine whether a break point exists, we comparethe nonlinear fit functions with a superposition of the nonlinearand the linear or quadratic functions. The superposition shouldyield the better fit in the presence of a break point. Theapplication of each fit function to the whole time series for eachevent ensures comparability between the fits, because themeasure of goodness, the reduced chi-squared, cn
2, is thenbased on the same number of data points for each fit function.
The fit is performed for the main part of the height–timeprofiles including all measured heights up to the final point ofincreasing acceleration. This is consistent with the character ofall fit functions, which do not include a decreasing secondderivative. In trying to fit the superposed functions to the data,it is found that the fitting software often cannot find a better fitwhen the quadratic term is included. In some cases, a poorer fitthan that excluding the quadratic term is obtained; although, avanishing coefficient for this term would be a valid solution,providing a very similar goodness of fit as the superpositionwith the linear function. In the interest of using a uniformmethod for all events, we have, therefore, dropped thequadratic term. This aspect is elaborated further by applyingthe quadratic fit function (including the linear term) only to theslow-rise phase that is inferred from the superposed fit. It turnsout that the uncertainty of the acceleration is bigger than, orcomparable to, the inferred acceleration for six of the 12 events(see detail below). This additionally suggests that the fitting ofthe slow-rise phase to a linear function should be restricted;although, the velocity data show a small increase in this phasefor several of our events. Thus, the following functions areemployed in the fitting:
= +h t a b t dexp , 1a1 1 1 1( ) ( ) ( )= - + +h t a b t t c t dexp , 1b2 2 2 0 2 2( ) [ ( )] ( )
= +h t a t d , 1cb3 3 33( ) ( )
= - + +h t a t t c t d , 1db4 4 0 4 44( ) ( ) ( )
where hi and t denote fitting height and time, respectively. Thequantities ai, bi, ci, di, and t0 are the coefficients of the functionsto be determined by the fit. The fit is performed by the routinempfit.pro (Markwardt 2009), which is available in the SolarSoftWare (SSW) package. The reduced chi-square cn
2 is
calculated by c-N m
2
, where c = å s== -ii N h t H t2
1i i
i
2
2
[ ( ) ( )] , N denotes
the number of data points, N−m is the number of the degreesof freedom, i.e., the number of data points minus the number offree parameters (m) in the fit function, and σi is the error foreach measured height Hi(t). The best fit is indicated when cn
2 isclosest to unity.
For the nonlinear component of the superposed functions, weemploy a two-step strategy. First, to minimize the differencebetween the purely nonlinear and the superposed fit functions,we set t0=0. This allows us to compare the resulting fits onthe formally most equal basis but implies the assumption that
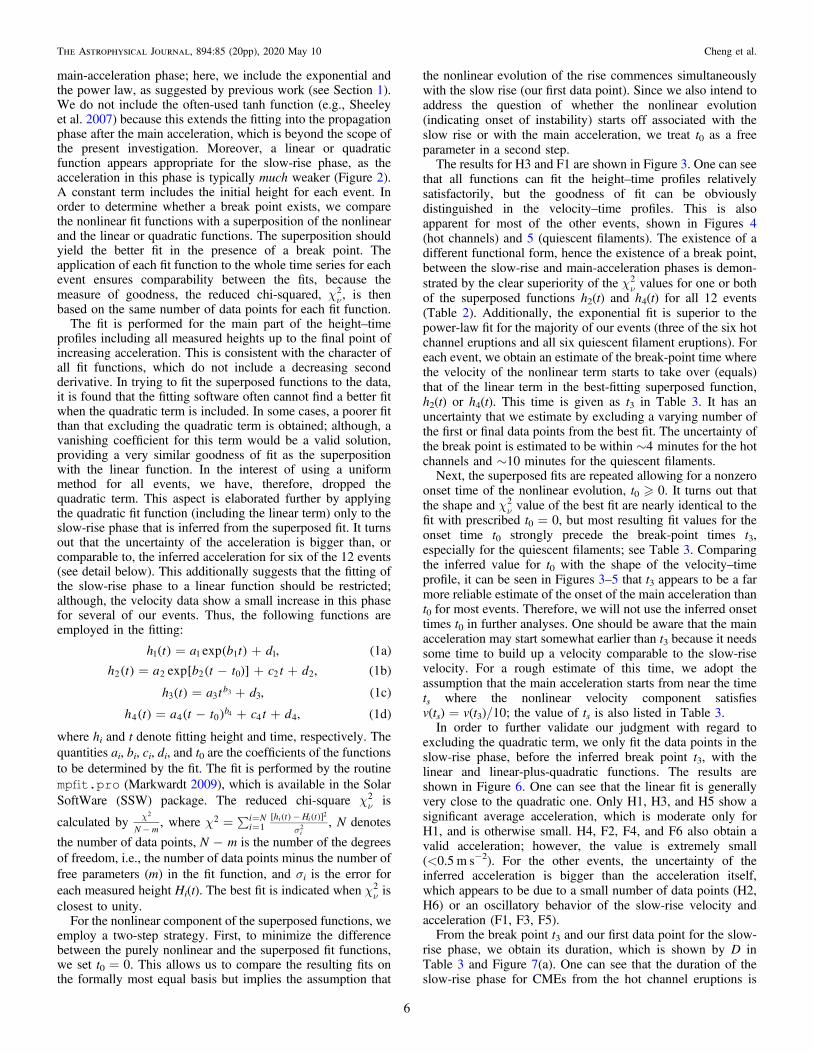
the nonlinear evolution of the rise commences simultaneouslywith the slow rise (our first data point). Since we also intend toaddress the question of whether the nonlinear evolution(indicating onset of instability) starts off associated with theslow rise or with the main acceleration, we treat t0 as a freeparameter in a second step.The results for H3 and F1 are shown in Figure 3. One can see
that all functions can fit the height–time profiles relativelysatisfactorily, but the goodness of fit can be obviouslydistinguished in the velocity–time profiles. This is alsoapparent for most of the other events, shown in Figures 4(hot channels) and 5 (quiescent filaments). The existence of adifferent functional form, hence the existence of a break point,between the slow-rise and main-acceleration phases is demon-strated by the clear superiority of the cn
2 values for one or bothof the superposed functions h2(t) and h4(t) for all 12 events(Table 2). Additionally, the exponential fit is superior to thepower-law fit for the majority of our events (three of the six hotchannel eruptions and all six quiescent filament eruptions). Foreach event, we obtain an estimate of the break-point time wherethe velocity of the nonlinear term starts to take over (equals)that of the linear term in the best-fitting superposed function,h2(t) or h4(t). This time is given as t3 in Table 3. It has anuncertainty that we estimate by excluding a varying number ofthe first or final data points from the best fit. The uncertainty ofthe break point is estimated to be within ∼4minutes for the hotchannels and ∼10minutes for the quiescent filaments.Next, the superposed fits are repeated allowing for a nonzero
onset time of the nonlinear evolution, t0�0. It turns out thatthe shape and cn
2 value of the best fit are nearly identical to thefit with prescribed t0=0, but most resulting fit values for theonset time t0 strongly precede the break-point times t3,especially for the quiescent filaments; see Table 3. Comparingthe inferred value for t0 with the shape of the velocity–timeprofile, it can be seen in Figures 3–5 that t3 appears to be a farmore reliable estimate of the onset of the main acceleration thant0 for most events. Therefore, we will not use the inferred onsettimes t0 in further analyses. One should be aware that the mainacceleration may start somewhat earlier than t3 because it needssome time to build up a velocity comparable to the slow-risevelocity. For a rough estimate of this time, we adopt theassumption that the main acceleration starts from near the timets where the nonlinear velocity component satisfiesv(ts)=v(t3)/10; the value of ts is also listed in Table 3.In order to further validate our judgment with regard to
excluding the quadratic term, we only fit the data points in theslow-rise phase, before the inferred break point t3, with thelinear and linear-plus-quadratic functions. The results areshown in Figure 6. One can see that the linear fit is generallyvery close to the quadratic one. Only H1, H3, and H5 show asignificant average acceleration, which is moderate only forH1, and is otherwise small. H4, F2, F4, and F6 also obtain avalid acceleration; however, the value is extremely small(<0.5 m s−2). For the other events, the uncertainty of theinferred acceleration is bigger than the acceleration itself,which appears to be due to a small number of data points (H2,H6) or an oscillatory behavior of the slow-rise velocity andacceleration (F1, F3, F5).From the break point t3 and our first data point for the slow-
rise phase, we obtain its duration, which is shown by D inTable 3 and Figure 7(a). One can see that the duration of theslow-rise phase for CMEs from the hot channel eruptions is
6
The Astrophysical Journal, 894:85 (20pp), 2020 May 10 Cheng et al.
mostly much shorter than that of the erupting filaments. Thelatter all have a slow rise of >40minutes and up to>170minutes for F4–F6. The H4 event also has a slow-risephase of long duration (∼75 minutes). As noted already above,a long and high hot channel connecting the periphery of thetwo active regions erupts in this event, so that the corresp-onding magnetic field strength is much weaker than that of theother five hot channels, which originate from the central area oftheir active regions. This resembles the quiescent filaments thatoriginate from large-scale and weak magnetic flux.
4.2. Timing Relation to Flares
4.2.1. Main-acceleration Phase
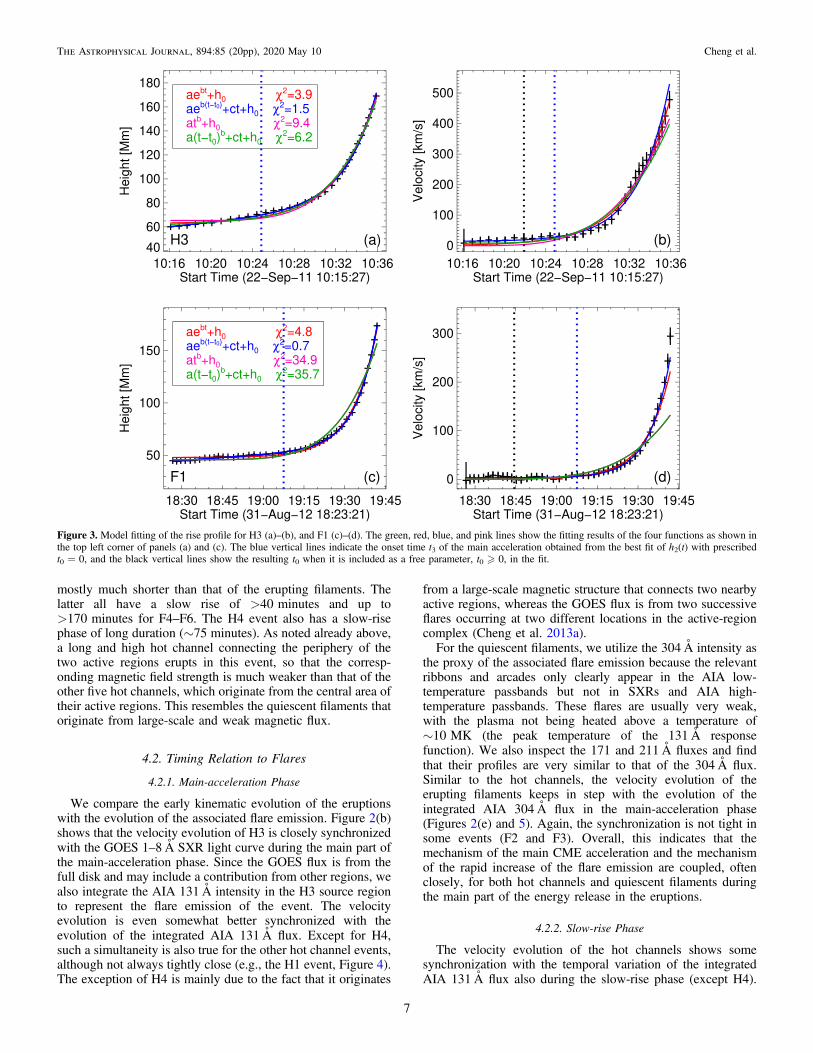
We compare the early kinematic evolution of the eruptionswith the evolution of the associated flare emission. Figure 2(b)shows that the velocity evolution of H3 is closely synchronizedwith the GOES 1–8Å SXR light curve during the main part ofthe main-acceleration phase. Since the GOES flux is from thefull disk and may include a contribution from other regions, wealso integrate the AIA 131Å intensity in the H3 source regionto represent the flare emission of the event. The velocityevolution is even somewhat better synchronized with theevolution of the integrated AIA 131Å flux. Except for H4,such a simultaneity is also true for the other hot channel events,although not always tightly close (e.g., the H1 event, Figure 4).The exception of H4 is mainly due to the fact that it originates
from a large-scale magnetic structure that connects two nearbyactive regions, whereas the GOES flux is from two successiveflares occurring at two different locations in the active-regioncomplex (Cheng et al. 2013a).For the quiescent filaments, we utilize the 304Å intensity as
the proxy of the associated flare emission because the relevantribbons and arcades only clearly appear in the AIA low-temperature passbands but not in SXRs and AIA high-temperature passbands. These flares are usually very weak,with the plasma not being heated above a temperature of∼10MK (the peak temperature of the 131Å responsefunction). We also inspect the 171 and 211Å fluxes and findthat their profiles are very similar to that of the 304Å flux.Similar to the hot channels, the velocity evolution of theerupting filaments keeps in step with the evolution of theintegrated AIA 304Å flux in the main-acceleration phase(Figures 2(e) and 5). Again, the synchronization is not tight insome events (F2 and F3). Overall, this indicates that themechanism of the main CME acceleration and the mechanismof the rapid increase of the flare emission are coupled, oftenclosely, for both hot channels and quiescent filaments duringthe main part of the energy release in the eruptions.
4.2.2. Slow-rise Phase
The velocity evolution of the hot channels shows somesynchronization with the temporal variation of the integratedAIA 131Å flux also during the slow-rise phase (except H4).
Figure 3. Model fitting of the rise profile for H3 (a)–(b), and F1 (c)–(d). The green, red, blue, and pink lines show the fitting results of the four functions as shown inthe top left corner of panels (a) and (c). The blue vertical lines indicate the onset time t3 of the main acceleration obtained from the best fit of h2(t) with prescribedt0=0, and the black vertical lines show the resulting t0 when it is included as a free parameter, t0�0, in the fit.
7
The Astrophysical Journal, 894:85 (20pp), 2020 May 10 Cheng et al.
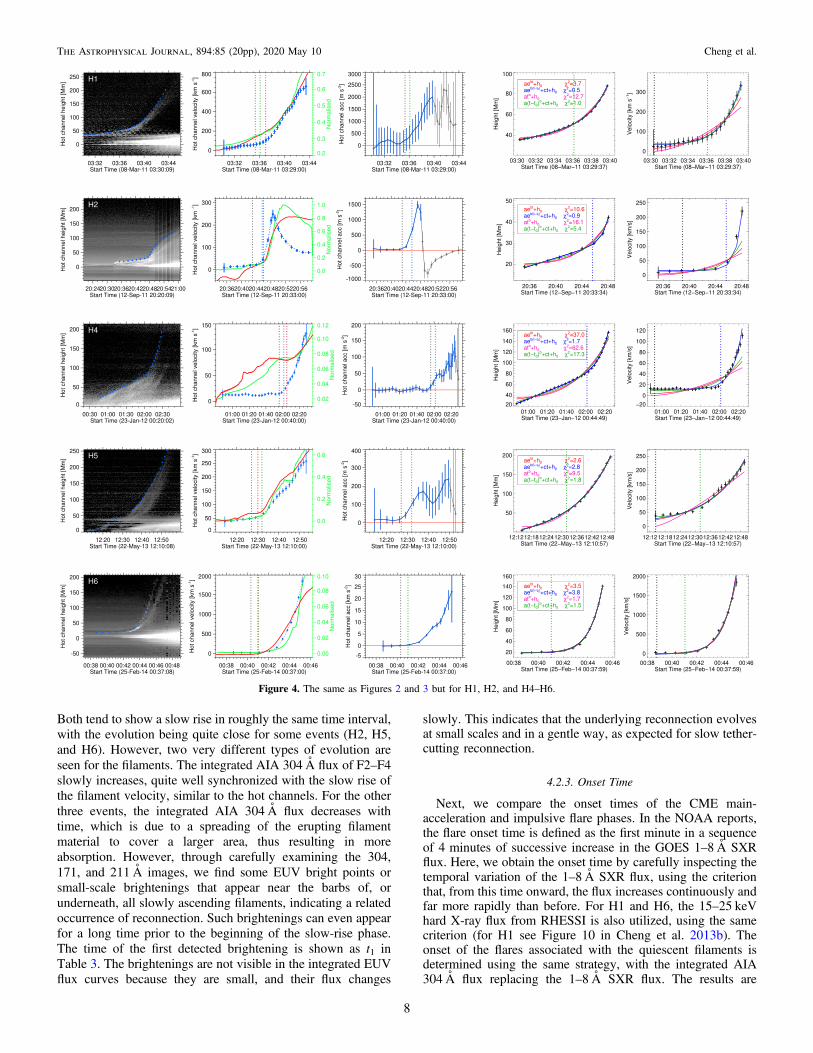
Both tend to show a slow rise in roughly the same time interval,with the evolution being quite close for some events (H2, H5,and H6). However, two very different types of evolution areseen for the filaments. The integrated AIA 304Å flux of F2–F4slowly increases, quite well synchronized with the slow rise ofthe filament velocity, similar to the hot channels. For the otherthree events, the integrated AIA 304Å flux decreases withtime, which is due to a spreading of the erupting filamentmaterial to cover a larger area, thus resulting in moreabsorption. However, through carefully examining the 304,171, and 211Å images, we find some EUV bright points orsmall-scale brightenings that appear near the barbs of, orunderneath, all slowly ascending filaments, indicating a relatedoccurrence of reconnection. Such brightenings can even appearfor a long time prior to the beginning of the slow-rise phase.The time of the first detected brightening is shown as t1 inTable 3. The brightenings are not visible in the integrated EUVflux curves because they are small, and their flux changes
slowly. This indicates that the underlying reconnection evolvesat small scales and in a gentle way, as expected for slow tether-cutting reconnection.
4.2.3. Onset Time
Next, we compare the onset times of the CME main-acceleration and impulsive flare phases. In the NOAA reports,the flare onset time is defined as the first minute in a sequenceof 4minutes of successive increase in the GOES 1–8Å SXRflux. Here, we obtain the onset time by carefully inspecting thetemporal variation of the 1–8Å SXR flux, using the criterionthat, from this time onward, the flux increases continuously andfar more rapidly than before. For H1 and H6, the 15–25 keVhard X-ray flux from RHESSI is also utilized, using the samecriterion (for H1 see Figure 10 in Cheng et al. 2013b). Theonset of the flares associated with the quiescent filaments isdetermined using the same strategy, with the integrated AIA304Å flux replacing the 1–8Å SXR flux. The results are
Figure 4. The same as Figures 2 and 3 but for H1, H2, and H4–H6.
8
The Astrophysical Journal, 894:85 (20pp), 2020 May 10 Cheng et al.
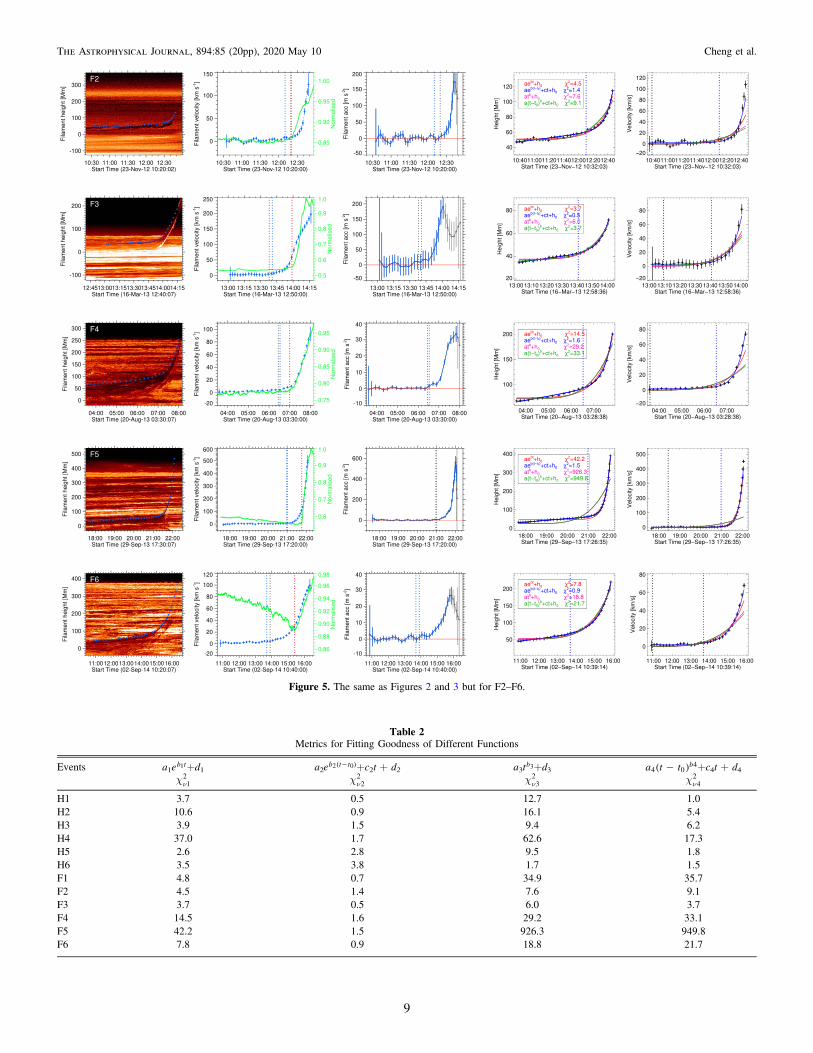
Figure 5. The same as Figures 2 and 3 but for F2–F6.
Table 2Metrics for Fitting Goodness of Different Functions
Events a1eb t1 +d1 a2 -eb t t2 0( )+c2t+d2 a3tb3+d3 -a t t b4 0
4( ) +c4t+d4cn12 cn2
2 cn32 cn4
2
H1 3.7 0.5 12.7 1.0H2 10.6 0.9 16.1 5.4H3 3.9 1.5 9.4 6.2H4 37.0 1.7 62.6 17.3H5 2.6 2.8 9.5 1.8H6 3.5 3.8 1.7 1.5F1 4.8 0.7 34.9 35.7F2 4.5 1.4 7.6 9.1F3 3.7 0.5 6.0 3.7F4 14.5 1.6 29.2 33.1F5 42.2 1.5 926.3 949.8F6 7.8 0.9 18.8 21.7
9
The Astrophysical Journal, 894:85 (20pp), 2020 May 10 Cheng et al.
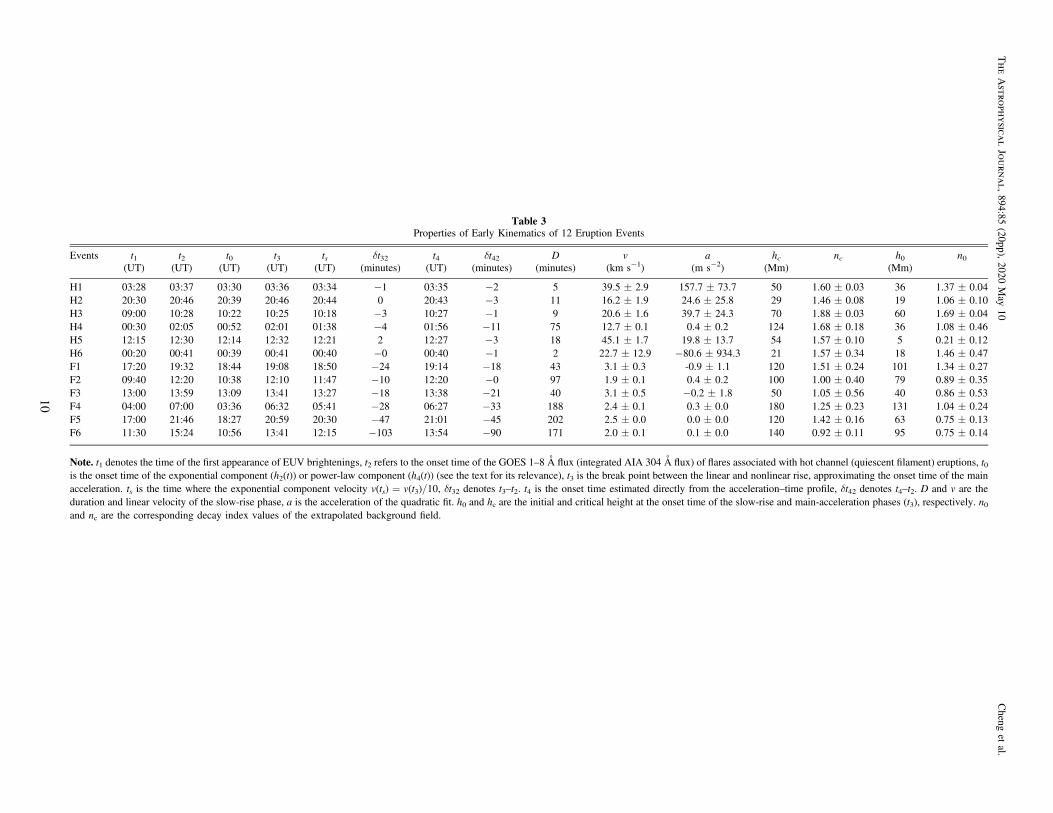
Table 3Properties of Early Kinematics of 12 Eruption Events
Events t1 t2 t0 t3 ts δt32 t4 δt42 D v a hc nc h0 n0(UT) (UT) (UT) (UT) (UT) (minutes) (UT) (minutes) (minutes) (km s−1) (m s−2) (Mm) (Mm)
H1 03:28 03:37 03:30 03:36 03:34 −1 03:35 −2 5 39.5±2.9 157.7±73.7 50 1.60±0.03 36 1.37±0.04H2 20:30 20:46 20:39 20:46 20:44 0 20:43 −3 11 16.2±1.9 24.6±25.8 29 1.46±0.08 19 1.06±0.10H3 09:00 10:28 10:22 10:25 10:18 −3 10:27 −1 9 20.6±1.6 39.7±24.3 70 1.88±0.03 60 1.69±0.04H4 00:30 02:05 00:52 02:01 01:38 −4 01:56 −11 75 12.7±0.1 0.4±0.2 124 1.68±0.18 36 1.08±0.46H5 12:15 12:30 12:14 12:32 12:21 2 12:27 −3 18 45.1±1.7 19.8±13.7 54 1.57±0.10 5 0.21±0.12H6 00:20 00:41 00:39 00:41 00:40 −0 00:40 −1 2 22.7±12.9 −80.6±934.3 21 1.57±0.34 18 1.46±0.47F1 17:20 19:32 18:44 19:08 18:50 −24 19:14 −18 43 3.1±0.3 -0.9±1.1 120 1.51±0.24 101 1.34±0.27F2 09:40 12:20 10:38 12:10 11:47 −10 12:20 −0 97 1.9±0.1 0.4±0.2 100 1.00±0.40 79 0.89±0.35F3 13:00 13:59 13:09 13:41 13:27 −18 13:38 −21 40 3.1±0.5 −0.2±1.8 50 1.05±0.56 40 0.86±0.53F4 04:00 07:00 03:36 06:32 05:41 −28 06:27 −33 188 2.4±0.1 0.3±0.0 180 1.25±0.23 131 1.04±0.24F5 17:00 21:46 18:27 20:59 20:30 −47 21:01 −45 202 2.5±0.0 0.0±0.0 120 1.42±0.16 63 0.75±0.13F6 11:30 15:24 10:56 13:41 12:15 −103 13:54 −90 171 2.0±0.1 0.1±0.0 140 0.92±0.11 95 0.75±0.14
Note. t1 denotes the time of the first appearance of EUV brightenings, t2 refers to the onset time of the GOES 1–8 Å flux (integrated AIA 304 Å flux) of flares associated with hot channel (quiescent filament) eruptions, t0is the onset time of the exponential component (h2(t)) or power-law component (h4(t)) (see the text for its relevance), t3 is the break point between the linear and nonlinear rise, approximating the onset time of the mainacceleration. ts is the time where the exponential component velocity v(ts)=v(t3)/10, δt32 denotes t3–t2. t4 is the onset time estimated directly from the acceleration–time profile, δt42 denotes t4–t2. D and v are theduration and linear velocity of the slow-rise phase, a is the acceleration of the quadratic fit. h0 and hc are the initial and critical height at the onset time of the slow-rise and main-acceleration phases (t3), respectively. n0and nc are the corresponding decay index values of the extrapolated background field.
10
TheAstro
physica
lJourn
al,
894:85(20pp),
2020May
10Cheng
etal.
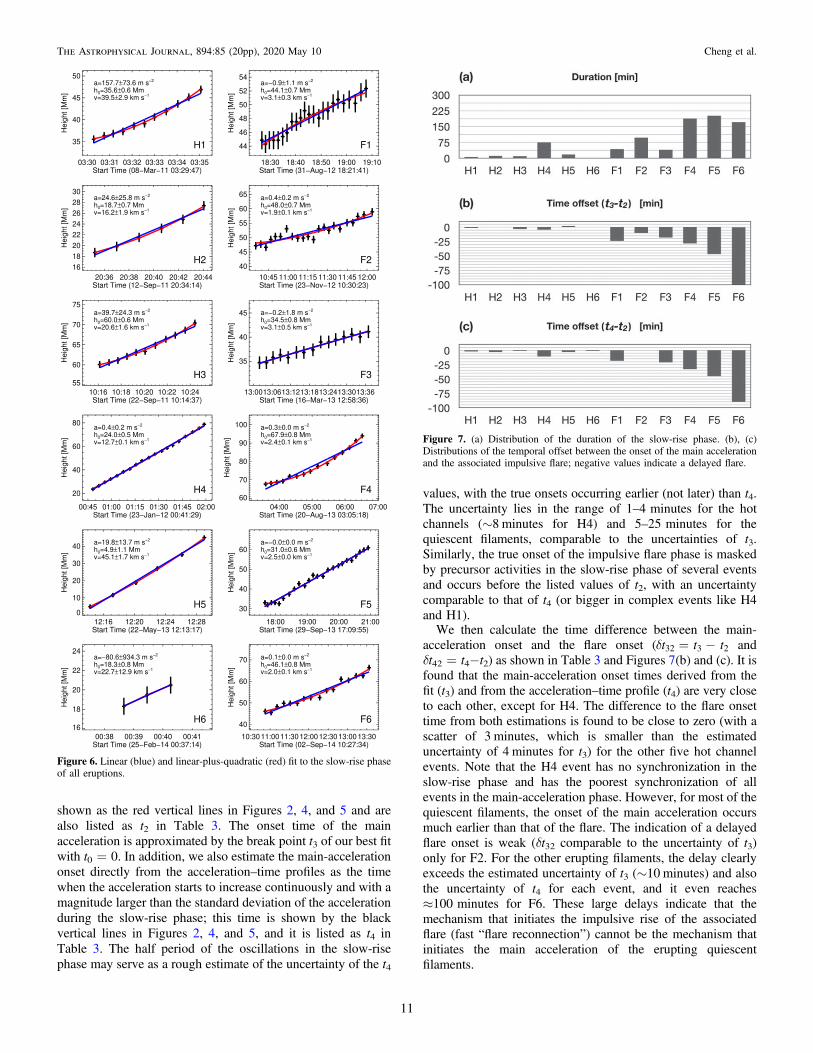
shown as the red vertical lines in Figures 2, 4, and 5 and arealso listed as t2 in Table 3. The onset time of the mainacceleration is approximated by the break point t3 of our best fitwith t0=0. In addition, we also estimate the main-accelerationonset directly from the acceleration–time profiles as the timewhen the acceleration starts to increase continuously and with amagnitude larger than the standard deviation of the accelerationduring the slow-rise phase; this time is shown by the blackvertical lines in Figures 2, 4, and 5, and it is listed as t4 inTable 3. The half period of the oscillations in the slow-risephase may serve as a rough estimate of the uncertainty of the t4
values, with the true onsets occurring earlier (not later) than t4.The uncertainty lies in the range of 1–4minutes for the hotchannels (∼8 minutes for H4) and 5–25minutes for thequiescent filaments, comparable to the uncertainties of t3.Similarly, the true onset of the impulsive flare phase is maskedby precursor activities in the slow-rise phase of several eventsand occurs before the listed values of t2, with an uncertaintycomparable to that of t4 (or bigger in complex events like H4and H1).We then calculate the time difference between the main-
acceleration onset and the flare onset (d = -t t t32 3 2 andδt42=t4−t2) as shown in Table 3 and Figures 7(b) and (c). It isfound that the main-acceleration onset times derived from thefit (t3) and from the acceleration–time profile (t4) are very closeto each other, except for H4. The difference to the flare onsettime from both estimations is found to be close to zero (with ascatter of 3 minutes, which is smaller than the estimateduncertainty of 4 minutes for t3) for the other five hot channelevents. Note that the H4 event has no synchronization in theslow-rise phase and has the poorest synchronization of allevents in the main-acceleration phase. However, for most of thequiescent filaments, the onset of the main acceleration occursmuch earlier than that of the flare. The indication of a delayedflare onset is weak (δt32 comparable to the uncertainty of t3)only for F2. For the other erupting filaments, the delay clearlyexceeds the estimated uncertainty of t3 (∼10 minutes) and alsothe uncertainty of t4 for each event, and it even reaches≈100minutes for F6. These large delays indicate that themechanism that initiates the impulsive rise of the associatedflare (fast “flare reconnection”) cannot be the mechanism thatinitiates the main acceleration of the erupting quiescentfilaments.
Figure 6. Linear (blue) and linear-plus-quadratic (red) fit to the slow-rise phaseof all eruptions.
Figure 7. (a) Distribution of the duration of the slow-rise phase. (b), (c)Distributions of the temporal offset between the onset of the main accelerationand the associated impulsive flare; negative values indicate a delayed flare.
11
The Astrophysical Journal, 894:85 (20pp), 2020 May 10 Cheng et al.
4.3. Relevance of Torus Instability
To investigate the relevance of the torus instability ininitiating solar eruptions, we compare its theoretical threshold(critical decay index of the background/strapping field) withthe observationally estimated values at the onset of our events.The decay index is defined as
= -n hd B
d h
ln
ln, 2t( ) ( )
( )( )
where Bt is the horizontal component of the coronal back-ground field. For the observational estimate, the critical (i.e.,onset) height and a coronal magnetic field model are required.Different methodological approaches are possible for each ofthem, e.g., the different fit functions used in Section 4.1 anddifferent extrapolation schemes. Moreover, the lack of magn-etic measurements from STEREO enforces adopting acompromise between the accuracy of the height–time andmagnetic measurements. Accordingly, we have chosen differ-ent strategies for the hot channel and quiescent filamenteruptions, as detailed in the following. Their respectiveadvantages and limitations are discussed in Section 5.4.
First, we address the onset of the main-acceleration phase,using t3 from the best height–time fit for each event as the onsettime. For the hot channel eruptions, we use the correspondingheight projected in the plane of sky as the critical height hc, butreference it to a point in the middle of the associated flareribbons or at the bottom of the flare loops (Figures 1(a) and2(a)). Except for H4, the hot channels are sufficiently close tothe limb to give a negligible difference between the projectedand radial distances to the reference point. The projected heightof H4 is corrected assuming a radial direction of the eruption.
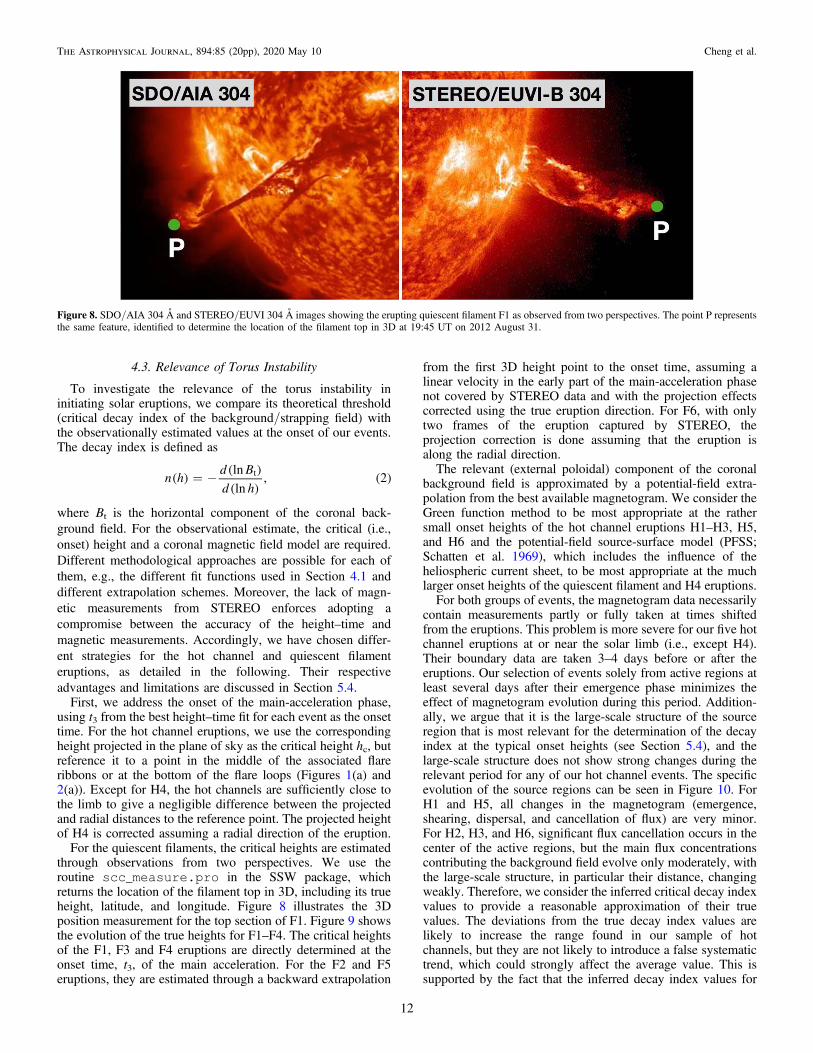
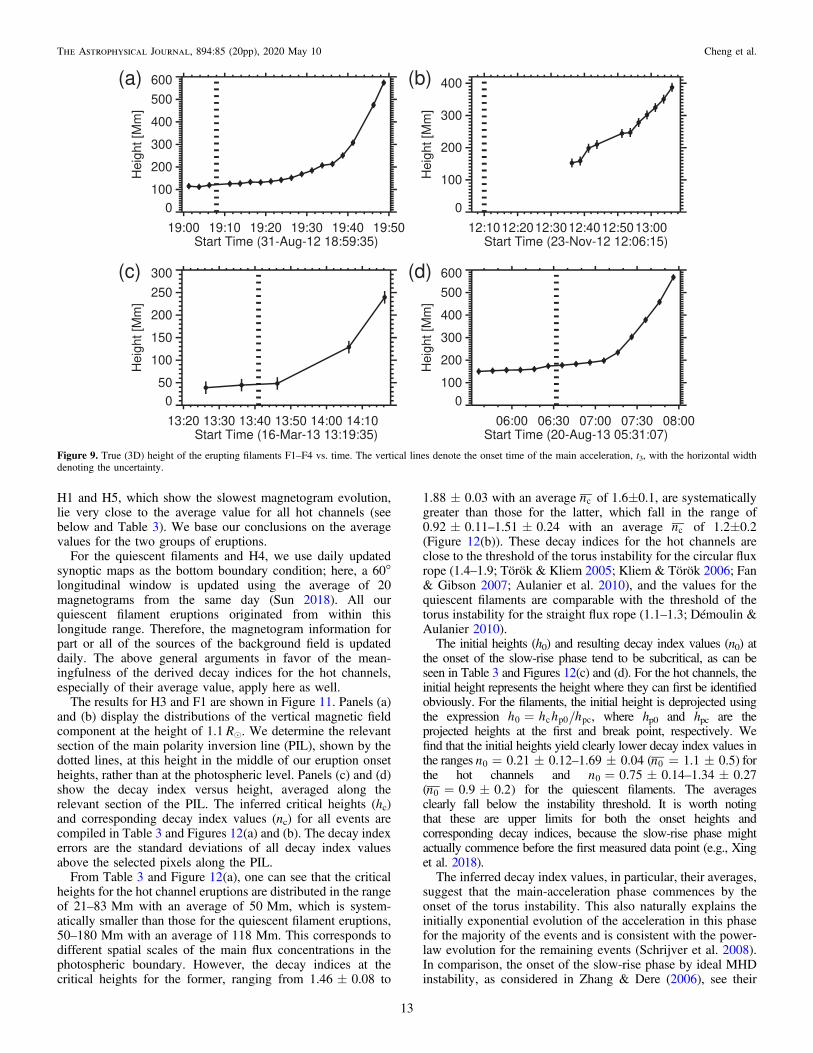
For the quiescent filaments, the critical heights are estimatedthrough observations from two perspectives. We use theroutine scc_measure.pro in the SSW package, whichreturns the location of the filament top in 3D, including its trueheight, latitude, and longitude. Figure 8 illustrates the 3Dposition measurement for the top section of F1. Figure 9 showsthe evolution of the true heights for F1–F4. The critical heightsof the F1, F3 and F4 eruptions are directly determined at theonset time, t3, of the main acceleration. For the F2 and F5eruptions, they are estimated through a backward extrapolation
from the first 3D height point to the onset time, assuming alinear velocity in the early part of the main-acceleration phasenot covered by STEREO data and with the projection effectscorrected using the true eruption direction. For F6, with onlytwo frames of the eruption captured by STEREO, theprojection correction is done assuming that the eruption isalong the radial direction.The relevant (external poloidal) component of the coronal
background field is approximated by a potential-field extra-polation from the best available magnetogram. We consider theGreen function method to be most appropriate at the rathersmall onset heights of the hot channel eruptions H1–H3, H5,and H6 and the potential-field source-surface model (PFSS;Schatten et al. 1969), which includes the influence of theheliospheric current sheet, to be most appropriate at the muchlarger onset heights of the quiescent filament and H4 eruptions.For both groups of events, the magnetogram data necessarily
contain measurements partly or fully taken at times shiftedfrom the eruptions. This problem is more severe for our five hotchannel eruptions at or near the solar limb (i.e., except H4).Their boundary data are taken 3–4 days before or after theeruptions. Our selection of events solely from active regions atleast several days after their emergence phase minimizes theeffect of magnetogram evolution during this period. Addition-ally, we argue that it is the large-scale structure of the sourceregion that is most relevant for the determination of the decayindex at the typical onset heights (see Section 5.4), and thelarge-scale structure does not show strong changes during therelevant period for any of our hot channel events. The specificevolution of the source regions can be seen in Figure 10. ForH1 and H5, all changes in the magnetogram (emergence,shearing, dispersal, and cancellation of flux) are very minor.For H2, H3, and H6, significant flux cancellation occurs in thecenter of the active regions, but the main flux concentrationscontributing the background field evolve only moderately, withthe large-scale structure, in particular their distance, changingweakly. Therefore, we consider the inferred critical decay indexvalues to provide a reasonable approximation of their truevalues. The deviations from the true decay index values arelikely to increase the range found in our sample of hotchannels, but they are not likely to introduce a false systematictrend, which could strongly affect the average value. This issupported by the fact that the inferred decay index values for
Figure 8. SDO/AIA 304 Å and STEREO/EUVI 304 Å images showing the erupting quiescent filament F1 as observed from two perspectives. The point P representsthe same feature, identified to determine the location of the filament top in 3D at 19:45UT on 2012 August31.
12
The Astrophysical Journal, 894:85 (20pp), 2020 May 10 Cheng et al.
H1 and H5, which show the slowest magnetogram evolution,lie very close to the average value for all hot channels (seebelow and Table 3). We base our conclusions on the averagevalues for the two groups of eruptions.
For the quiescent filaments and H4, we use daily updatedsynoptic maps as the bottom boundary condition; here, a 60°longitudinal window is updated using the average of 20magnetograms from the same day (Sun 2018). All ourquiescent filament eruptions originated from within thislongitude range. Therefore, the magnetogram information forpart or all of the sources of the background field is updateddaily. The above general arguments in favor of the mean-ingfulness of the derived decay indices for the hot channels,especially of their average value, apply here as well.
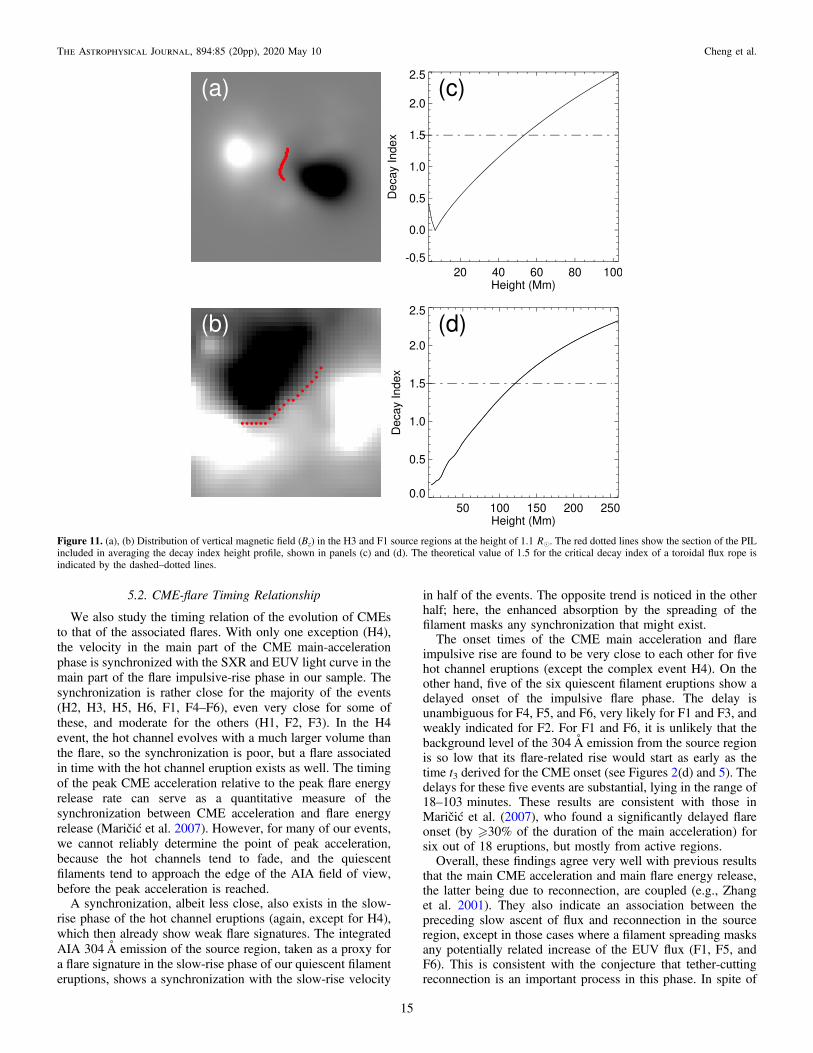
The results for H3 and F1 are shown in Figure 11. Panels (a)and (b) display the distributions of the vertical magnetic fieldcomponent at the height of 1.1 Re. We determine the relevantsection of the main polarity inversion line (PIL), shown by thedotted lines, at this height in the middle of our eruption onsetheights, rather than at the photospheric level. Panels (c) and (d)show the decay index versus height, averaged along therelevant section of the PIL. The inferred critical heights (hc)and corresponding decay index values (nc) for all events arecompiled in Table 3 and Figures 12(a) and (b). The decay indexerrors are the standard deviations of all decay index valuesabove the selected pixels along the PIL.
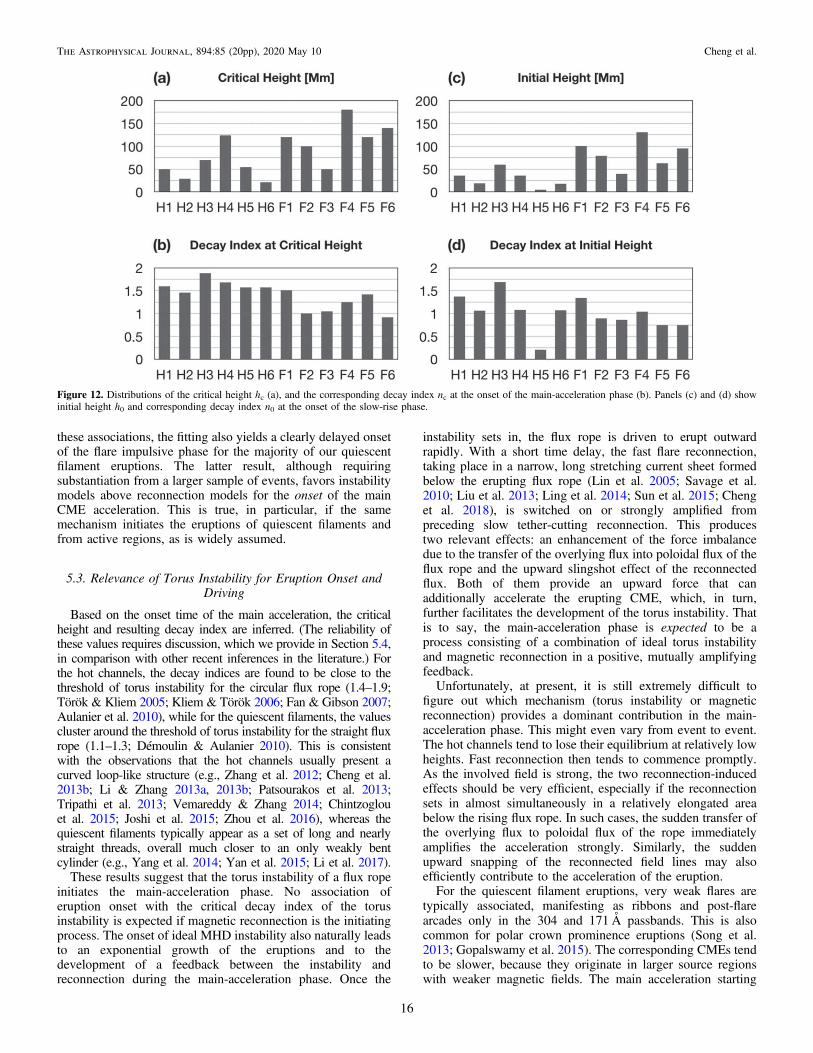
From Table 3 and Figure 12(a), one can see that the criticalheights for the hot channel eruptions are distributed in the rangeof 21–83Mm with an average of 50Mm, which is system-atically smaller than those for the quiescent filament eruptions,50–180Mm with an average of 118Mm. This corresponds todifferent spatial scales of the main flux concentrations in thephotospheric boundary. However, the decay indices at thecritical heights for the former, ranging from 1.46±0.08 to
1.88±0.03 with an average nc of 1.6±0.1, are systematicallygreater than those for the latter, which fall in the range of0.92±0.11–1.51±0.24 with an average nc of 1.2±0.2(Figure 12(b)). These decay indices for the hot channels areclose to the threshold of the torus instability for the circular fluxrope (1.4–1.9; Török & Kliem 2005; Kliem & Török 2006; Fan& Gibson 2007; Aulanier et al. 2010), and the values for thequiescent filaments are comparable with the threshold of thetorus instability for the straight flux rope (1.1–1.3; Démoulin &Aulanier 2010).The initial heights (h0) and resulting decay index values (n0) at
the onset of the slow-rise phase tend to be subcritical, as can beseen in Table 3 and Figures 12(c) and (d). For the hot channels, theinitial height represents the height where they can first be identifiedobviously. For the filaments, the initial height is deprojected usingthe expression =h h h h0 c p0 pc, where hp0 and hpc are theprojected heights at the first and break point, respectively. Wefind that the initial heights yield clearly lower decay index values inthe ranges = n 0.21 0.12 1.69 0.040 – ( = n 1.1 0.50 ) forthe hot channels and = n 0.75 0.14 1.34 0.270 –( = n 0.9 0.20 ) for the quiescent filaments. The averagesclearly fall below the instability threshold. It is worth notingthat these are upper limits for both the onset heights andcorresponding decay indices, because the slow-rise phase mightactually commence before the first measured data point (e.g., Xinget al. 2018).The inferred decay index values, in particular, their averages,
suggest that the main-acceleration phase commences by theonset of the torus instability. This also naturally explains theinitially exponential evolution of the acceleration in this phasefor the majority of the events and is consistent with the power-law evolution for the remaining events (Schrijver et al. 2008).In comparison, the onset of the slow-rise phase by ideal MHDinstability, as considered in Zhang & Dere (2006), see their
Figure 9. True (3D) height of the erupting filaments F1–F4 vs. time. The vertical lines denote the onset time of the main acceleration, t3, with the horizontal widthdenoting the uncertainty.
13
The Astrophysical Journal, 894:85 (20pp), 2020 May 10 Cheng et al.
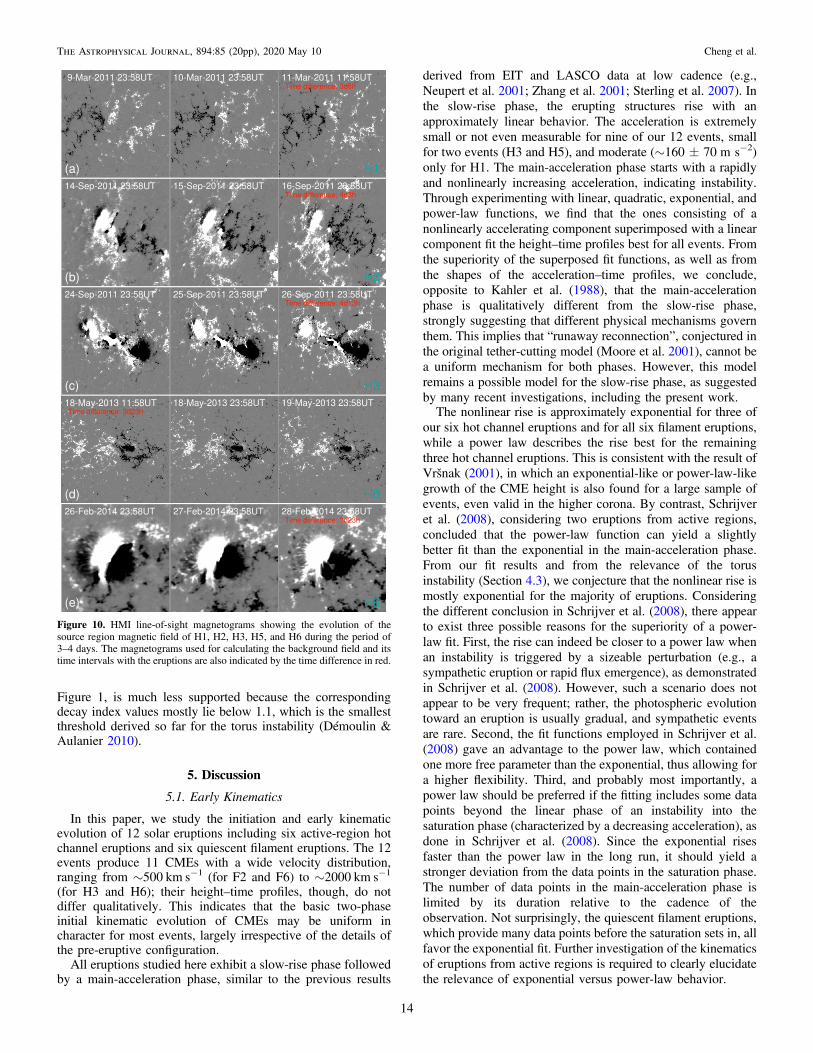
Figure 1, is much less supported because the correspondingdecay index values mostly lie below 1.1, which is the smallestthreshold derived so far for the torus instability (Démoulin &Aulanier 2010).
5. Discussion
5.1. Early Kinematics
In this paper, we study the initiation and early kinematicevolution of 12 solar eruptions including six active-region hotchannel eruptions and six quiescent filament eruptions. The 12events produce 11 CMEs with a wide velocity distribution,ranging from ∼500 km s−1 (for F2 and F6) to ∼2000 km s−1
(for H3 and H6); their height–time profiles, though, do notdiffer qualitatively. This indicates that the basic two-phaseinitial kinematic evolution of CMEs may be uniform incharacter for most events, largely irrespective of the details ofthe pre-eruptive configuration.
All eruptions studied here exhibit a slow-rise phase followedby a main-acceleration phase, similar to the previous results
derived from EIT and LASCO data at low cadence (e.g.,Neupert et al. 2001; Zhang et al. 2001; Sterling et al. 2007). Inthe slow-rise phase, the erupting structures rise with anapproximately linear behavior. The acceleration is extremelysmall or not even measurable for nine of our 12 events, smallfor two events (H3 and H5), and moderate (∼160±70 ms−2)only for H1. The main-acceleration phase starts with a rapidlyand nonlinearly increasing acceleration, indicating instability.Through experimenting with linear, quadratic, exponential, andpower-law functions, we find that the ones consisting of anonlinearly accelerating component superimposed with a linearcomponent fit the height–time profiles best for all events. Fromthe superiority of the superposed fit functions, as well as fromthe shapes of the acceleration–time profiles, we conclude,opposite to Kahler et al. (1988), that the main-accelerationphase is qualitatively different from the slow-rise phase,strongly suggesting that different physical mechanisms governthem. This implies that “runaway reconnection”, conjectured inthe original tether-cutting model (Moore et al. 2001), cannot bea uniform mechanism for both phases. However, this modelremains a possible model for the slow-rise phase, as suggestedby many recent investigations, including the present work.The nonlinear rise is approximately exponential for three of
our six hot channel eruptions and for all six filament eruptions,while a power law describes the rise best for the remainingthree hot channel eruptions. This is consistent with the result ofVršnak (2001), in which an exponential-like or power-law-likegrowth of the CME height is also found for a large sample ofevents, even valid in the higher corona. By contrast, Schrijveret al. (2008), considering two eruptions from active regions,concluded that the power-law function can yield a slightlybetter fit than the exponential in the main-acceleration phase.From our fit results and from the relevance of the torusinstability (Section 4.3), we conjecture that the nonlinear rise ismostly exponential for the majority of eruptions. Consideringthe different conclusion in Schrijver et al. (2008), there appearto exist three possible reasons for the superiority of a power-law fit. First, the rise can indeed be closer to a power law whenan instability is triggered by a sizeable perturbation (e.g., asympathetic eruption or rapid flux emergence), as demonstratedin Schrijver et al. (2008). However, such a scenario does notappear to be very frequent; rather, the photospheric evolutiontoward an eruption is usually gradual, and sympathetic eventsare rare. Second, the fit functions employed in Schrijver et al.(2008) gave an advantage to the power law, which containedone more free parameter than the exponential, thus allowing fora higher flexibility. Third, and probably most importantly, apower law should be preferred if the fitting includes some datapoints beyond the linear phase of an instability into thesaturation phase (characterized by a decreasing acceleration), asdone in Schrijver et al. (2008). Since the exponential risesfaster than the power law in the long run, it should yield astronger deviation from the data points in the saturation phase.The number of data points in the main-acceleration phase islimited by its duration relative to the cadence of theobservation. Not surprisingly, the quiescent filament eruptions,which provide many data points before the saturation sets in, allfavor the exponential fit. Further investigation of the kinematicsof eruptions from active regions is required to clearly elucidatethe relevance of exponential versus power-law behavior.
Figure 10. HMI line-of-sight magnetograms showing the evolution of thesource region magnetic field of H1, H2, H3, H5, and H6 during the period of3–4 days. The magnetograms used for calculating the background field and itstime intervals with the eruptions are also indicated by the time difference in red.
14
The Astrophysical Journal, 894:85 (20pp), 2020 May 10 Cheng et al.
5.2. CME-flare Timing Relationship
We also study the timing relation of the evolution of CMEsto that of the associated flares. With only one exception (H4),the velocity in the main part of the CME main-accelerationphase is synchronized with the SXR and EUV light curve in themain part of the flare impulsive-rise phase in our sample. Thesynchronization is rather close for the majority of the events(H2, H3, H5, H6, F1, F4–F6), even very close for some ofthese, and moderate for the others (H1, F2, F3). In the H4event, the hot channel evolves with a much larger volume thanthe flare, so the synchronization is poor, but a flare associatedin time with the hot channel eruption exists as well. The timingof the peak CME acceleration relative to the peak flare energyrelease rate can serve as a quantitative measure of thesynchronization between CME acceleration and flare energyrelease (Maričić et al. 2007). However, for many of our events,we cannot reliably determine the point of peak acceleration,because the hot channels tend to fade, and the quiescentfilaments tend to approach the edge of the AIA field of view,before the peak acceleration is reached.
A synchronization, albeit less close, also exists in the slow-rise phase of the hot channel eruptions (again, except for H4),which then already show weak flare signatures. The integratedAIA 304Å emission of the source region, taken as a proxy fora flare signature in the slow-rise phase of our quiescent filamenteruptions, shows a synchronization with the slow-rise velocity
in half of the events. The opposite trend is noticed in the otherhalf; here, the enhanced absorption by the spreading of thefilament masks any synchronization that might exist.The onset times of the CME main acceleration and flare
impulsive rise are found to be very close to each other for fivehot channel eruptions (except the complex event H4). On theother hand, five of the six quiescent filament eruptions show adelayed onset of the impulsive flare phase. The delay isunambiguous for F4, F5, and F6, very likely for F1 and F3, andweakly indicated for F2. For F1 and F6, it is unlikely that thebackground level of the 304Å emission from the source regionis so low that its flare-related rise would start as early as thetime t3 derived for the CME onset (see Figures 2(d) and 5). Thedelays for these five events are substantial, lying in the range of18–103minutes. These results are consistent with those inMaričić et al. (2007), who found a significantly delayed flareonset (by �30% of the duration of the main acceleration) forsix out of 18 eruptions, but mostly from active regions.Overall, these findings agree very well with previous results
that the main CME acceleration and main flare energy release,the latter being due to reconnection, are coupled (e.g., Zhanget al. 2001). They also indicate an association between thepreceding slow ascent of flux and reconnection in the sourceregion, except in those cases where a filament spreading masksany potentially related increase of the EUV flux (F1, F5, andF6). This is consistent with the conjecture that tether-cuttingreconnection is an important process in this phase. In spite of
Figure 11. (a), (b) Distribution of vertical magnetic field (Bz) in the H3 and F1 source regions at the height of 1.1Re. The red dotted lines show the section of the PILincluded in averaging the decay index height profile, shown in panels (c) and (d). The theoretical value of 1.5 for the critical decay index of a toroidal flux rope isindicated by the dashed–dotted lines.
15
The Astrophysical Journal, 894:85 (20pp), 2020 May 10 Cheng et al.
these associations, the fitting also yields a clearly delayed onsetof the flare impulsive phase for the majority of our quiescentfilament eruptions. The latter result, although requiringsubstantiation from a larger sample of events, favors instabilitymodels above reconnection models for the onset of the mainCME acceleration. This is true, in particular, if the samemechanism initiates the eruptions of quiescent filaments andfrom active regions, as is widely assumed.
5.3. Relevance of Torus Instability for Eruption Onset andDriving
Based on the onset time of the main acceleration, the criticalheight and resulting decay index are inferred. (The reliability ofthese values requires discussion, which we provide in Section 5.4,in comparison with other recent inferences in the literature.) Forthe hot channels, the decay indices are found to be close to thethreshold of torus instability for the circular flux rope (1.4–1.9;Török & Kliem 2005; Kliem & Török 2006; Fan & Gibson 2007;Aulanier et al. 2010), while for the quiescent filaments, the valuescluster around the threshold of torus instability for the straight fluxrope (1.1–1.3; Démoulin & Aulanier 2010). This is consistentwith the observations that the hot channels usually present acurved loop-like structure (e.g., Zhang et al. 2012; Cheng et al.2013b; Li & Zhang 2013a, 2013b; Patsourakos et al. 2013;Tripathi et al. 2013; Vemareddy & Zhang 2014; Chintzoglouet al. 2015; Joshi et al. 2015; Zhou et al. 2016), whereas thequiescent filaments typically appear as a set of long and nearlystraight threads, overall much closer to an only weakly bentcylinder (e.g., Yang et al. 2014; Yan et al. 2015; Li et al. 2017).
These results suggest that the torus instability of a flux ropeinitiates the main-acceleration phase. No association oferuption onset with the critical decay index of the torusinstability is expected if magnetic reconnection is the initiatingprocess. The onset of ideal MHD instability also naturally leadsto an exponential growth of the eruptions and to thedevelopment of a feedback between the instability andreconnection during the main-acceleration phase. Once the
instability sets in, the flux rope is driven to erupt outwardrapidly. With a short time delay, the fast flare reconnection,taking place in a narrow, long stretching current sheet formedbelow the erupting flux rope (Lin et al. 2005; Savage et al.2010; Liu et al. 2013; Ling et al. 2014; Sun et al. 2015; Chenget al. 2018), is switched on or strongly amplified frompreceding slow tether-cutting reconnection. This producestwo relevant effects: an enhancement of the force imbalancedue to the transfer of the overlying flux into poloidal flux of theflux rope and the upward slingshot effect of the reconnectedflux. Both of them provide an upward force that canadditionally accelerate the erupting CME, which, in turn,further facilitates the development of the torus instability. Thatis to say, the main-acceleration phase is expected to be aprocess consisting of a combination of ideal torus instabilityand magnetic reconnection in a positive, mutually amplifyingfeedback.Unfortunately, at present, it is still extremely difficult to
figure out which mechanism (torus instability or magneticreconnection) provides a dominant contribution in the main-acceleration phase. This might even vary from event to event.The hot channels tend to lose their equilibrium at relatively lowheights. Fast reconnection then tends to commence promptly.As the involved field is strong, the two reconnection-inducedeffects should be very efficient, especially if the reconnectionsets in almost simultaneously in a relatively elongated areabelow the rising flux rope. In such cases, the sudden transfer ofthe overlying flux to poloidal flux of the rope immediatelyamplifies the acceleration strongly. Similarly, the suddenupward snapping of the reconnected field lines may alsoefficiently contribute to the acceleration of the eruption.For the quiescent filament eruptions, very weak flares are
typically associated, manifesting as ribbons and post-flarearcades only in the 304 and 171Å passbands. This is alsocommon for polar crown prominence eruptions (Song et al.2013; Gopalswamy et al. 2015). The corresponding CMEs tendto be slower, because they originate in larger source regionswith weaker magnetic fields. The main acceleration starting
Figure 12. Distributions of the critical height hc (a), and the corresponding decay index nc at the onset of the main-acceleration phase (b). Panels (c) and (d) showinitial height h0 and corresponding decay index n0 at the onset of the slow-rise phase.
16
The Astrophysical Journal, 894:85 (20pp), 2020 May 10 Cheng et al.
earlier than the flare onset suggests that the acceleration processmay be first dominated by the torus instability, as thereconnection and its induced two effects should not be veryefficient (weak fields and relatively large heights at whichreconnection occurs). The slingshot effect, for example, turnsin such cases into a weak reconnection outflow, which maydeform the flux rope a little bit if it catches up to the eruptingrope, but may not accelerate it considerably. Similarly, theforce imbalance due to flux transfer should also not be verystrong. The distance between the flux rope and the reconnectingX-line is larger, and the reconnection jet velocity is smallercompared to eruptions from active regions. Therefore, if theflare reconnection is a consequence of the ideal MHDinstability, then one can expect that any delay of the flareonset, as well as the time needed to fully establish the feedbackbetween ideal instability and reconnection, tends to be longerfor erupting quiescent filaments, as found in the events studiedhere. The same trend is also indicated, albeit weakly, within ourgroup of quiescent filament eruptions: the eruptions F4–F6show the longest delay, and two of them (F4 and F6) are theslowest eruptions in the sample when only the AIA field ofview is considered (see Figure 5, second column). Since anydelay of reconnection onset can also depend on the magnetictopology of the source region, a close correlation with thevelocity of the eruption is not expected.
For the slow-rise phase, the torus instability is unlikely to bethe universal onset and driving process because the decay indexat the inferred onset height is clearly subcritical for the majorityof the investigated events. We argue that the slow rise of all 12events is closely associated with slow tether-cutting magneticreconnection. First, this is indicated by the synchronization ofthe velocity–time profiles and flare light curves, which is seenwhenever enhanced absorption by a filament is not dominant inthe light curve. Second, small-scale EUV brightenings are seenin the source regions of all events. This supports the occurrenceof reconnection in the slow-rise phase but with a much slowermagnetic dissipation rate than that in the main-accelerationphase. Such a slow reconnection is very critical to creatingmore poloidal flux and lifting the hot channels gently. This isalso inferred by recent work by Liu et al. (2018), in which ahyperbolic flux tube (HFT) was identified underneath the hotchannels prior to their eruption. The tether-cutting typereconnection in the HFT then proceeds slowly, due to theslow driving from the photosphere, as long as no fast drivingfrom an MHD instability in the corona occurs, simultaneouslyleading to the slow rise and heating of the hot channels. Theslow rise of the quiescent filaments can additionally be drivenby mass draining (see Jenkins et al. 2019 and referencestherein). Such a feature is observed in the slow-rise phase of F2but not in the other filament events studied here.
5.4. Estimate of Decay Index
Finally, we discuss the reliability of our estimates of theonset heights, hc, and critical decay index values, nc. It is clearthat an accurate estimate of the onset height is as important asan accurate coronal field model for obtaining a reliable decayindex. However, as pointed out in Section 4.3, with currentinstrumentation, a compromise between the reliability of theheight–time and magnetogram data must be chosen, especiallyfor hot channels and other rapidly evolving (fast) eruptions. Forevents near the limb, the h(t) data from SDO/AIA have a highaccuracy and cadence, yielding the most reliable onset heights,
but the magnetic data have a temporal offset of 3–4 days. Forevents near the disk center, the magnetic data are optimized,but STEREO/EUVI does not provide h(t) data for hot channelsand yields lower cadence for filaments. At present, it is notclear whether one of these choices or a compromise in themiddle yields the most reliable nc values. The former choicemay be best for events from slowly evolving source regions,and the latter choice may be best for very slowly risingeruptions.Our sample of quiescent filaments erupting from longitudes
�60° (Table 1) represents a good compromise for this categoryof events. This choice yields accurate and reliable onset heightsfrom the combination of AIA and EUVI data and mostly veryreliable and nearly up-to-date magnetograms of the sourceregion. On the other hand, the temporal offset of themagnetogram data for the five hot channel eruptions near thelimb introduces an uncertainty of the computed coronal fieldand inferred decay index values. We argue, however, thatsubstantial errors in the decay index values are unlikely,because the decay index at the relevant onset heights isprimarily determined by the large-scale structure of the active-region magnetograms. The typical height for torus instabilityonset is about the half-distance, Lf, between the mainphotospheric flux concentrations that provide the backgroundfield (this is where n=1.5 in a bipole). At this height, thelarge-scale structure of the photospheric field at scales ∼Lfdetermines the structure of the coronal background field and itsdecay index. Typically, the large-scale structure changes onlyslowly for active regions after their emergence phase, i.e., atmost moderately in the given time span. Figure 10, discussed inSection 4.3, confirms that the large-scale structure does notshow strong changes during the relevant period for any of ourhot channel events from the limb. The flux cancellation seen inthe evolution toward the eruptions H2, H3, and H6 at a scale=Lf will influence n(h) primarily at scales h=Lf and onlyweakly at h∼hc. Although the measured field strengthsbecome less reliable closer to the limb, the geometric evolutioncan still be judged, especially the evolution of Lf. The effect ofmagnetogram evolution on the decay index values in therelevant height range (h∼Lf) can be quantitatively studiedusing a sample of eruptions from active regions near the centralmeridian. This will be done in a follow-up study, to support themethodology chosen here.To illustrate the complexity of the methodological approach
to the problem, including the very important role of precise h(t)data, it is instructive to compare our values with thosepublished very recently by Vasantharaju et al. (2019,henceforth V19), Zou et al. (2019, henceforth Z19), andMyshyakov & Tsvetkov (2020). V19 and Z19 determined theonset of the main-acceleration phase of erupting filaments/prominences using the same fit function h2(t) with t0=0 andthe same expression for the onset time (our t3), and they alsoinferred the critical decay index at the obtained onsetheight. V19 selected seven filament eruptions from activeregions and three from between active regions, so-calledintermediate filament eruptions. There is a salient difference inthe results for the critical decay index, found to lie in the range0.8–1.2, averaging to ∼1.0, for the active-region filaments(0.8–1.3 if the intermediate filaments are included) in V19,while our critical decay indices for the eruptions from activeregions fall in the range 1.5–1.9, with an average of 1.6. On theother hand, Z19 found the critical decay index for filament
17
The Astrophysical Journal, 894:85 (20pp), 2020 May 10 Cheng et al.

eruptions from active regions to lie in the range 0.4–2.5, whichis consistent with our range (although far broader), with anaverage of ∼1.5, close to our average.
The analysis of the kinematic evolution in V19 and Z19 isvery similar to ours, with probably less-precise height data thanthat in V19 and Z19 because their source regions were chosenmostly on disk (in a range of intermediate longitudes 40 80–in V19 and without any longitude selection in Z19). This is alikely reason for the large scatter of the nc values in Z19 but canhardly explain the strong systematic difference to V19. Themain reason causing the latter, we speculate, is that V19underestimated the critical height. They found the criticalheights for their seven eruptions from active regions to lie inthe range hc=10–38Mm, with an average of 22Mm. This ismuch smaller than our hc=21–124Mm, with an average of57Mm. The main reason appears to be the fact that theyincluded a much earlier part of the slow rise in their analysis ofthe kinematics, possibly due to the low cadence available fromSTEREO. The early part typically presents a very smallvelocity (<1 km s−1; Xing et al. 2018). Such a small velocityresults in the crossing of the linear and exponential componentsin h2(t), i.e., the onset time, shifting toward an earlier time, thusgiving rise to a smaller onset height. Additional reasons couldbe that (1) filament heights, as used by V19, may fallsystematically below the heights of flux ropes (hot channelsused here), as suggested by Zuccarello et al. (2016), especiallyduring the main-acceleration phase, (2) several of the eventsin V19 actually originated in areas of a rather dispersed field,(3) most of their events originated from longitudes > 50°,where the daily update of the synoptic magnetogram has only alimited or no effect, (4) the different choice of coronal fieldmodel has a systematic effect on the decay index estimates, (5)power-law fits may tend to yield larger onset heights, as is thecase for our events H5 and H6, and (6) the samples of active-region events still have a relatively small size.
Specifically, V19 computed the potential field in the PFSSapproximation, while we use the Green function in a Cartesianbox. The latter assumes that all sources of the coronal field arelocalized under the magnetogram area, so that the fieldasymptotically decreases like a dipole field, i.e., n→3 for ¥h . The PFSS approximation implies the presence of the
heliospheric current sheet outside the source surface. Thisadditional source changes the asymptotic behavior of the fieldto a significantly slower decrease, n<3. From our experiencewith applying the PFSS method to > 50 cases, the decay indexin the height range approaching the source surface scattersstrongly, with values around 2.2 being most common.Irrespective of this specific value, it is clear that the PFSSmodel tends to drop the decay index to values lower than theones in the corresponding potential field computed with theGreen function. This is consistent also (1) with the slightlysmaller average critical decay index in Z19 compared to oursand (2) with the high critical decay index values of 1.5–1.8 forthree quiescent filament eruptions found by Myshyakov &Tsvetkov (2020), who used the Green function to compute thecoronal field. The critical values nc inferred in the literature foreruptions from the quiet Sun are typically smaller than those foreruptions from active regions, similar to our results inSection 4.3. While this is plausible from the geometricaldifference (typically flatter versus typically more archederupting structures, respectively), an influence of the universaluse of the PFSS model for eruptions from the quiet Sun, except
in the study by Myshyakov & Tsvetkov (2020), cannot beexcluded.From the above discussion, it is clear that a reliable
determination of the decay index at the onset of eruptionsrequires precise height–time measurements at high cadence, areliable magnetogram, and an appropriate choice of extrapola-tion method. All of the factors listed above, which definitely orpotentially influence the inferred decay index values, will beaddressed in subsequent investigations.
6. Conclusions
We obtain the following conclusions, valid in the wholerange of rise velocities reached by the 12 studied eruptions.
1. The fitting confirms that the slow-rise and main-acceleration phases of solar eruptions are qualitativelydifferent, indicating different dominant mechanisms.
2. The slow-rise phase is well approximated by a linear orquadratic ascent, with the majority of events showing avery small acceleration. An obvious quadratic contrib-ution is found only in three of our six hot channel events.
3. The main-acceleration phase is characterized by anexponential rise in the majority of events, indicatinginstability. For a small fraction of the events (three in oursample), the rise is closer to a power law. Further studiesof data with higher cadence are required to clarify therelevance of power-law behavior in this phase.
4. The kinematic evolution of the eruptions tends to besynchronized with reconnection in the source volume asrepresented by the SXR or EUV light curve of theassociated flare. The synchronization is found in both theslow-rise and main-acceleration phases and is often butnot always close. This indicates a strong role for slowtether-cutting reconnection in the slow-rise phase and apositive feedback between ideal MHD instability and fastflare reconnection in the main-acceleration phase.
5. The onset times of CME main acceleration and flareimpulsive rise lie close to each other for the hot channeleruptions, except for one complex event (H4). The delaysscatter within 3minutes, less than their estimateduncertainty. On the other hand, a delayed onset of theimpulsive flare phase is found in the majority of ourquiescent filament eruptions (five out of six) and weaklyindicated in the remaining one. This delay and its trend tobe bigger for slower eruptions are consistent with theconjecture that an ideal MHD instability initiates andinitially drives solar eruptions.
6. The decay index of the ambient field at the starting heightof the main-acceleration phase lies close to the thresholdof the torus instability for all 12 events (1.6± 0.1 onaverage for the typically arched hot channel eruptionsfrom active regions and 1.2± 0.2 on average for themuch flatter erupting quiescent filaments). This suggeststhat the torus instability initiates and initially drives themain-acceleration phase in the majority of solar erup-tions. However, the accuracy of the decay-index calcul-ation is limited by the lack of reliable magnetograms forfive of our hot channel events that occur close to or abovethe limb. We believe that this limitation does not changeour main conclusion, but further studies need to bepursued to confirm it.
18
The Astrophysical Journal, 894:85 (20pp), 2020 May 10 Cheng et al.
Code availability: The codes used for measuring and fittingheight–time data are available at the website http://spaceweather.gmu.edu/public/xcheng/fit/.
We thank the ISSI team on “Decoding the Pre-EruptiveMagnetic Configuration of Coronal Mass Ejections”, led by S.Patsourakos & A. Vourlidas, for stimulating the researchpresented here. We also acknowledge constructive commentsby the referee, which helped improving the clarity of themanuscript. SDO is a mission of NASA’s Living With a StarProgram. STEREO/SECCHI data are provided by a con-sortium of NRL (US), LMSAL (US), NASA/GSFC (US),RAL (UK), UBHAM (UK), MPS (Germany), CSL (Belgium),IOTA (France), and IAS (France). X.C., C.X., Z.J.Z., and M.D.D. are supported by NSFC grants 11722325, 11733003,11790303, 11790300, Jiangsu NSF grant BK20170011, the“Dengfeng B” program of Nanjing University, and theAlexander von Humboldt foundation. B.K. acknowledgessupport by the DFG and NSFC through the collaborative grantKL 817/8-1/NSFC and support by NASA through grantsNNX16AH87G, 80NSSC17K0016, 80NSSC19K0082, and80NSSC19K0860. T.T. was supported by NASA’s HSRprogram (award No. 80NSSCK0858), NSF’s Solar Terrestrialprogram (award No. AGS-1923377), and NSF’s PREEVENTSprogram (award No. ICER-1854790). J.Z. is supported byNASA grant NNH17ZDA001N-HSWO2R.
ORCID iDs
X. Cheng https://orcid.org/0000-0003-2837-7136B. Kliem https://orcid.org/0000-0002-5740-8803T. Török https://orcid.org/0000-0003-3843-3242M. D. Ding https://orcid.org/0000-0002-4978-4972
References
Alexander, D., Metcalf, T. R., & Nitta, N. V. 2002, GeoRL, 29, 1403cAntiochos, S. K., DeVore, C. R., & Klimchuk, J. A. 1999, ApJ, 510, 485Aulanier, G., Török, T., Démoulin, P., & DeLuca, E. E. 2010, ApJ, 708, 314Baty, H. 2001, A&A, 367, 321Bein, B. M., Berkebile-Stoiser, S., Veronig, A. M., Temmer, M., & Vršnak, B.
2012, ApJ, 755, 44Brueckner, G. E., Howard, R. A., Koomen, M. J., Korendyke, C. M., et al.
1995, SoPh, 162, 357Chen, H., Zhang, J., Cheng, X., et al. 2014, ApJL, 797, L15Cheng, X., Ding, M. D., Guo, Y., et al. 2014a, ApJ, 780, 28Cheng, X., Ding, M. D., & Zhang, J. 2010, ApJ, 712, 1302Cheng, X., Ding, M. D., Zhang, J., et al. 2014b, ApJL, 789, L35Cheng, X., Li, Y., Wan, L. F., et al. 2018, arXiv:1808.06071Cheng, X., Zhang, J., Ding, M. D., et al. 2013a, ApJL, 769, L25Cheng, X., Zhang, J., Ding, M. D., Liu, Y., & Poomvises, W. 2013b, ApJ,
763, 43Cheng, X., Zhang, J., Liu, Y., & Ding, M. D. 2011, ApJL, 732, L25Cheng, X., Zhang, J., Saar, S. H., & Ding, M. D. 2012, ApJ, 761, 62Chintzoglou, G., Patsourakos, S., & Vourlidas, A. 2015, ApJ, 809, 34Démoulin, P., & Aulanier, G. 2010, ApJ, 718, 1388Dere, K. P., Brueckner, G. E., Howard, R. A., Michels, D. J., &
Delaboudiniere, J. P. 1999, ApJ, 516, 465Fan, Y., & Gibson, S. E. 2003, ApJL, 589, L105Fan, Y., & Gibson, S. E. 2004, ApJ, 609, 1123Fan, Y., & Gibson, S. E. 2007, ApJ, 668, 1232Forbes, T. G. 2000, JGR, 105, 23153Forbes, T. G., & Isenberg, P. A. 1991, ApJ, 373, 294Gallagher, P. T., Lawrence, G. R., & Dennis, B. R. 2003, ApJL, 588, L53Gary, G. A., & Moore, R. L. 2004, ApJ, 611, 545Gibson, S. E., & Fan, Y. 2006, JGRA, 111, 12103Gilbert, H. R., Holzer, T. E., Burkepile, J. T., & Hundhausen, A. J. 2000, ApJ,
537, 503
Gopalswamy, N., Shimojo, M., Lu, W., et al. 2003, ApJ, 586, 562Gopalswamy, N., Yashiro, S., & Akiyama, S. 2015, ApJ, 809, 106Gosling, J. T. 1993, JGR, 98, 18937Green, L. M., Török, T., Vršnak, B., Manchester, W., & Veronig, A. 2018,
SSRv, 214, 46Guo, Y., Schmieder, B., Démoulin, P., et al. 2010, ApJ, 714, 343Hassanin, A., & Kliem, B. 2016, ApJ, 832, 106Howard, R. A., Moses, J. D., Vourlidas, A., et al. 2008, SSRv, 136, 67Illing, R. M. E., & Hundhausen, A. J. 1983, JGR, 88, 10210Inoue, S., Hayashi, K., Shiota, D., Magara, T., & Choe, G. S. 2013, ApJ,
770, 79Jenkins, J. M., Hopwood, M., Démoulin, P., et al. 2019, ApJ, 873, 49Ji, H., Wang, H., Schmahl, E. J., Moon, Y.-J., & Jiang, Y. 2003, ApJL,
595, L135Jiang, C., Wu, S. T., Feng, X., & Hu, Q. 2014, ApJL, 786, L16Joshi, N. C., Liu, C., Sun, X., et al. 2015, ApJ, 812, 50Kahler, S. W., Moore, R. L., Kane, S. R., & Zirin, H. 1988, ApJ, 328, 824Karpen, J. T., Antiochos, S. K., & DeVore, C. R. 2012, ApJ, 760, 81Kliem, B., Lin, J., Forbes, T. G., Priest, E. R., & Török, T. 2014, ApJ, 789, 46Kliem, B., Titov, V. S., & Török, T. 2004, A&A, 413, L23Kliem, B., & Török, T. 2006, PhRvL, 96, 255002Kwon, R.-Y., Zhang, J., & Olmedo, O. 2014, ApJ, 794, 148Lemen, J. R., Title, A. M., Akin, D. J., et al. 2012, SoPh, 275, 17Li, L. P., & Zhang, J. 2013a, A&A, 552, L11Li, Q., Deng, N., Jing, J., & Wang, H. 2017, ApJ, 841, 112Li, T., & Zhang, J. 2013b, ApJL, 778, L29Li, T., Zhang, J., & Ji, H. 2015, SoPh, 290, 1687Lin, J., Ko, Y.-K., Sui, L., et al. 2005, ApJ, 622, 1251Lin, J., & van Ballegooijen, A. A. 2002, ApJ, 576, 485Ling, A. G., Webb, D. F., Burkepile, J. T., & Cliver, E. W. 2014, ApJ, 784, 91Liu, R., Liu, C., Wang, S., Deng, N., & Wang, H. 2010, ApJL, 725, L84Liu, T., Su, Y., Cheng, X., van Ballegooijen, A., & Ji, H. 2018, ApJ, 868, 59Liu, W., Chen, Q., & Petrosian, V. 2013, ApJ, 767, 168Mackay, D. H., Karpen, J. T., Ballester, J. L., Schmieder, B., & Aulanier, G.
2010, SSRv, 151, 333Maričić, D., Vršnak, B., Stanger, A. L., et al. 2007, SoPh, 241, 99Markwardt, C. B. 2009, in ASP Conf. Ser. 411, Astronomical Data Analysis
Software and Systems XVIII, ed. D. A. Bohlender, D. Durand, & P. Dowler(San Francisco, CA: ASP), 251
McCauley, P. I., Su, Y. N., Schanche, N., et al. 2015, SoPh, 290, 1703Moore, R. L., Sterling, A. C., Hudson, H. S., & Lemen, J. R. 2001, ApJ,
552, 833Munro, R. H., Gosling, J. T., Hildner, E., et al. 1979, SoPh, 61, 201Myshyakov, I., & Tsvetkov, T. 2020, ApJ, 889, 28Neupert, W. M., Thompson, B. J., Gurman, J. B., & Plunkett, S. P. 2001, JGR,
106, 25215Nindos, A., Patsourakos, S., Vourlidas, A., & Tagikas, C. 2015, ApJ, 808, 117Olmedo, O., & Zhang, J. 2010, ApJ, 718, 433Ouyang, Y., Yang, K., & Chen, P. F. 2015, ApJ, 815, 72Palacios, J., Cid, C., Guerrero, A., Saiz, E., & Cerrato, Y. 2015, A&A,
583, A47Patsourakos, S., Vourlidas, A., & Kliem, B. 2010a, A&A, 522, A100Patsourakos, S., Vourlidas, A., & Stenborg, G. 2010b, ApJL, 724, L188Patsourakos, S., Vourlidas, A., & Stenborg, G. 2013, ApJ, 764, 125Pesnell, W. D., Thompson, B. J., & Chamberlin, P. C. 2012, SoPh, 275, 3Qiu, J., Wang, H., Cheng, C. Z., & Gary, D. E. 2004, ApJ, 604, 900Riley, P., Lionello, R., Mikić, Z., & Linker, J. 2008, ApJ, 672, 1221Sakurai, T. 1976, PASJ, 28, 177Savage, S. L., McKenzie, D. E., Reeves, K. K., Forbes, T. G., &
Longcope, D. W. 2010, ApJ, 722, 329Schatten, K. H., Wilcox, J. M., & Ness, N. F. 1969, SoPh, 6, 442Schou, J., Scherrer, P. H., Bush, R. I., et al. 2012, SoPh, 275, 229Schrijver, C. J., Elmore, C., Kliem, B., Török, T., & Title, A. M. 2008, ApJ,
674, 586Seaton, D. B., Bartz, A. E., & Darnel, J. M. 2017, ApJ, 835, 139Sheeley, N. R., Jr., Warren, H. P., & Wang, Y. M. 2007, ApJ, 671, 926Shen, Y., Liu, Y., & Su, J. 2012, ApJ, 750, 12Sinha, S., Srivastava, N., & Nandy, D. 2019, ApJ, 880, 84Song, H. Q., Chen, Y., Ye, D. D., et al. 2013, ApJ, 773, 129Song, H. Q., Cheng, X., Chen, Y., et al. 2017, ApJ, 848, 21Song, H. Q., Zhou, Z. J., Li, L. P., et al. 2018, ApJL, 864, L37Sterling, A. C., Harra, L. K., & Moore, R. L. 2007, ApJ, 669, 1359Sterling, A. C., Moore, R. L., & Freeland, S. L. 2011, ApJL, 731, L3Su, Y., van Ballegooijen, A., McCauley, P., et al. 2015, ApJ, 807, 144Sun, J. Q., Cheng, X., Ding, M. D., et al. 2015, NatCo, 6, 7598Sun, X. 2018, arXiv:1801.04265
19
The Astrophysical Journal, 894:85 (20pp), 2020 May 10 Cheng et al.
Temmer, M., Veronig, A. M., Kontar, E. P., Krucker, S., & Vršnak, B. 2010,ApJ, 712, 1410
Temmer, M., Veronig, A. M., Vršnak, B., et al. 2008, ApJL, 673, L95Török, T., Berger, M. A., & Kliem, B. 2010, A&A, 516, A49Török, T., & Kliem, B. 2005, ApJL, 630, L97Török, T., Kliem, B., & Titov, V. S. 2004, A&A, 413, L27Tripathi, D., Reeves, K. K., Gibson, S. E., Srivastava, A., & Joshi, N. C. 2013,
ApJ, 778, 142Vasantharaju, N., Vemareddy, P., Ravindra, B., & Doddamani, V. H. 2019,
ApJ, 885, 89Vemareddy, P., & Zhang, J. 2014, ApJ, 797, 80Veronig, A. M., Podladchikova, T., Dissauer, K., et al. 2018, ApJ, 868, 107Vourlidas, A., Wu, S. T., Wang, A. H., Subramanian, P., & Howard, R. A.
2003, ApJ, 598, 1392Vršnak, B. 2001, JGR, 106, 25249Wan, L., Cheng, X., Shi, T., Su, W., & Ding, M. D. 2016, ApJ, 826, 174Webb, D. F., Forbes, T. G., Aurass, H., et al. 1994, SoPh, 153, 73
Webb, D. F., & Hundhausen, A. J. 1987, SoPh, 108, 383Williams, D. R., Török, T., Démoulin, P., van Driel-Gesztelyi, L., & Kliem, B.
2005, ApJL, 628, L163Wood, B. E., Howard, R. A., & Linton, M. G. 2016, ApJ, 816, 67Xing, C., Li, H. C., Jiang, B., Cheng, X., & Ding, M. D. 2018, ApJ, 857, L14Yan, X.-L., Xue, Z.-K., Xiang, Y.-Y., & Yang, L.-H. 2015, RAA, 15, 1725Yang, S., Zhang, J., Liu, Z., & Xiang, Y. 2014, ApJL, 784, L36Yashiro, S., Akiyama, S., Gopalswamy, N., & Howard, R. A. 2006, ApJL,
650, L143Zhang, J., Cheng, X., & Ding, M.-D. 2012, NatCo, 3, 747Zhang, J., & Dere, K. P. 2006, ApJ, 649, 1100Zhang, J., Dere, K. P., Howard, R. A., Kundu, M. R., & White, S. M. 2001,
ApJ, 559, 452Zhang, J., Dere, K. P., Howard, R. A., & Vourlidas, A. 2004, ApJ, 604, 420Zhou, G. P., Zhang, J., & Wang, J. X. 2016, ApJL, 823, L19Zou, P., Jiang, C., Wei, F., Zuo, P., & Wang, Y. 2019, ApJ, 884, 157Zuccarello, F. P., Aulanier, G., & Gilchrist, S. A. 2016, ApJL, 821, L23
20
The Astrophysical Journal, 894:85 (20pp), 2020 May 10 Cheng et al.