initiation and titration of insulin analogs in the patient...
TRANSCRIPT
1
Initiation and Titration of Insulin Analogs in the
Patient with Type 2 Diabetes
Supported by an educational grant from Novo Nordisk Inc.
This program is supported by an educational grant from Novo Nordisk Inc. It has been accredited by the American Association of Diabetes Educators (AADE) for pharmacists, nurses, and dietitians.

2
Diabetes Nurse SpecialistMid America Diabetes AssociatesWichita, Kansas
Deborah Hinnen, RN, ARNP, BC-ADM, CDE, FAAN
The following program is a taped presentation by Deborah Hinnen.
Deborah Hinnen, RN, ARNP, BC-ADM, CDE, FAAN has been a diabetes educator for over thirty years. As a clinical nurse specialist and education coordinator, she currently works at Mid America Diabetes Associates as coordinator of a multidisciplinary team. The centerpiece of their program is a three day comprehensive self-management course that serves nearly 1000 people with diabetes per year.
Ms. Hinnen is involved extensively with the American Association of Diabetes Educators, having served as their national President in 1993-94. She was awarded their prestigious Distinguished Service Award in the summer of 2001. She has also served on the national board of directors for the American Diabetes Association, and was an associate editor for Diabetes Spectrum. She continues to volunteer with many other organizations. Her faculty positions are with the Pharmacy Department at University of Kansas, and Graduate Nursing Department at Wichita State University and the Physicians Assistant Program at Wichita State. Ms. Hinnen was inducted as a Fellow into the American Academy of Nursing in 2003.
Her career has focused on diabetes patient and professional education with many publications in both areas. In addition to diabetes efforts, she served as a Trustee for Butler Community College, a college with seven sites and more than 14,000 students.
3
Objectives
• Discuss the epidemiology, pathophysiology, and treatment goals of type 2 diabetes in the United States
• Review the advantages of insulin analogs based on pharmacokinetics and pharmacodynamics
• Explain why, when, and how to initiate insulin in a patient with type 2 diabetes, including overcoming psychological insulin resistance
• Discuss factors that must be considered when initiating and adjusting insulin regimens
The objectives of this educational activity are to:
• Discuss the epidemiology, pathophysiology, and treatment goals of type 2 diabetes in the United States.
• Review the advantages of insulin analogs based on the pharmacokinetics and pharmacodynamics of the various types of insulin.
• Explain why, when, and how to initiate insulin in a patient with type 2 diabetes, as well as tips for overcoming psychological insulin resistance.
• Discuss factors that must be considered when initiating and adjusting insulin regimens.

4
Diabetes Prevalence: 1994–2005
http://www.cdc.gov/diabetes/statistics/prev/state/fPrev1994and2005.htm
20051994
>8% 7%-7.9%6%-6.9% 5%-5.9% <5%
This slide shows how the prevalence of diabetes has increased dramatically in the United States over the last decade and is reaching epidemic proportions. The states in which less than 5% of the adult population had diagnosed diabetes are noted in light blue. The states marked in other colors represent higher prevalences of diagnosed diabetes. In 1994, 13 states had an age-adjusted prevalence of diabetes of 5% or higher. By 2005, this number increased dramatically, to 48 states having at least this prevalence.
There are some other striking diabetes statistics based on 2005 data.
• Approximately 20.8 million Americans, or 7% of population have diabetes. Of these, 14.6 million cases are diagnosed, and 6.2 million are undiagnosed.
• Type 2 diabetes accounts for the vast majority of diabetes cases, about 90%–95%.
• In 2005, 1.5 million new cases of diabetes were diagnosed in people aged 20 years or older.
• Another 54 million Americans are estimated to have prediabetes, a condition in which blood glucose levels are higher than normal, but not high enough to be classified as diabetes.
• Clinically based reports and regional studies suggest that the prevalence of type 2 diabetes is increasing among children and adolescents.
5
Complications Associated with Diabetes
*Leading cause of renal failure, new cases of blindness, and nontraumatic amputations.
Blindness*Blindness*
Kidney Kidney failure*failure*
Amputation*Amputation*
Heart diseaseHeart disease↑↑ 2X to 4X2X to 4X
Nerve damage in Nerve damage in 60% to 70% of patients60% to 70% of patients
6th leading cause6th leading causeof death of death
DiabetesMellitus
Risk of death Risk of death ↑↑ 2X2X
Anderson et al. National Vital Statistics Reports, 2005.CDC. National diabetes fact sheet—United States, 2005.
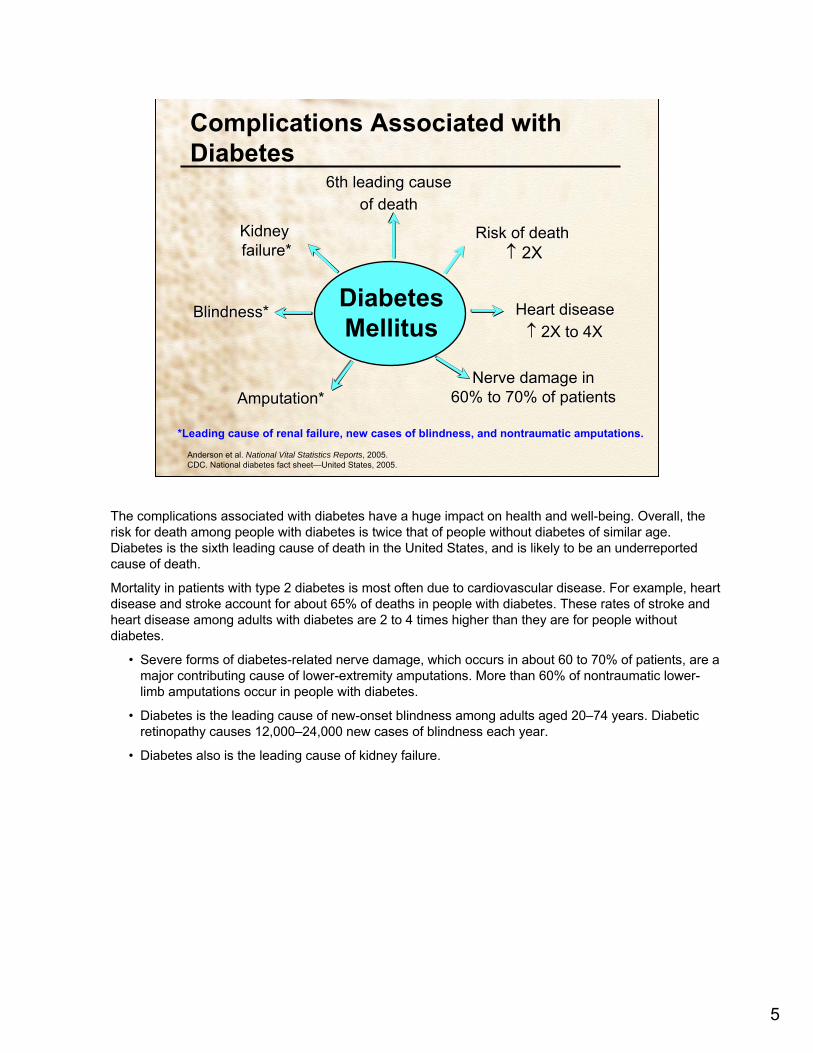
The complications associated with diabetes have a huge impact on health and well-being. Overall, the risk for death among people with diabetes is twice that of people without diabetes of similar age. Diabetes is the sixth leading cause of death in the United States, and is likely to be an underreported cause of death.
Mortality in patients with type 2 diabetes is most often due to cardiovascular disease. For example, heart disease and stroke account for about 65% of deaths in people with diabetes. These rates of stroke and heart disease among adults with diabetes are 2 to 4 times higher than they are for people without diabetes.
• Severe forms of diabetes-related nerve damage, which occurs in about 60 to 70% of patients, are a major contributing cause of lower-extremity amputations. More than 60% of nontraumatic lower-limb amputations occur in people with diabetes.
• Diabetes is the leading cause of new-onset blindness among adults aged 20–74 years. Diabetic retinopathy causes 12,000–24,000 new cases of blindness each year.
• Diabetes also is the leading cause of kidney failure.

6
Pathophysiology of Diabetes
Lebovitz HE. Therapy for Diabetes Mellitus and Related Disorders. 2004.Gerich JE. Eur J Clin Invest. 2002;32(Suppl 3):46–53. ADA. Diabetes Care. 2007;30(Suppl 1):S42–S47.Foulis AK. Joslin’s Diabetes Mellitus. 13th ed.1994.Bardsley JK. The Art and Science of Diabetes Self-Management Education. 2006.
Type I• Absolute insulin deficiency due to autoimmune or idiopathic destruction of pancreatic beta-cells
• Patients require exogenous insulin from the time of diagnosis
• 5%–10% of individuals with diabetes
A Dual Defect• Insulin resistance
– Impaired glucose uptake– Hepatic overproduction of glucose – Hyperinsulinemia (compensatory)
• Beta-cell dysfunction– Glucotoxicity– Lipotoxicity– Apoptosis
Type 2
It is important to review the basic differences between the two types of diabetes.
Type 1 diabetes is characterized by absolute insulin deficiency. Most individuals with type 1 diabetes have autoimmune destruction of pancreatic beta-cells, but a few have an unknown or idiopathic process that leads to beta-cell loss. The rate of beta-cell destruction varies widely, but eventually results in a total loss of insulin production.
• Patients with type 1 diabetes require exogenous insulin to survive.
• Once type 1 diabetes is diagnosed and blood glucose levels are normalized with treatment, there is typically a honeymoon period when insulin requirements decrease significantly. This occurs during the 1st month after diagnosis and lasts between 3 and 12 months.
• As alluded to earlier, about 5 to 10% of individuals with diabetes have type 1 diabetes. The remaining 90 to 95% have type 2 diabetes.
• Over 25% of patients diagnosed with type 1 diabetes are likely to have metabolic syndrome.
Type 2 diabetes occurs as a result of multiple pathophysiologic defects involving varying degrees of insulin resistance and insulin deficiency. Insulin resistance involves a failure of patients’ peripheral tissues to respond to insulin. This results in decreased uptake of glucose into peripheral tissues such as muscle, and increased breakdown of adipocytes, or fat cells. In addition, the liver fails to properly respond to insulin by limiting glucose production as it should. These defects result in elevated plasma glucose and free fatty acid concentrations. The system responds to the hyperglycemia by increasing insulin secretion. Beta-cell dysfunction can also occur, and involves impaired insulin secretion by the pancreas. This dysfunction may be primary or acquired, or both. Patients with type 2 diabetes may have a deficit in beta-cell mass. In addition, chronic hyperglycemia causes impairment of insulin secretion, leading to glucotoxicity, while free fatty acids exacerbate peripheral insulin resistance and impair beta-cell insulin secretion, causing lipotoxicity. The decrease in beta-cell mass seen in individuals with type 2 diabetes may be due to increased beta-cell apoptosis, a form of programmed cell death.
7
4:00
25
50
75
8:00 12:00 16:00 20:00 24:00 4:00
Breakfast Lunch Dinner
Plasma Insulin
(µU/mL)
Physiologic Serum Insulin Secretion Profile
Time8:00
Gavin JR III. Diabetes Educ. 2007;33(Suppl 3):66S–73S.
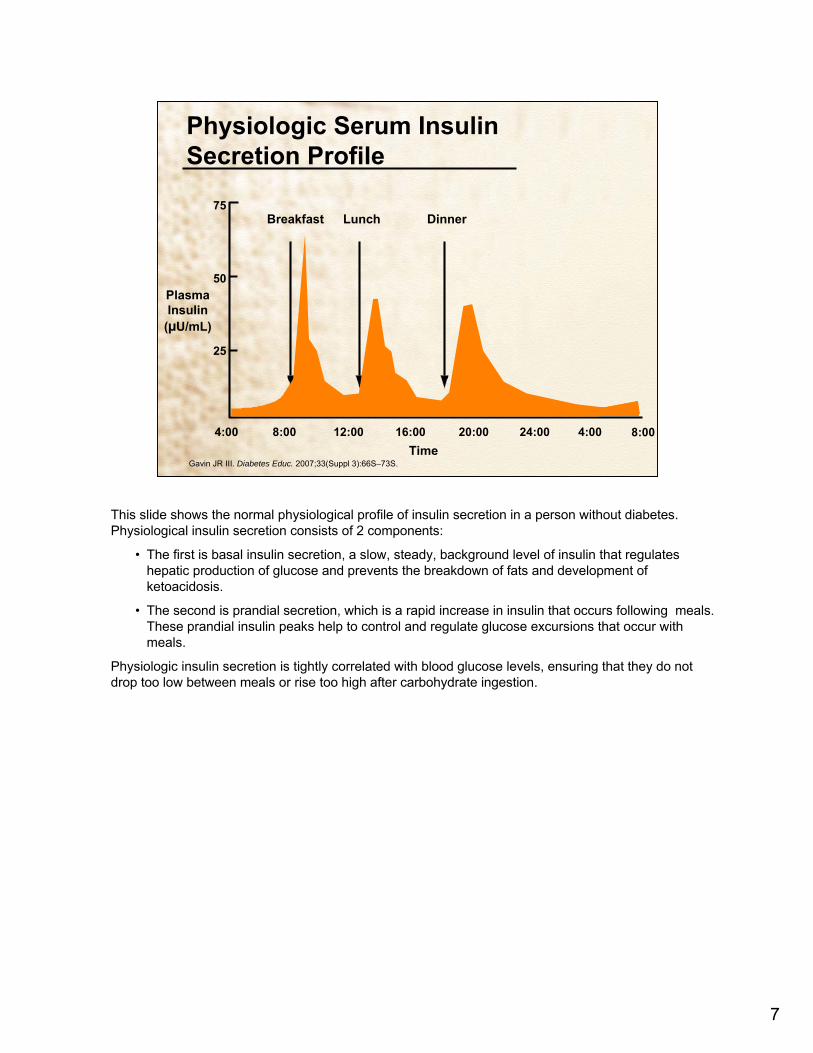
This slide shows the normal physiological profile of insulin secretion in a person without diabetes. Physiological insulin secretion consists of 2 components:
• The first is basal insulin secretion, a slow, steady, background level of insulin that regulates hepatic production of glucose and prevents the breakdown of fats and development of ketoacidosis.
• The second is prandial secretion, which is a rapid increase in insulin that occurs following meals. These prandial insulin peaks help to control and regulate glucose excursions that occur with meals.
Physiologic insulin secretion is tightly correlated with blood glucose levels, ensuring that they do not drop too low between meals or rise too high after carbohydrate ingestion.

8
Glucose Profiles in Diabetes
7 PM 7 AM 70
200
400
BloodGlucose
(mg/100 mL)
Breakfast Lunch Dinner Snack
Normal
Uncontrolleddiabetes
Gavin JR III. Diabetes Educ. 2007;33(Suppl 3):66S–73S.
Again, diabetes results from impairments in insulin action on the peripheral tissues or defects in insulin secretion from the pancreas, which cause blood glucose levels to fluctuate widely.
In this slide, the bottom orange curve represents blood glucose in an individual without diabetes, while the top black curve shows glucose profiles in uncontrolled diabetes. The goal of diabetes treatment is to shift the top curve into closer proximity with the bottom curve.

9
Type 2 Diabetes Is a Progressive Disease
0
100
200
300
–10 –5 0 5 10 15 20 25 30
50
150
250
350
At Risk for Diabetes
Glucose(mg/dL)
Relative Function
Postmeal Glucose
Fasting Glucose
Insulin Resistance
Insulin Levelβ-Cell Failure
Years of DiabetesBergenstal RM, ©2001 International Diabetes Center.
This slide depicts the progressive course of type 2 diabetes.
As mentioned earlier, in type 1 diabetes, endogenous insulin secretion is virtually absent because of autoimmune-mediated destruction of pancreatic beta-cells, although some patients continue to produce residual insulin for varying periods.
In contrast, in type 2 diabetes, beta-cell deterioration occurs progressively over many years. Most patients have had the disease for 10 or more years before diabetes is diagnosed. During this 10-year period (note the blue shaded areas), postprandial and fasting glucose levels and insulin resistance all increase. Beta-cell function starts to deteriorate after years of having type 2 diabetes. Eventually, the pancreas cannot synthesize and secrete sufficient insulin to meet the demands of insulin-resistant patients. This beta-cell failure progresses over time until most patients with type 2 diabetes require insulin therapy.

10
A1C = PPG + FPG
Normal A1C ≤6.0%
Glycemic Control
ADA. Diabetes Care. 2001;24:775–778.Gerich JE. Arch Intern Med. 2003;163:1306–1316.Monnier L et al. Diabetes Care. 2003;26:881–885.
PPG = postprandial glucose; FPG = fasting plasma glucose
The long-term impact of hyperglycemia on glycemic control is best measured by glycosylated hemoglobin, or A1C. This value is a function of both fasting and postprandial glucose exposure. Normal A1C is considered ≤6% and represents an average blood glucose level of 135 mg/dL or lower. On average, a 1% increase in A1C corresponds to an increase in mean plasma glucose of ~35 mg/dL.
A study published in 2003 followed 290 patients with type 2 diabetes and compared the fasting and postprandial contributions to glycemic control in individuals not responding to therapy with two oral antidiabetic drugs. In mild to moderate hyperglycemia, which was defined in the study as A1C <8.4%, 60%–80% of the glucose contribution came from postprandial glucose excursions. It was not until the A1C was >8.5% that the fasting blood glucose contributed more to the value. These results demonstrate that postprandial glucose measurements are not only warranted but necessary if improved glucose control is the goal.

11
Current Treatment Goals
ADA. Diabetes Care. 2007;30(Suppl 1):S4–S41.AACE/ACE. Endocr Pract. 2006;12(Suppl 1):6–12.AACE. Endocr Pract. 2000;6:162–213.
<140†<180*Postprandial glucose (mg/dL)<130/85<130/80Blood pressure (mm Hg)
<11090–130Fasting/preprandial glucose (mg/dL)
≤6.5%<7%A1C
<130<100 LDL-cholesterol (mg/dL)
<200<150 Triglycerides (mg/dL)>35>40HDL-cholesterol (mg/dL)
AACEADA
*Peak postprandial capillary plasma glucose; measure 1–2 hours after beginning of meal.†2-hour postprandial glucose.‡The ADA recommends an LDL <70 mg/dL in individuals with overt cardiovascular disease.
The current treatment goals for diabetes include A1C and fasting and postprandial blood glucose levels, as well as target levels for blood pressure and plasma lipids.
The glycemic targets that are shown on this slide are based on landmark studies that demonstrated that the risk of developing microvascular and macrovascular complications increases substantially once blood glucose and A1C levels exceed these recommended values. The target goals differ somewhat between the guidelines of the American Diabetes Association, or ADA and the American Association of Clinical Endocrinologists, referred to as AACE. The ADA favors tighter control of lipids and blood pressure whereas the AACE favors tighter control of glycemia.
It is important to note that the ADA recommends a low-density lipoprotein, or LDL, value of <70 mg/dL in individuals with overt cardiac disease.
Regardless of which standard is used, diabetes warrants continuous medical care and comprehensive self-management to achieve these goals and to prevent complications.

12
Benefits of Glycemic Control: Evidence from Clinical Trials
↓42%–57%
↓53%–92%
↓72%–87%
DCCT/EDIC(Type 1)
9% → 8%
↓16%*↓41%*Macrovascular
↓60%Neuropathy
↓24%–33%↓70%↓54%Nephropathy
↓17%–21%↓69%↓63%Retinopathy
UKPDS(Type 2)
8% → 7%
Kumamoto(Type 2)
9% → 7%
DCCT(Type 1)
9% → 7%A1C
*Not significant because of small number of events.
Several randomized controlled trials have studied the impact of intensive therapy on the incidence of long-term diabetes-related complications. The Diabetes Control and Complications Trial, or DCCT, evaluated the incidence of complications in patients with type 1 diabetes, whereas the Kumamoto study and the United Kingdom Prospective Diabetes Study, or UKPDS evaluated type 2 diabetes.
In all of the studies, a reduction of the A1C was associated with a statistically significant reduction in microvascular complications, including reduced incidences of retinopathy, neuropathy, and nephropathy. The DCCT, Kumamoto, and UKPDS did not elucidate a statistically significant reduction in macrovascular complications. This may have been due to the small number of events that occurred over the 6- to 10-year follow-up period. More recently, however, a significant reduction in macrovascular complications with intensive therapy in type 1 diabetes was observed in the DCCT/Epidemiology of Diabetes Interventions and Complications, or EDIC study, which was a very long-term (17-year) follow-up to the DCCT.

13
Treatment Goals Are Currently Unmet
20.6%--A1C ≥9%
-7.3%-A1C <7%BP <130/80 mm HgTotal cholesterol <200 mg/dL
42.3%37.0%35.8%A1C <7%
-37.2%-A1C >8%
Saydah et al. 1999–2000
Saaddine et al. 1999–2002
Koro et al. 1999–2000
Koro CE et al. Diabetes Care. 2004;27:17–20.Saydah SH et al. JAMA. 2004;291:335–342.Saadine JB et al. Ann Intern Med. 2006:144:465–474.
Reported outcomes among US adults diagnosed with diabetes
Despite the demonstrated benefits of glycemic control and the increasing numbers of medications and treatment options available, unfortunately many patients are not currently achieving diabetes treatment goals.
Recent data from national surveys, including the National Health and Nutrition Examination Survey, or NHANES, in 1999–2000, and the Behavioral Risk Factor Surveillance System in 2002 indicate that almost two thirds of US adults with diabetes are not meeting the current ADA goal for glycemic control, which is an A1C of <7%.
Substantial numbers of patients have A1C levels >8%, which is considered the recommended level for “taking action”, meaning switching or adding therapies. In one study, Saaddine and coworkers found that about 1 in 5 patients had “poor glycemic control,” which they defined as an A1C of 9% or greater.
In addition, many patients do not meet goals for blood pressure and blood lipid levels. Saydah and colleagues found that only 7.3% of adults with diabetes had met the composite goals of a A1C <7%, blood pressure <130/80 mm Hg, and total cholesterol <200 mg/dL. Adequate control of these markers has been proven to reduce the risk of vascular disease in diabetes.
14
Treat-to-Failure ApproachTheoretical Representation
A1C
Time
7%
Diet, e
xerci
se, li
festyl
e
OAD thera
py
Add seco
nd OAD
Initiate
insulin
OAD = oral antidiabetic drug
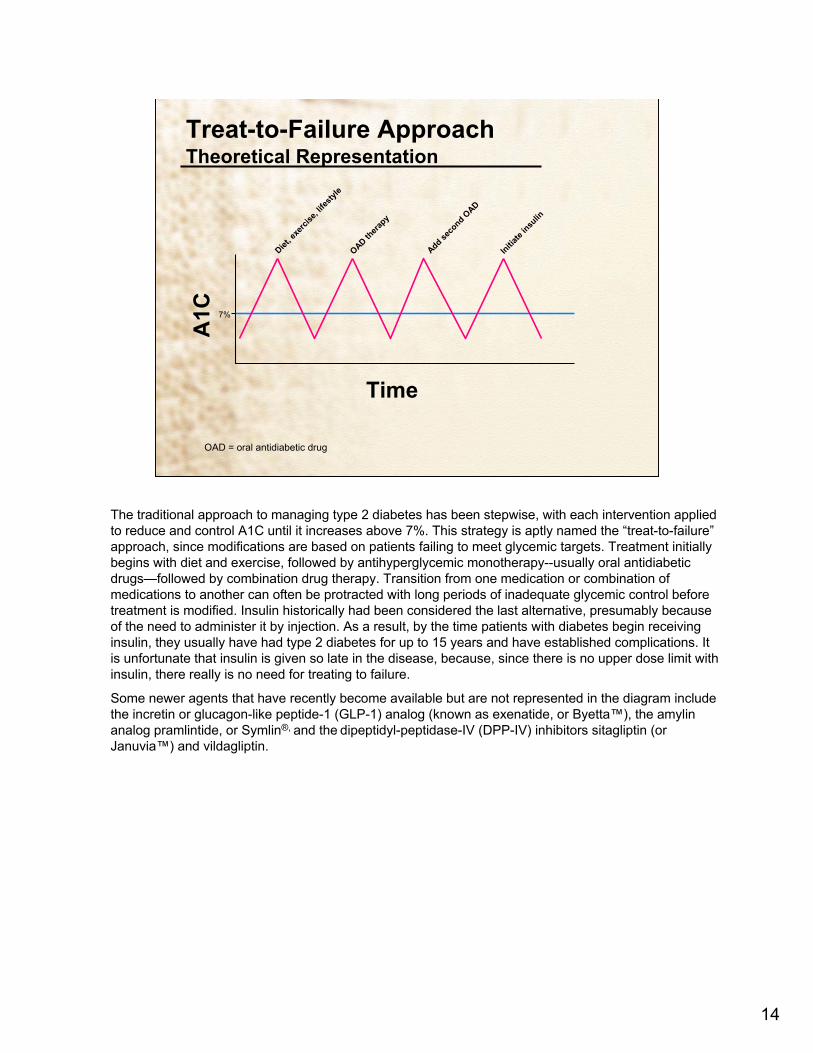
The traditional approach to managing type 2 diabetes has been stepwise, with each intervention applied to reduce and control A1C until it increases above 7%. This strategy is aptly named the “treat-to-failure” approach, since modifications are based on patients failing to meet glycemic targets. Treatment initially begins with diet and exercise, followed by antihyperglycemic monotherapy--usually oral antidiabetic drugs—followed by combination drug therapy. Transition from one medication or combination of medications to another can often be protracted with long periods of inadequate glycemic control before treatment is modified. Insulin historically had been considered the last alternative, presumably because of the need to administer it by injection. As a result, by the time patients with diabetes begin receiving insulin, they usually have had type 2 diabetes for up to 15 years and have established complications. It is unfortunate that insulin is given so late in the disease, because, since there is no upper dose limit with insulin, there really is no need for treating to failure.
Some newer agents that have recently become available but are not represented in the diagram include the incretin or glucagon-like peptide-1 (GLP-1) analog (known as exenatide, or Byetta™), the amylin analog pramlintide, or Symlin®, and the dipeptidyl-peptidase-IV (DPP-IV) inhibitors sitagliptin (orJanuvia™) and vildagliptin.
15
Patients Remain on Monotherapy Too Long
*May include uptitration. Length of time between first A1C >8.0% and switch/addition in therapy could include periods where patients had subsequent A1C test values below 8%. Based on nonrandomized retrospective database analysis. Data from Kaiser Permanente Northwest 1994–2002. Patients had to be continuously enrolled for 12 months with A1C lab values.
Length of time that A1C remained above 8.0% before a switch/addition in therapy*
0
5
10
15
20
25
Metformin Only Sulfonylurea Only
Months
(n = 354) (n = 2517)
14 Months
20 Months
Brown JB et al. Diabetes. 2003;52(Suppl 1):A61–A62. Abstract 264-OR.
Retrospective database study of 5,798 patients
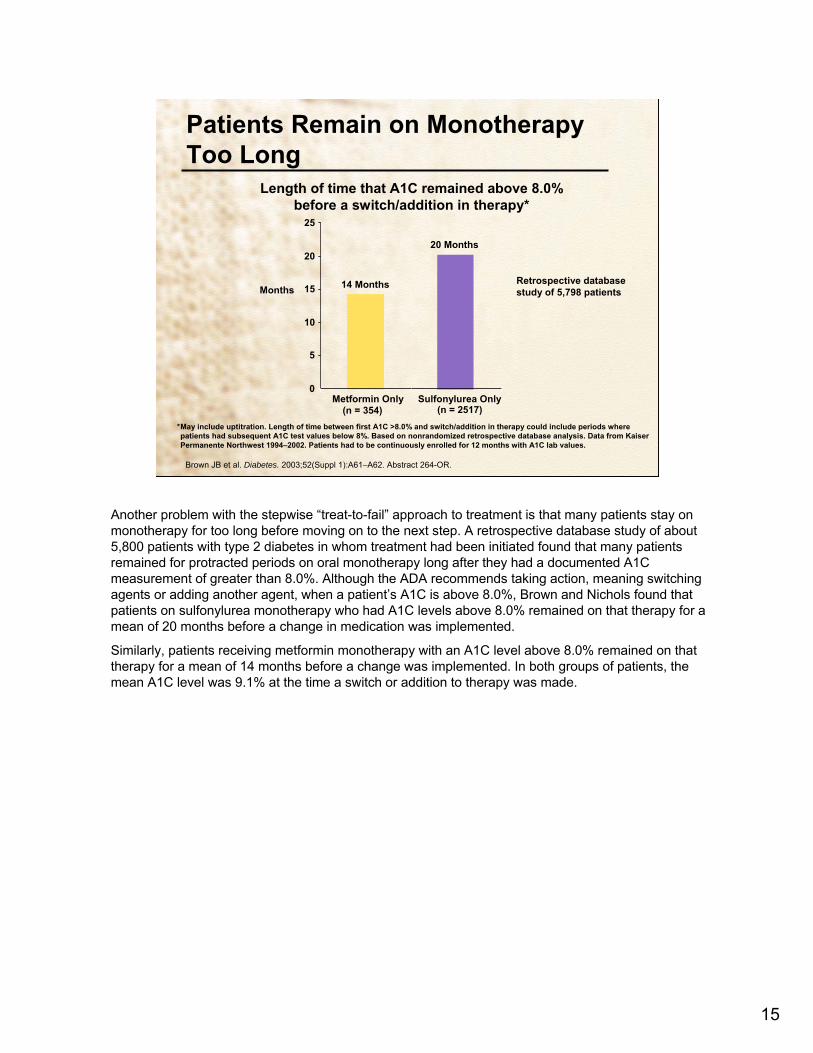
Another problem with the stepwise “treat-to-fail” approach to treatment is that many patients stay on monotherapy for too long before moving on to the next step. A retrospective database study of about 5,800 patients with type 2 diabetes in whom treatment had been initiated found that many patients remained for protracted periods on oral monotherapy long after they had a documented A1C measurement of greater than 8.0%. Although the ADA recommends taking action, meaning switching agents or adding another agent, when a patient’s A1C is above 8.0%, Brown and Nichols found that patients on sulfonylurea monotherapy who had A1C levels above 8.0% remained on that therapy for a mean of 20 months before a change in medication was implemented.
Similarly, patients receiving metformin monotherapy with an A1C level above 8.0% remained on that therapy for a mean of 14 months before a change was implemented. In both groups of patients, the mean A1C level was 9.1% at the time a switch or addition to therapy was made.

16
Type 2 Diabetes Treatment Options and Expected Decreases in A1C
0.5-0.9DPP-IV inhibitors
1-1.5Glinides
1.5-2.5Insulin
0.5-1.0Amylin analogs0.5-1.0GLP-1 analogs
0.5-0.8α-Glucosidase inhibitors0.5-1.4Thiazolidinediones
1.5Sulfonylureas 1.5Metformin1-2MNT (↓weight,↑activity)
Expected Decrease in A1C (%)Intervention
Nathan DM et al. Diabetes Care. 2006;29:1963–1972.Nathan DM. N Engl J Med. 2007;365:437–440.
There are numerous treatment options for type 2 diabetes. The approaches to management include medical nutrition therapy, or MNT, which consists of diet and physical activity, as well as a variety of pharmacologic agents. Different interventions and classes of medications vary somewhat in their ability to decrease A1C. For instance, lifestyle changes like losing weight and exercising are likely to reduce A1C by 1 to 2%. Oral antidiabetic drugs generally reduce A1C between 0.5% and 1.5%. Some may cause weight gain, while others are associated with weight loss or no effect on body weight. Metformin, for instance, typically reduces A1C by about 1.5% and can be associated with modest weight loss.Sulfonylureas, on the other hand, also lower A1C by ~1.5%, but a person can be expected to gain an average of about 2 kg while on therapy.
Of the glinides, repaglinide is almost as effective as metformin and the sulfonylureas (decreasing A1C by about 1.5%), while nateglinide results in a smaller decrease. This drug class also is associated with weight gain. The thiazolidinediones have demonstrated A1C decreases in the range of 0.5%–1.4%, and also are associated with weight gain. α-Glucosidase inhibitors reduce A1C by between 0.5%–0.8%, and are weight-neutral.
Insulin and insulin analogs can reduce A1C to any level to achieve the desired therapeutic goal. They can be expected to cause weight gain in the range of 2 to 4 kg.
The GLP-1 analog exenatide appears to lower A1C by between 0.5%–1%. It is currently approved for use in the US with sulfonylurea, metformin, and thiazolidinediones. Exenatide is associated with weight loss of 2–3 kg in the first year.
The amylin analog pramlintide, an injectable agent approved for use only as adjunct therapy with insulin, decreased A1C by between 0.5%–1.0% in clinical trials. Pramlintide is associated with weight loss of 1–1.5 kg over 6 months.
DPP-IV inhibitors are associated with a decrease in A1C of about 0.5%–0.9% and are weight neutral.

17
Short-acting insulin (onset of action: 30–60 min)
• Regular human insulin (Humulin® R, Novolin® R)
Rapid-acting insulin analogs (onset of action: 5–15 min)
• Insulin lispro (Humalog®)• Insulin aspart (NovoLog®)• Insulin glulisine (Apidra®)
Currently Available Insulin and Insulin Analogs: Short- and Rapid-Acting
Skyler JS. Therapy for Diabetes Mellitus and Related Disorders. 2004.Aventis. Apidra® Prescribing Information. 2005.
As mentioned earlier, insulin and insulin analogs differ from other pharmacologic treatments for type 2 diabetes in that they can reduce any level of A1C to close to the therapeutic goal. These slides show currently available insulin formulations.
Short-acting and rapid-acting insulin analogs are used for mealtime coverage of blood glucose levels in multiple daily injection therapy to mimic normal insulin action. They can be used intravenously and in insulin pump therapy.
There are 2 brands of injectable short-acting regular human insulin marketed in the United States (Novolin® R and Humulin® R). There are 3 brands of injectable rapid-acting insulin analogs (Humalog®, which is insulin lispro; NovoLog®, which is insulin aspart, and Apidra®, which is insulin glulisine.

18
Intermediate-acting insulin (onset of action: 2–4 hr)
• NPH human insulin (Humulin® N, Novolin® N)
Long-acting insulin analogs (onset of action: 2–4 hr)
• Insulin glargine (Lantus®)• Insulin detemir (Levemir®)
Currently Available Insulin and Insulin Analogs: Intermediate- and Long-Acting
Skyler JS. Therapy for Diabetes Mellitus and Related Disorders. 2004.Aventis. Lantus® Prescribing Information. 2004.Novo Nordisk. Levemir® Prescribing Information. 2005.
Novo Nordisk. Novolin® N Prescribing Information. 1999.Eli Lilly. Humulin® N Prescribing Information. 2000.
Intermediate- and long-acting insulins are used to mimic basal coverage of blood glucose levels.
Intermediate-acting insulins marketed in the United States include Humulin® N and Novolin® N. Both are neutral protamine Hagedorn, or NPH, human insulins, which are suspensions and require mixing before injection to assure consistent absorption.
Long-acting insulin analogs include insulin glargine (Lantus®) and insulin detemir (Levemir®).
19
Premixed insulin (onset of action: 30–60 min)• Humulin® 70/30• Humulin® 50/50• Novolin® 70/30
Premixed insulin analogs (onset of action: 5–15 min)• Humalog® Mix75/25™
• Humalog® Mix50/50™*
• NovoLog® Mix 70/30
Skyler JS. Therapy for Diabetes Mellitus and Related Disorders. 2004.Eli Lilly. Humalog® Prescribing Information. 2006.
Currently Available Insulin and Insulin Analogs: Premixed Formulations
*Onset of action: <0.5 hr.
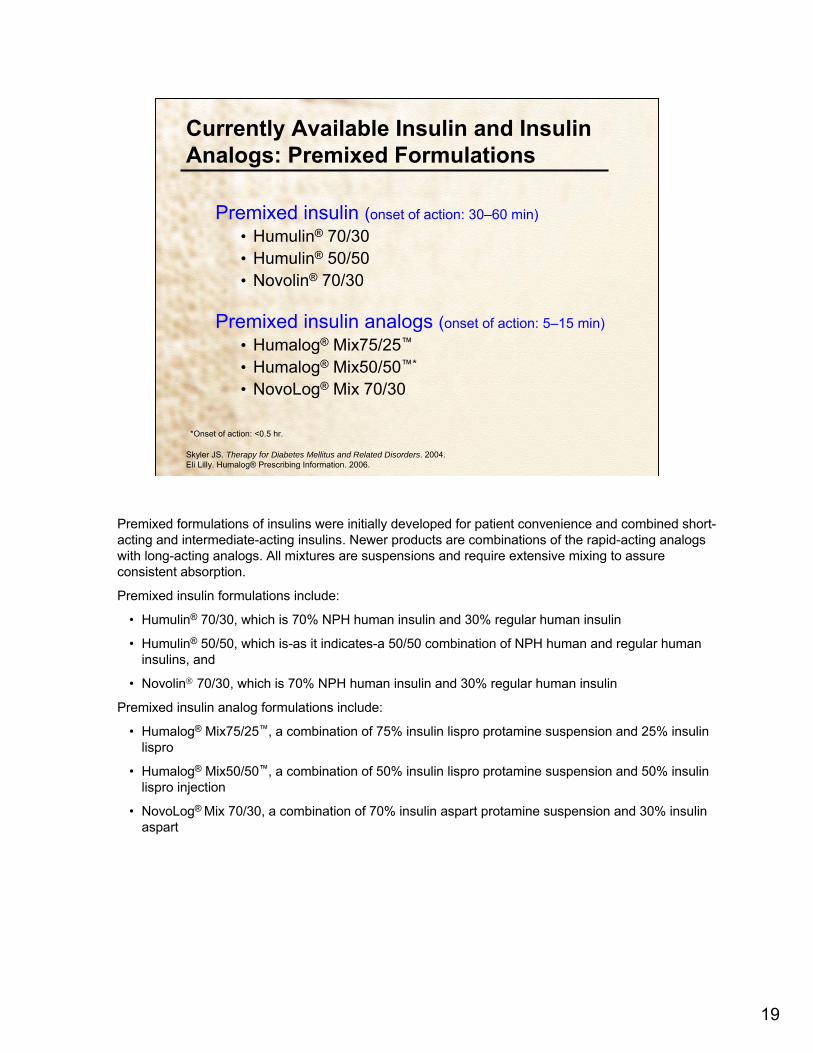
Premixed formulations of insulins were initially developed for patient convenience and combined short-acting and intermediate-acting insulins. Newer products are combinations of the rapid-acting analogs with long-acting analogs. All mixtures are suspensions and require extensive mixing to assure consistent absorption.
Premixed insulin formulations include:
• Humulin® 70/30, which is 70% NPH human insulin and 30% regular human insulin
• Humulin® 50/50, which is-as it indicates-a 50/50 combination of NPH human and regular human insulins, and
• Novolin® 70/30, which is 70% NPH human insulin and 30% regular human insulin
Premixed insulin analog formulations include:
• Humalog® Mix75/25™, a combination of 75% insulin lispro protamine suspension and 25% insulin lispro
• Humalog® Mix50/50™, a combination of 50% insulin lispro protamine suspension and 50% insulin lispro injection
• NovoLog® Mix 70/30, a combination of 70% insulin aspart protamine suspension and 30% insulin aspart

20
Time–Action Profiles of Insulin and Insulin Analogs: Theoretical Representations
The graph compares the time courses of different insulin preparations with the profile of normal (physiologic) insulin secretion.
The profile of physiologic insulin secretion can be seen plotted on the black line. The basal component is seen farthest at left. The prandial or mealtime component is represented by the peak.
The pharmacokinetic profiles of regular and NPH insulin, the darker blue and purple lines, are not conducive to reproducing the physiologic insulin secretion profile.
Regular insulin is absorbed more slowly that the prandial component of physiologic insulin and declines back to baseline more slowly. Rapid-acting insulin analogs (light blue line) are absorbed and reach peak plasma levels faster, and also decline back to baseline faster, than regular human insulin. The rapid-acting analogs more closely reproduce mealtime (prandial) physiologic insulin secretion than regular insulin.
Long-acting insulin analogs are relatively peakless, with flat action profiles, and thus reproduce the basal component of physiologic insulin secretion. In comparison, NPH insulin peaks at between 4 and 10 hours after injection. The long-acting insulin analogs have a more predictable time course of action than NPH.
21
4:00 16:00 20:00 24:00 4:00
Breakfast Lunch Dinner
Ideal Basal/Bolus Insulin Absorption Pattern
8:0012:008:00Time
Plasma Insulin(µU/mL)
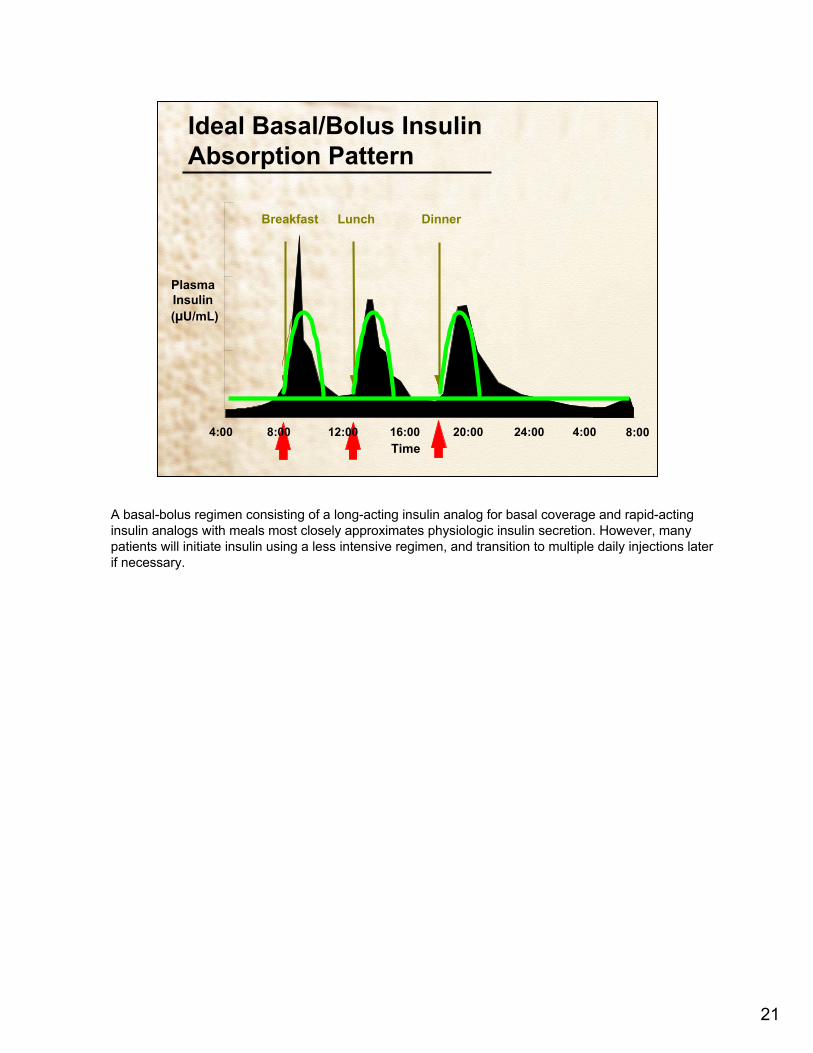
A basal-bolus regimen consisting of a long-acting insulin analog for basal coverage and rapid-acting insulin analogs with meals most closely approximates physiologic insulin secretion. However, many patients will initiate insulin using a less intensive regimen, and transition to multiple daily injections later if necessary.

22
Initiating Insulin in Practice: When and How
• Algorithms for initiating insulin
• Options for insulin regimens
• Evidence from clinical trials
• Calculating and titrating insulin dose
• Carbohydrate counting and calculating a correction bolus
• Psychological insulin resistance and clinical inertia
• Case studies
How can insulin be initiated for the treatment of type 2 diabetes in clinical practice?
The following sections will address this question. We will look specifically at algorithms for initiating insulin therapy, options for different insulin regimens, evidence from clinical trials, calculating and titrating insulin doses, carbohydrate counting and calculating a correction bolus, and psychological insulin resistance among patients and providers. Case studies incorporating these topics will then be presented.

23
Algorithm for Initiating Insulin TherapyHirsch et al Protocol
Assess Glycemic Status
A1C >7.5% FPG/PPG >100–250 mg/dL
A1C >7.5%FPG/PPG >250 mg/dL
Assess current treatment
Diet and exercise
OAD monotherapy
Combination OAD
Monotherapy
Add sensitizer
Initiate insulin
Once-dailybasal
Once-dailypremix
BIDpremix
Multipleinjections
Titrate weekly. Reassess at 1 month
Titrate weekly. Reassess at 2 months
Select regimen based on physician comfort and patient diet history, lifestyle, and motivation
Titrate weekly for 1 month or until glycemic targets achieved. Monitor monthly and adjust as needed. Transition to different regimen in 3–6 months if needed for glycemic targets or if hypoglycemia is a problem.
Refer to diabetes education program
Adapted from Hirsch IB et al. Clin Diabetes. 2005;23:78–86.
Providers must have a specific plan for initiating insulin. This slide depicts one recently published algorithm for initiating insulin in a primary care practice, as recommended by a group of clinicians.
According to this protocol, patients with very high blood glucose (meaning a fasting plasma glucose of 250 mg/dL or higher) should be started on insulin immediately. Initiating treatment with oral agents is a reasonable approach for patients with less severe hyperglycemia. The authors of the algorithm suggest that doses of oral antidiabetic drugs (shown as OADs on the slide) be adjusted weekly as needed to achieve targeted glycemic goals. Within 3 months, if glycemic targets are not achieved, insulin therapy should be initiated. Triple oral antidiabetic drug therapy can be tried before this, but this scenario usually is limited by lack of efficacy and side effects.
Though a basal-bolus insulin regimen is ideal for mimicking endogenous insulin action and overall glycemic control, it is difficult as first-line insulin therapy in type 2 diabetes because it requires substantial motivation on the part of the patient and provider, and requires training in carbohydrate counting and insulin adjustment. However, after starting with a simpler regimen and gaining confidence with self-injection, patients can more readily transition to multiple daily injections.
A once-daily basal insulin could consist of bedtime NPH or a long-acting insulin analog, which could be taken any time of day but at the same time every day.

24
Algorithm for Management of Type 2 Diabetes: ADA/EASD Consensus
ADA. Diabetes Care. 2007;30(Suppl 1):S4–S41.Nathan DM et al. Diabetes Care. 2006;29:1963–1972.
*Check A1C every 3 months until <7% and then at least every 6 months. †Although 3 oral agents can be used, initiation and titration of insulin therapy is preferred.
Diagnosis
Lifestyle Intervention + Metformin
A1C ≥7%No Yes*
Add Basal Insulin*-Most effective
Add Sulfonylurea-Least expensive
Add Glitazone-No hypoglycemia
No No No
No No
Yes* Yes* Yes*
Yes* Yes*
A1C ≥7% A1C ≥7% A1C ≥7%
A1C ≥7% A1C ≥7%
Intensify Insulin* Add Glitazone* Add Basal Insulin* Add Sulfonylurea†
Add Basal or Intensify Insulin*
Intensive insulin + Metformin +/- Glitazone
This slide depicts a slightly different algorithm that was recently published as part of a consensus statement from the ADA and the European Association for the Study of Diabetes.
As in the previous algorithm, the management goal is to achieve and maintain glycemic levels as close to the nondiabetic range as possible. This may involve rapidly changing therapies, allowing enough time to titrate each medication to an appropriate dose.
• In this algorithm, lifestyle changes and metformin should be initiated in the newly diagnosed patient.
• Within 2–3 months, if A1C remains above 7%, another medication should be added. The agent selected will depend in part on the A1C level—if it is >8.5%, for example, an agent with a greater capacity to lower glycemia, such as insulin, should be selected.
• If lifestyle, metformin, and a second agent are not effective in achieving the glycemic target, the next step is to start or intensify insulin. Adding a third oral agent can be considered, but is not recommended based on effectiveness and expense.
• In settings of severe hyperglycemia (blood glucose >250 mg/dL), immediate insulin plus lifestyle intervention is the recommended treatment.

25
Initiating Insulin: Which Patients and When?
• Extreme hyperglycemia (any of the following)– FPG >250 mg/dL– Random PG consistently >300 mg/dL– A1C >10%– Ketonuria– Symptomatic diabetes mellitus (weight loss, polyuria, polydipsia)
• Patients not achieving glycemic goals on oral agents– Patients receiving 2 oral agents not meeting A1C or FPG targets– Initiation of insulin preferred over adding third oral agent based on efficacy and
expense – Most patients with type 2 diabetes will eventually need insulin therapy
Hirsch IB et al. Clin Diabetes. 2005;23:78–86.Nathan DM et al. Diabetes Care. 2006;29:1963–1972.
Which patients with type 2 diabetes should be started on insulin, and when should insulin be initiated?
• In patients with extreme hyperglycemia, insulin should be started immediately to lower glucose levels. This is defined as any of the following: fasting plasma glucose above 250 mg/dL, random plasma glucose consistently above 300 mg/dL, an A1C greater than 10%, ketonuria, or symptomatic diabetes with polyuria, polydipsia, and weight loss.
• Patients on oral agents who are not meeting glycemic targets should also be started on insulin.
• In most patients with type 2 diabetes, it is reasonable to initiate therapy with oral agents.
• A1C should be checked every 2 to 3 months, and therapy should be changed if glycemic goals are not met.
• A combination of 2 oral agents may be used, and A1C should be reassessed in 2 to 3 months.
• Initiating insulin is preferable over adding a third oral agent in patients who are still not meeting glycemic goals.

26
Considerations for Choosing an Insulin Regimen
• Flexibility, lifestyle needs– Meal/snack schedules – Activity patterns
• Capability and willingness of patient– Handling, storing insulin– Administering insulin– Psychological insulin resistance
• Degree of hyperglycemia
• Goal: improving FPG or PPG
Hirsch IB et al. Clin Diabetes. 2005;23:78–86.Gavin JR III. Diabetes Educ. 2007:33:66S-73S.
In selecting an insulin regimen, it is extremely important to consider the needs, concerns, and capabilities of each patient.
Different patients have different needs for flexibility. While some patients have relatively consistent mealtimes and activity patterns, others may engage in sporadic periods of exercise and may vary the number and timing of meals. The insulin regimen must be tailored to the patient’s lifestyle and may need to be altered on an ongoing basis.
When starting insulin therapy, most patients are reluctant to accept multiple daily injections, so starting with a basal-bolus regimen may not be practical. Patients may also have concerns about handling or storing insulin. Such patients might be started on a once-daily regimen and later transitioned to multiple daily injections if glycemic goals are not met.
The patient’s degree of hyperglycemia will also impact the selection of an insulin regimen. Extreme hyperglycemia (a fasting plasma glucose above 250 mg/dL) will require basal-bolus multiple daily injection therapy that may be continued or modified once glucose is returned to near-normal levels.
Studies have shown that the closer A1C levels are to the normal range, the greater the contribution of postprandial glucose to the overall glycemic status. Thus, basal insulins targeting FPG may be used in patients with higher A1C, while those with A1C closer to the normal range may require rapid-acting insulins that target postprandial glucose levels.

27
Insulin Regimens: Options• Once-daily basal
– Advantages: minimizes injections; covers FPG, but not PPG excursions– Disadvantages: requires oral agents to control PPG excursions
• Once-daily premixed– Advantages: minimizes injections; covers FPG and 1 PPG excursion– Disadvantages: requires consistent daily routine; all PPG excursions not covered
• Twice-daily premixed– Advantages: covers FPG plus 2 PPG excursions without multiple injections– Disadvantages: requires consistent daily routine
• Basal-Bolus (MDI) – Advantages: ideal regimen to approximate physiological insulin secretion; allows
for maximum flexibility in meal and activity patterns– Disadvantages: multiple injections; usually requires more frequent BG monitoring
Hirsch IB et al. Clin Diabetes. 2005;23:78–86.Gavin JR III. Diabetes Educ. 2007:33:66S-73S.
There are several options for insulin regimens in the patient with type 2 diabetes.
A once-daily basal insulin regimen minimizes injections and covers fasting plasma glucose levels, but requires oral agents (or the endogenous insulin of the patient) to cover postprandial excursions.
Once-daily premixed insulin covers fasting plasma glucose and 1 postprandial excursion, but requires a consistent daily routine with 2 meals. The second meal is required at a specific time and should have a consistent carbohydrate content. This regimen does not allow for correction of out-of-range glucose levels.
A regimen of twice-daily premixed insulin covers fasting plasma glucose and requires multiple feedings for each injection. This regimen requires a consistent daily routine, and does not allow for correction of out-of-range glucose levels.
Basal-bolus regimens allow for alteration in dose for ambient glucose levels. This is the most flexible regimen and most closely approximates physiologic insulin secretion. If the goal is flexibility and not intensive control, frequent blood glucose monitoring is not required. Some patients test their blood glucose only once or twice per day.
28
Evidence-Based Insulin Algorithms
• Basal –Treat-to-target (Riddle et al)
• Insulin glargine vs NPH added to oral agents–Treat-to-target (Hermansen et al)
• Insulin detemir vs NPH added to oral agent
• Basal versus Premixed– INITIATE (Raskin et al) and Lispro-Mixture-Glargine (Malone et al)
studies– Basal versus premixed insulin analogs
• Premixed–1-2-3 Study (Garber et al)
• Optimal dosing of biphasic insulin aspart
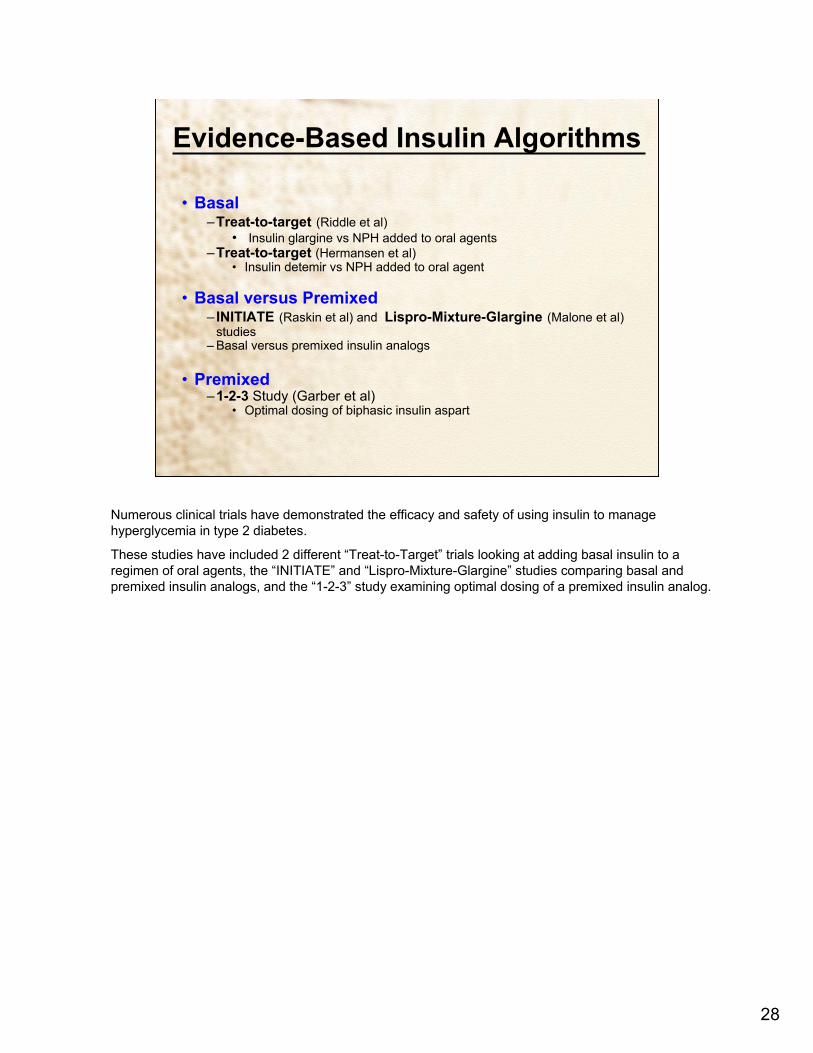
Numerous clinical trials have demonstrated the efficacy and safety of using insulin to manage hyperglycemia in type 2 diabetes.
These studies have included 2 different “Treat-to-Target” trials looking at adding basal insulin to a regimen of oral agents, the “INITIATE” and “Lispro-Mixture-Glargine” studies comparing basal and premixed insulin analogs, and the “1-2-3” study examining optimal dosing of a premixed insulin analog.

29
Study
• N = 756• Currently on stable doses of OADs • A1C >7.5% • Randomized to insulin glargine or
NPH at bedtime added to existing oral therapy x 24 weeks
• Weekly titration of insulin to target FPG ≤100 mg/dL
Treat-to-Target: Insulin Glargine vs NPH Added to Oral Therapy
NPH
Results
Glargine
A1C ≤7%
26.7% 33.2%
57.3% 58.0%
P < 0.05
A1C ≤7% without nocturnal
hypoglycemiaRiddle MC et al. Diabetes Care. 2003;26:3080–3086.
One of the “Treat-to-Target” trials compared the efficacy and hypoglycemia risks of insulin glargine versus NPH insulin added to existing oral therapy to achieve A1C less than or equal to 7%.
• This was a randomized, open-label, multicenter trial of 24 weeks duration.
• 756 Overweight men and women with type 2 diabetes and currently on stable doses of 1 or 2 oral agents but inadequately controlled (A1C >7.5%) were randomized to bedtime glargine or NPH once daily.
• The insulin dose was titrated weekly to achieve a target fasting plasma glucose of ≤100 mg/dL.
In this trial, a majority of patients in both treatment groups achieved the target A1C of ≤7% (about 60% in each group). However, as shown in the bar graph on the right, almost 25% more patients in the insulin glargine group achieved the target A1C without documented nocturnal hypoglycemia; a result that was statistically significant. The cumulative incidence of hypoglycemic events was lower with insulin glargine than with NPH.
The authors concluded that systematically titrated bedtime basal insulin added to existing oral therapy can safely achieve A1C of ≤7% in a majority of overweight patients with type 2 diabetes poorly controlled on oral agents alone, and that insulin glargine achieves this goal with significantly less nocturnal hypoglycemia.

30
Detemir
Study
• N = 476• Currently on 1 or 2 oral agents for
at least 4 months • A1C 7.5%–10.0% • Randomized to twice-daily insulin
detemir or twice-daily NPH added to existing oral therapy x 26 weeks
• Titration of insulin to targetprebreakfast/predinner PG ≤108 mg/dL
Treat-to-Target: Insulin Detemir vs NPH Added to Oral Therapy
NPH
Results
A1C ≤7.0% A1C ≤7.0%without
hypoglycemia
16%
26%
74% 70%
P = 0.008
Hermansen K et al. Diabetes Care. 2006;29:1269–1274.
A similar “Treat-to-Target” trial compared the efficacy and tolerability of insulin detemir versus NPH insulin added to existing oral therapy to achieve A1C ≤7%.
• This also was a randomized, open-label, multicenter trial.
• 476 Men and women with type 2 diabetes receiving 1 or 2 oral agents for at least 4 months but inadequately controlled (A1C 7.5%–10.0%) were randomized to twice-daily insulin detemir or NPH insulin.
• The insulin dose was titrated every 3 days to achieve target prebreakfast and predinner plasma glucose concentrations of ≤108 mg/dL.
After 26 weeks, a majority of patients in both treatment groups achieved the target A1C of ≤7% (70 to 74% of patients). As shown in the bar graph on the right, during the last 12 weeks of the trial, a significantly higher proportion of patients in the insulin detemir group (26%) achieved an A1C ≤7% without hypoglycemia, vs 16% for the NPH group. Insulin detemir was associated with a 47% lower risk for any hypoglycemic event and a 55% lower risk for nocturnal hypoglycemic events; both of these differences were statistically significant. Mean weight gain was 1.2 kg with insulin detemir versus 2.8 kg for NPH; this difference also was statistically significant.
These authors concluded that the addition of systematically titrated basal insulin to oral glucose-lowering agents can safely achieve A1C of ≤7% in a majority of patients with type 2 diabetes poorly controlled on oral agents alone and that insulin detemir achieves this goal with significantly less hypoglycemia and less weight gain than NPH insulin.

31
Raskin P et al. Diabetes Care. 2005;28:260–265.
Study• N = 233• Currently on >1000 mg/d metformin
alone or in combination with other OADs
• A1C ≥8.0% • Metformin dose optimized prior to
initiating insulin• Randomized to twice-daily BIAsp
70/30 or once-daily insulin glargine x 28 weeks
• Titration of insulin to target PG 80–110 mg/dL
INITIATE: Biphasic Insulin Aspart (BIAsp 70/30) vs Insulin Glargine
BIAsp 70/30
Results
Glargine
A1C <7% A1C ≤6.5%
42%
28%
66%
40%
P < 0.001
P < 0.05
The INITIATE trial compared twice-daily biphasic insulin aspart 70/30 with once-daily insulin glargine for patients with type 2 diabetes inadequately controlled on OADs.
• 233 Insulin-naive patients receiving >1000 mg/day of metformin alone or in combination with other oral antiabetic agents were randomized to either biphasic insulin aspart prebreakfast and predinner or insulin glargine at bedtime.
• Metformin was adjusted up to 2550 mg/d before insulin was initiated.
• Biphasic insulin aspart 70/30 was started at 5–6 units twice–daily while glargine was started at 10–12 units once daily; insulin doses were titrated to target fasting plasma glucose of 80–110 mg/dL.
After 28 weeks, as shown in the bar graph on the left, a significantly higher number of patients receiving biphasic insulin aspart achieved target A1C values recommended by the ADA than did patients receiving glargine. As shown in the bar graph on the right, results were still significant in favor of biphasic insulin aspart when using a target A1C of ≤6.5%. The overall mean A1C values were significantly lower for the biphasic insulin aspart (6.91%) than for the glargine group (7.41%). The incidence of minor hypoglycemic episodes (defined as blood glucose <56 mg/dL with or without symptoms) was greater for biphasic insulin aspart-treated patients. Weight gain also was greater for biphasic insulin aspart-treated patients.
In patients with type 2 diabetes poorly controlled on oral agents, initiating insulin with twice-daily biphasic insulin aspart 70/30 was more effective at achieving A1C targets than once-daily insulin glargine.

32
Glargine
Malone JK et al. Clin Ther. 2004;26:2034–2044.
Study
• N = 105, insulin-naive• Randomized to insulin lispro Mix75/25
twice daily plus metformin or insulin glargine plus metformin
• Prospective, crossover study• Patients received 16 weeks of each
treatment • 95 patients completed study
Lispro-Mixture-Glargine: Insulin Lispro Mix75/25 vs Insulin Glargine
Mix75/25
Results
A1C ≤7%
42%
18%
P < 0.001
• Weight gain higher with Mix75/25• Rate of hypoglycemic events slightly
higher with Mix75/25
The Lispro-Mixture-Glargine trial compared twice-daily insulin lispro mix 75/25 plus metformin with once-daily insulin glargine plus metformin for patients with type 2 diabetes.
• 105 Insulin-naive patients were randomized to either Mix75/25 twice daily plus metformin or insulin glargine once daily plus metformin in a crossover design. Patients received 16 weeks of each treatment, half received them in one order while the other half received them in the opposite order.
• There was no difference in baseline mean values for either treatment sequence group.
95 Patients completed the study. As shown in the bar graph, a significantly greater number of patients receiving Mix75/25 achieved an A1C of ≤7.0% than did glargine-treated patients (42 vs 18%-over a 2-fold difference between groups). The mean A1C values were significantly lower for the Mix75/25 (7.4%) than for the glargine group (7.8%). The incidence of nocturnal hypoglycemia was similar for the 2 treatments and the overall incidence of hypoglycemia was slightly higher for treatment with Mix75/25. Weight gain was greater for Mix75/25-treated patients (2.3 vs 1.6 kg, which was statistically significant at P = 0.006)
In conclusion, a higher proportion of patients treated with Mix75/25 plus metformin achieved the target A1C of ≤7.0%, compared with those treated with glargine plus metformin.

33
1-2-3 Study: Achieving A1C Targets with Optimal Dosing of Biphasic Insulin Aspart (BIAsp 70/30)
Garber AJ et al. Diabetes Obes Metab. 2006;8:58–66.
0
10
20
30
40
50
60
70
80
90
A1C ≤6.5%
QD
21%
52%60%
0
10
20
30
40
50
60
70
80
90
A1C <7.0%
•Results (ITT population; n = 100)
•Among completers (n = 74), by the end of the study– 88% of patients achieved A1C <7.0%– 77% of patients achieved A1C ≤6.5%
QD
QD or
BID
QD, BID, or
TID
41%
70%77%
QD or
BID
QD, BID, or
TID
The recently published 1-2-3 study enrolled patients with type 2 diabetes currently on oral therapy with or without basal insulin, and with A1C of 7.5 to 10.0%. The study assessed whether the addition and titration of biphasic insulin aspart 70/30 could enable these patients to meet glycemic targets.
• 100 Patients comprised the intention-to-treat, or ITT population
• Patients discontinued any basal insulin and added 1 predinner injection (12 units) of biphasic insulin aspart. The dose was titrated to achieve fasting blood glucose 80–110 mg/dL.
• At 15 weeks, A1C was assessed, and based on the result, patients either completed the study at 16 weeks (if A1C ≤6.5%) or continued in the study and added (and titrated) a second (prebreakfast) injection (if A1C >6.5%).
• At 31 weeks, patients were similarly assessed for A1C and either completed the study, or added (and titrated) a third biphasic insulin aspart injection.
As shown in the bar graph on the left, among the ITT population, the addition of once-daily biphasic insulin aspart enabled 41% of patients to achieve an A1C <7.0%; up to twice-daily biphasic insulinaspart enabled 70% to reach A1C <7.0%; and up to 3 doses/day resulted in 77% of patients achieving this glycemic target. The corresponding results for reaching a goal A1C of ≤6.5% is shown in the bar graph on the right. The 2 graphs are consistent.
Among the population of patients who completed the study (n = 74), by the end of the study, 88% of patients achieved A1C <7.0% and 77% of patients achieved A1C ≤6.5%.

34
Initiating Insulin: Choosing the Starting Dose
• Once-daily basal (intermediate-acting insulin or long-acting insulin analog)
– 10–20 units/injection in the morning or at bedtime
• Once-daily premix–10 units presupper
• Twice-daily premix–10 units presupper, 10 units prebreakfast
• Basal-Bolus–Individualized –Adjust dose and incorporate carbohydrate counting
Steil CF. The Art and Science of Diabetes Self-Management Education. 2006:321–355.Hirsch IB et al. Clin Diabetes. 2005;23:78–86.
Once the insulin regimen has been chosen, the clinician must decide on a starting dose. The best strategy is to start low and titrate up to avoid hypoglycemia.
A common starting dose for patients with type 2 diabetes who are initiating insulin is 0.15 units/kg per day. However, in practice, most patients will need higher doses due to insulin resistance.
For patients on a once-daily basal regimen, 10–20 units once a day is a reasonable starting dose. Those on a once-daily injection of a premixed insulin or insulin analog can start with 10 units predinner. For a twice-daily premix regimen, 10 units prebreakfast and 10 units predinner may be used as a starting dose. Basal-bolus therapy involves ≥3 injections per day. The doses will be calculated based on the meal and activity schedule of the patient. Patients on a basal-bolus regimen should be trained in insulin adjustment and carbohydrate counting by a certified diabetes educator.

35
Initiating Insulin: Titrating the Dose for Once- or Twice-Daily Regimens (Hirsch et al protocol)
+6≥180
+4140–179
+2110–139
No change80–109
–2<80Dosage Change (units)
Blood Glucose Levels (mg/dL) (last 3–7 days)
Hirsch IB et al. Clin Diabetes. 2005;23:78–86.
Adjust prebreakfast dose based on presupper value.Adjust presupper (premixed)/bedtime (basal) dose based on prebreakfast value.DO NOT increase dose if hypoglycemia (<70 mg/dL) or symptoms of hypoglycemia are present.
Once the patient has initiated insulin therapy on the starting dose, the dose should be titrated to achieve glycemic targets. This slide depicts one suggested titration schedule for use with patients on once- or twice-daily insulin regimens.
Using this schedule, patients should measure blood glucose once or twice daily depending on the regimen (before breakfast and before supper). The clinician can then adjust the dose based on the patient’s self-reported blood glucose values. Prebreakfast dosage adjustments are based on a review ofdaytime and presupper blood glucoses; presupper dosage adjustments are based on a review of postsupper and prebreakfast blood glucoses.
The dose should be titrated weekly until glycemic targets are achieved. If patients are not meeting glycemic targets after 3 to 6 months, or if recurrent hypoglycemia limits titration, then the regimen may need to be changed.

36
Initiating Insulin and Adjusting the Dose (Nathan et al protocol)
Start with once-daily basal insulin: bedtime intermediate-acting OR bedtime- or morning long-acting
Check FPG daily and increase dose, usually by 2 units every 3 days until FPG 70-130 mg/dL, or by 4 units every 3 days if FPG >180 mg/dL
AIC ≥7% after 2–3 mos?If hypoglycemia or FBG <70 mg/dL, reduce bedtime dose by ≥4 units, or 10% if dose >60 units
Continue regimen; check A1C every 3 mos
If FPG 70–130 mg/dL, check premeal and pre-hs BG; add second injection: start with 4 units; adjust by 2 units every 3 days until BG in range
Prelunch BG out of range: add rapid-acting at breakfast
AIC ≥7% after 3 mos?
Recheck premeal BG levels and add another injection if out of range. If A1C remains high, check 2-hr PPG levels and adjust preprandial rapid-acting dose
Predinner BG out of range: add NPH at breakfast or rapid-acting at lunch
Pre-hs BG out of range: add rapid-acting at dinner
Yes
No Yes
No
Nathan DM et al. Diabetes Care. 2006;29:1963–1972.
Nathan and coworkers have also suggested an algorithm for initiating and titrating insulin in type 2 diabetes.
This algorithm demonstrates both how to titrate the starting dose and how to change the insulin regimen if, despite appropriate titration, A1C levels are not at target after 2–3 months.
Insulin is initiated with a once-daily intermediate or long-acting formulation, dosed at 10 units or 0.2 unit/kg per day. The dose is then titrated up every 3 days based on fasting plasma glucose levels until fasting plasma glucose is between 70 and 130 mg/dL.
A1C is then checked after 2 to 3 months. If A1C ≥7%, and fasting plasma glucose is between 70 and 130 mg/dL, blood glucose levels are checked prelunch, predinner, and prebedtime. Depending on which of these is elevated, a second injection is added, usually a rapid-acting insulin analog at one of the mealtimes.
A1C is then rechecked after 3 months, and if it is ≥7%, the premeal blood glucose levels should be checked again, and if indicated, a third mealtime injection added. If A1C continues to be out of range, 2-hour postprandial blood glucose levels can be checked. If postprandial glucose is elevated, the dose of the corresponding mealtime rapid-acting insulin should be adjusted up.

37
Adjusting the Mealtime Dose: Carbohydrate Counting and Correction• For patients using basal-bolus (MDI) or insulin pump therapy• Allows a flexible eating schedule and tighter glycemic control • Matches short- or rapid-acting insulin to carbohydrate consumption• Insulin-to-carbohydrate ratio (ICR) individualized
– Nonobese: 1:15 → ~1 unit covers 15 g carbohydrate (or more)– Insulin-resistant: 1:5 → ~1 unit covers 5 g carbohydrate (or less)
• Mealtime insulin dose– Based on total amount of carbohydrate to be eaten
• Correction bolus– Amount of insulin needed to bring BG back into target range when premeal BG
too high or too low– Added to mealtime insulin dose– Determined in part by insulin sensitivity factor (ISF): eg, 1 unit of insulin for every
50 mg/dL premeal BG is above target
Tomky DM, Kulkarni K. The Art and Science of Diabetes Self-Management Education. 2006:371–398.Herbst KL, Hirsch IB. Clin Diabetes. 2002;20:11–17.
Carbohydrate counting is a valuable skill for patients on basal-bolus multiple daily injection regimens. It allows a more flexible eating schedule as well as tighter glycemic control, enabling a closer approximation of the physiologic secretion of insulin that occurs with meals.
Carbohydrate counting requires patients to check their blood glucose before meals and adjust the mealtime insulin dose based on both the glucose level and the carbohydrate content of the anticipated meal.
The insulin-to-carbohydrate ratio, or ICR, is individualized, and is determined by the patient’s sensitivity to insulin. For example, 1 unit of a rapid-acting analog can be given for every 10 to 15 grams of carbohydrate to be consumed. Subsequently, the ICR can be titrated to optimize control of both postprandial glucose of the present meal and the preprandial glucose of the next meal.
An obese individual will commonly need a ratio of about 1:5 (1 unit of a rapid-acting insulin analog for every 5 grams of carbohydrates to be consumed) and sometimes may need as much as 1 unit of insulin per gram of carbohydrate. A thin, insulin-sensitive individual may require a ratio of as little as 1:20. During titration, blood glucose should be checked 2 hours after the meal to determine if the insulin dose is correct. Postprandial blood glucose should be within 30 to 40 points of the preprandial value when the ICR is optimal.
If premeal blood glucose is high, a correction bolus of insulin may be given in addition to the normal prandial insulin dose. The extra insulin will vary according to a patient’s sensitivity to insulin. Patients may require an additional 1 to 2 units for every 50 mg/dL the premeal glucose level is above the target. Alternatively, it is often possible to estimate how much 1 unit of a rapid-acting insulin analog will decrease the plasma glucose over 3 hours, using the formula 1500 divided by the total daily insulin dose.
38
Example• Patient JR on MDI therapy has an ICR of 1:8
– 1 unit of insulin for every 8 g of carbohydrate consumed• Estimated carbohydrate content of dinner: 80 g• JR’s predinner BG check: 270 mg/dL (target: 120 mg/dL)
– ISF is 1 unit of insulin for every 50 mg/dL above target • How much rapid-acting insulin should JR administer?
Response• 80 g x 1 unit/8 g carbohydrate → 10 units insulin to cover dinner• Predinner BG check: 270 - 120 = 150 mg/dL above target → 3 units
correction bolus• JR should administer 10 + 3 = 13 units rapid-acting insulin at dinner
Adjusting the Mealtime Dose: Carbohydrate Counting and Correction
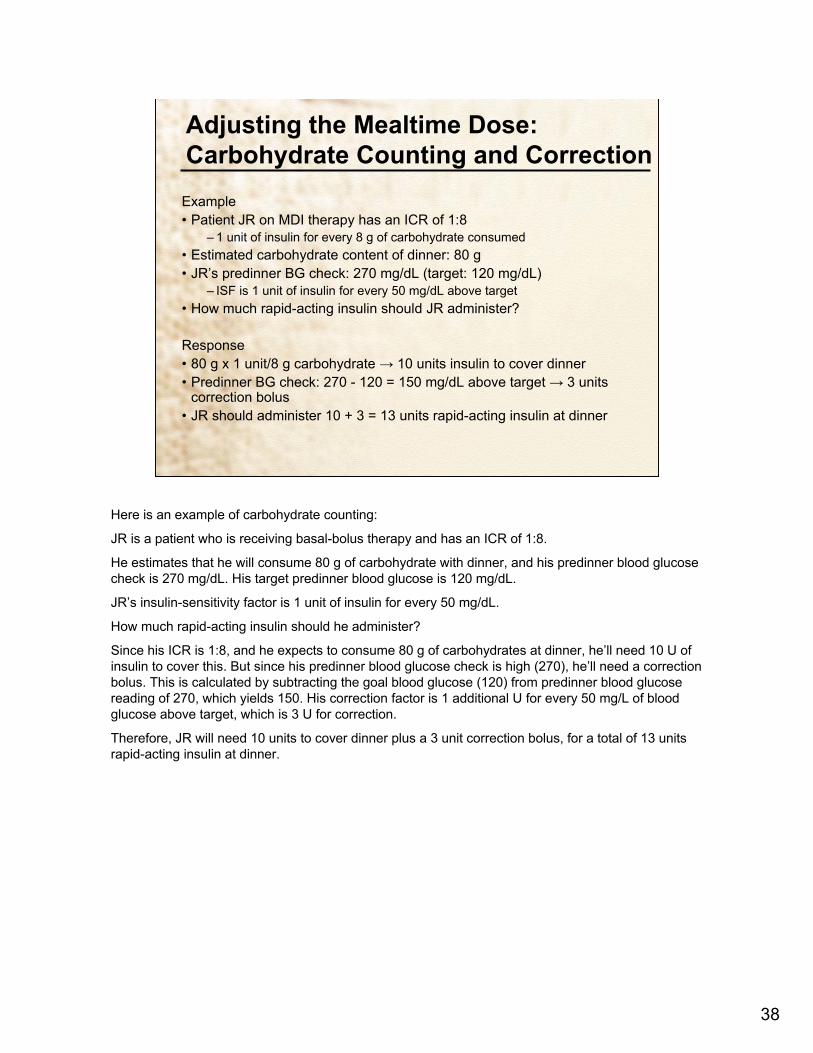
Here is an example of carbohydrate counting:
JR is a patient who is receiving basal-bolus therapy and has an ICR of 1:8.
He estimates that he will consume 80 g of carbohydrate with dinner, and his predinner blood glucose check is 270 mg/dL. His target predinner blood glucose is 120 mg/dL.
JR’s insulin-sensitivity factor is 1 unit of insulin for every 50 mg/dL.
How much rapid-acting insulin should he administer?
Since his ICR is 1:8, and he expects to consume 80 g of carbohydrates at dinner, he’ll need 10 U of insulin to cover this. But since his predinner blood glucose check is high (270), he’ll need a correction bolus. This is calculated by subtracting the goal blood glucose (120) from predinner blood glucose reading of 270, which yields 150. His correction factor is 1 additional U for every 50 mg/L of blood glucose above target, which is 3 U for correction.
Therefore, JR will need 10 units to cover dinner plus a 3 unit correction bolus, for a total of 13 units rapid-acting insulin at dinner.

39
Effects of Exercise on Glycemia
Benefits• Lowers BG concentrations during and after exercise• Lowers basal and postprandial insulin concentrations • Improves insulin sensitivity• Improves weight loss and reduction in body fat
Risks• Exercise-induced hypoglycemia• Hyperglycemia after vigorous exercise
Guidelines• Monitoring BG at start and end of exercise helps determine if insulin dose and/or carbohydrate
intake should be adjusted• May need to reduce rapid-acting insulin dose administered prior to or within 1 hour after exercise• If activity is performed more than 2 hours after a meal, a snack may be eaten 15 minutes prior to
beginning exercise • Replenish fluids during exercise to avoid dehydration, especially if physical activity results in
excessive perspiration or lasts more than 1 hour
Steppel JH, Horton ES. Therapy for Diabetes Mellitus and Related Disorders. 2004:149-56. Mullooly CA. The Art and Science of Diabetes Self-Management Education. 2006:297–319.
Regular physical exercise is recommended as a key component of a treatment program for type 2 diabetes, because exercise has specific effects on glycemia.
Blood glucose concentrations are lowered both during and after engaging in exercise. Blood glucose lowering depends on the starting blood glucose, the presence of insulin, and the type of activity. Both basal and postprandial insulin concentrations are lowered with regular exercise, and insulin sensitivity is increased. Exercise increases energy expenditures, thus contributing to weight loss, along with reduction in body fat and preservation of lean body mass.
The risks of exercise include hypoglycemia and hyperglycemia. Patients taking certain oral antidiabetic drugs or insulin are at risk for exercise-induced hypoglycemia.
Hyperglycemia may occur after vigorous exercise, as glucose is released into the blood to keep the supply available. Usually, this is a temporary response, and the blood glucose drops within an hour. Rarely, hyperglycemia may occur due to a combination of insulin resistance and inadequate insulin secretion. Extreme hyperglycemia with severe dehydration can result in hyperosmolar hyperglycemia.
Other risks include exacerbation of complications.
Certain guidelines need to be followed when implementing exercise programs.
• All patients should be evaluated before starting an exercise program, and exercise recommendations should be adjusted based on findings (for example, weight lifting is not indicated in patients with proliferative diabetic retinopathy).
• To help determine whether insulin dose or carbohydrate intake should be adjusted during a period of exercise, patients may monitor blood glucose at the start and end of an activity to determine the change in blood glucose that occurs.
• Based on blood glucose monitoring, patients may find that they need to reduce a preexercise dose of short- or rapid-acting insulin by 30 to 50% to keep blood glucose from dropping below the target range. A dose of short- or rapid-acting insulin administered within an hour after the activity may also need to be reduced.
• If the activity is performed more than 2 hours after the last meal or snack, a snack may be eaten within 15 minutes prior to the activity.
• Fluids should be replenished during exercise to avoid dehydration. This is especially important if the physical activity results in excessive perspiration or lasts more than 1 hour.

40
Psychological Insulin Resistance and Clinical Inertia: Patients
• Nearly one third of patients not taking insulin would be unwilling to start even if it were prescribed
• Negative perceptions of insulin include:
Sense of personal failure, self-blameOnce initiated, insulin therapy will be permanentDiabetes has become more seriousAnticipated pain, fear of injectionFear of hypoglycemiaFear of restrictions and demands associated with insulinFear of weight gain
Polonsky WH et al. Diabetes Care. 2005;28:2543–2545.Peragallo-Dittko V. Diabetes Educ. 2007;33:60S–65S.Peyrot M et al. Diabetes Care. 2005;28:2673–2679.Peyrot M et al. Diabetologia. 2003;46(Suppl 2):A89.
One of the key challenges of initiating insulin therapy for type 2 diabetes is recognizing and responding to psychological insulin resistance. Psychological insulin resistance is reluctance on the part of both patients and providers to start insulin therapy when it would be beneficial.
In a recent survey of patients with type 2 diabetes, among those not currently taking insulin, 28.2%-nearly one-third of respondents-reported being unwilling to take insulin even if it were prescribed. Another study showed that more than half of patients (57%) with type 2 diabetes not currently on insulin were worried about starting insulin therapy. Moreover, 48% of those patients believed that starting insulin would mean that they had not correctly followed treatment recommendations.
Patients resist starting insulin therapy for a number of reasons, including a sense of personal failure regarding management of their diabetes, beliefs that insulin therapy will become permanent or that it indicates a worsening of their disease, and fears of injection, weight gain, and/or hypoglycemia.

41
Psychological Insulin Resistance: Insulin and Weight Gain
Modest weight gain is a consequence of insulin therapy
• Average weight gain of ~2–4 kg after starting insulin• Due largely to improved metabolism of glucose: correction of glycemia
and reduction in glycosuria
Guidelines
• Educators should be truthful with patients about the potential for weight gain
• Establishing a meal and exercise plan can help minimize weight gain• Patients should be reminded that exercise promotes weight loss and
also improves insulin sensitivity (↓ insulin resistance) by promoting glucose uptake into muscle
Nathan DN, et al. Diabetes Care. 2006;29:1963–1972.Kazlauskaite R, Fogelfeld L. 2003. Dis Mon. 49:377–420. Peragallo-Dittko V. Diabetes Educ. 2007;33:60S–65S.
Modest weight gain is a consequence of insulin therapy. On average, insulin is associated with a weight gain of about 2 to 4 kg, due largely to the improved metabolism of glucose: insulin corrects the patient’s glycemia and reduces glycosuria. Weight gain may increase insulin resistance.
Providers and diabetes educators should address patients’ concerns by being truthful about the potential for weight gain when starting insulin.
Establishing a meal and exercise plan may help to minimize weight gain. Patients may also be reminded that exercise not only promotes weight loss, but also improves insulin sensitivity (thereby reducing insulin resistance), by promoting glucose uptake into muscle.

42
Psychological Insulin Resistance and Clinical Inertia: Providers• Over 50% of nurses and primary care physicians report delaying
insulin therapy until absolutely necessary• Delaying insulin therapy is more common among US physicians
than physicians in other countries• Specialists are less likely to delay initiating insulin
– Delay is less likely when insulin is viewed as more efficacious• Health care providers’ negative perceptions of insulin
– Extra time will be required to manage complex treatment regimens– Extra training, support, and resources will be required– Fear of patient’s hypoglycemia, weight gain– Fear of patient’s anger and alienation
Polonsky WH, Jackson RA. Clin Diabetes. 2004;22:147–150.Peragallo-Dittko V. Diabetes Educ. 2007;33:60S–65S.Peyrot M et al. Diabetes Care. 2005;28:2673–2679.Phillips P. Rev. Diabet Stud. 2005;2:35–39.
Studies have documented that health care providers, like patients, also demonstrate psychological insulin resistance.
Analyses from the Diabetes Attitudes, Wishes, and Needs, or DAWN study, showed that among diabetes care providers, over 50% of primary care physicians and nurses believe that insulin should be delayed until absolutely necessary. Delay of insulin therapy was found to be significantly less among specialists and opinion leaders who view insulin as more efficacious.
Health care providers’ negative attitudes about insulin take several forms. These include concerns about complex treatment regimens too difficult to manage in a busy primary care practice; fears that patients will be annoyed and feel alienated when insulin is introduced; a lack of resources needed for insulin education; and concerns about patients’ possible weight gain or hypoglycemia.
As a result of these concerns, health care providers may reflect and amplify patients’ own fears about starting insulin, resulting in an unspoken collusion between patient and provider to postpone insulin therapy as long as possible. This occurs, for example, if a clinician uses insulin as a potential punishment, threatening to prescribe it if a patient does not lose weight or otherwise adhere to a treatment program.
Replacing such negative attitudes and perceptions on the part of clinicians with a more positive and accepting view of insulin is an essential step toward achieving more effective diabetes management.

43
Overcoming Psychological Insulin Resistance• Education
– Stress progressive nature of type 2 diabetes and beta-cell decline– Introduce the concept of insulin early
• Describe insulin as one step in a management process, not a last resort
– Explain that insulin regimen will be matched to needs and lifestyle– Teach management of hypoglycemia and weight gain– Introduce a variety of insulin delivery devices
• May reduce trauma and anxiety– Explain advantages of insulin analogs
• Increase flexibility in mealtimes
• Diabetes-care team approach–Including nurses, dietitians, and diabetes educators
Funnell MM et al. Diabetes Educ. 2004;30:274–280.Peragallo-Dittko V. Diabetes Educ. 2007;33:60S–65S.Korytkowski M. Int J Obes Relat Metab Disord. 2002;26(Suppl 3):S18–S24.Ratner R. Pract Diabetol. 2004;23:14–24.
Patient education is a key factor in overcoming psychological insulin resistance. Patients should understand the progressive nature of type 2 diabetes and the role of insulin, including insulin resistance and progressive beta-cell decline. Insulin is a natural hormone that is diminished in diabetes. Its use should be described as one step in a treatment process, not as a last resort, nor as a threat or punishment.
The emphasis of treatment should be glycemic control and not insulin avoidance or alternatives to insulin. Indeed, introducing insulin at the time of diagnosis might reduce some of the preexisting myths of the process. Some clinicians have advocated patient self-injection with saline soon after diagnosis to mitigate the fear associated with future use of insulin. To reduce the fear of potential adverse reactions like hypoglycemia and weight gain, patients can be taught management strategies for prevention and treatment.
Presenting the individual with options for insulin delivery systems as well as dosing options may make the idea of insulin therapy more palatable and show that treatment can be tailored to match lifestyle concerns. Many individuals report that the use of insulin pens or dosers makes them more comfortable injecting in public. They describe them as easier to learn and promote patient confidence in their ability to accurately prepare a dose. In addition, current needles are thinner and smaller, assuring minimal discomfort from the injection.
The use of a diabetes-care team approach—including physicians, nurses, dietitians, and diabetes educators—helps to ensure that patients are informed and educated about their disease and its management, which is key to overcoming psychological insulin resistance.

44
Hypoglycemia • Occurs less frequently in type 2 than in type 1 diabetes• Causes
• Errors in insulin dosing• Missed or delayed meals• Unplanned physical activity• Illness
• Prevention• Adjusting insulin regimen based on
• Past experience • Mealtimes• Expected physical activity
• Use rapid-acting insulin analogs • Adjust dose with each meal based on carbohydrate counting• Pharmacokinetic profile: decline back to baseline quickly, so minimize
postprandial hypoglycemia
Steil CF. The Art and Science of Diabetes Self-Management Education. 2006:321–355.Cryer PE et al. Diabetes Care. 2003;26:1902–1912.
Hypoglycemia is a risk associated with insulin therapy, though it occurs less frequently in type 2 than in type 1 diabetes.
Hypoglycemia is best defined based on symptoms. Mild cases are identified as those that cause sweating, trembling, light-headedness, and lack of coordination. Severe cases are defined as those in which the patient is unable to self-treat due to mental confusion, lethargy, or unconsciousness; in these cases, others must provide treatment.
Glycemic thresholds for the onset of symptoms of hypoglycemia differ among individuals; however, a lower blood glucose limit of 70 mg/dL has been suggested.
Hypoglycemia can be caused by errors in insulin dosing, missed or delayed meals, unplanned physical activity, or illness. The adrenergic symptoms of low blood sugar may be absent due to concomitant medications (for example, beta-blockers mask the symptoms of hypoglycemia) or the condition of hypoglycemic unawareness.
Hypoglycemia can often be prevented by adjusting insulin regimens based on past experience, expected mealtimes and sizes, and expected physical activity. Ideally, insulin regimens should be as flexible as possible, enabling patients to adjust doses to meal size and schedule changes.
Using rapid-acting insulin analogs helps to allow for such flexibility. Their rapid onset of action (5 to 15 min) means patients do not have to wait 30 minutes after injecting before they begin eating. The rapid decline back to baseline levels helps to avoid postprandial hypoglycemia that may be associated with regular insulin.
45
• Treatment: “Rule of 15”• 15 g of oral carbohydrate, then retest blood glucose in 15 minutes
• Fast-acting carbohydrate – 15 g • ½ cup juice or soda• 1 cup low fat milk • 1 tbsp honey or jam
• Follow with meal or snack
• If not able to swallow: glucagon followedby liquid carbohydrates as soon as possible
• Severe or prolonged hypoglycemia may require intravenous glucoseand professional assistance
Steil CF. The Art and Science of Diabetes Self-Management Education. 2006:321–355.Cryer PE et al. Diabetes Care. 2003;26:1902–1912.
Hypoglycemia
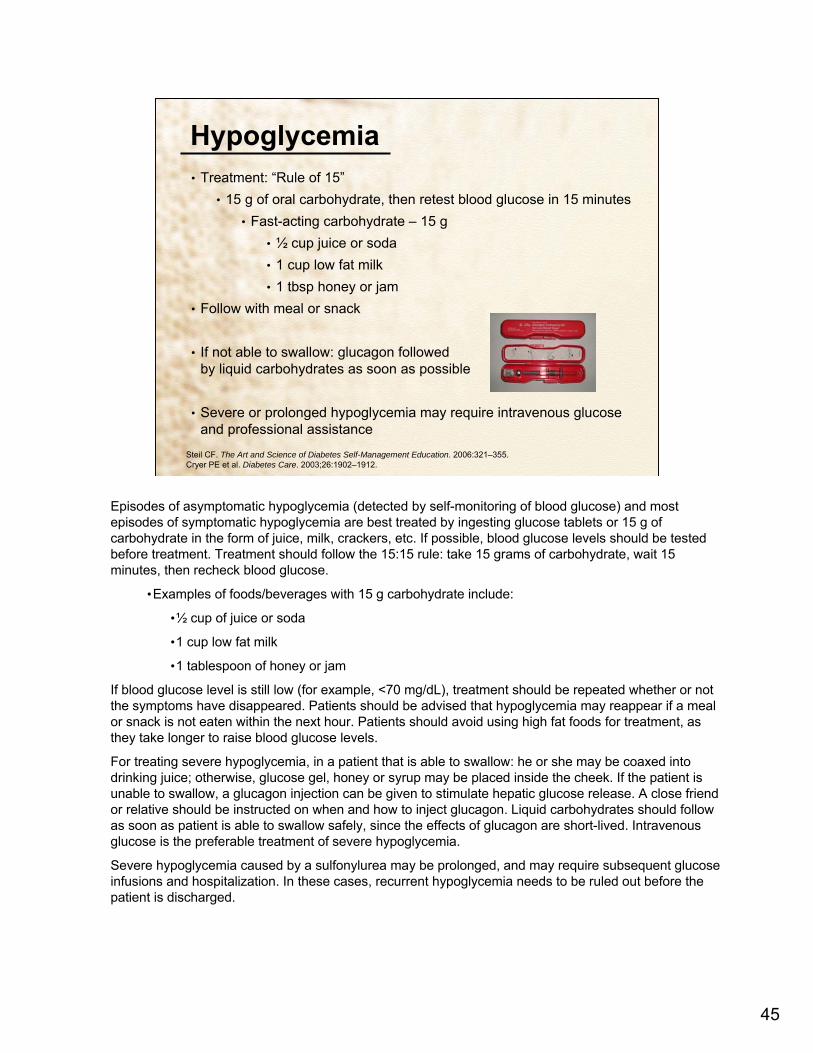
Episodes of asymptomatic hypoglycemia (detected by self-monitoring of blood glucose) and most episodes of symptomatic hypoglycemia are best treated by ingesting glucose tablets or 15 g of carbohydrate in the form of juice, milk, crackers, etc. If possible, blood glucose levels should be tested before treatment. Treatment should follow the 15:15 rule: take 15 grams of carbohydrate, wait 15 minutes, then recheck blood glucose.
•Examples of foods/beverages with 15 g carbohydrate include:
•½ cup of juice or soda
•1 cup low fat milk
•1 tablespoon of honey or jam
If blood glucose level is still low (for example, <70 mg/dL), treatment should be repeated whether or not the symptoms have disappeared. Patients should be advised that hypoglycemia may reappear if a meal or snack is not eaten within the next hour. Patients should avoid using high fat foods for treatment, as they take longer to raise blood glucose levels.
For treating severe hypoglycemia, in a patient that is able to swallow: he or she may be coaxed into drinking juice; otherwise, glucose gel, honey or syrup may be placed inside the cheek. If the patient is unable to swallow, a glucagon injection can be given to stimulate hepatic glucose release. A close friend or relative should be instructed on when and how to inject glucagon. Liquid carbohydrates should follow as soon as patient is able to swallow safely, since the effects of glucagon are short-lived. Intravenous glucose is the preferable treatment of severe hypoglycemia.
Severe hypoglycemia caused by a sulfonylurea may be prolonged, and may require subsequent glucose infusions and hospitalization. In these cases, recurrent hypoglycemia needs to be ruled out before the patient is discharged.

46
Initiating Insulin Therapy:Case #1
• AM: 46-year-old African American woman diagnosed with type 2 diabetes 6 years ago
– Reports fatigue x 1 month• Current medications: metformin 1000 mg BID; glyburide 10 mg BID • No polydipsia, polyuria or weight changes; no changes in vision; no
numbness or burning in extremities• Works full-time; 60–90 minute commute each way• Mealtimes and BG checks erratic; dinner is always largest meal• Reluctant to start insulin therapy due to fear of injections• Body mass index: 27 kg/m2
• Labs– Current A1C: 9.0% – Previous A1C (6 months ago): 8.8%– Last fasting BG 170 mg/dL (3 days ago)
Let’s discuss a case in which insulin therapy is initiated in a patient with inadequate glycemic control on oral agents.
AM is a 46-year-old African American woman with type 2 diabetes that was diagnosed 6 years ago. She reports to her physician complaining of fatigue for the last month. She has no symptoms of hyperglycemia, and has no signs or history of retinopathy or neuropathy. Her current medications are metformin 1000 mg twice daily and glyburide 10 mg twice daily. She checks her blood glucose at mealtimes and erratically at other times. Dinner is her largest meal of the day. AM expresses reluctance about starting insulin because she is afraid of injections. Her A1C is 9% and last fasting blood glucose was 170 mg/dL.

47
• What are AM’s BG goals?– Fasting BG: 90–130 mg/dL– PPG: 140–180 mg/dL
• What management options might help AM achieve glycemic targets?
– Add a third oral agent– Add once-daily basal insulin and continue oral agents– Start premixed insulin analog once per day at supper
and discontinue oral agents– Begin twice-daily premixed insulin analog and
discontinue oral agents
Initiating Insulin Therapy:Case #1
The goal blood glucose levels for AM are consistent with ADA guidelines for fasting and postprandial glucose targets.
There are a few treatment options that might help AM get closer to her targets. One of these is adding a third oral agent, an incretin mimetic, or a once-daily basal insulin to her regimen of oral agents.
Another option is initiating a regimen of premixed insulin once per day at supper, since this is AM’s largest meal. However, this would require her dinner to occur at a regular time every day and to have a consistent carbohydrate content. This might not be compatible with AM’s lifestyle.
A third option is to initiate a twice-daily premixed insulin regimen, but again, this would require consistent mealtimes and carbohydrate contents of meals, and may not suit AM’s needs.
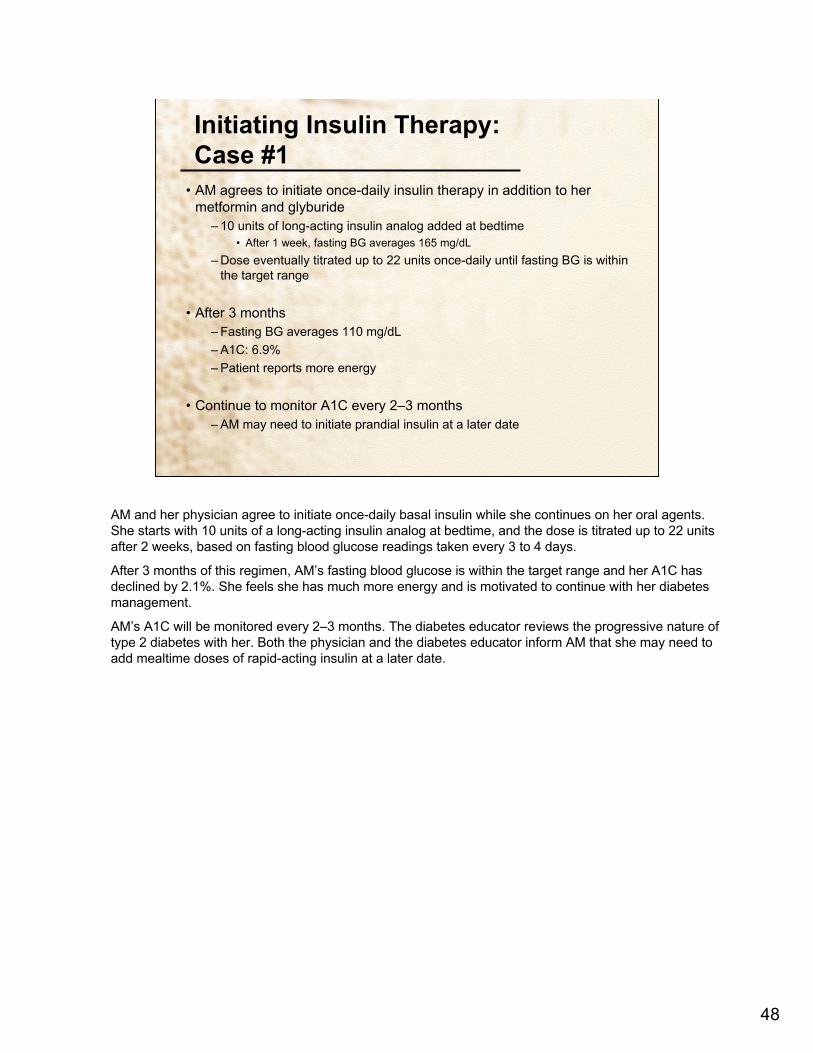
48
• AM agrees to initiate once-daily insulin therapy in addition to her metformin and glyburide
– 10 units of long-acting insulin analog added at bedtime• After 1 week, fasting BG averages 165 mg/dL
– Dose eventually titrated up to 22 units once-daily until fasting BG is within the target range
• After 3 months– Fasting BG averages 110 mg/dL– A1C: 6.9%– Patient reports more energy
• Continue to monitor A1C every 2–3 months– AM may need to initiate prandial insulin at a later date
Initiating Insulin Therapy:Case #1
AM and her physician agree to initiate once-daily basal insulin while she continues on her oral agents. She starts with 10 units of a long-acting insulin analog at bedtime, and the dose is titrated up to 22 units after 2 weeks, based on fasting blood glucose readings taken every 3 to 4 days.
After 3 months of this regimen, AM’s fasting blood glucose is within the target range and her A1C has declined by 2.1%. She feels she has much more energy and is motivated to continue with her diabetes management.
AM’s A1C will be monitored every 2–3 months. The diabetes educator reviews the progressive nature of type 2 diabetes with her. Both the physician and the diabetes educator inform AM that she may need to add mealtime doses of rapid-acting insulin at a later date.
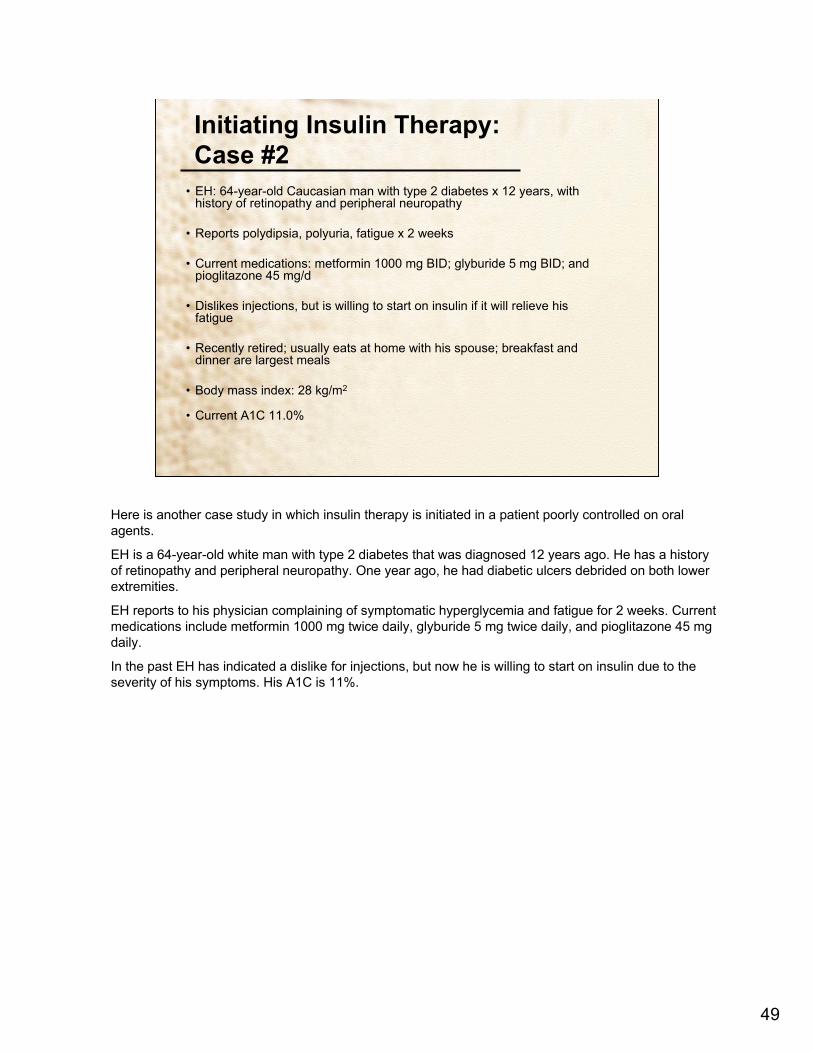
49
• EH: 64-year-old Caucasian man with type 2 diabetes x 12 years, with history of retinopathy and peripheral neuropathy
• Reports polydipsia, polyuria, fatigue x 2 weeks
• Current medications: metformin 1000 mg BID; glyburide 5 mg BID; and pioglitazone 45 mg/d
• Dislikes injections, but is willing to start on insulin if it will relieve his fatigue
• Recently retired; usually eats at home with his spouse; breakfast and dinner are largest meals
• Body mass index: 28 kg/m2
• Current A1C 11.0%
Initiating Insulin Therapy:Case #2
Here is another case study in which insulin therapy is initiated in a patient poorly controlled on oral agents.
EH is a 64-year-old white man with type 2 diabetes that was diagnosed 12 years ago. He has a history of retinopathy and peripheral neuropathy. One year ago, he had diabetic ulcers debrided on both lower extremities.
EH reports to his physician complaining of symptomatic hyperglycemia and fatigue for 2 weeks. Current medications include metformin 1000 mg twice daily, glyburide 5 mg twice daily, and pioglitazone 45 mg daily.
In the past EH has indicated a dislike for injections, but now he is willing to start on insulin due to the severity of his symptoms. His A1C is 11%.

50
BG log from previous week
260
*
*
344
*
*
353
2 hrs Post-breakfast (mg/dL)
366
*
330
*
*
301
*
2 hrs Post-dinner (mg/dL)
220Sunday
201Saturday
*Friday
195Thursday
212Wednesday
210Tuesday
192Monday
FBG(mg/dL)Day
* BG not checked.
Initiating Insulin Therapy:Case #2
This slide shows EH’s blood glucose readings from his log for the previous week. As you can see, his fasting blood glucose levels average around 200 mg/dL and postprandial levels average 350 mg/dL.
What is an appropriate management strategy for EH?

51
• EH has uncontrolled and symptomatic hyperglycemia on 3 oral agents
– Suggests beta-cell failure
• Insulin therapy is clearly indicated in this patient who has already experienced microvascular complications
– Earlier initiation of insulin might have slowed the progression to these complications
• Which insulin regimen?– Once-daily basal or premix– Twice-daily premix– Basal-bolus (MDI)
Initiating Insulin Therapy:Case #2
Clearly, EH has uncontrolled and symptomatic hyperglycemia on 3 oral agents, which suggests beta-cell failure and insulin deficiency. Exogenous insulin is clearly required. Earlier initiation of insulin might have delayed or prevented the progression of EH’s microvascular complications.
Which insulin regimen is most appropriate for this patient?

52
• Twice-daily premixed insulin analog selected– Initial dose: 10 units prebreakfast, 10 units predinner– Titrated up to 30 units prebreakfast, 20 units predinner
• Results after 3 weeks
211
190
*
*
2 hrs Post-breakfast (mg/dL)
120
142
140
Before Dinner(mg/dL)
*
210
196
*
2 hrs Post-dinner (mg/dL)
145
*
*
151
Bedtime (mg/dL)
130Monday
132Sunday
127Saturday
141Friday
Before Breakfast(mg/dL)Day
• After 3 months, A1C is 9.0%
• Next steps?
* BG not checked.
Initiating Insulin Therapy:Case #2
In a discussion with his physician, EH chose a twice-daily premix regimen. A basal-bolus regimen was also an option, but EH preferred to limit his injections to 2 per day. A twice-daily premix regimen allows tighter glycemic control than a once-daily injection of basal insulin while limiting the number of injections, but it requires more frequent blood glucose monitoring.
EH begins on a dose of 10 units prebreakfast and 10 units predinner, which is titrated up to 30 units prebreakfast and 20 units predinner based on fasting and postprandial blood glucose readings phoned in to the physician.
EH’s fasting, postprandial, and bedtime blood glucose readings after 3 weeks of insulin therapy are shown on this slide. Fasting values average 130 mg/dL and postprandial values average 200 mg/dL.
After 3 months, A1C is 9.0%, which is a nice 2% decline, but still not at target.
What are the next steps for managing EH’s hyperglycemia?
53
Changing the Insulin Regimen:Case #2 (continued)
• EH has now had an improvement in his A1C, but is not yet at target
• With his current insulin regimen, he reports having awakened with symptoms of hypoglycemia twice in the last week
As we continue with the case of EH, we will examine how an insulin regimen can be changed to optimize glycemic control.
To summarize to this point, EH presents to his physician with an A1C of 9.0%. His current regimen is twice-daily premixed insulin analog—30 units prebreakfast and 20 units predinner. He reports having awakened with symptoms of hypoglycemia twice during the previous week.

54
EH BG log from last week
Small lunch; skipped 2nd
shot
Woke up; ate snack
Woke up; ate snack
Comment
215
320
220
*
210
239
*
2 hrs Post-dinner (mg/dL)
*
*
55
*
57
*
*
3 AM(mg/dL)
153
60
140
172
139
110
155
Before Dinner(mg/dL)
200Thursday
180Wednesday
177Tuesday
195Monday
200Sunday
175Saturday
190Friday
Before Breakfast(mg/dL)Day
* BG not checked.
Changing the Insulin Regimen:Case #2
EH’s blood glucose log from the previous week is shown.
Fasting values average 180 mg/dL, postprandial values average 220 mg/dL and EH has gained 10 lbs.
EH was asked to make a note in his log if he experienced hypoglycemic symptoms, skipped a meal or an insulin dose, or engaged in more than usual activity. Such information is extremely valuable for interpreting out-of-range BG readings, and helps the patient to see the connection between his or her BG level and events.

55
• In a discussion, EH explained that he ate a smaller than usual lunch on Wednesday, and then stayed outside for several hours playing with his grandchildren. He then skipped his predinnerinsulin dose because his BG was low.
• On Sunday night (BG 55 mg/dL) and Tuesday night (BG 57 mg/dL), EH awoke with symptoms of hypoglycemia, for which he ate a snack.
• He agreed to transition to an MDI regimen since he wanted more flexibility in his mealtimes and sizes, and better glycemic control.
Changing the Insulin Regimen:Case #2
On probing, EH revealed that he ate a smaller than usual lunch on Wednesday, and then was physically active outside for several hours, playing with his grandchildren. He then skipped his dinner insulin dose because his predinner blood glucose was low.
EH agreed to transition to a basal-bolus insulin regimen since he needed more flexibility in his mealtimes and sizes and better glycemic control.

56
• Initial basal-bolus (MDI) regimen: – Long-acting insulin analog: 20 units prebreakfast– Rapid-acting insulin analog: 8 units breakfast; 3 units lunch, 9 units
dinner
• Results after 4 days
130
139
177
150
Before lunch (mg/dL)
*
215
235
*
2 hrs Post-dinner (mg/dL)
170
166
162
160
Bedtime (mg/dL)
172
181
140
190
Before Dinner(mg/dL)
195Monday
190Sunday
175Saturday
180Friday
Before Breakfast(mg/dL)Day
Changing the Insulin Regimen:Case #2
* BG not checked.
EH started on the following regimen:
• Long-acting insulin analog—20 units prebreakfast
• Rapid-acting insulin analog—8 units at breakfast, 3 units at lunch, and 9 units at dinner—to accommodate his preference for a large breakfast and a large dinner
EH’s blood glucose log for the previous 4 days is shown on this slide.

57
• Fasting BG averaging 180 mg/dL– Long-acting insulin analog changed to 16 units taken at bedtime, and then titrated
up to achieve fasting PG in the target range (90–130 mg/dL).
• PPGs were sometimes within the target range, but not consistently (>200 mg/dL on 3 occasions)
– EH learned to adjust each mealtime insulin dose using carbohydrate counting• His ICR is 1:8. • Example: He estimates he will consume 64 g of carbohydrates at lunch, so
he will need approximately 8 units insulin.• For each mealtime insulin dose, he estimates his carbohydrate intake, and
calculates his insulin dose using his ICR.
• After several weeks, EH finds he likes the flexibility a basal-bolus regimen affords him, and is pleased with the better glycemic control reflected in his BG log.
– Fasting BG averaging 115 mg/dL– 2-hr PPG averages 140 mg/dL
• After 3 months, A1C = 6.6%
Changing the Insulin Regimen:Case #2
So over the previous 4 days, his fasting values averaged 180 mg/dL, suggesting better control is needed during the night. Therefore, the basal insulin component was reduced by 20% (to 16 units) and taken at bedtime rather than prebreakfast. It was then titrated up to achieve FPG <130 mg/dL. His postprandial glucose values were sometimes within the target range, but not consistently. EH had postprandial glucose values >200 mg/dL on 3 occasions.
To address these out-of-range values, EH learned to adjust each meal-time insulin dose using carbohydrate counting. He uses an ICR of 1:8, which was determined in consultation with his diabetes educator. For example, if he estimates that he will consume 64 g of carbohydrate at lunch, he will need 8 units of insulin (64g divided by 8g/U = 8 U). For each mealtime insulin dose, EH estimates his carbohydrate intake and calculates his does of rapid-acting insulin.
After several weeks, EH is pleased with the flexibility and improved glycemic control he has using a basal-bolus multiple daily injection regimen. His fasting and postprandial blood glucose levels are within his target ranges, and after 3 months his A1C has declined an additional 2.4%.

58
Summary• The prevalence of type 2 diabetes in the United States has increased
markedly over the past decade, and a large proportion of patients are not meeting glycemic targets on current treatment regimens.
• Insulin treatment for type 2 diabetes has been shown to enable patients to achieve and maintain glycemic targets.
• The goal of initiating insulin is to achieve glycemic control with minimal risk of hypoglycemia; the regimen chosen should be matched to the patient’s needs and capabilities.
• Patients can achieve maximum flexibility and tight glycemic control with a basal-bolus (MDI) regimen, using a rapid-acting insulin analog for mealtime coverage and a long-acting insulin analog for basal coverage.
In summary,
• The prevalence of type 2 diabetes in the United States has increased markedly over the past decade, and a large proportion of patients are not meeting glycemic targets on current treatment regimens.
• Insulin treatment for type 2 diabetes has been shown to enable patients to achieve and maintain glycemic targets.
• The goal of initiating insulin is to achieve glycemic control with minimal risk of hypoglycemia; the regimen chosen should be matched to the patient’s needs and capabilities.
• Patients can achieve maximum flexibility and tight glycemic control with a basal-bolus multiple daily injection regimen, using a rapid-acting insulin analog for mealtime coverage and a long-acting insulin analog for basal coverage.