inland transport co emissions- situation and status in thailand
TRANSCRIPT

Inland Transport CO2 Emissions-
Situation and Status in Thailand
Malee Uabharadorn, PhDOffice of Transport and Traffic Policy and Panning
Ministry of Transport
23 September 2013
UNESCAP Bangkok, Thailand
Office of Transport and Traffic Policy and Planning: OTP, Ministry of Transport, THAILAND

������������� ��������
Green Economy ����� �����
- ����"#$��%�'�������%(��
- �����)���*�����
Thailand NAMA Development
Green Economy with Energy Sector
Fuel Substitution in Transportation
Environmental Sustainable Transportation
Source: Sirindhorn International Institute of Technology (SIIT)

NAMAs under UNFCCC
(Unilateral NAMAs)
Domestic NAMAs
Internationally
Supported NAMAs
• Two kinds of NAMAs have been defined under UNFCCC:
Domestic means (unilateral NAMAs) and Internationally supported
to cover NAMA costs (supported NAMAs).
• A third option would credit emission reductions and make
them tradable on the carbon market (credited NAMAs), which is
not clear today.
Source: Sirindhorn International Institute of Technology (SIIT)

Thailand NAMAs is the Climate Change Policy Management which clarify on Climate Change and National
Development Strategies
NAMAs should be clearly focusing on the
Measured, Reported, and Verified (MRV)
Source: Sirindhorn International Institute of Technology (SIIT)

Thailand’s NAMAs is not the new GHFs…..but
� Currently, Thailand has proposed
regulations/standards on energy efficiency and 25% targeted in Alternative Energy Development Plan (AEDP). These could be NAMAs.
� Feed-in Tariff (FiTs) in Thailand since 2007 is
policy instrument to promote RE, and can be a part of NAMAs.
� Policy-based Instrument will be a part of
Thailand’s NAMAs; ….Carbon Tax Collection
Source: Sirindhorn International Institute of Technology (SIIT)

Thailand NAMAs is supporting to build up;1. The private co-investment in low-carbon development.2. To create the new investment on Renewable Energy(RE) and Efficient use of Energy (EE).3. Thailand NAMAs can apply as the multi-sector strategy by importing the Government Policy which includes
Source: Sirindhorn International Institute of Technology (SIIT)

Th
ree
-tie
red
NA
MA
de
ve
lop
me
nt 1. N A M A Conception Phase
Con cept developm ent
Outpu t : N A M A Concept / N A M A Concept N ote
2. NAMA Implementation Phase
Concept elaboration
3. NAMA Operation Phase
Concept evaluation
Thailand’s NAMAs: Best Practices and ProcessT
hre
e-tie
red
NA
MA
de
ve
lop
me
nt
Source: Sirindhorn International Institute of Technology (SIIT)

Answer from Ministry of ENERGY only…
CO2 Countermeasures in Thailands NAMAs Estimated budget (M Baht)
Renewable Electricity Generation (DEDE) 224,600a
Energy Efficiency in Buildings and Industries
(DEDE)4,800b
Bio-diesel in the transport sector (DEDE) 890c
Environmental Sustainable Transport (OTP) 990,000d
Sources: aEstimated from subsidy spent on feed-in tariffs (DEDE).
bEstimated from budgets spent on energy efficiency promotion (EPPO).
cEstimated from budgets spent on bio-diesel promotion (DEDE), Excluded R&D.
dReport on Environmental Sustainable Transport (OTP-MOT).
Estimated budgets spent on NAMA actions in the NAMA period (up to 2020)
Thailand NAMAs…where the budget comes from?
Source: Sirindhorn International Institute of Technology (SIIT)
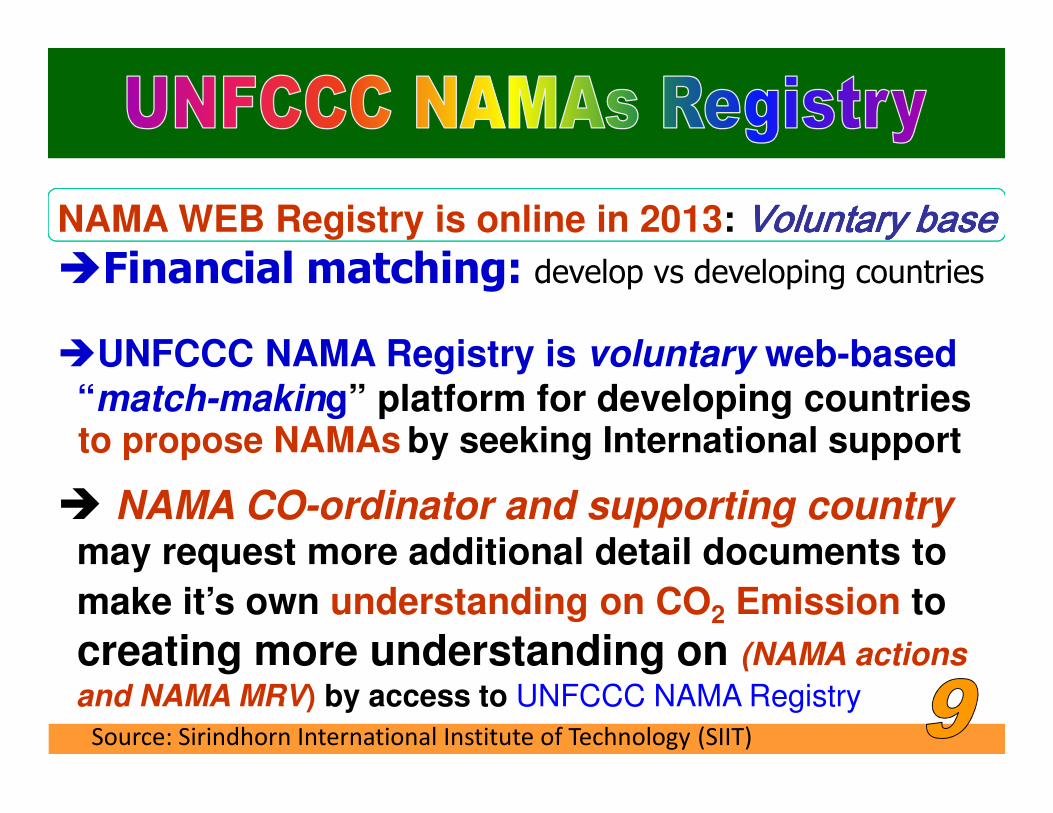
NAMA WEB Registry is online in 2013: Voluntary baseVoluntary baseVoluntary baseVoluntary base�Financial matching: develop vs developing countries
�UNFCCC NAMA Registry is voluntary web-based
“match-making” platform for developing countriesto propose NAMAs by seeking International support
� NAMA CO-ordinator and supporting country may request more additional detail documents to
make it’s own understanding on CO2 Emission to
creating more understanding on (NAMA actions
and NAMA MRV) by access to UNFCCC NAMA Registry
Source: Sirindhorn International Institute of Technology (SIIT)
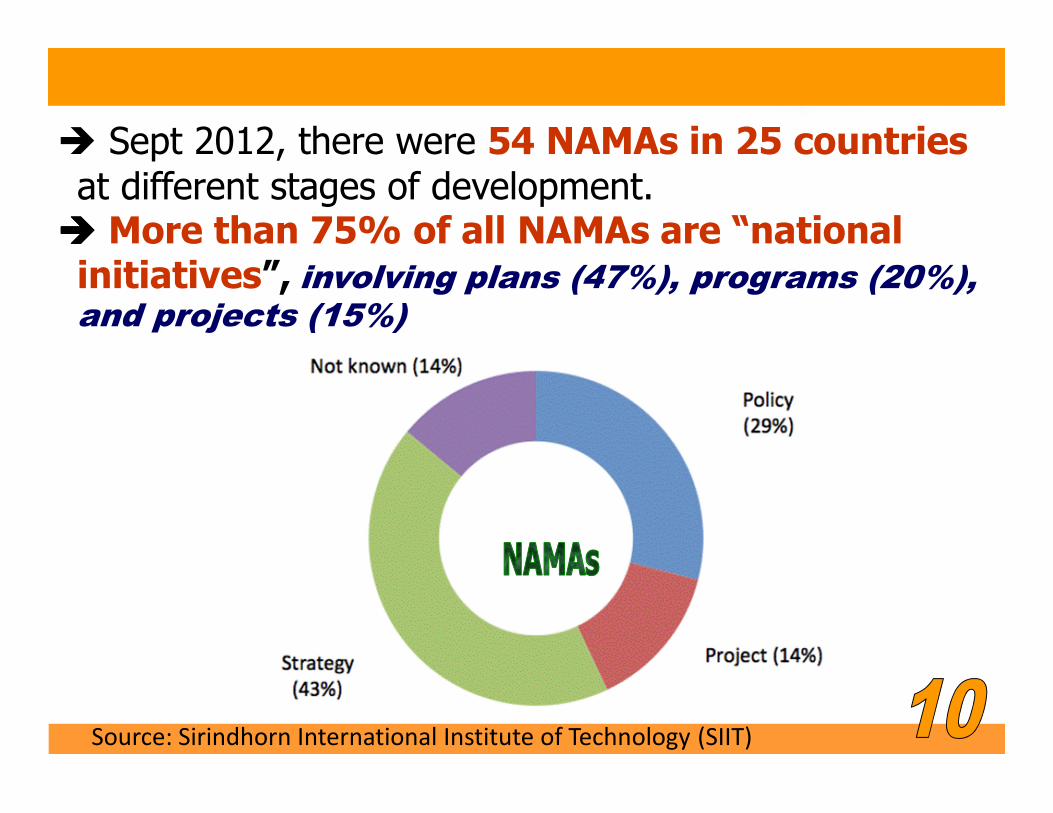
� Sept 2012, there were 54 NAMAs in 25 countriesat different stages of development.
���� More than 75% of all NAMAs are “national initiatives”, involving plans (47%), programs (20%), and projects (15%)
Source: Sirindhorn International Institute of Technology (SIIT)
UNFCCC NAMA “Pipeline”
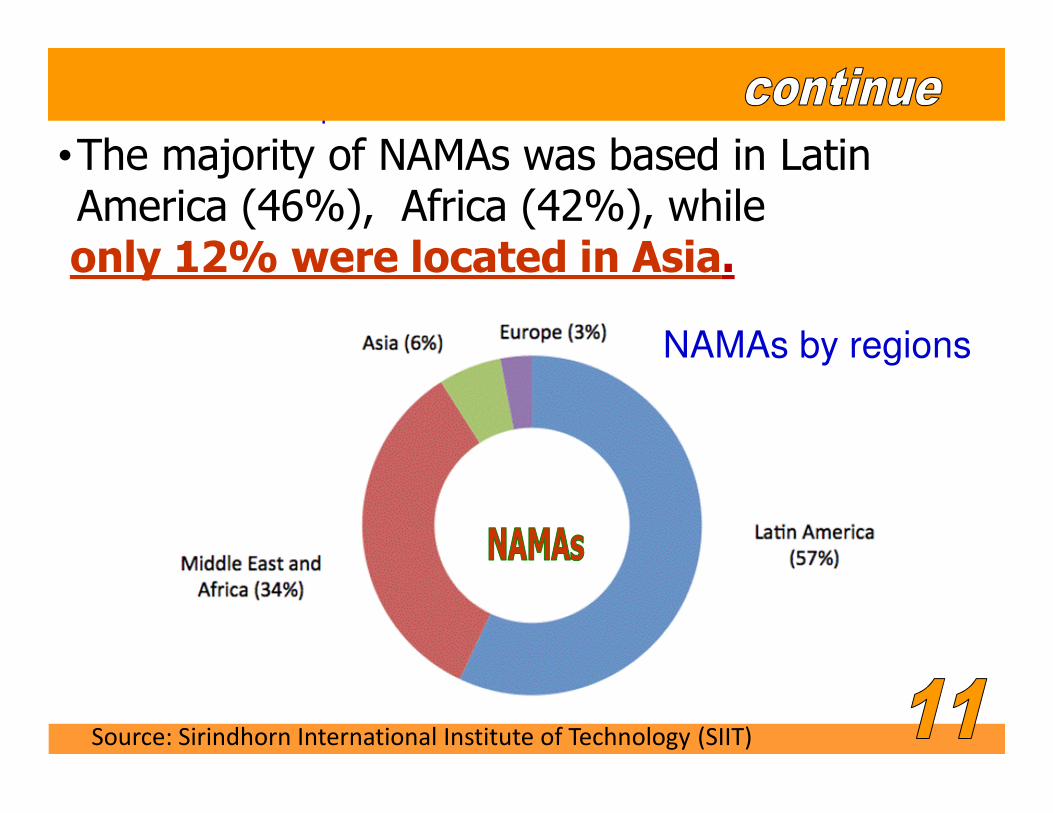
•The majority of NAMAs was based in Latin America (46%), Africa (42%), whileonly 12% were located in Asia.
NAMAs by regions
Source: Sirindhorn International Institute of Technology (SIIT)

Thailand Sectoral distribution of NAMAs, Oct 2012
Source: Sirindhorn International Institute of Technology (SIIT)

Energy,
69.57%
Industrial Process,
7.15%
Agriculture &
Livestock, 22.64%
Forestry, -3.44%Waste Management,
4.07%
Source: Thailand’s Second National Communication, (ONEP, 2011)
Development of Thailand NAMAsThailand CO2 emissions by sectors in 2000
IncludingTransport

1. Renewable Electricity (AEDP25%)
2. Energy Efficiency in Buildings & Industries
3. Bio-fuels for transportation (AEDP25%)
4. Environmental Sustainable Transport
Source: Sirindhorn International Institute of Technology (SIIT)
������������� ��������
Green Economy ����� �����
- ����"#$��%�'�������%(��
- �����)���*�����
Thailand NAMA Development
Green Economy with Energy Sector
Fuel Substitution in Transportation
Environmental Sustainable Transportation

EE REEnergy conservation Energy RenewableTarget to EE 20 years:
Reduce Energy’s Intensity (EI)of the energy usage
By reduction to 25% within 20 yearsBy the year 2020 must increase Energy Saving
38,200 ktoe
Target to AEDPProportion of renewable energy:
total energy usage to 25% within 10 years
In the form of Electricity, Heat, and Biofuels
Source: Sirindhorn International Institute of Technology (SIIT)

Final Energy Consumption (ktoe)
Sectoral Energy Consumption in Thailand in the BAU 2020
Source: Sirindhorn International Institute of Technology (SIIT)

0
50,000
100,000
150,000
200,000
250,000
300,000
350,000
400,000
2005200620072008200920102011201220132014201520162017201820192020
Total CO2 emissions (kt-CO2)
367 Mt
331 MtPDP2007 Forecast: BAU
Recent Forecast in 2013
Note :
PDP = Thailand’s Power Development Plan.
CO2 Emissions in the BAU 2020
Source: Sirindhorn International Institute of Technology (SIIT)

RenewableEnergy
Adder price (Baht/kWh)*
20% target(2011 )
25% new target 2012-
2021
1.Biomass 0.3-0.5 3,700 MW 3,630 MW
2.Biogas 0.3-0.5 120 MW 600 MW
3. Waste 2.5-3.5 160 MW 160 MW
4. Wind 3.5-4.5 800 MW 1,200 MW
5. Hydropower 0.8-1.5 324 MW 1,608 MW
6. Solar 6.5 500 MW 2,000 MW
7.Others - - 3 MW
Total Capacity 5,604 MW 9,201 MW
Source : Alternative Energy Development Plan (AEDP) 2012. Department
of Alternative Energy Development and Efficiency (DEDE, 2012).
Premium FiTs for RE electricity generation
in AEDP 25% (2012 updated)
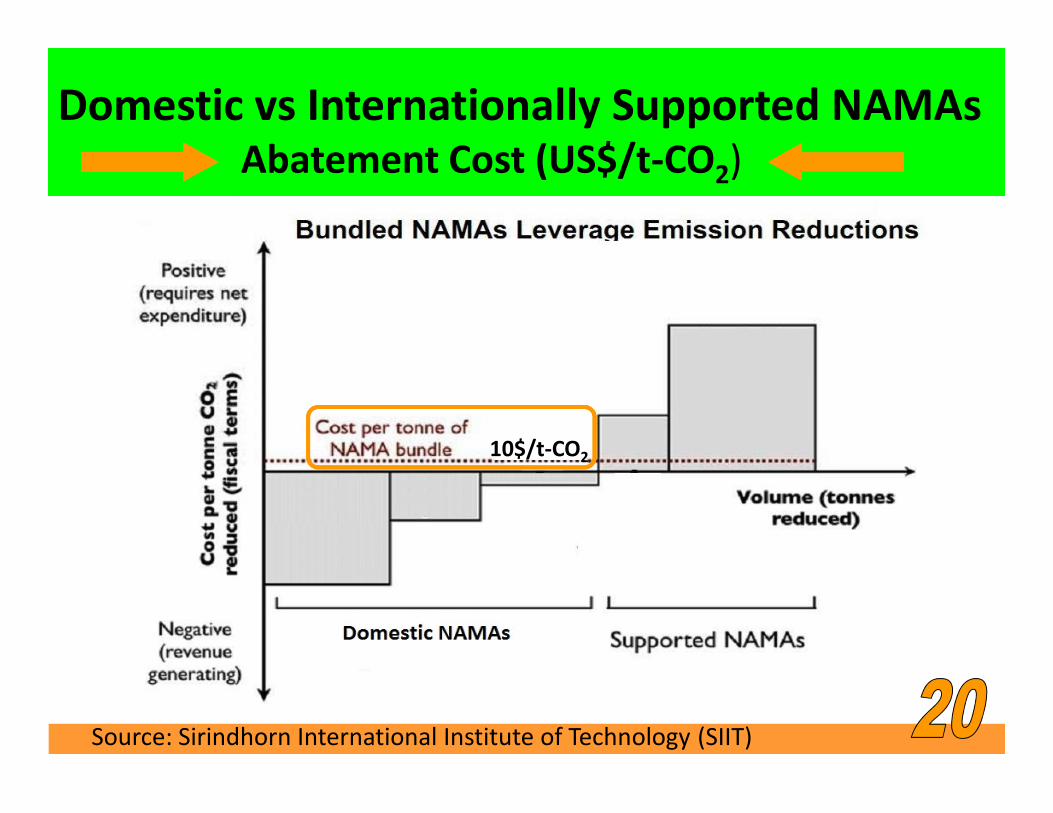
10$/t-CO2
Domestic vs Internationally Supported NAMAsAbatement Cost (US$/t-CO2)
Source: Sirindhorn International Institute of Technology (SIIT)
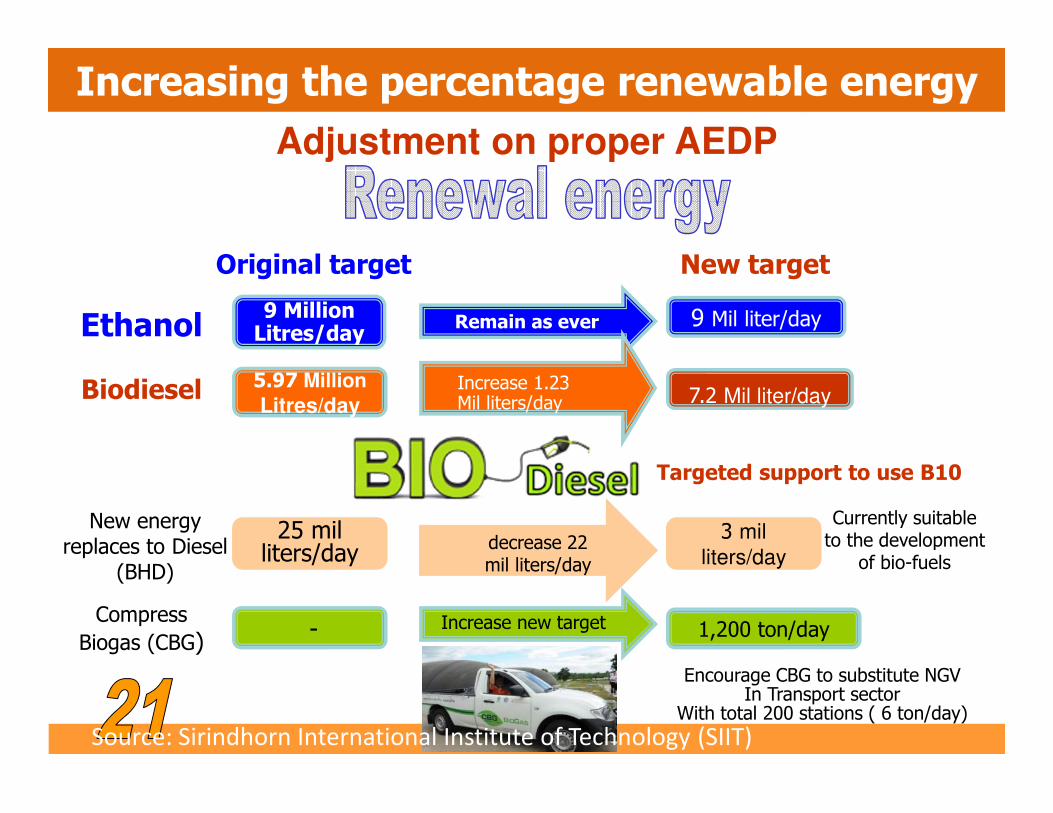
Increasing the percentage renewable energy
Original target New target
9 Million Litres/day
9 Mil liter/dayEthanol Remain as ever
5.97 Million
Litres/day 7.2 Mil liter/dayBiodiesel Increase 1.23Mil liters/day
Targeted support to use B10
25 mil liters/day
3 mil
liters/day
New energy replaces to Diesel
(BHD)
decrease 22 mil liters/day
Currently suitable to the development
of bio-fuels
- 1,200 ton/dayCompress
Biogas (CBG)Increase new target
Encourage CBG to substitute NGV In Transport sector
With total 200 stations ( 6 ton/day)
Adjustment on proper AEDP
Source: Sirindhorn International Institute of Technology (SIIT)

NAMAs CO2 Countermeasures CO2 reduction in 2020
(kt-CO2)
RE Power (Low MAC) 2,568Domestic
NAMAs
Sub-total 2.6 Mt-CO2
Internationally
RE Power (High MAC) 13,456supported
NAMAs
Sub-total 13.5 Mt-CO2
Total Domestic and Supported NAMAs 16.0 Mt-CO2
Potential of CO2 Mitigation in 2020
AEDP 2012 - RE power
Source: Sirindhorn International Institute of Technology (SIIT)

Potential of CO2 Mitigation in 2020 Large Buildings and Industries
NAMAs CO2 Countermeasures CO2 reduction in 2020
(kt-CO2)
Domestic
NAMAsEE Industries (Low MAC) 4,762
EE Building Codes 5,909
Sub-total 8.3 Mt-CO2
Supported
NAMAsEE Industries (High MAC) 9,743
Sub-total 9.7 Mt-CO2
Total Domestic and Supported NAMAs 20.4 Mt-CO2
Source: Sirindhorn International Institute of Technology (SIIT)

������������� ��������
Green Economy ����� �����
- ����"#$��%�'�������%(��
- �����)���*�����
Thailand NAMA Development
Green Economy with Energy Sector
Fuel Substitution in Transportation
Environmental Sustainable Transportation

Source: Sirindhorn International Institute of Technology (SIIT)

NAMAs CO2 Countermeasures CO2 reduction in 2020
(kt-CO2)
Domestic
NAMAsTransport/Ethanol (AEDP) 5,069
Transport/Biodiesel 1st Gen 5,022
Sub-total 10.0 Mt-CO2
Supported
NAMAsTransport/Biodiesel 2nd Gen 14,459
Sub-total 14.5 Mt-CO2
Total Domestic and Supported NAMAs 24.5 Mt-CO2
Potential of CO2 mitigation in 2020
Source: Sirindhorn International Institute of Technology (SIIT)

Potential of CO2 Mitigation in NAMAsEnvironmental Sustainable Transportation
by OTP
1. Modal shift2. Fuel economy improvement3. Sustainable transport system

NAMAs CO2 Countermeasures CO2 reduction in 2020
(kt-CO2)
Environmental Sustainable
Transport12,000
Sub-total 12.0 Mt-CO2
Total Supported NAMAs 12.0 Mt-CO2
Supported
NAMAs
Source: Sirindhorn International Institute of Technology (SIIT)

NAMAs CO2 Countermeasures CO2 reduction in 2020
kt-CO2 % % %Scenario I (High Potential) Scenario II Scenario III
RE Power (MAC) 2,568
EE Industries (MAC & Large) 4,762
Building Codes (Large) 5,909 80% achieved
Domestic Transport/Ethanol 5,069
NAMAs Transport/Biodiesel 1st Gen 5,022
Sub-total (Mt-CO2) 23,330 6.35 6.35 5.08
RE Power (MAC) 13,456
Inter. EE Industries (MAC & Large) 9,743 50% achieved
Supported Transport/Biodiesel 2nd Gen &
CBG for transportation
14,459 50% achieved
NAMAs Environmental Sustainable
Transport (BCDBEGH IDJ)
12,000
Sub-total (Mt-CO2) 49,658 13.51 11.55 8.39
Total Domestic and Supported NAMAs 72,988 19.86 17.90 13.47
Total emissions in 2005 (energy only) 192,724
Total emissions in 2020 (energy only) 367,437
Scenarios of CO2 Mitigation in Thailand NAMAs
Source: Sirindhorn International Institute of Technology (SIIT)

Year DoPED* Energy Intensity(toe/1000 USD)
CO2 Intensity (t-CO2/USD)
2005 68.82 0.280 0.696
2020 BAU 69.24 0.274 0.564
2020 NAMA +10.7% -17.9% -18.3%
* DoPED: Diversification of primary energy demand
Source: Sirindhorn International Institute of Technology (SIIT)

“Thailand will endeavor to lower CO2 emissions in the range of 7-20% in 2020……..compared to the BAU”
CO2 Counter-measures
• RE: Biomass, biogas, hydro, Solar, Wind,
Waste-to-energy etc.
• EE in Industries, Buildings, Transportation
• Bio-Fuels and alternative energy sources
• Environmental Sustainable Transport System
Thailand’s NAMAs
Source: Sirindhorn International Institute of Technology (SIIT)

������������� ��������
Green Economy ����� �����
- ����"#$��%�'�������%(��
- �����)���*�����
Thailand NAMA Development
Green Economy with Energy Sector
Fuel Substitution in Transportation
Environmental Sustainable Transportation

Mega Project on Thailand Infrastructure Development
with USD 67 Billion
28.90%17.89% 52.16%
Source: Office of Transport and Traffic Policy and Planning: OTP

Customs 418
Source: OTP
The Infrastructure Development Programs
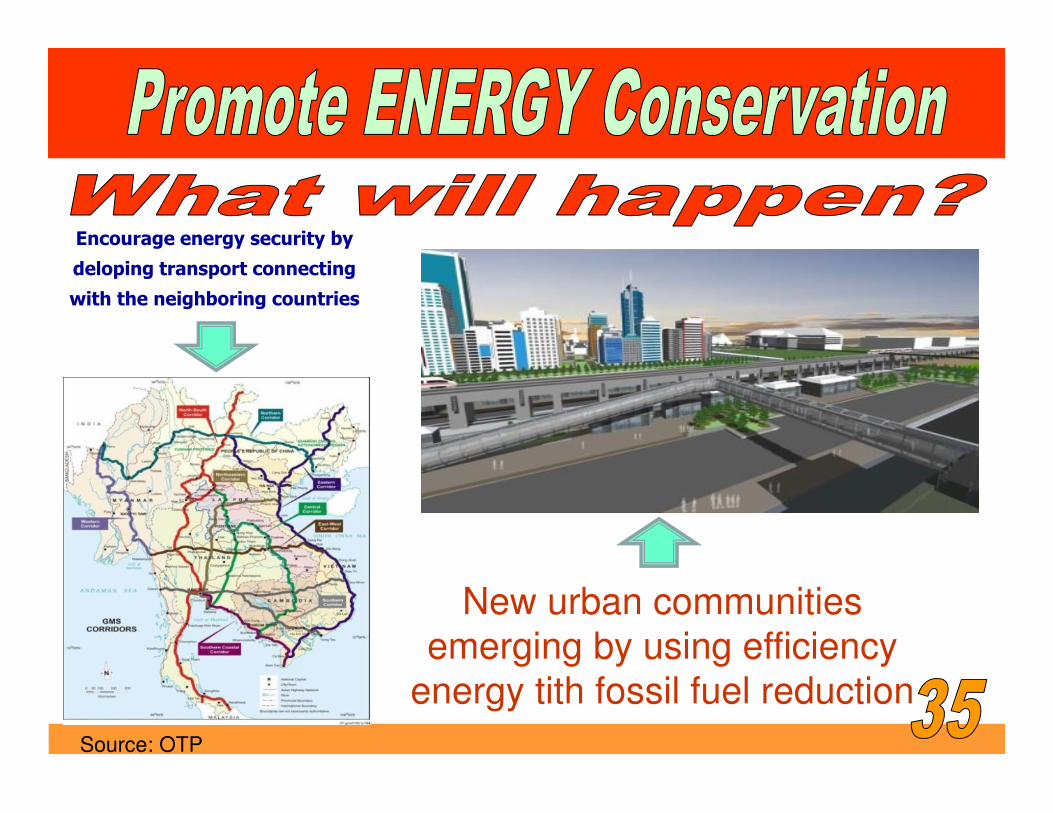
Encourage energy security by
deloping transport connecting
with the neighboring countries
New urban communities
emerging by using efficiency
energy tith fossil fuel reduction
Source: OTP

Million tons
3rd version of PDP2010
Diesell/Renewal energy
Natural GasImport CoalLigniteNuclear
Source: Sirindhorn International Institute of Technology (SIIT)

2.2 e �������)� 2 ������� g�$ Country Strategy
Energy Saving from Thailand Transport Infrastructure Development
USD 67 Billion“ h�i�j#k% l'm������)� ����"�i"�������n��� ���”
%���nl/����o�� ��lpq��"�r��s"
Reduce the LOST
from using the
fossil fuel not less
than 100,000
Million Baht/year
Outcome: Support transport energy efficiency, reduce the import and usage of FOSSIL FUEL
Rural Highways
Motorways
BTS
Railway double track
Mass Rapid Transit
Source: OTP

OTP: Sample on Testing Analysis of Vehicle Emissions
Emissions of pollutants released by Transport sector in 2011,
Based on outputs from the transport models,
National Model (NAM) and Extened Bangkok Urban Model (eBUM)
Emission NAM eBUM
Hydrocarbon (HC) 0.04 0.03
Carbon monoxide (CO) 0.26 0.15
Nitrogen oxides (NOx) 0.24 0.11
Carbon dioxide (CO2) 39.21 18.21
Unit: M tonnes
Remark: Results shown are directly output from Transport Model, These figures have to be further clibrated against the Ministry of Energy’s figure
