inner cabrillo beach water quality improvement project ... · i inner cabrillo beach water quality...
TRANSCRIPT

January 2006
Inner Cabrillo BeachWater Quality Improvement Project
Source Identifications and Mitigation AlternativesVolume I Summary Report
Port of Los AngelesEngineering Division

i
INNER CABRILLO BEACH WATER QUALITY IMPROVEMENT PROJECT
SOURCE IDENTIFICATIONS AND MITIGATION ALTERNATIVES
VOLUME I - SUMMARY REPORT
January 2006
Table of Contents
Page No. 1.0 EXECUTIVE SUMMARY ............................................................................................................. 1 2.0 BACKGROUND AND PURPOSE ................................................................................................. 8
2.1 Project Setting ............................................................................................................................. 8 2.2 Project Purpose............................................................................................................................ 9
3.0 INITIAL ANALYSIS OF BACTERIAL MONITORING DATA AT INNER CABRILLO BEACH.......................................................................................................................................... 10
3.1 Introduction and Purpose........................................................................................................... 10 3.2 Bacterial Standards .................................................................................................................... 10 3.3 Exceedances of Bacterial Objectives at Inner Cabrillo Beach .................................................. 12
3.3.1 Frequency of Exceedances................................................................................................ 12 3.3.2 Reductions Required......................................................................................................... 14
3.4 Conclusions from Analyses of Inner Cabrillo Beach Monitoring Data..................................... 16 4.0 OFFSHORE HARBOR WATER SOURCES ............................................................................... 17
4.1 Analysis of Existing Offshore Harbor Water ............................................................................ 17 4.2 Additional Water Quality Surveys Offshore Inner Cabrillo Beach........................................... 17 4.3 Nearshore Water and Swash Zone Water Sampling and Bacterial Analysis............................. 17 4.4 Conclusions on Offshore Sources of Contamination to Inner Cabrillo Beach .......................... 20
5.0 INSHORE CIRCULATION AND HYDRODYNAMIC RESULTS ............................................ 21 5.1 Initial U.S. Army Corps of Engineers Study Results ................................................................ 21 5.2 Field Dye Study of Discharge from Wetland ............................................................................ 24 5.3 Field Dye Studies at Inner Cabrillo Beach Face........................................................................ 24 5.4 Nearshore Hydrodynamic Modeling of Circulation .................................................................. 24 5.5 Field Circulation Pump Experiment ..........................................................................................32
5.5.1 Circulation Pump Models ................................................................................................. 32 5.5.2 Field Experiment Design and Methods............................................................................. 32
5.6 Conclusions on Circulation and Hydrodynamic Studies at Inner Cabrillo Beach..................... 36 6.0 LOCAL SOURCES OF BACTERIAL CONTAMINATION....................................................... 41
6.1 Importance of Sources Local to the Beach ................................................................................ 41 6.2 Chronology of Interim Repairs/Diversions at Southern End of Beach ..................................... 42 6.3 Storm and Sanitary Sewer Drainage System Investigations...................................................... 43
6.3.1 Inspections ........................................................................................................................ 43 6.3.2. Interim Project of Repair and Diversion of Drainage Systems at South End of Beach.... 46
6.3.2.1 Repair/Diversion Project .............................................................................................. 46 6.3.2.2. Beach Response After Repair/Diversion Project.......................................................... 46
6.3.3 Interstitial Water Results................................................................................................... 49 6.3.4 Semi-Permanent Groundwater Well Results .................................................................... 52 6.3.5 Seep and Stormwater Runoff Results ............................................................................... 54 6.3.6 Old Abandoned Sanitary Outfall ...................................................................................... 57 6.3.7 Drainage System Conclusions .......................................................................................... 58

ii
Table of Contents (cont.)
Page No. 6.5 Beach Sand Studies ................................................................................................................... 59
6.5.1 Sand Sources of Contamination........................................................................................ 59 6.5.2 Beach Flooding ................................................................................................................. 62
6.6 Swash Zone Particulate Materials and Nearshore Eelgrass Beds.............................................. 64 6.6.1 Eelgrass Beds at Inner Cabrillo Beach.............................................................................. 64 6.6.2 Erosion of Sediments and Detrital Materials .................................................................... 66 6.6.3 Bacterial Measurements of Suspended Particulates and Eelgrass bed Sediments ............ 70
6.7 Birds and Other Local Animals ................................................................................................. 75 6.7.1 Bird Use at Inner Cabrillo Beach...................................................................................... 75 6.7.2 Other Local Animals......................................................................................................... 77 6.7.3 Bird Exclusion Structure................................................................................................... 78 6.7.4 Accretion of Additional Beach Area Inside Breakwater .................................................. 82 6.7.5 Genetic Ribotyping ........................................................................................................... 83 6.7.6 Bird and Other Animal Conclusions................................................................................. 84
6.8 Inner Cabrillo Beach Operations and Maintenance................................................................... 85 6.8.1 Sand Management............................................................................................................. 86 6.8.2 Trash/Garbage and Picnic Areas....................................................................................... 90 6.8.3 Conclusions on Operations and Maintenance................................................................... 92
7.0 STUDY FINDINGS AND RECOMMENDATIONS ................................................................... 93 7.1 Summary of Study Findings ...................................................................................................... 93
7.1.1 Exceedances of Bacterial Water Quality Objectives at Inner Cabrillo Beach .................. 93 7.1.2 Offshore Sources............................................................................................................... 93 7.1.3 Drainage System Sources ................................................................................................. 93 7.1.4 Beach Sand, Stormwater Discharges and Beach Flooding ............................................... 94 7.1.4 Birds and Other Mammals ................................................................................................ 94 7.1.5 Particulate Materials and Nearby Eelgrass Beds .............................................................. 95 7.1.6 Water Circulation.............................................................................................................. 96
7.2 Description of Recommended Project Alternatives .................................................................. 97 7.2.1 Redesign/Extend Bird Exclusion Structure ...................................................................... 97 7.2.2 Make Remaining Repairs of Sanitary Sewer System ....................................................... 98 7.2.3 Divert Stormwater Discharges From Beach ..................................................................... 98 7.2.4 Re-contour Beach to Prevent Flooding and Promote Drainage ........................................ 98 7.2.5 Clean and Deepen Immediate Nearshore Area to Promote Mixing, Prevent Routine
Erosion of Fines/Enhance Swimming Area ...................................................................... 98 7.2.6 Develop Beach Management Plan .................................................................................... 98 7.2.7 Circulation Enhancement Methods................................................................................... 99 7.2.8 Project Staging.................................................................................................................. 99
8.0 REFERENCES ............................................................................................................................ 100

iii
List of Tables
Page No. Table 1. Bacterial Water Quality Objectives (REC-1).................................................................... 10 Table 2. TMDL Allowed Exceedances at Inner Cabrillo Beach CB02 .......................................... 12 Table 3. Average Single Sample and Allowable Bacterial Exceedance Days Expressed as Daily Sampling ................................................................................................................. 14 Table 4. Percentage Exceedances of Water Quality Objectives ..................................................... 15 Table 5. Bacteria (Counts/100ml) in Sterile Seawater Extracts of Sand and Stormwater Runoff from a 2.09-Inch Event on 26 February 2004....................................................... 60 Table 6. Average Days per Year LAOH Tides Reach or Exceed 10 Water Level Categories from 6.0 feet and Greater in Height (MLLW) .................................................................. 62 Table 7. Comparison of Concentrations of Fecal Indicator Bacteria Measured in Particulate Samples using Chromogenic Substrate Test Kits and Standard Laboratory Test Methods, at 10:1 Seawater to Sediment Ratio with PSP Extraction Protocol, June 7-8, 2005 ........................................................................................................................... 73 Table 8. Fecal Indicator Bacteria Measured in Swash Zone Suspended Sediments and Surficial Eelgrass Bed Sediments Using Three Extraction Methods at 10:1 Seawater to Sediment Ratio and Two Analytical Approaches, June 7-8, 2005................ 73
List of Figures
Page No. Figure 1. Inner Cabrillo Beach Area, Port of Los Angeles ................................................................ 1 Figure 2. Inner Cabrillo Beach Aerial View. Wetland, Youth Camp, and Cabrillo Marina to the North ............................................................................................................................. 2 Figure 3. Outer Cabrillo Beach .......................................................................................................... 3 Figure 4. Children in the Inner Cabrillo Beach Intertidal Area.......................................................... 4 Figure 5. Leaking Sewer .................................................................................................................... 5 Figure 6. Eelgrass Bed in Swim Area Extended from -1 Ft MLLW just off the Beach Face ............ 5 Figure 7. Construction of Sewer Repairs ........................................................................................... 6 Figure 8. Weekend Use of Inner Cabrillo Beach ............................................................................... 6 Figure 9. Renovated Bath House and Community Center at Inner Cabrillo Beach........................... 8 Figure 10. Warning Sign Posted on Beach......................................................................................... 10 Figure 11. Bacterial Monitoring Stations at Inner Cabrillo Beach and Los Angeles/ Long Beach Harbor .................................................................................................................... 11 Figure 12. Bacterial Monitoring Stations in Alamitos Bay................................................................ 11 Figure 13. Comparison of Percent of the Time Exceedances Occur at Cabrillo Beach Shoreline Sites. CB01 – Launch Ramp, CB02 and CBE on Inner Cabrillo Beach, S7 – Outer Cabrillo Beach ................................................................................................ 13 Figure 14. Percent of the Time Exceedances Occur at Other Protected Beaches, B6 – Long Beach and B29 – Alamitos Bay ........................................................................................ 14 Figure 15. Enterococcus Monthly Averaged Single Sample and 30-Day Geometric Mean Data ..... 15 Figure 16. Typical Results of Dry Weather Bacterial Surveys Offshore Inner Cabrillo Beach......... 18 Figure 17. Typical Response of Offshore Stations to a Storm Event................................................. 19 Figure 18. Enterococcus Measured in the Swash Zone (A) versus in Two Feet of Water (B) .......... 20 Figure 19. Flood and Ebb Currents in Western Harbor Under No Wind Conditions (USACE/Evans Hamilton, 2003)...................................................................................... 22 Figure 20. Two Layer Flow Under Predominate West Wind Conditions (USACE/Evans Hamilton, 2003). ............................................................................................................... 22

iv
List of Figures (cont.)
Page No. Figure 21. U.S. Corps of Engineers Dye Plume Under Predominate West Winds Inner Cabrillo Beach, 15 September 2002. Surface Layer Dye Plume Moves Offshore (top) and Transported to Beach by Bottom Countercurrent (bottom................................ 23 Figure 22. Remote Controlled Airplane Equipped with Digital Camera ........................................... 24 Figure 23. Constructed Wetland Located just North of the Inner Cabrillo Beach Launch Ramp...... 25 Figure 24. Rhodamine Dye in the Inner Cabrillo Beach Wetland near the Outlet at 07:30 March 17, 2004 ................................................................................................................. 25 Figure 25. Plume Discharge from Constructed Wetland, Under Predominate West Wind Conditions, March 17, 2005.............................................................................................. 26 Figure 26. Dye Movement from Swash Zone in Nearshore Area Under Very Light Southwest Wind Conditions in Early Morning, 09:00 August 27, 2003, Wind 4 mph. 250-270 Degrees ............................................................................................................................. 27 Figure 27. Three Dimensional Numerical Model Grid Showing Vector Velocities for Inner Cabrillo Beach Nearshore Circulation Modeling, RMA-12 Model.................................. 28 Figure 28. Inner Cabrillo Beach Base Condition, 2 Knot Wind @ 240 deg. from North (Left). Inner Cabrillo Beach Currents, No Wind. Red Traces Bottom Circulation Over 15 Hour Time Period (Right)................................................................................................. 29 Figure 29. Base Condition, 5 Knot Wind @ 240 deg. from North .................................................... 30 Figure 30. Movement of Nearshore Bottom Water, Inner Cabrillo Beach Currents, 5 Knot Wind @ 240 deg. from North ........................................................................................... 31 Figure 31. Inner Cabrillo Beach Currents, 2 Knots @ SE (160 deg. from North) (Left). Inner Cabrillo Beach Currents. 5 Knots @ NW (300 deg. from North) (Right)....................... 33 Figure 32. 30,000 gpm Pump, 2 Knot Wind @ 240 deg. from North................................................ 34 Figure 33. Inner Cabrillo Beach Circulation Pump Field Experiment, August 3-5, 2005 ................. 35 Figure 34. Aerial Photograph of Dye Distribution Southern Part of Inner Cabrillo Beach, 11:30, August 3, 2005. Insert RMA Model Predictions. (Note Pumping Started at 08:22). Red Indicates Clean Water Flushed to Beach.................................................. 37 Figure 35. Current Speeds and Water Height in Water Column Above ADPC Current Meter, August 4 and 5, 2005 ........................................................................................................ 38 Figure 36. Current Directions in Water Column Above ADPC Current Meter, August 4 and 5, 2005 .................................................................................................................................. 39 Figure 37. Repair/Diversion Interim Project ...................................................................................... 41 Figure 38. Storm Drains and Sanitary Sewage Lines at Inner Cabrillo Beach .................................. 44 Figure 39. Storm Drain Conveyances North of Cabrillo Beach......................................................... 45 Figure 40. Overflow Stormwater Outfall at South Corner ICB ......................................................... 43 Figure 41. Repair and Diversion of Storm Sewer and Repair of Local Leaking Sanitary Sewers, June 2004............................................................................................................. 47 Figure 42. Sanitary Sewer from Both House Built into Top of Clay Storm Drain, 1932 .................. 48 Figure 43. Sanitary Sewer Line from Cabrillo Bath House ............................................................... 48 Figure 44. Enterococcus Monitoring Data, Summer 2004................................................................. 50 Figure 45. Enterococcus Monitoring Data, Summer 2005................................................................. 50 Figure 46. Enterococcus Monitoring Data, Summer 2003................................................................. 51 Figure 47. Enterococcus Monitoring Data, Fall/Winter 2005............................................................ 51 Figure 48. Enterococcus Results in May/June 2003 Interstitial Water Samples, Inner Cabrillo Beach ................................................................................................................................ 52 Figure 49. Location of Semi-Permanent Groundwater Wells at Inner Cabrillo Beach...................... 53 Figure 50. Persistent Brackish Water Seep at Southern Corner of Inner Cabrillo Beach .................. 55
v
List of Figures (cont.)
Page No. Figure 51. Dry Weather Seep Sampling, April 21, 2004. Rained 0.09”, 4 Days Prior. Square —Seep Samples. Triangle—Ocean Samples. Dotted Circle—Interstitial Groundwater Sample ........................................................................................................ 56 Figure 52. Wet Weather Seep Sampling, October 31, 2004. Rained 0.11”, Same Day. Square —Seep Samples. Circle—Stormwater Samples .............................................................. 56 Figure 53. Location of Old Abandoned Sewer Outfall (Red Alignment as Found)........................... 57 Figure 54. Pothole & Magnetic Surveying......................................................................................... 58 Figure 55. Pre-Wet Weather Sand Surveys, August 15 to September 30, 2003. Smallest Circle–Surface Samples. Medium Circle–6-inches Deep. Largest Circle–12- Inches Deep. Rain 0.3”, 16-62 Days Prior. Wind 3-8 KT, 150-220º.............................. 61 Figure 56. Bird Use of Flooding Inner Cabrillo Beach...................................................................... 63 Figure 57. Ponded Water on Flooded Inner Cabrillo Beach .............................................................. 63 Figure 58. Eelgrass Beds at Inner Cabrillo Beach, August 2000 (MEC, 2001)................................. 65 Figure 59. Inner Cabrillo Beach Nearshore Eelgrass at Low Tide (-1 ft MLLW), 1700 December 2, 2005 ............................................................................................................. 67 Figure 60. Eelgrass Showing in the Swim Area of Inner Cabrillo Beach at Low Tide, 1700 December 2, 2005 ............................................................................................................. 68 Figure 61. Eelgrass Beds and Fine Sediment/Detrital Material Offshore Inner Cabrillo Beach........ 69 Figure 62. Particulate & Detrital Materials, Swash Zone High Tide Range Conditions, Inner Cabrillo Beach .................................................................................................................. 71 Figure 63. Sea Gulls and Terns on Cabrillo Beach ............................................................................ 76 Figure 64. Bird Excrement on Northern Part of Inner Cabrillo Beach .............................................. 77 Figure 65. Bird Exclusion Structure Erected on Inner Cabrillo Beach, September 2000 .................. 79 Figure 66. Effectiveness of Bird Exclusion Structure on Southern Portion of Inner Cabrillo Beach ................................................................................................................................ 80 Figure 67. Monthly Averages of Percent of the Time Bacterial Water Quality Exceedances Occur at Inner Cabrillo Beach .......................................................................................... 81 Figure 68. New Beach Accreting on Inside of Breakwater Now Being Used by Birds..................... 83 Figure 69. Trash Piles Being Readied for Removal at Inner Cabrillo Beach..................................... 87 Figure 70. Trash Deposited on Inner Cabrillo Beach by Onshore Winds and Tide........................... 87 Figure 71. Front End Loader Used to Maintain the Inner Cabrillo Beach ......................................... 88 Figure 72. Rake is Use Extensively to Gather Trash and to Groom the Beach Sands ....................... 88 Figure 73. Herrington Beach Sand Grooming Equipment ................................................................. 89 Figure 74. Clearing Sand at Inner Cabrillo Beach ............................................................................. 89 Figure 75. Gulls Attracted to Picnic Area at Inner Cabrillo Beach.................................................... 91 Figure 76. Fecal Contamination on Picnic Tables from Birds ........................................................... 91 Figure 77. Discoveries........................................................................................................................ 99
VOLUME II – TECHNICAL APPENDICES Appendix A. Analysis of Bacterial Monitoring Data at Inner Cabrillo Beach Appendix B. Bacterial Concentrations in Waters Offshore of Inner Cabrillo Beach Appendix C. Inshore Circulation and Hydrodynamic Results Inner Cabrillo Beach Appendix D. Local Sources of Bacterial Contamination at Inner Cabrillo Beach Volume I - Summary Report and Volume II - Technical Appendices (January 2006) are included on attached CD. Cabrillo Beach Underwater Video Surveys (May 2005) are included on second CD.

vi
ACKNOWLEDGDEMENTS
Funding for this study was provided by a Clean Beaches Initiative Grant from the State Water Resources Control Board with additional funding by the Port of Los Angeles. Richard Mast and Hank Steinorth of DMJM+HARRIS managed the contract under the Port of Los Angeles Channel Deepening project as well as provided engineering support for this study. Program Director was John Foxworthy of the Port of Los Angeles who actively directed the study and participated in the long process of sorting out the meaning of data and clues uncovered in this investigation. This Inner Cabrillo Beach Water Quality Improvement project was a difficult investigation with an adaptive scope of work, rather than a preplanned study. Therefore John Foxworthy's active technical and management participation was critical. Patrick Kinney of Kinnetic Laboratories served as Project Manager for this study of the sources of contamination at Inner Cabrillo Beach. Richard Mast led the engineering support efforts supplied by DMJM+HARRIS assisted by Gary Sjelin who carried out the hydraulic calculations and designed storm water and sanitary sewer improvements. Hydrodynamic modeling support was provided by Richard Rachiele and John DeGeorge of Resource Management Associates. Dr. Alexandria Boehm of the Department of Civil and Environmental Engineering at Stanford University assisted with key consulting advice on methodologies and knowledge of bacterial contamination of beaches. Key help was provided by the City of Los Angeles, Bureau of Sanitation Environmental Monitoring Laboratory staff, with special efforts provided by Farhana Mohamed, Zora Bahariance, and Ann Dalkey, both for initially getting us going but also for the continual monitoring data that was so essential to the success of this project. Other City and Port staff were most helpful, especially the local staff working at Inner Cabrillo Beach from maintenance to management all of who were highly motivated to assist with beach improvements. Special thanks are extended to Linda Chilton of the Cabrillo Marine Aquarium who guided us on previous study results and data about the Inner Cabrillo Beach environment. Dale Parent led the Kinnetic Laboratories field efforts and figured out many of the answers to the puzzles of beach contamination and the long history and old infrastructure at Inner Cabrillo Beach. He also managed the large amount of field and laboratory data generated. Kinnetic Laboratory staff including Ken Kronschnabl, Marty Stevenson, Spencer Johnson assisted in coordinating field and data interpretation tasks. Others included Bob Shelquist, Mackenzie Manning, Jeremy Burns, Kathy Motte, Greg Cotton Genevieve Lada, Amy Howk, and Brandalynn Curtis. Peter Wilde, Gary Gillingham, and Kathleen Dorsey carried out data base management, statistical analysis, and graphic productions. Jonathan Toal provided technical and editing support.

1
INNER CABRILLO BEACH WATER QUALITY IMPROVEMENT PROJECT
SOURCE IDENTIFICATIONS AND MITIGATION ALTERNATIVES
VOLUME I - SUMMARY REPORT
Prepared by: Port of Los Angeles Engineering Division
Kinnetic Laboratories, Inc. DMJM+HARRIS
January 2006
1.0 EXECUTIVE SUMMARY Inner Cabrillo Beach experiences excessive numbers of bacterial water quality violations as measured on the beach by the City of Los Angeles Department of Sanitation at the CB02 monitoring site. Inner Cabrillo Beach is located inside the breakwater of the Port of Los Angeles, along the San Pedro shore in the western Harbor and is comprised of the southern recreational beach and park complex, the constructed wetland, and the northern beach of the present Youth Facility. Inner Cabrillo Beach has served urban areas of the City of San Pedro and greater Los Angeles since the early 1900s and is the home of the Cabrillo Marine Aquarium and the recently restored Cabrillo Bath House. In addition to beach, park, and community facilities, the Port of Los Angeles has also enhanced habitat in the Inner Cabrillo Beach area by a constructed saltwater wetland, construction of shallow water habitat, and planting of eelgrass that has now filled this western area of the Harbor in the depth range of -1 to -15 feet MLLW. This beach is thus of immense value as a marine science teaching resource with thousands of school children bussed to the beach for classes at the aquarium and to participate in field activities on Inner Cabrillo Beach.
Figure 1. Inner Cabrillo Beach Area, Port of Los Angeles.
2
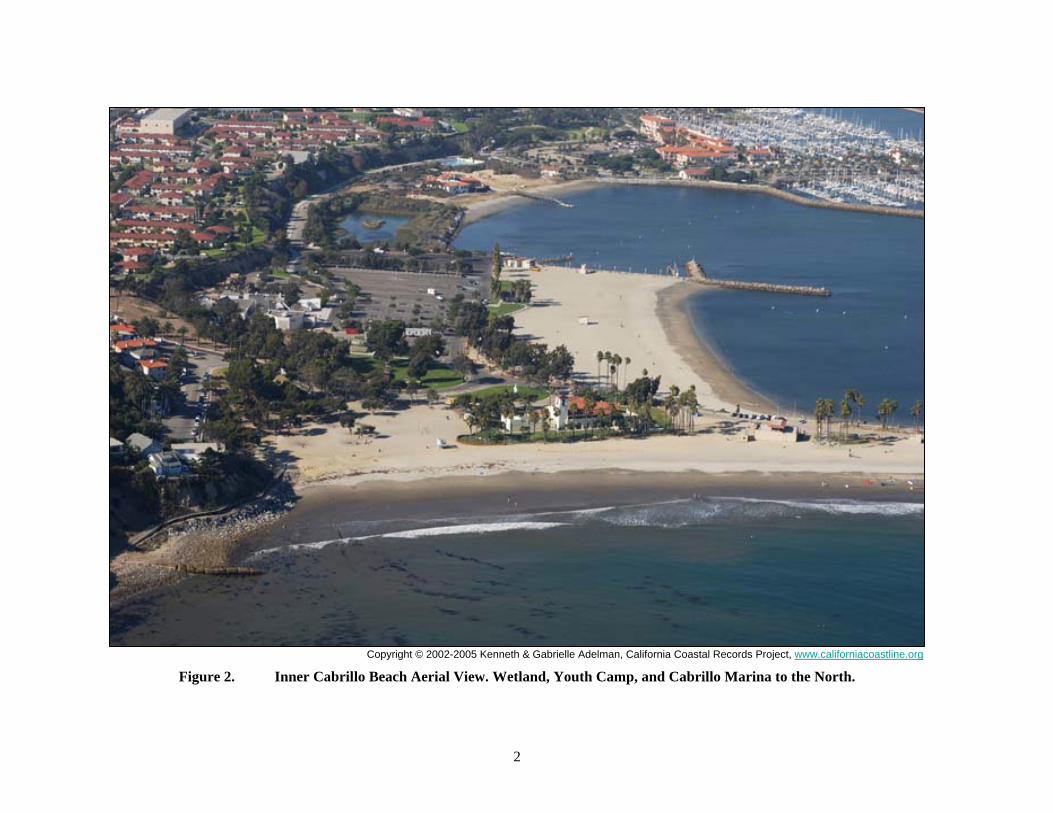
Figure 2. Inner Cabrillo Beach Aerial View. Wetland, Youth Camp, and Cabrillo Marina to the North. Copyright © 2002-2005 Kenneth & Gabrielle Adelman, California Coastal Records Project, www.californiacoastline.org

3
Figure 3. Outer Cabrillo Beach.

4
Cabrillo Beach is also a very important and historical urban beach. Inner Cabrillo Beach is especially valuable as one of the few urban beaches accessible to the Los Angeles area that is protected from open ocean waves. The protected Inner Cabrillo Beach is the only protected beach in the City and one of the few in the urban area. Total visitors exceed 1.25 million/year. Attendance at the Cabrillo Marine Aquarium is about 400,000 per year, including about 140,000 school children per year participating in the Cabrillo Marine Aquarium's marine education program. Considerable regional economic and fiscal benefits accrue from this resource and attraction, both from out of City visitors and from uses by both local and other City residents. Because of the importance of this sheltered beach for the large urban population, this beach has a high priority for clean up even though it is a difficult problem caused by multiple factors. Complicating factors also exist with potentially conflicting natural resources such as heavy bird use and extensive eelgrass habitats existing immediately offshore the beach (about 0.5 feet MLLW). Inner Cabrillo Beach is an incredible recreational and educational resource to City of Los Angeles. Both northern and southern portions have invaluable habitat values. It is necessary to optimize both values to the City and Port of Los Angeles The Problem • Excessive bacterial violations occur at Inner Cabrillo Beach CB02. • Violations have been high for 10-year monitoring period. This has likely occurred for a longer
time period. • Violation excessive during both wet and dry periods, large reductions needed • Inner Cabrillo Beach violations significantly higher than other beaches, including other protected
beaches in Los Angeles/Long Beach area • Northern Inner Cabrillo Beach at Youth Camp similarly high • Need to fix this problem to meet regulatory requirements and to maintain and avoid the necessity
of closing or removing the protected urban beach at Inner Cabrillo Beach. This would have major impacts on the recreational opportunities available to urban children and for the City of Los Angeles as a whole.
Large reductions will be required in bacterial exceedances at CB02 in order to make the beach safe and to meet public health and regulatory requirements, including new bacteria compliance schedules imposed in a Basin Plan amendment by California Regional Water Quality Control Board for Total Daily Maximum Load (TMDL) requirements (LARWQCB, 2004). From the historical monitoring data, the average days of exceedances per year based upon single sample criteria has approximated 170 days/year. Figure 4. Children in the Inner
Cabrillo Beach Intertidal Area.

5
Summary of Project Findings - Multiple Sources and Mechanisms of Contamination • Harbor Water Generally Clean - Clearly Local Sources
at Beach o Offshore water clean except for few days around
storm events o Based on 31 new surveys at Inner Cabrillo Beach,
7.5-year city offshore surveys, and data analyses o Harbor water almost meets new requirements now
• Sources from Local Sanitary Sewage Leaks o Leaks found in local sanitary systems o Based upon drainage Inspections, ground water
studies, old abandoned outfall, sources on bluff Figure 5. Leaking Sewer. • Sources from Stormwater Discharges Into and Over Beach
o Based on direct measurements of water and beach sand during and after storms • Local Sources of Birds and Small Mammal
o Based on observations, beach response to partial bird structure, genetic ribotyping • Sources from Fine Particulates Eroded/Transported to Beach Face Causing Violations
o Based upon direct measurements of contamination associated with particles and eelgrass beds, documentation of fine particulate erosion, tidal condition correlations with violations
o Seawater extracts of sand generally low in bacteria • Low Water Circulation at Beach Face, Clean Water Just Offshore
o Based on hydrodynamic modeling, field current and dye studies, field tests of circulation pump induced circulation/mixing & reduced bacteria at beach
These findings include two fundamental results as follows:
• The offshore Outer Harbor waters are clean except during storm events and return to good water
quality in a few days following a storm. Outer Harbor waters presently are close to meeting new TMDL requirements. Thus sources local to the beach account for frequent violations. It is not necessary to fix the whole Harbor and distant drainages or other City sources in order to address reductions at Inner Cabrillo Beach. Furthermore, potential sources local to Inner Cabrillo Beach are of the size and nature that are amenable to practical solutions using proven technology.
• Multiple local sources and causes were found at
Inner Cabrillo Beach, including leaking sewers, defective storm drains, heavy bird and other animal use, very restricted circulation at the beach face, and heavy eelgrass beds in the swim area and immediately adjacent to the beach face.
Figure 6. Eelgrass Bed in Swim Area
Extending from -1 Ft MLLW just off the Beach Face.

6
Interim Actions and Results Previously in 2000 a partial bird exclusion structure was installed on Inner Cabrillo Beach. This action resulted in an apparent reduction of bacterial exceedances at CB02 but not sufficient to meet health and TMDL requirements. The Port of Los Angeles implemented a project completed in June 2004 to fix the leaky sanitary sewers and defective storm drain local to the south end of Inner Cabrillo Beach. Subsequent beach monitoring data response was confounded by a water main break up on Stephen White Drive that apparently raised contamination at Figure 7. Construction on Sewer Repairs. CB02 by an order of magnitude, followed by a winter of record rains. The following 2005 dry season exceedances were low comparable to previous best years but did not approach zero days as required. Wet season violations also continue at an excessive frequency indicating remaining bacterial sources are still effective in causing water quality violations. Summary of Recommended Project Alternatives Project findings summarized above show that contamination of Inner Cabrillo Beach is mostly caused by sources local to the beach and not from the Harbor, except for a few days surrounding major storm events. Multiple local sources and mechanisms of contamination were found at Inner Cabrillo Beach likely causing water quality violations at the CB02 beach monitoring site. Interim measures of partial bird exclusion from the immediate area of CB02 on the southern part of the beach and of fixing local leaking sanitary and storm sewers in the south corner of the beach resulted in improvement but did not result in approaching public health and TMDL requirements.
Figure 8. Weekend Use of Inner Cabrillo Beach.

7
Project alternatives designed to reduce and eliminate exceedances of bacterial water quality standards at Inner Cabrillo Beach have been formulated and prioritized. These alternatives should be implemented in stages, with the easiest and/or likely more productive alternatives implemented early followed by monitoring of beach performance. Subsequent project alternatives can be implemented later. Recommended project alternatives are as follows with more detailed project descriptions and evaluations included within this document: • Redesign/Extend Bird Exclusion Structure
o Extend over entire beach o Use esthetic design with minimum poles o Design/implement bird protection or cleanup system for picnic tables
• Make Remaining Repairs of Sanitary Sewer System o Remove/block old sewer outfall from bluff o Test/repair sanitary sewers on Stephen White Drive in San Pedro
• Divert Stormwater Discharges From Beach o Remove stormwater sewer from beach, discharge to ocean east of offshore groin
• Re-contour Beach to Prevent Flooding and Promote Drainage o Raise elevation to +9 feet o Replace sand to promote drainage
• Clean and Deepen Immediate Nearshore Area to Promote Mixing, Prevent Routine Erosion of Fines/Enhance Swimming Area o Develop eelgrass management plan o Remove and mitigate eelgrass - immediate inshore area only o Deepen immediate area, add coarse sand
• Develop Beach Management Plan o Plan for control of mammals (cats, racoons, etc.) o Sand management plan to include sand along breakwater
• Circulation Enhancement Methods o Artificial circulation enhancement system o Structural modifications/shoreline reconfiguration
Project staging probably would be as follows with expected levels of CEQA documentation: CEQA Level Initial Stage. • Extend/rebuild bird exclusion structure MND • Repair sanitary systems E • Re-contour beach MND Intermediate Stage. • Clean/deepen nearshore MND • Implement beach management plan MND • Divert storm sewer(s) MND or EIR/EIS Additional Stage. • Circulation enhancement MND or EIR/EIS E - Exempt; MND - Mitigated Negative Declaration, EIR/EIS - Full Environmental Impact Reports This Volume I - Summary Report briefly presents and synthesizes the study findings and recommendations. More detailed information is presented Volume II – Technical Appendices. In addition, these reports are provided on a CD along with a second CD with video presentations of Inner and Outer Cabrillo Beach underwater habitats.
8
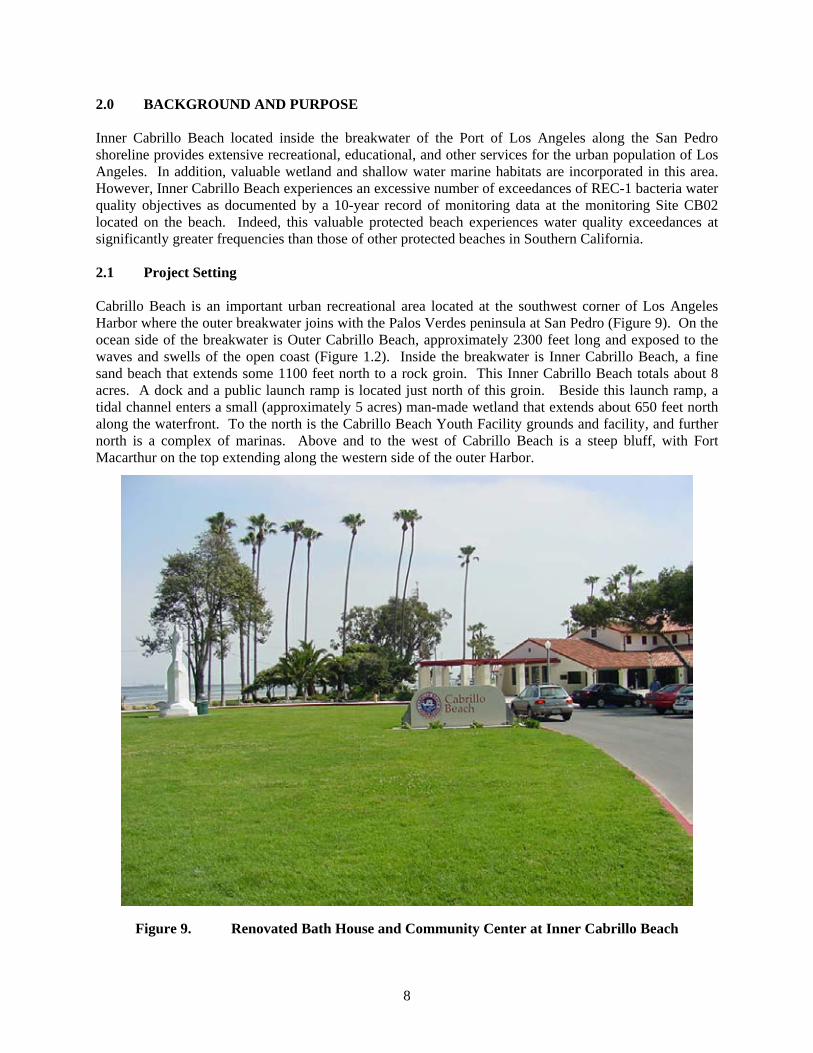
2.0 BACKGROUND AND PURPOSE Inner Cabrillo Beach located inside the breakwater of the Port of Los Angeles along the San Pedro shoreline provides extensive recreational, educational, and other services for the urban population of Los Angeles. In addition, valuable wetland and shallow water marine habitats are incorporated in this area. However, Inner Cabrillo Beach experiences an excessive number of exceedances of REC-1 bacteria water quality objectives as documented by a 10-year record of monitoring data at the monitoring Site CB02 located on the beach. Indeed, this valuable protected beach experiences water quality exceedances at significantly greater frequencies than those of other protected beaches in Southern California. 2.1 Project Setting Cabrillo Beach is an important urban recreational area located at the southwest corner of Los Angeles Harbor where the outer breakwater joins with the Palos Verdes peninsula at San Pedro (Figure 9). On the ocean side of the breakwater is Outer Cabrillo Beach, approximately 2300 feet long and exposed to the waves and swells of the open coast (Figure 1.2). Inside the breakwater is Inner Cabrillo Beach, a fine sand beach that extends some 1100 feet north to a rock groin. This Inner Cabrillo Beach totals about 8 acres. A dock and a public launch ramp is located just north of this groin. Beside this launch ramp, a tidal channel enters a small (approximately 5 acres) man-made wetland that extends about 650 feet north along the waterfront. To the north is the Cabrillo Beach Youth Facility grounds and facility, and further north is a complex of marinas. Above and to the west of Cabrillo Beach is a steep bluff, with Fort Macarthur on the top extending along the western side of the outer Harbor.
Figure 9. Renovated Bath House and Community Center at Inner Cabrillo Beach

9
To the east of Inner Cabrillo Beach is the Cabrillo Beach Fishing Pier inside of the breakwater. A rock groin extends offshore on the ocean side to protect Outer Cabrillo Beach. A thin sand beach now accreting exists along the inside of the rock breakwater, usable at lower tide conditions. A Shallow Water Habitat was constructed within the Outer Harbor adjacent to this area as part of the Pier 400 and Channel Deepening projects. Cabrillo Beach offers a protected sand beach for swimming, with personal watercraft also allowed to land at the northern end. Picnic areas, barbeque grills, volleyball courts and a playground area for children is provided. A free public boat launch ramp and a dock is provided at the northern end of the Inner Beach, separated from the sand beach by the rock groin structure. The launch ramp supports small boat recreation in and out of the harbor. Personal watercraft recreation is also very popular in this area. Because of the strong diurnal winds that come over the Palos Verdes peninsula many afternoons, wind surfing is very popular at Cabrillo Beach, both within the breakwater and offshore in the area of Outer Cabrillo Beach. Outer Cabrillo Beach also offers rocky habitat associated with the breakwater itself and with the adjacent rocky peninsula, making it popular for diving activities. Just offshore of Inner Cabrillo Beach, the soft bottom supports beds of eelgrass that extend up the entire western side of the Outer Harbor, with some kelp further offshore along the inner breakwater. The Cabrillo Marine Aquarium is also located near the shore at Cabrillo Beach. The Aquarium is a facility of the City of Los Angeles Department of Recreation and Parks. It was built as an educational, recreational, and research facility devoted to encouraging active public participation to promote knowledge and conservation of the marine life of Southern California. Educational visits by bus loads of school children is a prominent activity at the museum and the adjacent Cabrillo Beach facilities. Beach resources at the Outer Cabrillo Beach, the rocky shore of the Point Fermin Marine Life Refuge, the nearby fossil rich cliffs, the salt marsh, fishing pier, and the sand of Inner Cabrillo Beach, are all accessible educational resources for both school classes and for the general public. The old Cabrillo Beach Bathhouse has recently been restored serve beach use and to furnish a public facility for community meetings and events. This Mediterranean style structure built in 1932 supported early use of Cabrillo Beach. 2.2 Project Purpose The purpose of this project was to investigate sources of bacterial contamination causing the excessive number of exceedances of water quality objectives at Inner Cabrillo Beach. Specifically these studies were designed to examine the question of whether the contamination was caused by sources elsewhere in the Harbor or was from sources local to the beach. In addition, recommendations for possible corrective actions were to be developed. The present Inner Cabrillo Beach Water Quality Improvement Project was funded under a State of California Clean Beaches Initiative Grant and by the Port of Los Angeles. This project was also an opportunity to cooperate with other Port of Los Angeles and the U.S. Army Corps of Engineers studies underway associated with documenting changes in Harbor circulation associated with ongoing infrastructural projects within the Port, including the Channel Deepening Project.

10
3.0 INITIAL ANALYSIS OF BACTERIAL MONITORING DATA AT INNER CABRILLO BEACH 3.1 Introduction and Purpose Existing and continuing bacterial monitoring data for Inner Cabrillo Beach were analyzed for the purposes of determining the degree of compliance with standards and to examine the data for possible causative relationships. Results of analyses of continuing bacterial monitoring data to document beach responses to external influences and interim corrective actions taken by the City and the Port of Los Angeles are discussed below. The County of Los Angeles, Department of Health Services has the beach posted with warning signs if bacteria levels exceed State water quality standards (Figure 10). The signs remain posted until testing reveals that bacteria levels meet State standards. Bacterial monitoring has been done daily at Inner Cabrillo Beach from late 1994 to the summer of 2005 when monitoring frequency was changed to 5 days per week. Monitoring is carried out by the City of Los Angeles, Bureau of Sanitation. Samples at Inner Cabrillo Beach are taken in the swash zone at a designated monitoring site CB02 in front of the Lifeguard Stand on the southern half of the beach. Other nearby monitoring sites include CB01 located at the launch ramp just to the north of the beach, and S7 located on Outer Cabrillo Beach and monitored by the County of Los Angeles (Figure 11). The City of Los Angeles also monitors Harbor waters on an approximate bi-weekly schedule, with the nearest stations (Figure 12) located at the mouth of the West Channel to the north (H29) and offshore Inner Cabrillo Beach (H49). Other beach monitoring sites within the Los Angeles/Long Beach Harbor and within Alamitos Bay for which monitoring data are available are also shown in Figures 11 and 12. Figure 10. Warning Sign Posted on Beach 3.2 Bacterial Standards The California Code of Regulations, Title 17 sets state ocean water standards for healthfulness and safety of ocean water contact sports areas. The protective bacteriological water quality objectives for Inner Cabrillo Beach are those for REC-1 (Water Contact) Beneficial Uses of Marine Waters. These objectives apply to water samples taken at the beach as well as to Harbor waters. For monitoring of the beach, water samples are to be taken in ankle- to knee-deep water, approximately 4 to 24 inches below the water surface adjacent to the public beach. These water quality objectives are shown in Table 1 as follows: Table 1. Bacterial Water Quality Objectives (REC-1) 30 Day Geometric Mean Limits Single Sample Limits Total Coliform 1,000 10,000 or 1,000 if FC/TC > 0.1 Fecal Coliform 200 400 Enterococcus 35 104

11
Figure 11. Bacterial Monitoring Stations at Inner Cabrillo Beach and Los Angeles/Long Beach Harbor
Figure 12. Bacterial Monitoring Stations in Alamitos Bay

12
Beneficial use classifications for Los Angeles Harbor waters listed in the Basin Plan (LARWQCB, 1994) include the REC-1 (Water Contact) Beneficial Uses of Marine Waters. Additionally, Los Angeles Harbor has been listed by the State Water Resources Control Board as an impaired water body for bacteria under Section 303d of the Clean Water Act, with the Main Channel and Inner Cabrillo Beach (both Northern Area by Wetland/Youth Facility and southern recreational beach). Subsequently, a Bacterial Total Maximum Daily Load (TMDL) action was developed by the Los Angeles Regional Water Quality Control Board (LARWQCB, 2004) that amends the Basin Plan to include requirements to identify and reduce bacterial sources. Specifically, this TMDL Amendment sets specific performance standards for Inner Cabrillo Beach in the form of the number of days of exceedances of REC-1 water quality objectives that will be allowed at the monitoring site (CB02) located on the beach, along with a required schedule for compliance. Briefly, these requirements are as follows in Table 2:
Table 2. TMDL Allowed Exceedances at Inner Cabrillo Beach CB02
Number of Allowed Exceedance Days
Year of Compliance
Summer Dry Period 0 2010 Winter Dry Period 3 2010
Wet Weather 17 2010
3.3 Exceedances of Bacterial Objectives at Inner Cabrillo Beach The primary sources of historical water quality data for the Los Angeles and Long Beach Harbor area consisted of monitoring data provided by the City of Los Angeles, Bureau of Sanitation (Ms. Farhana Mohamed, Ms. Ann Dalkey, and Mr. Ronald Cressey). Additional data were also provided by the Los Angeles County Sanitation District (Joe Meistrell and Alex Steele), the City of Long Beach Environmental Health (Mae Nikaido). Additional data were provided by the Cabrillo Marine Aquarium (Linda Chilton) and the Southern California Marine Institute (Kerry Flaherty). A brief survey of bacteria levels at outfall locations within the Port of Los Angeles also provided information on contributions from upstream dry weather discharges (LARWQCB and SCCWRP, 2004). 3.3.1 Frequency of Exceedances A plot of the percent of the time that bacterial exceedances have occurred in the 1994-2003 historical bacteria monitoring record is shown in Figure 13 for the monitoring site CB02 on Inner Cabrillo Beach and for other nearby monitoring sites. For clarity, the percent exceedance data have been averaged by week to reduce clutter. The percent violations at Site CB02 on Inner Cabrillo Beach have been high and continuing since the record began late in 1994, always above 20% of the time at best and reaching 80-95% of the time in some wet seasons. Since 2000 extremes have been from about 15% to around 60% of the time. From more detailed plots (Technical Appendix A) it was obvious from raw data plots that enterococcus and fecal coliform cause most violations. Though a seasonal signal exists in the data, dry weather violations are also common. The percent of the time that violations occur at CB02 was far and above that shown by any of the comparable local beach stations, with the exception of a temporary monitoring Site CBE (when data available) which was also located on Inner Cabrillo Beach (northern part of the beach). Site CB01 located at the launch ramp and separated from Inner Cabrillo Beach by the rock groin, was noticeably lower in total violations but still showed a significant number. In contrast, the nearby open ocean beach site (S7) at Outer Cabrillo Beach showed few violations.

13
Total Violations By Station
0
10
20
30
40
50
60
70
80
90
100
Jan-94 Jan-95 Jan-96 Jan-97 Jan-98 Jan-99 Jan-00 Jan-01 Jan-02 Jan-03
Date (Monthly)
Perc
entV
iola
tions
CBE Total Violations
CB02 Total Violations
CB01 Total Violations
S7 Total Violations
Wet Wet WetWet WetWet WetWetWetWet
Bird Exclusion(From September 19, 2000)
Figure 13. Comparison of Percent of the Time Exceedances Occur at Cabrillo Beach Shoreline
Sites. CB01 - Launch Ramp, CB02 and CBE on Inner Cabrillo Beach, S7 - Outer Cabrillo Beach.
Plots of the same data expressed as percentage of the time that bacterial exceedances exist at Inner Cabrillo Beach are compared to the data for other protected beaches in nearby Long Beach (Figure 14). One site selected for comparison was B-29, a protected, fine sand beach with similar use located within Alamitos Bay, an area of restricted circulation (Figure 12). A second site was B6 (Figure 11 located east of Queensway in Long Beach. This long sand beach (parallel to Ocean Boulevard) is also within the protected Harbor breakwater, has numerous storm drain discharges, is close to the discharge of the Los Angeles River, and sustains similar urban beach use. Site B-29 within Alamitos Bay has been studied as part of the City of Long Beach's Storm Water Monitoring Program (Kinnetic Laboratories, 2002). Violations at this protected beach were almost all directly related to rain events, with practically no violations in the dry season, both before and after installations of a dry weather diversion project. Another similar protected beach is Marina Beach located in the upper end of Marina del Rey Harbor that has also been studied recently (Kinnetic Laboratories, 2004). This protected beach normally has only a few violations during the dry season, though stormwater drainages cause frequent wet season violations. Data from inland comparison beaches is in contrast to that of the data for CB02 at Inner Cabrillo Beach. Again, these results would tend to indicate a local source at Cabrillo Beach to explain the differences in violations, particularly in the dry weather period.

14
Total Violations By Station
0
10
20
30
40
50
60
70
80
90
100
Jan-94 Jan-95 Jan-96 Jan-97 Jan-98 Jan-99 Jan-00 Jan-01 Jan-02 Jan-03
Date (Monthly)
Perc
entV
iola
tions
B6 Total Violations
B29 Total Violations
S7 Total Violations
Wet Wet WetWet WetWet WetWetWetWet
Bird Exclusion(From September 19, 2000)
Figure 14. Percent of the Time Exceedances Occur at Other Protected Beaches, B6 - Long
Beach and B29 - Alamitos Bay. 3.3.2 Reductions Required Analyses of these data reveal that large reductions will be required in bacterial exceedances at CB02 in order to make the beach safe and to meet new TMDL regulatory requirements. Based upon the historical monitoring data, the approximate average days of exceedances per year based upon single sample criteria are tabulated below (Table 3) and illustrate the number of days per year that exceedances need to be reduced. Thus using the approximate 10 year monitoring record, about 166 days of exceedances must be reduced by some 146 days, including zero violations during the dry season.
Table 3. Average Single Sample and Allowable Bacterial Exceedance Days Expressed as Daily Sampling.
SUMMER DRY WEATHER WINTER DRY WEATHER WET WEATHER1
April 1 – October 31 November 1 – March 31 November 1 – October 31
STATION LOCATION TMDL (# days)
Current (# days)
TMDL (# days)
Current (# days)
TMDL (# days)
Current (# days)
CB012 Cabrillo Beach Boat Ramp 0 12.8 3 8.9 17 20.7
CB022 Cabrillo Beach Lifeguard Stand 0 73.1 3 51.1 17 41.9
HW293 Yacht Basin Entrance 0 1.4 3 0.7 15 13.0
HW493 Offshore Cabrillo Beach 0 0 3 2.0 15 15.0
Bolded, italicized values indicate sites and seasons where TMDL goals are currently met. Red Values indicate current exceedances onInner Cabrillo Beach. 1 Wet weather based upon Los Angeles Airport rain gauge. 2 Exceedance calculations for CB01 and CB02 were based upon sampling records from 1995 through May 2005. 3 Exceedance calculations for HW29 and HW49 were based upon 7.5-year record from November 1996 through March 2005. Calendar year 1998 removed to avoid bias since only fecal coliform was monitored. Weekly sampling data were scaled up to estimate daily esceedances.

15
Table 4 shows additional information expressed as the percent of the time that exceedances of water quality objectives occur at CB02 for the period before and after 2000. If the 30-Day Geometric Mean criteria are also included, the percent of time that exceedances occur is in the range of 78-95%. A bird exclusion structure was emplaced on the southern part of Inner Cabrillo Beach late in 2000. The effects of this structure are more fully discussed in Section 6 below. Nevertheless, large reductions in the number of water quality exceedances at CB02 are still needed. Figure 15 shows that for only some years in late summer is the 30-day geometric mean for enterococcus below the 35/100 ml. water quality objective.
Table 4. Percentage Exceedances of Water Quality Objectives. Percent of Time that Exceedances Occur at CB02
Period Single Sample Criteria
(percent)
Single and 30-Day GeoMeans Sample Criteria
(percent) 1995-2000 1 54.0 95.6 2000-2005 1,2 37.4 78.3 Combined 46.6 87.9
1 Dividing date is 9/15/2000, the approximate date of the installation of the bird exclusion zone. 2 2005 data ends at 09/15/05.
Figure 15. Enterococcus Monthly Averaged Single Sample and 30-Day Geometric Mean Data.
Cabrillo Beach Shoreline Station CB2 Monthly Averaged Enterococcus Single Sample Dataand Running 30-Day Geometric Means.
July 1994 to October 2005.
1
100
10000
Jul
Aug
Sep
Oct
Nov
Dec
Jan
Feb
Mar
Apr
May
Jun
Jul
Aug
Sep
Oct
Nov
Dec
Jan
Feb
Mar
Apr
May
Jun
Jul
Aug
Sep
Oct
Nov
Dec
Jan
Feb
Mar
Apr
May
Jun
Jul
Aug
Sep
Oct
Nov
Dec
Jan
Feb
Mar
Apr
May
Jun
Jul
Aug
Sep
Oct
Nov
Dec
Jan
Feb
Mar
Apr
May
Jun
Jul
Aug
Sep
Oct
Nov
Dec
Jan
Feb
Mar
Apr
May
Jun
Jul
Aug
Sep
Oct
Nov
Dec
Jan
Feb
Mar
Apr
May
Jun
Jul
Aug
Sep
Oct
Nov
Dec
Jan
Feb
Mar
Apr
May
Jun
Jul
Aug
Sep
Oct
Nov
Dec
Jan
Feb
Mar
Apr
May
Jun
Jul
Aug
Sep
Oct
Nov
Dec
Jan
Feb
Mar
Apr
May
Jun
Jul
Aug
Sep
Oct
Nov
Dec
Jan
Feb
Mar
Apr
May
Jun
Jul
Aug
Sep
Oct
1994 1995 1996 1997 1998 1999 2000 2001 2002 2003 2004 2005
Year and Month (1994 to 2005)
Ente
roco
ccus
CFU
/ 10
0 m
L
Monthly Averaged Daily Values Averaged 30-Day Geometric MeanGeometric Mean Exceedance Level (35 CFU/ 100mL) Single Sample Exceedance Level (104 CFU /100mL)

16
3.4 Conclusions from Analyses of Inner Cabrillo Beach Monitoring Data Using historic beach bacterial monitoring data, the following conclusions may be reached: Analyses of Historic Data
• Inner Cabrillo Beach has a 10-year record of excessive bacterial water quality violations measured at the City of Los Angeles, Bureau of Sanitation beach monitoring Station CB02 located in front of the Lifeguard Stand on Inner Cabrillo Beach.
• Single sample exceedances indicator bacteria show a seasonal signal, but violations during both the winter (wet season) and summer (dry season) occur frequently. These violations occur frequently during rainy days, but also very frequently during dry days.
• Most single sample violations are caused by high levels of fecal coliform or E. coli and most often by enterococcus.
• Violations at CB02 occur much more frequently at Inner Cabrillo Beach than at other similarly protected urban beaches, such as Marina del Rey or Long Beach or Alamitos Bay beaches where dry weather violations are generally rare. Violations on the ocean side of the breakwater at Outer Cabrillo Beach are not a problem.
• Statistical analyses of the historical record at CB02 showed that violations based on single sample criteria occurred 48% of the time, 60% of the time in the wet season and 40% of the time in the dry season. In contrast, violations at CB01 located just to the north of the groin near the mouth of the wetland occurred 11% of the time, 17% of the time in the wet season and 7% of the time in the dry season. Violations on the ocean side of the breakwater were not a problem.
• 30-Day running geometric means of indicator bacteria result in almost continuous violations at CB02.
• Statistical contingency tests of the historic data showed the expected rain event causes of violations, tidal range influences, and slight associations with easterly or higher winds. This information did not help greatly in identifying a specific cause unique to Inner Cabrillo Beach violations.
• The uniquely high and persistent violations at CB02 are indicative of very local sources of contamination at the beach.
17
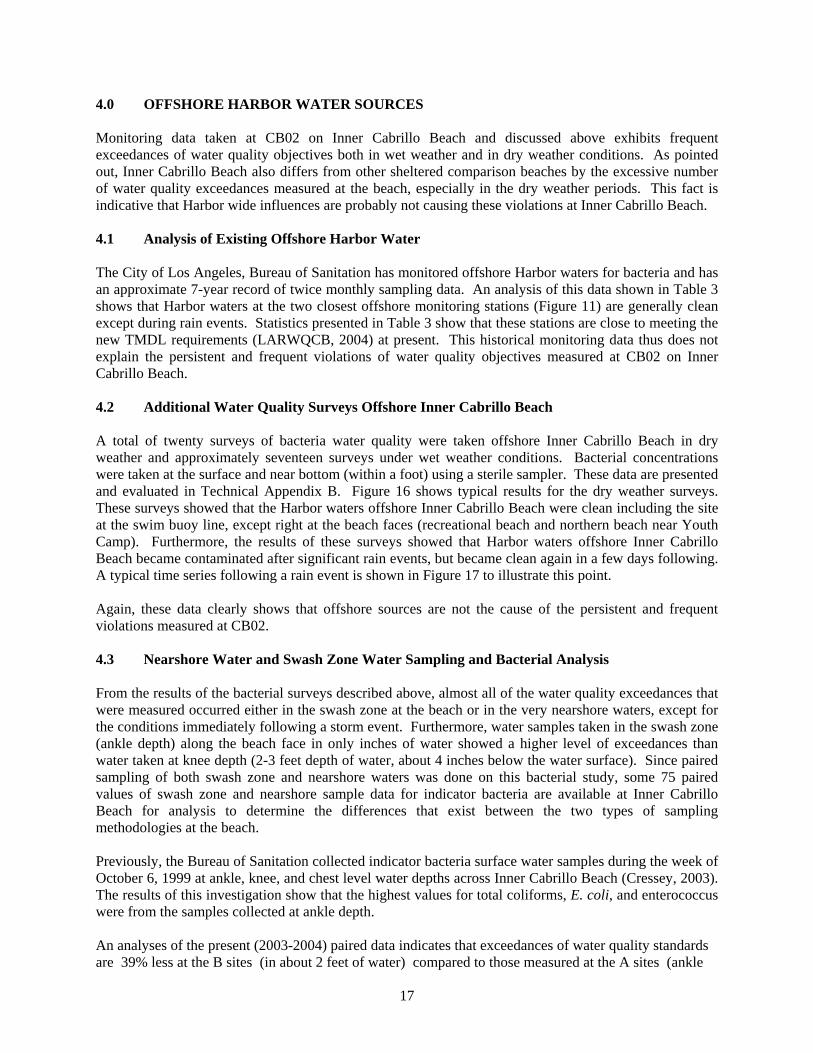
4.0 OFFSHORE HARBOR WATER SOURCES Monitoring data taken at CB02 on Inner Cabrillo Beach and discussed above exhibits frequent exceedances of water quality objectives both in wet weather and in dry weather conditions. As pointed out, Inner Cabrillo Beach also differs from other sheltered comparison beaches by the excessive number of water quality exceedances measured at the beach, especially in the dry weather periods. This fact is indicative that Harbor wide influences are probably not causing these violations at Inner Cabrillo Beach. 4.1 Analysis of Existing Offshore Harbor Water The City of Los Angeles, Bureau of Sanitation has monitored offshore Harbor waters for bacteria and has an approximate 7-year record of twice monthly sampling data. An analysis of this data shown in Table 3 shows that Harbor waters at the two closest offshore monitoring stations (Figure 11) are generally clean except during rain events. Statistics presented in Table 3 show that these stations are close to meeting the new TMDL requirements (LARWQCB, 2004) at present. This historical monitoring data thus does not explain the persistent and frequent violations of water quality objectives measured at CB02 on Inner Cabrillo Beach. 4.2 Additional Water Quality Surveys Offshore Inner Cabrillo Beach A total of twenty surveys of bacteria water quality were taken offshore Inner Cabrillo Beach in dry weather and approximately seventeen surveys under wet weather conditions. Bacterial concentrations were taken at the surface and near bottom (within a foot) using a sterile sampler. These data are presented and evaluated in Technical Appendix B. Figure 16 shows typical results for the dry weather surveys. These surveys showed that the Harbor waters offshore Inner Cabrillo Beach were clean including the site at the swim buoy line, except right at the beach faces (recreational beach and northern beach near Youth Camp). Furthermore, the results of these surveys showed that Harbor waters offshore Inner Cabrillo Beach became contaminated after significant rain events, but became clean again in a few days following. A typical time series following a rain event is shown in Figure 17 to illustrate this point. Again, these data clearly shows that offshore sources are not the cause of the persistent and frequent violations measured at CB02. 4.3 Nearshore Water and Swash Zone Water Sampling and Bacterial Analysis From the results of the bacterial surveys described above, almost all of the water quality exceedances that were measured occurred either in the swash zone at the beach or in the very nearshore waters, except for the conditions immediately following a storm event. Furthermore, water samples taken in the swash zone (ankle depth) along the beach face in only inches of water showed a higher level of exceedances than water taken at knee depth (2-3 feet depth of water, about 4 inches below the water surface). Since paired sampling of both swash zone and nearshore waters was done on this bacterial study, some 75 paired values of swash zone and nearshore sample data for indicator bacteria are available at Inner Cabrillo Beach for analysis to determine the differences that exist between the two types of sampling methodologies at the beach. Previously, the Bureau of Sanitation collected indicator bacteria surface water samples during the week of October 6, 1999 at ankle, knee, and chest level water depths across Inner Cabrillo Beach (Cressey, 2003). The results of this investigation show that the highest values for total coliforms, E. coli, and enterococcus were from the samples collected at ankle depth. An analyses of the present (2003-2004) paired data indicates that exceedances of water quality standards are 39% less at the B sites (in about 2 feet of water) compared to those measured at the A sites (ankle

18
INNER CABRILLO BEACH OFFSHORE BACTERIAL SURVEYS
TWENTY SURVEYS IN DRY WEATHER CONDITIONS, JUNE 2003 TO OCTOBER 2004 Figure 16. Typical Results of Dry Weather Bacterial Surveys Offshore Inner Cabrillo Beach

19
STORM SERIES - ENTEROCOCCUS
SEVENTEEN WET WEATHER SURVEYS
Figure 17. Typical Response of Offshore Stations to a Storm Event

20
1 10 100 1000 10000Enterococcus - A
1
10
100
1000
10000
Ente
roco
ccus
- B
deep, beach swash zone). In this data set, violations occurred at the A sites 48% of the time while only 29% of the time at the B sites. From this data set, bacterial concentrations are highest in the swash zone, drop just off the beach in two feet of water depth, and are very low at the station offshore by the swim buoys except for immediately after a rain event. A plot of the results for B sites versus A sites for enterococcus is shown in Figure 18. Enterococcus concentrations are routinely lower at B, but if B is greater than 104/100 ml it does not really matter. However, the lower right hand box is most important since it indicates violations at A but not at B. The City Bureau of Sanitation monitors Inner Cabrillo Beach in a manner consistent with procedures used on all beaches, which is to sample in ankle deep water. Guidance on methods to be used is in AB411, codified in California Code of Regulations (CCR) Title 17 Public Health, Division 1 State Department of Health Services, Chapter 5 Sanitation (Environmental), SubChapter 1 Engineering (Sanitary), Group 10. Sanitation, Healthfulness and Safety of Public Beaches and Ocean Water-Contact Sports Areas. Section 7961(b) includes appropriate sampling depths for waters adjacent to public beaches. It states that samples should be taken from just below the water surface, in ankle- to knee-depth water, approximately 4- to 24- inches deep. The California Department of Health Services Saltwater Beaches Guidance (Draft) (http://www.dhs.ca.gov/ps/ddwem/beaches/saltwater.htm) for sampling under this regulation differs slightly. This guidance indicates that samples should be taken from just below the water surface, in ankle- to knee-depth water, approximately 12 to 24 inches deep. 4.4 Conclusions on Offshore Sources of Contamination to Inner Cabrillo Beach Specific findings from the historical routine monitoring data and from 36 sampling episodes of Inner Cabrillo Beach waters are as follows: • Except in the surf zone, exceedances of public health criteria (REC-1 Standards) are infrequent in
Los Angeles Outer Harbor waters during the dry season and during dry winter periods. • Indicator bacteria are elevated throughout the near shore waters of Inner Cabrillo Beach after
significant rain events, especially along the beach. These numbers are usually reduced substantially within two to four days after a significant storm event with greater persistence occurring in the swash zone of Inner Cabrillo Beach.
• Bacteria concentrations are greater in the swash zone (ankle deep water) than at two-feet depth along the beach (39% less) and are very low at the outer swim buoy line except immediately after a storm event. In general, bacterial concentrations are lower at the monitoring point in front of the lifeguard stand (CB02) than at the northern beach (CBE) or in
• Enterococcus concentrations are the chief cause of exceedances of public health criteria. • The general level of indicator bacteria present in the Harbor waters do not explain frequent
exceedances measured at the swash zone of Inner Cabrillo Beach, except during storm events when stormwater discharges are present. Therefore, most bacterial exceedances are from a beach source rather than from elsewhere in the Harbor.
Figure 18. Enterococcus Measured in the Swash Zone (A) versus in Two Feet of Water (B).
21
5.0 INSHORE CIRCULATION AND HYDRODYNAMIC RESULTS Circulation by Harbor currents at the beach face of Inner Cabrillo Beach is an important variable with respect to bacterial violations measured at the beach. This is particularly important since offshore water quality data indicate that Harbor waters are generally clean except for a few days after a storm event, in contrast to data on frequent bacterial exceedances measured at the beach face. Hydrodynamic modeling and field circulation studies have been carried out in the western Harbor by the U.S. Army Corps of Engineers Waterways Experiment Station (WES). Further nearshore and swash zone field and modeling studies have been carried out by this project to delineate circulation at the beach face. Also, it was desired to evaluate the possibility of the use of a nearshore circulation pump(s) to improve mixing and circulation with clean water from just offshore the beach. Work tasks investigating inshore circulation and hydrodynamics at Inner Cabrillo Beach include the following:
• Early U.S. Army Corps of Engineers modeling and field studies in the Western Harbor, • Field dye study of tidal discharge from the wetland located north of Inner Cabrillo Beach, • Beach face dye investigations at Inner Cabrillo Beach, • Nearshore hydrodynamic modeling of beach face circulation, • Field studies for model calibration and of circulation pump effects.
5.1 Initial U.S. Army Corps of Engineers Study Results Early hydrodynamic modeling efforts by the U. S. Corps of Engineering were associated with the design of the Upper Harbor Channel Deepening Project along with the design of the Shallow Water Habitat in the Outer Harbor. Results of these design modeling efforts supported the conclusions that circulation in the western Harbor in the area of Cabrillo Beach would not be significantly affected by the Deepening Project even though currents further out in the Harbor in the channels would be strengthened. Expanding the Shallow Water Habitat was also predicted to have no significant impact on water circulation and water quality in the inshore areas of the western Outer Harbor (USACE, 1990). Preliminary considerations of improving circulation in the western Harbor, such as by an opening in the breakwater was noted to also have negative impacts. These negative impacts include beach and breakwater erosion, bottom erosion, habitat changes, and a larger wave climate at the swimming area (USACE, 2002). Field studies by the U. S. Army Corps of Engineers using dye tracers and moored current meters were carried out during the period of September 12-16, 2002, and with moored meters again emplaced during the period of July 22 - October 8, 2003 (U. S. Army Engineer District, Los Angeles and U. S. Army Engineer Research & Development Center/Evans Hamilton 2003; 2004). With reference to Figure 19, currents under no wind conditions were tidally dominated and slow, averaging 4 cm/sec or less moving in and out of the western Harbor. However, during the predominate daily westerly wind conditions, a two layer circulation develops where bottom waters are directed westward toward the shorelines, the surface currents are directed northeastward, and upwelling of the bottom waters into the surface waters occurs along the shoreline (Figure 20). This two layer circulation persists regardless of the tide stage of flood or ebb. The results of the over two month deployment in July-October 2003 confirmed this two-layer wind driven flow is a consistent feature driven by the predominate southwesterly diurnal winds. Photographs taken during the dye and current meter study carried out by the USACE show that continuously pumped dye moved offshore with the surface layer (Figure 21). At the same time, dye was transported to the Inner Cabrillo Beach face by the bottom return current (Figure 21) dramatically illustrating the circulation in this inshore area that was depicted in Figure 20.

22
Figure 19. Flood and Ebb Currents in Western Harbor Under No Wind Conditions (USACE/Evans Hamilton, 2003).
Figure 20. Two Layer Flow Under Predominate West Wind Conditions (USACE/Evans
Hamilton, 2003).

23
Figure 21. U.S. Corps of Engineers Dye Plume Under Predominate West Winds Inner Cabrillo
Beach, 15 September 2002. Surface Layer Dye Plume Moves Offshore (top) and Transported to Beach by Bottom Countercurrent (bottom).

24
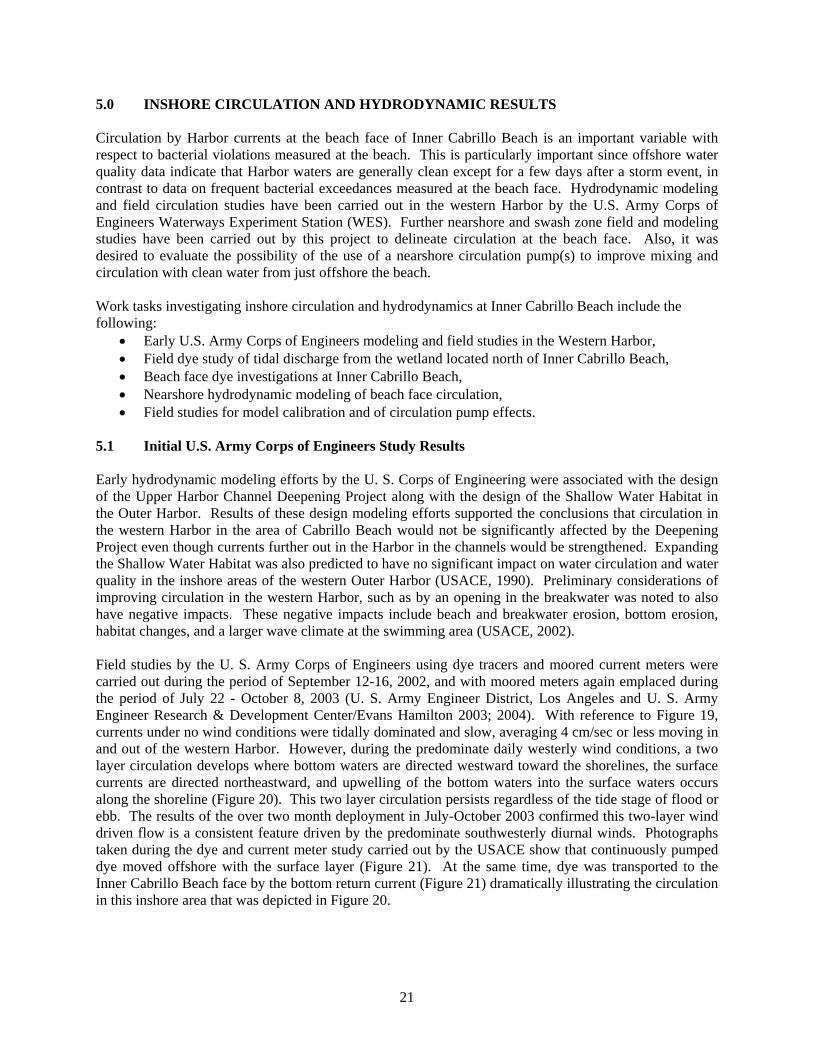
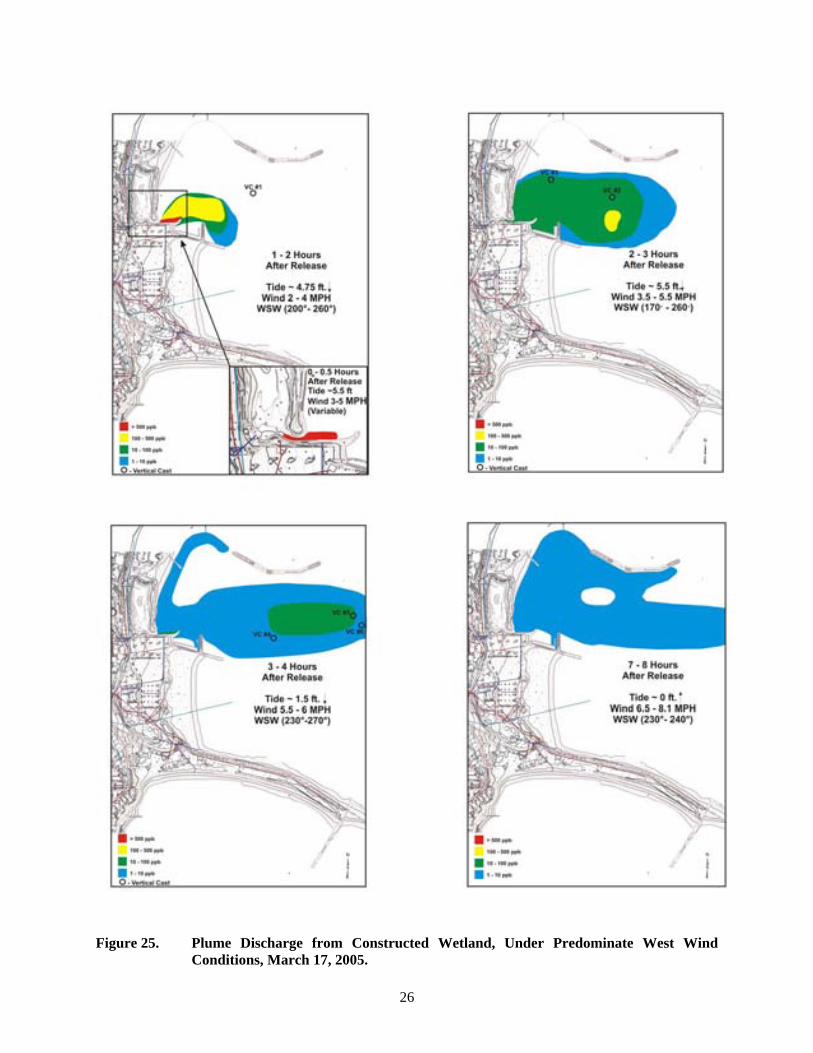
5.2 Field Dye Study of Discharge from Wetland Another dye study was done under this present Clean Beaches Initiative program that traced the tidal discharge from the constructed wetland located just to the north of Inner Cabrillo Beach starting with an early morning high tide condition. Dye concentrations were determined as a function of depth and position by a pumped fluorometer from a survey boat. The plume was also traced by aerial photography using a small, remote controlled airplane (Figure 22). Two liters of Rhodamine WT dye were placed within the constructed wetland (Figure 23) near the outlet at peak high tide at 07:00 March 17, 2004 (Figure 24). Winds were low initially, then building to about 12 mph from the southwest as the diurnal conditions developed. The results (Figure 25) showed that the dyed discharge plume moved to the northeast under predominant southwest winds, consistent with the circulation patterns identified by the U. S. Corps of Engineers field study (Figure 20). The dye plume was mostly confined to the surface layer of 0-3 feet, penetrating at lower concentrations in the far field to 5-6 feet later in the day as wind and ambient turbulence mixed the dye downward. This dye experiment demonstrated the offshore movement of the wetland discharge flows by wind driven surface currents under the predominate southwest diurnal wind conditions. A small detached plume on the nearby mudflat outside the wetland moved north in the wind shadow of the wetland groin towards the youth facility beach (Figure 25). 5.3 Field Dye Studies at Inner Cabrillo Beach Face Initial simple dye tracing was carried out for swash zone water at Inner Cabrillo Beach under low wind conditions that often exist early in the morning before and during beach monitoring. For these experiments, dye was placed on the northern beach swash zone using a watering can. Figure 26 illustrates the flow patterns and the lack of mixing along this beach face under such quiet conditions. These runs done on 27 August 2003, and an earlier experiment on 15 August under similar conditions, indicated that the dye could move slowly southward along the beach even against a few mile per hour south or southwest wind, before freshening westerly winds (~4 mph) moved the plume northward and out along the breakwater. Little mixing with waters just offshore was demonstrated. 5.4 Nearshore Hydrodynamic Modeling of Circulation To better quantify and study the inshore circulation, and to evaluate possible circulation enhancement options, a three-dimensional hydrodynamic model was applied to the Inner Cabrillo Beach nearshore area. Resource Management Associates RMA-10 and RMA-11 models were used which are finite element programs for hydrodynamics and water quality transport (King, 1998), originally developed for the U.S. Army Corps of Engineers Waterways Experiments Station. The three-dimensional model grid used is illustrated in Figure 27. This model was calibrated with the results of the U. S. Army Corps of Engineers field study results (USACE/Evans Hamilton 2003 and 2004). Figure 28 illustrates that nearshore currents at Inner Cabrillo Beach under no wind conditions are very low, tidal currents in the range of several hundredths of a knot (less than 0.02 m/sec) and less at the beach face. Bottom velocities were also low, with the particle tracer shown in Figure 28 illustrating little movement over a 15 hour time interval. With wind, the two layer flow regime is set up as illustrated in Figure 29 for the cases of a 5 knot southwest wind condition. The surface currents are increased substantially to about 0.04-0.05 m/s or almost 0.1 knot. Bottom water is brought into the beach. Figure 30 illustrates the movement of bottom water tracer particles that are brought into the beach, upwelled, and
Figure 22. Remote Controlled Airplane Equipped with Digital Camera.

25
Figure 23. Constructed Wetland Located just North of the Inner Cabrillo Beach Launch
Ramp.
Figure 24. Rhodamine Dye in the Inner Cabrillo Beach Wetland near the Outlet at 07:30,
March 17, 2004.
26
Figure 25. Plume Discharge from Constructed Wetland, Under Predominate West Wind
Conditions, March 17, 2005.

27
Figure 26. Dye Movement from Swash Zone in Nearshore Area Under Very Light Southwest Wind Conditions in Early Morning, 09:00
August 27, 2003, Wind 4 mph. 250-270 Degrees.
Swash Zone Dye Study

28
Figure 27. Three Dimensional Numerical Model Grid Showing Vector Velocities for Inner Cabrillo Beach Nearshore
Circulation Modeling, RMA-12 Model.
29
0.040 m/s
Peak Flood (Sep 16, 3:00)
0.040 m/s
Near High Tide (Sep 16, 6:00)
0.040 m/s
Peak Flood (Sep 16, 3:00)
0.040 m/s
Near High Tide (Sep 16, 6:00)Figure 28. Inner Cabrillo Beach Base Condition, 2 Knot Wind @ 240 deg. from North (Left). Inner Cabrillo Beach Currents,
No Wind. Red Traces Bottom Circulation Over 15 Hour Time Period (Right).

30
Figure 29. Base Condition, 5 Knot Wind @ 240 deg. from North.
Surface Near Bottom
0.040 m/s 0.040 m/s
Surface Near Bottom
0.040 m/s 0.040 m/s

31
2 Hours 4 Hours 6 Hours 8 Hours 9 Hours Figure 30. Movement of Nearshore Bottom Water, Inner Cabrillo Beach Currents, 5 Knot Wind @ 240 deg. from North.
0.050 m/s 0.050 m/s 0.050 m/s
0.050 m/s 0.050 m/s
Green Particle in Bottom Layer Blue Particle Upwelling Red Particle in Upper Layer

32
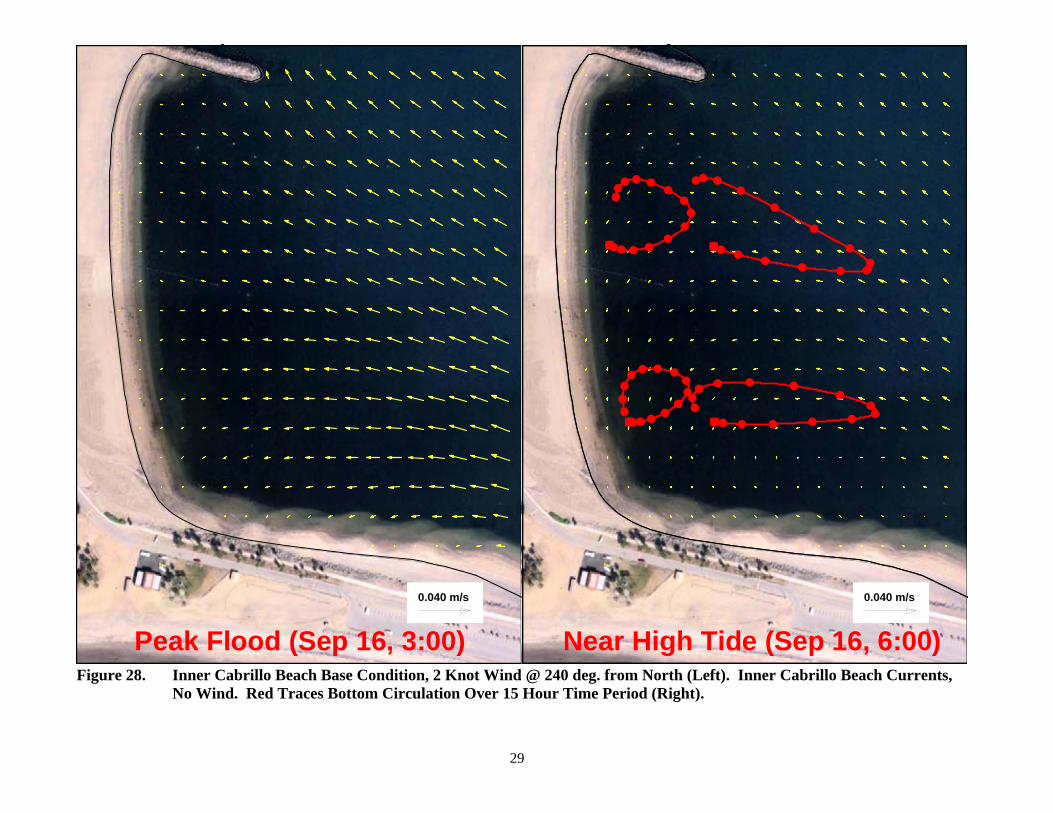
moved out with the surface current. However, looking at the time scale of Figure 30, it is evident that it takes about 8 to 10 hours to move bottom water from the swim area to the beach, to the surface, and out of the area. In other words, even under a modest 5 knot wind the residence time along the beach face at Inner Cabrillo Beach is long. Figure 31 shows that for conditions of a south wind (160 Degrees) and a north wind (300 Degrees) that gyres of bottom water also result in long residence times in the shallow waters just off Inner Cabrillo Beach. 5.5 Field Circulation Pump Experiment In order to study the potential for a pump to improve circulation at the Inner Cabrillo Beach face the following approach was taken: • The three-dimensional hydrodynamic model described above was used to predict the existing
nearshore current field and the size and location of a circulation pump necessary to significantly increase the circulation and mixing of offshore water into the area where bacterial water quality violations frequently occur.
• A field study was designed using dye injections; recording current, fluorescence, and turbidity meters; and aerial photography at a circulation pump rate of about 20,000 gpm located outside the swim buoy line at the southern end of the beach.
• The field data results were used to evaluate the feasibility and effectiveness of a circulation pump installation. Should this corrective alternative be selected, the verified and calibrated hydrodynamic model could then be used to guide design of such an installation.
5.5.1 Circulation Pump Models Model runs were made to estimate the size of a circulation pump to use in a field experiment. Modeling results showed that circulation pump sizes of 10,000 to 30,000 gpm would be needed depending on wind velocity (Figure 32). Introduction of clean water from just outside the swim area into the nearshore area is induced by pumps in this size range, resulting in water velocities to the north just off the beach face in excess of 0.1 knot (>0.05 m/sec) implying residence times of less than two hours for bottom waters at the beach face. Thus the modeling results of pump influences along the face of the beach indicate that a 10,000 gpm pump would be the minimum size pump to have a significant impact. The design would propose to use industrial mixing pump(s). Mixing pumps are submersible pumps that are used in industrial applications. They are installed in tanks, reservoirs, and ponds to circulate liquids. The pumps are used for mixing and current creation. The pump would be encased in a cage for safety. An example would be the Flygt submersible mixer equipped with a 55-inch diameter banana blade propeller operating at low 55 RPM, or smaller (22-inch) propeller models operating at a higher 575 RPM. Entrainment of marine organisms by the higher RPM pumps would be an application issue. 5.5.2 Field Experiment Design and Methods The pilot circulation pump experiment illustrated in Figure 33 was developed to test the effectiveness of the concept of inducing a current of clean water from offshore the beach face to flow along the shoreline and dilute and remove bacterial contamination found to exist at the beach face. Water movements were traced by Rhodamine WT, a red dye injected by a metering pump into the circulation pump discharge. Thus red water flowing through the study area is known to have come through the circulation pump. In addition, a patch of green, Fluorescein dye was initially placed at the beach swash zone (not on the beach) to illustrate initial movements of surface water right at the beach face and to document the subsequent flushing with offshore waters. Dye movements were photographically recorded by use of an aerial radio controlled airplane equipped with a high resolution color camera as well as by handheld cameras. Wind, tide, inshore
33
0.050 m/s 0.050 m/s
Figure 31. Inner Cabrillo Beach Currents, 2 Knots @ SE (160 deg. from North) (Left). Inner Cabrillo Beach Currents. 5 Knots @ NW (300 deg. from North) (Right)

34
Surface Near Bottom
0.040 m/s 0.040 m/s
Surface Near Bottom
0.040 m/s 0.040 m/s
Figure 32. 30,000 gpm Pump, 2 Knot Wind @ 240 deg. from North.

35
Figure 33. Inner Cabrillo Beach Circulation Pump Field Experiment, August 3-5, 2005.
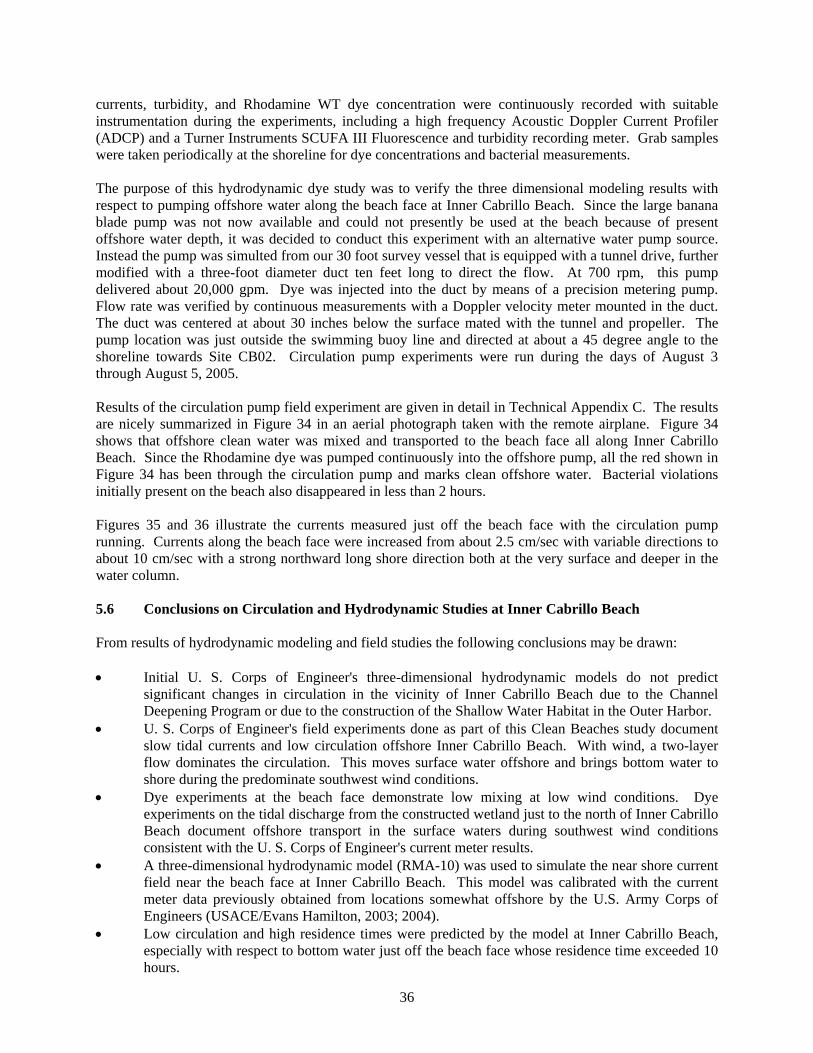
36
currents, turbidity, and Rhodamine WT dye concentration were continuously recorded with suitable instrumentation during the experiments, including a high frequency Acoustic Doppler Current Profiler (ADCP) and a Turner Instruments SCUFA III Fluorescence and turbidity recording meter. Grab samples were taken periodically at the shoreline for dye concentrations and bacterial measurements. The purpose of this hydrodynamic dye study was to verify the three dimensional modeling results with respect to pumping offshore water along the beach face at Inner Cabrillo Beach. Since the large banana blade pump was not now available and could not presently be used at the beach because of present offshore water depth, it was decided to conduct this experiment with an alternative water pump source. Instead the pump was simulted from our 30 foot survey vessel that is equipped with a tunnel drive, further modified with a three-foot diameter duct ten feet long to direct the flow. At 700 rpm, this pump delivered about 20,000 gpm. Dye was injected into the duct by means of a precision metering pump. Flow rate was verified by continuous measurements with a Doppler velocity meter mounted in the duct. The duct was centered at about 30 inches below the surface mated with the tunnel and propeller. The pump location was just outside the swimming buoy line and directed at about a 45 degree angle to the shoreline towards Site CB02. Circulation pump experiments were run during the days of August 3 through August 5, 2005. Results of the circulation pump field experiment are given in detail in Technical Appendix C. The results are nicely summarized in Figure 34 in an aerial photograph taken with the remote airplane. Figure 34 shows that offshore clean water was mixed and transported to the beach face all along Inner Cabrillo Beach. Since the Rhodamine dye was pumped continuously into the offshore pump, all the red shown in Figure 34 has been through the circulation pump and marks clean offshore water. Bacterial violations initially present on the beach also disappeared in less than 2 hours. Figures 35 and 36 illustrate the currents measured just off the beach face with the circulation pump running. Currents along the beach face were increased from about 2.5 cm/sec with variable directions to about 10 cm/sec with a strong northward long shore direction both at the very surface and deeper in the water column. 5.6 Conclusions on Circulation and Hydrodynamic Studies at Inner Cabrillo Beach From results of hydrodynamic modeling and field studies the following conclusions may be drawn: • Initial U. S. Corps of Engineer's three-dimensional hydrodynamic models do not predict
significant changes in circulation in the vicinity of Inner Cabrillo Beach due to the Channel Deepening Program or due to the construction of the Shallow Water Habitat in the Outer Harbor.
• U. S. Corps of Engineer's field experiments done as part of this Clean Beaches study document slow tidal currents and low circulation offshore Inner Cabrillo Beach. With wind, a two-layer flow dominates the circulation. This moves surface water offshore and brings bottom water to shore during the predominate southwest wind conditions.
• Dye experiments at the beach face demonstrate low mixing at low wind conditions. Dye experiments on the tidal discharge from the constructed wetland just to the north of Inner Cabrillo Beach document offshore transport in the surface waters during southwest wind conditions consistent with the U. S. Corps of Engineer's current meter results.
• A three-dimensional hydrodynamic model (RMA-10) was used to simulate the near shore current field near the beach face at Inner Cabrillo Beach. This model was calibrated with the current meter data previously obtained from locations somewhat offshore by the U.S. Army Corps of Engineers (USACE/Evans Hamilton, 2003; 2004).
• Low circulation and high residence times were predicted by the model at Inner Cabrillo Beach, especially with respect to bottom water just off the beach face whose residence time exceeded 10 hours.

37
Figure 34. Aerial Photograph of Dye Distribution Southern Part of Inner Cabrillo Beach, 11:30, August 3, 2005. Insert RMA Model Predictions. (Note Pumping Started at 08:22). Red Indicates Clean Water Flushed to Beach
Near Surface
0.040 m/s

38
CB02 ADCP Current Speed(Bin 2 at bottom, up to bin 6. Each bin = 10cm)
Pum
p O
n
Pum
p O
ff
0
25
50
75
100
125
150
8/4/059:00
8/4/0512:00
8/4/0515:00
8/4/0518:00
8/4/0521:00
8/5/050:00
8/5/053:00
8/5/056:00
8/5/059:00
8/5/0512:00
8/5/0515:00
8/5/0518:00
8/5/0521:00
Cur
rent
Spe
ed (m
m/s
ec)
-0.5
0
0.5
1
1.5
2
2.5
App
roxi
mat
e D
epth
/ Ti
de L
evel
(m
)
Bin 2
Bin 3
Bin 4
Bin 5
Bin 6
Depth
LA Harbor Tide
SensorHeadToo
Shallowfor
AccurateMeasurements
Figure 35. Current Speeds and Water Height in Water Column Above ADPC Current Meter, August 4 and 5, 2005.

39
CB02 ADCP Current Direction Data(Bin 2 at bottom, up to Bin 6. Each Bin = 10cm)
Pum
p O
n
Pum
p O
ff
0
90
180
270
360
8/4/059:00
8/4/0512:00
8/4/0515:00
8/4/0518:00
8/4/0521:00
8/5/050:00
8/5/053:00
8/5/056:00
8/5/059:00
8/5/0512:00
8/5/0515:00
8/5/0518:00
8/5/0521:00
Cur
rent
Dire
ctio
n (d
eg T
rue)
Bin 2Bin 3Bin 4Bin 5Bin 6
SensorHeadToo
Shallowfor
AccurateMeasurements
Figure 36. Current Directions in Water Column Above ADPC Current Meter, August 4 and 5, 2005.

40
• Dry weather violations are associated with high tide-range conditions (violations with significant tidal range and occurring on a rising tide, after a low tide, Appendix A). Organic rich particulate material brought from the nearby eelgrass beds to the beach face by the undercurrent during these conditions have been implicated with beach violations.
• Model runs made to estimate the size of a circulation pump to use in a field experiment indicated that a pump in the range of 10,000 to 30,000 gpm should be used to effectively circulate and mix water along the swash zone of Inner Cabrillo Beach.
Additional conclusions reached from the circulation pump field experiments carried out at Inner Cabrillo Beach as follows: • A full scale circulation pump experiment was run with a 20,000 gpm pump located outside the
swim area pointing at about a 45-degree angle towards CB02 on the beach. • Results of the field and modeling experiment showed that circulation in the nearshore area of the
Inner Cabrillo Beach face could be augmented by use of the circulation pump of proper size and capacity. Mixing of water from outside the swim area was accomplished for the entire length of Inner Cabrillo Beach including penetration of the very shallow swash zone. Currents along the beach face were increased from about 2.5 cm/sec with variable directions to about 10 cm/sec with a strong northward longshore direction both at the very surface and deeper in the water column. Vertical mixing of surface and deeper waters was also accomplished by this circulation pump. Bacterial violations initially present on the beach also disappeared in less than 2 hours.
• Field and modeling results were in reasonable agreement describing the circulation field in the nearshore area of Inner Cabrillo Beach and on the effects of the circulation pump on this flow field at the beach face. The data generated can be used to further calibrate the model if actual design of a pumped circulation system becomes an actual alternative corrective action being

41
6.0 LOCAL SOURCES OF BACTERIAL CONTAMINATION This section documents study efforts that were directed to finding local contamination sources that may be the causes of excessive bacterial water quality violations at Inner Cabrillo Beach. General methods used for these purposes were as follows: Sanitary and Storm Drainage Systems • Physical inspections and dye
tracing of sanitary sewer systems. • Physical inspections and dye
tracing of stormwater sewer systems.
• Interstitial water, seeps, and groundwater sampling and testing to detect upland contamination sources that may be moving to the beach.
• Interim repair and diversions of local leaking sanitary and storm drains discovered at the south end of the beach (Figure 37).
Figure 37. Repair/Diversion Interim Project
Beach Sand Testing • Sampling and bacterial analyses of beach sands during both dry and wet weather. • Testing for contamination associated with stormwater flow over beach sand and time of
persistence. • Characterization of periodic flooding of the beach.
Swash Zone Particulates and Near Shore Eelgrass Beds • Map and characterize eelgrass beds in the swim area and close nearshore areas off Inner Cabrillo
Beach. • Examine potential for reservoir of bacterial contamination in eelgrass bed sediments and detrital
materials. Birds and Other Local Animals • Bird use and behavior at the beach. • Genetic ribotyping analyses to determine potential host sources of bacterial contamination and the
importance of birds as a source. • Statistical analyses of beach monitoring data before and after installation of partial bird exclusion
structure. 6.1 Importance of Sources Local to the Beach Existing historical data for Inner Cabrillo Beach and for the outer waters of Los Angeles Harbor were compiled at the beginning of this project (Kinnetic Laboratories, 2003). Initial analyses of these data pointed to the possibility that the sources of bacterial contamination causing the excessive water quality violations at the Inner Cabrillo Beach were local to the beach. Additional data obtained by this present study summarized above and presented in Technical Appendices A and B support the following conclusions regarding Inner Cabrillo Beach (CB02):

42
• Bacterial water quality violations are mostly caused by sources of contamination local to the
Beach. • Outer Harbor waters are generally clean of bacteria, meeting REC-1 criteria and coming close to
meeting new Regional Water Quality Control Board TMDL requirements for the number of days of allowable exceedances.
• Inner Cabrillo Beach is unique in the high number of bacterial water quality violations, even when compared to other local sheltered beaches. This is especially true for dry weather violations.
These results are very important. It should not be necessary to fix a problem that involves the whole Harbor and distant drainages or other City sources in order to address reductions at CB02 on Inner Cabrillo Beach. Furthermore, potential sources local to Inner Cabrillo Beach should be of the size and nature that are amenable to a practical solution. 6.2 Chronology of Interim Repairs/Diversions at Southern End of Beach The search for sources of contamination and mechanisms of transport to the Inner Cabrillo Beach monitoring site CB02 was an ongoing investigation, not a completely pre-planned study. Thus initial findings triggered adaptations in the sampling efforts and also resulted in an interim repair/diversion project on defective sewers local to the south end of Inner Cabrillo Beach. Because of this adaptive approach, the general chronology of this study to identify local sources was as follows: • Existing data and initial new data on Harbor waters indicated that Inner Cabrillo Beach bacterial
violations were mostly caused by sources local to the Beach (Technical Appendix B). • Physical inspections of the drainage system revealed old (1932) suspect sanitary sewers and
defective storm drains local to the south end of Inner Cabrillo Beach. • Initial results of interstitial water investigations (pits dug in the beach) revealed contamination
below the sand in the southern corner associated with the defective storm drain (confirmed by dye) and sanitary lines intersecting this old 1932 clay pipe.
• Contaminated sand (as measured by sand extractions with sterile seawater) did not indicate generally dirty sands to be an explanation (Section 3 below). However, brackish water (11-21 ppt salinity) seeping from the sand in the southern corner of the beach often was contaminated, though it was not clear if the source of contamination was from fresh groundwater or from the seawater. The rocky breakwater prevented easy sampling.
• The Port of Los Angeles implemented a project to fix the defective storm drain and sanitary sewers local to the south end of the beach (completed June 30, 2004).
• Initial beach response measured by monitoring data was confounded by an order of magnitude summer increase in bacterial concentrations associated with water main failures up on the San Pedro bluff, followed by record winter rainfall and intense storms. Bacterial violations did not taper off until the onset of dry weather in the summer of 2005, then persisted at a low frequency equal to or better than in recent past good years. Still violations substantially exceeded regulatory requirements of no violations during dry weather.
• The beach response the first summer was highlighted by contamination sources from the bluff and led to renewed efforts in groundwater testing and utility line searches for the old sewer outfall. The latter outfall was finally found in the summer of 2005.
• Other sources were also investigated including birds and other animals (Section 6.6) and eelgrass/detrital organic material reservoirs (Section 6.5).
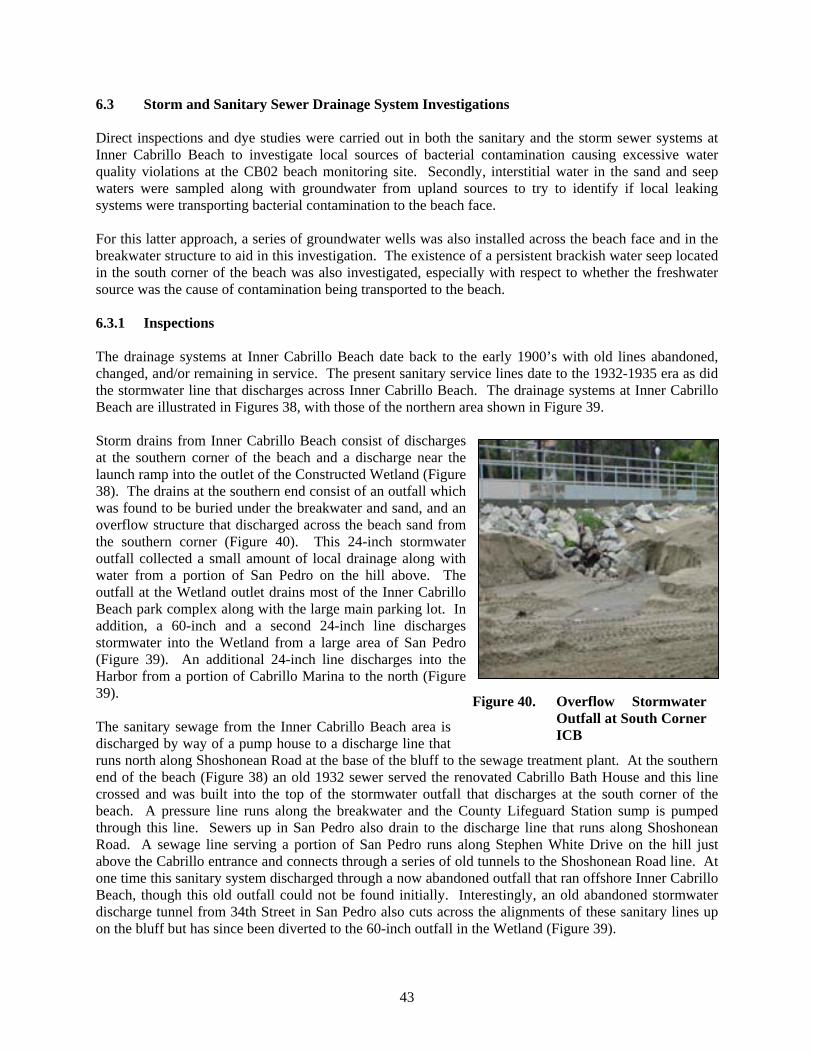
43
6.3 Storm and Sanitary Sewer Drainage System Investigations Direct inspections and dye studies were carried out in both the sanitary and the storm sewer systems at Inner Cabrillo Beach to investigate local sources of bacterial contamination causing excessive water quality violations at the CB02 beach monitoring site. Secondly, interstitial water in the sand and seep waters were sampled along with groundwater from upland sources to try to identify if local leaking systems were transporting bacterial contamination to the beach face. For this latter approach, a series of groundwater wells was also installed across the beach face and in the breakwater structure to aid in this investigation. The existence of a persistent brackish water seep located in the south corner of the beach was also investigated, especially with respect to whether the freshwater source was the cause of contamination being transported to the beach. 6.3.1 Inspections The drainage systems at Inner Cabrillo Beach date back to the early 1900’s with old lines abandoned, changed, and/or remaining in service. The present sanitary service lines date to the 1932-1935 era as did the stormwater line that discharges across Inner Cabrillo Beach. The drainage systems at Inner Cabrillo Beach are illustrated in Figures 38, with those of the northern area shown in Figure 39. Storm drains from Inner Cabrillo Beach consist of discharges at the southern corner of the beach and a discharge near the launch ramp into the outlet of the Constructed Wetland (Figure 38). The drains at the southern end consist of an outfall which was found to be buried under the breakwater and sand, and an overflow structure that discharged across the beach sand from the southern corner (Figure 40). This 24-inch stormwater outfall collected a small amount of local drainage along with water from a portion of San Pedro on the hill above. The outfall at the Wetland outlet drains most of the Inner Cabrillo Beach park complex along with the large main parking lot. In addition, a 60-inch and a second 24-inch line discharges stormwater into the Wetland from a large area of San Pedro (Figure 39). An additional 24-inch line discharges into the Harbor from a portion of Cabrillo Marina to the north (Figure 39). The sanitary sewage from the Inner Cabrillo Beach area is discharged by way of a pump house to a discharge line that runs north along Shoshonean Road at the base of the bluff to the sewage treatment plant. At the southern end of the beach (Figure 38) an old 1932 sewer served the renovated Cabrillo Bath House and this line crossed and was built into the top of the stormwater outfall that discharges at the south corner of the beach. A pressure line runs along the breakwater and the County Lifeguard Station sump is pumped through this line. Sewers up in San Pedro also drain to the discharge line that runs along Shoshonean Road. A sewage line serving a portion of San Pedro runs along Stephen White Drive on the hill just above the Cabrillo entrance and connects through a series of old tunnels to the Shoshonean Road line. At one time this sanitary system discharged through a now abandoned outfall that ran offshore Inner Cabrillo Beach, though this old outfall could not be found initially. Interestingly, an old abandoned stormwater discharge tunnel from 34th Street in San Pedro also cuts across the alignments of these sanitary lines up on the bluff but has since been diverted to the 60-inch outfall in the Wetland (Figure 39).
Figure 40. Overflow Stormwater Outfall at South Corner ICB

44
Figure 38. Storm Drains and Sanitary Sewage Lines at Inner Cabrillo Beach.

45
Figure 39. Storm Drain Conveyances North of Cabrillo Beach.

46
Inspections and dye tracing thus identified the old sanitary sewer lines and the defective stormwater outfall in the southern corner as potential sources of bacterial contamination to the beach. Initial interstitial water sampling results in the sand also identified contamination and dye in groundwater at the southern end of the beach providing support for the finding of defective drainage systems in this area. 6.3.2. Interim Project of Repair and Diversion of Drainage Systems at South End of Beach 6.3.2.1 Repair/Diversion Project Initial results of drainage system inspections and interstitial water sampling at Inner Cabrillo Beach revealed defective sanitary and storm sewers located near the southern end of Inner Cabrillo Beach. Initial results of interstitial water sampling and testing also indicated contamination in the beach sands at the southern corner of the beach along with contaminated brackish water seeps in the southern corner. The Port of Los Angeles wished to repair these identified deficiencies in local drainage even as source studies continued. An interim project to repair these local defective drainages was designed (Figure 41). This project was constructed during the period of June 3 to July 2, 2004. This project accomplished the following tasks at Inner Cabrillo Beach: • Repaired leaky sanitary sewers local to the southern end of the beach, • Replaced a defective storm drain located at the southern end of the beach, • Diverted dry weather storm sewer flows to the sanitary system, • Diverted first flush wet weather storm drain flows from the southern end to the launch ramp. During the construction project it was verified that local sewer lines had been leaking (Figures 42 and 43). The sanitary sewer line from the Cabrillo Bath House was leaking both inside the clay storm drain structure where it crossed the storm drain, and also along the line outside this structure. Furthermore, the sanitary pressure line serving the County Lifeguard Station located on the Breakwater above the southern end of the beach was also leaking as verified by pressure tests. This line also extended out along the breakwater and dye added to the sump at the County Lifeguard Station had been transported out along this line thus indicating leaks also along this section. Repairs and improvements were also made to the conveyances making up Stormwater Drainage SD-1 (Figure 37). As shown in Figure 41, the primary and secondary discharge conveyances were replaced with a single 24-inch conveyance that discharged directly onto the beach as an overflow discharge. Riprap was placed to minimize erosion in front of the rebuilt overflow outfall on the beach. In addition, a bypass was constructed at the catch basins along Oliver Vickery Circle Way to divert first flush flows to Stormwater Drainage SD-2 (Figure 37) and ultimately into the tidal channel to the constructed wetland. The diverter conveyance consists of an 18-inch RCP and connects to Stormwater Drainage SD-2 in front of the center bathroom. Dry weather, low flow discharges were also diverted through an orifice located in the drop inlet in front of the Cabrillo Bath House into the sanitary sewage system. 6.3.2.2. Beach Response After Repair/Diversion Project Monitoring of beach performance after the repair and diversions of the sewer systems at the south end of Inner Cabrillo Beach is described in detail in Technical Appendix A. In summary, monitoring subsequent to the repair/diversion project was confounded by two events, first failure during the summer of a water main located up on the bluff along Stephen White Drive, and secondly a winter wet season of record rainfall and intense storms most of which overwhelmed the first flush diversions of stormwater from Inner Cabrillo Beach. The monitoring record shows continuing excessive violations at the beach, though the summer 2005 equaled or bettered previous good years.

47
Figure 41. Repair and Diversion of Storm Sewer and Repair of Local Leaking Sanitary Sewers, June, 2004.

48
Figure 42. Sanitary Sewer from Bath House Built into Top of Clay Storm Drain, 1932.
Figure 43. Sanitary Sewer Line from Cabrillo Bath House.

49
The beach monitoring responses (2003-2005) showed the following (Technical Appendix D): • Beach performance during the 2004 dry weather period following the interim project to replace
the defective sanitary and stormwater drainage at the southern end of Inner and Cabrillo Beach showed increased violations coinciding with water main leak problems on the bluff above the beach on Stephan White Drive (Figure 44). Comparisons with the 2005 dry weather season (Figure 45) show an order of magnitude higher contamination levels at Inner Cabrillo Beach during the summer of 2004.
• Beach performance during the following winter wet season was obscured by the occurrence of record total rainfall and intense storm events such that most events exceeded the new diversion capacity and caused stormwater overflows directly over the beach sands. Beach performance during the 2004-2005 wet season was similar to that of the 2003-2004 wet season.
• Direct comparisons of the dry seasons of 2003 (before repairs, Figure 46) and that of 2005 (after repairs, Figure 45) are very similar, with the 2004 summer dry season being much higher in bacterial concentrations and in number of violations. Good beach performance in 2005 continued until early winter (Figure 47). It needs to be noted that dry season violations at Inner Cabrillo Beach are not zero as required by the TMDL requirements, even though they are much lower than experienced during the wet season.
• Beach monitoring response to the water main break indicates that a source of bacterial contamination exists in the ground up on the bluff on Stephen White Drive. Indeed a major sewer parallels the water main along this street (Figure 37). A transport path exists that allowed this contamination to be transported to the beach causing bacterial violations even though the surface water was observed to be diverted to the launch ramp stormwater discharge where it quickly dissipated.
• The high bacterial exceedances observed earlier in the summer dry period could have been similarly driven by leaking freshwater from this water main.
• A pattern of more frequent violations associated with higher tidal ranges seems apparent from these plots, particularly following a low tide below about 0 ft to -1 ft MLLW.
• Subsequent to these analyses of beach responses, further investigations found an old buried sanitary sewer outfall pipe continuous from the base of the bluff to the center of the beach.
These data thus indicate that sources of contamination exist up on Stephen White Drive that can still be transported to the beach. 6.3.3 Interstitial Water Results Bacterial analyses of interstitial water samples were carried out on Inner Cabrillo Beach prior to and subsequent to the 2003/2004 wet weather season as an attempt to identify any local leakage into the beach sands from the damaged and buried storm drain outfalls in the southern corner of the beach or from any sanitary sewer lines. Initial spring/early summer 2003 interstitial sampling was carried out in mid-May and early June, mostly by digging pits to the groundwater and then directly sampling. A somewhat simplified summary figure of these early summer results is shown in Figure 48 (shown for enterococcus) that indicates consistent groundwater contamination in the sand at the southern corner of the beach where the defective storm drain and suspected sanitary leaks were present. Rhodamine dye which was injected into the storm drain discharge was also measured in the groundwater in the south corner of the beach. Later in the summer/fall of 2003 dry season, contamination was not present in the beach interstitial water.

50
Figure 44. Enterococcus Monitoring Data, Summer 2004
Figure 45. Enterococcus Monitoring Data, Summer 2005

51
0.01
0.1
1
10
100
1000
10000
100000
Sep
- 16
Sep
- 18
Sep
- 20
Sep
- 22
Sep
- 24
Sep
- 26
Sep
- 28
Sep
- 30
Oct -
02Oc
t - 04
Oct -
06Oc
t - 08
Oct -
10Oc
t - 12
Oct -
14Oc
t - 16
Oct -
18Oc
t - 20
Oct -
22Oc
t - 24
Oct -
26Oc
t - 28
Oct -
30No
v - 01
Nov -
03No
v - 05
Nov -
07No
v - 09
Nov -
11No
v - 13
Nov -
15No
v - 17
Nov -
19No
v - 21
Nov -
23No
v - 25
Nov -
27No
v - 29
Dec -
01De
c - 03
Dec -
05De
c - 07
Dec -
09De
c - 11
Dec -
13De
c - 15
Dec -
17De
c - 19
Dec -
21De
c - 23
Dec -
25De
c - 27
Dec -
29De
c - 31
2005 (Dry Weather)
Ente
roco
ccus
(Cou
nts/
100
ml)
-5
-2
1
4
7
10
13
16
19
22
25
28
Tida
l Ele
vatio
n (fe
et re
lativ
e to
MLL
W)
30-Day Exceedance Standard (>35) Daily Single Sample Exceedance Standard (>104)Centered 7-Day Geometric Mean Tide Level Min & Max Range Relative to 10:00Daily Enterococcus Values Enterococcus That Exceed State WQ StandardsTide Height of Exceedance Sample
2005 September 16 to December 31 Station HYP CB2 Daily Enterococcus Single Sample Values, Exceedances, and 7- Day Moving Geometric Means vs. the Maximum Difference in Tide Height (Range) Between Prior and Subsequent Tide Extremes
(High or Low) Relative to Height Reached at 10:00 Each Sample Day.
Wet Season �( November 1 to April 1 ) Rain
0.48"Rain0.32"
Rain0.32"
Rain0.66"
Rain0.66"
Rain0.48"
Figure 46. Enterococcus Monitoring Data, Summer 2003
Figure 47. Enterococcus Monitoring Data, Fall/Winter 2005

52
Figure 48. Enterococcus Results in May/June 2003 Interstitial Water Samples, Inner Cabrillo
Beach. A final dry season interstitial water sampling was conducted on June 29, 2005. This sampling involved excavating pits at six different locations in the south corner of the beach to expose the groundwater. The primary purpose of these samples was to find and test for the differences in bacteria contamination between fresh, brackish and salty interstitial water. Interstitial water from the pit containing the freshest water (4.2 ppt) contained very little or no bacteria and very little bacteria were also found in three other pits containing brackish and high saline water. Two pits did contain measurable levels of bacteria but the only public health exceedance was from the interstitial water collected in a pit with a salinity of 31.6 ppt at the low point in front of the overflow structure. Salinity in the pits was higher than what has been typically found in the interstitial water of the south corner of the beach most likely because of the very high astronomical tides (> +7 feet) that occurred the days leading up to this sampling event. The one pit with the freshest water was located in front of a seep immediately above the brackish water seep which is located at the south corner of the beach. Whenever levels of bacteria above the public health criteria were encountered, salinities were usually fairly high (>21 ppt). Interstitial groundwater wells were sampled for indicator bacteria twice during the 2003-2004 wet weather season and once during the 2004-2005 wet weather season. Generally, these winter samples of interstitial water across the beach were found to be clean except for some samples in the southern corner of the beach in the spring associated with the stormwater overflow discharges or high-salinity water near the beach face. These data further verify that fresh groundwater flowing through Cabrillo Beach does not appear to be a substantial source of bacteria contamination. 6.3.4 Semi-Permanent Groundwater Well Results As described earlier, in early 2005, semi-permanent groundwater wells were installed every 100 feet along the top of Inner Cabrillo Beach and at three onshore locations along the Los Angeles Outer Harbor Breakwater. The locations of these wells are shown in Figure 49. Sampling wells were installed with a

53
screen point interval over the approximate 5-foot depth range of MSW to MLLW. The main purpose of these wells was to further determine whether or not bacteria contamination is migrating through the groundwater from upland sources to the beach and offshore waters. Subsequent to their installation, the groundwater wells were sampled several times through June of 2005. Figure 49. Location of Semi-Permanent Groundwater Wells at Inner Cabrillo Beach. Results of the well testing, along the top of Inner Cabrillo Beach, showed that single-sample public health criteria were never exceeded in any of the wells, although slightly elevated levels of total coliforms were evident on the February 2005 sampling event, which occurred after an extended wet period. These wells were installed to test whether leakage or contamination upland of the beach was being transported through the groundwater and into the beach sand contaminating the beach and causing the excessive violations measured at CB02. Based on the data collected, it appears that the sewer conveyances above the beach are not a source of bacteria contamination transported by groundwater to the near shore waters. The three breakwater wells were much more problematical as drilling needed to be done into rock and rubble filled with sand or dredge materials. Because of the rock, rotary drilling needed to be done, but in a rock/rubble substrate with unknown fine grained fill and porosity, drilling fluids could be a problem both for the drilling operation and for possibly changing the porosity greatly in the vicinity of the well. Instead, a Fraste D43 air rotary drill was used with compressed air utilized instead of a drilling fluid. Once drilled, wells were installed with a screen point interval at elevations corresponding to the interval MSW to MLLW, an approximate 5 foot interval for sampling. Wells were purged with at least three case volumes before sampling and the wells did recharge. However, because of the unusual rock and rubble substrate, concerns that representative samples could be obtained from these wells remained.

54
Sampling results from the breakwater well waters did not yield consistent data showing that contamination was moving from the uplands through the breakwater to the beach. Indeed the results of these well tests were variable but often did not show contamination. These samples were, of course, taken during a winter of intense rainfall. The breakwater groundwater well results may be summarized as follows: • Initial samples (February 15) after well installations and a few days after two intense rain events
(approximately 2.5 inches and 0.4 inches), sampling results showed very high total coliform values in all three wells, but high E. coli and enterococcus only in the lower well just above the beach and seep.
• Two days later, a repeat sampling showed much lower results, with only the lower well showing significant contamination with the exception of an enterococcus exceedance in the middle well (near the Cabrillo Statue).
• Subsequent sampling about a week later (February 23) showed all values below water quality standards, but with an elevated total coliform value at the upper well (picnic area below the bluff). Bacteria values were then below exceedances in March and in April samplings, as well as in June (with the exception of an elevated enterococcus count at the middle well and high total coliform in the upper well).
• All breakwater well samples, even the lower are freshwater with salinities consistently between 4 to 5 ppt.
These data could support an explanation of initial contamination associated with well drilling and a conclusion that contaminated groundwater is not moving from the bluff to the beach in the breakwater. The validity of the wells in the breakwater was a concern however. Therefore, early in the morning of April 20, 2005 approximately 400ml of Rhodamine WT dye was put into the middle breakwater well (close to the Cabrillo Statue). The bottom breakwater well and the swash zone in the corner just below the bottom breakwater well were sampled throughout this and the following two days. The area was revisited a week later and sampling was again conducted. After adjusting for turbidity, dye was not detected at any of the sampled sites. These results indicate that hydraulic conductivity does not exist between the middle breakwater well (near the statue) with the bottom breakwater well or with the beach. Either the breakwater is not permeable or the wells are not correctly sampling groundwater flow in the breakwater. Thus conclusions from the groundwater well sampling efforts were the following:
• Contamination is not moving with the groundwater in sample wells across the upper beach. • Contamination also could not be documented as moving to the beach though the breakwater.
However, doubts about the validity of the sampling wells or whether the breakwater is porous or not make this latter conclusion uncertain. Supporting data exist in that samples of fresh interstitial water feeding the seep have not been found to be contaminated except by addition of seawater from the beach face.
6.3.5 Seep and Stormwater Runoff Results To further examine the contribution of stormwater runoff and groundwater movement through Cabrillo Beach to the bacterial contamination in the offshore waters of Cabrillo Beach, periodic samples for indicator bacteria were collected from runoff and from interstitial groundwater seeping up through the

55
beach sands at low tide. Samples were collected by making a small indentation in the surface of the beach sand and sampling the seeping water directly into a sterile bacteria sampling vial. All of the water sampled seeping in the lower intertidal across the beach face was found by salinity measurements to be seawater draining from the sand from the previous high tide, except in the southern corner of the beach. Here a persistent seep of brackish water existed as shown in Figure 50. This seep in the corner was usually in the range of 11 to 21 ppt salinity and was often contaminated with bacteria. The initial reaction was that this was the smoking gun that indicated that fresh groundwater was transporting contamination to the beach face in the corner from leaks in the sanitation systems upland. Attention was thus focused on this southern end of the beach in front of the storm drain outfalls and the broken pipeline. The work described above on interstitial water and groundwater wells across the beach and in the breakwater were designed to determine whether this fresh groundwater was indeed contaminated. As explained above, conclusions were that freshwater was not found to be contaminated except due to the broken stormwater outfall and due to fresh stormwater flowing across the sand. Seep sampling was carried out during the 2003/2004 wet season and the following 2004 dry seasons. Two examples of the results are illustrated in Figure 51 (dry season example) and Figure 52 (wet season example). The results of the dry season seep sampling at the southern corner of the beach show elevated bacteria concentrations throughout extended dry weather periods. Samples collected in the swash zone were more often contaminated and to greater extent than the seep samples they were paired with. Wet weather seep samples were collected in the same manner as the dry season samples. However, these samples consisted of water seeping from the sand or running either on or through the sand if rain had just occurred. All stormwater samples measured well above single-sample public health criteria for total coliforms, E. coli and enterococcus. The public health criteria exceedances in the seep sample were less severe than those in the raw stormwater. Seeps during storm events showed high exceedances and low salinities indicative of freshwater.
Figure 50. Persistent Brackish Water Seep at Southern Corner of Inner Cabrillo Beach.
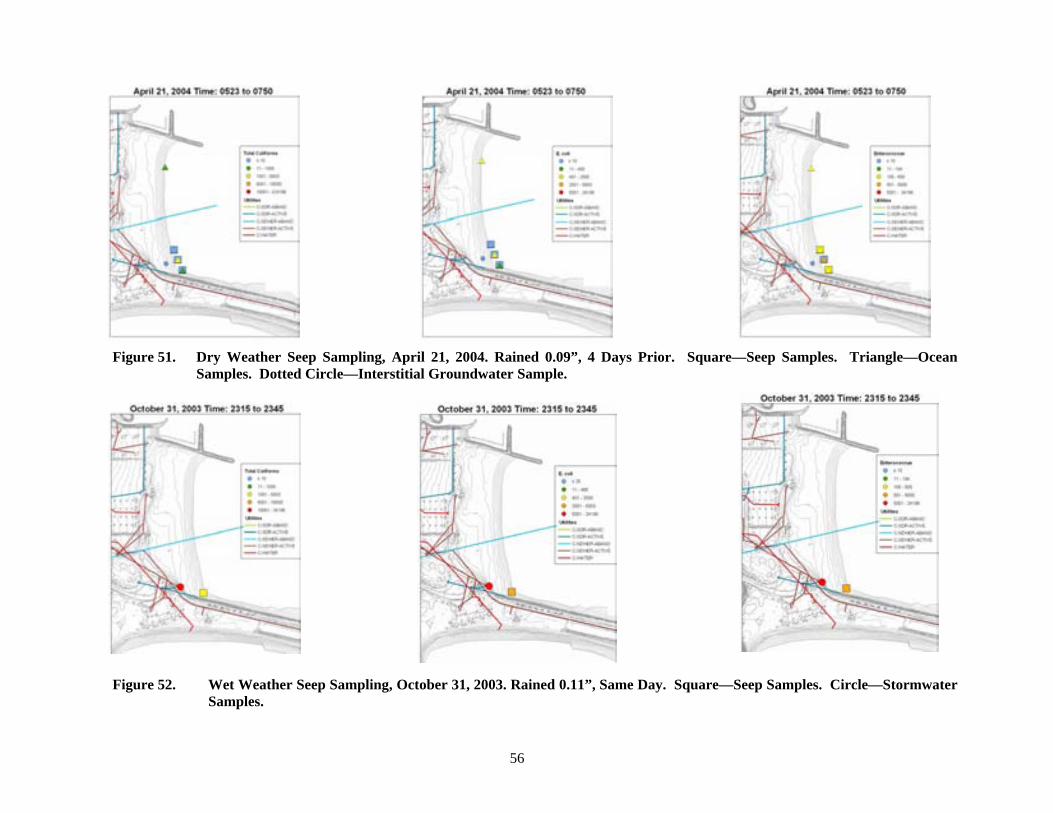
56
Figure 51. Dry Weather Seep Sampling, April 21, 2004. Rained 0.09”, 4 Days Prior. Square—Seep Samples. Triangle—Ocean Samples. Dotted Circle—Interstitial Groundwater Sample.
Figure 52. Wet Weather Seep Sampling, October 31, 2003. Rained 0.11”, Same Day. Square—Seep Samples. Circle—Stormwater Samples.

57
6.3.6 Old Abandoned Sanitary Outfall Initial searches for this old abandoned outfall proved fruitless and considerable effort was spent to find old drawings and photographs from Port and City archives and from local museums. Partial drawings in different versions and showing a variety of locations were obtained. Figure 53 shows some of the possible alignments and the location when this line was eventually found. Initial effort involved magnetometer surveys, jet probing just off the beach face, and hand coring at locations identified as possible buried manhole locations. Because of the importance of this possible line to beach contamination, particularly with the beach performance record observed during the water line break up on Stephen White Drive a more intensive search for old records and local surveys were carried out. Then a potholing technique used for locating utility lines with minimum disturbances was next attempted. In order to minimize the differences in location among the potential alignments for this old outfall (Figure 53), potholing was done behind the aquarium in the service yard, the nearest accessible site closest to the bluff. Potholes were evacuated to form a thin trench 14 feet deep along a line perpendicular to the probable alignment of the old outfall (Figure 54). Difficulties were encountered because of existing utility lines for the aquarium in this area and because of deep debris such as rocks and timbers.
Figure 53. Location of Old Abandoned Sewer Outfall (Red Alignment as Found).

58
After two days of effort and numerous false targets, a pipe was located at about 12 foot depth that attracted a magnet. A long 12 foot long rod fitted with a small drill bit was turned into the pipe to make a good electrical connection. An electromagnetic survey of the underground line was then conducted. An electrode from a Model RD-4000 T10 transmitter was then attached to the rod that had been drilled into the pipe and the fencing system of the aquarium complex was used as the ground. The transmitter frequency was selected and the pipe route was then traced with a Model RD-4000 RX mobile detector (Figure 54). This system worked very well. The pipe line route and approximate depths were then traced as an apparently contiguous line, under the new aquarium building addition, across the parking lots to the north of the sanitary pump house, underneath the southern bathroom above the beach, and out across the beach (Figure 6.13). The line was lost about at the existing beach berm above the low intertidal area. The line apparently also went back to the bluff face in the vicinity of the old manhole. A suspected manhole on this alignment was located in the road just to the north of the existing sanitary pump house. It is recommended that this old sewer outfall be removed or blocked to prevent transport of contamination from the bluff to the beach. 6.3.7 Drainage System Conclusions Conclusions on the drainage system investigations at Inner Cabrillo Beach include the following: • Initial inspections identified the old 1928-1932 sanitary sewer lines and the stormwater outfall in
the southern corner as a source of bacterial contamination to the beach. • Initial results of interstitial water investigations (pits dug in the beach) revealed contamination
below the sand in the southern corner associated with the defective storm drain (confirmed by dye) and a sanitary line built through the top of this old 1932 clay storm sewer pipe.
• Contaminated sand (as measured by sand extractions with sterile seawater) did not indicate generally dirty sands to be an explanation. However, brackish water (11-21 ppt salinity) seeping from the sand in the southern corner of the beach often was contaminated, though it was not clear if the source of contamination was from fresh groundwater or from the seawater. The rocky breakwater prevented easy sampling.
• The Port of Los Angeles implemented a project to fix the defective storm drain and sanitary sewers local to the south end of the beach (completed June 30, 2004). The local sanitary sewers were confirmed to have been leaking and the storm drain was crushed below the breakwater below the sand. The sanitary sewers were replaced. The first flush stormwater flow was diverted to the launch ramp for discharge and the overflow structure discharging across the sand in the southern corner of the beach was rebuilt. Low, dry weather flows were diverted to the sanitary system.
Figure 54. Pothole & Magnetic Surveying.

59
• Initial beach response measured by monitoring data was confounded by an order of magnitude summer increase in bacterial concentrations at the beach associated with water main failures up on the San Pedro bluff, followed by record winter rainfall and intense storms. This water main was repaired as an emergency in August and later replaced in the fall of 2004. Bacterial violations did not taper off until the onset of dry weather in the summer of 2005, then persisted at a low frequency equal to or better than in recent past good years. Still violations substantially exceeded regulatory requirements (no violations during dry weather).
• The beach response strongly implicates contamination sources from the bluff up on Stephen White Drive. A sanitary sewer system also runs along Stephen White Drive. Old sanitary and storm sewer tunnels also exist up on the bluff in this area of San Pedro.
• The first summer highlighted contamination sources from the bluff and led to renewed efforts in groundwater testing and utility line searches for the old sewer outfall. The latter outfall was finally found in the summer of 2005 and was found to be apparently contiguous from the bluff to the beach berm area, at a depth of approximately 12 feet below surface and in the groundwater. In addition, groundwater wells were installed across the upper beach and the breakwater. Additional testing of interstitial water and seeps was also carried out.
• Results from groundwater well monitoring showed that contamination is not moving with the groundwater in sample wells across the upper beach. Contamination also could not be documented as moving to the beach though the breakwater, though the quality of the wells in the rock/rubble substrate is unknown.
• Subsequent interstitial water sampling, and seep and swash zone sampling all indicate that fresh groundwater is not contributing to beach contamination. o Across most of the beach face, fresh groundwater and interstitial water are generally
clean away from the beach face. Seep water consists of seawater draining back out of the intertidal area after the previous high tide.
o Interstitial waters in the southern corner in the vicinity of the brackish water seep are least contaminated when sampled upstream and are fresh, are contaminated upon mixing with the seawater from the swash zone, and the seep waters (11-21 ppt salinity) are generally less contaminated than corresponding swash zone waters. Beach flooding that occurs all the way up to the overflow outfall in the southern corner apparently can introduce contaminated seawater into the local interstitial water in front of this overflow.
o All stormwater samples measured well above single-sample public health criteria for total coliforms, E. coli and enterococcus. The public health criteria exceedances in the seep sample were less severe than those in the raw stormwater. Seeps during storm events showed high exceedances and salinities were freshwater. Wet weather (post storm) seepage was predominantly freshwater on the day of a storm and freshwater influence seemed to persist in the seep samples even two weeks after a storm event, but were mixed with seawater from the daily tides.
6.5 Beach Sand Studies 6.5.1 Sand Sources of Contamination As part of the study to investigate the sources of bacterial contamination at the Inner Cabrillo swimming beach, bacterial concentrations in beach sand samples were measured in order to determine whether contaminated sand on the beach could be causing the water quality violations measured at the beach face. Sand sampling and analysis experiments were designed to investigate whether the beach sands themselves were contaminated, such as from bird sources, and to determine the subsequent ability of sand from the beach to leach indicator bacteria into seawater. This question was examined by extracting the sand sample with sterilized, natural seawater. Objectives for sand source testing efforts were as follows:

60
• Determine the bacterial contamination present in beach sands and the spatial distribution of such
contamination on the beach and with depth in the sand. • Determine the ease with which contaminated sand can contaminate sterile seawater on contact. • Determine the bacterial contamination present in beach sands during the dry season and
determine changes during the wet season, particularly at the southern end of the beach where stormwater discharges across the sand.
• Identify any reservoirs of bacteria existing locally in the sand. • Formulate possible beach sand management practices based upon the results of the sand analyses. The primary objective of this work was not to obtain total bacteria concentration data from sand samples. Rather it was desired to determine whether sterile seawater could become significantly contaminated by contact with the beach sands. The ability of sand from the beach to leach indicator bacteria into seawater was determined by extracting the sand sample with sterilized seawater in a standardized test. In the field, the sand samples were collected using pre-sterilized spoons into pre-sterilized aluminum weighing cups and weighed with a field balance to obtain a 25 gm sample. Bacterial extraction using the sterilized seawater was carried out as follows: • Seawater (250 ml) from ToxScan Inc.'s coastal laboratory supply in Santa Cruz was added to a
Mason jar, which was then autoclaved along with the cap and sealed for transport to the field. • The sand sample was added to the Mason jar containing the sterile seawater, shaken for one
minute, and allowed to settle for 10 minutes. • The clear seawater above the sediment was then sampled using a sterile 20 ml disposable syringe
and put into a sterile 100 ml bacteria-sampling bottle for analyses. To document the status of the beach before wet season rains and to examine the ability of beach sand to leach bacteria into the nearby seawater, samples for indicator bacteria in Inner Cabrillo Beach sands were collected prior to the start of the 2003/2004 wet weather season using the primary extraction procedure described earlier. The results of this sampling are depicted in Figure 55. Bacteria are present in the sand at Inner Cabrillo Beach as is common to all beaches. However, simple extraction of bacteria from beach sand samples (10/1 volume extract) does not result in particularly high bacteria concentrations in the water extracts but are similar to that reported at other beaches. During the wet season, contaminated stormwater running across the beach sand from the outfall overflow on the south end of the beach raises the contaminants in the sand. This elevated contamination persists for a few days following a rain event as shown in the following summary Table 5 for the February 26, 2004 storm event that produced 2.09 inches of rain. Table 5. Bacteria (Counts/100ml) in Sterile Seawater Extracts of Sand After Stormwater
Runoff from a 2.09-Inch Event on 26 February 2004. Date Duration After
2.09” of Rainfall Total Coliforms E. coli Enterococcus
26 Feb 2004 Immediately After 2923 - 4569 63 - 173 689 - 1145
28 Feb 2004 2 Days After 63 - 122 < 10 - 10 41 - 173
1 March 2004 4 Days After < 10 - 84 < 10 - 10 10 - 31

61
Figure 55. Pre-Wet Weather Sand Surveys, August 15 to September 30, 2003. Smallest Circle–Surface Samples. Medium Circle–6-inches Deep. Largest Circle–12-inches Deep. Rain 0.3”, 16-62 Days Prior. Wind 3-8 KT, 150-220°.

62
On three different occasions, sand samples were extracted with sterile seawater to see if nearby bird feces or a foamy film like substance mixed with sand readily leached bacteria into the seawater. In extracts from sand samples incorporating bird feces, bacteria levels from all three indicator tests were in the tens of thousands. On the other hand, the levels of indicator bacteria extracted with seawater from the surrounding sand or from beach foam were below the method detection limits for total coliforms and E. coli and slightly above the single-sample public health criterion for enterococcus. 6.5.2 Beach Flooding Inner Cabrillo Beach is composed of fine sand and clays with low permeability on the upper beach. Beach elevations are such that flooding occurs at higher tides and ponds accumulate behind the highest portion of the beach, particularly on the northern section. These ponds are highly contaminated, are used by birds, and take over 12 hours to drain because of limited permeability of the fine materials in the upper beach sands. Figure 56 and Figure 57 show such beach flooding occurs at tides of +7 feet MLLW or somewhat lower depending on surge in the Harbor at the time. Table 6 shows the frequency of occurrence of differing tidal heights at Inner Cabrillo Beach. Table 6. Average Days per Year LAOH Tides Reach or Exceed 10 Water Level Categories from
6.0 feet and Greater in Height (MLLW). Tide Water Level
(Height ≥ (ft. MLLW))* Average All
Year (Days/Yr.) Average Dry Season**
(Days/Yr.) Average Wet Season**
(Days/Yr.) 6.0 104 61 43 6.1 88 50 37 6.2 73 41 32 6.3 61 35 25 6.4 50 28 22 6.5 43 23 19 6.7 28 15 13 7.0 11 5 6 7.2 4 2 2 7.4 1 0 1
*Data Spanning 11 Years from 1994 to 2004 from NOAA are adjusted to be relative to MLLW Station Datum for Epoch 1983 to 2001 ** Weather Seasons: April 1 to October 31 (Dry) November 1 to March 31 (Wet). Recommendations for corrective measures to be considered would consist of replacing existing beach sand with clean beach sand to increase permeability and flushing, raising the beach to an elevation of +9.0 feet MLLW in order to reduce flooding, and removal of a shallow dead-end corner from the beach in order to improve circulation. In the very southern corner of the beach, some eelgrass material would need to be removed for transplant to another area of the Inner Cabrillo Beach. The transplant would need to be conducted by a firm specialized in such work. The project would also include monitoring the transplant site after completion to verify success. New sand would then be placed on the beach to cover the corner and fill to a higher elevation. This would eliminate the shallow corner of the beach and improve the circulation at the beach face.

63
Figure 56. Bird Use of Flooding Inner Cabrillo Beach.
Figure 57. Ponded Water on Flooded Inner Cabrillo Beach.

64
6.6 Swash Zone Particulate Materials and Nearshore Eelgrass Beds The Port of Los Angeles has developed the Inner Cabrillo Beach area along the San Pedro shoreline within the western Harbor into a multifaceted use area of park, beaches, marine aquarium, youth facility, and community use buildings. A constructed marine wetland is included, along with valuable shallow water habitats. Eelgrass was planted by the Port of Los Angeles in the shallow waters of Inner Cabrillo Beach and has thrived in the shallow areas from 0 to -15 feet MLLW. More recently, shallow water habitats in deeper waters offshore Inner Cabrillo Beach have been constructed as additional feeding areas for the endangered California Least Tern. Dense eelgrass beds now exist offshore from Inner Cabrillo Beach and are the basis of rich, shallow water marine biological habitats in the western Outer Harbor. At the southern recreational beach, these beds extend inshore throughout the swimming area into a depth of about 0.0 or -1.5 feet MLLW. These beds are characterized by fine sediments, detrital organic materials, and high biomass very close to the beach face. These dense beds also inhibit nearshore circulation and mixing and accumulate some trash. Similar conditions exist along the outside shore of the wetland and along the Youth Facility beach, both located north of the groin and boat launch area. Bacterial violations at the southern recreational beach are uniquely high, even when compared to other similar protected beaches in Southern California and in the Los Angeles/Long Beach Harbor (Technical Appendix A). Bird use of Inner Cabrillo Beach contributes local bacterial contamination. However, birds are absent at night but come at dawn and use the northern half of the beach. Bacterial monitoring of the beach is done around 9-10 am, leaving only about 3-5 hours, depending on the season, for contamination to be generated at the beach and transported southward to the monitoring site located in front of the lifeguard stand on the southern portion of the beach. Therefore, it was thought that a reservoir of contamination may exist at the beach that stores or cultures bacteria and accounts for the uniquely high number of violations in dry weather as well as in wet weather conditions. Extraction of beach sands with sterilized seawater does not yield bacterial concentrations that are particularly high or unique. Results are similar to those obtained at other beaches and reported in the literature. Thus highly contaminated beach sands were not indicated as a unique cause. Contamination in the interstitial water of the sand seems to be confined to the outer saline layer near the beach face and to vary quickly in response to tide. Inner Cabrillo Beach is unique in that dense eelgrass beds exist right off the beach face. Therefore the possibility was explored that these beds could act as a reservoir or a storage mechanism that might account for the uniquely high number of violations measured at the monitoring site CB02. 6.6.1 Eelgrass Beds at Inner Cabrillo Beach Eelgrass (Zostera marina) is a marine vascular plant that grows in soft-bottom bays and estuaries. Eelgrass is a dominant plant that structures a community by stabilizing soft bottom sediments, by furnishing organic grazing and detrital material to other organisms, and by furnishing a sheltered habitat for many resident species as well as a nursery area for other marine life. Eelgrass as a vegetated shallow water habitat is considered to be a special aquatic habitat protected under Section 30.10 of Title 14, Chapter 4, Article 1 of the California Code of Regulations which prohibits cutting or disturbance. Eelgrass distribution (MEC, 2001) in the Outer Harbor of the Port of Los Angeles is shown in Figure 58 (August 2000). The eelgrass beds have spread to cover over 42 acres of the Inner Cabrillo Beach area. The dense eelgrass beds right adjacent to Inner Cabrillo Beach shorelines are particularly evident in Figure 58 which shows survey data for August, 2000. Vegetative cover varies widely with season as well as with interannual variations in environmental conditions.

65
Figure 58. Eelgrass Beds at Inner Cabrillo Beach, August 2000 (MEC, 2001).

66
Eelgrass very close to shore and in the swim area is shown in Figures 59 and 60 near a low tide of -1 foot MLLW on December 2, 2005 at 1700 hours. Drift algae covers the beach just above the low tide line with detrital eelgrass deposited near the high tide line. The tops of the eelgrass blades from the growing bed can be seen throughout the swim area as well as off the northern part of the beach. Similar beds lie just off the beach face at the northern Youth Camp beach. Swimmers using the beach walk in the soft silt/mud bottom at low tide conditions and swim in the floating eelgrass blades at higher tides except right at the beach face. Because of the important habitat involved, the size and health of eelgrass beds in the Port of Los Angeles are quantitatively monitored periodically by the Port as part of mitigations associated with ongoing projects as well as part of periodic baseline conditions surveys. Techniques used include side scan sonar mapping surveys to determine eelgrass bed area and estimates of density in broad categories of dense, moderate, and sparse. Ground truth data are obtained by diver surveys on selected calibration transects. Therefore, underwater video surveys were also run at Inner Cabrillo Beach as part of this present study. One purpose of this underwater video survey was to examine potential processes or mechanisms within the nearshore eelgrass beds that might act as a reservoir or sources for bacterial contamination causing continuing water quality violations at the beach. Another purpose was to provide qualitative documentation of the habitat values that exist in this offshore area so that balanced decisions could be facilitated by first hand visual presentations of this nearshore environment. A video edited from all of the footage acquired and of approximately a half hour in duration is attached to this report in the form of a video disc that is available to project personnel, decision makers from agencies, as well as to others. This video disc contains underwater footage obtained in the eelgrass bed just offshore from the beach. It also contains comparative footage from a video transect through the Berth 300 eelgrass beds in Seaplane Lagoon in the Harbor. In addition, for comparison and contrast, the video disc contains an edited video from nearshore waters of Outer Cabrillo Beach, including the shallow sand habitat and the rocky area in the Point Fermin area. The video includes eelgrass, algae, and kelp communities characterizing this rocky offshore habitat. These videos are to supplement other quantitative data from other Port projects. 6.6.2 Erosion of Sediments and Detrital Materials From above it has been shown that eelgrass beds with fine particulate sediments and detrital materials exist just off the Inner Cabrillo Beach face starting at an elevation of about 0 to -1 foot MLLW. From analyses of bacterial data in the offshore harbor waters (Technical Appendix B) it has been shown that Harbor waters are generally clean except for during rain events and for a few days following. These clean waters have been measured close inshore near the swim buoy line and at the bottom above the eelgrass bed. However they are frequently high in the swash zone of the beach and significantly less in only two feet of water just offshore the beach face (Technical Appendix B). From analyses of the bacterial monitoring data (Appendix A) it has been shown that violations are related to tide, and specifically seem to follow a pattern of following low tide conditions approaching 0 feet MLLW or lower along with an associated high tidal range. Sand extractions with sterilized seawater did not seem to yield particularly high bacterial contamination (Appendix D, Section 3), and interstitial freshwater and seeps did not show contamination except for early results that were found to be associated with leaky storm and sanitary sewers in the southern corner that have since been fixed (Appendix D, Section 2). Viewing of the underwater video showed that fine sediments exist in the eelgrass bed and they could be disturbed into a cloud of sediment with a diver’s hand, Figure 61. Unless disturbed however, neither turbid nor detrital layers (nepheloid layer) existed on the bottom moving with the small surge present during the survey in this part of the Harbor. In other words, the eelgrass bed seemed, in general, to be stabilizing the bottom and the fine sediments were cohesive enough so that constant turbidity was not

67
Figure 59. Inner Cabrillo Beach Nearshore Eelgrass at Low Tide (-1 ft MLLW), 1700
December 2, 2005.

68
Figure 60. Eelgrass Showing in the Swim Area of Inner Cabrillo Beach at Low Tide, 1700
December 2, 2005.

69
Figure 61. Eelgrass Beds and Fine Sediment/Detrital Material Offshore Inner Cabrillo Beach.

70
present at the bottom. Visibility in the video was compromised by phytoplankton and zooplankton along with other fine suspended solids. However, it was observed that the swash zone could become very loaded with suspended particulate materials, particularly at low tide conditions where the small surge was effective in eroding detrital materials and sediments. This condition is shown in Figure 62, and in more clarity in the underwater video. Footage of the movements of these particulate materials is included on the video disc, at the end of the segment on the Inner Cabrillo Beach eelgrass beds. Hydrodynamic modeling and field studies (Technical Appendix C) have shown that circulation in the nearshore area is slow, with bottom waters having a residence time of 8-10 hours. Circulation in this nearshore area is dominated by wind driven flow, superimposed on the slow tidal in and out currents. Under wind conditions two layer circulation occurs, with flow at the bottom normally toward the beach and offshore in the surface layer. Diurnal winds from the southwest are the dominant condition, often building to 10-12 knots in the afternoon and driving this onshore bottom flow. Since the swash zone is exactly where the uniquely high number of bacterial violations occur, it was decided to investigate the effect that these suspended particulate materials might have on bacterial readings and to investigate bacterial concentrations in the eelgrass sediments offshore the beach. 6.6.3 Bacterial Measurements of Suspended Particulates and Eelgrass bed Sediments Standard bacterial analyses protocols are for analyses of water samples and call for shaking of the sample before sub-sampling by pipette for laboratory analyses. Soils and, in particular, beach sand samples have been analyzed by extraction with water or a buffered solution, either with or without sonification. A brief review of previous literature results of such beach sand analyses is included in Technical Appendix D along with comparisons with literature data from other studies. For sand extraction on Inner Cabrillo Beach the objective was not to obtain total bacteria concentration data from sand samples. Rather it was desired to determine whether sterile seawater could become significantly contaminated by contact with the beach sands. Monitoring of Inner Cabrillo Beach at CB02 is carried out in the shallow swash zone at the beach face where high concentrations of fine suspended sediments and less dense organic (detrital) materials are often observed. A few test samples sent to the laboratory where very fine beach drift sand or organic particulates from the swash zone yielded much higher bacterial analyses results. Therefore, it was desired to test whether these materials would result in differing bacterial results if incorporated into the analytical cultures. As described above, the ability of sand from the beach to leach indicator bacteria into seawater was determined by extracting the sand sample with sterilized seawater in a standardized test. As an experiment, three protocols were used to test suspended and offshore fine sediments from the eelgrass beds. The thesis was that finer or less dense organic particles may settle much slower than would coarse sand from a beach. If such particles contain bacteria they would raise bacterial counts if fine enough to be included into the analyses cultures. If the laboratory followed protocol of first shaking the sample and immediately sub-sampling these particles would be expected to affect the analyses. The experimental modified protocols were as follows:

71
Figure 62. Particulate & Detrital Materials, Swash Zone High Tide Range Conditions, Inner
Cabrillo Beach.

72
• Particulate Sample Protocol (PSP). This protocol involved adding about either 10 or 25 ml of sand to a bacteria vial. Either a 10:1 or 4:1 water to sediment sample ratio was used in different tests carried out. Sterile seawater was added to bring the total volume to 100 ml. The sample was shaken for one minute and an aliquot was drawn immediately with a pipette and analyzed (at both Associated Laboratories and the field laboratory). This protocol included the fine sediments of the sample into the bacteria analyses cultures.
• Modified Particulate Extraction Protocol (MPEP). This protocol followed the PSP except the sample was shaken for one minute and allowed to settle for only 30 seconds.
• Sand/Particulate Extraction Protocol (SPEP). This protocol was basically that followed previously for the Inner Cabrillo sand extractions and was the same as the PSP except the sample was shaken for one minute and allowed to settle for 10 minutes.
These methods were not intended to mimic the particle concentrations that actually exist in the swash zone but to demonstrate whether these natural particles could significantly influence concentrations measured by the monitoring methods. Thus arbitrary 10:1 and 4:1 sterile seawater to particle ratios by volume were used in this exploratory work. Both Colilert/Enterolert Chromogenic Substrate (CS) Test Kits were used as well as standard laboratory Multiple Tube/Membrane Filter (MTF/MF) methods for indicator bacteria analyses (See Technical Appendix B). Results were compared between the two analytical methods when possible to see the effects of particulates on both methods. Several studies have been conducted to compare the CS test procedures to both MTF and MF techniques. Abbott et al. (1998) provided an initial evaluation of the Enterolert test and noted that this procedure was an improvement over the MF test due to problems with the particulates obstructing contact of the target organisms with the agar surface. Counting of colonies was also cited as an issue when large amounts of particulate material were present. Highly turbid samples needed to be subjected to sample dilution and repeated filtration. Testing turbid samples with Enterolert was not found to be problem since the fluorescence was not obscured by turbidity. Noble et al. (2004) Griffith et al. (2004) conducted an extensive comparison and verification of CS methods with both MTF and MF methods for sampling conducted in ambient coastal waters of Southern California. He found all three methods to provide comparable results. Griffith’s study used a consistent procedure of not counting weakly fluorescing cells based upon verification studies that suggested that these cells were false positives. This is in contrast to current recommendations by IDEXX, the manufacturer of the test kits, that weakly fluorescing cells be included. Noble et al. (2004) reported similar results when the CS, MTF and MF methods were compared in stormwater-affected waters along open sandy beaches, rocky shorelines, and beach areas near urban runoff outlets. Again, no substantial differences were noted in the different test methods. Suspended particulate materials collected from the swash zone and from the nearshore eelgrass beds were sampled and analyzed by the experimental protocols described above in order to investigate whether these particles could influence analyses of bacterial indicators at CB02. Details of these experiments are presented in Technical Appendix D. However, the results indicate that inclusion of these natural particulate materials into the laboratory analyses samples has a major impact on results obtained. Typically, samples with particulates included yield high concentrations of indicator bacteria. Furthermore, working with two-phase samples with particulate materials that vary as to grain size and particle densities introduces additional variability. Tables 7 and 8 briefly summarize some of the results. Table 7 shows that generally high concentrations of indicator bacteria were measured when particles were included in the analyses and compares results using both the standard Chromogenic Substrate test methods and the Multiple Tube/Membrane Filter methods. Data in Table 8 compare the three different extraction methods (which vary settling times used in the analyses) and the two analytical approaches (Chromogenic and MTF/MF).

73
Table 7. Comparison of Concentrations of Fecal Indicator Bacteria Measured in Particulate
Samples using Chromogenic Substrate Test Kits and Standard Laboratory Test Methods, at 10:1 Seawater to Sediment Ratio with PSP Extraction Protocol, June 7-8, 2005.
Medium Fecal
Indicator Bacteria
Colilert/Enterolert Ranges
(#/100 ml)
Multiple Tube/ Membrane Filter Ranges
(#/100 ml) Total Coliform 4,800 - >24,000 40-80
E. coli <10 <20 Cabrillo Beach Soils Enterococcus >24,000 70 -3500 Total Coliform <10 - >24,000 300 - 1,300
E. coli <10 - 6,900 300 - 1,300 Detrital Plant Material Enterococcus <10 - >24,000 630 - 1,000 Total Coliform 3,000 - >24,000 1100 - >160,000
E. coli 2,700 - >24,000 1100 - >160,000 Swash Zone Suspended Sediment
Enterococcus >24,000 1400 - 993,000 Total Coliform 500 - >24,000 500 -2,400
E. coli 500 - 2,400 700 - 5,600 Cabrillo Beach Eelgrass Surface Sediment (<0.5 inches) Enterococcus >24,000 700 - 5,600
Total Coliform 75 20 E. coli 10 <20
Cabrillo Beach Eelgrass Deep Sediments (>11 inches) Enterococcus >24,000 50 Table 8. Fecal Indicator Bacteria Measured in Swash Zone Suspended Sediments and
Surficial Eelgrass Bed Sediments Using Three Extraction Methods at 10:1 Seawater to Sediment Ratio and Two Analytical Approaches, June 7 -8, 2005.
Extraction Protocol Medium and Method
Fecal Indicator Bacteria PSP1 MPEP2 SPEP3
Swash Zone Suspended Sediment #/100ml #/100ml #/100ml
Total Coliform >24,196 >24,196 >24,196 E. coli 4400 2000 6200 Colilert/Enterolert
Enterococcus 2000 2500 2200 Total Coliform 300 130 230
E. coli 110 40 80 Multiple Tube/Membrane Filter Enterococcus 2500 800 3100 Eelgrass Bed Sediment #/100ml #/100ml #/100ml
Total Coliform 500 350 183 E. coli 350 240 119 Colilert/Enterolert
Enterococcus >24,196 318 97 Total Coliform 80 <20 <20
E. coli <20 <20 <20 Multiple Tube/Membrane Filter
Enterococcus 300 40 <10 1. PSP - Particulate Sample Protocol, 10 grams of sediment brought to volume of 100 ml with sterile seawater,
shaken and immediately subsampled with pipette. 2. MPEP – Modified Particulate Extraction Protocol, same as PSP but allowed to settle for 30 seconds prior to
subsampling with pipette. 3. SPEP – Sand/Particulate Extraction Protocol, same as PSP but allowed to settle for 10 minutes prior to
subsampling with pipette.

74
Sediment and other particulate matter have been documented to act as reservoirs, provide conditions for re-growth, and assist in transport of fecal indicator bacteria (Appendix D, Section 3.1.1). The results of this investigation indicate that particulate matter may also play an important role in development of periodic high concentrations of bacteria in the swash zone. The presence of particulates in water samples can heavily influence water quality test results depending upon the unique characteristics of the particles, as well as the specific test method used to measure concentrations of fecal indicator bacteria. These factors can lead to very substantial and widely varying differences in water quality measurements due to the presence of particulates in samples. The type or source of particulate material in the samples can also impact tests. Results of testing with IDEXX Colilert and Enterolert test kits can result in very different results that appear to be respond differently depending upon the source and characteristics of particles in the samples. Unfortunately, no comparisons have been performed that focus on sediments or highly turbid samples. Studies conducted at Inner Cabrillo Beach clearly show that higher concentrations of particles can produce very different results using different test procedures. Studies conducted at Inner Cabrillo Beach were not designed to provide extensive methods comparison, nor to develop new protocols. Instead investigations were intended to explore the potential influence of sediments, detrital organic materials, and the high biomass of the nearshore eelgrass beds. The field investigations of particulate-associated bacteria and their potential influence on water quality resulted in the following findings. • Bacterial violations at Inner Cabrillo Beach have been shown to correlate with tide range,
specifically with low tide conditions followed by higher range tides (Technical Appendix A). • Eelgrass beds provide a potential reservoir and source of bacteria to the swash zone. Eelgrass
beds exist just offshore of Inner Cabrillo Beach and are exposed at extreme tides. As documented in the video survey and photographs taken at low tide, these eelgrass beds exist throughout most of the area enclosed for swimming. Video survey results shows that sediments in these areas are very fine and easily suspended into the water column and that suspended material also contains detrital organic matter with reduced particle densities. Disturbances can be due to both swimmers/wades and wind or wave action during periods of minus tides. Once disturbed, the normal winds induce onshore transport of bottom waters that can transport the sediments towards the beach face. Resident times of bottom water at the beach face are long, in the order of 8-10 hours (Technical Appendix C).
• Analyses of the surficial sediments within the eelgrass beds indicates that these fine sediments harbor elevated levels of fecal indicator bacteria especially if these particle enter the culture media associated with the bacteria analyses protocols. Examination of sediment profiles with depth indicated that concentrations of fecal indicator bacteria progressively decreased with depth.
• Fine suspended particulates collected from the swash zone were found to have high concentrations of fecal indicator bacteria. Based upon our limited testing, bacteria associated with these particulates gave similar concentrations whether the samples were taken immediately after shaking or after allowing ten minutes of settling. The Colilert test resulted in dramatically higher concentrations of total coliform and E. coli than were obtained from MTF tests yet the lack of change with extended settling was consistent for both tests. In contrast, the Enterolert test was found to provide similar results to those obtained with the MF procedures.
• Bacterial measurements of two-phase samples were found to result in highly variable results that were influenced both by the characteristics of the particles and the test methods. Bacterial measurements of surficial sediments from the eelgrass beds using different test methods and extraction procedures were found to exhibit much different characteristics than those of suspended particulates from the swash zone. Concentrations of all fecal indicators decreased substantially when allowed to settle for periods of 30 seconds and 10 minutes. Decreases in

75
concentrations were most dramatic for enterococcus. The rapid removal of enterococcus through settling of particulates was most extreme when analyzed by the Enterolert method.
Inner Cabrillo Beach is unique among other local sheltered beaches in having dense eelgrass beds located a few feet from the beach face. These exploratory results indicate that the inclusion of particulates from the eelgrass bed sediments and associated detrital materials can dramatically affect the levels of indicator bacteria measured in water samples. High concentrations of particulates are often observed in the swash zone of Inner Cabrillo Beach where the monitoring samples are taken and the exceedances of water quality standards correlate with tide, especially with situations following low erosive tide conditions. Based upon these exploratory results, it is hard to envision that the excessive bacterial exceedances measured at Inner Cabrillo Beach are not influenced by this reservoir of particulate and organic matter. Inclusion of only small amounts of these particulate materials could easily raise enterococcus concentrations above the 104 counts/100 ml water quality objective. 6.7 Birds and Other Local Animals Cabrillo Beach and its adjacent waters serve as roosting or foraging habitat for high numbers of birds, mainly gulls and their allies (Figure 63). Several studies of bird use of the beach and its environs have been conducted both independently and in concert with issues surrounding elevated levels of bacterial pollution in the immediate vicinity. In September of 2000, an experimental bird exclusion structure was constructed in an attempt to reduce the high bacterial counts tentatively attributed to excrement from the birds roosting on the beach. 6.7.1 Bird Use at Inner Cabrillo Beach Bird occupation of the Cabrillo Beach and adjacent areas (total 8 habitats) comprises mostly gulls, terns and skimmers (Larinae) which together account for over 75% of the total birds in the Cabrillo Beach vicinity MEC 2001). Western Gulls (Larus occidentalis), Heermann’s Gulls (L. heermanni), Elegant Terns (Sterna elegans) and Black Skimmers (Rynchops niger) are the predominant species present on the beach. Other species groups present in significant numbers include waterfowl and upland birds, mainly Rock Dove (Feral Pigeon, Columba livia) and Common Crow (Corvus brachyrhynchos) which comprise 17% and 4% of the total, respectively. Cabrillo Beach bird count data provided by the Cabrillo Marine Aquarium reveal that the predominant beach use is by gulls, with pigeons and terns also present in substantial numbers (L. Chilton, pers. comm. 2003). During the present study, bird counts were also carried out during the period of May 2003 to August 2005 but irregularly and incidental to other samplings being done at Inner Cabrillo Beach. Bird counts typically ranged from less than a 100 to close to 600 birds present at a given time. Interestingly, no birds use the beach at night. Birds come at dawn and leave at dusk. This fact has interesting implications. New contamination of the beach, particularly down in the swash zone would need to occur between dawn and 9 to 10 am in the morning when the site CB02 is sampled for the day, and then be transferred down beach from the northern area used by the birds to the southern area where the monitoring site CB02 is located in front of the lifeguard stand. Bird use at site CB02 has remained uniformly very low, as determined by general observation and when counted. When present, birds can contribute significant fecal contamination within the intertidal area (Figure 64).

76
Figure 63. Sea Gulls and Terns on Cabrillo Beach.

77
Figure 64. Bird Excrement on Northern Part of Inner Cabrillo Beach. 6.7.2 Other Local Animals Dogs are currently prohibited from being on the beach at Inner Cabrillo Beach and there is signage informing the public. Nevertheless, some beach use by dogs occurs as well as leashed dogs being present in the upland park adjacent to the beach. A sizable population of feral cats live at Cabrillo Beach, many in the rocks out along the inner side of the breakwater and others along the edges of the wetland just to the north. These cats are cared for and fed by a small group of residents. They have scheduled their days so that food and water are provided everyday. They are familiar with almost all of the cats. They also provide other services, including trying to tame and condition some of the cats for adoption and/or neutering them to keep the population down. Cats are also undoubtedly dropped off at Inner Cabrillo Beach or elsewhere in the area by some members of the large urban population. The current number of feral cats is reputed to be approximately 45 according to a personal conversation with a caregiver. Signage at Inner Cabrillo Beach warns against feeding feral cats, as well as against dropping off cats for abandonment. However, since these cats are so important to the caregivers and some are elderly, a tolerant policy is in effect. An unknown but sizable number of raccoons also reside at Inner Cabrillo Beach. It is not unusual to see as many as a dozen come out of the wetland margins at night to forage along the breakwaters or in the park. At times, this problem has been exasperated by excess garbage and inadequate capacity for trash removal. Data are not available on other rodents that may be present, though the feral cats might be a deterrent.

78
Inner Cabrillo Beach apparently is not heavily used by marine mammals. Sea lions do not haul out frequently on the nearby rock groins, breakwater, or dock. On rare occasions they have been observed offshore in the eelgrass beds. 6.7.3 Bird Exclusion Structure In order to reduce the number of birds particularly the large number of gulls using the beach, a bird exclusion structure was constructed in September 2000 along with implementation of a covered trash can program at the beach. The structure covered only the southern part of the lower beach and intertidal area. The bird exclusion structure consisted of long galvanized fence poles placed in a grid fashion, approximately 80 feet apart in the north south direction parallel to the beach and 60 feet apart in the east/west direction across the lower beach and intertidal area. A schematic of the beach coverage is shown in Figure 65 and views of the structure are shown in Figure 66. Dacron braid was strung in a crisscross pattern from the top of the poles. The initial report from the Environmental Affairs Department on the efficacy of the bird exclusion structure at Inner Cabrillo Beach suggested that the structure had a positive impact on water quality in the exclusion area (City of Los Angeles, 2001). However, this preliminary conclusion was based upon bird use observations and bacterial monitoring comparisons for a short period of months before and after the structure was erected and bird count data were irregular over this time period. A subsequent study completed in January of 2003 confirmed the initial findings of the 15 February 2001 report (Dalkey and Bahariance, 2003). This study found significantly decreased bird use of the beach beneath the bird exclusion structure compared to the non-excluded part of the beach. Although total numbers of birds on the beach varied widely between surveys, the area beneath the bird exclusion structure had, on average, 95% fewer birds than the uncovered area. Bacteria levels were, on average, 20% higher at the site outside of the bird exclusion structure than at the sample site CB02 under the structure. The frequency of exceedances of the California State Bathing Water standards decreased by 65% following the installation of the bird exclusion structure (Dalkey and Bahariance, 2003). In spite of this apparent success two problems remained. The first problem is that even though the number of violations of water quality standards as measured at the monitoring site CB02 were down, they were still unacceptably high. Inner Cabrillo Beach remained unique in the high number of violations, particularly noticeable in the dry weather periods when other stormwater related issues were not at work. Secondly, some years after the structure was emplaced were dry years, with rainfall in the 2001-2002 wet season totaling about 2 inches and the following 2002-2003 and 2003-2004 wet seasons totaling 8.6 and 7.3 inches compared to an expected average of over 12 inches of rainfall. Earlier years in the ten-year record have also shown lower frequencies of violations indicating that variables other than the erection of the bird exclusion structure influence the number of violations. Therefore, with more data now available through the summer of 2005, it was desired to reexamine the apparent effect of the structure by comparing beach performance over longer periods of time. This was done by calculating average monthly percent of the time that exceedances (due to single sample events) occurred for the entire ten year record of monitoring data for CB02. The results are plotted in Figure 67.

79
Figure 65. Bird Exclusion Structure Erected on Inner Cabrillo Beach, September 2000.
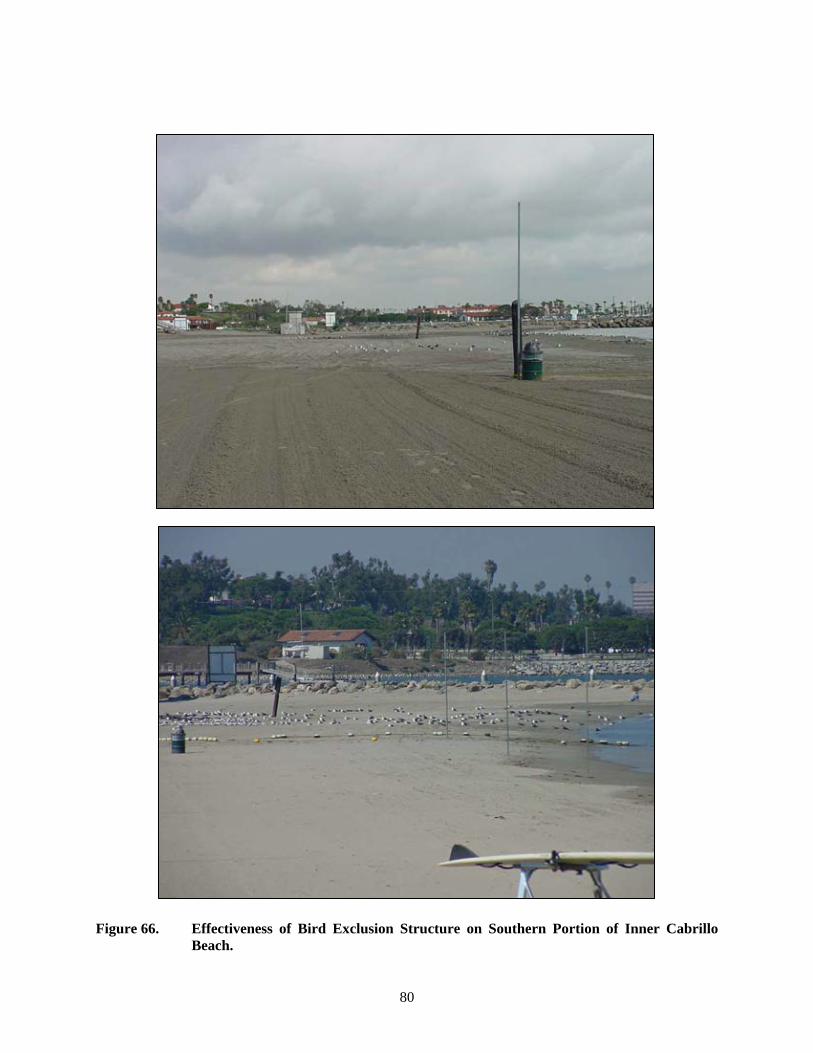
80
Figure 66. Effectiveness of Bird Exclusion Structure on Southern Portion of Inner Cabrillo
Beach.

81
0%
10%
20%
30%
40%
50%
60%
70%
80%
90%
100%
Jul
Aug
Sep
Oct
Nov
Dec
Jan
Feb
Mar
Apr
May
Jun
Jul
Aug
Sep
Oct
Nov
Dec
Jan
Feb
Mar
Apr
May
Jun
Jul
Aug
Sep
Oct
Nov
Dec
Jan
Feb
Mar
Apr
May
Jun
Jul
Aug
Sep
Oct
Nov
Dec
Jan
Feb
Mar
Apr
May
Jun
Jul
Aug
Sep
Oct
Nov
Dec
Jan
Feb
Mar
Apr
May
Jun
Jul
Aug
Sep
Oct
Nov
Dec
Jan
Feb
Mar
Apr
May
Jun
Jul
Aug
Sep
Oct
Nov
Dec
Jan
Feb
Mar
Apr
May
Jun
Jul
Aug
Sep
Oct
Nov
Dec
Jan
Feb
Mar
Apr
May
Jun
Jul
Aug
Sep
Oct
Nov
Dec
Jan
Feb
Mar
Apr
May
Jun
Jul
Aug
Sep
Oct
Nov
Dec
Jan
Feb
Mar
Apr
May
Jun
Jul
Aug
Sep
WET WET Dry WET WET Dry WET WET Dry WET WET Dry WET WET Dry WET WET Dry WET WET Dry WET WET Dry WET WET Dry WET1996 1997 1998 1999 2000 2001 2002 2003 2004 2005
Months, Season, and Year (1995 to 2005)
Perc
ent t
hat E
xcee
d St
ate S
tand
ards
1995
Bird Exclusion Implemented ►
45 Months Before Bird Exclusion --- 61% Average
Exceedances.
15 Months After Construction Finished.
45% Average Exceedances
45 Months After Bird Exclusion --- 33% Average Exceedances.
1995 to 2005 HYP Shoreline Station CB2 Monthly Percentages of Single Sample Enterococcus Concentrationsthat Exceed State Water Quality Standards for Bacteria Density (>104 bacteria per 100 ml).
Construction Started and Finshed ►
Figure 67. Monthly Averages of Percent of the Time Bacterial Water Quality Exceedances Occur at Inner Cabrillo Beach.

82
Selection of an appropriate range of times for comparison is somewhat arbitrary and will affect the specific numbers but not substantially change any conclusion. With reference to Figure 67 we selected a period of 45 months after the structure was emplaced. We cut off the summer of 2005 and treated it separately as unusual events influenced this time period. A water main up above the entrance to Inner Cabrillo Beach was leaking probably throughout the summer and broke in August. Though freshwater from surface runoff did not reach the beach from this source, the dry monitoring data clearly showed that contamination from Stephen White Drive was affecting the beach. Early that spring sanitary and storm sewer leaks local to the south end of the beach had also been repaired. Then later in the year, record rainfalls (29.4 inches) also may be reflected in these monitoring data. For the comparisons before and after construction of the bird exclusion structure, an equal interval of 45 months was selected. The results show that the percent of the time that exceedances occurred dropped from 61% of the time to 33% of the time during these two 45 month periods. Exceedances then went up to 44% of the time during 2005 probably because of the unusual factors discussed above for that time period. Reductions in violations based upon single sample exceedances approximate 45% for summer dry, 34% for winter dry, and 43% for winter wet periods. Thus initial impressions and short-term data analyses, additional analyses, and later longer-term data analyses provide substantial evidence that suggests that the bird exclusion structure has reduced the number of violations of bacteria water quality standards at Inner Cabrillo Beach. However, the percent of the time exceedances occur is still 33% of the time, dropping briefly in dry weather to 6-20 %. Both exceedance frequencies are way above the new Los Angeles Regional Water Quality Board TMDL requirements. Prior to installation of the bird exclusion structure, bird usage on the southern portion of the beach had historically been lower than usage of the northern section of the beach. Following installation of the exclusion structure, gull usage of the southern portion of the beach further decreased, while pigeon use of the southern section of the beach remained approximately equivalent to the pre-installation usage. Post-installation bird usage of the exclusion area continued to be lower than usage of the non-excluded area. Total bird usage of the entire beach did not appear to change substantially. 6.7.4 Accretion of Additional Beach Area Inside Breakwater Sand transported from offshore over the breakwater by high waves, and fine sand transported across the breakwater due to wind erosion have been acting to accrete a beach along the inside of the breakwater extending from the area of the fishing pier to the main Inner Cabrillo Beach. Reputedly, this accretion has occurred during the past 10 years. This long beach (approximately 2000 feet in length) is now starting to be used by the public with access from the adjacent parking lots. It is also being used more and more by birds similar to their use of the recreational beach itself. A view of this beach from near Inner Cabrillo beach is shown in Figure 68. This beach area inside the breakwater is used by birds, particularly near the main recreational beach and near the Fishing Pier. Beach profiles along this inside beach get steeper as one goes eastward out toward the Fishing Pier.

83
Figure 68. New Beach Accreting on Inside of Breakwater Now Being Used by Birds. 6.7.5 Genetic Ribotyping Genetic ribotyping is a relatively new technique that can provide data on the ultimate host sources of bacteria found on Inner Cabrillo Beach. The purpose of this work was to develop data on the potential host sources for bacteria found on the beach, particularly the relative importance of bird sources and of sewage sources. Ribotyping was first proposed by Grimont and Grimont (1986) as a potential taxonomic tool for differentiating bacterial strains. Selander et al. (1987) demonstrated that clones of bacteria remain more or less independent due to very low rates of recombination. These studies formed the basis for use of ribotyping to identify host species for bacteria found in receiving water bodies (Scott et al. 2002). Initial use of ribotyping relied upon a use of a single restriction enzyme. Use of a single enzyme was found to be insensitive but ribotyping with two or more enzymes has been shown to be highly sensitive in the identification of host-specific lineages of bacteria (Samadpour 2002). Dr. Samadpour’s methods have been used successfully in a number of studies conducted in California (Environmental Health Services, 1999; Kitts et al., 2002; and MEC-Weston, 2004) and Washington (Herrera Environmental Consultants, 2001 and Repp and Milne, 2003). Ribotyping can thus be used as a taxonomic tool for differentiating bacterial strains. As applied using two or more enzymes this method is sensitive in the identification of host-specific lineages of bacteria. Applied to E. coli, bacteria colonies from the beach can be compared with samples from birds, dogs, human, etc. hosts in a database to ascertain potential sources. Multiple colonies of bacteria cultured from

84
multiple samples taken from a defined site over a time interval appropriate to interpretation are characterized and the percent contributions from various sources, such as humans or birds can be estimated. This method yields data as to the host species but does not tell us specifics of pathways to the beach. For example, if the results implicate birds we still do not know if this is due to bird contamination contributed to the beach the day sampling took place or from a reservoir of bacteria contamination built up locally by protracted use. The many samples to resolve such questions are not practical because of the effort and costs associated with this method. The ribotyping method used to identify sources of microbial pollution at Cabrillo Beach was as modified by Dr. Samadpour, termed Eco RI / Pvu II variant. All testing was conducted by the Institute for Environmental Health, Inc. under the direction of Dr. Samadpour. These genetic ribotyping techniques on E. coli bacteria were used to study host sources of bacteria present at CB02 on Inner Cabrillo Beach during dry weather periods in May and June of 2005. For each event, multiple samples were taken on a rising tide after a low tide, the condition where it might be expected that water quality violations could occur. During each sampling event a total of 50 samples were collected in sterile 100mL IDEXX bottles. Samples were collected at CB02 within the swash zone (ankle depth). The objective was to obtain a total of 100 isolates of E. coli from the 50 samples for each of the sampling events. Between two and five isolates can be obtained from each water sample. Pure cultures are developed and cultured for the 100 isolates and then subjected to the ribotyping process. Fecal source samples were also collected from local feral cats and gulls and from sewage collected directly from sanitary sewers at Cabrillo Beach. These source samples add to the existing library of source isolates and determine if any localized differences exist in relationships between host species and E. coli strains. A subset of ten samples from the fifty samples collected was tested for E. coli and total coliform bacteria using Colilert®-18 test kits during each sampling event. Results ribotyping tests of dry weather water samples are summarized in Table 9. Results indicated that birds accounted for between 36 to 56% of the E. coli contamination. Sewage was 10-12 % of the total. Feral cats, raccoons, domestic dogs, and rodents also contributed incrementally but this total for local terrestrial mammals was significant at 15-40%. These results are in general agreement with potential host sources observed at Inner Cabrillo Beach.
Table 9. E. coli Ribotyping Results, CB02, Dry Weather 2005. Source 3 May 2005 23 July 2005 Birds Feline Dog Raccoon Rodent Marine Mammal Sewage Unknown
56% 7% 3% 1% 4% 5% 12% 12%
36% 13% 10% 8% 9% 6% 10% 8%
6.7.6 Bird and Other Animal Conclusions The following conclusions may be drawn concerning bird and other animal sources of bacterial contamination at Inner Cabrillo Beach: • Bird use of Inner Cabrillo Beach is high, with numbers often approximating 100-150 birds, and
occasionally reaching almost 600 birds. Bird occupation of the Cabrillo Beach and adjacent areas comprises mostly gulls, terns and skimmers (Larinae). Western Gulls (Larus occidentalis),

85
Heermann’s Gulls (L. heermanni), Elegant Terns (Sterna elegans) and Black Skimmers (Rynchops niger) are the predominant species present on the beach. Other species groups present in significant numbers include waterfowl and upland birds, mainly Rock Dove (Feral Pigeon, Columba livia) and Common Crow (Corvus brachyrhynchos). Pelicans will occasionally and briefly be on the beach, usually when they are feeding actively in the shallow water just offshore.
• Bird use is heavily biased to the northern half of the beach outside the bird exclusion area with only occasional birds present on the southern swim area. Birds come at dawn and leave at dusk with no use at night.
• Beach accretion along the inside of the breakwater has established additional beach area that is now starting to be used by birds in addition to the northern area of the recreational Inner Cabrillo Beach itself.
• Both short time data analyses and later longer-term data analyses seem to support the fact that the bird exclusion structure has reduced the number of violations of bacteria water quality standards at Inner Cabrillo Beach. However, the percent of the time exceedances occur is still 33% of the time, dropping briefly in dry weather to 6-20 %. Both exceedance frequencies are way above the new Los Angeles Regional Water Quality Board TMDL requirements.
• Results of genetic ribotyping analyses during dry weather indicated that birds as host sources accounted for between 36 to 56% of the E. coli contamination. Sewage was 10-12 % of the total. Feral cats, raccoons, and domestic dogs and rodents also contributed incrementally but this total for local terrestrial mammals was significant at 15-40%. These results are in general agreement with potential host sources observed at Inner Cabrillo Beach.
In summary, analyses of beach monitoring data for additional years through the fall of 2005 indicate that the reduction of bacterial violations since the partial bird exclusion structure was erected apparently continues. Birds also were identified as significant host sources though other sources were also implicated. Recommended actions should include further management of bird sources at the beach. One option would be to extend the present structure over the entire beach and mitigate elsewhere if necessary. A more esthetic design with modern materials and significantly fewer poles is suggested. Additional management of other mammals would be a subsequent step if necessary as terrestrial mammals were found to be host sources of E. coli during dry weather testing at CB02. Human sources of 10-12% need to be addressed by other means. 6.8 Inner Cabrillo Beach Operations and Maintenance The Cabrillo Beach area is used extensively as an urban park, and educational and recreational area. Because of the extensive and varied public facilities and their heavy use by the Los Angeles urban population, Inner Cabrillo Beach operations and maintenance is a major task for the City and Port of Los Angeles. Operation and maintenance practices at Inner Cabrillo Beach are excellent and they are carried out very well by a dedicated staff. In spite of the varied uses and the high variations in number of people at Inner Cabrillo Beach at differing times, the beach and park facilities are remarkably clean and well maintained. This point is very important in that the Cabrillo Beach area is heavily used by the urban population and also contains extremely valuable natural, recreational, and educational resources to be maintained and protected. Cabrillo Beach is maintained by the City of Los Angeles Recreation and Parks Department and by the Port of Los Angeles as the landowner. City of Los Angeles Lifeguards operate out of a facility located at the Inner Cabrillo Beach. A City lifeguard boat operates from the dock located near the launch ramp at Inner Cabrillo Beach. Los Angeles County lifeguards have a similar facility on the breakwater with

86
responsibilities for the ocean side beaches, including Outer Cabrillo Beach. The Cabrillo Marine Aquarium also has a resident staff at Cabrillo Beach who add to the critical mass of City personnel both using and caring for the area. Management practices pertinent to the present bacterial contamination study include the following: • Inner Cabrillo Beach is posted frequently for public health due to violations of bacterial water
quality standards at the monitoring station CB02 located in front of the lifeguard station on the beach.
• Cabrillo Beach is closed during nighttime hours, and is patrolled by the Harbor Police. • Beaches are raked daily with a tractor to remove debris, primarily from floatables brought in by
the tide. These floatables include eelgrass and algae from the beds just off the beach, trash from the Harbor, and other materials originating from human use of Cabrillo Beach.
• Restrooms, trash removal, and other maintenance activities are performed daily. • Dogs are restricted to the upland parks on leash only, and are prohibited from Cabrillo Beach
itself. • Signs to control human activities are posted and include prohibitions on tents or camping on the
beaches, littering, open fires, alcoholic beverages and the like. • Signage also warns against feeding birds and feral cats. • Additional signage reminds the public to pick up trash. 6.8.1 Sand Management A problem specific to Cabrillo Beach is the necessity for raking of trash, debris, dead algae, eelgrass, or kelp that washes up on Inner Cabrillo Beach daily (Figures 69 and 70). Depending upon wind and tide conditions, debris from elsewhere in the Port also deposits on the beach. Water circulation along the beach face (Appendix C, this study) consists of slow tidal currents under calm conditions and a two-layer, wind dominated circulation when wind is blowing. The normal diurnal winds are strongly from the SW and cause an onshore bottom current to the beach with the surface moving offshore. During conditions of onshore winds such as associated with storm events, surface floatables are driven onto the beach by the wind and tide. During major rain events, large amounts of urban trash enter the Harbor from Dominguez Channel, the Los Angeles River, and local storm drain systems. Under the right conditions, some of this material can be deposited on Inner Cabrillo Beach or in the eelgrass bed. Under conditions of lower tides, considerable locally generated algae and eelgrass detrital materials are brought ashore and deposited with the falling tide. Also, depending upon beach use, locally generated trash accumulates on the beach. This is exasperated by the often westerly diurnal winds that blow plastics and paper to the beach and water. Sand grooming is carried out 5 days per week at Inner Cabrillo Beach by the Recreation and Parks Department. A tractor equipped with a bucket, rake and/or drag is used to clean debris from the sand and to regrade the sand (Figures 71 and 72). This is done each weekday starting about 6:30 am prior to public arrival at Cabrillo Beach. In addition, a specially designed (Herrington) sand sifter machine is available to clean debris from the beach sand (Figure 73). Presently, excess sand raked to the south end of the beach is removed (Figure 74) and trucked back to the northern end for redistribution, usually deposited near the Lifeguard Building at the northern end and re-spread on the upper beach. Trash and debris raked from the beach and sand are loaded into a dump truck

87
Figure 69. Trash Piles Being Readied for Removal at Inner Cabrillo Beach.
Figure 70. Trash Deposited on Inner Cabrillo Beach by Onshore Winds and Tide.

88
Figure 71. Front End Loader Used to Maintain the Inner Cabrillo Beach.
Figure 72. Rake is Used Extensively to Gather Trash and to Groom the Beach Sands.

89
Figure 73. Herrington Beach Sand Grooming Equipment.
Figure 74. Clearing Sand at Inner Cabrillo Beach.

90
and hauled to a landfill by Park and Recreational staff. Approximately one trip per week to the landfill is necessary for disposal of beach debris (Raul Leon, Recreation and Parks Department, Personal Communication). Occasionally, sand is deposited by the tractor along the inside of the breakwater where new beach has been accreting over the past 10 years from sand carried over the breakwater by waves and wind erosion from Outer Cabrillo Beach. Some sand piles on the inner side of the breakwater have plant content, which tends to raise the organic content of the sand along this beach. Since this beach along the breakwater is now being used more by birds it would be best to keep the beach sand as clean of organic materials as possible. Thus only clean sand should be placed on this beach along the breakwater. Birds arrive at dawn and daily bacterial sampling of the southern part of the beach (CB02) occurs a few hours later. Present practice is to rake the area along the high tide line and above, but to generally leave the lower intertidal area to be cleaned by the next flood tide. Thus at higher elevations, fecal material is raked into the sand. Beach sand extractions with sterile seawater do not yield particularly high contamination in the extract, unless the fecal material itself is included in the sample. Consideration has been given to removal of the fecal material from the sand as a corrective measure. One option considered would be to scrape a thin surface layer of sand up using the Herrington beach grooming machine modified to retain sand. This sand would then be cycled to a designated area on the upper beach (such as near the Lifeguard Headquarters on the northern beach by the launch ramp) to bake in the sun before recycling back to the beach. However, this process would need to include the lower intertidal area and possibly very early in the morning before beach monitoring was conducted. Thus this process would be very labor intensive. It would also require the equipment to operate in the lower intertidal area where it could be subject to seawater corrosion and softer substrates. The alternative of extending the bird exclusion structure was thus considered to be more practical, far less problematical, and much more cost effective. The present practice of recycling sand from the raking process, where sand that has had most of the trash and debris removed is placed at the northern upper beach to be later re-spread, seems to be a practical step to accomplish part of this operation without undue effort and expense. 6.8.2 Trash/Garbage and Picnic Areas Because of the large number of visitors at Cabrillo Beach and the Cabrillo Marine Aquarium, collection and disposal of trash and garbage generated is a major task. A sufficient number of trash containers apparently exist at Inner Cabrillo Beach and these are covered containers to discourage bird use. The maintenance staff also have an aggressive schedule of clean up, especially important during heavy use periods of weekend or holiday use. Additional dumpster and garbage service has been necessary to solve past problems of secure garbage storage and special dump runs. Heavy bird use of Inner Cabrillo Beach has been implicated as an important local source for water quality violations at the beach face causing exposure of beach users. In addition, exposure to bird feces at the picnic areas, particularly the picnic tables at the beach (Figures75 and 76) needs to be minimized by new methods of cleaning tables and/or exclusion of birds, mostly gulls.
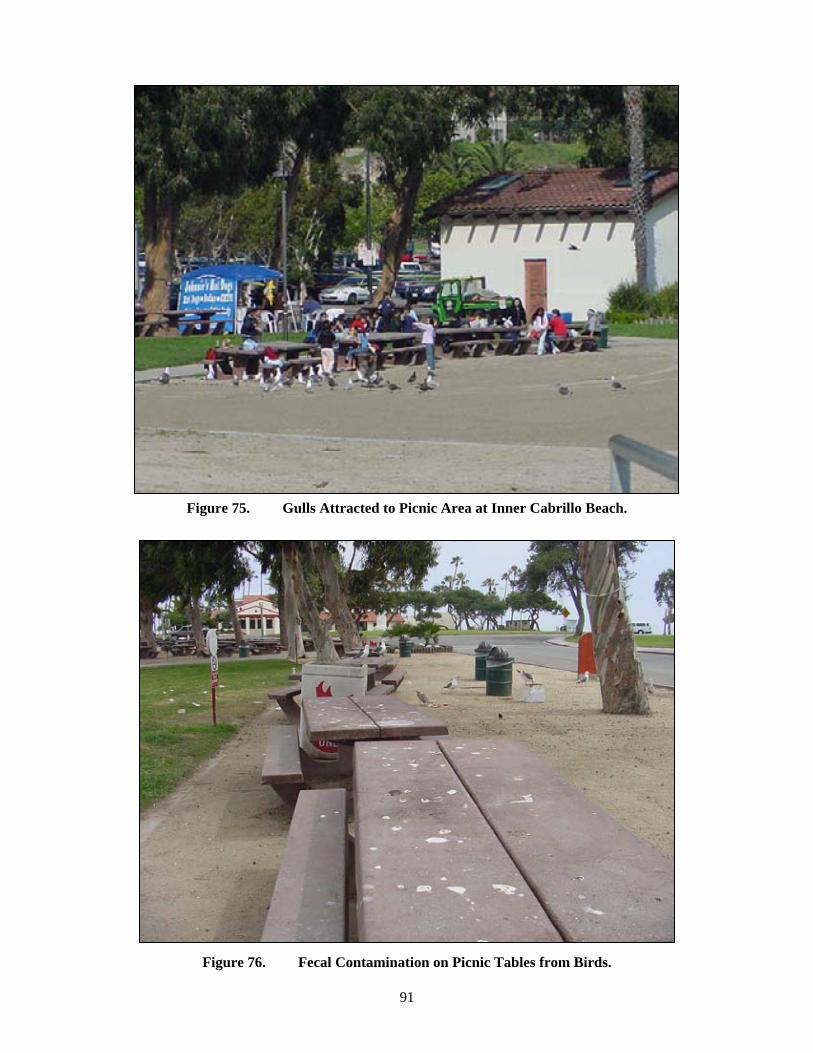
91
Figure 75. Gulls Attracted to Picnic Area at Inner Cabrillo Beach.
Figure 76. Fecal Contamination on Picnic Tables from Birds.

92
6.8.3 Conclusions on Operations and Maintenance Conclusions on Operation and Maintenance practices at Inner Cabrillo Beach are as follows: • Operation and maintenance practices at Inner Cabrillo Beach are excellent and are carried out
very well by a dedicated staff. In spite of the varied uses and the high variations in number of people at Inner Cabrillo Beach at differing times, the beach and park facilities are remarkably clean and well maintained.
• The present practice of recycling sand from the raking process that removes most of the trash and debris, then recycles separated sand that accumulates back to the northern upper beach to be later re-spread seems to be a practical step to recycle sand without undue effort and expense. The alternative of extending the bird exclusion structure was considered to be more practical, far less problematical, and much more cost effective than physically removing bird excrement and sand from the intertidal area and treating on the upper beach. Only clean sand should be placed on the beach accreting on the inside of the breakwater in order to minimize particulate and organic materials on this beach.
• Additional trash and garbage dumpsters and more frequent disposal would greatly aid the local maintenance staff to prevent attractive food from birds, feral cats, raccoons and other local animals.
• Improvements need to be made at the picnic areas to avoid attracting gulls and to prevent or clean excessive contamination of the picnic tables and nearby areas.
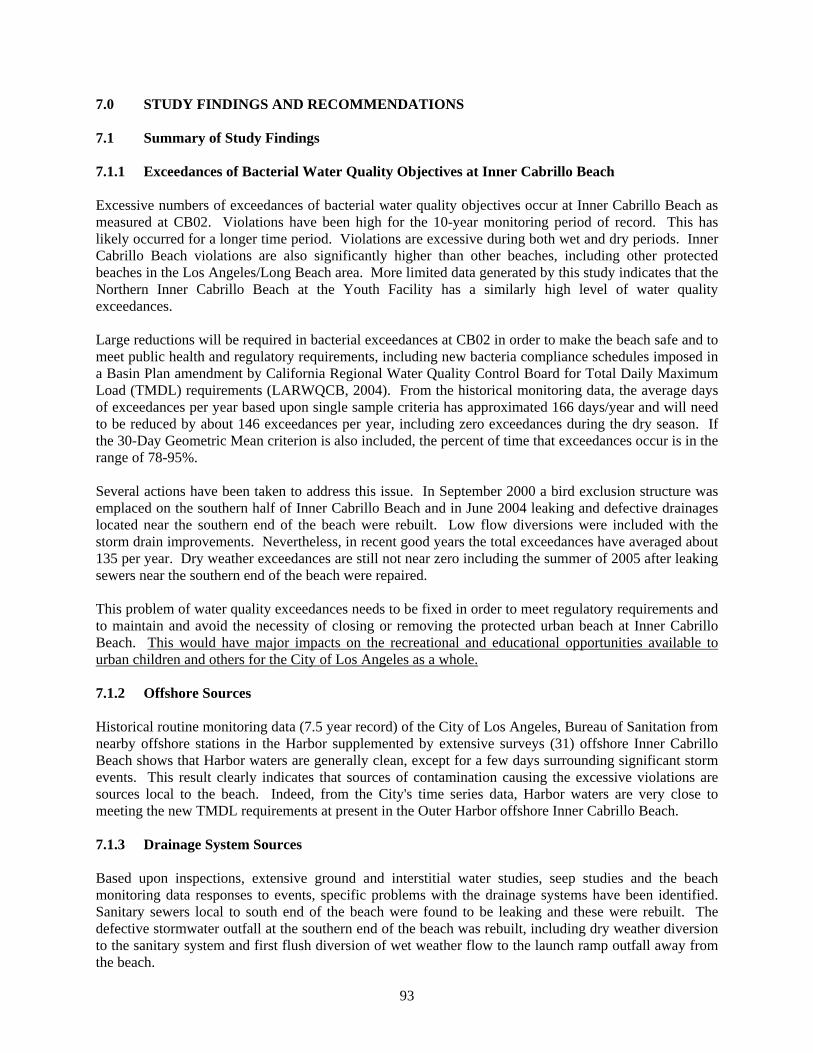
93
7.0 STUDY FINDINGS AND RECOMMENDATIONS 7.1 Summary of Study Findings 7.1.1 Exceedances of Bacterial Water Quality Objectives at Inner Cabrillo Beach Excessive numbers of exceedances of bacterial water quality objectives occur at Inner Cabrillo Beach as measured at CB02. Violations have been high for the 10-year monitoring period of record. This has likely occurred for a longer time period. Violations are excessive during both wet and dry periods. Inner Cabrillo Beach violations are also significantly higher than other beaches, including other protected beaches in the Los Angeles/Long Beach area. More limited data generated by this study indicates that the Northern Inner Cabrillo Beach at the Youth Facility has a similarly high level of water quality exceedances. Large reductions will be required in bacterial exceedances at CB02 in order to make the beach safe and to meet public health and regulatory requirements, including new bacteria compliance schedules imposed in a Basin Plan amendment by California Regional Water Quality Control Board for Total Daily Maximum Load (TMDL) requirements (LARWQCB, 2004). From the historical monitoring data, the average days of exceedances per year based upon single sample criteria has approximated 166 days/year and will need to be reduced by about 146 exceedances per year, including zero exceedances during the dry season. If the 30-Day Geometric Mean criterion is also included, the percent of time that exceedances occur is in the range of 78-95%. Several actions have been taken to address this issue. In September 2000 a bird exclusion structure was emplaced on the southern half of Inner Cabrillo Beach and in June 2004 leaking and defective drainages located near the southern end of the beach were rebuilt. Low flow diversions were included with the storm drain improvements. Nevertheless, in recent good years the total exceedances have averaged about 135 per year. Dry weather exceedances are still not near zero including the summer of 2005 after leaking sewers near the southern end of the beach were repaired. This problem of water quality exceedances needs to be fixed in order to meet regulatory requirements and to maintain and avoid the necessity of closing or removing the protected urban beach at Inner Cabrillo Beach. This would have major impacts on the recreational and educational opportunities available to urban children and others for the City of Los Angeles as a whole. 7.1.2 Offshore Sources Historical routine monitoring data (7.5 year record) of the City of Los Angeles, Bureau of Sanitation from nearby offshore stations in the Harbor supplemented by extensive surveys (31) offshore Inner Cabrillo Beach shows that Harbor waters are generally clean, except for a few days surrounding significant storm events. This result clearly indicates that sources of contamination causing the excessive violations are sources local to the beach. Indeed, from the City's time series data, Harbor waters are very close to meeting the new TMDL requirements at present in the Outer Harbor offshore Inner Cabrillo Beach. 7.1.3 Drainage System Sources Based upon inspections, extensive ground and interstitial water studies, seep studies and the beach monitoring data responses to events, specific problems with the drainage systems have been identified. Sanitary sewers local to south end of the beach were found to be leaking and these were rebuilt. The defective stormwater outfall at the southern end of the beach was rebuilt, including dry weather diversion to the sanitary system and first flush diversion of wet weather flow to the launch ramp outfall away from the beach.

94
Other events (water main break, record winter rains) obscured the beach response. Subsequent 2005 dry weather data was as good or better than recent good years, including a long period of good performance in the late fall and early winter. However, dry weather exceedances are still not close to zero. These exceedances generally correlate with the occurrences of low tides approaching 0 MLLW or less and the associated higher tidal range of these events. The beach response to the water main break up on the bluff in San Pedro provided strong evidence for a contamination source off Port property up on Stephen White Drive that was reaching the beach. Renewed efforts finally found an old abandoned sewer outfall, apparently contiguous to the beach from the base of the bluff. In this area of Stephen White Drive the present sanitary sewers are in the vicinity of old sanitary and storm water tunnels as well as abandoned connections to the old outfall. These sewers have not been pressure tested to detect seepage of contamination or some underground connection to the old outfall drain. Other contamination sources or other transport paths were not found by the ground water testing efforts though proof of a negative is always difficult. Specifically, a contaminated freshwater source could not be found up-gradient from the persistent brackish water seep in the southern corner of the beach. Initially thought to be a smoking gun indicating an upstream contamination leak, the fresh groundwater was found to be clean with the saline water apparently causing the contamination. 7.1.4 Beach Sand, Stormwater Discharges and Beach Flooding Beach sand at Inner Cabrillo Beach was not found to easily leach bacterial contaminants into sterile seawater and bacterial concentrations were similar to that found by investigators at other beaches. However, stormwater flowing over the beach sands were of course found to be highly contaminated. Almost all storms in the 2004-2005 wet season of record rains overflowed to the beach as the diversion was not sized for these large events. Sand in front of the overflow outfall after a stormwater discharge were found to be contaminated but to recover over a period of days. A unique feature of Inner Cabrillo Beach is beach flooding and ponding back behind the beach berm caused by the higher tide conditions. Flooding occurs at about +7 feet MLLW or lower if surge is present. The beach takes about 12 hours to drain because of poor permeability. Contaminants are brought to the beach if the swash zone in contaminated and birds are attracted to the ponds. 7.1.4 Birds and Other Mammals Bird use of Inner Cabrillo Beach is high, with numbers often approximating 100-150 birds, and occasionally reaching almost 600 birds. Bird occupation of the Cabrillo Beach and adjacent areas comprises mostly gulls, terns and skimmers (Larinae). Western Gulls (Larus occidentalis), Heermann’s Gulls (L. heermanni), Elegant Terns (Sterna elegans) and Black Skimmers (Rynchops niger) are the predominant species present on the beach. Other species groups present in significant numbers include waterfowl and upland birds, mainly Rock Dove (Feral Pigeon, Columba livia) and Common Crow (Corvus brachyrhynchos). Pelicans will occasionally and briefly be on the beach, usually when they are feeding actively in the shallow water just offshore. Bird use is heavily biased to the northern half of the beach outside the bird exclusion area with only occasional birds present on the southern swim area. Birds come at dawn and leave at dusk with no use at night. Beach accretion along the inside of the breakwater has established additional beach area that is now starting to be used by birds in addition to the northern area of the recreational Inner Cabrillo Beach itself.

95
Both short time data analyses and later longer-term data analyses seem to support the fact that the bird exclusion structure has reduced the number of violations of bacteria water quality standards at Inner Cabrillo Beach. However, the percent of the time exceedances occur is still 33% of the time, dropping briefly in dry weather to 6-20 %. Both exceedance frequencies are way above the new Los Angeles Regional Water Quality Board TMDL requirements. Results of genetic ribotyping analyses during dry weather indicated that birds as host sources accounted for between 36 to 56% of the E. coli contamination. Sewage was 10-12 % of the total contamination. Feral cats, raccoons, and domestic dogs and rodents also contributed incrementally but the combined contribution from all local terrestrial mammals was significant at 15-40%. These results are in general agreement with potential host sources observed at Inner Cabrillo Beach. In summary, analyses of beach monitoring data for additional years through the fall of 2005 indicate that the reduction of bacterial violations since the partial bird exclusion structure was erected has apparently persisted. Birds also were identified as significant host sources though other sources were also implicated. 7.1.5 Particulate Materials and Nearby Eelgrass Beds Bird use of Inner Cabrillo Beach contributes local bacterial contamination. However, birds are absent at night but come at dawn and use the northern half of the beach. Bacterial monitoring of the beach is done around 9-10 am, leaving only about 3-5 hours, depending on the season, for contamination to be generated at the beach and transported southward to the monitoring site located in front of the lifeguard stand on the southern portion of the beach. Therefore, it was thought that a reservoir of contamination may exist at the beach that stores or cultures bacteria and accounts for the uniquely high number of violations in dry weather as well as in wet weather conditions. Inner Cabrillo Beach is unique in that dense eelgrass beds exist right off the beach face. Therefore the possibility was explored that these beds could act as a reservoir or a storage mechanism that might account for the uniquely high number of violations measured at the monitoring site CB02. Bacterial violations at Inner Cabrillo Beach have been shown to correlate with tide range, specifically with low tide conditions followed by higher range tides. Eelgrass beds provide a potential reservoir and source of bacteria to the swash zone. Eelgrass beds exist just offshore of Inner Cabrillo Beach and are exposed at extreme tides. As documented in the video survey and photographs taken at low tide, these eelgrass beds exist throughout most of the area enclosed for swimming. Video survey results shows that sediments in these areas are very fine and easily suspended into the water column and that suspended material also contains detrital organic matter with reduced particle densities. Disturbances can be due to both swimmers/wades and wind or wave action during periods of minus tides. Once disturbed, the normal winds induce onshore transport of bottom waters that can transport the sediments towards the beach face. Resident times of bottom water at the beach face are long, in the order of 8-10 hours. Analyses of the surficial sediments within the eelgrass beds indicates that these fine sediments harbor elevated levels of fecal indicator bacteria especially if these particle enter the culture media associated with the bacteria analyses protocols. Examination of sediment profiles with depth indicated that concentrations of fecal indicator bacteria progressively decreased with depth. Fine suspended particulates collected from the swash zone were found to have high concentrations of fecal indicator bacteria. Based upon our limited testing, bacteria associated with these particulates gave similar concentrations whether the samples were taken immediately after shaking or after allowing ten

96
minutes of settling. The Colilert test resulted in dramatically higher concentrations of total coliform and E. coli than were obtained from MTF tests yet the lack of change with extended settling was consistent for both tests. In contrast, the Enterolert test was found to provide similar results to those obtained with the MF procedures. Bacterial measurements of two-phase samples were found to result in highly variable results that were influenced both by the characteristics of the particles and the test methods. Bacterial measurements of surficial sediments from the eelgrass beds using different test methods and extraction procedures were found to exhibit much different characteristics than those of suspended particulates from the swash zone. Concentrations of all fecal indicators decreased substantially when allowed to settle for periods of 30 seconds and 10 minutes. Decreases in concentrations were most dramatic for enterococcus. The rapid removal of enterococcus through settling of particulates was most extreme when analyzed by the Enterolert method. Inner Cabrillo Beach is unique among other local sheltered beaches in having dense eelgrass beds located a few feet from the beach face. These exploratory results indicate that the inclusion of particulates from the eelgrass bed sediments and associated detrital materials can dramatically affect the levels of indicator bacteria measured in water samples. High concentrations of particulates are often observed in the swash zone of Inner Cabrillo Beach where the monitoring samples are taken and the exceedances of water quality standards correlate with tide, especially with situations following low erosive tide conditions. Based upon these exploratory results, it is hard to envision that the excessive bacterial exceedances measured at Inner Cabrillo Beach are not influenced by this reservoir of particulate and organic matter. Inclusion of only small amounts of these particulate materials could easily raise enterococcus concentrations above the 104 cells/100 ml water quality objective. 7.1.6 Water Circulation U. S. Corps of Engineer's field experiments done as part of this Clean Beaches study document slow tidal currents and low circulation offshore Inner Cabrillo Beach. With wind, a two-layer flow dominates the circulation. This moves surface water offshore and brings bottom water to shore during the predominate southwest wind conditions. Dye experiments at the beach face demonstrate low mixing at low wind conditions. Dye experiments on the tidal discharge from the constructed wetland just to the north of Inner Cabrillo Beach document offshore transport in the surface waters during southwest wind conditions consistent with the U. S. Corps of Engineer's current meter results. A three-dimensional hydrodynamic model (RMA-10) was used to simulate the nearshore current field near the beach face at Inner Cabrillo Beach. This model was calibrated with the current meter data previously obtained from locations somewhat offshore by the U.S. Army Corps of Engineers (USACE/Evans Hamilton, 2003; 2004). Low circulation and high residence times were predicted by the model at Inner Cabrillo Beach, especially with respect to bottom water just off the beach face whose residence time exceeded 10 hours. Dry weather violations are associated with high tide-range conditions (violations with significant tidal range and occurring on a rising tide, after a low tide. Organic rich particulate material brought from the nearby eelgrass beds to the beach face by the undercurrent during these conditions have been implicated with beach violations.

97
Model runs made to estimate the size of a circulation pump to use in a field experiment indicated that a pump in the range of 10,000 to 30,000 gpm should be used to effectively circulate and mix water along the swash zone of Inner Cabrillo Beach. A full scale circulation pump experiment was run with a 20,000 gpm pump located outside the swim area pointing at about a 45-degree angle towards CB02 on the beach. Results of the field and modeling experiment showed that circulation in the nearshore area of the Inner Cabrillo Beach face could be augmented by use of the circulation pump of proper size and capacity. Mixing of water from outside the swim area was accomplished for the entire length of Inner Cabrillo Beach including penetration of the very shallow swash zone. Currents along the beach face were increased from about 2.5 cm/sec with variable directions to about 10 cm/sec with a strong northward longshore direction both at the very surface and deeper in the water column. Vertical mixing of surface and deeper waters was also accomplished by this circulation pump. Bacterial violations initially present on the beach also disappeared in less than 2 hours. Field and modeling results were in reasonable agreement describing the circulation field in the nearshore area of Inner Cabrillo Beach and on the effects of the circulation pump on this flow field at the beach face. The data generated can be used to further calibrate the model if actual design of a pumped circulation system becomes an actual alternative corrective action being 7.2 Description of Recommended Project Alternatives The findings include several fundamental results. These include:
• The offshore Outer Harbor waters are clean except during storm events and return to good water
quality in a few days following a storm. Thus sources local to the beach account for frequent violations. It is not necessary to fix the whole Harbor and distant drainages or other City sources in order to address reductions at Inner Cabrillo Beach. Furthermore, potential sources local to Inner Cabrillo Beach are of the size and nature that are amenable to practical solutions using proven technology.
• Multiple local sources and causes were found at Inner Cabrillo Beach, including leaking sewers,
defective storm drains, heavy bird and other animal use, very restricted circulation at the beach face, and heavy eelgrass beds in the swim area and immediately adjacent to the beach face.
• Interim measures of partial bird exclusion from the immediate area of CB02 on the southern part
of the beach and of fixing local leaking sanitary and storm sewers in the south corner of the beach resulted in improvements but did not result in approaching public health and TMDL requirements.
Corrective project alternatives designed to reduce and eliminate exceedances of bacterial water quality standards at Inner Cabrillo Beach have been formulated and prioritized. These alternatives should be implemented in stages, with the easiest and/or likely more productive alternatives implemented early followed by monitoring of beach performance. Subsequent project alternatives can be implemented later. Recommended corrective project alternatives are summarized in the following sections. 7.2.1 Redesign/Extend Bird Exclusion Structure Since the bird exclusion structure has been shown to improve beach performance and birds were the major host source identified in the dry weather genetic ribotyping tests, the bird exclusion structure should be rebuilt and extended to protect the entire beach. However, a more esthetic design with minimum poles should be considered. In addition, a bird protection or cleanup system for picnic tables should be designed and implemented.

98
7.2.2 Make Remaining Repairs of Sanitary Sewer System The old abandoned outfall from the bluff to the beach should be removed or permanently blocked. In addition, the sanitary sewer line that runs along Stephen White Drive should be pressure tested, and probably replaced along with associated laterals in this area. 7.2.3 Divert Stormwater Discharges From Beach Many storm events will activate the overflow discharge located at the southern end of Inner Cabrillo Beach. For example, almost all 2005 storms caused this outfall to flow across the beach. Because of the high number of wet weather reductions in water quality exceedances that will be required, it may be necessary to remove the outfall at the southern end of Inner Cabrillo Beach. Discharge would be to the ocean east of the offshore breakwater groin. 7.2.4 Re-contour Beach to Prevent Flooding and Promote Drainage Recommendations for corrective measures would consist of replacing existing beach sand with clean beach sand to increase permeability and flushing, raising the beach to an elevation of +9.0 feet MLLW in order to reduce flooding, and removal of a shallow dead-end corner from the beach in order to improve circulation. In addition, the outer part of the northern groin at Inner Cabrillo Beach is not needed to retain sand and could be removed to increase beach face circulation.
7.2.5 Clean and Deepen Immediate Nearshore Area to Promote Mixing, Prevent Routine Erosion of Fines/Enhance Swimming Area Because erosion of fines from the eelgrass beds apparently occurs at the lower tide conditions and to enhance the shallow swimming area, it is recommended that the immediate inshore area to the swim buoy be deepened and cleaned of fine sediment and capped with coarse sand. This would involve transplanting eelgrass that occupies this area. Because of the habitat value of eelgrass beds, an eelgrass management plan should be developed along with suitable mitigation and monitoring. 7.2.6 Develop Beach Management Plan Operation and maintenance practices at Inner Cabrillo Beach are excellent and are carried out very well by a dedicated staff. In spite of the varied uses and the high variations in number of people at Inner Cabrillo Beach at differing times, the beach and park facilities are remarkably clean and well maintained. The present practice of recycling sand from the raking process that removes most of the trash and debris, then recycles separated sand that accumulates back to the northern upper beach to be later re-spread seems to be a practical step to recycle sand without undue effort and expense. The alternative of extending the bird exclusion structure was considered to be more practical, far less problematical, and much more cost effective than physically removing bird excrement and sand from the intertidal area and treating on the upper beach. Only clean sand should be placed on the beach accreting on the inside of the breakwater in order to minimize particulate and organic materials on this beach. Data developed during dry weather in this study indicates that birds are a host source for contamination found at CB02 (36-56%), about 12% of sewage origin, but other mammals including feral cats accounting for about 15-40%. Depending on the success of other measures including the bird exclusion structure, a plan for additional control of other mammals (cats, raccoons) may be needed.

99
Improvements need to be made at the picnic areas to avoid attracting gulls and to prevent or clean excessive contamination of the picnic tables and nearby areas. Additional trash and garbage dumpsters and more frequent disposal would greatly aid the local maintenance staff to prevent attractive food from birds, feral cats, raccoons and other local animals. 7.2.7 Circulation Enhancement Methods If necessary, an improved beach face circulation system may be needed. A pumped circulation system has been shown to effectively mix and flush this inshore area. Modeling and field data have been collected to aid in design of such a system. In addition, other ongoing work by the U. S. Army Corps of Engineers may add new data to effects of Port structural modifications on local circulation. 7.2.8 Project Staging Project staging probably would be as follows with expected levels of CEQA documentation: CEQA Level Initial Stage • Extend/rebuild bird exclusion structure MND • Repair sanitary systems E • Re-contour beach MND Intermediate Stage • Clean/deepen nearshore MND • Implement beach management plan MND • Divert storm sewer(s) MND or EIR/EIS Additional Stage • Circulation enhancement MND or EIR/EIS E - Exempt; MND - Mitigated Negative Declaration, EIR/EIS - Full Environmental Impact Reports
Figure 77. Discoveries.
100
8.0 REFERENCES Abbott, S, B. Caughley, and G. Scott. 1998. Evaluation of Enterolert for enumeration of enterococci in
the marine environment. New Zealand Journal of Marine and Freshwater Research, Vol 32:505-513.
City of Los Angeles, 2001. Environmental Affairs Department. Council File No. 99-0958, Cabrillo
Beach Water Quality. 15 February 2001. Cressey, Ronald 2003. City of Los Angeles, Bureau of Sanitation. Personal Communication. Dalkey, A. and Z. Bahariance, 2003. Effectiveness of the Bird Exclusion Structure for Reducing
Bacterial Contamination at Cabrillo Beach. Environmental Monitoring Division, Bureau of Sanitation, City of Los angeles. 16 January 2003.
Environmental Health Services 1999. Lower Rincon Creek Watershed Study: A Field Investigation into
the Source of Fecal Contamination in the Lower Rincon Creek Watershed and Ocean Interface (Surfzone). Report prepared for Santa Barbara County Health Department, Heal the Ocean, and the Santa Barbara County Water Agency (Project Clean Water).
Griffith, J.F., L.A. Aumand, I.M. Lee, C.D. McGee, L.L. Othman, K.J. Ritter, K.O. Walker and S.B.
Weisberg. 2004. Comparison and verification of bacterial water quality methods using ambient coastal water samples. in Southern California Coastal Water Research Project Biennial Report 2003-2004.
Grimont, F. and Grimont, P.A.D. 1986. Ribosomal ribonucleic acid gene restriction patterns as potential
taxonomic tools. Annules de L’Institut Pasteur/Microbiology.137 B(2):165-175. Herrera Environmental Consultants. 2001. Seattle-Tacoma Airport Stormwater Monitoring Program.
Report prepared for the Port of Seattle. Kinnetic Laboratories, Inc. and Southern California Coastal Water Research Project. 2002. City of Long
Beach Storm Water Monitoring Report 2001-2002, NPDES Permit No. CAS004003 (CI 8052), July 2002.
Kinnetic Laboratories, Inc., 2003. Task 1 Final Report, Compilation of Pertinent Data, Inner Cabrillo
Beach Water Quality Improvement Project. Report prepared for the City of Los Angeles, Harbor Department. Final Revision 30 May 2003.
Kinnetic Laboratories, Inc., 2004. Marina Beach Water Quality Improvement Project. Bacteria Source
Studies and Recommendations. Phase 1 Final Report. Report Prepared for Los Angeles County Department of Beaches and Harbors. Los Angeles, CA.
King, Ian 1998. RMA-10. A Finite Element Model for Stratified Flow. User's Guide. Version 6.5.
Department of Civil and Environmental Engineering, university of California, Davis. Los Angeles Regional Water Quality Control Boad (LARWQCB), 1994. Water Quality Control Plan for
the Los Angeles Region. Basin Plan for the coastal Watersheds of Los Angeles and Ventura Counties. California Regional Water Quality Control Board, Los Angeles Region, Monterey Park, CA. June 13, 1994.

101
Los Angeles Regional Water Quality Control Boad (LARWQCB), 2004. Los Angeles Harbor Bacterial TMDL Inner Cabrillo Beach and Main Ship Channel. April 30, 2004.
Los Angeles Regional Water Quality Control Board & Southern California Coastal Water Research
Project, 2004. Port of Los Angeles Bacteria Study. Report prepared by MEC-Weston Solutions, Inc.
MEC Analytical Systems, Inc., 2001. Ports of Long Beach and Los Angeles Year 2000 Baseline Study.
Prepared for the Port of Los Angeles. MEC-Weston. 2004. Mission Bay Clean Beaches Initiative Final Report. Noble, R.T., M.K. Leecaster, C.D. McGee, S.B. Weisberg, and K. Ritter. 2004. Comparison of bacterial
indicator analysis in stormwater-affected coastal waters. Water Research. Vol. 38:1183-1188. Repp, D. and M. Milne, 2003. Microbial Source Tracking Case Study, Clarks Creek Pollution Reduction
Study. Samadpour, M. 2002. Microbial Source Tracking: Principles and Practice. Microbial Source Tracking
Workshop, February 5-7, 2002, Irvine Marriott Hotel. Sponsored by USEPA, SCCWRP, National Water Research Institute, and the California SWRCB.
Scott, Troy M., Joan B. Rose, Tracie M. Jenkins, Samuel R. Farrah, and Jerzy Lukasik. 2002. Microbial
Source Tracking: Current Methodology and Future Directions. Applied and Environmental Microbiology, Dec. 2002, p. 5796-5803
Selander, R.K., D.A. Caugant, and T.S. Whittam. 1987. Genetic structure and variation in natural
populations of Escherichia coli. In: Cellular and Molecular Biology, F.C. Neidhardt et al. (eds.). American Society for Microbiology, Washington D.C.
U. S. Army Corps of Engineers, Engineer Waterways Experiment Station, 1990. Los Angeles and Long
Beach Harbors Model Enhancement Program, Three Dimensional Numerical Model Testing of Tidal Circulation. Technical Report CERC-90-16. Vicksburg, MS.
U. S. Army Corps of Engineers, Engineer Research and Development Center, Environmental and Coastal
and Hydraulics Laboratories, 2002. Study Plan, Investigation of Options to Improve Water Quality at Inner Cabrillo Beach, Los Angeles (Working Draft, 6/17/02).
U. S. Army Engineer District, Los Angeles and U. S. Army Engineer Research & Development Center,
Vicksburg, 2003. Inner Cabrillo Beach Pre-Construction Monitoring Final Report. Prepared by Evans-Hamilton, Inc. November 20, 2003.
U. S. Army Engineer District, Los Angeles and U. S. Army Engineer Research & Development Center,
Vicksburg, 2004. Inner Cabrillo Beach Circulation Study, Final Report. Prepared by Evans-Hamilton, Inc. May, 2004.