innergex renewable energy inc. (tsx: ine) · for renewable electricity is driven by strong support...
TRANSCRIPT

INNERGEX RENEWABLE ENERGY INC. JUNE 2015
(TSX: INE)

CAUTIONARY STATEMENTS FORWARD-LOOKING INFORMATION
This document contains forward-looking information within the meaning of securities legislations (“Forward-Looking Information”), which can generally be identified by the use of words such as “projected”, “potential”, “expect”, “estimate”, or other comparable terminology that states that certain events will or will not occur. It represents the estimates and expectations of the Corporation relating to future results and developments as of the date of this document. It includes future-oriented financial information, such as projected Adjusted EBITDA, estimated project costs and expected project financing, Free Cash Flow and Payout Ratio to inform readers of the potential financial impact of commissioning existing development projects. This information may not be appropriate for other purposes. Forward-Looking Information in this document is based on certain key assumptions made by the Corporation, including those concerning hydrology, wind regimes and solar irradiation, performance of operating facilities, financial market conditions, and the Corporation’s success in developing new facilities.
The material risks and uncertainties that may cause actual results and developments to be materially different from current expressed Forward-Looking Information are referred to in the Corporation's Annual Information Form in the “Risk Factors” section and include, without limitation: the ability of the Corporation to execute its strategy for building shareholder value; its ability to raise additional capital and the state of capital markets; liquidity risks related to derivative financial instruments; variability in hydrology, wind regimes and solar irradiation; delays and cost overruns in the design and construction of projects, uncertainty surrounding the development of new facilities; variability of installation performance and related penalties; and the ability to secure new power purchase agreements or to renew existing ones. The principal assumptions, risks and uncertainties concerning specific Forward-Looking Information contained in this document are more fully outlined on page 24.
Although the Corporation believes that the expectations and assumptions on which forward-looking information is based are reasonable, readers of this document are cautioned not to rely unduly on this Forward-Looking Information since no assurance can be given that it will prove to be correct. The Corporation does not undertake any obligation to update or revise any Forward-Looking Information, whether as a result of events or circumstances occurring after the date of this document, unless required by legislation.
NON IFRS MEASURES
Adjusted EBITDA, Free Cash Flow and Payout Ratio are not measures recognized by International Financial Reporting Standards (IFRS) and have no meaning prescribed by it. References to “Adjusted EBITDA” are to revenues less operating expenses, general and administrative expenses and prospective project expenses. References to “Free Cash Flow” are to cash flows from operating activities before changes in non-cash operating working capital items, less maintenance capital expenditures net of proceeds from disposals, scheduled debt principal payments, preferred share dividends declared and the portion of Free Cash Flow attributed to non-controlling interests, plus cash receipts by the Harrison Hydro Limited Partnership for the wheeling services to be provided to other facilities owned by the Corporation over the course of their power purchase agreement, plus or minus other elements that are not representative of the Corporation’s long-term cash generating capacity, such as transaction costs related to realized acquisitions (which are financed at the time of the acquisition) and realized losses or gains on derivative financial instruments used to hedge the interest rate on project-level debt. References to “Payout Ratio” are to dividends declared on common shares divided by Free Cash Flow. Readers are cautioned that Adjusted EBITDA should not be construed as an alternative to net earnings and Free Cash Flow should not be construed as an alternative to cash flows from operating activities, as determined in accordance with IFRS.
Innergex believes that these indicators are important, as they provide management and the reader with additional information about the Corporation's production and cash generation capabilities, its ability to sustain current dividends and dividend increases and its ability to fund its growth. These indicators also facilitate comparison of results over different periods.
ALL AMOUNTS SHOWN ARE IN CANADIAN DOLLARS.
JUNE 2015 2 INVESTOR PRESENTATION

OVERVIEW MARKET DYNAMICS STRATEGY AND
BUSINESS MODEL GROWTH
PROSPECTS FINANCIALS SUMMARY
• Innergex is a leading independent renewable power producer based in Canada
PUBLIC LISTING
TSX:INE PART OF THE S&P/TSX COMPOSITE INDEX
DIVIDEND / YIELD
$0.62 5.5%
INVESTMENT GRADE CREDIT RATING
BBB- (S&P)
MARKET CAP
$1.2 billion ENTERPRISE VALUE
$3.0 billion
HISTORY
FOUNDED
1990 IPO
2003 25TH ANNIVERSARY
2015 SOURCES OF RENEWABLE ENERGY
INSTALLED CAPACITY
1,194 MW
(687 MW NET)
MARKETS QUEBEC, ONTARIO AND BRITISH COLUMBIA, CANADA IDAHO, USA
COMPANY SNAPSHOT
JUNE 2015 3 INVESTOR PRESENTATION
HYDRO WIND SOLAR
SERIES A 5% PREFERRED SHARES
INE.PR.A
SERIES C 5.75% PREFERRED SHARES
INE.PR.C
5.75% CONVERTIBLE DEBENTURES
INE.DB

OVERVIEW MARKET DYNAMICS STRATEGY AND
BUSINESS MODEL GROWTH
PROSPECTS FINANCIALS SUMMARY
INVESTMENT HIGHLIGHTS
• Low-risk business model with a stable and growing dividend
JUNE 2015 4 INVESTOR PRESENTATION
• Consistent and predictable cash flows from high quality, long-life contracted assets
• Pure play in renewable energy with a focus on hydro assets
• Strong management with over 25 years of development and operations experience, engineering expertise, and financial acumen
• Growth from projects currently under development in Canada and international expansion strategy into Latin America and Europe
• Dividend that is sustainable and growing

OVERVIEW MARKET DYNAMICS STRATEGY AND
BUSINESS MODEL GROWTH
PROSPECTS FINANCIALS SUMMARY
NUMBER OF SITES MW
NET GROSS
26 418 547
6 236 614
1 33 33
33 687 1,194
NUMBER OF SITES MW
NET GROSS
4 133 169
1 75 150
5 208 319
MAP OF OPERATIONS
JUNE 2015 5 INVESTOR PRESENTATION
• Innergex is a pure play in renewable energy with a focus on hydro assets
IN OPERATION UNDER CONSTRUCTION
LEGEND Hydro Wind Solar
Under construction

OVERVIEW MARKET DYNAMICS STRATEGY AND
BUSINESS MODEL GROWTH
PROSPECTS FINANCIALS SUMMARY
PRODUCTION PROFILE
• Diversification of revenues is an important risk management tool
JUNE 2015 6 INVESTOR PRESENTATION
• Multiple energy sources and regions reduce our exposure to variability in water, wind and solar regimes and to any one market
BY SOURCE OF ENERGY1 BY REGION1
1 Based on consolidated revenues.
Solar
7% Wind
22%
Hydro
71%
Idaho, USA
2%
British Columbia
48%
Ontario
9%
Québec
41%
Solar 4%
Hydro 67%
Wind 29%
2017
2014
USA 1%
QC 43%
ON 6%
BC 50%
2014
2017
OVERVIEW MARKET DYNAMICS STRATEGY AND
BUSINESS MODEL GROWTH
PROSPECTS FINANCIALS SUMMARY
1,22
7 1,90
5
2,10
5
2,38
2 2,96
2
2010 2011 2012 2013 2014
947
2,00
5
2,29
6
2,37
7
2,71
6
359
1,02
6 1,23
1
1,34
0
1,64
5
2010 2011 2012 2013 2014
5-YEAR FINANCIAL HISTORY
JUNE 2015 7 INVESTOR PRESENTATION
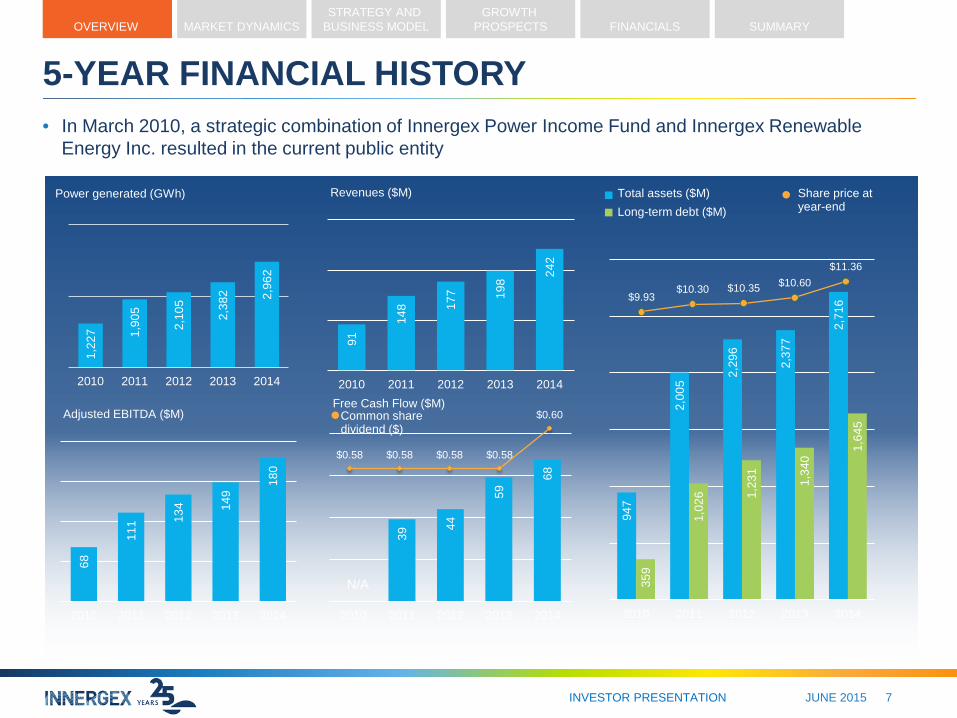
• In March 2010, a strategic combination of Innergex Power Income Fund and Innergex Renewable Energy Inc. resulted in the current public entity
Power generated (GWh)
Revenues ($M) Total assets ($M) Long-term debt ($M)
Share price at year-end
68
111 13
4 149
180
2010 2011 2012 2013 2014
Adjusted EBITDA ($M) 39
44
59 68
2010 2011 2012 2013 2014
Free Cash Flow ($M)
91
148 17
7 198
242
2010 2011 2012 2013 2014
$9.93 $10.30 $10.35 $10.60
$11.36
Common share dividend ($)
$0.58 $0.58 $0.58 $0.58
$0.60
N/A

OVERVIEW MARKET DYNAMICS STRATEGY AND
BUSINESS MODEL GROWTH
PROSPECTS FINANCIALS SUMMARY
310
320
330
340
350
360
370
380
390
400
1959 1972 1985 1998 2011
GLOBAL CO2 EMISSIONS
• Renewable energy is part of the solution to climate change
JUNE 2015 8 INVESTOR PRESENTATION
• In 2013, global concentrations of CO2 surpassed 400 ppm for the first time in history
CONCENTRATIONS
OF CO2 AT THE MAUNA LOA
OBSERVATORY
• Renewable energy is a clean, competitive and sustainable alternative to fossil energy
• The challenge is for governments to plan their energy needs with a long-term view and a commitment to reducing GHG emissions
OVERVIEW MARKET DYNAMICS STRATEGY AND
BUSINESS MODEL GROWTH
PROSPECTS FINANCIALS SUMMARY
MARKET DYNAMICS
JUNE 2015 9 INVESTOR PRESENTATION
1. Source: International Energy Agency (IEA) Medium-Term Renewable Energy Market Report 2014 2. Source: US Energy Information Administration (EIA), www.eia.gov/forecasts/aeo/
• Overall macroeconomic context for renewable energy development is favourable
• Demand for renewable electricity is driven by strong support for decarbonization in addressing climate change, a desire to diversify sources of energy, and the retirement of conventional power plants
• Globally, renewable generation is expected to grow 45%, or 5.4% per year, to 20201
• Global new investment in renewables is expected to remain around US$230 billion (approx.125 GW) per year1
• Renewables are expected to account for 80% of new generation in OECD countries and 70% in non-OECD countries, from 2013 to 20201
• In the US, renewables are the fastest growing source of electricity generation; non-hydro renewable energy is expected to grow 140%, or 3.2%, per year, and grow from 12% to 16% of total generation by 20402
• Challenges include the need for stable long-term policies that address the capital intensive nature of renewable assets and that price in externalities (emissions), grid capacity and system integration of intermittent renewables, and strong and creditworthy traditional utilities
• Competition for new generation comes mainly from natural gas, as abundant supplies of shale gas are keeping gas prices low, putting downward pressure on electricity prices
• Construction costs for wind and solar are driven down by technology and economies of scale
• In Canada, no large power calls are expected but pockets of opportunities remain • Construction costs for hydro are mainly stable but rising in British Columbia, driven by higher labour and civil
engineering costs and increasingly complex locations • Limited organic growth opportunities and the emerging yieldcos could lead to industry consolidation • First Nation participation in new energy infrastructure is becoming a driving force, reinforced by the recent supreme
court ruling regarding aboriginal land title in British Columbia (Tsilhqot'in First Nation v. British Columbia)

OVERVIEW MARKET DYNAMICS STRATEGY AND
BUSINESS MODEL GROWTH
PROSPECTS FINANCIALS SUMMARY
LEVELIZED COST OF ENERGY (LCOE)
• Costs for wind and solar continue to decline and are increasingly competitive
JUNE 2015 10 INVESTOR PRESENTATION
• Renewable energy is cost competitive with other sources of energy, including natural gas
ENERGY SOURCES
$/M
WH
Source: Bloomberg, Q2 2014
0
50
100
150
200
250
OffshoreWind
OnshoreWind
Nuclear Solar PV NaturalGas
Coal SmallHydro
LargeHydro
OVERVIEW MARKET DYNAMICS STRATEGY AND
BUSINESS MODEL GROWTH
PROSPECTS FINANCIALS SUMMARY
STRATEGY
JUNE 2015 11 INVESTOR PRESENTATION
• Our strategy for building shareholder value is to develop or acquire high-quality facilities that generate sustainable cash flows and provide an attractive risk-adjusted return on invested capital, and to distribute a stable dividend
• Remain exclusively in renewable energy
• Ensure strategic priorities conform to sustainable business practices
• Consolidate leadership position in Canada
• Expand into selected target-markets internationally
• Develop competitive differentiator of partnerships, especially with First Nations and local communities
• Focus on key performance indicators: equipment availability, project IRRs, Adjusted EBITDA, Free Cash Flow, and Payout Ratio
• Distribute a stable and growing dividend to our shareholders
OVERVIEW MARKET DYNAMICS STRATEGY AND
BUSINESS MODEL GROWTH
PROSPECTS FINANCIALS SUMMARY
SUSTAINABLE DEVELOPMENT
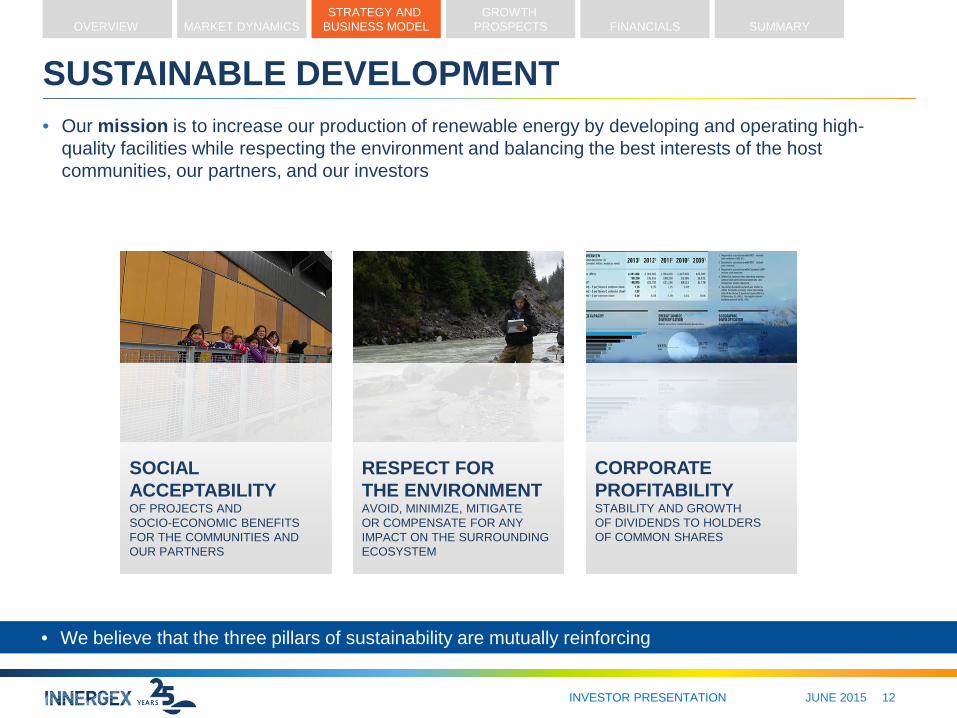
• We believe that the three pillars of sustainability are mutually reinforcing
JUNE 2015 12 INVESTOR PRESENTATION
• Our mission is to increase our production of renewable energy by developing and operating high-quality facilities while respecting the environment and balancing the best interests of the host communities, our partners, and our investors
CORPORATE PROFITABILITY STABILITY AND GROWTH OF DIVIDENDS TO HOLDERS OF COMMON SHARES
SOCIAL ACCEPTABILITY OF PROJECTS AND SOCIO-ECONOMIC BENEFITS FOR THE COMMUNITIES AND OUR PARTNERS
RESPECT FOR THE ENVIRONMENT AVOID, MINIMIZE, MITIGATE OR COMPENSATE FOR ANY IMPACT ON THE SURROUNDING ECOSYSTEM

OVERVIEW MARKET DYNAMICS STRATEGY AND
BUSINESS MODEL GROWTH
PROSPECTS FINANCIALS SUMMARY
CORPORATIONS
CREEK POWER BRITISH COLUMBIA
662/3-331/3% OWNER OF FITZSIMMONS CREEK, BOULDER CREEK AND UPPER LILLOOET RIVER HYDRO FACILITIES PARTNER: LEDCOR POWER GROUP LTD
CARTIER WIND ENERGY QUÉBEC
38-62%, 50-50% MANAGEMENT OWNER OF BAIE-DES-SABLES, L’ANSE-À-VALLEAU, CARLETON, MONTAGNE SÈCHE AND GROS-MORNE FACILITIES
PARTNER: TRANSCANADA CORP.
EXISTING PARTNERSHIPS
• Our partnerships are a competitive differentiator, especially those with First Nations and local communities
JUNE 2015 13 INVESTOR PRESENTATION
• We have the ability and the expertise to form partnerships that work
FIRST NATIONS AND LOCAL COMMUNITIES
UMBATA FALLS ONTARIO
49-51% PARTNER: OJIBWAYS OF THE PIC RIVER FIRST NATION
KWOIEK CREEK BRITISH COLUMBIA
50-50% PARTNER: KANAKA BAR INDIAN BAND
VIGER-DENONVILLE QUÉBEC
50-50% PARTNER: RIVIÈRE-DU-LOUP RCM MAGPIE QUÉBEC
70-30% VOTING RIGHTS PARTNER: MINGANIE RCM
MESGI’G UGJU’S’N QUÉBEC
50-50% PARTNER: MI’GMAQ FIRST NATIONS OF QUEBEC
FINANCIAL INSTITUTIONS
HARRISON LP BRITISH COLUMBIA
50-50% OWNER OF THE DOUGLAS CREEK, FIRE CREEK, LAMONT CREEK, STOKKE CREEK, TIPELLA CREEK, AND UPPER STAVE RIVER FACILITIES
PARTNER: CC&L AND LPF (SURFSIDE) DEVELOPMENT
SM-1 QUÉBEC
50-50% PARTNER: DESJARDINS PENSION PLAN
23 MW 50 MW
590 MW
150 MW
25 MW 150 MW
114 MW
31 MW
41 MW
OVERVIEW MARKET DYNAMICS STRATEGY AND
BUSINESS MODEL GROWTH
PROSPECTS FINANCIALS SUMMARY
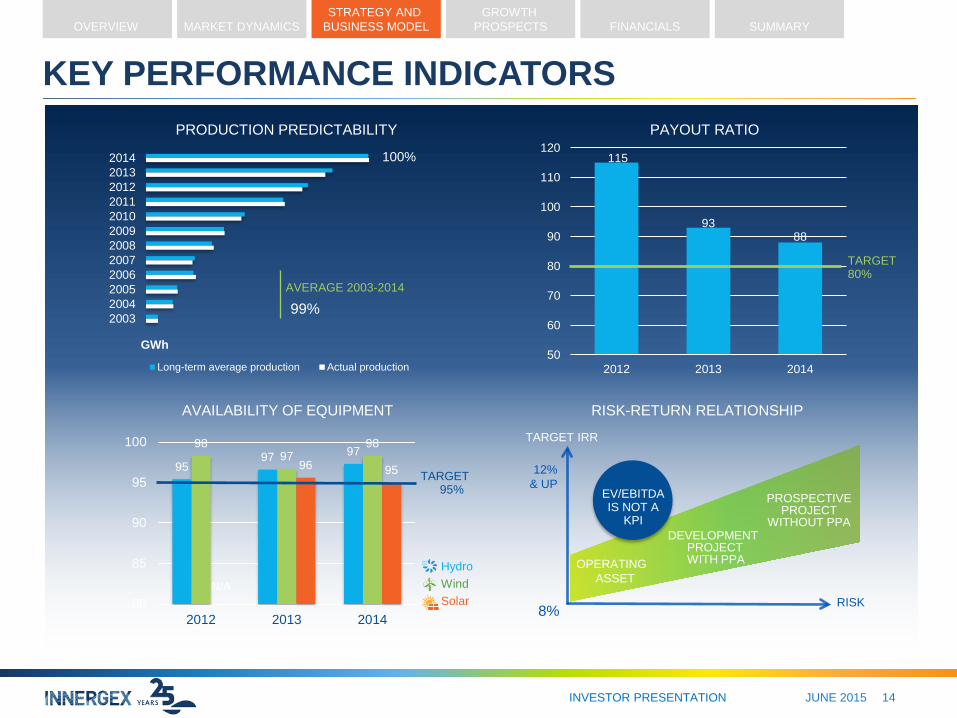
KEY PERFORMANCE INDICATORS
JUNE 2015 14 INVESTOR PRESENTATION
95 97 97
98 97
98
96 95
80
85
90
95
100
2012 2013 2014
201420132012201120102009200820072006200520042003
Long-term average production Actual production
TARGET IRR
RISK
AVAILABILITY OF EQUIPMENT
TARGET 80%
TARGET 95%
Hydro Wind Solar
PAYOUT RATIO
8%
12% & UP
PRODUCTION PREDICTABILITY
GWh
99%
100%
RISK-RETURN RELATIONSHIP
OPERATING ASSET
EV/EBITDA IS NOT A
KPI DEVELOPMENT
PROJECT WITH PPA
PROSPECTIVE PROJECT
WITHOUT PPA
AVERAGE 2003-2014
N/A
115
93 88
50
60
70
80
90
100
110
120
2012 2013 2014

OVERVIEW MARKET DYNAMICS STRATEGY AND
BUSINESS MODEL GROWTH
PROSPECTS FINANCIALS SUMMARY
PROJECTS UNDER CONSTRUCTION
• We are focused on delivering projects on time and on budget
JUNE 2015 15 INVESTOR PRESENTATION
• Projects under construction represent a 27% increase in gross installed capacity, currently at 1,194 MW
PROJECT NAME LOCATION
GROSS CAPACITY
(MW)
ESTIMATED CONSTRUCTION
COSTS ($M)
ESTIMATED PROJECT
FINANCING ($M) EXPECTED IN-SERVICE
TRETHEWAY CREEK BC 21.2 111.5 ACTUAL 92.9 2015
BOULDER CREEK BC 25.3 119.2 2016
UPPER LILLOOET RIVER BC 81.4 315.0 2016
BIG SILVER CREEK BC 40.6 216.0 150.0 2016
MESGI’G UGJU’S’N (MU) QC 150.0 340.0 280.0 2016
TOTAL 318.5 1,101.7 1,014.5
ACTUAL 491.6
• We are in the process of obtaining non-recourse project-level financing for each of these projects
• We have no need for additional equity issuance to bring these projects to commercial operation

OVERVIEW MARKET DYNAMICS STRATEGY AND
BUSINESS MODEL GROWTH
PROSPECTS FINANCIALS SUMMARY
GROWTH DRIVERS
• Targeting an Adjusted EBITDA CAGR of 18% and a Free Cash Flow CAGR of 12% for 2014-2017
JUNE 2015 16 INVESTOR PRESENTATION
• Complete the five projects under construction expected to reach commercial operation by the end of 2016, increasing gross installed capacity by 27% from current levels
• Submit projects under requests for proposals as part of the ongoing call for 300 MW of new wind energy and 140 MW of new solar energy in Ontario in 2015 and another in 2016
• Advance prospective projects with four local First Nations with a view to obtaining negotiated power purchase agreements (PPAs) – these projects have a combined gross installed capacity of 417 MW
• Source new growth in target markets internationally, in Latin America and in Europe, where demand for renewable energy is strong, driven by economic growth or the need to replace fossil fuels, and where declining costs are making renewable energy cost competitive
• Seek acquisition opportunities to gain a foothold in target markets internationally and to consolidate leadership position in Canada, that are immediately accretive to cash flows
NULKI HILLS (BC)
210 MW IN PARTNERSHIP WITH THE SAIK’UZ FIRST NATION
SIX HYDRO PROJECTS IN BC TOTALLING
150 MW IN PARTNERSHIP WITH THE IN-SHUCK-CH FIRST NATION
MATAWIN (QC)
15 MW IN PARTNERSHIP WITH THE MANAWAN COMMUNITY OF THE ATIKAMECK FIRST NATION
ONIMIKI (QC)
42 MW IN PARTNERSHIP WITH THE EAGLE VILLAGE FIRST NATION, THE WOLF LAKE FIRST NATION AND THE TEMISCAMINGUE RCM

OVERVIEW MARKET DYNAMICS STRATEGY AND
BUSINESS MODEL GROWTH
PROSPECTS FINANCIALS SUMMARY
AT DECEMBER 31, 2014
FINANCIAL STRUCTURE
• We expect to finance our projects with fixed-rate non-recourse project-level debt
JUNE 2015 17 INVESTOR PRESENTATION
• We maintain a balanced capital structure
Preferred shares
4%
Common equity at market value
38%
Corporate debt
11%
Convertible debentures
3%
Project-level debt
43%
Revolving term credit facility supported by 12 unencumbered assets Saint-Paulin Montmagny Glen Miller Brown Lake Miller Creek Portneuf 1-2-3 Batawa Chaudière Baie-des-Sables Gros-Morne

OVERVIEW MARKET DYNAMICS STRATEGY AND
BUSINESS MODEL GROWTH
PROSPECTS FINANCIALS SUMMARY
INTEREST EXPENSES
PROJECT IRR
VALUE OF DERIVATIVES
INTEREST PAYMENT ON REVOLVING TERM CREDIT FACILITY
INTEREST PAYMENT ON PROJECT-LEVEL DEBT
IRR OF DEVELOPMENT PROJECTS
IRR OF PROSPECTIVE PROJECTS
FREE CASH FLOW (FCF)
DERIVATIVE FINANCIAL INSTRUMENTS USED TO HEDGE THE INTEREST RATE ON EXISTING AND FUTURE DEBT
DERIVATIVE FINANCIAL INSTRUMENTS USED TO HEDGE THE INTEREST RATE ON EXISTING AND FUTURE DEBT
Interest rate on majority of revolving term credit facility has been fixed through use of derivative financial instruments
Interest rates on project-level debts have been fixed through use of derivative financial instruments
Base interest rates on upcoming project financings for development projects have been hedged through use of derivative financial instruments. When financing is secured, forward contracts will be settled, resulting in a realized gain (loss) on derivative financial instruments that will be offset by a higher (lower) interest rate on debt for its duration; this will not affect the economic value of project
Price of any power purchase agreement secured for prospective projects in the future will reflect prevailing interest rates at that time and the expected interest rate on project financing will be hedged through use of derivative financial instruments around the time construction begins
Realized gains or losses arising from settlement of derivative financial instruments will have an immediate impact on cash flows, and an offsetting impact on future cash flows for duration of debt
These are unrealized gains and losses, which do not affect Free Cash Flow
Offsetting entry to the unrealized gains or losses are recorded in owners' equity
NO IMPACT NO IMPACT ON
PV OF FCF STREAM
$145M UNREALIZED
GAIN
$145M DECREASED IN
LIABILITIES
NO IMPACT NO IMPACT ON
PV OF FCF STREAM
$149M UNREALIZED
LOSS
$149M INCREASED IN
LIABILITIES
INTEREST RATE SENSITIVITY
JUNE 2015 18 INVESTOR PRESENTATION
• We have virtually no exposure to interest rate fluctuations
100 bp 100 bp
OVERVIEW MARKET DYNAMICS STRATEGY AND
BUSINESS MODEL GROWTH
PROSPECTS FINANCIALS SUMMARY
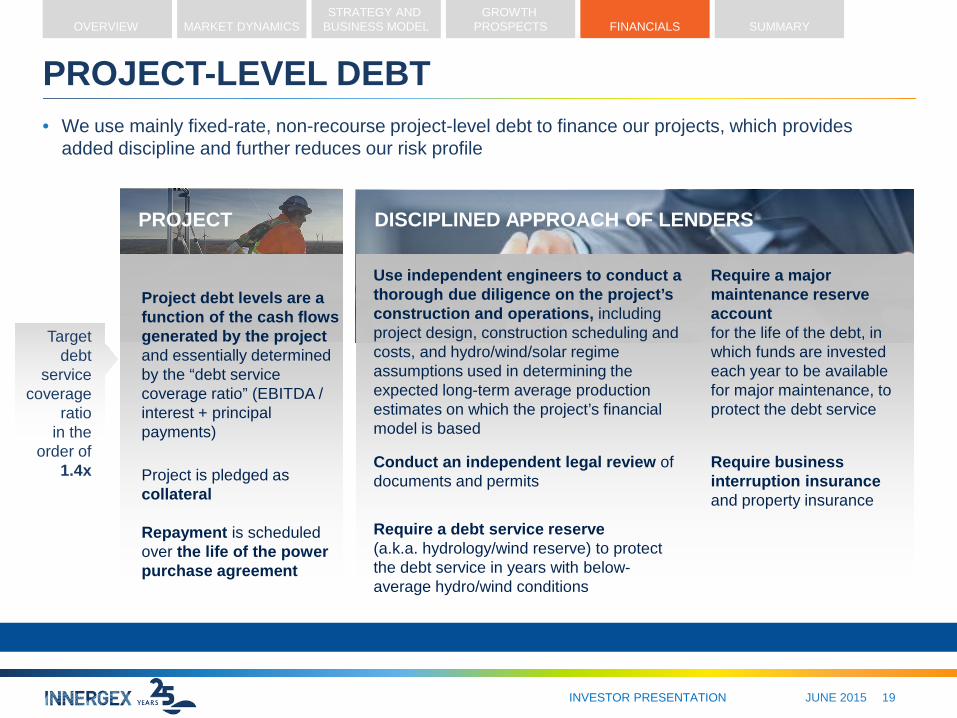
PROJECT-LEVEL DEBT
JUNE 2015 19 INVESTOR PRESENTATION
• We use mainly fixed-rate, non-recourse project-level debt to finance our projects, which provides added discipline and further reduces our risk profile
PROJECT DISCIPLINED APPROACH OF LENDERS
Use independent engineers to conduct a thorough due diligence on the project’s construction and operations, including project design, construction scheduling and costs, and hydro/wind/solar regime assumptions used in determining the expected long-term average production estimates on which the project’s financial model is based
Require a major maintenance reserve account for the life of the debt, in which funds are invested each year to be available for major maintenance, to protect the debt service
Conduct an independent legal review of documents and permits
Require business interruption insurance and property insurance
Require a debt service reserve (a.k.a. hydrology/wind reserve) to protect the debt service in years with below-average hydro/wind conditions
Target debt
service coverage
ratio in the
order of 1.4x
Project debt levels are a function of the cash flows generated by the project and essentially determined by the “debt service coverage ratio” (EBITDA / interest + principal payments)
Project is pledged as collateral Repayment is scheduled over the life of the power purchase agreement
OVERVIEW MARKET DYNAMICS STRATEGY AND
BUSINESS MODEL GROWTH
PROSPECTS FINANCIALS SUMMARY
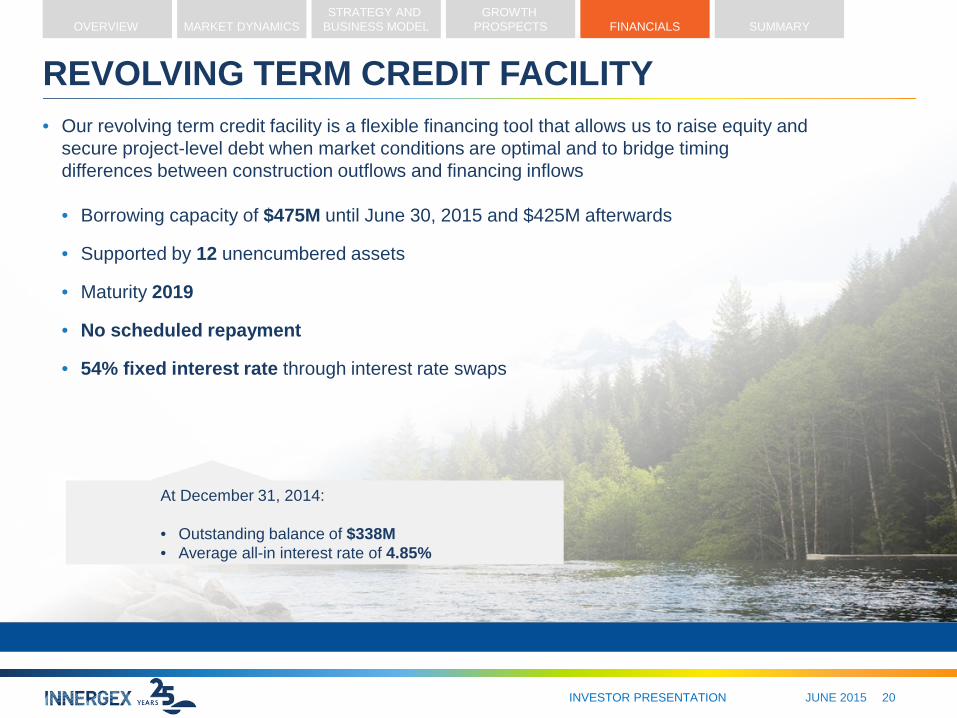
REVOLVING TERM CREDIT FACILITY
JUNE 2015 20 INVESTOR PRESENTATION
• Our revolving term credit facility is a flexible financing tool that allows us to raise equity and secure project-level debt when market conditions are optimal and to bridge timing differences between construction outflows and financing inflows • Borrowing capacity of $475M until June 30, 2015 and $425M afterwards
• Supported by 12 unencumbered assets
• Maturity 2019
• No scheduled repayment
• 54% fixed interest rate through interest rate swaps
At December 31, 2014: • Outstanding balance of $338M • Average all-in interest rate of 4.85%
OVERVIEW MARKET DYNAMICS STRATEGY AND
BUSINESS MODEL GROWTH
PROSPECTS FINANCIALS SUMMARY
CAPITAL ALLOCATION
JUNE 2015 21 INVESTOR PRESENTATION
• Reinvest in the business We invest $5-$8 million each year in prospective project expenses for greenfield project development in preparation for future requests for proposals or negotiated power purchase agreements
• Pay a dividend and grow it over time We intend to grow the dividend as Free Cash Flow grows
• Make acquisitions We seek acquisitions to expand internationally and to consolidate leadership position in Canada, that are immediately accretive to cash flows
• Use Board of Directors’ approved normal course issuer bid to buy back shares We can purchase for cancellation up to 1 million common shares, if and when we believe the market price of common shares does not reflect their inherent value (expires March 2016)
• Achieve and maintain a Payout Ratio of approximately 80%

OVERVIEW MARKET DYNAMICS STRATEGY AND
BUSINESS MODEL GROWTH
PROSPECTS FINANCIALS SUMMARY
18% 12%
ADJUSTED EBITDA ($M)
FREE CASH FLOW ($M)
GUIDANCE
• Our growth is significant and measurable
JUNE 2015 22 INVESTOR PRESENTATION
• In 2017, we will reach an annual run-rate that reflects our five projects currently under construction
687 MW
1,194 MW
895 MW
1,513 MW
2014 2017 CAGR
INSTALLED CAPACITY
NET GROSS NET GROSS
180
295
0
50
100
150
200
250
300
350
68
95
0
20
40
60
80
100

OVERVIEW MARKET DYNAMICS STRATEGY AND
BUSINESS MODEL GROWTH
PROSPECTS FINANCIALS SUMMARY
INVESTMENT THESIS
• Solid growth supported by a sound capital structure
JUNE 2015 23 INVESTOR PRESENTATION
• Solid track record of growth delivering projects on time and on budget
• Strategic plan to replenish sources of long-term growth beyond 2017 by expanding into target-markets internationally and consolidating leadership position in Canada
• Low-risk capital structure balanced and flexible
• Virtually no exposure to interest rate fluctuations
• Reinvestment and dividend growth focus of capital allocation
• Clear performance targets With consistent execution

PRINCIPAL ASSUMPTIONS PRINCIPAL RISKS AND UNCERTAINTIES PROJECTED ADJUSTED EBITDA For each facility, the Corporation determines an annual long-term average level of electricity production (LTA) over the expected life of the facility, based on several factors that include, without limitations, historically observed water flows or wind or solar irradiation conditions, turbine or panel technology, installed capacity, energy losses, operational features and maintenance. Although production will fluctuate from year to year, over an extended period it should approach the estimated long-term average. The Corporation then estimates expected annual revenues for each facility by multiplying its LTA by a price for electricity stipulated in the power purchase agreement secured with a public utility or other creditworthy counterparty. These agreements stipulate a base price and, in some cases, a price adjustment depending on the month, day and hour of delivery. In most cases, power purchase agreements also contain an annual inflation adjustment based on a portion of the Consumer Price Index. The Corporation then estimates annual operating earnings by subtracting from the estimated revenues the budgeted annual operating costs, which consist primarily of operators’ salaries, insurance premiums, operations and maintenance expenditures, property taxes, and royalties; these are predictable and relatively fixed, varying mainly with inflation except for maintenance expenditures. On a consolidated basis, the Corporation estimates annual Adjusted EBITDA by adding the projected operating earnings of all the facilities in operation that it consolidates*, from which it subtracts budgeted general and administrative expenses, comprised essentially of salaries and office expenses, and budgeted prospective project expenses, which are determined based on the number of prospective projects the Corporation chooses to develop and the resources required to do so. *Excludes Umbata Falls and Viger-Denonville accounted for using the equity method.
- Improper assessment of water, wind and sun resources and associated electricity production
- Variability in hydrology, wind regimes and solar irradiation - Equipment failure or unexpected operations & maintenance
activity - Unexpected seasonal variability in the production and
delivery of electricity - Variability of facility performance and related penalties - Changes to water and land rental expenses - Unexpected maintenance expenditures - Lower inflation rate than expected
ESTIMATED PROJECT COSTS, EXPECTED OBTAINMENT OF PERMITS, START OF CONSTRUCTION, WORK CONDUCTED AND START OF COMMERCIAL OPERATION FOR DEVELOPMENT PROJECTS OR PROSPECTIVE PROJECTS For each development project, the Corporation provides an estimate of project costs based on its extensive experience as a developer, directly related incremental internal costs, site acquisition costs and financing costs, which are eventually adjusted for projected costs provided by the engineering, procurement and construction contractor retained for the project. The Corporation provides indications regarding scheduling and construction (EPC) progress for its development projects and indications regarding its prospective projects, based on its extensive experience as a developer.
- Performance of counterparties, such as EPC contractors - Delays and cost overruns in project design construction - Obtainment of permits - Equipment supply - Relationships with stakeholders - Regulatory and political risks - Interest rate fluctuations and financing risk - Higher inflation rate than expected
EXPECTED PROJECT FINANCING The Corporation provides indications of its intention to secure non-recourse project-level debt financing for its development projects, based on the expected LTA production and the expected costs of each project, expected power purchase agreement term, a leverage ratio of approximately 75%-85%, as well as its extensive experience in project financing and its knowledge of the capital markets.
- Interest rate fluctuations and financing risk - Financial leverage and restrictive covenants governing current
and future indebtedness
PROJECTED FREE CASH FLOW AND PAYOUT RATIO The Corporation estimates Free Cash Flow as projected cash flow from operations before changes in non-cash operating working capital items, less estimated maintenance capital expenditures net of proceeds from disposals, scheduled debt principal payments, preferred share dividends and the portion of Free Cash Flow attributed to non-controlling interests, plus cash receipts by the Harrison Hydro L.P. for the wheeling services to be provided to other facilities owned by the Corporation over the course of their power purchase agreement. It also adjusts for other elements, which represent cash inflows or outflows that are not representative of the Corporation's long-term cash generating capacity, such as adding back transaction costs related to realized acquisitions (which are financed at the time of the acquisition) and adding back realized losses or subtracting realized gains on derivate financial instruments used to fix the interest rate on project-level debt. The Corporation estimates the Payout Ratio by dividing the most recent declared annual common share dividend by the projected Free Cash Flow.
- Adjusted EBITDA below expectations caused mainly by the risks and uncertainties mentioned above and by higher prospective project expenses
- Projects costs above expectations caused mainly by the performance of counterparties and delays and cost overruns in the design and construction of projects
- Regulatory and political risk - Interest rate fluctuations and financing risk - Financial leverage and restrictive covenants governing current
and future indebtedness - Unexpected maintenance capital expenditures - The Corporation may not declare or pay a dividend
INTENTION TO SUBMIT PROJECTS UNDER REQUESTS FOR PROPOSALS AND TO GAIN A FOOTHOLD IN TARGET MARKETS INTERNATIONALLY The Corporation provides indications of its intention to submit projects under requests for proposals based on the state of readiness of some of its prospective projects and their compatibility with the announced terms of these requests for proposals. It provides indications of its intention to establish a presence in target markets internationally in the coming years based on its strategic plan.
- Regulatory and political risks - Ability of the Corporation to execute its strategy for building
shareholder value - Ability to secure new PPAs - Foreign exchange fluctuations
FORWARD-LOOKING INFORMATION CONTAINED IN THIS DOCUMENT
JUNE 2015 24 INVESTOR PRESENTATION

www.innergex.com
For more information, please contact:
Marie-Josée Privyk, CFA, SIPC Director – Communications and Sustainable Development
Tel. 450 928-2550, ext. 222 Cell. 514 250-0868
JUNE 2015 INVESTOR PRESENTATION 25