innolux corporation and subsidiaries · innolux corporation estimates future cash flows based on...
TRANSCRIPT

INNOLUX CORPORATION AND
SUBSIDIARIES
CONSOLIDATED FINANCIAL STATEMENTS AND
REPORT OF INDEPENDENT ACCOUNTANTS
DECEMBER 31, 2018 AND 2017
~1~
REPORT OF INDEPENDENT ACCOUNTANTS
To the Board of Directors and Shareholders of Innolux Corporation and subsidiaries
Opinion
We have audited the accompanying consolidated balance sheets of Innolux Corporation (the
“Company”) and its subsidiaries as at December 31, 2018 and 2017, and the related consolidated
statements of comprehensive income, of changes in equity and of cash flows for the years then ended,
and notes to the financial statements, including a summary of significant accounting policies.
In our opinion, the accompanying consolidated financial statements present fairly, in all material
respects, the consolidated financial position of the Company and its subsidiaries as at December 31,
2018 and 2017, and its consolidated financial performance and its consolidated cash flows for the years
then ended in accordance with the “Regulations Governing the Preparation of Financial Reports by
Securities Issuers” and International Financial Reporting Standards, International Accounting Standards,
IFRIC Interpretations, and SIC Interpretations as endorsed by the Financial Supervisory Commission.
Basis for opinion
We conducted our audits in accordance with the “Regulations Governing Auditing and Attestation of
Financial Statements by Certified Public Accountants” and generally accepted auditing standards in the
Republic of China (ROC GAAS). Our responsibilities under those standards are further described in the
Auditor’s Responsibilities for the Audit of Financial Statements section of our report. We are
independent of the Company and its subsidiaries in accordance with the Code of Professional Ethics for
Certified Public Accountants in the Republic of China (the “Code”), and we have fulfilled our other
ethical responsibilities in accordance with the Code. We believe that the audit evidence we have obtained
is sufficient and appropriate to provide a basis for our opinion.
Key audit matters
Key audit matters are those matters that, in our professional judgment, were of most significance in our
audit of the financial statements of the current period. These matters were addressed in the context of
our audit of the financial statements as a whole and, in forming our opinion thereon, we do not provide
a separate opinion on these matters.
~2~
The key audit matters in relation to the financial statements for the year ended December 31, 2018 are
outlined as follows:
Inventory valuation
Description
The industry is characterised in its significant fluctuations closely in connection with the economic
environment. As the technology evolves rapidly, the Group’s existing products may become obsolete
when the customers demand for new products or the Group fails to compete with the evolutionary
production approach. The abovementioned factors thus affect the sales amount ultimately. The Group
has evaluated the inventory by taking into account of allowance, obsoleteness or trivial sales amount and
the cost has been written down to the net realizable value. For details of inventory, please refer to Note
6(6). As the amounts of inventories are material, the types of inventories vary, and the estimation of net
realizable value for individually obsolete or damaged inventories is dependent upon significant
management judgement, we consider inventory valuation a key audit matter.
How our audit addressed the matter
We assessed whether the accounting policies on the provision for the loss on decline in value and
obsoleteness of inventory are reasonable and in accordance with the accounting principles, as well as
whether they are applied consistently. We examined inventory aging report and assessed the
reasonableness of provision for the loss on slow-moving inventory. We also assessed the reasonableness
of net realizable value and the appropriateness of valuation basis.
Valuation and impairment of goodwill and property, plant and equipment
Description
For details of the impairment valuation of goodwill and property, plant and equipment, please refer to
Notes 6(8) and 6(10).
Innolux Corporation estimates future cash flows based on appropriate discount rates. In determining
whether goodwill and property, plant and equipment may be impaired, the recoverable amount of the
cash generating unit is measured based on how assets are utilized, duration years of assets and projected
income and expenses in the future. The estimate involves several assumptions such as determination of
discount rates, expected growth rate and future financial projections. As these estimates are dependent
upon significant management judgement, we consider management’s assessment of impairment of
goodwill and property, plant and equipment a key audit matter.

~3~
How our audit addressed the matter
We assessed the key assumptions used by management in estimating expected future cash flows,
including the reasonableness of expected operating revenue, gross profit, changes in expenses, and the
basic assumptions applied in expected future cash flows. We also examined the parameters of discount
rates, including the risk-free rate of return on equity capital, the risk factor of the industry and the rate
of return on similar investments in the market.
Other matter – Parent company only financial reports
We have audited and expressed an unqualified opinion on the parent company only financial statements
of Innolux Co., Ltd. as at and for the years ended December 31, 2018 and 2017.
Responsibilities of management and those charged with governance for the
consolidated financial statements
Management is responsible for the preparation and fair presentation of the consolidated financial
statements in accordance with the “Regulations Governing the Preparation of Financial Reports by
Securities Issuers” and International Financial Reporting Standards, International Accounting Standards,
IFRIC Interpretations, and SIC Interpretations as endorsed by the Financial Supervisory Commission,
and for such internal control as management determines is necessary to enable the preparation of
consolidated financial statements that are free from material misstatement, whether due to fraud or error.
In preparing the consolidated financial statements, management is responsible for assessing the Group’s
ability to continue as a going concern, disclosing, as applicable, matters related to going concern and
using the going concern basis of accounting unless management either intends to liquidate the Group or
to cease operations, or has no realistic alternative but to do so.
Those charged with governance, including audit committee, are responsible for overseeing the Group’s
financial reporting process.
Auditor’s responsibilities for the audit of the consolidated financial statements
Our objectives are to obtain reasonable assurance about whether the consolidated financial statements
as a whole are free from material misstatement, whether due to fraud or error, and to issue an auditor’s
report that includes our opinion. Reasonable assurance is a high level of assurance, but is not a guarantee
that an audit conducted in accordance with ROC GAAS will always detect a material misstatement when
it exists. Misstatements can arise from fraud or error and are considered material if, individually or in
the aggregate, they could reasonably be expected to influence the economic decisions of users taken on
the basis of these consolidated financial statements.

~4~
As part of an audit in accordance with ROC GAAS, we exercise professional judgment and maintain
professional skepticism throughout the audit. We also:
A. Identify and assess the risks of material misstatement of the consolidated financial statements,
whether due to fraud or error, design and perform audit procedures responsive to those risks, and
obtain audit evidence that is sufficient and appropriate to provide a basis for our opinion. The risk of
not detecting a material misstatement resulting from fraud is higher than for one resulting from error,
as fraud may involve collusion, forgery, intentional omissions, misrepresentations, or the override of
internal control.
B. Obtain an understanding of internal control relevant to the audit in order to design audit procedures
that are appropriate in the circumstances, but not for the purpose of expressing an opinion on the
effectiveness of the Group’s internal control.
C. Evaluate the appropriateness of accounting policies used and the reasonableness of accounting
estimates and related disclosures made by management.
D. Conclude on the appropriateness of management’s use of the going concern basis of accounting and,
based on the audit evidence obtained, whether a material uncertainty exists related to events or
conditions that may cast significant doubt on the Group’s ability to continue as a going concern. If
we conclude that a material uncertainty exists, we are required to draw attention in our auditor’s
report to the related disclosures in the consolidated financial statements or, if such disclosures are
inadequate, to modify our opinion. Our conclusions are based on the audit evidence obtained up to
the date of our auditor’s report. However, future events or conditions may cause the Group to cease
to continue as a going concern.
E. Evaluate the overall presentation, structure and content of the consolidated financial statements,
including the disclosures, and whether the consolidated financial statements represent the underlying
transactions and events in a manner that achieves fair presentation.
F. Obtain sufficient appropriate audit evidence regarding the financial information of the entities or
business activities within the Group to express an opinion on the consolidated financial statements.
We are responsible for the direction, supervision and performance of the group audit. We remain
solely responsible for our audit opinion.
We communicate with those charged with governance regarding, among other matters, the planned scope
and timing of the audit and significant audit findings, including any significant deficiencies in internal
control that we identify during our audit.
We also provide those charged with governance with a statement that we have complied with relevant
ethical requirements regarding independence, and to communicate with them all relationships and other
matters that may reasonably be thought to bear on our independence, and where applicable, related
safeguards.

~5~
From the matters communicated with those charged with governance, we determine those matters that
were of most significance in the audit of the consolidated financial statements of the current period and
are therefore the key audit matters. We describe these matters in our auditor’s report unless law or
regulation precludes public disclosure about the matter or when, in extremely rare circumstances, we
determine that a matter should not be communicated in our report because the adverse consequences of
doing so would reasonably be expected to outweigh the public interest benefits of such communication.
PricewaterhouseCoopers, Taiwan
February 14, 2019
------------------------------------------------------------------------------------------------------------------------------------------------- The accompanying consolidated financial statements are not intended to present the financial position and results of operations and cash flows in accordance with accounting principles generally accepted in countries and jurisdictions other than the Republic of China. The standards, procedures and practices in the Republic of China governing the audit of such financial statements may differ from those generally accepted in countries and jurisdictions other than the Republic of China. Accordingly, the accompanying consolidated financial statements and report of independent accountants are not intended for use by those who are not informed about the accounting principles or auditing standards generally accepted in the Republic of China, and their applications in practice.
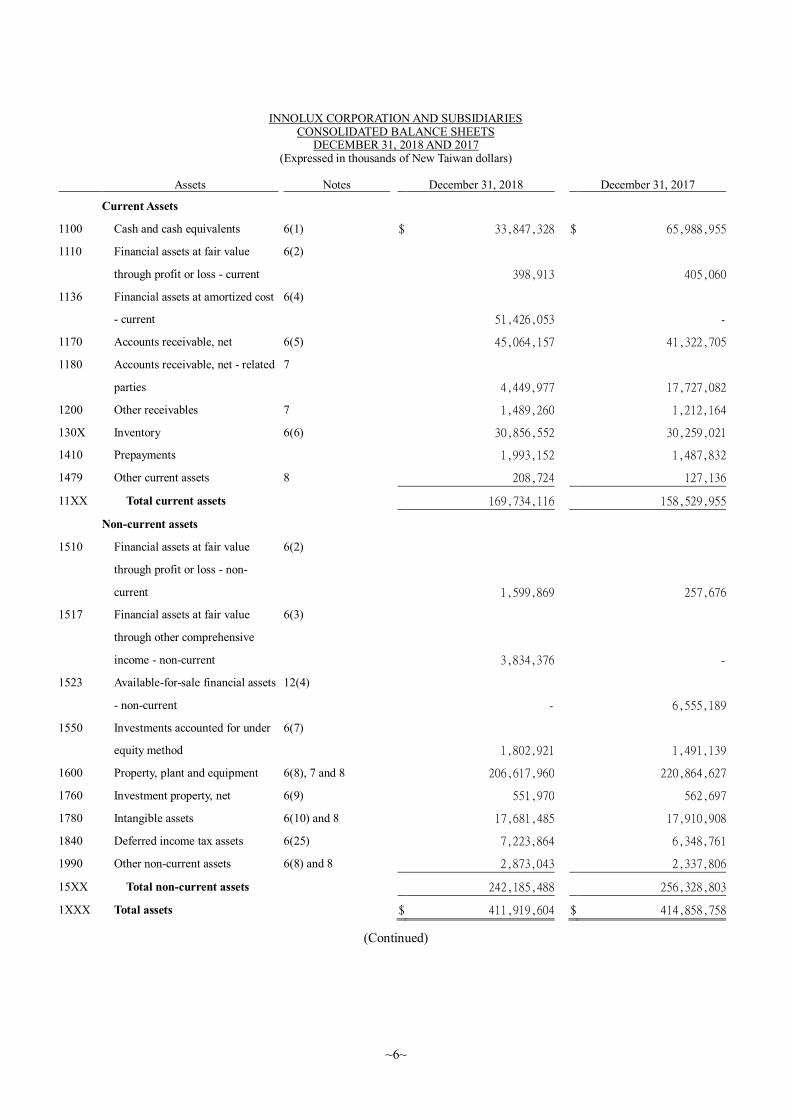
INNOLUX CORPORATION AND SUBSIDIARIES CONSOLIDATED BALANCE SHEETS
DECEMBER 31, 2018 AND 2017 (Expressed in thousands of New Taiwan dollars)
~6~
Assets Notes December 31, 2018 December 31, 2017
Current Assets
1100 Cash and cash equivalents 6(1) $ 33,847,328 $ 65,988,955
1110 Financial assets at fair value
through profit or loss - current
6(2)
398,913 405,060
1136 Financial assets at amortized cost
- current
6(4)
51,426,053 -
1170 Accounts receivable, net 6(5) 45,064,157 41,322,705
1180 Accounts receivable, net - related
parties
7
4,449,977 17,727,082
1200 Other receivables 7 1,489,260 1,212,164
130X Inventory 6(6) 30,856,552 30,259,021
1410 Prepayments 1,993,152 1,487,832
1479 Other current assets 8 208,724 127,136
11XX Total current assets 169,734,116 158,529,955
Non-current assets
1510 Financial assets at fair value
through profit or loss - non-
current
6(2)
1,599,869 257,676
1517 Financial assets at fair value
through other comprehensive
income - non-current
6(3)
3,834,376 -
1523 Available-for-sale financial assets
- non-current
12(4)
- 6,555,189
1550 Investments accounted for under
equity method
6(7)
1,802,921 1,491,139
1600 Property, plant and equipment 6(8), 7 and 8 206,617,960 220,864,627
1760 Investment property, net 6(9) 551,970 562,697
1780 Intangible assets 6(10) and 8 17,681,485 17,910,908
1840 Deferred income tax assets 6(25) 7,223,864 6,348,761
1990 Other non-current assets 6(8) and 8 2,873,043 2,337,806
15XX Total non-current assets 242,185,488 256,328,803
1XXX Total assets $ 411,919,604 $ 414,858,758
(Continued)
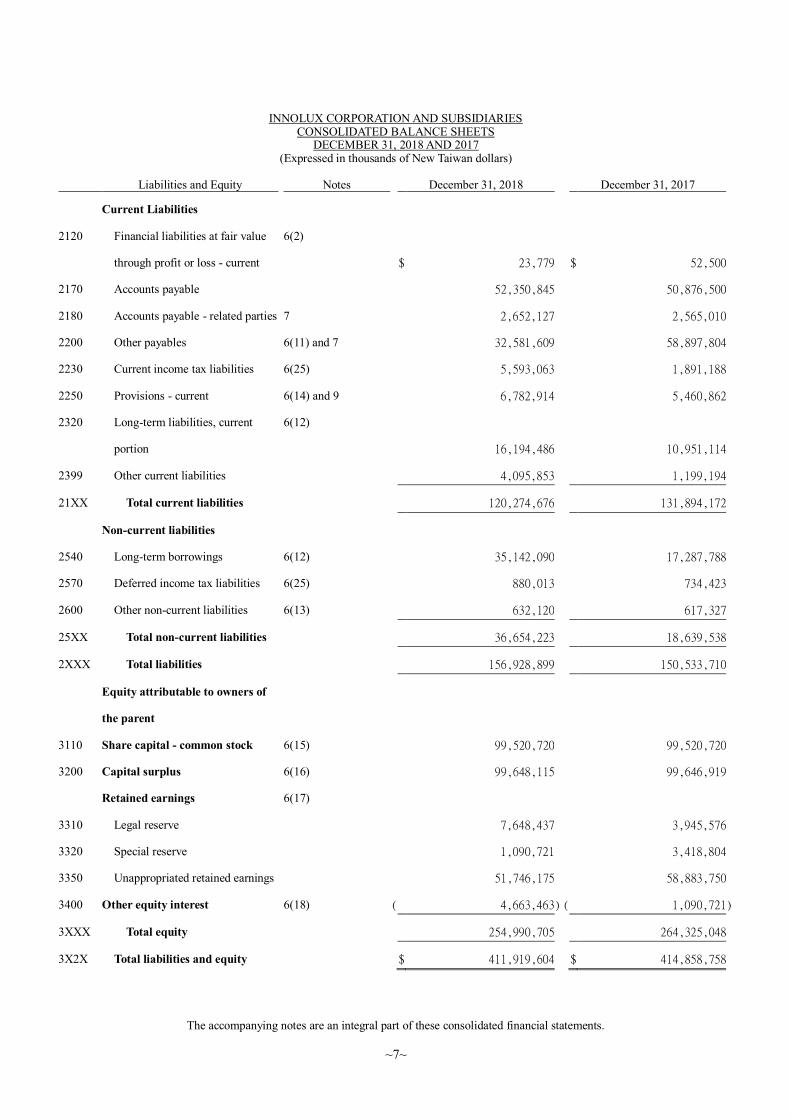
INNOLUX CORPORATION AND SUBSIDIARIES CONSOLIDATED BALANCE SHEETS
DECEMBER 31, 2018 AND 2017 (Expressed in thousands of New Taiwan dollars)
The accompanying notes are an integral part of these consolidated financial statements.
~7~
Liabilities and Equity Notes December 31, 2018 December 31, 2017
Current Liabilities
2120 Financial liabilities at fair value
through profit or loss - current
6(2)
$ 23,779 $ 52,500
2170 Accounts payable 52,350,845 50,876,500
2180 Accounts payable - related parties 7 2,652,127 2,565,010
2200 Other payables 6(11) and 7 32,581,609 58,897,804
2230 Current income tax liabilities 6(25) 5,593,063 1,891,188
2250 Provisions - current 6(14) and 9 6,782,914 5,460,862
2320 Long-term liabilities, current
portion
6(12)
16,194,486 10,951,114
2399 Other current liabilities 4,095,853 1,199,194
21XX Total current liabilities 120,274,676 131,894,172
Non-current liabilities
2540 Long-term borrowings 6(12) 35,142,090 17,287,788
2570 Deferred income tax liabilities 6(25) 880,013 734,423
2600 Other non-current liabilities 6(13) 632,120 617,327
25XX Total non-current liabilities 36,654,223 18,639,538
2XXX Total liabilities 156,928,899 150,533,710
Equity attributable to owners of
the parent
3110 Share capital - common stock 6(15) 99,520,720 99,520,720
3200 Capital surplus 6(16) 99,648,115 99,646,919
Retained earnings 6(17)
3310 Legal reserve 7,648,437 3,945,576
3320 Special reserve 1,090,721 3,418,804
3350 Unappropriated retained earnings 51,746,175 58,883,750
3400 Other equity interest 6(18) ( 4,663,463 ) ( 1,090,721 )
3XXX Total equity 254,990,705 264,325,048
3X2X Total liabilities and equity $ 411,919,604 $ 414,858,758
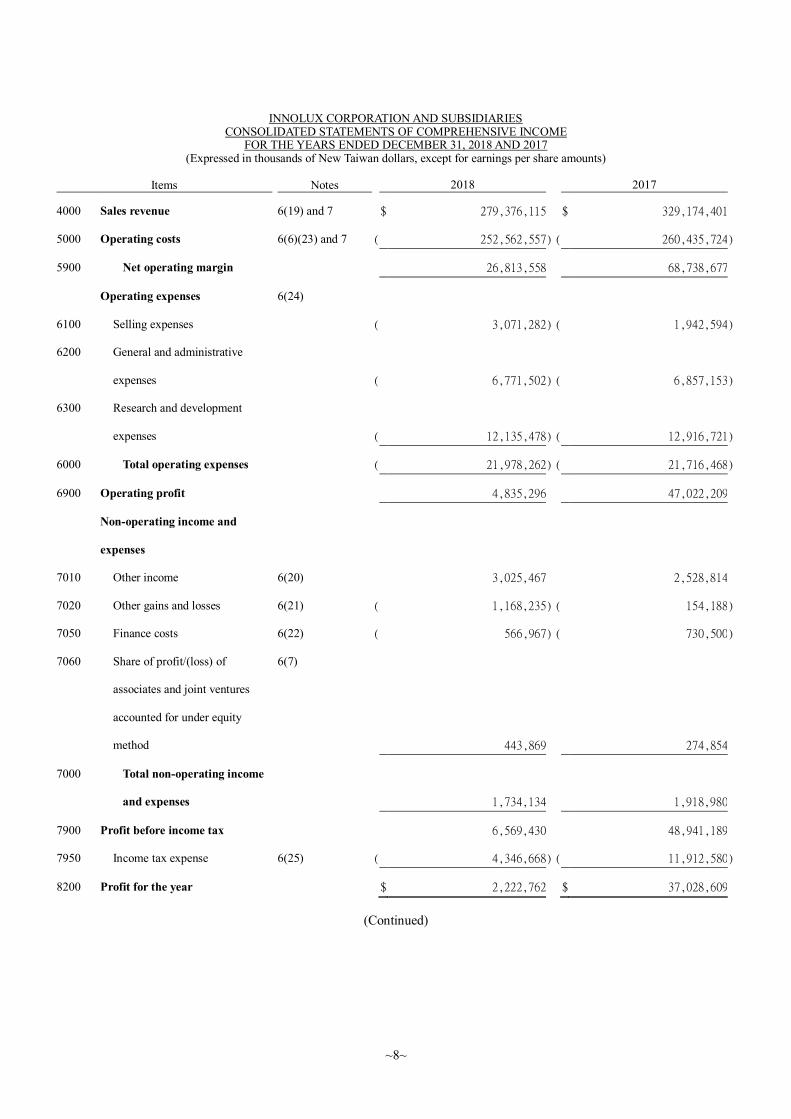
INNOLUX CORPORATION AND SUBSIDIARIES CONSOLIDATED STATEMENTS OF COMPREHENSIVE INCOME
FOR THE YEARS ENDED DECEMBER 31, 2018 AND 2017 (Expressed in thousands of New Taiwan dollars, except for earnings per share amounts)
~8~
Items Notes 2018 2017
4000 Sales revenue 6(19) and 7 $ 279,376,115 $ 329,174,401
5000 Operating costs 6(6)(23) and 7 ( 252,562,557 ) ( 260,435,724 )
5900 Net operating margin 26,813,558 68,738,677
Operating expenses 6(24)
6100 Selling expenses ( 3,071,282 ) ( 1,942,594 )
6200 General and administrative
expenses
( 6,771,502 ) ( 6,857,153 )
6300 Research and development
expenses
( 12,135,478 ) ( 12,916,721 )
6000 Total operating expenses ( 21,978,262 ) ( 21,716,468 )
6900 Operating profit 4,835,296 47,022,209
Non-operating income and
expenses
7010 Other income 6(20) 3,025,467 2,528,814
7020 Other gains and losses 6(21) ( 1,168,235 ) ( 154,188 )
7050 Finance costs 6(22) ( 566,967 ) ( 730,500 )
7060 Share of profit/(loss) of
associates and joint ventures
accounted for under equity
method
6(7)
443,869 274,854
7000 Total non-operating income
and expenses
1,734,134 1,918,980
7900 Profit before income tax 6,569,430 48,941,189
7950 Income tax expense 6(25) ( 4,346,668 ) ( 11,912,580 )
8200 Profit for the year $ 2,222,762 $ 37,028,609
(Continued)

INNOLUX CORPORATION AND SUBSIDIARIES CONSOLIDATED STATEMENTS OF COMPREHENSIVE INCOME
FOR THE YEARS ENDED DECEMBER 31, 2018 AND 2017 (Expressed in thousands of New Taiwan dollars, except for earnings per share amounts)
The accompanying notes are an integral part of these consolidated financial statements.
~9~
Items Notes 2018 2017
Other comprehensive (loss) income (net)
Components of other comprehensive loss that will not be reclassified to profit or loss
8311 Remeasurement of defined
benefit obligations 6(13)
( $ 29,878 ) ( $ 49,571 ) 8316 Unrealized gains (losses) on
financial assets at fair value through other comprehensive income
6(18)
( 2,828,816 ) - 8349 Income tax related to
components of other comprehensive income that will not be reclassified to profit or loss
6(25)
5,976 8,427 8310 Components of other
comprehensive loss that will not be reclassified to profit or loss
( 2,852,718 ) ( 41,144 ) Components of other
comprehensive (loss) income that will be reclassified to profit or loss
8361 Financial statements translation
differences of foreign operations 6(18)
( 828,563 ) ( 1,643,264 ) 8362 Unrealized gain on valuation of
available-for-sale financial assets
6(18)
- 4,322,008 8370 Share of other comprehensive
income (loss) of associates and joint ventures accounted for under equity method
6(18)
84,637 ( 33,551 ) 8399 Income tax relating to the
components of other comprehensive loss that will be reclassified to profit or loss
6(25)
- ( 317,110 ) 8360 Components of other
comprehensive (loss) income that will be reclassified to profit or loss
( 743,926 ) 2,328,083 8300 Other comprehensive (loss)
income for the year, net of tax
( $ 3,596,644 ) $ 2,286,939
8500 Total comprehensive (loss) income for the year
( $ 1,373,882 ) $ 39,315,548
Profit (loss) attributable to: 8610 Owners of the parent $ 2,222,762 $ 37,028,609
Other comprehensive (loss) income attributable to:
8710 Owners of the parent ( $ 1,373,882 ) $ 39,315,548
Earnings per share (in dollars) 6(26) 9750 Basic earnings per share $ 0.22 $ 3.72
9850 Diluted earnings per share $ 0.22 $ 3.63
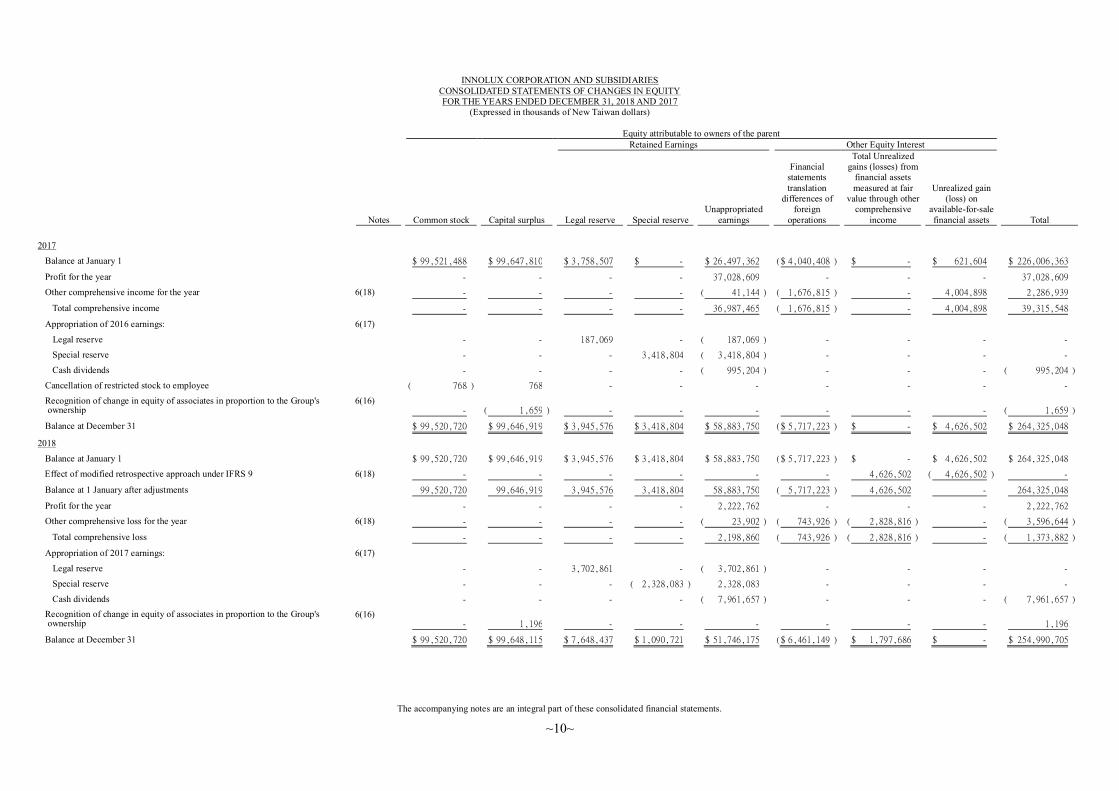
INNOLUX CORPORATION AND SUBSIDIARIES
CONSOLIDATED STATEMENTS OF CHANGES IN EQUITY
FOR THE YEARS ENDED DECEMBER 31, 2018 AND 2017
(Expressed in thousands of New Taiwan dollars)
Equity attributable to owners of the parent
Retained Earnings Other Equity Interest
Notes
Common stock
Capital surplus
Legal reserve
Special reserve
Unappropriated
earnings
Financial
statements
translation
differences of
foreign
operations
Total Unrealized
gains (losses) from
financial assets
measured at fair
value through other
comprehensive
income
Unrealized gain
(loss) on
available-for-sale
financial assets
Total
The accompanying notes are an integral part of these consolidated financial statements.
~10~
2017
Balance at January 1 $ 99,521,488 $ 99,647,810 $ 3,758,507 $ - $ 26,497,362 ( $ 4,040,408 ) $ - $ 621,604 $ 226,006,363
Profit for the year - - - - 37,028,609 - - - 37,028,609
Other comprehensive income for the year 6(18) - - - - ( 41,144 ) ( 1,676,815 ) - 4,004,898 2,286,939
Total comprehensive income - - - - 36,987,465 ( 1,676,815 ) - 4,004,898 39,315,548
Appropriation of 2016 earnings: 6(17)
Legal reserve - - 187,069 - ( 187,069 ) - - - -
Special reserve - - - 3,418,804 ( 3,418,804 ) - - - -
Cash dividends - - - - ( 995,204 ) - - - ( 995,204 )
Cancellation of restricted stock to employee ( 768 ) 768 - - - - - - -
Recognition of change in equity of associates in proportion to the Group's ownership
6(16) - ( 1,659 ) - - - - - - ( 1,659 )
Balance at December 31 $ 99,520,720 $ 99,646,919 $ 3,945,576 $ 3,418,804 $ 58,883,750 ( $ 5,717,223 ) $ - $ 4,626,502 $ 264,325,048
2018
Balance at January 1 $ 99,520,720 $ 99,646,919 $ 3,945,576 $ 3,418,804 $ 58,883,750 ( $ 5,717,223 ) $ - $ 4,626,502 $ 264,325,048
Effect of modified retrospective approach under IFRS 9 6(18) - - - - - - 4,626,502 ( 4,626,502 ) -
Balance at 1 January after adjustments 99,520,720 99,646,919 3,945,576 3,418,804 58,883,750 ( 5,717,223 ) 4,626,502 - 264,325,048
Profit for the year - - - - 2,222,762 - - - 2,222,762
Other comprehensive loss for the year 6(18) - - - - ( 23,902 ) ( 743,926 ) ( 2,828,816 ) - ( 3,596,644 )
Total comprehensive loss - - - - 2,198,860 ( 743,926 ) ( 2,828,816 ) - ( 1,373,882 )
Appropriation of 2017 earnings: 6(17)
Legal reserve - - 3,702,861 - ( 3,702,861 ) - - - -
Special reserve - - - ( 2,328,083 ) 2,328,083 - - - -
Cash dividends - - - - ( 7,961,657 ) - - - ( 7,961,657 ) Recognition of change in equity of associates in proportion to the Group's
ownership 6(16)
- 1,196 - - - - - - 1,196
Balance at December 31 $ 99,520,720 $ 99,648,115 $ 7,648,437 $ 1,090,721 $ 51,746,175 ( $ 6,461,149 ) $ 1,797,686 $ - $ 254,990,705
INNOLUX CORPORATION AND SUBSIDIARIES CONSOLIDATED STATEMENTS OF CASH FLOWS
FOR THE YEARS ENDED DECEMBER 31, 2018 AND 2017 (Expressed in thousands of New Taiwan dollars)
Notes 2018 2017
~11~
CASH FLOWS FROM OPERATING ACTIVITIES
Profit before tax $ 6,569,430 $ 48,941,189
Adjustments
Adjustments to reconcile profit (loss)
Depreciation and amortization 6(23) 35,878,131 33,564,048
Net loss on financial assets or liabilities at fair
value through profit or loss
301,253 -
Expected credit loss 100,233 -
Share of loss of associates and joint ventures
accounted for under equity method
6(7)
( 443,869 ) ( 274,854 )
Gain from disposal of investments 6(21) ( 968 ) ( 2,483,645 )
Loss on disposal of property, plant and
equipment
6(21)
267,509 597,261
Impairment loss 6(21) - 3,120,824
Interest expense 6(22) 566,967 730,500
Interest income 6(20) ( 991,116 ) ( 472,331 )
Dividend income 6(20) ( 236,574 ) ( 151,677 )
Unrealized foreign exchange loss (gain) 149,778 ( 4,725 )
Changes in operating assets and liabilities
Changes in operating assets
Financial assets /liabilities at fair value
through profit or loss - current
( 22,574 ) ( 1,486,042 )
Accounts receivable ( 1,514,778 ) 11,532,927
Accounts receivable - related parties 13,277,320 ( 6,127,723 )
Other receivables ( 214,028 ) 845,803
Inventories ( 597,531 ) ( 6,857,293 )
Prepayments ( 505,320 ) 64,541
Other current assets ( 55,873 ) 23,807
Changes in operating liabilities
Accounts payable 1,474,345 ( 998,805 )
Accounts payable - related parties 87,117 ( 2,555,225 )
Other payables ( 1,755,666 ) 6,975,259
Provisions - current 1,322,052 1,695,628
Other current liabilities 370,916 ( 221,458 )
Other non-current liabilities ( 78,805 ) 16,688
Cash inflow generated from operations 53,947,949 86,474,697
Cash paid for income tax ( 1,368,330 ) ( 3,832,038 )
Net cash flows from operating activities 52,579,619 82,642,659
(Continued)
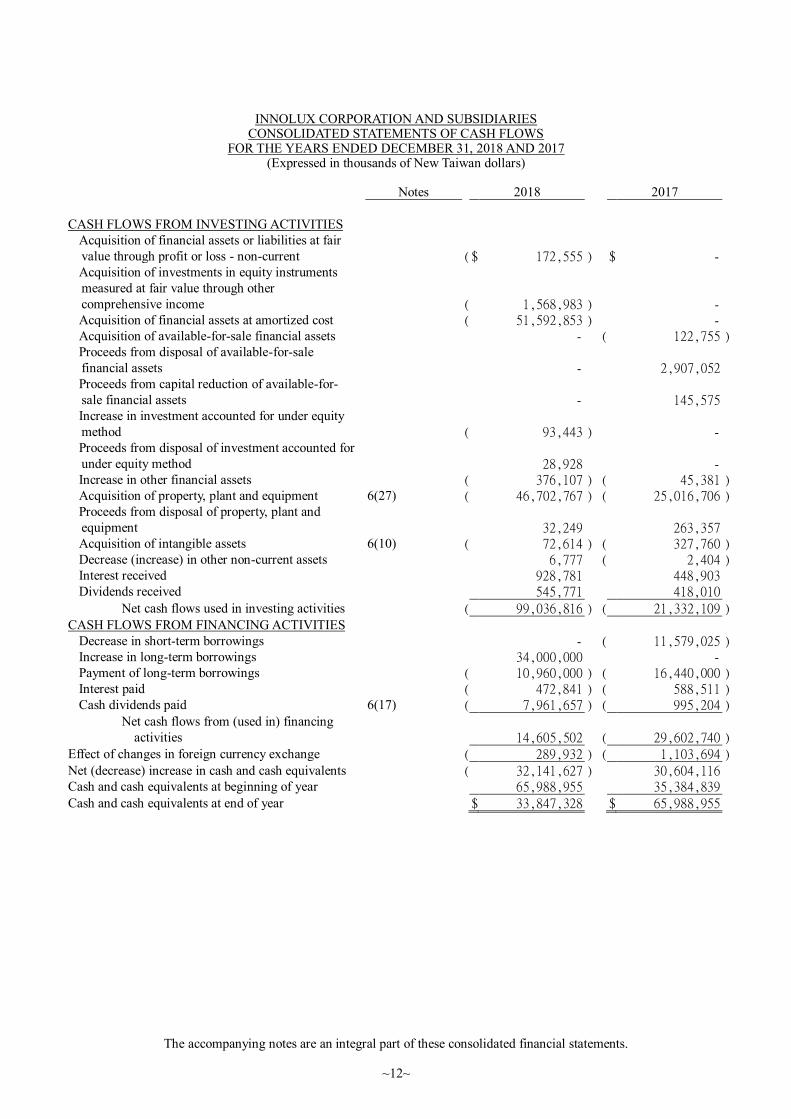
INNOLUX CORPORATION AND SUBSIDIARIES CONSOLIDATED STATEMENTS OF CASH FLOWS
FOR THE YEARS ENDED DECEMBER 31, 2018 AND 2017 (Expressed in thousands of New Taiwan dollars)
Notes 2018 2017
The accompanying notes are an integral part of these consolidated financial statements.
~12~
CASH FLOWS FROM INVESTING ACTIVITIES
Acquisition of financial assets or liabilities at fair
value through profit or loss - non-current
( $ 172,555 ) $ -
Acquisition of investments in equity instruments
measured at fair value through other
comprehensive income
( 1,568,983 ) -
Acquisition of financial assets at amortized cost ( 51,592,853 ) -
Acquisition of available-for-sale financial assets - ( 122,755 )
Proceeds from disposal of available-for-sale
financial assets
- 2,907,052
Proceeds from capital reduction of available-for-
sale financial assets
- 145,575
Increase in investment accounted for under equity
method
( 93,443 ) -
Proceeds from disposal of investment accounted for
under equity method
28,928 -
Increase in other financial assets ( 376,107 ) ( 45,381 )
Acquisition of property, plant and equipment 6(27) ( 46,702,767 ) ( 25,016,706 )
Proceeds from disposal of property, plant and
equipment
32,249 263,357
Acquisition of intangible assets 6(10) ( 72,614 ) ( 327,760 )
Decrease (increase) in other non-current assets 6,777 ( 2,404 )
Interest received 928,781 448,903
Dividends received 545,771 418,010
Net cash flows used in investing activities ( 99,036,816 ) ( 21,332,109 )
CASH FLOWS FROM FINANCING ACTIVITIES
Decrease in short-term borrowings - ( 11,579,025 )
Increase in long-term borrowings 34,000,000 -
Payment of long-term borrowings ( 10,960,000 ) ( 16,440,000 )
Interest paid ( 472,841 ) ( 588,511 )
Cash dividends paid 6(17) ( 7,961,657 ) ( 995,204 )
Net cash flows from (used in) financing
activities
14,605,502 ( 29,602,740 )
Effect of changes in foreign currency exchange ( 289,932 ) ( 1,103,694 )
Net (decrease) increase in cash and cash equivalents ( 32,141,627 ) 30,604,116
Cash and cash equivalents at beginning of year 65,988,955 35,384,839
Cash and cash equivalents at end of year $ 33,847,328 $ 65,988,955

~13~
INNOLUX CORPORATION AND SUBSIDIARIES
NOTES TO THE CONSOLIDATED FINANCIAL STATEMENTS
FOR THE YEARS ENDED DECEMBER 31, 2018 AND 2017
(Expressed in thousands of New Taiwan dollars, except as otherwise indicated)
1. HISTORY AND ORGANIZATION
(1) Innolux Corporation (the “Company”) was organized on January 14, 2003 under the Act for
Establishment and Administration of Science Parks in Republic of China (R.O.C.). The Company
was listed on the Taiwan Stock Exchange Corporation (the “TSEC”) in October 2006. The Company
merged with TPO Displays Corporation and Chi Mei Optoelectronics Corporation on March 18,
2010, with the Company as the surviving entity.
(2) The Company and its subsidiaries (the “Group”) engage in the research, development, design,
manufacture and sales of TFT-LCD panels, modules and monitors of LCD, color filter, and low
temperature poly-silicon TFT-LCD.
2. THE DATE OF AUTHORIZATION FOR ISSUANCE OF THE CONSOLIDATED FINANCIAL
STATEMENTS AND PROCEDURES FOR AUTHORIZATION
These consolidated financial statements were authorized for issuance by the Board of Directors on
February 14, 2019.
3. APPLICATION OF NEW STANDARDS, AMENDMENTS AND INTERPRETATIONS
(1) Effect of the adoption of new issuances of or amendments to International Financial Reporting
Standards (“IFRS”) as endorsed by the Financial Supervisory Commission (“FSC”)
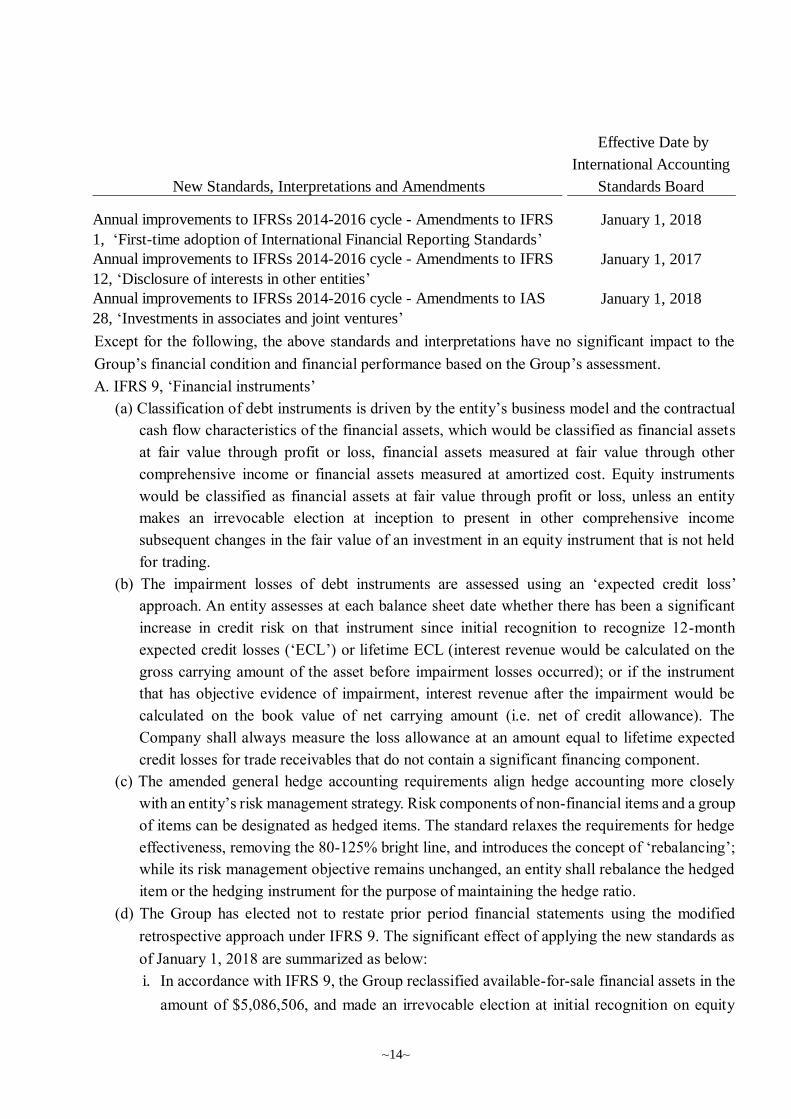
New standards, interpretations and amendments endorsed by FSC effective from 2018 are as follows:
New Standards, Interpretations and Amendments
Effective Date by
International Accounting
Standards Board
Amendments to IFRS 2, ‘Classification and measurement of share-based
payment transactions’
January 1, 2018
Amendments to IFRS 4, ‘Applying IFRS 9 Financial instruments with
IFRS 4 Insurance contracts’
January 1, 2018
IFRS 9, ‘Financial instruments’ January 1, 2018
IFRS 15, ‘Revenue from contracts with customers’ January 1, 2018
Amendments to IFRS 15, ‘Clarifications to IFRS 15 Revenue from
contracts with customers’
January 1, 2018
Amendments to IAS 7, ‘Disclosure initiative’ January 1, 2017
Amendments to IAS 12, ‘Recognition of deferred tax assets for
unrealized losses’
January 1, 2017
Amendments to IAS 40, ‘Transfers of investment property’ January 1, 2018
IFRIC 22, ‘Foreign currency transactions and advance consideration’ January 1, 2018
~14~
Except for the following, the above standards and interpretations have no significant impact to the
Group’s financial condition and financial performance based on the Group’s assessment.
A. IFRS 9, ‘Financial instruments’
(a) Classification of debt instruments is driven by the entity’s business model and the contractual
cash flow characteristics of the financial assets, which would be classified as financial assets
at fair value through profit or loss, financial assets measured at fair value through other
comprehensive income or financial assets measured at amortized cost. Equity instruments
would be classified as financial assets at fair value through profit or loss, unless an entity
makes an irrevocable election at inception to present in other comprehensive income
subsequent changes in the fair value of an investment in an equity instrument that is not held
for trading.
(b) The impairment losses of debt instruments are assessed using an ‘expected credit loss’
approach. An entity assesses at each balance sheet date whether there has been a significant
increase in credit risk on that instrument since initial recognition to recognize 12-month
expected credit losses (‘ECL’) or lifetime ECL (interest revenue would be calculated on the
gross carrying amount of the asset before impairment losses occurred); or if the instrument
that has objective evidence of impairment, interest revenue after the impairment would be
calculated on the book value of net carrying amount (i.e. net of credit allowance). The
Company shall always measure the loss allowance at an amount equal to lifetime expected
credit losses for trade receivables that do not contain a significant financing component.
(c) The amended general hedge accounting requirements align hedge accounting more closely
with an entity’s risk management strategy. Risk components of non-financial items and a group
of items can be designated as hedged items. The standard relaxes the requirements for hedge
effectiveness, removing the 80-125% bright line, and introduces the concept of ‘rebalancing’;
while its risk management objective remains unchanged, an entity shall rebalance the hedged
item or the hedging instrument for the purpose of maintaining the hedge ratio.
(d) The Group has elected not to restate prior period financial statements using the modified
retrospective approach under IFRS 9. The significant effect of applying the new standards as
of January 1, 2018 are summarized as below:
i. In accordance with IFRS 9, the Group reclassified available-for-sale financial assets in the
amount of $5,086,506, and made an irrevocable election at initial recognition on equity
New Standards, Interpretations and Amendments
Effective Date by
International Accounting
Standards Board
Annual improvements to IFRSs 2014-2016 cycle - Amendments to IFRS
1, ‘First-time adoption of International Financial Reporting Standards’
January 1, 2018
Annual improvements to IFRSs 2014-2016 cycle - Amendments to IFRS
12, ‘Disclosure of interests in other entities’
January 1, 2017
Annual improvements to IFRSs 2014-2016 cycle - Amendments to IAS
28, ‘Investments in associates and joint ventures’
January 1, 2018

~15~
instruments not held for dealing or trading purpose, by increasing financial assets at fair
value through other comprehensive income in the amount of $5,086,506. There was no
effect on retained earnings and other equity interest.
ii. In accordance with IFRS 9, the Group reclassified available-for-sale financial assets in the
amount of $1,468,683 by increasing financial assets at fair value through profit or loss in
the amount of $1,468,683. There was no effect on retained earnings and other equity
interest.
B. IFRS 15, ‘Revenue from contracts with customers’ and amendments
(a) IFRS 15, ‘Revenue from contracts with customers’ replaces IAS 11, ‘Construction Contracts’,
IAS 18, ‘Revenue’, and relevant interpretations and SICs. According to IFRS 15, revenue is
recognized when a customer obtains control of goods or services. A customer obtains control
of goods or services when a customer has the ability to direct the use of, and obtain
substantially all of the remaining benefits from, the asset.
The core principle of IFRS 15 is that an entity recognizes revenue to depict the transfer of
promised goods or services to customers in an amount that reflects the consideration to which
the entity expects to be entitled in exchange for those goods or services. An entity recognizes
revenue in accordance with that core principle by applying the following steps:
Step 1: Identify contracts with customer.
Step 2: Identify performance obligations in the contract(s).
Step 3: Determine the transaction price.
Step 4: Allocate the transaction price.
Step 5: Recognize revenue when the performance obligation is satisfied.
Further, IFRS 15 includes a set of comprehensive disclosure requirements that requires an
entity to disclose sufficient information to enable users of financial statements to understand
the nature, amount, timing and uncertainty of revenue and cash flows arising from contracts
with customers.
(b) The Group has elected not to restate prior period financial statements using the modified
retrospective approach under IFRS 15. The significant effects of applying the new standards
as of January 1, 2018 are summarized as below:
Presentation of assets and liabilities in relation to contracts with customers
In line with IFRS 15 requirements, the Group changed the presentation of certain accounts in
the balance sheet as follows:
Under IFRS 15, liabilities in relation to expected volume discounts and refunds to customers
are recognized as refund liabilities, but were previously presented as accounts receivable-
allowance for sales returns and discounts in the balance sheet. As of January 1, 2018, the
balance amounted to $2,327,123.

~16~
C. Amendments to IAS 7, ‘Disclosure initiative’
This amendment requires that an entity shall provide more disclosures related to changes in
liabilities arising from financing activities, including both changes arising from cash flows and
non-cash changes.
The Group expects to provide additional disclosure to explain the changes in liabilities arising
from financing activities.
(2) Effect of new issuances of or amendments to IFRSs as endorsed by the FSC but not yet adopted by
the Group
New standards, interpretations and amendments endorsed by the FSC effective from 2019 are as
follows:
Except for the following, the above standards and interpretations have no significant impact to the
Group’s financial condition and financial performance based on the Group’s assessment.
IFRS 16, ‘Leases’
IFRS 16, ‘Leases’, replaces IAS 17, ‘Leases’ and related interpretations and SICs. The standard
requires lessees to recognize a ‘right-of-use asset’ and a lease liability (except for those leases with
terms of 12 months or less and leases of low-value assets). The accounting stays the same for lessors,
which is to classify their leases as either finance leases or operating leases and account for those two
types of leases differently. IFRS 16 only requires enhanced disclosures to be provided by lessors.
The Group expects to recognize the lease contract of lessees in line with IFRS 16. However, the
Group intends not to restate the financial statements of prior period (collectively referred herein as
the “modified retrospective approach”). On January 1, 2019, it is expected that right-of-use asset
and lease liability will be increased by $7,029,771 and $6,180,682, and retained earnings stay the
same.
New Standards, Interpretations and Amendments
Effective Date by
International Accounting
Standards Board
Amendments to IFRS 9, ‘Prepayment features with negative
compensation’
January 1, 2019
IFRS 16, ‘Leases’ January 1, 2019
Amendments to IAS 19, ‘Plan amendment, curtailment or settlement’ January 1, 2019
Amendments to IAS 28, ‘Long-term interests in associates and joint
ventures’
January 1, 2019
IFRIC 23, ‘Uncertainty over income tax treatments’ January 1, 2019
Annual improvements to IFRSs 2015-2017 cycle January 1, 2019
~17~
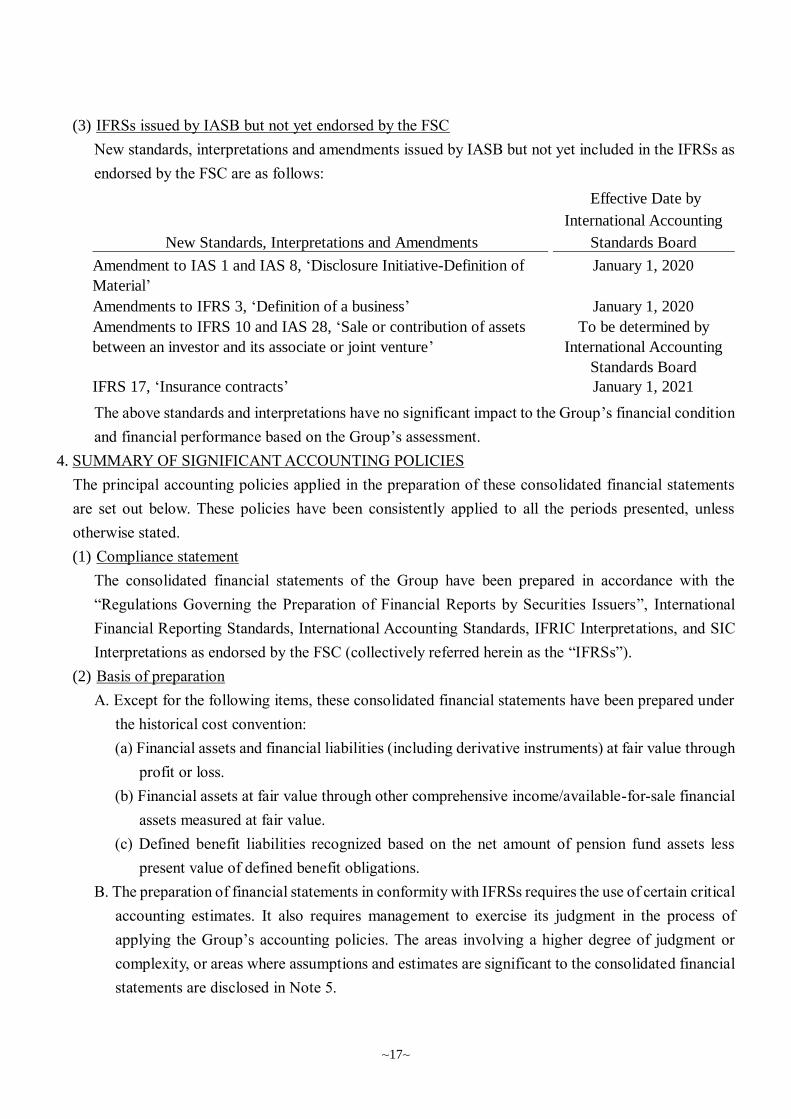
(3) IFRSs issued by IASB but not yet endorsed by the FSC
New standards, interpretations and amendments issued by IASB but not yet included in the IFRSs as
endorsed by the FSC are as follows:
The above standards and interpretations have no significant impact to the Group’s financial condition
and financial performance based on the Group’s assessment.
4. SUMMARY OF SIGNIFICANT ACCOUNTING POLICIES
The principal accounting policies applied in the preparation of these consolidated financial statements
are set out below. These policies have been consistently applied to all the periods presented, unless
otherwise stated.
(1) Compliance statement
The consolidated financial statements of the Group have been prepared in accordance with the
“Regulations Governing the Preparation of Financial Reports by Securities Issuers”, International
Financial Reporting Standards, International Accounting Standards, IFRIC Interpretations, and SIC
Interpretations as endorsed by the FSC (collectively referred herein as the “IFRSs”).
(2) Basis of preparation
A. Except for the following items, these consolidated financial statements have been prepared under
the historical cost convention:
(a) Financial assets and financial liabilities (including derivative instruments) at fair value through
profit or loss.
(b) Financial assets at fair value through other comprehensive income/available-for-sale financial
assets measured at fair value.
(c) Defined benefit liabilities recognized based on the net amount of pension fund assets less
present value of defined benefit obligations.
B. The preparation of financial statements in conformity with IFRSs requires the use of certain critical
accounting estimates. It also requires management to exercise its judgment in the process of
applying the Group’s accounting policies. The areas involving a higher degree of judgment or
complexity, or areas where assumptions and estimates are significant to the consolidated financial
statements are disclosed in Note 5.
New Standards, Interpretations and Amendments
Effective Date by
International Accounting
Standards Board
Amendment to IAS 1 and IAS 8, ‘Disclosure Initiative-Definition of
Material’
January 1, 2020
Amendments to IFRS 3, ‘Definition of a business’ January 1, 2020
Amendments to IFRS 10 and IAS 28, ‘Sale or contribution of assets
between an investor and its associate or joint venture’
To be determined by
International Accounting
Standards Board
IFRS 17, ‘Insurance contracts’ January 1, 2021
~18~
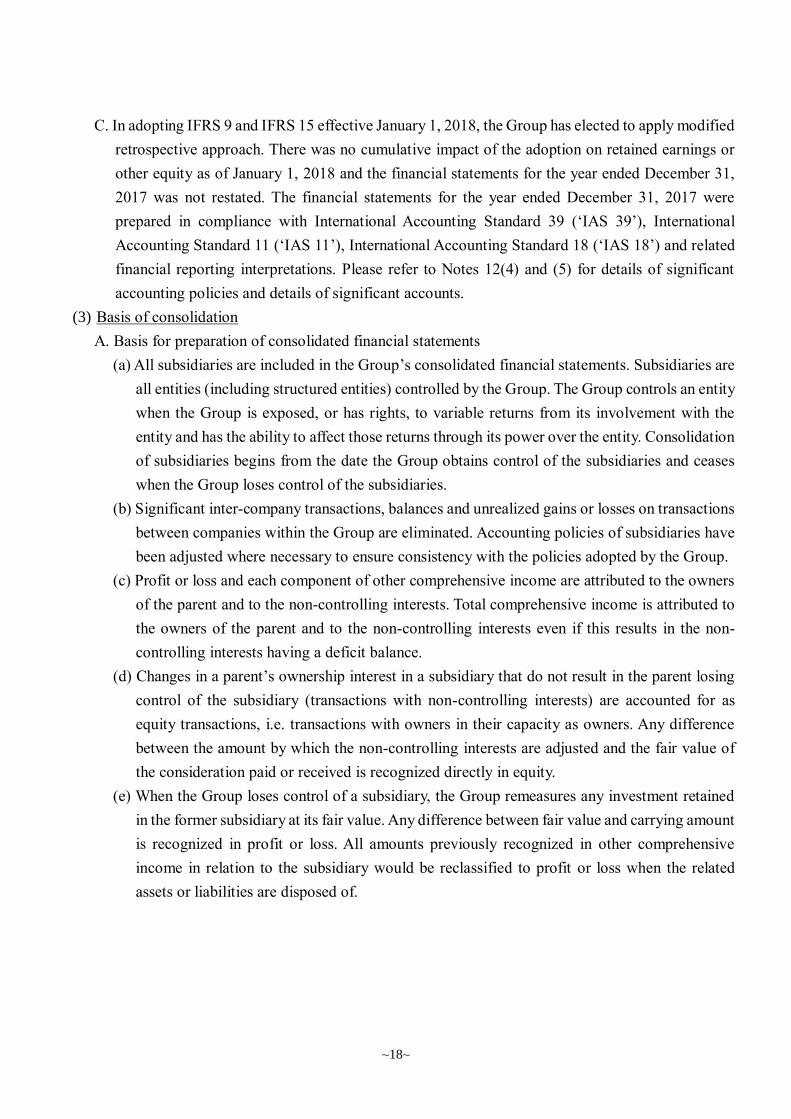
C. In adopting IFRS 9 and IFRS 15 effective January 1, 2018, the Group has elected to apply modified
retrospective approach. There was no cumulative impact of the adoption on retained earnings or
other equity as of January 1, 2018 and the financial statements for the year ended December 31,
2017 was not restated. The financial statements for the year ended December 31, 2017 were
prepared in compliance with International Accounting Standard 39 (‘IAS 39’), International
Accounting Standard 11 (‘IAS 11’), International Accounting Standard 18 (‘IAS 18’) and related
financial reporting interpretations. Please refer to Notes 12(4) and (5) for details of significant
accounting policies and details of significant accounts.
(3) Basis of consolidation
A. Basis for preparation of consolidated financial statements
(a) All subsidiaries are included in the Group’s consolidated financial statements. Subsidiaries are
all entities (including structured entities) controlled by the Group. The Group controls an entity
when the Group is exposed, or has rights, to variable returns from its involvement with the
entity and has the ability to affect those returns through its power over the entity. Consolidation
of subsidiaries begins from the date the Group obtains control of the subsidiaries and ceases
when the Group loses control of the subsidiaries.
(b) Significant inter-company transactions, balances and unrealized gains or losses on transactions
between companies within the Group are eliminated. Accounting policies of subsidiaries have
been adjusted where necessary to ensure consistency with the policies adopted by the Group.
(c) Profit or loss and each component of other comprehensive income are attributed to the owners
of the parent and to the non-controlling interests. Total comprehensive income is attributed to
the owners of the parent and to the non-controlling interests even if this results in the non-
controlling interests having a deficit balance.
(d) Changes in a parent’s ownership interest in a subsidiary that do not result in the parent losing
control of the subsidiary (transactions with non-controlling interests) are accounted for as
equity transactions, i.e. transactions with owners in their capacity as owners. Any difference
between the amount by which the non-controlling interests are adjusted and the fair value of
the consideration paid or received is recognized directly in equity.
(e) When the Group loses control of a subsidiary, the Group remeasures any investment retained
in the former subsidiary at its fair value. Any difference between fair value and carrying amount
is recognized in profit or loss. All amounts previously recognized in other comprehensive
income in relation to the subsidiary would be reclassified to profit or loss when the related
assets or liabilities are disposed of.

~19~
B. Subsidiaries included in the consolidated financial statements:
Main
Business December December
Name of Investor Name of Subsidiary Activities 31, 2018 31, 2017 Description
Innolux Corporation Bright Information Holding Ltd. Investment holdings 100 100 -
Golden Achiever International
Limited
Investment holdings 100 100 -
Innolux Holding Limited Investment holdings 100 100 -
Keyway Investment
Management Limited
Investment holdings 100 100 -
Landmark International Ltd. Investment holdings 100 100 -
Toppoly Optoelectronics
(B.V.I.) Ltd.
Investment holdings 100 100 -
Innolux Hong Kong Holding
Limited
Investment holdings 100 100 -
Leadtek Global Group Limited Distribution
company
100 100 -
Yuan Chi Investment Co., Ltd. Investment
company
100 100 -
InnoJoy Investment Corporation Investment
company
100 100 -
Innolux Japan Co., Ltd.
(Formerly name: Innolux
Optoelectronics
Japan Co., Ltd.)
Investment, R&D.
manufacturing and
distribution
company
54 49 (c)
Innolux Corporation Distribution
company
- 100 (c)
Innolux Technology USA Inc. Distribution
company
- 100 (c)
Innolux Singapore Holding Pte.
Ltd.
Investment holdings 100 100 -
Golden Achiever
International Limited
VAP Optoelectronics (Nanjing)
Corp.
Processing company - 100 (e)
Innolux Holding
Limited
Rockets Holding Ltd. Investment holdings 100 100 -
Suns Holding Ltd. Investment holdings 100 100 -
Lakers Trading Ltd. Distribution
company
100 100 -
Keyway Investment
Management Limited
Foshan Innolux Logistics Ltd. Warehousing
company
100 100 -
Landmark
International Ltd.
Ningbo Innolux Optoelectronics
Ltd.
Processing company 100 100 -
Foshan Innolux Optoelectronics
Ltd.
Processing company 100 100 -
Ningbo Innolux Display Ltd. Processing company 100 100 -
Toppoly
Optoelectronics
(B.V.I.) Ltd.
Toppoly Optoelectronics
(Cayman) Ltd.
Investment holdings 100 100 -
Ownership (%)
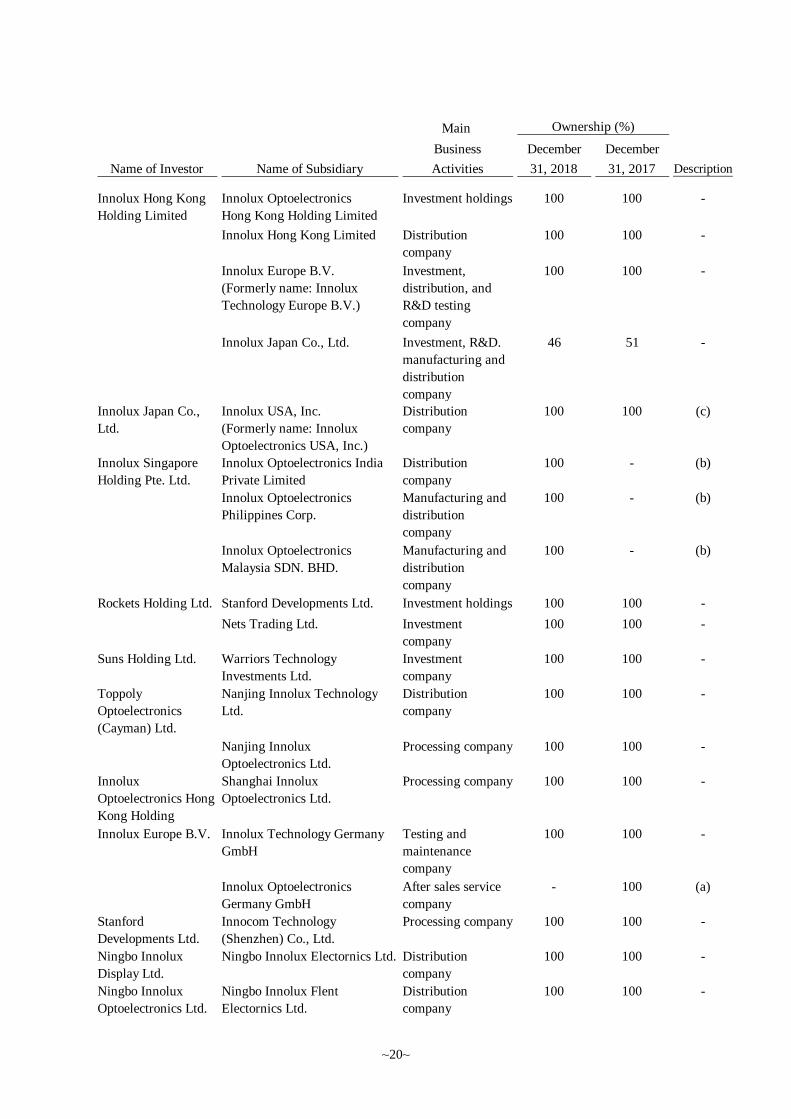
~20~
Main
Business December December
Name of Investor Name of Subsidiary Activities 31, 2018 31, 2017 Description
Ownership (%)
Innolux Hong Kong
Holding Limited
Innolux Optoelectronics
Hong Kong Holding Limited
Investment holdings 100 100 -
Innolux Hong Kong Limited Distribution
company
100 100 -
Innolux Europe B.V.
(Formerly name: Innolux
Technology Europe B.V.)
Investment,
distribution, and
R&D testing
company
100 100 -
Innolux Japan Co., Ltd. Investment, R&D.
manufacturing and
distribution
company
46 51 -
Innolux Japan Co.,
Ltd.
Innolux USA, Inc.
(Formerly name: Innolux
Optoelectronics USA, Inc.)
Distribution
company
100 100 (c)
Innolux Singapore
Holding Pte. Ltd.
Innolux Optoelectronics India
Private Limited
Distribution
company
100 - (b)
Innolux Optoelectronics
Philippines Corp.
Manufacturing and
distribution
company
100 - (b)
Innolux Optoelectronics
Malaysia SDN. BHD.
Manufacturing and
distribution
company
100 - (b)
Rockets Holding Ltd. Stanford Developments Ltd. Investment holdings 100 100 -
Nets Trading Ltd. Investment
company
100 100 -
Suns Holding Ltd. Warriors Technology
Investments Ltd.
Investment
company
100 100 -
Toppoly
Optoelectronics
(Cayman) Ltd.
Nanjing Innolux Technology
Ltd.
Distribution
company
100 100 -
Nanjing Innolux
Optoelectronics Ltd.
Processing company 100 100 -
Innolux
Optoelectronics Hong
Kong Holding
Limited
Shanghai Innolux
Optoelectronics Ltd.
Processing company 100 100 -
Innolux Europe B.V. Innolux Technology Germany
GmbH
Testing and
maintenance
company
100 100 -
Innolux Optoelectronics
Germany GmbH
After sales service
company
- 100 (a)
Stanford
Developments Ltd.
Innocom Technology
(Shenzhen) Co., Ltd.
Processing company 100 100 -
Ningbo Innolux
Display Ltd.
Ningbo Innolux Electornics Ltd. Distribution
company
100 100 -
Ningbo Innolux
Optoelectronics Ltd.
Ningbo Innolux Flent
Electornics Ltd.
Distribution
company
100 100 -

~21~
(a) In the third quarter of 2018, Innolux Optoelectronics Germany Gmbh had completed
liquidation and dissolution.
(b) Innolux Optoelectronics India Private Limited, Innolux Optoelectronics Philippines Corp. and
Innolux Optoelectronics Malaysia SDN. BHD was established in the first quarter of 2018 and
was included in the consolidated financial statements since the date of establishment.
(c) The Company’s wholly-owned subsidiary, Innolux Japan Co., Ltd., issued new shares to obtain
the equity share of Innolux Corporation and Innolux Technology USA Inc. which also are
wholly owned by the Company. Innolux Optoelectronics USA, Inc., the directly wholly-owned
subsidiary of Innolux Japan Co., Ltd., issued new share to Innolux Japan Co., Ltd. and obtained
the equity share of Innolux Corporation and Innolux Technology USA Inc., and merged with
these companies. Innolux Optoelectronics USA, Inc. was the surviving company. The effective
date was February 28, 2018, and was accounted as reorganization. Innolux Optoelectronics
USA, Inc. was renamed Innolux USA, Inc on March 2018.
(d) Shenzhen PixinLED Technology Co., Ltd. was established in the first quarter of 2018 and was
included in the consolidated financial statement since the date of establishment.
(e) In the fourth quarter of 2018, VAP Optoelectronics (Nanjing) Corp. had completed liquidation
and dissolution.
C. Subsidiaries not included in the consolidated financial statements: None.
D. Adjustments for subsidiaries with different balance sheet dates: None.
E. The restrictions on fund remittance from subsidiaries to the parent company: None.
F. Subsidiaries that have non-controlling interests that are material to the Group: None.
(4) Foreign currency translation
Items included in the financial statements of each of the Group’s entities are measured using the
currency of the primary economic environment in which the entity operates (the “functional
currency”). The consolidated financial statements are presented in New Taiwan dollars, which is the
Company’s functional and the Group’s presentation currency.
A. Foreign currency transactions and balances
(a) Foreign currency transactions are translated into the functional currency using the exchange
rates prevailing at the dates of the transactions or valuation where items are remeasured.
Foreign exchange gains and losses resulting from the settlement of such transactions are
recognized in profit or loss in the period in which they arise, except when deferred in other
comprehensive income statements as qualifying cash flow hedge.
(b) Monetary assets and liabilities denominated in foreign currencies at the period end are re-
translated at the exchange rates prevailing at the balance sheet date. Exchange differences
arising upon re-translation at the balance sheet date are recognized in profit or loss.
Main
Business December December
Name of Investor Name of Subsidiary Activities 31, 2018 31, 2017 Description
Ownership (%)
Foshan Innolux
Optoelectronics Ltd.
Foshan Innolux Flent
Electornics Ltd.
Distribution
company
100 100 -
Innocom Technology
(Shenzhen) Co.,
LTD.
Shenzhen PixinLED
Technology Co., LTD.
R&D and
distribution
company
100 - (d)

~22~
(c) Non-monetary assets and liabilities denominated in foreign currencies held at fair value
through profit or loss are re-translated at the exchange rates prevailing at the balance sheet
date; their translation differences are recognized in profit or loss. Non-monetary assets and
liabilities denominated in foreign currencies held at fair value through other comprehensive
income are re-translated at the exchange rates prevailing at the balance sheet date; their
translation differences are recognized in other comprehensive income. However, non-
monetary assets and liabilities denominated in foreign currencies that are not measured at fair
value are translated using the historical exchange rates at the dates of the initial transactions.
(d) All foreign exchange gains and losses are presented in the statement of comprehensive income
within ‘other gains and losses’.
B. Translation of foreign operations
(a) The operating results and financial position of all the group entities and associates that have a
functional currency different from the presentation currency are translated into the
presentation currency as follows:
i. Assets and liabilities for each balance sheet presented are translated at the spot exchange
rate at the date of that balance sheet;
ii. Income and expenses for each statement of comprehensive income are translated at
average exchange rates of that period; and
iii. All resulting exchange differences are recognized in other comprehensive income.
(b) When the foreign operation partially disposed of or sold is an associate, exchange differences
that were recorded in other comprehensive income are proportionately reclassified to profit or
loss as part of the gain or loss on sale. In addition, even when the Group retains partial interest
in the former foreign associate after losing significant influence over the former foreign
associate, such transactions should be accounted for as disposal of all interest in these foreign
operations.
(c) When the foreign operation partially disposed of or sold is a subsidiary, cumulative exchange
differences that were recorded in other comprehensive income are proportionately transferred
to the non-controlling interest in this foreign operation. In addition, even when the Group
retains partial interest in the former foreign subsidiary after losing control of the former foreign
subsidiary, such transactions should be accounted for as disposal of all interest in the foreign
operation.
(5) Classification of current and non-current items
A. Assets that meet one of the following criteria are classified as current assets; otherwise they are
classified as non-current assets:
(a) Assets arising from operating activities that are expected to be realized, or are intended to be
sold or consumed within the normal operating cycle;
(b) Assets held mainly for trading purposes;
(c) Assets that are expected to be realized within twelve months from the balance sheet date;
~23~
(d) Cash and cash equivalents, excluding restricted cash and cash equivalents and those that are
to be exchanged or used to settle liabilities more than twelve months after the balance sheet
date.
B. Liabilities that meet one of the following criteria are classified as current liabilities; otherwise they
are classified as non-current liabilities:
(a) Liabilities that are expected to be settled within the normal operating cycle;
(b) Liabilities arising mainly from trading activities;
(c) Liabilities that are to be settled within twelve months from the balance sheet date;
(d) Liabilities for which the repayment date cannot be extended unconditionally to more than
twelve months after the balance sheet date. Terms of a liability that could, at the option of the
counterparty, result in its settlement by the issue of equity instruments do not affect its
classification.
(6) Cash equivalents
Cash equivalents refer to short-term, highly liquid investments that are readily convertible to known
amounts of cash and subject to an insignificant risk of changes in value. Time deposits and bonds
sold under repurchase agreement that meet the definition above and are held for the purpose of
meeting short-term cash commitments in operations are classified as cash equivalents.
(7) Financial assets at fair value through profit or loss
A. Financial assets at fair value through profit or loss are financial assets that are not measured at
amortized cost or fair value through other comprehensive income.
B. On a regular way purchase or sale basis, financial assets at fair value through profit or loss are
recognized and derecognized using trade date accounting.
C. At initial recognition, the Group measures the financial assets at fair value and recognizes the
transaction costs in profit or loss. The Group subsequently measures the financial assets at fair
value, and recognizes the gain or loss in profit or loss.
D. The Group recognizes the dividend income when the right to receive payment is established, future
economic benefits associated with the dividend will flow to the Group and the amount of the
dividend can be measured reliably.
(8) Financial assets at fair value through other comprehensive income
A. Financial assets at fair value through other comprehensive income comprise equity securities
which are not held for trading, and for which the Group has made an irrevocable election at initial
recognition to recognize changes in fair value in other comprehensive income.
B. On a regular way purchase or sale basis, financial assets at fair value through other comprehensive
income are recognized and derecognized using trade date accounting.
C. At initial recognition, the Group measures the financial assets at fair value plus transaction costs.
The Group subsequently measures the financial assets at fair value:
The changes in fair value of equity investments that were recognized in other comprehensive
income are reclassified to retained earnings and are not reclassified to profit or loss following the

~24~
derecognition of the investment. Dividends are recognized as revenue when the right to receive
payment is established, future economic benefits associated with the dividend will flow to the
Group and the amount of the dividend can be measured reliably.
(9) Financial assets at amortized cost
A. Financial assets at amortized cost are those that meet all of the following criteria:
(a) The objective of the Group’s business model is achieved by collecting contractual cash flows.
(b) The assets’ contractual cash flows represent solely payments of principal and interest.
B. On a regular way purchase or sale basis, financial assets at amortized cost are recognized and
derecognized using trade date accounting.
C. At initial recognition, the Group measures the financial assets at fair value plus transaction costs.
Interest income from these financial assets is included in finance income using the effective
interest method. A gain or loss is recognized in profit or loss when the asset is derecognized or
impaired.
D. The Group’s time deposits which do not fall under cash equivalents are those with a short maturity
period and are measured at initial investment amount as the effect of discounting is immaterial.
(10) Accounts and notes receivable
A. Accounts and notes receivable entitle the Group a legal right to receive consideration in exchange
for transferred goods or rendered services.
B. The short-term accounts and notes receivable without bearing interest are subsequently measured
at initial invoice amount as the effect of discounting is immaterial.
C. The Group’s operating pattern of accounts receivable that are expected to be factored is for the
purpose of receiving contract cash flow and selling, and the accounts receivable are subsequently
measured at fair value, with any changes in fair value recognized in other comprehensive income.
(11) Impairment of financial assets
For accounts receivable that have a significant financing component, at each reporting date, the
Group recognizes the impairment provision for 12 months expected credit losses if there has not
been a significant increase in credit risk since initial recognition or recognizes the impairment
provision for the lifetime expected credit losses (ECLs) if such credit risk has increased since initial
recognition after taking into consideration all reasonable and verifiable information that includes
forecasts. On the other hand, for accounts receivable that do not contain a significant financing
component, the Group recognizes the impairment provision for lifetime ECLs.
(12) Derecognition of financial assets
The Group derecognizes a financial asset when one of the following conditions is met:
A. The contractual rights to receive the cash flows from the financial asset expire.
B. The contractual rights to receive cash flows of the financial asset have been transferred and the
Group has transferred substantially all risks and rewards of ownership of the financial asset.
C. The contractual rights to receive cash flows of the financial asset have been transferred; however,
the Group has not retained control of the financial asset.

~25~
(13) Operating leases (lessor)
Lease income from an operating lease (net of any incentives given to the lessee) is recognized in
profit or loss on a straight-line basis over the lease term.
(14) Inventories
Inventories are stated at the lower of cost and net realizable value. Cost is determined using the
weighted-average method. The cost of finished goods and work in progress comprises raw materials,
direct labour, other direct costs and related production overheads (allocated based on normal
operating capacity). It excludes borrowing costs. The item by item approach is used in applying the
lower of cost and net realizable value. Net realizable value is the estimated selling price in the
ordinary course of business, less the estimated cost of completion and applicable variable selling
expenses.
(15) Investments accounted for using equity method / associates
A. Associates are all entities over which the Group has significant influence but not control. In
general, it is presumed that the investor has significant influence, if an investor holds, directly or
indirectly 20 per cent or more of the voting power of the investee. Investments in associates are
accounted for using the equity method and are initially recognized at cost.
B. The Group’s share of its associates’ post-acquisition profits or losses is recognized in profit or
loss, and its share of post-acquisition movements in other comprehensive income is recognized
in other comprehensive income. When the Group’s share of losses in an associate equals or
exceeds its interest in the associate, the Group does not recognize further losses, unless it has
incurred legal or constructive obligations or made payments on behalf of the associate.
C. When changes in an associate’s equity do not arise from profit or loss or other comprehensive
income of the associate and such changes do not affect the Group’s ownership percentage of the
associate, the Group recognizes change in ownership interests in the associate in ‘capital surplus’
in proportion to its ownership.
D. Unrealized gains on transactions between the Group and its associates are eliminated to the extent
of the Group’s interest in the associates. Unrealized losses are also eliminated unless the
transaction provides evidence of an impairment of the asset transferred. Accounting policies of
associates have been adjusted where necessary to ensure consistency with the policies adopted
by the Group.
(16) Property, plant and equipment
A. Property, plant and equipment are initially recorded at cost. Borrowing costs incurred during the
construction period are capitalized.
B. Subsequent costs are included in the asset’s carrying amount or recognized as a separate asset, as
appropriate, only when it is probable that future economic benefits associated with the item will
flow to the Group and the cost of the item can be measured reliably. The carrying amount of the
replaced part is derecognized. All other repairs and maintenance are charged to profit or loss
during the financial period in which they are incurred.

~26~
C. Land is not depreciated. Other property, plant and equipment apply cost model and are depreciated
using the straight-line method to allocate their cost over their estimated useful lives. Each part of
an item of property, plant, and equipment with a cost that is significant in relation to the total cost
of the item must be depreciated separately.
D. The assets’ residual values, useful lives and depreciation methods are reviewed, and adjusted if
appropriate, at each financial year-end. If expectations for the assets’ residual values and useful
lives differ from previous estimates or the patterns of consumption of the assets’ future economic
benefits embodied in the assets have changed significantly, any change is accounted for as a
change in estimate under IAS 8, ‘Accounting Policies, Changes in Accounting Estimates and
Errors’, from the date of the change. The estimated useful lives of property, plant and equipment
are as follows:
Buildings and structures 2~51 years
Machinery and equipment 5~11 years
Other equipment 2~6 years
(17) Investment property
An investment property is stated initially at its cost and measured subsequently using the cost model.
Except for land, investment property is depreciated on a straight-line basis over its estimated useful
life of 25 ~ 50 years.
(18) Intangible assets
A. Goodwill arises in a business combination accounted for by applying the acquisition method.
B. Patent, royalties and other intangible assets are amortized on a straight-line basis over their
estimated useful lives of 2 ~ 10 years.
(19) Impairment of non-financial assets
A. The Group assesses at each balance sheet date the recoverable amounts of those assets where
there is an indication that they are impaired. An impairment loss is recognized for the amount by
which the asset’s carrying amount exceeds its recoverable amount. The recoverable amount is
the higher of an asset’s fair value less costs to sell or value in use. Except for goodwill, when the
circumstances or reasons for recognizing impairment loss for an asset in prior years no longer
exist or diminish, the impairment loss is reversed. The increased carrying amount due to reversal
should not be more than what the depreciated or amortized historical cost would have been if the
impairment had not been recognized.
B. The recoverable amounts of goodwill, intangible assets with an indefinite useful life and
intangible assets that have not yet been available for use are evaluated periodically. An
impairment loss is recognized for the amount by which the asset’s carrying amount exceeds its
recoverable amount. Impairment loss of goodwill previously recognized in profit or loss shall not
be reversed in the following years.
C. For the purpose of impairment testing, goodwill acquired in a business combination is allocated
to each of the cash-generating units, or groups of cash-generating units, that is/are expected to

~27~
benefit from the synergies of the business combination. Each unit or group of units to which the
goodwill is allocated represents the lowest level within the entity at which the goodwill is
monitored for internal management purposes. Goodwill is monitored at the operating segment
level.
(20) Borrowings
A. Borrowings comprise long-term and short-term bank borrowings. Borrowings are recognized
initially at fair value, net of transaction costs incurred. Borrowings are subsequently stated at
amortized cost; any difference between the proceeds (net of transaction costs) and the redemption
value is recognized in profit or loss over the period of the borrowings using the effective interest
method.
B. Fees paid on the establishment of loan facilities are recognized as transaction costs of the loan to
the extent that it is probable that some or all of the facility will be drawn down. In this case, the
fee is deferred until the draw-down occurs. To the extent there is no evidence that it is probable
that some or all of the facility will be drawn down, the fee is capitalized as a pre-payment for
liquidity services and amortized over the period of the facility to which it relates.
(21) Notes and accounts payable
A. Accounts payable are liabilities for purchases of raw materials, goods or services and notes
payable are those resulting from operating and non-operating activities.
B. The short-term notes and accounts payable without bearing interest are subsequently measured at
initial invoice amount as the effect of discounting is immaterial.
(22) Financial liabilities at fair value through profit or loss
A. Financial liabilities are classified in this category of held for trading if acquired principally for
the purpose of repurchasing in the short-term. Derivatives are also categorized as financial
liabilities held for trading unless they are designated as hedges.
B. At initial recognition, the Group measures the financial liabilities at fair value. All related
transaction costs are recognized in profit or loss. The Group subsequently measures these
financial liabilities at fair value with any gain or loss recognized in profit or loss.
C. If the credit risk results in fair value changes in financial liabilities designated as at fair value
through profit or loss, they are recognized in other comprehensive income in the circumstances
other than avoiding accounting mismatch or recognizing in profit or loss for loan commitments
or financial guarantee contracts.
(23) Provisions
Provisions (including warranties, litigation, etc.) are recognized when the Group has a present legal
or constructive obligation as a result of past events, and it is probable that an outflow of economic
resources will be required to settle the obligation and the amount of the obligation can be reliably
estimated. Provisions are measured at the present value of the expenditures expected to be required
to settle the obligation on the balance sheet date, which is discounted using a pre-tax discount rate
that reflects the current market assessments of the time value of money and the risks specific to the

~28~
obligation. When discounting is used, the increase in the provision due to passage of time is
recognized as interest expense. Provisions are not recognized for future operating losses.
(24) Employee benefits
A. Short-term employee benefits
Short-term employee benefits are measured at the undiscounted amount of the benefits expected
to be paid in respect of service rendered by employees in a period and should be recognized as
expense in that period when the employees render service.
B. Pensions
(a) Defined contribution plans
For defined contribution plans, the contributions are recognized as pension expense when they
are due on an accrual basis. Prepaid contributions are recognized as an asset to the extent of a
cash refund or a reduction in the future payments.
(b) Defined benefit plans
i. Net obligation under a defined benefit plan is defined as the present value of an amount of
pension benefits that employees will receive on retirement for their services with the Group
in current period or prior periods. The liability recognized in the balance sheet in respect
of defined benefit pension plans is the present value of the defined benefit obligation at the
balance sheet date less the fair value of plan assets. The net defined benefit obligation is
calculated annually by independent actuaries using the projected unit credit method. The
rate used to discount is determined by using interest rates of government bonds (at the
balance sheet date) that are denominated in the currency in which the benefits will be
paid, and that have terms to maturity approximating to the terms of the related pension
liability.
ii. Remeasurements arising on defined benefit plans are recognized in other comprehensive
income in the period in which they arise and are recorded as retained earnings.
C. Employees’ compensation and directors’ remuneration
Employees’ compensation and directors’ remuneration are recognized as expense and liability,
provided that such recognition is required under legal or constructive obligation and those
amounts can be reliably estimated. Any difference between the resolved amounts and the
subsequently actual distributed amounts is accounted for as changes in estimates.
(25) Employee share-based payment
Restricted stocks:
A. Restricted stocks issued to employees are measured at the fair value of the equity instruments
granted at the grant date, and are recognized as compensation cost over the vesting period.
B. For restricted stocks where employees have to pay to acquire those stocks, if employees resign
during the vesting period, they must return the stocks to the Group and the Group must refund
their payments on the stocks. The Group recognizes the payments from the employees who are
expected to resign during the vesting period as liabilities at the grant date, and recognizes the

~29~
payments from the employees who are expected to be eventually vested with the stocks in ’capital
surplus – others’.
(26) Income taxes
A. The tax expense for the period comprises current and deferred tax. Tax is recognized in profit or
loss, except to the extent that it relates to items recognized in other comprehensive income or
items recognized directly in equity, in which cases the tax is recognized in other comprehensive
income or equity.
B. The current income tax expense is calculated on the basis of the tax laws enacted or substantively
enacted at the balance sheet date in the countries where the Company and its subsidiaries operate
and generate taxable income. Management periodically evaluates positions taken in tax returns
with respect to situations in accordance with applicable tax regulations. It establishes provisions
where appropriate based on the amounts expected to be paid to the tax authorities. An additional
tax is levied on the unappropriated retained earnings and is recorded as income tax expense in
the year the stockholders resolve to retain the earnings.
C. Deferred tax is recognized, using the balance sheet liability method, on temporary differences
arising between the tax bases of assets and liabilities and their carrying amounts in the
consolidated balance sheet. Deferred tax is determined using tax rates (and laws) that have been
enacted or substantially enacted by the balance sheet date and are expected to apply when the
related deferred tax asset is realized or the deferred tax liability is settled.
D. Deferred tax assets are recognized only to the extent that it is probable that future taxable profit
will be available against which the temporary differences can be utilized. At each balance sheet
date, unrecognized and recognized deferred tax assets are reassessed.
E. A deferred tax asset shall be recognized for the carryforward of unused tax credits result ing from
research and development expenditures to the extent that it is possible that future taxable profit
will be available against which the unused tax credits can be utilized.
(27) Revenue recognition
A. The Group is primarily engaged in manufacture and sale of TFT-LCD panel products. The Group
recognizes revenue when the right of control is transferred to the customer when the products are
delivered to customer and the Group has no unperformed obligation that could affect customer
acceptance of the product. Delivery occurs when the products have been shipped to the specific
location, the risks of obsolescence and loss have been transferred to the customer, and either the
customer has accepted the products in accordance with the sales contract, or the Group has
objective evidence that all criteria for acceptance have been satisfied.
B. Sales revenue is calculated based on the contract price, net of volume discounts and sales returns
and discounts. Revenue from these sales is recognized based on the price specified in the contract,
net of the estimated volume discounts/ sales discounts and allowances. Accumulated experience
is used to estimate and provide for the volume discounts, sales discounts and allowances, using
the expected value method, and revenue is only recognized to the extent that it is highly probable

~30~
that a significant reversal will not occur. The estimation is subject to an assessment at each
reporting date. A refund liability is recognized for expected volume discounts, sales discounts
and allowances payable to customers in relation to sales made until the end of the reporting
period. No element of financing is deemed present as the sales are made, which is consistent with
market practice.
C. A receivable is recognized when the goods are delivered as this is the point in time that the
consideration is unconditional because only the passage of time is required before the payment
is due.
(28) Operating segments
Operating segments are reported in a manner consistent with the internal reporting provided to the
chief operating decision maker, who is responsible for allocating resources and assessing
performance of the operating segments.
5. CRITICAL ACCOUNTING JUDGEMENTS, ESTIMATES AND KEY SOURCES OF ASSUMPTION
UNCERTAINTY
The preparation of these consolidated financial statements requires management to make critical
judgements in applying the Group’s accounting policies and make critical assumptions and estimates
concerning future events. Assumptions and estimates may differ from the actual results and are
continually evaluated and adjusted based on historical experience and other factors. For the information
of critical accounting judgements, estimates and key sources of assumption uncertainty is addressed
below:
(1) Critical accounting estimates and assumptions
The Group makes estimates and assumptions based on the expectation of future events that are
believed to be reasonable under the circumstances at the end of the reporting period. The resulting
accounting estimates might be different from the related actual results. The estimates and assumptions
that have a significant risk of causing a material adjustment to the carrying amounts of assets and
liabilities within the next financial year are addressed below:
A. Impairment assessment of goodwill
The impairment assessment of goodwill relies on the Group’s subjective judgement, including
identifying cash-generating units, allocating assets and liabilities as well as goodwill to related
cash-generating units, and determining the recoverable amounts of related cash-generating units.
Please refer to Note 6(10) for the information of goodwill impairment.
B. Impairment assessment of tangible and intangible assets (excluding goodwill)
The Group assesses impairment based on its subjective judgement and determines the separate
cash flows of a specific group of assets, useful lives of assets and the future possible income and
expenses arising from the assets depending on how assets are utilized and industrial
characteristics. Any changes of economic circumstances or estimates due to the change of Group
strategy might cause material impairment on assets in the future. Please refer to Notes 6(8) and
6(10) for the information of impairment assessment impairment.
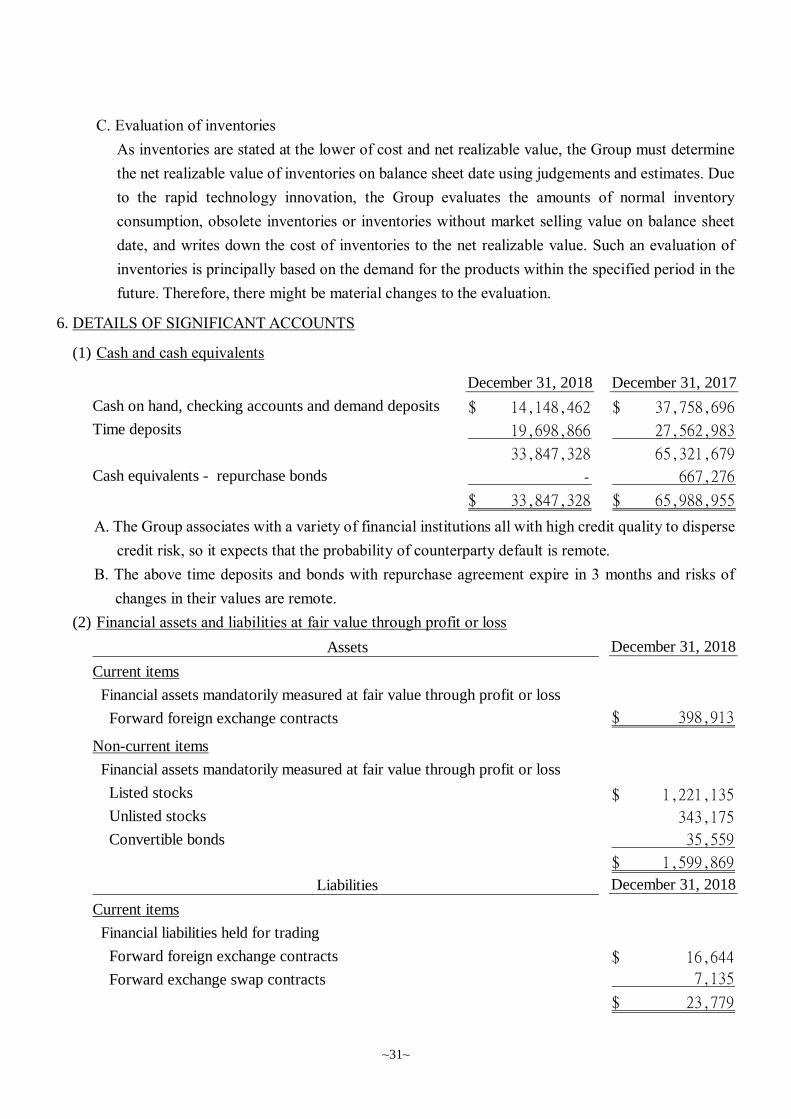
~31~
C. Evaluation of inventories
As inventories are stated at the lower of cost and net realizable value, the Group must determine
the net realizable value of inventories on balance sheet date using judgements and estimates. Due
to the rapid technology innovation, the Group evaluates the amounts of normal inventory
consumption, obsolete inventories or inventories without market selling value on balance sheet
date, and writes down the cost of inventories to the net realizable value. Such an evaluation of
inventories is principally based on the demand for the products within the specified period in the
future. Therefore, there might be material changes to the evaluation.
6. DETAILS OF SIGNIFICANT ACCOUNTS
(1) Cash and cash equivalents
A. The Group associates with a variety of financial institutions all with high credit quality to disperse
credit risk, so it expects that the probability of counterparty default is remote.
B. The above time deposits and bonds with repurchase agreement expire in 3 months and risks of
changes in their values are remote.
(2) Financial assets and liabilities at fair value through profit or loss
December 31, 2018 December 31, 2017
Cash on hand, checking accounts and demand deposits 14,148,462$ 37,758,696$
Time deposits 19,698,866 27,562,983
33,847,328 65,321,679
Cash equivalents - repurchase bonds - 667,276
33,847,328$ 65,988,955$
Assets December 31, 2018
Current items
Financial assets mandatorily measured at fair value through profit or loss
Forward foreign exchange contracts 398,913$
Non-current items
Financial assets mandatorily measured at fair value through profit or loss
Listed stocks 1,221,135$
Unlisted stocks 343,175
Convertible bonds 35,559
1,599,869$
Liabilities December 31, 2018
Current items
Financial liabilities held for trading
Forward foreign exchange contracts 16,644$
Forward exchange swap contracts 7,135
23,779$
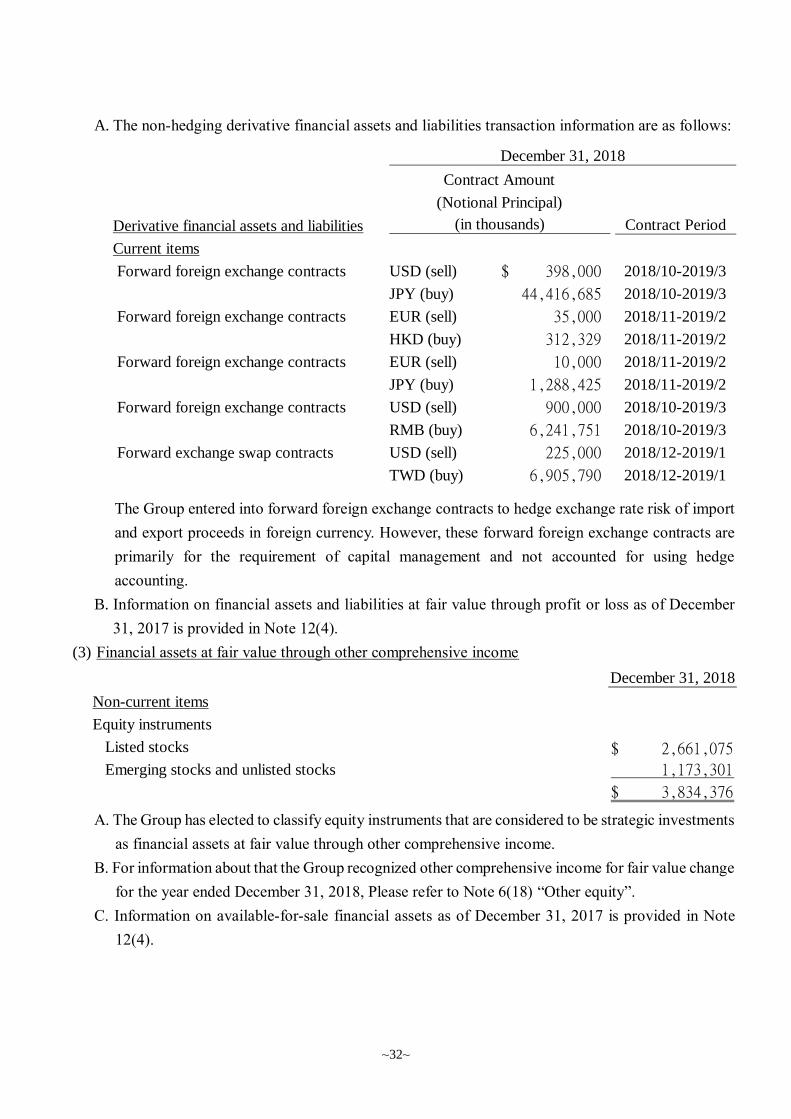
~32~
A. The non-hedging derivative financial assets and liabilities transaction information are as follows:
The Group entered into forward foreign exchange contracts to hedge exchange rate risk of import
and export proceeds in foreign currency. However, these forward foreign exchange contracts are
primarily for the requirement of capital management and not accounted for using hedge
accounting.
B. Information on financial assets and liabilities at fair value through profit or loss as of December
31, 2017 is provided in Note 12(4).
(3) Financial assets at fair value through other comprehensive income
A. The Group has elected to classify equity instruments that are considered to be strategic investments
as financial assets at fair value through other comprehensive income.
B. For information about that the Group recognized other comprehensive income for fair value change
for the year ended December 31, 2018, Please refer to Note 6(18) “Other equity”.
C. Information on available-for-sale financial assets as of December 31, 2017 is provided in Note
12(4).
Derivative financial assets and liabilities Contract Period
Current items
Forward foreign exchange contracts USD (sell) 398,000$ 2018/10-2019/3
JPY (buy) 44,416,685 2018/10-2019/3
Forward foreign exchange contracts EUR (sell) 35,000 2018/11-2019/2
HKD (buy) 312,329 2018/11-2019/2
Forward foreign exchange contracts EUR (sell) 10,000 2018/11-2019/2
JPY (buy) 1,288,425 2018/11-2019/2
Forward foreign exchange contracts USD (sell) 900,000 2018/10-2019/3
RMB (buy) 6,241,751 2018/10-2019/3
Forward exchange swap contracts USD (sell) 225,000 2018/12-2019/1
TWD (buy) 6,905,790 2018/12-2019/1
December 31, 2018
Contract Amount
(Notional Principal)
(in thousands)
December 31, 2018
Non-current items
Equity instruments
Listed stocks 2,661,075$
Emerging stocks and unlisted stocks 1,173,301
3,834,376$
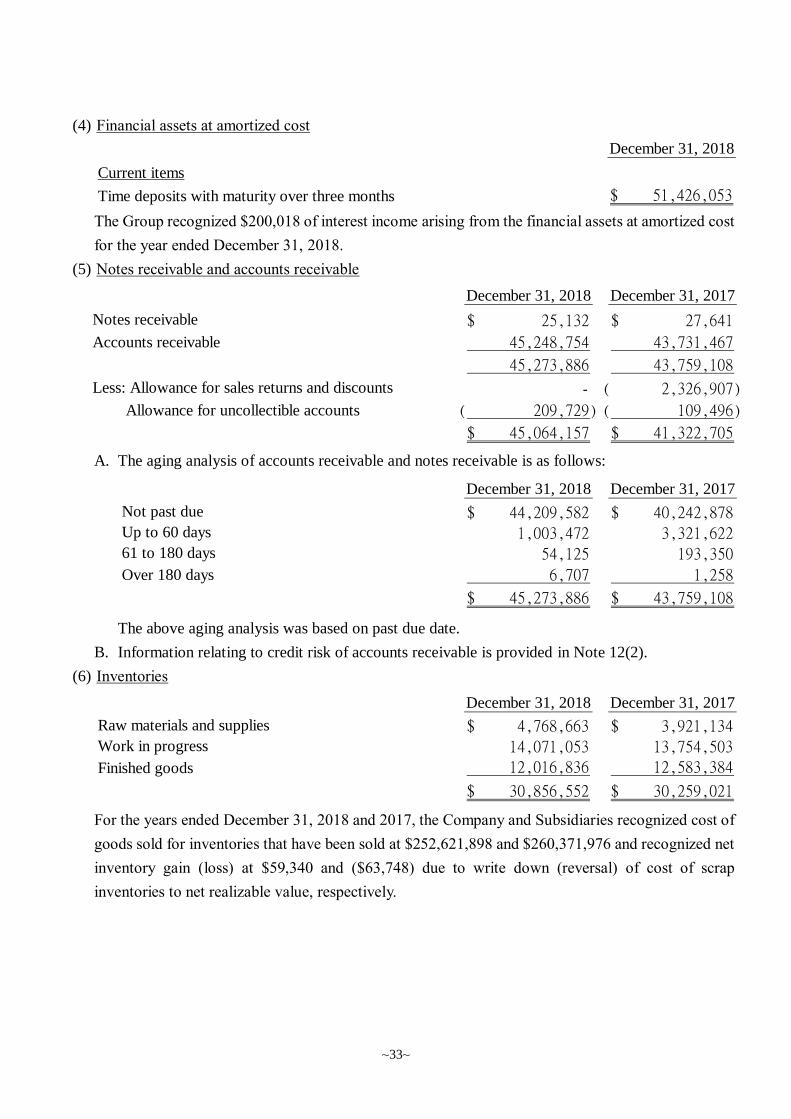
~33~
(4) Financial assets at amortized cost
The Group recognized $200,018 of interest income arising from the financial assets at amortized cost
for the year ended December 31, 2018.
(5) Notes receivable and accounts receivable
A. The aging analysis of accounts receivable and notes receivable is as follows:
The above aging analysis was based on past due date.
B. Information relating to credit risk of accounts receivable is provided in Note 12(2).
(6) Inventories
For the years ended December 31, 2018 and 2017, the Company and Subsidiaries recognized cost of
goods sold for inventories that have been sold at $252,621,898 and $260,371,976 and recognized net
inventory gain (loss) at $59,340 and ($63,748) due to write down (reversal) of cost of scrap
inventories to net realizable value, respectively.
December 31, 2018
Current items
Time deposits with maturity over three months 51,426,053$
December 31, 2018 December 31, 2017
Notes receivable 25,132$ 27,641$
Accounts receivable 45,248,754 43,731,467
45,273,886 43,759,108
Less: Allowance for sales returns and discounts - 2,326,907)(
Allowance for uncollectible accounts 209,729)( 109,496)(
45,064,157$ 41,322,705$
December 31, 2018 December 31, 2017
Not past due 44,209,582$ 40,242,878$
Up to 60 days 1,003,472 3,321,622
61 to 180 days 54,125 193,350
Over 180 days 6,707 1,258
45,273,886$ 43,759,108$
December 31, 2018 December 31, 2017
Raw materials and supplies 4,768,663$ 3,921,134$
Work in progress 14,071,053 13,754,503
Finished goods 12,016,836 12,583,384
30,856,552$ 30,259,021$

~34~
(7) Investments accounted for under the equity method
The operating results of the Group’s share in all individually immaterial associates are summarized
below:
(8) Property, plant and equipment
December 31, 2018 December 31, 2017
Ampower Holding Ltd. 956,577$ 853,016$
FI Medical Device Manufacturing Co., Ltd. 655,827 525,926
Others 190,517 112,197
1,802,921$ 1,491,139$
2018 2017
Profit for the year from continuing operations 443,869$ 274,854$
Other comprehensive income (loss) - net of tax 84,637 33,551)(
Total comprehensive income 528,506$ 241,303$
Years ended December 31,
Transfer, net
exchange
differences
At January 1 Additions Disposals and others At December 31
Cost:
Land 3,852,792$ -$ -$ -$ 3,852,792$
Buildings 196,417,863 342,354 209,999)( 2,971,063 199,521,281
Machinery and equipment 496,794,502 1,590,240 3,999,317)( 16,264,353 510,649,778
Other equipment 39,761,461 71,244 2,183,162)( 5,649,152 43,298,695
736,826,618 2,003,838 6,392,478)( 24,884,568 757,322,546
Accumulated depreciation
and impairment:
Buildings 114,356,774)( 8,762,007)( 201,616 13,218 122,903,947)(
Machinery and equipment 384,279,016)( 22,108,105)( 3,749,549 502,652)( 403,140,224)(
Other equipment 33,205,003)( 4,505,027)( 2,141,540 780,254)( 36,348,744)(
531,840,793)( 35,375,139)( 6,092,705 1,269,688)( 562,392,915)(
Unfinished construction and
equipment under acceptance 15,878,802 20,300,569 - 24,491,042)( 11,688,329
220,864,627$ 206,617,960$
2018

~35~
A. Amount of borrowing costs capitalized as part of property, plant and equipment and the range of
the interest rates for such capitalization are as follows:
B. For the year ended December 31, 2018, the Group has no amount of borrowing costs capitalized.
C. Information about the property, plant and equipment that were pledged to others as collateral is
provided in Note 8.
D. As of December 31, 2018 and 2017, the prepayments for business facilities which have not yet
entered the factory (shown as ‘other non-current assets’) amounted to $1,559,446 and $1,423,391,
respectively.
E. Information on impairment assessments is provided in Note 6 (10).
(9) Investment property
Transfer, net
exchange
differences
At January 1 Additions Disposals and others At December 31
Cost:
Land 3,852,792$ -$ -$ -$ 3,852,792$
Buildings 193,290,765 561,168 340,514)( 2,906,444 196,417,863
Machinery and equipment 438,234,703 29,244,575 7,438,732)( 36,753,956 496,794,502
Other equipment 36,511,450 473,132 1,199,395)( 3,976,274 39,761,461
671,889,710 30,278,875 8,978,641)( 43,636,674 736,826,618
Accumulated depreciation
and impairment:
Buildings 105,693,860)( 9,118,112)( 286,562 168,636 114,356,774)( Machinery and equipment 371,358,748)( 19,086,064)( 6,777,534 611,738)( 384,279,016)( Other equipment 29,890,362)( 4,162,139)( 1,151,295 303,797)( 33,205,003)(
506,942,970)( 32,366,315)( 8,215,391 746,899)( 531,840,793)(
Unfinished construction and
equipment under acceptance 36,414,118 23,779,405 105,943)( 44,208,778)( 15,878,802
201,360,858$ 220,864,627$
2017
Year ended December 31, 2017
Capitalized amount 203,902$
Range of the interest rates for capitalization 2.15%~2.41%
At January 1 Additions At December 31
Cost:
Land 188,247$ -$ 188,247$
Buildings 439,228 - 439,228
627,475 - 627,475
Accumulated depreciation:
Buildings 64,778)( 10,727)( 75,505)(
562,697$ 10,727)($ 551,970$
2018
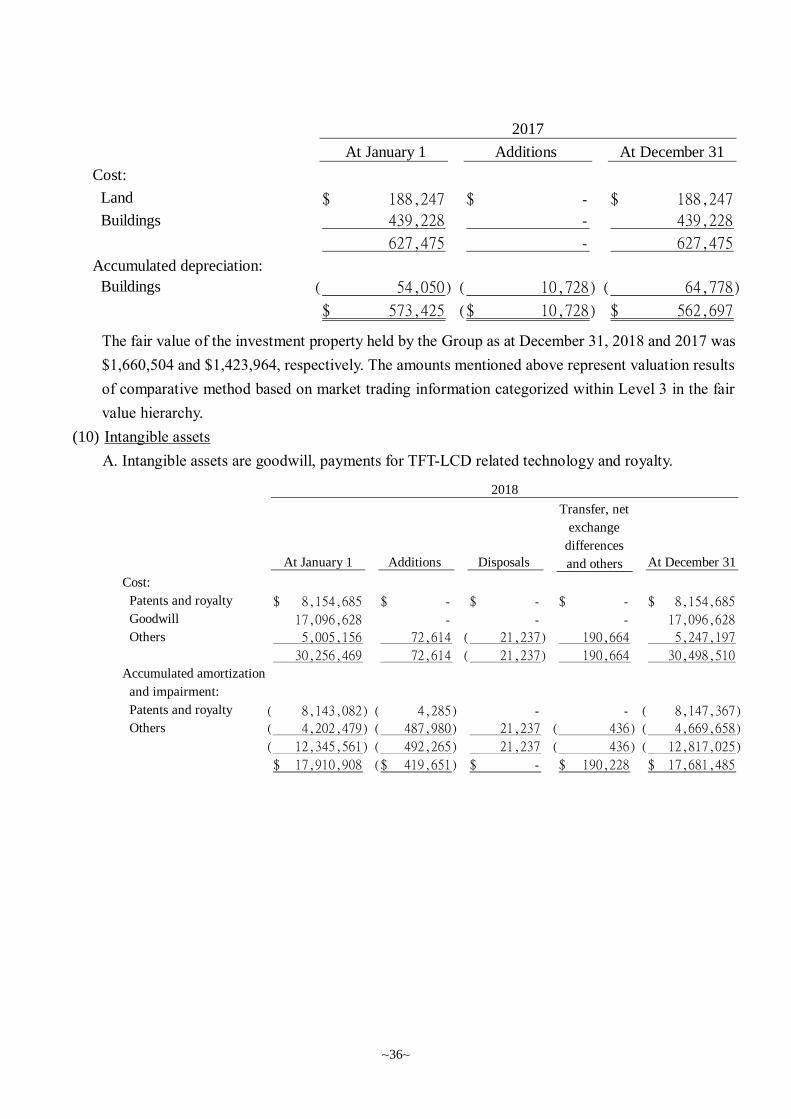
~36~
The fair value of the investment property held by the Group as at December 31, 2018 and 2017 was
$1,660,504 and $1,423,964, respectively. The amounts mentioned above represent valuation results
of comparative method based on market trading information categorized within Level 3 in the fair
value hierarchy.
(10) Intangible assets
A. Intangible assets are goodwill, payments for TFT-LCD related technology and royalty.
At January 1 Additions At December 31
Cost:
Land 188,247$ -$ 188,247$
Buildings 439,228 - 439,228
627,475 - 627,475
Accumulated depreciation:
Buildings 54,050)( 10,728)( 64,778)(
573,425$ 10,728)($ 562,697$
2017
Transfer, net
exchange
differences
At January 1 Additions Disposals and others At December 31
Cost:
Patents and royalty 8,154,685$ -$ -$ -$ 8,154,685$
Goodwill 17,096,628 - - - 17,096,628
Others 5,005,156 72,614 21,237)( 190,664 5,247,197
30,256,469 72,614 21,237)( 190,664 30,498,510
Accumulated amortization
and impairment:
Patents and royalty 8,143,082)( 4,285)( - - 8,147,367)(
Others 4,202,479)( 487,980)( 21,237 436)( 4,669,658)(
12,345,561)( 492,265)( 21,237 436)( 12,817,025)(
17,910,908$ 419,651)($ -$ 190,228$ 17,681,485$
2018

~37~
B. Details of amortization of intangible assets are as follows:
C. The Group performed impairment analysis for recoverable amount of the goodwill at each
reporting date and used the value in use as the basis for calculation of the recoverable amount.
The value in use was calculated based on the estimated present value of future cash flows for
five years, which was discounted at the discount rate of 9.08% for the year ended December 31,
2018, to reflect the specific risks of the related cash generating units. The future cash flows were
estimated based on the future revenue, gross profit, and other operating costs each year. Based
on the evaluation above, the Group did not recognize impairment loss on goodwill for the year
ended December 31, 2018.
(11) Other payables
Transfer, net
exchange
differences
At January 1 Additions Disposals and others At December 31
Cost:
Patents and royalty 8,154,685$ -$ -$ -$ 8,154,685$
Goodwill 17,096,628 - - - 17,096,628
Others 4,417,732 327,760 55,492)( 315,156 5,005,156
29,669,045 327,760 55,492)( 315,156 30,256,469
Accumulated amortization
and impairment:
Patents and royalty 7,528,072)( 615,010)( - - 8,143,082)(
Others 3,694,652)( 571,995)( 55,492 8,676 4,202,479)(
11,222,724)( 1,187,005)( 55,492 8,676 12,345,561)(
18,446,321$ 859,245)($ -$ 323,832$ 17,910,908$
2017
2018 2017
Operating costs 355,874$ 1,051,664$
Operating expenses 136,391 135,341
492,265$ 1,187,005$
Years ended December 31,
December 31, 2018 December 31, 2017
Other personnel expenses 10,642,647$ 13,116,498$
Payable on machinery and equipment 7,982,978 32,381,338
Repairs and maintenance expense payable 2,625,869 2,568,063
Utilities expense payable 1,093,497 1,070,308
Other payables 10,236,618 9,761,597
32,581,609$ 58,897,804$
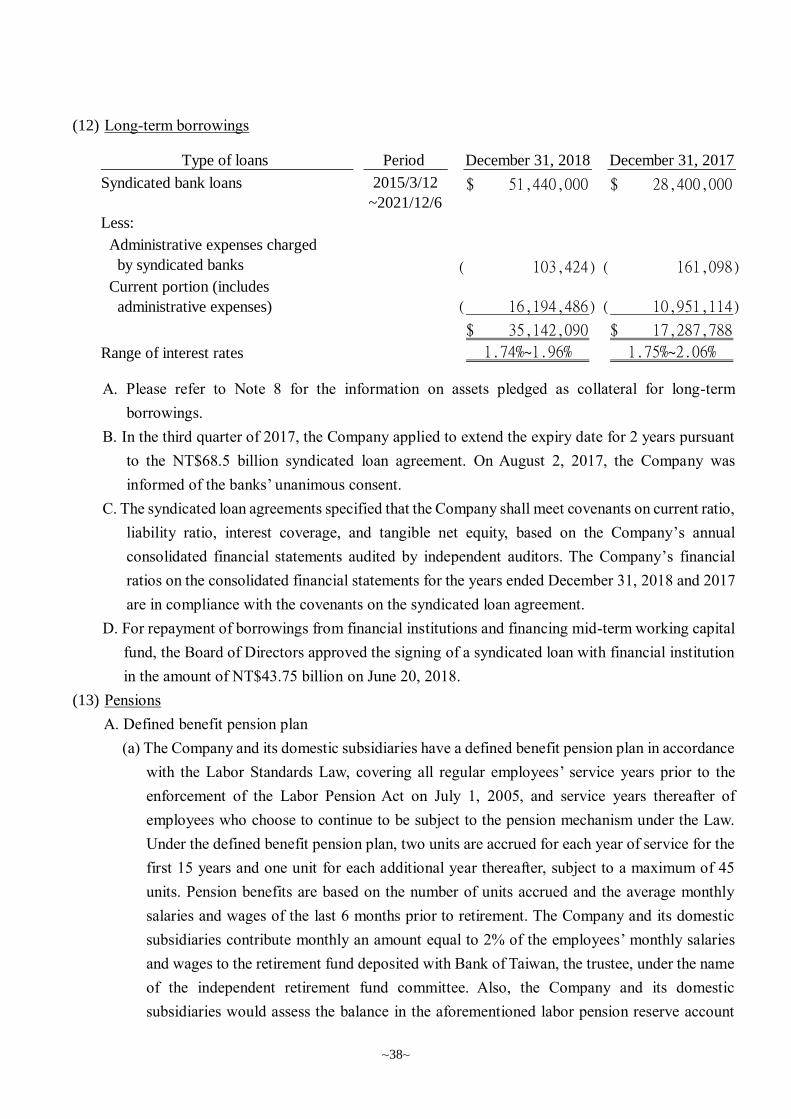
~38~
(12) Long-term borrowings
A. Please refer to Note 8 for the information on assets pledged as collateral for long-term
borrowings.
B. In the third quarter of 2017, the Company applied to extend the expiry date for 2 years pursuant
to the NT$68.5 billion syndicated loan agreement. On August 2, 2017, the Company was
informed of the banks’ unanimous consent.
C. The syndicated loan agreements specified that the Company shall meet covenants on current ratio,
liability ratio, interest coverage, and tangible net equity, based on the Company’s annual
consolidated financial statements audited by independent auditors. The Company’s financial
ratios on the consolidated financial statements for the years ended December 31, 2018 and 2017
are in compliance with the covenants on the syndicated loan agreement.
D. For repayment of borrowings from financial institutions and financing mid-term working capital
fund, the Board of Directors approved the signing of a syndicated loan with financial institution
in the amount of NT$43.75 billion on June 20, 2018.
(13) Pensions
A. Defined benefit pension plan
(a) The Company and its domestic subsidiaries have a defined benefit pension plan in accordance
with the Labor Standards Law, covering all regular employees’ service years prior to the
enforcement of the Labor Pension Act on July 1, 2005, and service years thereafter of
employees who choose to continue to be subject to the pension mechanism under the Law.
Under the defined benefit pension plan, two units are accrued for each year of service for the
first 15 years and one unit for each additional year thereafter, subject to a maximum of 45
units. Pension benefits are based on the number of units accrued and the average monthly
salaries and wages of the last 6 months prior to retirement. The Company and its domestic
subsidiaries contribute monthly an amount equal to 2% of the employees’ monthly salaries
and wages to the retirement fund deposited with Bank of Taiwan, the trustee, under the name
of the independent retirement fund committee. Also, the Company and its domestic
subsidiaries would assess the balance in the aforementioned labor pension reserve account
Type of loans Period December 31, 2018 December 31, 2017
Syndicated bank loans 2015/3/12
~2021/12/6
51,440,000$ 28,400,000$
Less:
Administrative expenses charged
by syndicated banks 103,424)( 161,098)(
Current portion (includes
administrative expenses) 16,194,486)( 10,951,114)(
35,142,090$ 17,287,788$
Range of interest rates 1.74%~1.96% 1.75%~2.06%

~39~
by December 31, every year. If the account balance is insufficient to pay the pension
calculated by the aforementioned method to the employees expected to qualify for retirement
in the following year, the Company and its domestic subsidiaries will make contributions for
the deficit by next March.
(b) The amounts recognized in the balance sheet are as follows:
(c) Movements in net defined benefit liabilities are as follows:
December 31, 2018 December 31, 2017
Present value of defined benefit obligations 2,000,113$ 1,902,852$
Fair value of plan assets 1,686,545)( 1,548,769)(
Net defined benefit liability 313,568$ 354,083$
Present value of
defined benefit Fair value Net defined
obligations of plan assets benefit liability
Year ended December
31, 2018
Balance at January 1 1,902,852$ 1,548,769$ 354,083$
Current service cost 5,749 - 5,749 Interest expense / income 28,468 23,157 5,311
34,217 23,157 11,060
Remeasurements:
Experience adjustments 69,773 39,895 29,878 Benefits paid 6,729)( 6,729)( -
63,044 33,166 29,878
Contribution for the year - 81,453 81,453)(
Balance at December 31 2,000,113$ 1,686,545$ 313,568$
Present value of
defined benefit Fair value Net defined
obligations of plan assets benefit liability
Year ended December
31, 2017
Balance at January 1 1,827,687$ 1,534,864$ 292,823$
Current service cost 6,711 - 6,711 Interest expense / income 31,071 26,093 4,978
37,782 26,093 11,689
Remeasurements:
Experience adjustments 49,488 83)( 49,571 Benefits paid 12,105)( 12,105)( -
37,383 12,188)( 49,571
Balance at December 31 1,902,852$ 1,548,769$ 354,083$

~40~
(d) The Bank of Taiwan was commissioned to manage the Fund of the Company’s and domestic
subsidiaries’ defined benefit pension plan in accordance with the Fund’s annual investment
and utilization plan and the “Regulations for Revenues, Expenditures, Safeguard and
Utilization of the Labor Retirement Fund” (Article 6: The scope of utilization for the Fund
includes deposit in domestic or foreign financial institutions, investment in domestic or
foreign listed, over-the-counter, or private placement equity securities, investment in
domestic or foreign real estate securitization products, etc.). With regard to the utilization of
the Fund, its minimum earnings in the annual distributions on the final financial statements
shall be no less than the earnings attainable from the amounts accrued from two-year time
deposits with the interest rates offered by local banks. If the earnings is less than
aforementioned rates, government shall make payment for the deficit after being authorized
by the Regulator. The Company and domestic subsidiaries have no right to participate in
managing and operating that fund and hence the Company and domestic subsidiaries are
unable to disclose the classification of plan assets fair value in accordance with IAS 19
paragraph 142. The composition of fair value of plan assets as of December 31, 2018 and
2017 is given in the Annual Labor Retirement Fund Utilization Report announced by the
government.
(e) The principal actuarial assumptions used were as follows:
Future mortality rate was estimated based on the 5th Taiwan Standard Ordinary Experience
Mortality Table.
Because the main actuarial assumption changed, the present value of defined benefit
obligation is affected. The analysis was as follows:
2018 2017
Discount rate 1.25% 1.50%
Future salary increases 1.50% 1.50%
Years ended December 31,
Increase Decrease Increase Decrease
0.25% 0.25% 0.25% 0.25%
December 31, 2018
Effect on present value of
defined benefit obligation 74,991)($ 78,684$ 78,288$ 74,991)($
Increase Decrease Increase Decrease
0.25% 0.25% 0.25% 0.25%
December 31, 2017
Effect on present value of
defined benefit obligation 74,882)($ 78,699$ 78,501$ 75,063)($
Discount rate Future salary increases
Discount rate Future salary increases
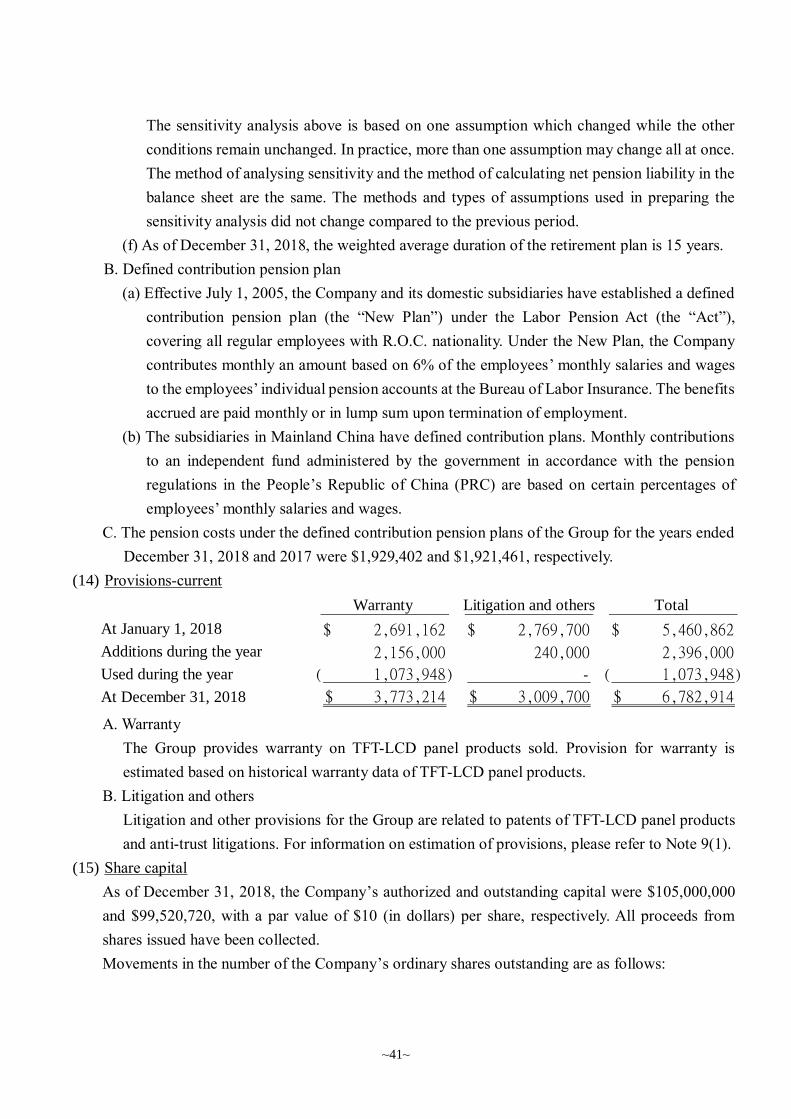
~41~
The sensitivity analysis above is based on one assumption which changed while the other
conditions remain unchanged. In practice, more than one assumption may change all at once.
The method of analysing sensitivity and the method of calculating net pension liability in the
balance sheet are the same. The methods and types of assumptions used in preparing the
sensitivity analysis did not change compared to the previous period.
(f) As of December 31, 2018, the weighted average duration of the retirement plan is 15 years.
B. Defined contribution pension plan
(a) Effective July 1, 2005, the Company and its domestic subsidiaries have established a defined
contribution pension plan (the “New Plan”) under the Labor Pension Act (the “Act”),
covering all regular employees with R.O.C. nationality. Under the New Plan, the Company
contributes monthly an amount based on 6% of the employees’ monthly salaries and wages
to the employees’ individual pension accounts at the Bureau of Labor Insurance. The benefits
accrued are paid monthly or in lump sum upon termination of employment.
(b) The subsidiaries in Mainland China have defined contribution plans. Monthly contributions
to an independent fund administered by the government in accordance with the pension
regulations in the People’s Republic of China (PRC) are based on certain percentages of
employees’ monthly salaries and wages.
C. The pension costs under the defined contribution pension plans of the Group for the years ended
December 31, 2018 and 2017 were $1,929,402 and $1,921,461, respectively.
(14) Provisions-current
A. Warranty
The Group provides warranty on TFT-LCD panel products sold. Provision for warranty is
estimated based on historical warranty data of TFT-LCD panel products.
B. Litigation and others
Litigation and other provisions for the Group are related to patents of TFT-LCD panel products
and anti-trust litigations. For information on estimation of provisions, please refer to Note 9(1).
(15) Share capital
As of December 31, 2018, the Company’s authorized and outstanding capital were $105,000,000
and $99,520,720, with a par value of $10 (in dollars) per share, respectively. All proceeds from
shares issued have been collected.
Movements in the number of the Company’s ordinary shares outstanding are as follows:
Warranty Litigation and others Total
At January 1, 2018 2,691,162$ 2,769,700$ 5,460,862$
Additions during the year 2,156,000 240,000 2,396,000
Used during the year 1,073,948)( - 1,073,948)(
At December 31, 2018 3,773,214$ 3,009,700$ 6,782,914$

~42~
A. The Board of Directors of the Company resolved to increase capital for cash by issuing the GDR
which had been completed in January 2013. The Company issued 1,125,000 thousand shares of
common stock for cash, with a unit of GDR representing 10 shares of common stock at the
Luxembourg Stock Exchange which raised a total of $14,519,051, net of issuance cost. The
Company has terminated the contracts in relation to the circulation of GDR and its account of
the depositary bank in order to lower administrative costs in accordance with the resolution by
the Board of Directors on July 26, 2017. As of December 31, 2018, the Company has no unit of
GDR outstanding.
B. The Company adopted a resolution in 2013 to issue restricted shares to employees, consisting of
36,263 thousand shares without consideration and 36,263 thousand shares with consideration
(the price for subscription is $5 (in dollars) per share). Until the vesting conditions are met by
employees, those shares are restricted with regard to transfer of voting rights, dividend and other
rights. For the years ended December 31, 2018 and 2017, the Company has retired 0 and 77
thousand shares of unvested restricted stocks to employees, respectively, and decreased capital
in accordance with related regulation.
(16) Capital surplus
Pursuant to the R.O.C. Company Act, capital surplus arising from paid-in capital in excess of par
value on issuance of common stocks and donations can be used to cover accumulated deficit or to
issue new stocks or cash to shareholders in proportion to their share ownership, provided that the
Company has no accumulated deficit. Further, the R.O.C. Securities and Exchange Act requires that
the amount of capital surplus to be capitalized mentioned above should not exceed 10% of the paid-
in capital each year. Accumulated deficit shall first be covered by retained earnings before the capital
reserve can be used to cover the accumulated deficit.
2018 2017
Number of ordinary Number of ordinary
shares (in thousands) shares (in thousands)
At January 1 9,952,072 9,952,149
Cancellation of restricted stock to employees - 77)(
At December 31 9,952,072 9,952,072
Share of profit (loss)
of associates
accounted for under
Share premium equity method Total
At January 1 99,614,690$ 32,229$ 99,646,919$
Recognition of change in equity
of associates in proportion
to the Group's ownership - 1,196 1,196
At December 31 99,614,690$ 33,425$ 99,648,115$
2018

~43~
(17) Retained earnings
A. Under the Company’s Articles of Incorporation, the current year’s earnings, if any, shall first be
offset against prior years’ operating losses, then set aside 10% of the remaining amount as legal
reserve (until the legal reserve equals the paid-in capital). Preferred dividend shall be distributed
after setting aside or reversing a special reserve according to related regulations. The
appropriation of the remaining amount along with the unappropriated earnings from previous
years shall be proposed by the Board of Directors and resolved by the shareholders. The
Company is in an emerging industry which is growing rapidly, and has a capital intensive
business. The Company is at the stage of stable growth. In line with the Company’s long-term
financial plan in the future, investment environment and business competition situation, the
appropriation of dividends shall be proposed by the Board of Directors and resolved by the
shareholders, taking into account the future capital expenditure budget and capital requirement
of the Company. However, the stock dividends distributed to shareholders shall not exceed two-
thirds of distributable dividends in current period.
B. Except for covering accumulated deficit or issuing new stocks or cash to shareholders in
proportion to their share ownership, the legal reserve shall not be used for any other purpose.
The use of legal reserve for the issuance of stocks or cash to shareholders in proportion to their
share ownership is permitted, provided that the balance of the reserve exceeds 25% of the
Company’s paid-in capital.
C. The details of the appropriation of 2017 and 2016 net income which was approved at the
stockholders’ meeting in June 2018 and 2017, respectively, are as follows:
Share of profit (loss)
of associates Restricted
accounted for under stock to
Share premium equity method employees Total
At January 1 99,614,516$ 33,888$ 594)($ 99,647,810$
Cancellation of restricted stock to
employees - - 768 768
Vested restricted stock to employees 174 - 174)( -
Recognition of change in equity
of associates in proportion
to the Group's ownership - 1,659)( - 1,659)(
At December 31 99,614,690$ 32,229$ -$ 99,646,919$
2017
Dividends per Dividends per
Amount share (in dollars) Amount share (in dollars)
Legal reserve 3,702,861$ 187,069$
(Reversal) Provision
of special reserve 2,328,083)( 3,418,804
Cash dividends 7,961,657 0.80$ 995,204 0.10$
9,336,435$ 4,601,077$
Years ended December 31,
2017 2016

~44~
D. For the information relating to employees’ compensation and directors’ remuneration, please
refer to Note 6(24).
(18) Other equity items
(19) Operating income
The Group derives revenue from the transfer of goods at a point in time.
Financial assets
at fair value
Available- through other
Currency for-sale comprehensive
translation investments income Total
At January 1 5,717,223)($ 4,626,502$ -$ 1,090,721)($
Effect of modified retrospective
approach under IFRS 9 - 4,626,502)( 4,626,502 -
Balance after retropective
adjustment 5,717,223)( - 4,626,502 1,090,721)(
Revaluation - gross - - 2,828,816)( 2,828,816)(
Currency translation differences 828,563)( - - 828,563)( Share of other comprehensive income
of associates 84,637 - - 84,637
At December 31 6,461,149)($ -$ 1,797,686$ 4,663,463)($
2018
Available-
Currency for-sale
translation investments Total
At January 1 4,040,408)($ 621,604$ 3,418,804)($
Revaluation of available-for-sale
investments - gross - 3,675,370 3,675,370
Revaluation transfer of available-for-
sale investment - gross - 646,638 646,638
Currency translation differences 1,643,264)( - 1,643,264)(
Share of other comprehensive loss
of associates 33,551)( - 33,551)(
Effect of income tax - 317,110)( 317,110)(
At December 31 5,717,223)($ 4,626,502$ 1,090,721)($
2017
2018 2017
TFT-LCD products 279,376,115$ 329,174,401$
Years ended December 31,
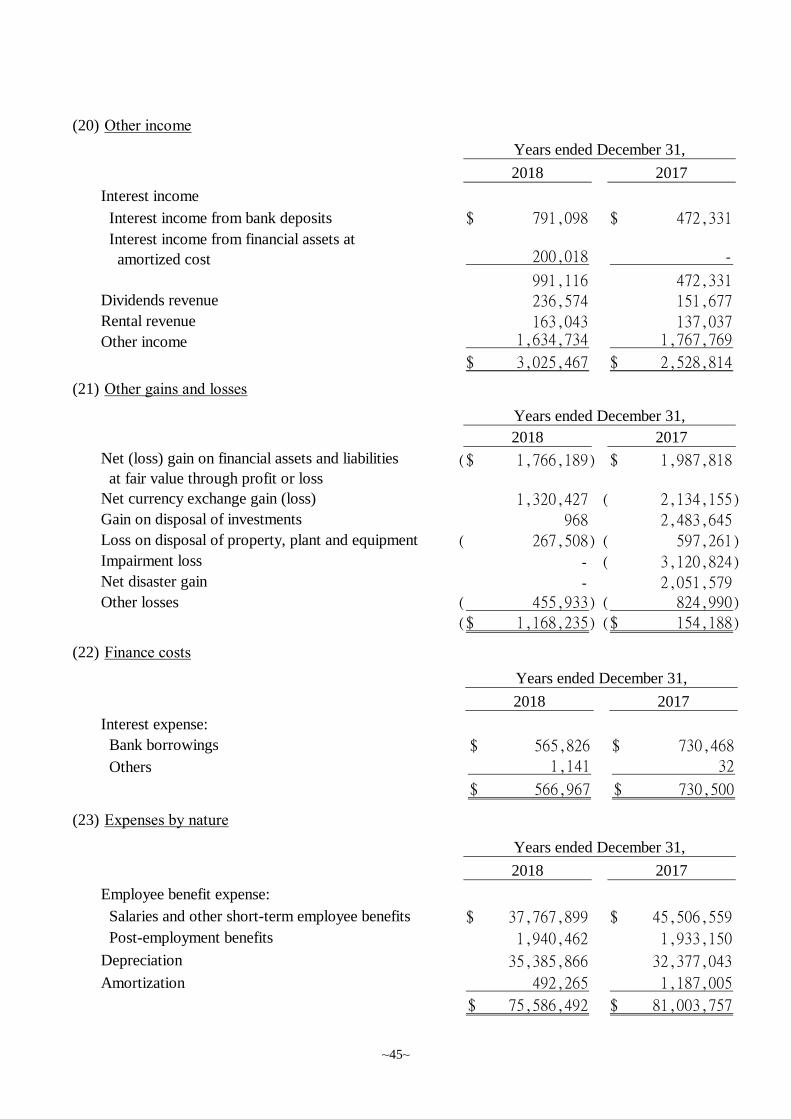
~45~
(20) Other income
(21) Other gains and losses
(22) Finance costs
(23) Expenses by nature
2018 2017
Interest income
Interest income from bank deposits 791,098$ 472,331$
Interest income from financial assets at
amortized cost 200,018 -
991,116 472,331
Dividends revenue 236,574 151,677
Rental revenue 163,043 137,037
Other income 1,634,734 1,767,769
3,025,467$ 2,528,814$
Years ended December 31,
2018 2017
Net (loss) gain on financial assets and liabilities
at fair value through profit or loss
1,766,189)($ 1,987,818$
Net currency exchange gain (loss) 1,320,427 2,134,155)(
Gain on disposal of investments 968 2,483,645
Loss on disposal of property, plant and equipment 267,508)( 597,261)(
Impairment loss - 3,120,824)(
Net disaster gain - 2,051,579
Other losses 455,933)( 824,990)(
1,168,235)($ 154,188)($
Years ended December 31,
2018 2017
Interest expense:
Bank borrowings 565,826$ 730,468$
Others 1,141 32
566,967$ 730,500$
Years ended December 31,
2018 2017
Employee benefit expense:
Salaries and other short-term employee benefits 37,767,899$ 45,506,559$
Post-employment benefits 1,940,462 1,933,150
Depreciation 35,385,866 32,377,043
Amortization 492,265 1,187,005
75,586,492$ 81,003,757$
Years ended December 31,
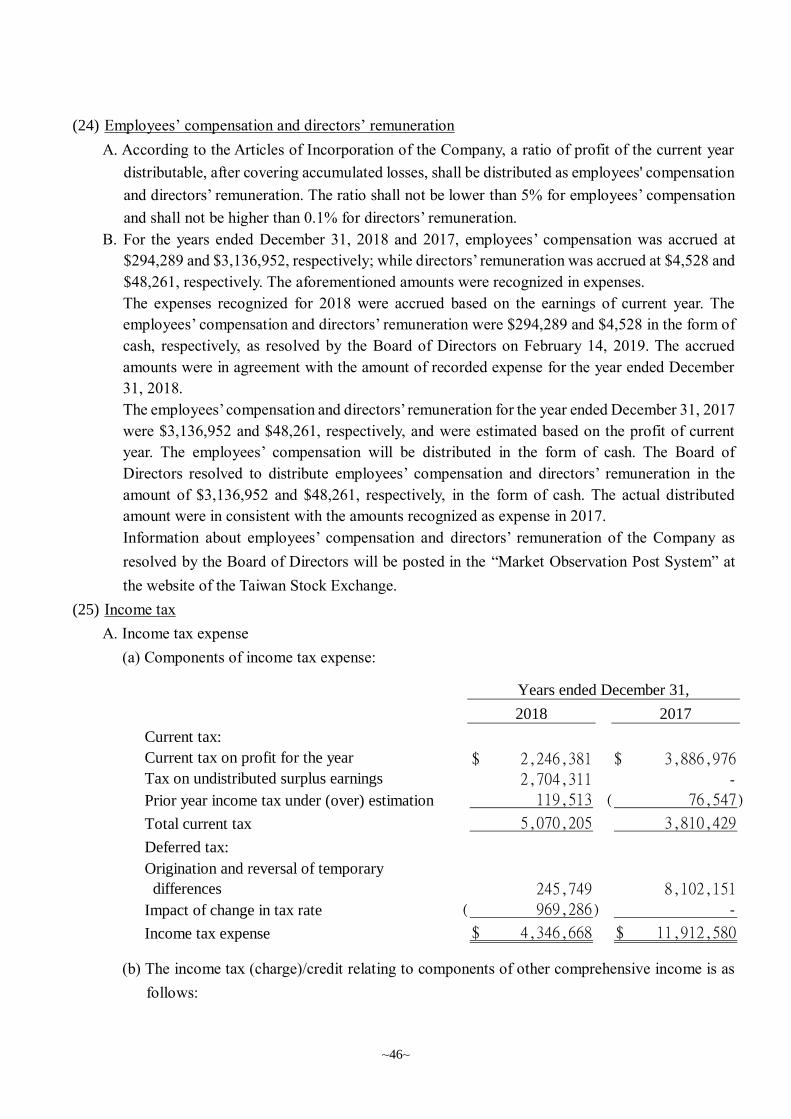
~46~
(24) Employees’ compensation and directors’ remuneration
A. According to the Articles of Incorporation of the Company, a ratio of profit of the current year
distributable, after covering accumulated losses, shall be distributed as employees' compensation
and directors’ remuneration. The ratio shall not be lower than 5% for employees’ compensation
and shall not be higher than 0.1% for directors’ remuneration.
B. For the years ended December 31, 2018 and 2017, employees’ compensation was accrued at
$294,289 and $3,136,952, respectively; while directors’ remuneration was accrued at $4,528 and
$48,261, respectively. The aforementioned amounts were recognized in expenses.
The expenses recognized for 2018 were accrued based on the earnings of current year. The
employees’ compensation and directors’ remuneration were $294,289 and $4,528 in the form of
cash, respectively, as resolved by the Board of Directors on February 14, 2019. The accrued
amounts were in agreement with the amount of recorded expense for the year ended December
31, 2018.
The employees’ compensation and directors’ remuneration for the year ended December 31, 2017
were $3,136,952 and $48,261, respectively, and were estimated based on the profit of current
year. The employees’ compensation will be distributed in the form of cash. The Board of
Directors resolved to distribute employees’ compensation and directors’ remuneration in the
amount of $3,136,952 and $48,261, respectively, in the form of cash. The actual distributed
amount were in consistent with the amounts recognized as expense in 2017.
Information about employees’ compensation and directors’ remuneration of the Company as
resolved by the Board of Directors will be posted in the “Market Observation Post System” at
the website of the Taiwan Stock Exchange.
(25) Income tax
A. Income tax expense
(a) Components of income tax expense:
(b) The income tax (charge)/credit relating to components of other comprehensive income is as
follows:
2018 2017
Current tax:
Current tax on profit for the year 2,246,381$ 3,886,976$
Tax on undistributed surplus earnings 2,704,311 -
Prior year income tax under (over) estimation 119,513 76,547)(
Total current tax 5,070,205 3,810,429
Deferred tax:
Origination and reversal of temporary
differences 245,749 8,102,151
Impact of change in tax rate 969,286)( -
Income tax expense 4,346,668$ 11,912,580$
Years ended December 31,

~47~
B. Reconciliation between income tax expense and accounting profit:
C. Amounts of deferred tax assets or liabilities as a result of temporary differences and loss
carryforward are as follows:
2018 2017
Fair value of available-for-sale financial assets -$ 317,110$
Remeasurements of defined benefit
obligatrons 5,976)( 8,427)(
5,976)($ 308,683$
Years ended December 31,
2018 2017
Tax calculated based on profit before tax and 3,029,631$ 11,532,189$
statutory tax rate
Effects from items disallowed by tax regulation 445,094)( 477,430)(
Prior year income tax overestimation 119,513 76,547)(
Effect from changes in tax regulation 969,286)( -
Additional 10% tax on undistributed earnings 2,704,311 -
Separate taxation 89,783 -
Change in assessment of realization of deferred
tax assets 182,190)( 934,368
Tax expense 4,346,668$ 11,912,580$
Years ended December 31,
Recognized
Recognized in other
in profit comprehensive
January 1 or loss income December 31
Temporary differences:
- Deferred tax assets:
Sales returns and discount provisions 429,340$ 46,385$ -$ 475,725$
Accrued royalties and warranty provisions 1,095,009 444,298 - 1,539,307
Unrealized exchange loss - 162,222 - 162,222
Unrealized loss on financial instruments 430,539 80,707 - 511,246
Prior year expense carryforward 3,480 112 - 3,592
Loss carryforward 3,752,755 74,393 - 3,827,148
Others 637,638 61,010 5,976 704,624
6,348,761$ 869,127$ 5,976$ 7,223,864$
- Deferred tax liabilities:
Unrealized exchange (gain) loss 41,713)($ 41,713$ -$ -$
Amortization charges on goodwill 641,795)( 210,163)( - 851,958)(
Others 50,915)( 22,860 - 28,055)(
734,423)($ 145,590)($ -$ 880,013)($
5,614,338$ 723,537$ 5,976$ 6,343,851$
2018

~48~
D. Expiration dates of unused loss carryforward and amounts of unrecognized deferred tax assets
are as follows:
Recognized
Recognized in other
in profit comprehensive
January 1 or loss income December 31
Temporary differences:
- Deferred tax assets:
Sales returns and discount provisions 270,483$ 158,857$ -$ 429,340$
Accrued royalties and warranty provisions 731,844 363,165 - 1,095,009 Unrealized loss (gain) on
financial instruments 470,394 277,255 317,110)( 430,539
Prior year expense carryforward 3,772 292)( - 3,480
Loss carryforward 12,619,814 8,867,059)( - 3,752,755
Others 601,836 27,375 8,427 637,638
14,698,143$ 8,040,699)($ 308,683)($ 6,348,761$
- Deferred tax liabilities:
Unrealized exchange (gain) loss 113,545)($ 71,832$ -$ 41,713)($
Amortization charges on goodwill 559,426)( 82,369)( - 641,795)(
Others - 50,915)( - 50,915)(
672,971)($ 61,452)($ -$ 734,423)($
14,025,172$ 8,102,151)($ 308,683)($ 5,614,338$
2017
Amount Unrecognized
Year filed / Unused deferred Usable
incurred assessed amount tax assets until year
2011 Assessed 23,793,756$ 17,120,565$ 2021
2012 Assessed 42,643,231 30,530,343 2022
2016 Assessed 1,051,680 756,727 2026
67,488,667$ 48,407,635$
Amount Unrecognized
Year filed / Unused deferred Usable
incurred assessed amount tax assets until year
2011 Assessed 26,496,656$ 18,260,810$ 2021
2012 Assessed 42,898,003 29,564,194 2022
2016 Filed 1,282,669 883,982 2026
70,677,328$ 48,708,986$
December 31, 2018
December 31, 2017
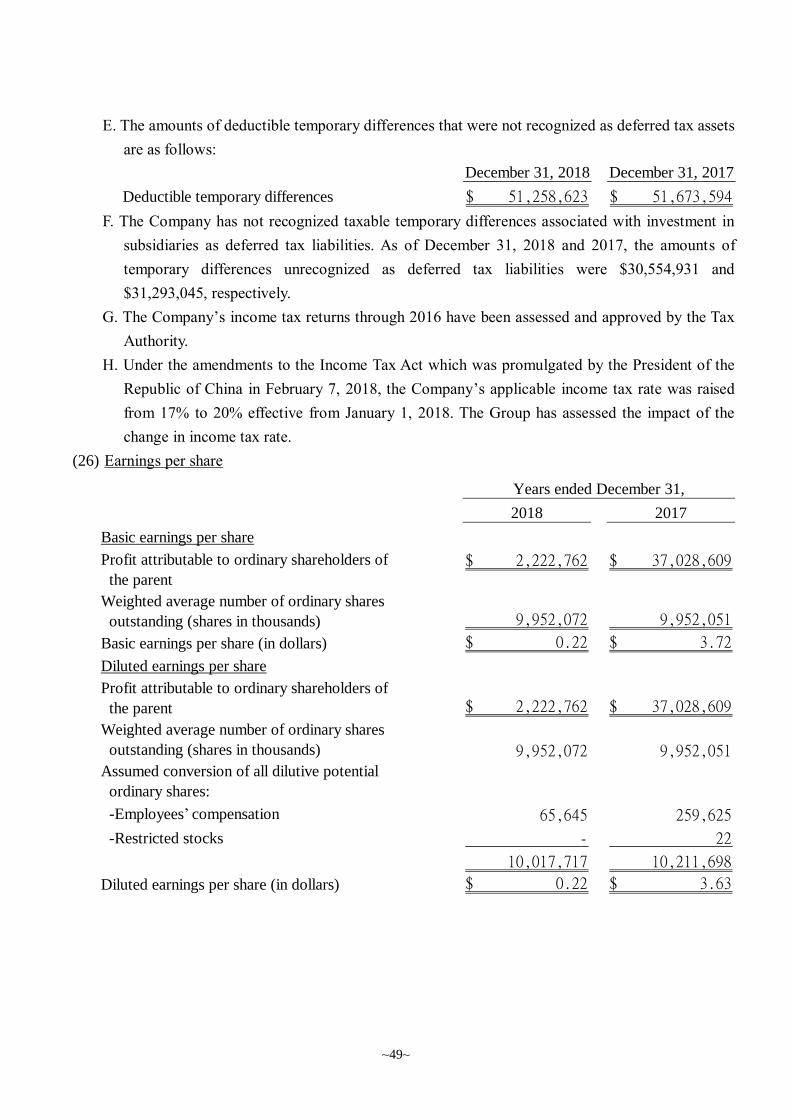
~49~
E. The amounts of deductible temporary differences that were not recognized as deferred tax assets
are as follows:
F. The Company has not recognized taxable temporary differences associated with investment in
subsidiaries as deferred tax liabilities. As of December 31, 2018 and 2017, the amounts of
temporary differences unrecognized as deferred tax liabilities were $30,554,931 and
$31,293,045, respectively.
G. The Company’s income tax returns through 2016 have been assessed and approved by the Tax
Authority.
H. Under the amendments to the Income Tax Act which was promulgated by the President of the
Republic of China in February 7, 2018, the Company’s applicable income tax rate was raised
from 17% to 20% effective from January 1, 2018. The Group has assessed the impact of the
change in income tax rate.
(26) Earnings per share
December 31, 2018 December 31, 2017
Deductible temporary differences 51,258,623$ 51,673,594$
2018 2017
Basic earnings per share
Profit attributable to ordinary shareholders of
the parent
2,222,762$ 37,028,609$
Weighted average number of ordinary shares
outstanding (shares in thousands) 9,952,072 9,952,051
Basic earnings per share (in dollars) 0.22$ 3.72$
Diluted earnings per share
Profit attributable to ordinary shareholders of
the parent 2,222,762$ 37,028,609$
Weighted average number of ordinary shares
outstanding (shares in thousands) 9,952,072 9,952,051
Assumed conversion of all dilutive potential
ordinary shares:
-Employees’ compensation 65,645 259,625
-Restricted stocks - 22
10,017,717 10,211,698
Diluted earnings per share (in dollars) 0.22$ 3.63$
Years ended December 31,

~50~
(27) Supplemental cash flow information
Investing activities with partial cash payments:
(28) Changes in liabilities from financing activities
For the year ended December 31, 2018, all changes in liabilities from financing activities are changes
in cash flow from financing activities. Please refer to consolidated statements of cash flows.
7. RELATED PARTY TRANSACTIONS
(1) Names and relationship of related parties
(2) Significant related party transactions
A. Operating revenue
The collection period was 30~120 days upon delivery or on a monthly-closing basis to related
parties, and 30~90 days to non-related parties. The sales prices and the trading terms to related
parties above were not significantly different from those of sales to third parties.
B. Purchases of goods
2018 2017
Purchase of property, plant and equipment 22,304,407$ 54,058,280$
Add: Opening balance of payable on equipment 32,381,338 3,339,764
Less: Ending balance of payable on equipment 7,982,978)( 32,381,338)(
Cash paid during the year 46,702,767$ 25,016,706$
Years ended December 31,
Names of related parties Relationship with the Group
Hon Hai Precision Industry Co., Ltd. and its subsidiaries Other related party
Chi Lin Optoelectronics Co., Ltd. and its subsidiaries Other related party
FI Medical Device Manufacturing Co., Ltd. Associate
GIO Optoelectronics Corp. Associate
Fu Lian Net International (Hong Kong) Limited Other related party
Panxian FuguiKang Precision electronic Ltd. Other related party
Chongqing Fuyusheng Electronics Technology Co.,Ltd. Other related party
2018 2017
Sales of goods:
Other related parties 18,631,752$ 48,858,191$
Associates 23,687 37,115
18,655,439$ 48,895,306$
Years ended December 31,
2018 2017
Purchases of goods:
Other related parties 5,403,092$ 12,518,080$
Associates 1,579,096 1,341,203
6,982,188$ 13,859,283$
Years ended December 31,

~51~
The payment term was 30~120 days to related parties after delivery, and 30~180 days to non-
related parties after delivery or on a monthly-closing basis. The purchase prices and the payment
terms from related parties above were not materially different from those of purchases from third
parties.
C. Receivables from related parties
(a) The receivables from related parties arise mainly from sales transactions. The receivables are
due 30~120 days after the date of sale. The receivables are unsecured in nature and bear no
interest.
(b) The abovementioned receivables from related parties that exceed normal granting periods were
transferred under ‘Other receivables – related parties’.
D. Other receivables from related parties
E. Payables to related parties
December 31, 2018 December 31, 2017
Accounts receivable:
Other related parties
- Nanjing Hongfusharp Precision
Electronics Co., Ltd.
175,236$ 7,617,857$
- Others 4,911,939 10,086,180
Associates 47,881 25,463
5,135,056 17,729,500
Less: Transferred other receivable 685,079)( 2,418)(
4,449,977$ 17,727,082$
December 31, 2018 December 31, 2017
Other receivables:
Accounts receivables transferred to other receivables
- Other related parties
- Fu Lian Net International (Hong Kong) Limited 369,837$ -$ - Panxian FuguiKang Precision electronic Ltd. 178,663 -
- Chongqing Fuyusheng Electronics Technology
Co., Ltd. 136,555 - - Others 24 2,418 Other receivables
- Other related parties 9,832 13,001 - Associates 7,820 2,547
702,731$ 17,966$
December 31, 2018 December 31, 2017
Accounts payable:
Other related parties 2,382,269$ 2,371,033$
Associates 269,858 193,977
2,652,127$ 2,565,010$
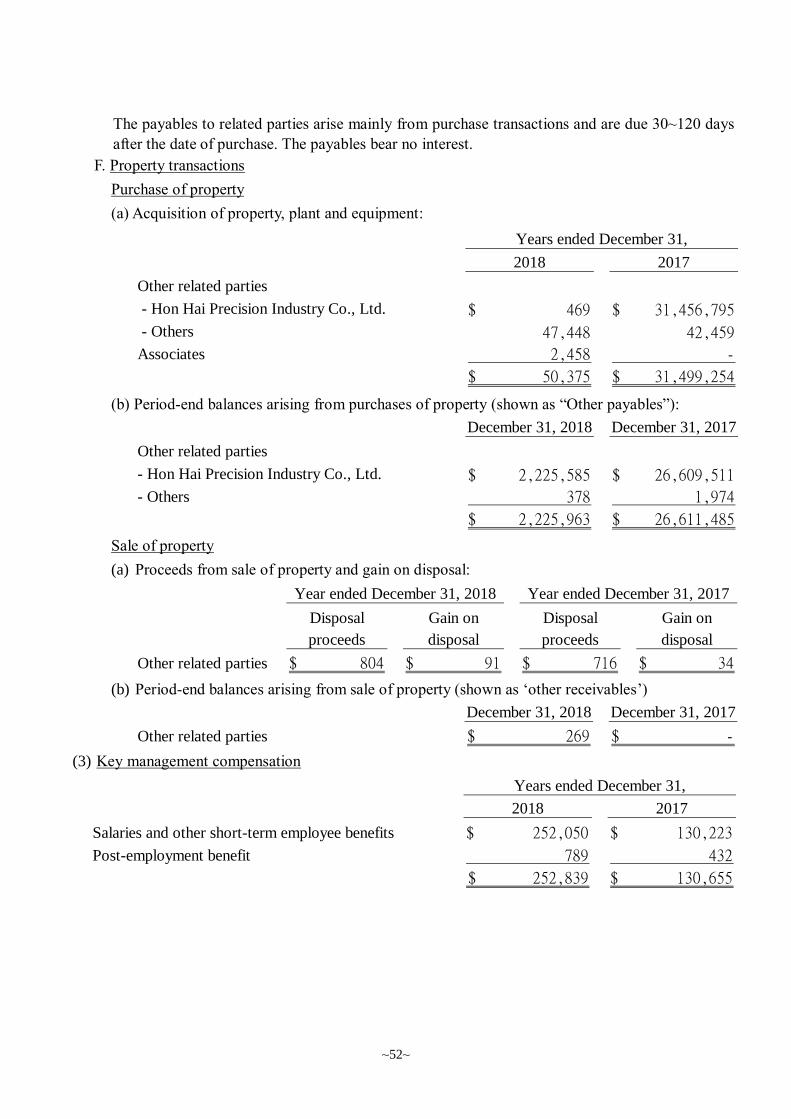
~52~
The payables to related parties arise mainly from purchase transactions and are due 30~120 days
after the date of purchase. The payables bear no interest.
F. Property transactions
Purchase of property
(a) Acquisition of property, plant and equipment:
(b) Period-end balances arising from purchases of property (shown as “Other payables”):
Sale of property
(a) Proceeds from sale of property and gain on disposal:
(b) Period-end balances arising from sale of property (shown as ‘other receivables’)
(3) Key management compensation
2018 2017
Other related parties
- Hon Hai Precision Industry Co., Ltd. 469$ 31,456,795$
- Others 47,448 42,459
Associates 2,458 -
50,375$ 31,499,254$
Years ended December 31,
December 31, 2018 December 31, 2017
Other related parties
- Hon Hai Precision Industry Co., Ltd. 2,225,585$ 26,609,511$
- Others 378 1,974
2,225,963$ 26,611,485$
Disposal Gain on Disposal Gain on
proceeds disposal proceeds disposal
Other related parties 804$ 91$ 716$ 34$
Year ended December 31, 2018 Year ended December 31, 2017
December 31, 2018 December 31, 2017
Other related parties 269$ -$
2018 2017
Salaries and other short-term employee benefits 252,050$ 130,223$
Post-employment benefit 789 432
252,839$ 130,655$
Years ended December 31,

~53~
8. PLEDGED ASSETS
The Group’s assets pledged as collateral are as follows:
9. SIGNIFICANT CONTINGENT LIABILITIES AND UNRECOGNIZED CONTRACT
COMMITMENTS
(1) Contingencies-Significant Litigations
A. Chi Mei Optoelectronics Corporation (the “CMO”), Chi Mei Optoelectronics Japan Co., Ltd., Chi
Mei Optoelectronics UK Ltd., Chi Mei Optoelectronics Europe B.V., and Chi Mei Optoelectronics
USA Inc. were investigated by the United States (the “U.S.”) Department of Justice in December
2006 for alleged violation of the anti-trust laws. In December 2009, the Company reached a plea
agreement with the Department of Justice of the U.S. and paid off the fines. Later, Brazil
government initiated an investigation case against the Company. The investigation is still ongoing
and the Company has been cooperative with the investigation. As for civil lawsuits filed by some
state governments in the U.S., downstream panel makers, and customers, the Company had
reached settlement agreement individually.
The company’s subsidiary in U.S. received a civil complaint from the government of Puerto Rico
in September 2018, claiming that the company, together with other defendants of Taiwan, Japan
and South Korea panel factories, had unjustified enrichment from the TFT-LCD pricing
collaborations in 2006 and requested monetary compensation. The U.S. subsidiary of the company
has appointed a lawyer to handle the lawsuit.
B. Eidos Displays, LLC and Eidos III, LLC (“Eidos”) filed a lawsuit against the Company and
American subsidiaries with the United States District Court for the District of East Texas on April
25, 2011, alleging infringement of its patent. The administrative law judge has ruled a summary
judgment for the lawsuit in December 2013 rendering Eidos’ patent as invalid, and the presiding
judge has confirmed the summary judgment in January 2014. Eidos has filed a complaint in
February 2014.
In February 2014, Eidos appealed to the US Court of Appeals for the Federal Circuit (CAFC). In
March 2015, the CAFC overruled the decision rendered by the district court and ordered a retrial.
In June 2017, the jury determined that some products of the Company and American subsidiaries
Pledged asset December 31, 2018 December 31, 2017 Purpose
Other current assets
-Time deposits 77,849$ 1,594$ Tariff and credit card guarantee
Property, plant and equipment 111,162,901 70,966,784 Long-term loans
Intangible assets 1,122 7,446 Long-term loans
Other non-current assets
-Time deposits
- 722
Guarantee for contract
and performance bond
-Refundable deposits 368,194 - Guarantee for litigation
111,610,066$ 70,976,546$
Book value

~54~
constituted direct infringement of patent and ordered an infringement compensation for Eidos. On
March 5, 2018, the court made first instance judgement and the Company had appealled. However,
the results of the litigation are uncertain and are dependent on the future litigation progress. The
Company does not expect that the lawsuit would have a material adverse effect on the Company’s
financial position or results of operations in the short-term.
C. On July 10, 2018, Vista Peak Ventures, LLC filed four complaints against the Company in the
United States District Court for the Eastern District of Texas, alleging the infringement of several
of its patents. Currently no court date has been set. The Company has engaged outside legal
counsels to handle this lawsuit. Since the final results of the litigation are dependent on future
litigation progress and are uncertain, the Company does not expect that the lawsuit will have a
material adverse effect on its financial position or results of operations in the short term.
D. The Company had assessed and recognized related losses and liabilities as shown in ‘provisions-
current’ for the aforementioned investigation relating to anti-trust laws and patent litigation.
(2) Commitments
A. Capital expenditure contracted for at the balance sheet date but not yet incurred is as follows:
B. Operating lease commitments
The Group leases plant, land and warehouses under non-cancellable operating lease agreements.
The majority of lease agreements are renewable at the end of the lease period at market rate.
The future aggregate minimum lease payments under non-cancellable operating leases are as
follows:
C. Outstanding letters of credit
The outstanding letters of credit for the purchase of property, plant and equipment are as follows:
10. SIGNIFICANT DISASTER LOSS
The Company’s partial inventories and buildings were damaged due to the earthquake which occurred
in Kaohsiung, Taiwan on February 6, 2016. The Company has conducted a disaster assessment and a
conservative estimation on insurance claim to assess possible disaster loss. The insurance claim had
been paid as of September 30, 2017. The Company accrued gain of $755,413 after offsetting the loss
with insurance claim.
December 31, 2018 December 31, 2017
Property, plant and equipment 22,914,278$ 18,794,836$
December 31, 2018 December 31, 2017
Not later than one year 581,550$ 579,498$
Later than one year but not later than five years 1,635,763 1,943,547
Later than five years 991,604 541,101
3,208,917$ 3,064,146$
December 31, 2018 December 31, 2017
Outstanding letters of credit 445,458$ 45,687$
~55~
11. SUBSEQUENT EVENTS AFTER THE BALANCE SHEET DATE
None.
12. OTHERS
(1) Capital management
The Company’s objectives are to maintain an optimal capital structure, and constructively reduce
the debt ratio and the cost of capital in order to maximize shareholders’ equity.
(2) Financial instruments
A. Financial instruments by category
For information of the Group’s financial assets (financial assets at fair value through profit or
loss, financial assets at fair value through other comprehensive income, available-for-sale
financial assets, financial assets at amortized cost, cash and cash equivalents, accounts receivable
(including related parties) and other receivables) and financial liability (financial liabilities at fair
value through profit or loss, accounts payable (including related parties), other payables and long-
term borrowings (including current portion)), please refer to Note 6 and consolidated balance
sheets.
B. Risk management policies
(a) The Company’s and its subsidiaries’ activities expose it to a variety of financial risks: market
risk (including foreign exchange risk, interest rate risk and price risk), credit risk and liquidity
risk. The Group’s overall risk management programme focuses on the unpredictability of
financial markets and seeks to minimize potential adverse effects on the Group’s financial
position and financial performance. The Group uses derivative financial instruments to hedge
certain risk exposures (see Notes 6(2)).
(b) Risk management is carried out by the treasury department under policies approved by the
board of directors. The Company’s and its subsidiaries’ treasury identifies, evaluates and
hedges financial risks in close cooperation with the Company’s and its subsidiaries’ operating
units. The Board provides principles for overall risk management, as well as policies covering
specific areas and matters, such as foreign exchange risk, interest rate risk, credit risk, use of
derivative financial instruments and non-derivative financial instruments, and investment by
excess liquidity.
C. Significant financial risks and degrees of financial risks
(a) Market risk
Foreign exchange risk
i. The Group operates internationally and is exposed to foreign exchange risk arising from
the transactions of the company and its subsidiaries used in various functional currency,
primarily with respect to the USD and RMB. Foreign exchange risk arises from future
commercial transactions, recognized assets and liabilities and net investments in foreign
operations.
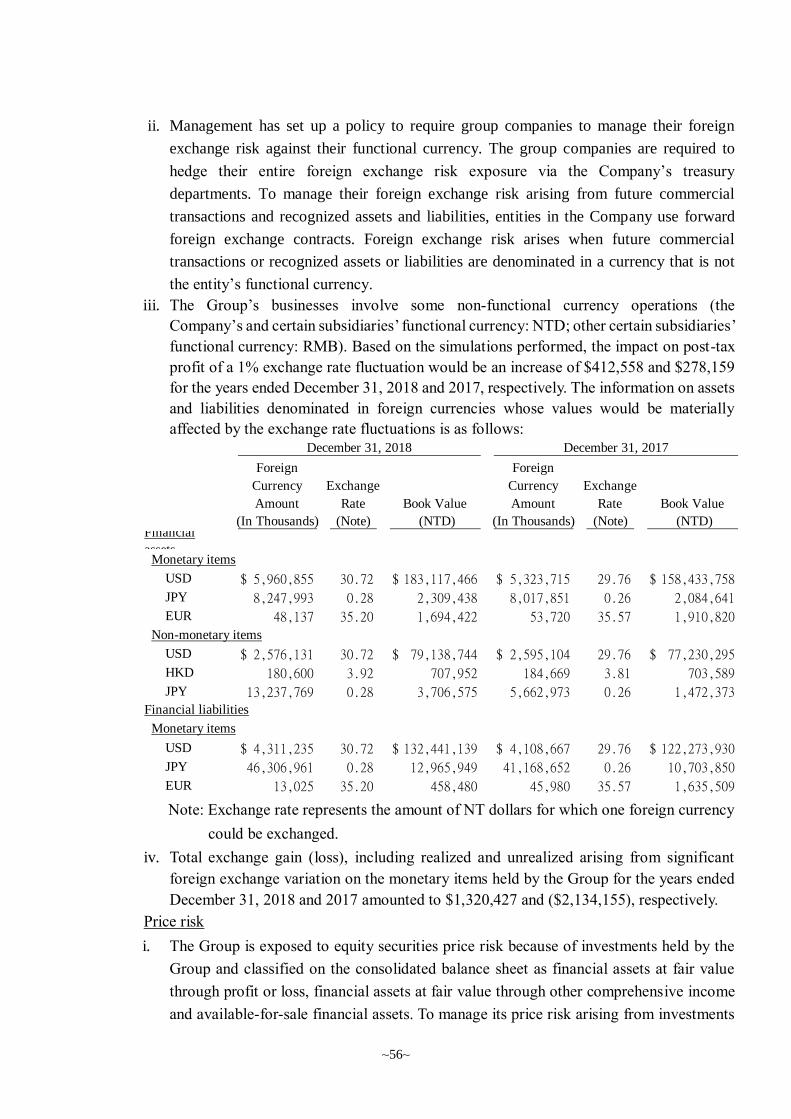
~56~
ii. Management has set up a policy to require group companies to manage their foreign
exchange risk against their functional currency. The group companies are required to
hedge their entire foreign exchange risk exposure via the Company’s treasury
departments. To manage their foreign exchange risk arising from future commercial
transactions and recognized assets and liabilities, entities in the Company use forward
foreign exchange contracts. Foreign exchange risk arises when future commercial
transactions or recognized assets or liabilities are denominated in a currency that is not
the entity’s functional currency.
iii. The Group’s businesses involve some non-functional currency operations (the
Company’s and certain subsidiaries’ functional currency: NTD; other certain subsidiaries’
functional currency: RMB). Based on the simulations performed, the impact on post-tax
profit of a 1% exchange rate fluctuation would be an increase of $412,558 and $278,159
for the years ended December 31, 2018 and 2017, respectively. The information on assets
and liabilities denominated in foreign currencies whose values would be materially
affected by the exchange rate fluctuations is as follows:
Note: Exchange rate represents the amount of NT dollars for which one foreign currency
could be exchanged.
iv. Total exchange gain (loss), including realized and unrealized arising from significant
foreign exchange variation on the monetary items held by the Group for the years ended
December 31, 2018 and 2017 amounted to $1,320,427 and ($2,134,155), respectively.
Price risk
i. The Group is exposed to equity securities price risk because of investments held by the
Group and classified on the consolidated balance sheet as financial assets at fair value
through profit or loss, financial assets at fair value through other comprehensive income
and available-for-sale financial assets. To manage its price risk arising from investments
Foreign Foreign
Currency Exchange Currency Exchange
Amount Rate Book Value Amount Rate Book Value
(In Thousands) (Note) (NTD) (In Thousands) (Note) (NTD) Financial
assets Monetary items
USD 5,960,855$ 30.72 183,117,466$ 5,323,715$ 29.76 158,433,758$
JPY 8,247,993 0.28 2,309,438 8,017,851 0.26 2,084,641
EUR 48,137 35.20 1,694,422 53,720 35.57 1,910,820
Non-monetary items
USD 2,576,131$ 30.72 79,138,744$ 2,595,104$ 29.76 77,230,295$
HKD 180,600 3.92 707,952 184,669 3.81 703,589
JPY 13,237,769 0.28 3,706,575 5,662,973 0.26 1,472,373
USD 4,311,235$ 30.72 132,441,139$ 4,108,667$ 29.76 122,273,930$
JPY 46,306,961 0.28 12,965,949 41,168,652 0.26 10,703,850
EUR 13,025 35.20 458,480 45,980 35.57 1,635,509
December 31, 2018 December 31, 2017
Financial liabilities
Monetary items

~57~
in equity securities, the Group diversifies its portfolio. Diversification of the portfolio is
done in accordance with the limits set by the Group.
ii. The Group’s investments in equity securities comprise domestic listed and unlisted
stocks. The prices of equity securities would change due to the change of the future value
of investee companies. If the prices of these equity securities had increased/decreased by
20% with all other variables held constant, post-tax profit for the years ended December
31, 2018 and 2017 would have increased/decreased by $312,862 and $51,535,
respectively; other comprehensive gains and losses would have increased/decreased by
$766,875 and $1,311,038, respectively.
Cash flow and fair value interest rate risk
i. The Group’s main interest rate risk arises from long-term borrowings with variable rates,
which expose the Group to cash flow interest rate risk. During the years ended December
31, 2018 and 2017, the Group’s borrowings at variable rate were denominated in the
NTD.
ii. The Group analyses its interest rate exposure on a dynamic basis. Various scenarios are
simulated taking into consideration refinancing, renewal of existing positions, alternative
financing and hedging. Based on these scenarios, the Group calculates the impact on
profit and loss of a defined interest rate shift. For each simulation, the same interest rate
shift is used for all currencies. The scenarios are run only for liabilities that represent the
major interest-bearing positions.
iii. If the borrowing interest rate of NTD had increased/decreased by 0.25% with all other
variables held constant, profit, net of tax for the years ended December 31, 2018 and 2017
would have decreased/increased by $128,600 and $71,000, respectively. The main factor
is that changes in interest expense result in floating-rate borrowings.
(b) Credit risk
i. Credit risk refers to the risk of financial loss to the Group arising from default by the
clients or counterparties of financial instruments on the contract obligations. The main
factor is that counterparties could not repay in full the accounts receivable based on the
agreed terms, and the contract cash flows.
ii. According to the Group’s credit policy, each local entity in the Group is responsible for
managing and analysing the credit risk for each of their new clients before standard
payment and delivery terms and conditions are offered. Internal risk control assesses the
credit quality of the customers, taking into account their financial position, past
experience and other factors. Individual risk limits are set based on internal or external
ratings in accordance with limits set by the managements. The utilization of credit limits
is regularly monitored.
iii. The Group adopts following assumption under IFRS 9 to assess whether there has been a
significant increase in credit risk on that instrument since initial recognition:
If the contract payments are past due over 30 days based on the terms, there has been a
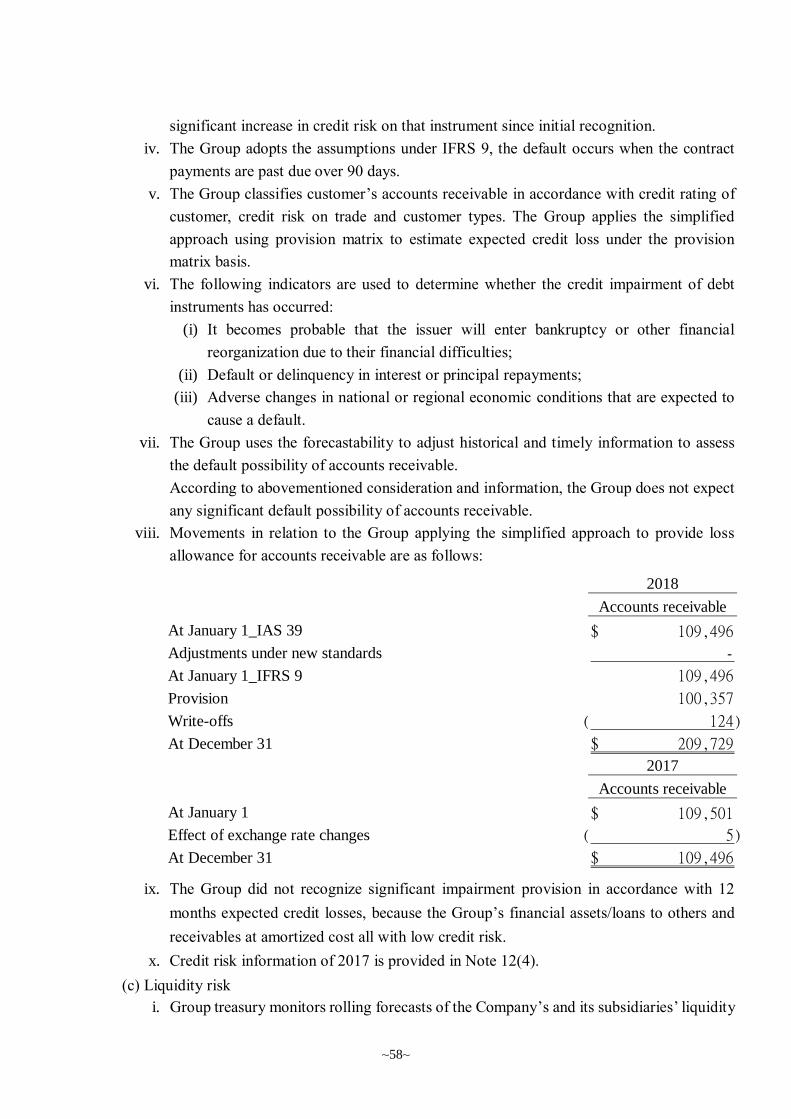
~58~
significant increase in credit risk on that instrument since initial recognition.
iv. The Group adopts the assumptions under IFRS 9, the default occurs when the contract
payments are past due over 90 days.
v. The Group classifies customer’s accounts receivable in accordance with credit rating of
customer, credit risk on trade and customer types. The Group applies the simplified
approach using provision matrix to estimate expected credit loss under the provision
matrix basis.
vi. The following indicators are used to determine whether the credit impairment of debt
instruments has occurred:
(i) It becomes probable that the issuer will enter bankruptcy or other financial
reorganization due to their financial difficulties;
(ii) Default or delinquency in interest or principal repayments;
(iii) Adverse changes in national or regional economic conditions that are expected to
cause a default.
vii. The Group uses the forecastability to adjust historical and timely information to assess
the default possibility of accounts receivable.
According to abovementioned consideration and information, the Group does not expect
any significant default possibility of accounts receivable.
viii. Movements in relation to the Group applying the simplified approach to provide loss
allowance for accounts receivable are as follows:
ix. The Group did not recognize significant impairment provision in accordance with 12
months expected credit losses, because the Group’s financial assets/loans to others and
receivables at amortized cost all with low credit risk.
x. Credit risk information of 2017 is provided in Note 12(4).
(c) Liquidity risk
i. Group treasury monitors rolling forecasts of the Company’s and its subsidiaries’ liquidity
2018
Accounts receivable
At January 1_IAS 39 109,496$
Adjustments under new standards -
At January 1_IFRS 9 109,496
Provision 100,357
Write-offs 124)(
At December 31 209,729$
2017
Accounts receivable
At January 1 109,501$
Effect of exchange rate changes 5)(
At December 31 109,496$

~59~
requirements to ensure it has sufficient cash to meet operational needs while maintaining
sufficient headroom on its undrawn committed borrowing facilities (Note 6(13)) at all
times so that the Group does not breach borrowing limits or covenants (where applicable)
on any of its borrowing facilities. Such forecasting takes into consideration the
Company’s and its subsidiaries’ debt financing plans, covenant compliance, compliance
with internal balance sheet ratio targets and external regulatory or legal requirements.
ii. Surplus cash held by the operating entities over and above balance required for working
capital management are transferred to the Group’s treasury. Group treasury invests
surplus cash in interest bearing savings accounts, time deposits, money market deposits
and marketable securities. The Group chooses instruments that are with appropriate
maturities or sufficient liquidity to provide sufficient headroom as determined by the
abovementioned forecasts. These are expected to readily generate cash inflows for
managing liquidity risk.
iii. The table below analyses the Group’s non-derivative financial liabilities and net-settled
or gross-settled derivative financial liabilities into relevant maturity groupings based on
the remaining period at the balance sheet date to the contractual maturity date for non-
derivative financial liabilities and to the expected maturity date for derivative financial
liabilities. The amounts disclosed in the table are the contractual undiscounted cash flows.
Except for the above, the non-derivative and derivative financial liabilities of the Group
are all due within one year.
(3) Fair value estimation
A. The different levels that the inputs to valuation techniques are used to measure fair value of
financial and non-financial instruments have been defined as follows:
Level 1: Quoted prices (unadjusted) in active markets for identical assets or liabilities that the
entity can access at the measurement date. A market is regarded as active where a market
in which transactions for the asset or liability take place with sufficient frequency and
volume to provide pricing information on an ongoing basis. The fair value of the
Group’s investment in listed stocks is included in Level 1.
Level 2: Inputs other than quoted prices included within Level 1 that are observable for the asset
or liability, either directly or indirectly. The fair value of the Group’s investment in
derivative instruments is included in Level 2.
Level 3: Unobservable inputs for the asset or liability. The fair value of the Group’s investment
in equity investment without active market is included in Level 3.
Less than Between 1 Between 3
December 31, 2018 1 year and 3 years and 5 years Total
Long-term borrowings
(including current portion)
16,210,000$ 35,230,000$ -$ 51,440,000$
Non-derivative financial liabilities
Less than Between 1 Between 3
December 31, 2017 1 year and 3 years and 5 years Total
Long-term borrowings
(including current portion)
10,960,000$ 16,890,000$ 550,000$ 28,400,000$

~60~
B. Fair value information of investment property at cost is provided in Note 6(9).
C. Financial instruments not measured at fair value
The carrying amounts of cash and cash equivalents, accounts receivable, other receivables,
financial assets at amortized cost, accounts payable, other payables and long-term borrowings
(including current portion) are approximate to their fair values.
D. The related information of financial and non-financial instruments measured at fair value by level
on the basis of the nature, characteristics and risks of the assets and liabilities is as follows:
(a) The related information of natures of the assets and liabilities is as follows:
December 31, 2018 Level 1 Level 2 Level 3 Total
Assets
Recurring fair value measurements
Financial assets at fair value
through profit or loss
Equity securities 1,221,135$ -$ 343,175$ 1,564,310$
Forward exchange contracts - 398,913 - 398,913
Convertible bonds - - 35,559 35,559
Financial assets at fair value
through other comprehensive
income - - - -
Equity securities 2,661,075 - 1,173,301 3,834,376
3,882,210$ 398,913$ 1,552,035$ 5,833,158$
Liabilities
Recurring fair value measurements
Financial liabilities at fair value
through profit or loss
Forward exchange contracts -$ 16,644$ -$ 16,644$
Forward exchange swap contracts - 7,135 - 7,135
-$ 23,779$ -$ 23,779$
December 31, 2017 Level 1 Level 2 Level 3 Total
Assets
Financial assets at fair value
through profit or loss
Equity securities 257,676$ -$ -$ 257,676$
Forward exchange contracts - 328,170 - 328,170
Forward exchange swap contracts - 76,890 - 76,890
Available-for-sale financial assets
Equity securities 6,241,465 - 313,724 6,555,189
6,499,141$ 405,060$ 313,724$ 7,217,925$
Recurring fair value measurements

~61~
(b) The methods and assumptions the Group used to measure fair value are as follows:
i. The instruments the Group used market quoted prices as their fair values (that is, Level
1) are listed below by characteristics:
ii. Except for financial instruments with active markets, the fair value of other financial
instruments is measured by using valuation techniques or by reference to counterparty
quotes. The fair value of financial instruments measured by using valuation techniques
can be referred to current fair value of instruments with similar terms and characteristics
in substance, discounted cash flow method or other valuation methods, including
calculated by applying model using market information available at the consolidated
balance sheet date.
iii. When assessing non-standard and low-complexity financial instruments, for example,
foreign exchange swap contracts, the Group adopts valuation technique that is widely
used by market participants. The inputs used in the valuation method to measure these
financial instruments are normally observable in the market.
iv. The valuation of derivative financial instruments is based on valuation model widely
accepted by market participants, such as present value techniques and option pricing
models. Forward exchange contracts and foreign exchange swap contracts are usually
valued based on the current forward exchange rate.
v. The output of valuation model is an estimated value and the valuation technique may not
be able to capture all relevant factors of the Group’s financial and non-financial
instruments. Therefore, the estimated value derived using valuation model is adjusted
accordingly with additional inputs, for example, model risk or liquidity risk and etc. In
accordance with the Group’s management policies and relevant control procedures
relating to the valuation models used for fair value measurement, management believes
adjustment to valuation is necessary in order to reasonably represent the fair value of
financial and non-financial instruments at the consolidated balance sheet. The inputs and
pricing information used during valuation are carefully assessed and adjusted based on
current market conditions.
vi. The Group takes into account adjustments for credit risks to measure the fair value of
financial and non-financial instruments to reflect credit risk of the counterparty and the
Group’s credit quality.
December 31, 2017 Level 1 Level 2 Level 3 Total
Liabilities
Financial liabilities at fair value
through profit or loss
Forward exchange contracts -$ 52,500$ -$ 52,500$
Recurring fair value measurements
Listed shares Emerging stocks Corporate bond
Market quoted price Closing price Last transaction price Weighted average quoted price

~62~
E. For the years ended December 31, 2018 and 2017, there was no transfer between Level 1 and
Level 2.
F. The following table presents the changes in level 3 instruments as at December 31, 2018 and
2017:
G. For the years ended December 31, 2018 and 2017, there was no transfer into or out from Level
3.
H. Investment management segment is in charge of valuation procedures for fair value
measurements being categorized within Level 3, which is to verify independent fair value of
financial instruments. Such assessment is to ensure the valuation results are reasonable by
applying independent information to make results close to current market conditions, confirming
the resource of information is independent, reliable and in line with other resources and
represented as the exercisable price, and frequently calibrating valuation model, performing
back-testing, updating inputs used to the valuation model and making any other necessary
adjustments to the fair value.
Investment management segment set up valuation policies, valuation processes, and rules for
measuring fair value of financial instruments and ensure compliance with the related
requirements in IFRS.
Equity securities Hybrid instrument Total
At January 1 313,724$ -$ 313,724$ Gains and losses
recognized in profit
or loss 114,507)( 4,755 109,752)(
Gains and losses
recognized in other
comprehensive income 217,789)( - 217,789)(
Acquired in the period 1,532,689 30,955 1,563,644
Effect on exchange rate
changes 2,359 151)( 2,208
At December 31 1,516,476$ 35,559$ 1,552,035$
2018
2017
Equity securities
At January 1 242,351$
Gains and losses recognized in profit or loss 490,901)(
Gains and losses recognized in other
comprehensive income 585,094
Acquired in the period 122,755
Effect on exchange rate changes 145,575)(
At December 31 313,724$

~63~
I. The following is the qualitative information of significant unobservable inputs and sensitivity
analysis of changes in significant unobservable inputs to valuation model used in Level 3 fair
value measurement:
J. The Group has carefully assessed the valuation models and assumptions used to measure fair
value. However, use of different valuation models or assumptions may result in different
measurement. The following is the effect of profit or loss or of other comprehensive income from
financial assets and liabilities categorized within Level 3 if the inputs used to valuation models
have changed:
Fair value at
December
31, 2018
Valuation
technique
Significant
unobservable input
Range
(weighted
average)
Relationship of
inputs to fair value
Non-derivative
equity instrument:
Unlisted shares 1,490,390$ Market
comparable
companies
Price to earnings ratio
multiple, price to sales
ratio multiple, price to
book ratio multiple
0.58~41.52
(5.06)
The higher the
multiple, the higher
the fair value
Discount for lack of
marketability
30%~70%
(33%)
The higher the
discount for lack of
marketability, the
lower the fair value Venture capital
shares
Private equity
fund investment
26,086 Net asset
value
Not applicable Not
applicable
Not applicable
Hybrid instrument:
Convertible bond 35,559 Discounted
cash flow
method and
Option
pricing model
Volatility and Discount
rate
2.5%~46.7%
(24.6%)
The higher the
volatility, the higher
the fair value; The
higher the discount
rate, the lower the
fair value
Fair value at
December
31, 2017
Valuation
technique
Significant
unobservable input
Range
(weighted
average)
Relationship of
inputs to fair value
Non-derivative
equity instrument:
Unlisted shares 286,940$ Market
comparable
companies
Price to earnings ratio
multiple, price to sales
ratio multiple, price to
book ratio multiple
1.26~61.93
(26.49)
The higher the
multiple, the higher
the fair value
Discount for lack of
marketability
30%~70%
(51%)
The higher the
discount for lack of
marketability, the
lower the fair value Venture capital
shares
Private equity
fund investment
26,784 Net asset
value
Not applicable Not
applicable
Not applicable
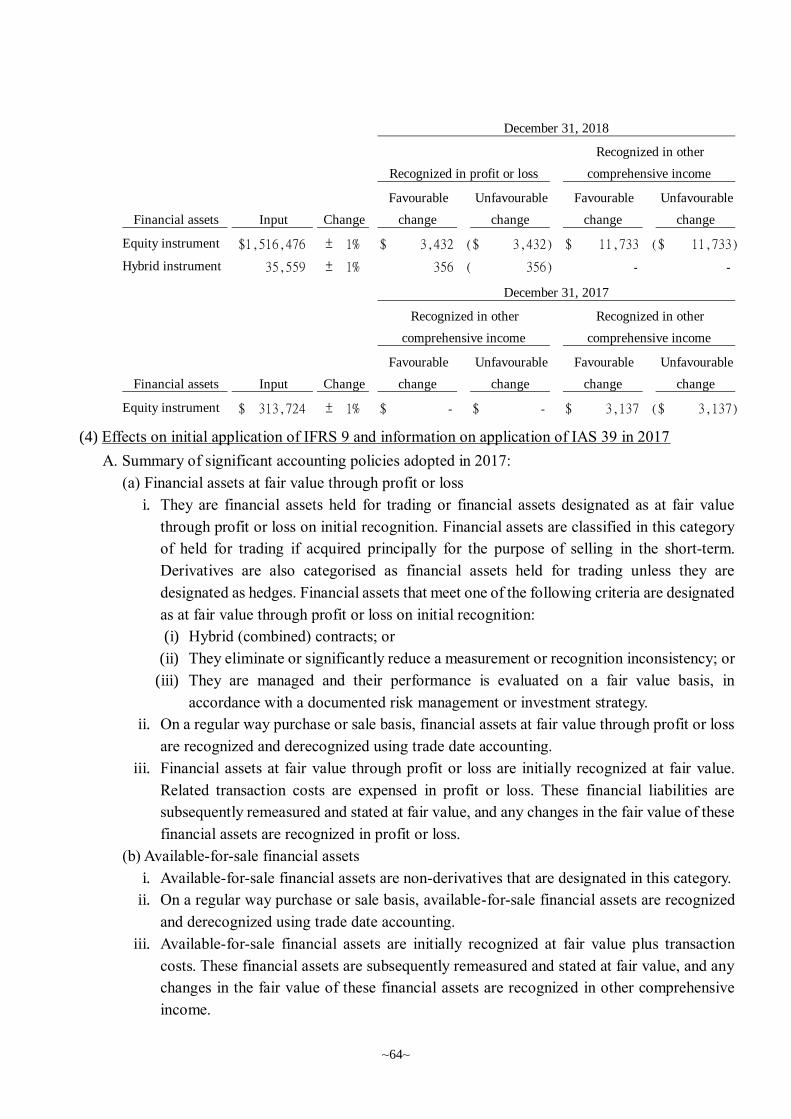
~64~
(4) Effects on initial application of IFRS 9 and information on application of IAS 39 in 2017
A. Summary of significant accounting policies adopted in 2017:
(a) Financial assets at fair value through profit or loss
i. They are financial assets held for trading or financial assets designated as at fair value
through profit or loss on initial recognition. Financial assets are classified in this category
of held for trading if acquired principally for the purpose of selling in the short-term.
Derivatives are also categorised as financial assets held for trading unless they are
designated as hedges. Financial assets that meet one of the following criteria are designated
as at fair value through profit or loss on initial recognition:
(i) Hybrid (combined) contracts; or
(ii) They eliminate or significantly reduce a measurement or recognition inconsistency; or
(iii) They are managed and their performance is evaluated on a fair value basis, in
accordance with a documented risk management or investment strategy.
ii. On a regular way purchase or sale basis, financial assets at fair value through profit or loss
are recognized and derecognized using trade date accounting.
iii. Financial assets at fair value through profit or loss are initially recognized at fair value.
Related transaction costs are expensed in profit or loss. These financial liabilities are
subsequently remeasured and stated at fair value, and any changes in the fair value of these
financial assets are recognized in profit or loss.
(b) Available-for-sale financial assets
i. Available-for-sale financial assets are non-derivatives that are designated in this category.
ii. On a regular way purchase or sale basis, available-for-sale financial assets are recognized
and derecognized using trade date accounting.
iii. Available-for-sale financial assets are initially recognized at fair value plus transaction
costs. These financial assets are subsequently remeasured and stated at fair value, and any
changes in the fair value of these financial assets are recognized in other comprehensive
income.
Favourable Unfavourable Favourable Unfavourable
Financial assets Input Change change change change change
Equity instrument $1,516,476 ± 1% $ 3,432 ($ 3,432) $ 11,733 ($ 11,733)
Hybrid instrument 35,559 ± 1% 356 ( 356) - -
Favourable Unfavourable Favourable Unfavourable
Financial assets Input Change change change change change
Equity instrument $ 313,724 ± 1% $ - $ - $ 3,137 ($ 3,137)
comprehensive income
Recognized in profit or loss
Recognized in other
comprehensive income
December 31, 2018
December 31, 2017
Recognized in other
comprehensive income
Recognized in other

~65~
(c) Loans and receivables
Accounts receivable are loans and receivables originated by the entity. They are created by
the entity by selling goods or providing services to customers in the ordinary course of
business. Accounts receivable are initially recognized at fair value and subsequently
measured at amortized cost using the effective interest method, less provision for impairment.
However, short-term accounts receivable without bearing interest are subsequently measured
at initial invoice amount as the effect of discounting is immaterial.
(d) Impairment of financial assets
i. The Group assesses at each balance sheet date whether there is objective evidence that a
financial asset or a group of financial assets is impaired as a result of one or more events
that occurred after the initial recognition of the asset (a ‘loss event’) and that loss event (or
events) has an impact on the estimated future cash flows of the financial asset or group of
financial assets that can be reliably estimated.
ii. The criteria that the Group uses to determine whether there is objective evidence of an
impairment loss is as follows:
(i) Significant financial difficulty of the issuer or debtor;
(ii) A breach of contract, such as a default or delinquency in interest or principal payments;
(iii) Information about significant changes with an adverse effect that have taken place in
the technology, market, economic or legal environment in which the issuer operates,
and indicates that the cost of the investment in the equity instrument may not be
recovered; or
(iv) A significant or prolonged decline in the fair value of an investment in an equity
instrument below its cost.
iii. When the Group assesses that there has been objective evidence of impairment and an
impairment loss has occurred, accounting for impairment is made as follows according to
the category of financial assets:
(i) Financial assets measured at amortized cost
The amount of the impairment loss is measured as the difference between the asset’s
carrying amount and the present value of estimated future cash flows discounted at the
financial asset’s original effective interest rate, and is recognized in profit or loss. If, in
a subsequent period, the amount of the impairment loss decreases and the decrease can
be related objectively to an event occurring after the impairment loss was recognized,
the previously recognized impairment loss is reversed through profit or loss to the extent
that the carrying amount of the asset does not exceed its amortized cost that would have
been at the date of reversal had the impairment loss not been recognized previously.
Impairment loss is recognized and reversed by adjusting the carrying amount of the asset
through the use of an impairment allowance account.

~66~
(ii) Available-for-sale financial assets
The amount of the impairment loss is measured as the difference between the asset’s
acquisition cost (less any principal repayment and amortization) and current fair value,
less any impairment loss on that financial asset previously recognized in profit or loss,
and is reclassified from ‘other comprehensive income’ to ‘profit or loss’. If, in a
subsequent period, the fair value of an investment in a debt instrument increases, and
the increase can be related objectively to an event occurring after the impairment loss
was recognized, such impairment loss is reversed through profit or loss. Impairment loss
of an investment in an equity instrument recognized in profit or loss shall not be reversed
through profit or loss. Impairment loss is recognized and reversed by adjusting the
carrying amount of the asset through the use of an impairment allowance account.
B. For details of the reconciliations of carrying amount of financial assets transferred from
December 31, 2017, IAS 39, to January 1, 2018, IFRS 9, please refer to Note 3(1).
C. As of December 31, 2017 and for the year ended December 31, 2017, the details of significant
accounting items are as follows:
(a) Financial assets and liabilities at fair value through profit or loss
i. For the year ended December 31, 2017, the Group recognized net profit of $1,987,818 in
the abovementioned financial instruments.
Assets December 31, 2017
Current items
Financial assets held for trading
Forward foreign exchange contracts 328,170$
Forward exchange swap contracts 76,890
405,060$
Non-current items
Financial assets held for trading
Stock-Advanced Optoelectronic
Technology Inc. 48,040$
Valuation adjustment 209,636
257,676$
Liabilities December 31, 2017
Current items
Financial liabilities held for trading
Forward foreign exchange contracts 52,500$
Forward exchange swap contracts -
52,500$

~67~
ii. The non-hedging derivative financial assets and liabilities transaction are as follows:
The Group entered into the forward foreign exchange contracts to hedge exchange rate risk
of price and foreign currency amount position of import and export. However, these forward
foreign exchange contracts are used to satisfy capital needs and are not accounted for under
hedge accounting.
(b) Available-for-sale financial assets
i. The Group recognized comprehensive income for fair value change and reclassified from
equity to profit or loss for year ended December 31, 2017. Please refer to Note 6(19).
ii. For the year ended December 31, 2017, the Company and its subsidiary assessed that
investment value of certain investee companies was impaired and recognized impairment
loss of $3,120,824 which was listed as ‘other gains and losses’.
D. Information on credit risk as of December 31, 2017 and for the year ended December 31, 2017
is as follows:
(a) Credit risk refers to the risk of financial loss to the Group arising from default by the clients
or counterparties of financial instruments on the contract obligations. According to the
Group’s credit policy, each local entity in the Group is responsible for managing and
analyzing the credit risk for each of their new clients before standard payment and delivery
terms and conditions are offered. Customer credit quality is assessed via internal risk control,
Derivative financial Contract
assets and liabilities period
Current items
Forward foreign USD (sell) 400,000$ 2017/10-2018/3
exchange contracts JPY (buy) 44,934,619 2017/10-2018/3
Forward foreign EUR (sell) 15,800 2017/10-2018/2
exchange contracts USD (buy) 18,841 2017/10-2018/2
Forward foreign EUR (sell) 34,200 2017/10-2018/3
exchange contracts JPY (buy) 4,554,765 2017/10-2018/3
Forward foreign HKD (sell) 371,732 2017/12-2018/2
exchange contracts EUR (buy) 40,000 2017/12-2018/2
Forward foreign USD (sell) 430,000 2017/7-2018/2
exchange contracts RMB (buy) 2,870,455 2017/7-2018/2
Forward foreign USD (sell) 410,000 2017/12-2018/1
swap contracts TWD (buy) 12,289,569 2017/12-2018/1
December 31, 2017
Contract amount
(Notional principal) (in thousands)
December 31, 2017
Non-current items
Listed stocks 5,969,565$
Emerging and unlisted stocks 585,624
6,555,189$
~68~
considering customer financial position, past experience and other factors. Individual risk
limits are set by the board of directors based on internal or external ratings. The utilization of
credit limits is regularly monitored. Credit risk arises from cash and cash equivalents,
derivative financial instruments and deposits with banks and financial institutions, as well as
credit exposures to wholesale and retail customers, including outstanding receivables.
Because the Company's and its subsidiaries’ counterparties and executor are banks with good
credit standing and financial institutions and government with investment grade or above,
there is no significant default. Therefore, there is no significant credit risk.
(b) For the year ended December 31, 2017, no credit limits were exceeded during the reporting
periods, and management does not expect any significant losses from non-performance by
these counterparties.
(c) On December 31, 2017, the aging analysis of accounts receivable that were past due but not
impaired is as follows:
(d) Movement analysis of accounts receivable that were impaired is as follows:
i. As of December 31, 2017, the Group accrued accounts receivable that were impaired and
recognized $109,496, respectively.
ii. Movement on allowance for bad debts for impairment loss on individual provision is as
follows:
(5) Effects of initial application of IFRS 15 and information on application of IAS 11 and IAS 18 in
2017
A. The significant accounting policies applied on revenue recognition for the year ended December
31, 2017 are set out below.
The Group manufactures and sells TFT-LCD panel products Revenue is measured at the fair
value of the consideration received or receivable taking into account of value-added tax, returns,
rebates and discounts for the sale of goods to external customers in the ordinary course of the
Group’s activities.
B. There is no effect on single account of the statement of comprehensive income, if the Group
continues applying abovementioned accounting policy in the 2018. Under IFRS 15, refund
liabilities are presented as accounts receivable-allowance for sales return and discounts in the
December 31, 2017
Up to 60 days 3,321,622$
61 to 180 days 193,350
Over 181 days 1,258
3,516,230$
2017
At January 1 109,501$
Net exchange differences 5)(
At December 31 109,496$

~69~
previous reporting period. As of December 31, 2018, the effect from changes in accounting
policy was $2,081,707.
13. SUPPLEMENTARY DISCLOSURES
(1) Significant transactions information
A. Loans to others: Please refer to Table 1.
B. Provision of endorsements and guarantees to others: None.
C. Holding of marketable securities at the end of the period (not including subsidiaries, associates
and joint ventures): Please refer to Table 2.
D. Acquisition or sale of the same security with the accumulated cost exceeding $300 million or
20% of the Company’s paid-in capital: Please refer to Table 3.
E. Acquisition of real estate reaching $300 million or 20% of paid-in capital or more: None.
F. Disposal of real estate reaching $300 million or 20% of paid-in capital or more: None.
G. Purchases or sales of goods from or to related parties reaching $100 million or 20% of paid-in
capital or more: Please refer to Table 4.
H. Receivables from related parties reaching $100 million or 20% of paid-in capital or more: Please
refer to Table 5.
I. Trading in derivative instruments undertaken during the reporting periods: Please refer to Note
6(2).
J. Significant inter-company transactions during the reporting period: Please refer to Table 6.
(2) Information on investees
Names, locations and other information of investee companies (not including investees in Mainland
China): Please refer to Table 7.
(3) Information on investments in Mainland China
A. Basic information: Please refer to Table 8.
B. Significant transactions, either directly or indirectly through a third area, with investee
companies in the Mainland Area: Please refer to Table 1, 4, 5 and 6.
14. SEGMENT INFORMATION
(1) General information
The Group is primarily engaged in research, development, manufacture, and sale of TFT LCD. The
chief operating decision-maker considered the business from a perspective of product size of TFT
LCD. TFT LCD products are currently classified into big size and small-medium size. Because the
Group met the criteria for combining the segment information of big size and small-medium size
TFT LCD departments, the Group disclosed only one reportable operating segment for all TFT LCD
products.
The Group’s operating segment information was prepared in accordance with the Group’s
accounting policies. The chief operating decision-maker allocated resources and assesses
performance of the operating segments primarily based on the operating revenue and profit (loss)
before tax and discontinued operations of individual operating segment.

~70~
(2) Segment information
The segment information provided to the chief operating decision-maker for the reportable segments
is as follows:
(3) Reconciliation for segment income
In current period, the revenue and income or loss before tax of reportable operating segment are
consistent with those of continuing operations.
(4) Information on products
Revenue from external customers is mainly from sale of TFT-LCD products, the sales amount is in
agreement with operating revenue.
(5) Geographical information
Geographical information for the years ended December 31, 2018 and 2017 is as follows:
(6) Major customer information
The individual sales to the Group’s customers that exceed 10% of the sales in the statements of
comprehensive income for the years ended December 31, 2018 and 2017 are set forth below:
2018 2017
TFT LCD TFT LCD
Segment revenue 279,376,115$ 329,174,401$
Segment income 6,569,430$ 48,941,189$
Depreciation and amortization 35,878,131$ 33,564,048$
Capital expenditure-property, plant
and equipment 46,702,767$ 25,016,706$
Segment assets 411,919,604$ 414,858,758$
Years ended December 31,
Revenue Non-current assets Revenue Non-current assets
Taiwan 75,594,192$ 196,073,680$ 115,922,366$ 211,482,604$
Hong Kong 79,813,964 - 75,037,923 108
China 48,206,617 31,236,727 68,728,719 29,891,298
Singapore 14,362,284 - 17,892,659 -
Europe 11,444,728 38,722 11,408,208 24,951
US 10,775,116 736 8,022,386 612
Others 39,179,214 6,399 32,162,140 275,743
Total 279,376,115$ 227,356,264$ 329,174,401$ 241,675,316$
Years ended December 31,
2018 2017
Sale amount Percentage of sales Sale amount Percentage of sales
Company A 28,944,033$ 10% 50,574,810$ 15%
Years ended December 31,
2018 2017
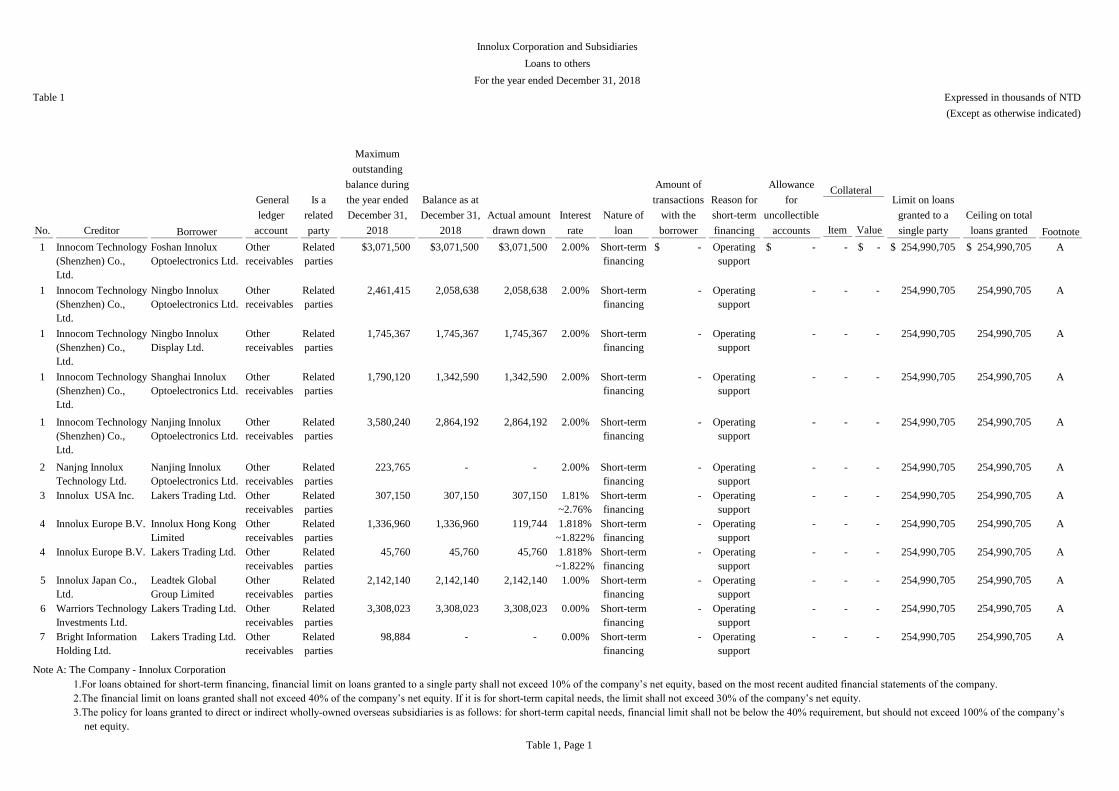
Item Value
1 Innocom Technology
(Shenzhen) Co.,
Ltd.
Foshan Innolux
Optoelectronics Ltd.
Other
receivables
Related
parties
$3,071,500 $3,071,500 $3,071,500 2.00% Short-term
financing
$ - Operating
support
$ - - $ - 254,990,705$ 254,990,705$ A
1 Innocom Technology
(Shenzhen) Co.,
Ltd.
Ningbo Innolux
Optoelectronics Ltd.
Other
receivables
Related
parties
2,461,415 2,058,638 2,058,638 2.00% Short-term
financing
- Operating
support
- - - 254,990,705 254,990,705 A
1 Innocom Technology
(Shenzhen) Co.,
Ltd.
Ningbo Innolux
Display Ltd.
Other
receivables
Related
parties
1,745,367 1,745,367 1,745,367 2.00% Short-term
financing
- Operating
support
- - - 254,990,705 254,990,705 A
1 Innocom Technology
(Shenzhen) Co.,
Ltd.
Shanghai Innolux
Optoelectronics Ltd.
Other
receivables
Related
parties
1,790,120 1,342,590 1,342,590 2.00% Short-term
financing
- Operating
support
- - - 254,990,705 254,990,705 A
1 Innocom Technology
(Shenzhen) Co.,
Ltd.
Nanjing Innolux
Optoelectronics Ltd.
Other
receivables
Related
parties
3,580,240 2,864,192 2,864,192 2.00% Short-term
financing
- Operating
support
- - - 254,990,705 254,990,705 A
2 Nanjng Innolux
Technology Ltd.
Nanjing Innolux
Optoelectronics Ltd.
Other
receivables
Related
parties
223,765 - - 2.00% Short-term
financing
- Operating
support
- - - 254,990,705 254,990,705 A
3 Innolux USA Inc. Lakers Trading Ltd. Other
receivables
Related
parties
307,150 307,150 307,150 1.81%
~2.76%
Short-term
financing
- Operating
support
- - - 254,990,705 254,990,705 A
4 Innolux Europe B.V. Innolux Hong Kong
Limited
Other
receivables
Related
parties
1,336,960 1,336,960 119,744 1.818%
~1.822%
Short-term
financing
- Operating
support
- - - 254,990,705 254,990,705 A
4 Innolux Europe B.V. Lakers Trading Ltd. Other
receivables
Related
parties
45,760 45,760 45,760 1.818%
~1.822%
Short-term
financing
- Operating
support
- - - 254,990,705 254,990,705 A
5 Innolux Japan Co.,
Ltd.
Leadtek Global
Group Limited
Other
receivables
Related
parties
2,142,140 2,142,140 2,142,140 1.00% Short-term
financing
- Operating
support
- - - 254,990,705 254,990,705 A
6 Warriors Technology
Investments Ltd.
Lakers Trading Ltd. Other
receivables
Related
parties
3,308,023 3,308,023 3,308,023 0.00% Short-term
financing
- Operating
support
- - - 254,990,705 254,990,705 A
7 Bright Information
Holding Ltd.
Lakers Trading Ltd. Other
receivables
Related
parties
98,884 - - 0.00% Short-term
financing
- Operating
support
- - - 254,990,705 254,990,705 A
Note A: The Company - Innolux Corporation
1.For loans obtained for short-term financing, financial limit on loans granted to a single party shall not exceed 10% of the company’s net equity, based on the most recent audited financial statements of the company.
2.The financial limit on loans granted shall not exceed 40% of the company’s net equity. If it is for short-term capital needs, the limit shall not exceed 30% of the company’s net equity.
3.The policy for loans granted to direct or indirect wholly-owned overseas subsidiaries is as follows: for short-term capital needs, financial limit shall not be below the 40% requirement, but should not exceed 100% of the company’s
net equity.
Maximum
outstanding
balance during
the year ended
December 31,
2018
Balance as at
December 31,
2018
Actual amount
drawn downNo. Creditor Borrower
General
ledger
account
Is a
related
party
Innolux Corporation and Subsidiaries
Loans to others
For the year ended December 31, 2018
Table 1 Expressed in thousands of NTD
(Except as otherwise indicated)
Collateral Limit on loans
granted to a
single party
Ceiling on total
loans granted Footnote
Interest
rate
Nature of
loan
Amount of
transactions
with the
borrower
Reason for
short-term
financing
Allowance
for
uncollectible
accounts
Table 1, Page 1

Securities held by Marketable securities General ledger account Number of shares Book value Ownership (%) Fair value Footnote
Common stock (Note)
Innolux Corporation AvanStrate Inc. NoneFinancial assets at fair value through
profit or loss
900,000 $ 29,034 1 $ 29,034
Innolux Corporation TPV Technology Limited NoneFinancial assets at fair value through
profit or loss
150,500,000 708,133 6 708,133
Innolux Corporation Chi Lin Optoelectronics Co., Ltd.Other related
party
Financial assets at fair value through
profit or loss
17,792,552 65,247 19 65,247
Innolux Corporation Epistar Corporation NoneFinancial assets at fair value through
profit or loss
89,072 2,280 - 2,280
Innolux CorporationCheng Mei Materials Technology
CorporationNone
Financial assets at fair value through
profit or loss
44,741,305 393,723 7 393,723
Innolux Corporation Allied Material Technology Corp. NoneFinancial assets at fair value through
profit or loss
1,209 - - -
Innolux Corporation VIZIO. Inc. NoneFinancial assets at fair value through
other comprehensive income
927,452 1,111,388 4 1,111,388
Yuan Chi Investment Co., Ltd. Trillion Science, Inc. NoneFinancial assets at fair value through
profit or loss
1,439,180 - 2 -
InnoJoy Investment Corporation Advanced Optoelectronic Technology, Inc. NoneFinancial assets at fair value through
profit or loss
6,964,222 116,999 5 116,999
InnoJoy Investment Corporation eChem solutions Corp. NoneFinancial assets at fair value through
other comprehensive income
2,750,000 61,913 5 61,913
InnoJoy Investment Corporation EPILEDS Co., Ltd. NoneFinancial assets at fair value through
other comprehensive income
7,347,144 114,615 7 114,615
InnoJoy Investment Corporation Fitipower Integrated Technology Inc. NoneFinancial assets at fair value through
other comprehensive income
10,000,000 369,000 6 369,000
Ningbo Innolux Optoelectronics Ltd. 上海辰岱投資中心(有限合夥) NoneFinancial assets at fair value through
profit or loss
- 137,932 - 137,932
Warriors Technology Investments Ltd. OED Holding Ltd. NoneFinancial assets at fair value through
profit or loss
16,000,000 3,984 6 3,984
Warriors Technology Investments Ltd. Obsidian Sensors, Inc. NoneFinancial assets at fair value through
profit or loss
414,136 80,892 13 80,892
As of December 31, 2018
Innolux Corporation and Subsidiaries
Holding of marketable securities at the end of the year (not including subsidiaries, associates and joint ventures)
December 31, 2018
Table 2 Expressed in thousands of NTD
(Except as otherwise indicated)
Relationship
with the
securities issuer
Table 2, Page 1
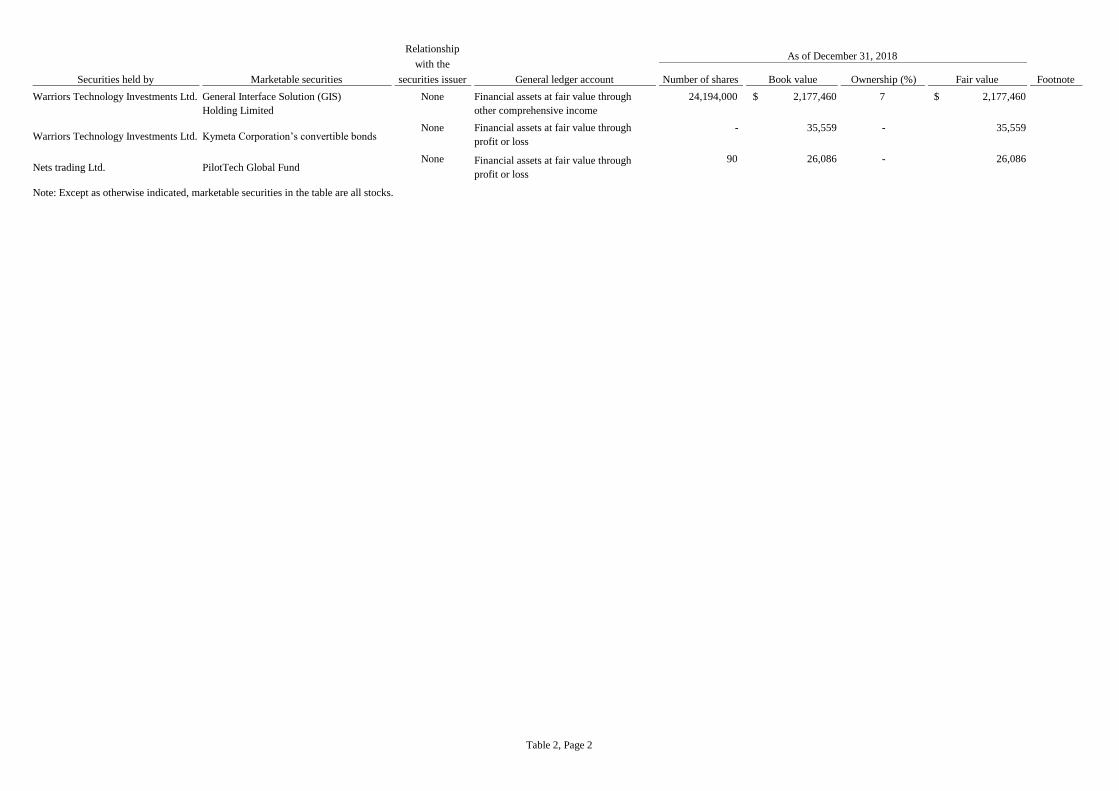
Securities held by Marketable securities General ledger account Number of shares Book value Ownership (%) Fair value Footnote
As of December 31, 2018Relationship
with the
securities issuer
Warriors Technology Investments Ltd. General Interface Solution (GIS)
Holding Limited
None Financial assets at fair value through
other comprehensive income
24,194,000 $ 2,177,460 7 $ 2,177,460
Warriors Technology Investments Ltd. Kymeta Corporation’s convertible bondsNone Financial assets at fair value through
profit or loss
- 35,559 - 35,559
Nets trading Ltd. PilotTech Global FundNone Financial assets at fair value through
profit or loss
90 26,086 - 26,086
Note: Except as otherwise indicated, marketable securities in the table are all stocks.
Table 2, Page 2

Number of
shares Amount
Number of
shares Amount
Number of
shares
Selling
price Book value
Gain (loss)
on disposal
Number of
shares Amount
Innolux
Corporation
VIZIO, Inc.
(Stocks)
Financial assets at fair
value through other
comprehensive income
Not applicable Not applicable - $ - 927,452 $ 1,341,089 - $ - $ - $ - 927,452 $ 1,111,388
Note 1: Marketable securities in the table refer to stocks, bonds, beneficiary certificates and other related derivative securities.
Note 2: Fill in the columns the counterparty and relationship if securities are accounted for under the equity method; otherwise leave the columns blank.
Note 3: Aggregate purchases and sales amounts should be calculated separately at their market values to verify whether they individually reach NT$300 million or 20% of paid-in capital or more.
Note 4: Including the amount of unrealized gain or loss on financial assets at fair value through other comprehensive income.
Innolux Corporation and Subsidiaries
Acquisition or sale of the same security with the accumulated cost exceeding $300 million or 20% of the Company's paid-in capital
For the year ended December 31, 2018
Table 3 Expressed in thousands of NTD
(Except as otherwise indicated)
Addition (Note 3) Disposal (Note 3)
Balance as at
December 31, 2018
(Note 4)
Investor
Marketable
securities
(Note 1)
General
ledger account
Counterparty
(Note 2)
Relationship with
the investor
(Note 2)
Balance as at
January 1, 2018
(Note 4)
Table 3, Page 1
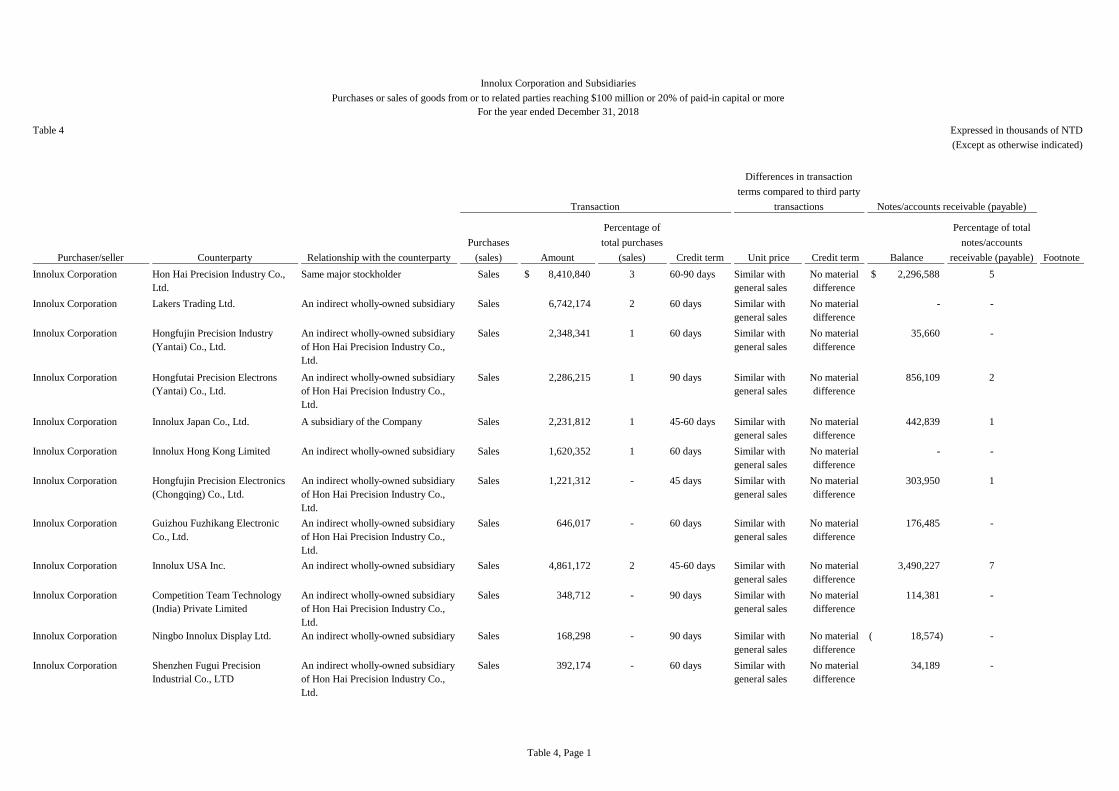
Purchases
(sales) Amount
Percentage of
total purchases
(sales) Credit term Unit price Credit term Balance
Percentage of total
notes/accounts
receivable (payable)
Innolux Corporation Hon Hai Precision Industry Co.,
Ltd.
Same major stockholder Sales 8,410,840$ 3 60-90 days Similar with
general sales
No material
difference
2,296,588$ 5
Innolux Corporation Lakers Trading Ltd. An indirect wholly-owned subsidiary Sales 6,742,174 2 60 days Similar with
general sales
No material
difference
- -
Innolux Corporation Hongfujin Precision Industry
(Yantai) Co., Ltd.
An indirect wholly-owned subsidiary
of Hon Hai Precision Industry Co.,
Ltd.
Sales 2,348,341 1 60 days Similar with
general sales
No material
difference
35,660 -
Innolux Corporation Hongfutai Precision Electrons
(Yantai) Co., Ltd.
An indirect wholly-owned subsidiary
of Hon Hai Precision Industry Co.,
Ltd.
Sales 2,286,215 1 90 days Similar with
general sales
No material
difference
856,109 2
Innolux Corporation Innolux Japan Co., Ltd. A subsidiary of the Company Sales 2,231,812 1 45-60 days Similar with
general sales
No material
difference
442,839 1
Innolux Corporation Innolux Hong Kong Limited An indirect wholly-owned subsidiary Sales 1,620,352 1 60 days Similar with
general sales
No material
difference
- -
Innolux Corporation Hongfujin Precision Electronics
(Chongqing) Co., Ltd.
An indirect wholly-owned subsidiary
of Hon Hai Precision Industry Co.,
Ltd.
Sales 1,221,312 - 45 days Similar with
general sales
No material
difference
303,950 1
Innolux Corporation Guizhou Fuzhikang Electronic
Co., Ltd.
An indirect wholly-owned subsidiary
of Hon Hai Precision Industry Co.,
Ltd.
Sales 646,017 - 60 days Similar with
general sales
No material
difference
176,485 -
Innolux Corporation Innolux USA Inc. An indirect wholly-owned subsidiary Sales 4,861,172 2 45-60 days Similar with
general sales
No material
difference
3,490,227 7
Innolux Corporation Competition Team Technology
(India) Private Limited
An indirect wholly-owned subsidiary
of Hon Hai Precision Industry Co.,
Ltd.
Sales 348,712 - 90 days Similar with
general sales
No material
difference
114,381 -
Innolux Corporation Ningbo Innolux Display Ltd. An indirect wholly-owned subsidiary Sales 168,298 - 90 days Similar with
general sales
No material
difference
18,574)( -
Innolux Corporation Shenzhen Fugui Precision
Industrial Co., LTD
An indirect wholly-owned subsidiary
of Hon Hai Precision Industry Co.,
Ltd.
Sales 392,174 - 60 days Similar with
general sales
No material
difference
34,189 -
Innolux Corporation and Subsidiaries
Purchases or sales of goods from or to related parties reaching $100 million or 20% of paid-in capital or more
For the year ended December 31, 2018
Table 4 Expressed in thousands of NTD
(Except as otherwise indicated)
FootnotePurchaser/seller Counterparty Relationship with the counterparty
Transaction
Differences in transaction
terms compared to third party
transactions Notes/accounts receivable (payable)
Table 4, Page 1
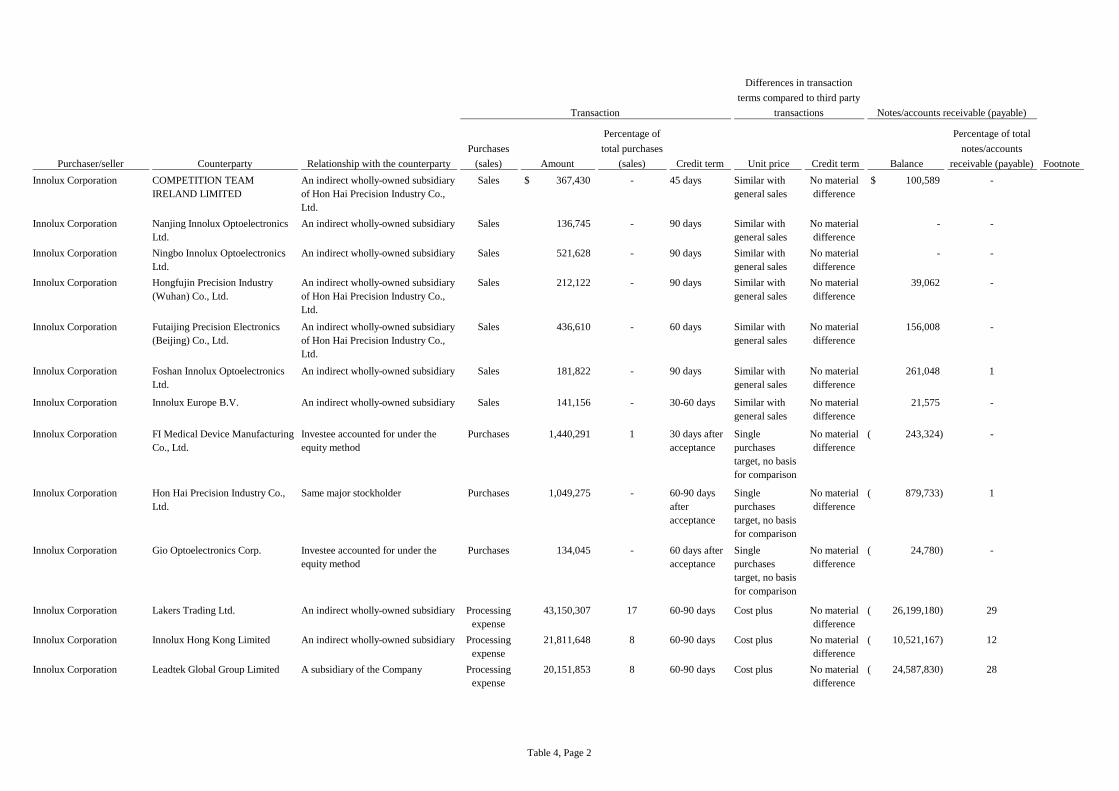
Purchases
(sales) Amount
Percentage of
total purchases
(sales) Credit term Unit price Credit term Balance
Percentage of total
notes/accounts
receivable (payable) FootnotePurchaser/seller Counterparty Relationship with the counterparty
Transaction
Differences in transaction
terms compared to third party
transactions Notes/accounts receivable (payable)
Innolux Corporation COMPETITION TEAM
IRELAND LIMITED
An indirect wholly-owned subsidiary
of Hon Hai Precision Industry Co.,
Ltd.
Sales 367,430$ - 45 days Similar with
general sales
No material
difference
100,589$ -
Innolux Corporation Nanjing Innolux Optoelectronics
Ltd.
An indirect wholly-owned subsidiary Sales 136,745 - 90 days Similar with
general sales
No material
difference
- -
Innolux Corporation Ningbo Innolux Optoelectronics
Ltd.
An indirect wholly-owned subsidiary Sales 521,628 - 90 days Similar with
general sales
No material
difference
- -
Innolux Corporation Hongfujin Precision Industry
(Wuhan) Co., Ltd.
An indirect wholly-owned subsidiary
of Hon Hai Precision Industry Co.,
Ltd.
Sales 212,122 - 90 days Similar with
general sales
No material
difference
39,062 -
Innolux Corporation Futaijing Precision Electronics
(Beijing) Co., Ltd.
An indirect wholly-owned subsidiary
of Hon Hai Precision Industry Co.,
Ltd.
Sales 436,610 - 60 days Similar with
general sales
No material
difference
156,008 -
Innolux Corporation Foshan Innolux Optoelectronics
Ltd.
An indirect wholly-owned subsidiary Sales 181,822 - 90 days Similar with
general sales
No material
difference
261,048 1
Innolux Corporation Innolux Europe B.V. An indirect wholly-owned subsidiary Sales 141,156 - 30-60 days Similar with
general sales
No material
difference
21,575 -
Innolux Corporation FI Medical Device Manufacturing
Co., Ltd.
Investee accounted for under the
equity method
Purchases 1,440,291 1 30 days after
acceptance
Single
purchases
target, no basis
for comparison
No material
difference
243,324)( -
Innolux Corporation Hon Hai Precision Industry Co.,
Ltd.
Same major stockholder Purchases 1,049,275 - 60-90 days
after
acceptance
Single
purchases
target, no basis
for comparison
No material
difference
879,733)( 1
Innolux Corporation Gio Optoelectronics Corp. Investee accounted for under the
equity method
Purchases 134,045 - 60 days after
acceptance
Single
purchases
target, no basis
for comparison
No material
difference
24,780)( -
Innolux Corporation Lakers Trading Ltd. An indirect wholly-owned subsidiary Processing
expense
43,150,307 17 60-90 days Cost plus No material
difference
26,199,180)( 29
Innolux Corporation Innolux Hong Kong Limited An indirect wholly-owned subsidiary Processing
expense
21,811,648 8 60-90 days Cost plus No material
difference
10,521,167)( 12
Innolux Corporation Leadtek Global Group Limited A subsidiary of the Company Processing
expense
20,151,853 8 60-90 days Cost plus No material
difference
24,587,830)( 28
Table 4, Page 2
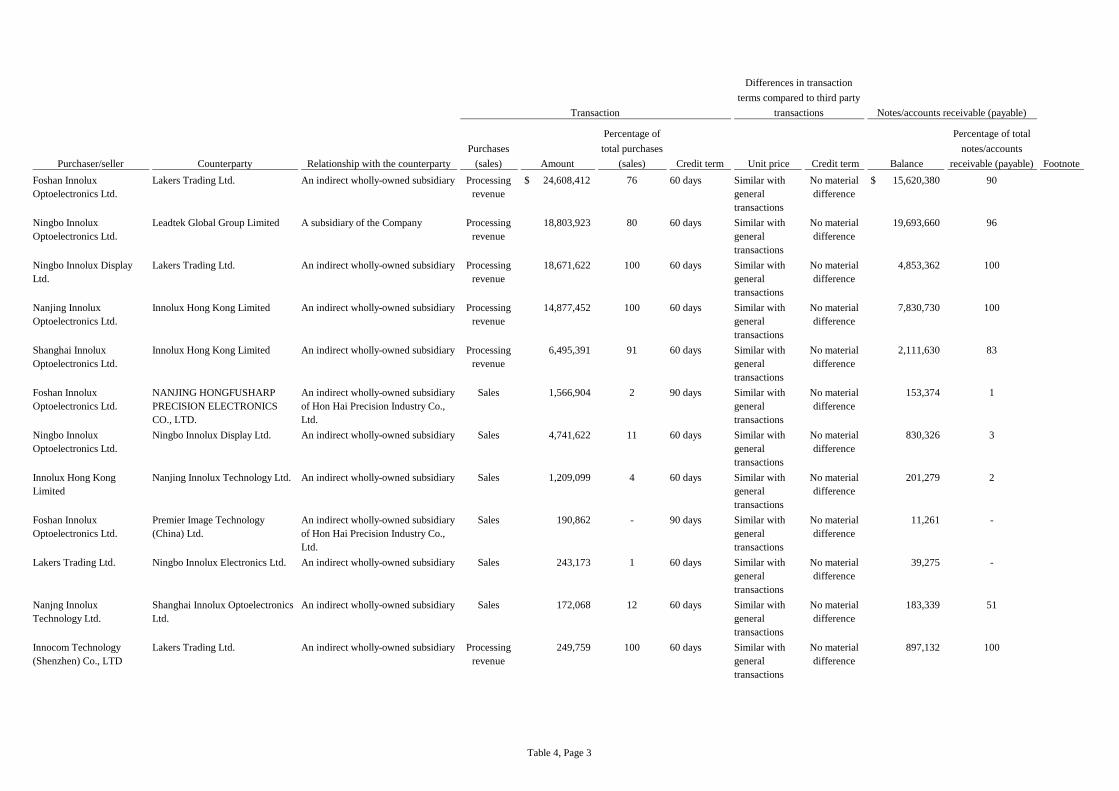
Purchases
(sales) Amount
Percentage of
total purchases
(sales) Credit term Unit price Credit term Balance
Percentage of total
notes/accounts
receivable (payable) FootnotePurchaser/seller Counterparty Relationship with the counterparty
Transaction
Differences in transaction
terms compared to third party
transactions Notes/accounts receivable (payable)
Foshan Innolux
Optoelectronics Ltd.
Lakers Trading Ltd. An indirect wholly-owned subsidiary Processing
revenue
24,608,412$ 76 60 days Similar with
general
transactions
No material
difference
15,620,380$ 90
Ningbo Innolux
Optoelectronics Ltd.
Leadtek Global Group Limited A subsidiary of the Company Processing
revenue
18,803,923 80 60 days Similar with
general
transactions
No material
difference
19,693,660 96
Ningbo Innolux Display
Ltd.
Lakers Trading Ltd. An indirect wholly-owned subsidiary Processing
revenue
18,671,622 100 60 days Similar with
general
transactions
No material
difference
4,853,362 100
Nanjing Innolux
Optoelectronics Ltd.
Innolux Hong Kong Limited An indirect wholly-owned subsidiary Processing
revenue
14,877,452 100 60 days Similar with
general
transactions
No material
difference
7,830,730 100
Shanghai Innolux
Optoelectronics Ltd.
Innolux Hong Kong Limited An indirect wholly-owned subsidiary Processing
revenue
6,495,391 91 60 days Similar with
general
transactions
No material
difference
2,111,630 83
Foshan Innolux
Optoelectronics Ltd.
NANJING HONGFUSHARP
PRECISION ELECTRONICS
CO., LTD.
An indirect wholly-owned subsidiary
of Hon Hai Precision Industry Co.,
Ltd.
Sales 1,566,904 2 90 days Similar with
general
transactions
No material
difference
153,374 1
Ningbo Innolux
Optoelectronics Ltd.
Ningbo Innolux Display Ltd. An indirect wholly-owned subsidiary Sales 4,741,622 11 60 days Similar with
general
transactions
No material
difference
830,326 3
Innolux Hong Kong
Limited
Nanjing Innolux Technology Ltd. An indirect wholly-owned subsidiary Sales 1,209,099 4 60 days Similar with
general
transactions
No material
difference
201,279 2
Foshan Innolux
Optoelectronics Ltd.
Premier Image Technology
(China) Ltd.
An indirect wholly-owned subsidiary
of Hon Hai Precision Industry Co.,
Ltd.
Sales 190,862 - 90 days Similar with
general
transactions
No material
difference
11,261 -
Lakers Trading Ltd. Ningbo Innolux Electronics Ltd. An indirect wholly-owned subsidiary Sales 243,173 1 60 days Similar with
general
transactions
No material
difference
39,275 -
Nanjng Innolux
Technology Ltd.
Shanghai Innolux Optoelectronics
Ltd.
An indirect wholly-owned subsidiary Sales 172,068 12 60 days Similar with
general
transactions
No material
difference
183,339 51
Innocom Technology
(Shenzhen) Co., LTD
Lakers Trading Ltd. An indirect wholly-owned subsidiary Processing
revenue
249,759 100 60 days Similar with
general
transactions
No material
difference
897,132 100
Table 4, Page 3

Purchases
(sales) Amount
Percentage of
total purchases
(sales) Credit term Unit price Credit term Balance
Percentage of total
notes/accounts
receivable (payable) FootnotePurchaser/seller Counterparty Relationship with the counterparty
Transaction
Differences in transaction
terms compared to third party
transactions Notes/accounts receivable (payable)
Innolux Europe B.V. Innolux Corporation An indirect wholly-owned subsidiary Service
revenue
899,754$ 86 60 days Similar with
general
transactions
No material
difference
232,063$ 94
Innolux Japan Co.,Ltd. Innolux Hong Kong Limited An indirect wholly-owned subsidiary Service
revenue
159,406 6 60 days Similar with
general
transactions
No material
difference
- -
Innolux Japan Co., Ltd. Innolux Corporation A subsidiary of the Company Service
revenue
115,099 4 60 days Similar with
general
transactions
No material
difference
68,077 12
Innolux USA Inc. Innolux Corporation An indirect wholly-owned subsidiary Service
revenue
104,731 2 60 days Similar with
general
transactions
No material
difference
28,507 1
Ningbo Innolux Display
Ltd.
Hon Hai Precision Industry Co.,
Ltd.
Same major stockholder Purchases 1,723,501 7 90 days after
goods are
shipped
Similar with
general
transactions
No material
difference
571,058)( 9
Ningbo Innolux
Optoelectronics Ltd.
Hon Hai Precision Industry Co.,
Ltd.
Same major stockholder Purchases 825,348 2 90 days after
goods are
shipped
Similar with
general
transactions
No material
difference
274,881)( 2
Ningbo Innolux
Optoelectronics Ltd.
Hongfujin Precision Industry
(Shenzhen) Co., Ltd.
An indirect wholly-owned subsidiary
of Hon Hai Precision Industry Co.,
Ltd.
Purchases 559,327 1 90 days after
goods are
shipped
Similar with
general
transactions
No material
difference
185,942)( 2
Foshan Innolux
Optoelectronics Ltd.
Hon Hai Precision Industry Co.,
Ltd.
Same major stockholder Purchases 825,188 1 90 days after
goods are
shipped
Similar with
general
transactions
No material
difference
392,531)( 2
Nanjing Innolux
Optoelectronics Ltd.
Hon Hai Precision Industry Co.,
Ltd.
Same major stockholder Purchases 144,326 1 90 days after
goods are
shipped
Similar with
general
transactions
No material
difference
16,865)( -
Foshan Innolux
Optoelectronics Ltd.
Premier Image Technology
(China) Ltd.
An indirect wholly-owned subsidiary
of Hon Hai Precision Industry Co.,
Ltd.
Purchases 152,347 - 60 days after
goods are
shipped
Similar with
general
transactions
No material
difference
22,786)( -
Table 4, Page 4
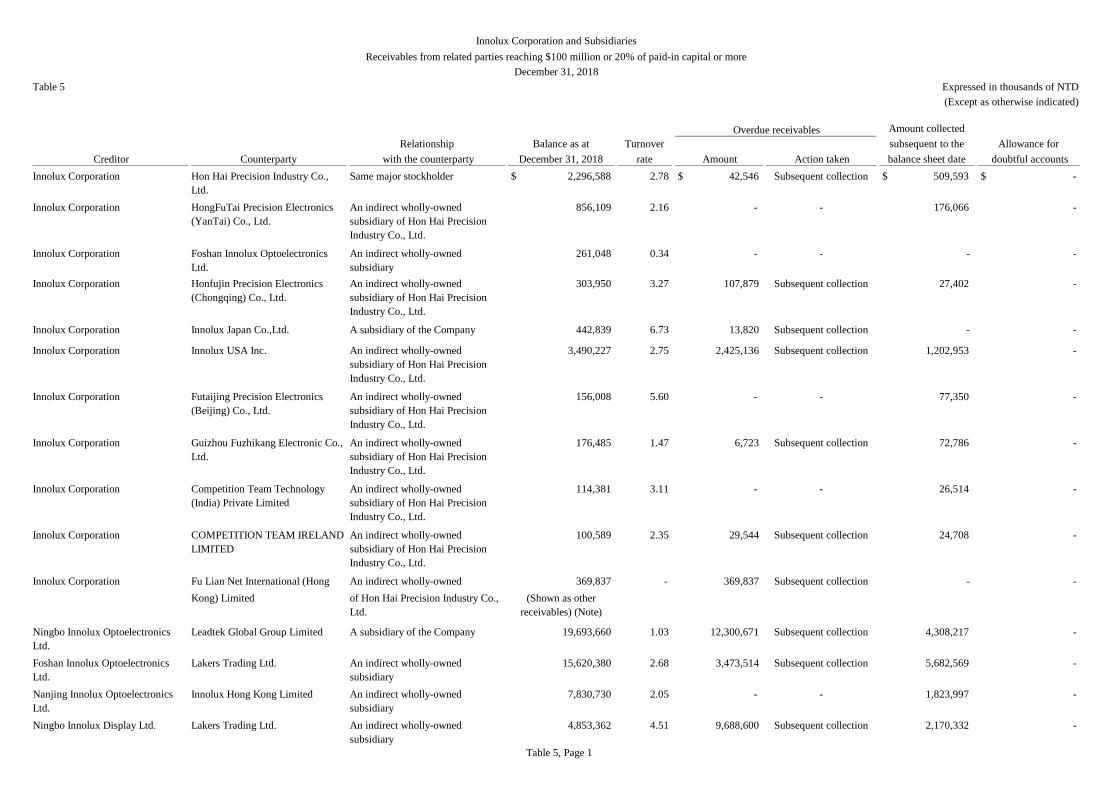
Table 5
Amount Action taken
Innolux Corporation Hon Hai Precision Industry Co.,
Ltd.
Same major stockholder $ 2,296,588 2.78 $ 42,546 Subsequent collection $ 509,593 $ -
Innolux Corporation HongFuTai Precision Electronics
(YanTai) Co., Ltd.
An indirect wholly-owned
subsidiary of Hon Hai Precision
Industry Co., Ltd.
856,109 2.16 - - 176,066 -
Innolux Corporation Foshan Innolux Optoelectronics
Ltd.
An indirect wholly-owned
subsidiary
261,048 0.34 - - - -
Innolux Corporation Honfujin Precision Electronics
(Chongqing) Co., Ltd.
An indirect wholly-owned
subsidiary of Hon Hai Precision
Industry Co., Ltd.
303,950 3.27 107,879 Subsequent collection 27,402 -
Innolux Corporation Innolux Japan Co.,Ltd. A subsidiary of the Company 442,839 6.73 13,820 Subsequent collection - -
Innolux Corporation Innolux USA Inc. An indirect wholly-owned
subsidiary of Hon Hai Precision
Industry Co., Ltd.
3,490,227 2.75 2,425,136 Subsequent collection 1,202,953 -
Innolux Corporation Futaijing Precision Electronics
(Beijing) Co., Ltd.
An indirect wholly-owned
subsidiary of Hon Hai Precision
Industry Co., Ltd.
156,008 5.60 - - 77,350 -
Innolux Corporation Guizhou Fuzhikang Electronic Co.,
Ltd.
An indirect wholly-owned
subsidiary of Hon Hai Precision
Industry Co., Ltd.
176,485 1.47 6,723 Subsequent collection 72,786 -
Innolux Corporation Competition Team Technology
(India) Private Limited
An indirect wholly-owned
subsidiary of Hon Hai Precision
Industry Co., Ltd.
114,381 3.11 - - 26,514 -
Innolux Corporation COMPETITION TEAM IRELAND
LIMITED
An indirect wholly-owned
subsidiary of Hon Hai Precision
Industry Co., Ltd.
100,589 2.35 29,544 Subsequent collection 24,708 -
Innolux Corporation Fu Lian Net International (Hong An indirect wholly-owned
subsidiary
369,837 - 369,837 Subsequent collection - -
Kong) Limited of Hon Hai Precision Industry Co.,
Ltd.
(Shown as other
receivables) (Note)
Ningbo Innolux Optoelectronics
Ltd.
Leadtek Global Group Limited A subsidiary of the Company 19,693,660 1.03 12,300,671 Subsequent collection 4,308,217 -
Foshan Innolux Optoelectronics
Ltd.
Lakers Trading Ltd. An indirect wholly-owned
subsidiary
15,620,380 2.68 3,473,514 Subsequent collection 5,682,569 -
Nanjing Innolux Optoelectronics
Ltd.
Innolux Hong Kong Limited An indirect wholly-owned
subsidiary
7,830,730 2.05 - - 1,823,997 -
Ningbo Innolux Display Ltd. Lakers Trading Ltd. An indirect wholly-owned
subsidiary
4,853,362 4.51 9,688,600 Subsequent collection 2,170,332 -
Innolux Corporation and Subsidiaries
Receivables from related parties reaching $100 million or 20% of paid-in capital or more
December 31, 2018
Expressed in thousands of NTD
(Except as otherwise indicated)
Amount collected
subsequent to the
balance sheet date
Allowance for
doubtful accounts Creditor Counterparty
Relationship
with the counterparty
Balance as at
December 31, 2018
Turnover
rate
Overdue receivables
Table 5, Page 1
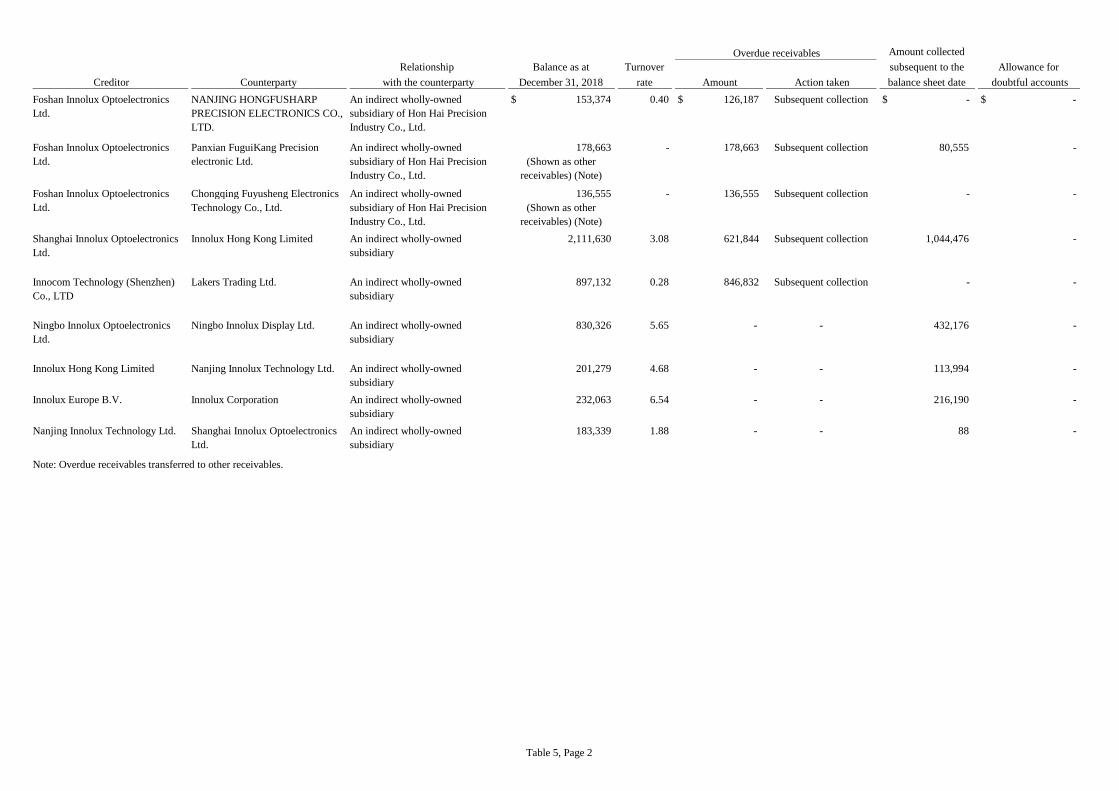
Amount Action taken
Amount collected
subsequent to the
balance sheet date
Allowance for
doubtful accounts Creditor Counterparty
Relationship
with the counterparty
Balance as at
December 31, 2018
Turnover
rate
Overdue receivables
Foshan Innolux Optoelectronics
Ltd.
NANJING HONGFUSHARP
PRECISION ELECTRONICS CO.,
LTD.
An indirect wholly-owned
subsidiary of Hon Hai Precision
Industry Co., Ltd.
$ 153,374 0.40 $ 126,187 Subsequent collection $ - $ -
An indirect wholly-owned 178,663 - 178,663 Subsequent collection 80,555 -
subsidiary of Hon Hai Precision
Industry Co., Ltd.
(Shown as other
receivables) (Note)
Chongqing Fuyusheng Electronics An indirect wholly-owned 136,555 - 136,555 Subsequent collection - -
Technology Co., Ltd. subsidiary of Hon Hai Precision
Industry Co., Ltd.
(Shown as other
receivables) (Note)
Shanghai Innolux Optoelectronics
Ltd.
Innolux Hong Kong Limited An indirect wholly-owned
subsidiary
2,111,630 3.08 621,844 Subsequent collection 1,044,476 -
Innocom Technology (Shenzhen)
Co., LTD
Lakers Trading Ltd. An indirect wholly-owned
subsidiary
897,132 0.28 846,832 Subsequent collection - -
Ningbo Innolux Optoelectronics
Ltd.
Ningbo Innolux Display Ltd. An indirect wholly-owned
subsidiary
830,326 5.65 - - 432,176 -
Innolux Hong Kong Limited Nanjing Innolux Technology Ltd. An indirect wholly-owned
subsidiary
201,279 4.68 - - 113,994 -
Innolux Europe B.V. Innolux Corporation An indirect wholly-owned
subsidiary
232,063 6.54 - - 216,190 -
Nanjing Innolux Technology Ltd. Shanghai Innolux Optoelectronics
Ltd.
An indirect wholly-owned
subsidiary
183,339 1.88 - - 88 -
Note: Overdue receivables transferred to other receivables.
Panxian FuguiKang Precision
electronic Ltd.
Foshan Innolux Optoelectronics
Ltd.
Foshan Innolux Optoelectronics
Ltd.
Table 5, Page 2
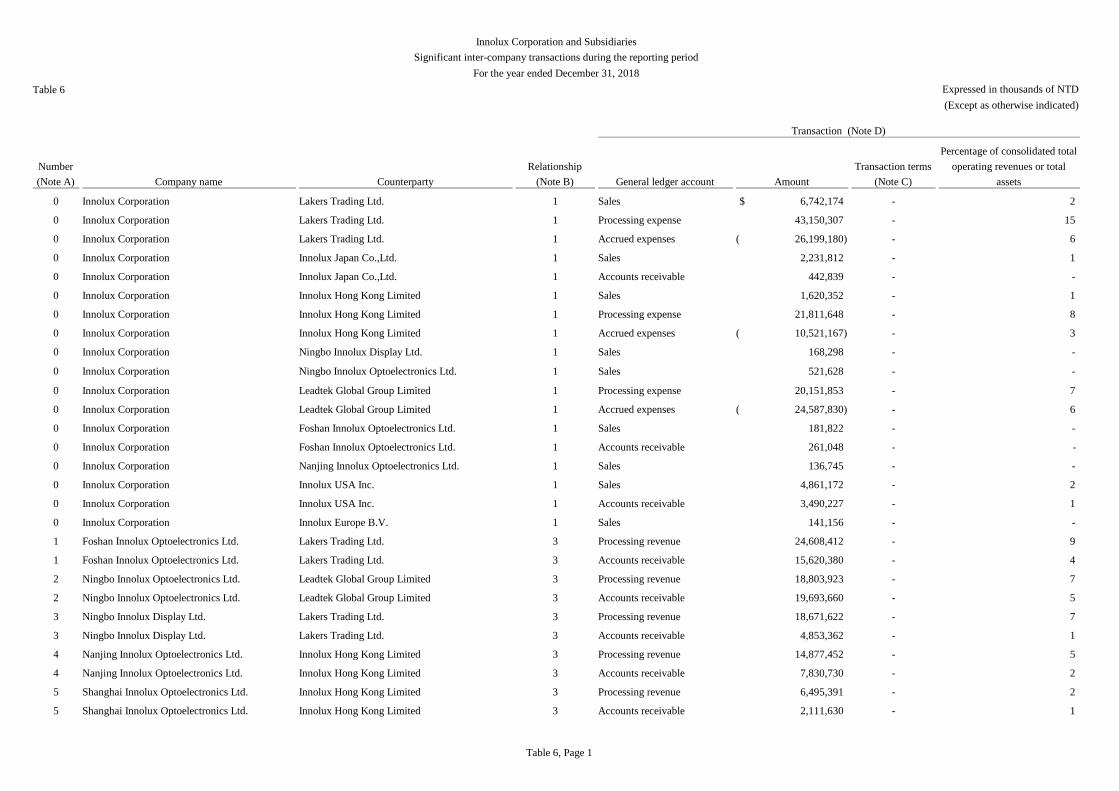
General ledger account Amount
Transaction terms
(Note C)
Percentage of consolidated total
operating revenues or total
assets
0 Innolux Corporation Lakers Trading Ltd. 1 Sales 6,742,174$ - 2
0 Innolux Corporation Lakers Trading Ltd. 1 Processing expense 43,150,307 - 15
0 Innolux Corporation Lakers Trading Ltd. 1 Accrued expenses 26,199,180)( - 6
0 Innolux Corporation Innolux Japan Co.,Ltd. 1 Sales 2,231,812 - 1
0 Innolux Corporation Innolux Japan Co.,Ltd. 1 Accounts receivable 442,839 - -
0 Innolux Corporation Innolux Hong Kong Limited 1 Sales 1,620,352 - 1
0 Innolux Corporation Innolux Hong Kong Limited 1 Processing expense 21,811,648 - 8
0 Innolux Corporation Innolux Hong Kong Limited 1 Accrued expenses 10,521,167)( - 3
0 Innolux Corporation Ningbo Innolux Display Ltd. 1 Sales 168,298 - -
0 Innolux Corporation Ningbo Innolux Optoelectronics Ltd. 1 Sales 521,628 - -
0 Innolux Corporation Leadtek Global Group Limited 1 Processing expense 20,151,853 - 7
0 Innolux Corporation Leadtek Global Group Limited 1 Accrued expenses 24,587,830)( - 6
0 Innolux Corporation Foshan Innolux Optoelectronics Ltd. 1 Sales 181,822 - -
0 Innolux Corporation Foshan Innolux Optoelectronics Ltd. 1 Accounts receivable 261,048 - -
0 Innolux Corporation Nanjing Innolux Optoelectronics Ltd. 1 Sales 136,745 - -
0 Innolux Corporation Innolux USA Inc. 1 Sales 4,861,172 - 2
0 Innolux Corporation Innolux USA Inc. 1 Accounts receivable 3,490,227 - 1
0 Innolux Corporation Innolux Europe B.V. 1 Sales 141,156 - -
1 Foshan Innolux Optoelectronics Ltd. Lakers Trading Ltd. 3 Processing revenue 24,608,412 - 9
1 Foshan Innolux Optoelectronics Ltd. Lakers Trading Ltd. 3 Accounts receivable 15,620,380 - 4
2 Ningbo Innolux Optoelectronics Ltd. Leadtek Global Group Limited 3 Processing revenue 18,803,923 - 7
2 Ningbo Innolux Optoelectronics Ltd. Leadtek Global Group Limited 3 Accounts receivable 19,693,660 - 5
3 Ningbo Innolux Display Ltd. Lakers Trading Ltd. 3 Processing revenue 18,671,622 - 7
3 Ningbo Innolux Display Ltd. Lakers Trading Ltd. 3 Accounts receivable 4,853,362 - 1
4 Nanjing Innolux Optoelectronics Ltd. Innolux Hong Kong Limited 3 Processing revenue 14,877,452 - 5
4 Nanjing Innolux Optoelectronics Ltd. Innolux Hong Kong Limited 3 Accounts receivable 7,830,730 - 2
5 Shanghai Innolux Optoelectronics Ltd. Innolux Hong Kong Limited 3 Processing revenue 6,495,391 - 2
5 Shanghai Innolux Optoelectronics Ltd. Innolux Hong Kong Limited 3 Accounts receivable 2,111,630 - 1
Innolux Corporation and Subsidiaries
Significant inter-company transactions during the reporting period
For the year ended December 31, 2018
Table 6 Expressed in thousands of NTD
(Except as otherwise indicated)
Number
(Note A) Company name Counterparty
Relationship
(Note B)
Transaction (Note D)
Table 6, Page 1
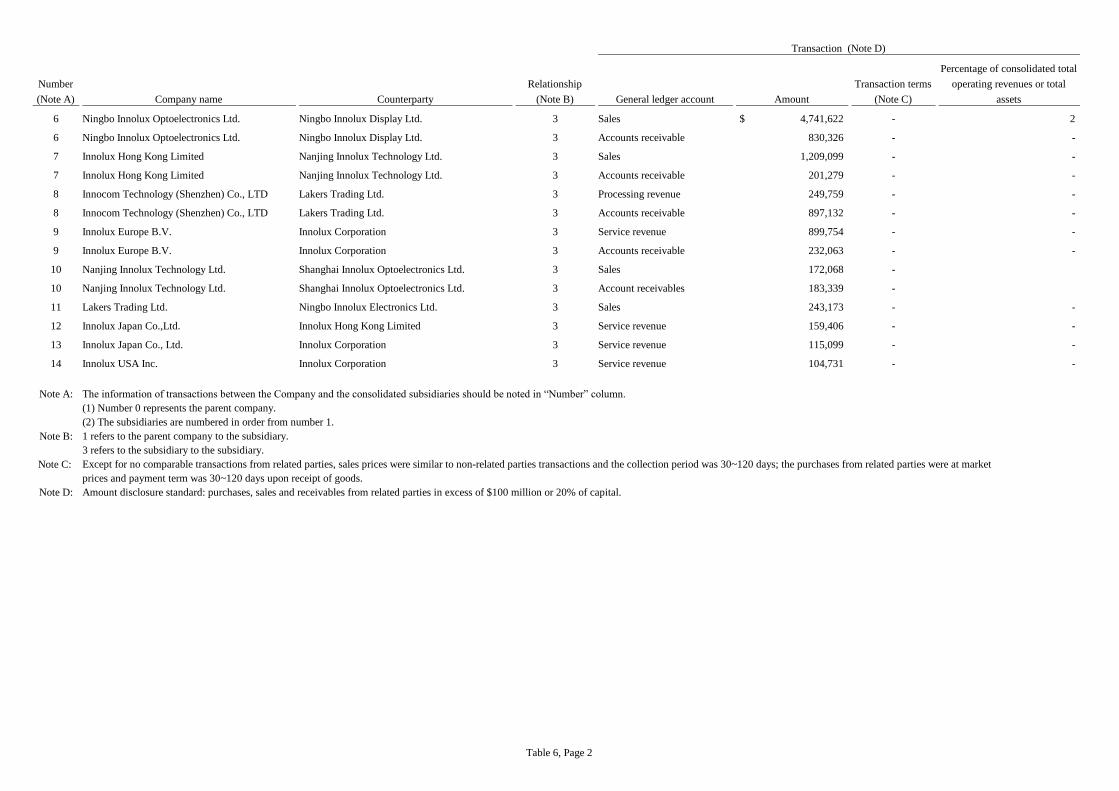
General ledger account Amount
Transaction terms
(Note C)
Percentage of consolidated total
operating revenues or total
assets
Number
(Note A) Company name Counterparty
Relationship
(Note B)
Transaction (Note D)
6 Ningbo Innolux Optoelectronics Ltd. Ningbo Innolux Display Ltd. 3 Sales 4,741,622$ - 2
6 Ningbo Innolux Optoelectronics Ltd. Ningbo Innolux Display Ltd. 3 Accounts receivable 830,326 - -
7 Innolux Hong Kong Limited Nanjing Innolux Technology Ltd. 3 Sales 1,209,099 - -
7 Innolux Hong Kong Limited Nanjing Innolux Technology Ltd. 3 Accounts receivable 201,279 - -
8 Innocom Technology (Shenzhen) Co., LTD Lakers Trading Ltd. 3 Processing revenue 249,759 - -
8 Innocom Technology (Shenzhen) Co., LTD Lakers Trading Ltd. 3 Accounts receivable 897,132 - -
9 Innolux Europe B.V. Innolux Corporation 3 Service revenue 899,754 - -
9 Innolux Europe B.V. Innolux Corporation 3 Accounts receivable 232,063 - -
10 Nanjing Innolux Technology Ltd. Shanghai Innolux Optoelectronics Ltd. 3 Sales 172,068 -
10 Nanjing Innolux Technology Ltd. Shanghai Innolux Optoelectronics Ltd. 3 Account receivables 183,339 -
11 Lakers Trading Ltd. Ningbo Innolux Electronics Ltd. 3 Sales 243,173 - -
12 Innolux Japan Co.,Ltd. Innolux Hong Kong Limited 3 Service revenue 159,406 - -
13 Innolux Japan Co., Ltd. Innolux Corporation 3 Service revenue 115,099 - -
14 Innolux USA Inc. Innolux Corporation 3 Service revenue 104,731 - -
Note A: The information of transactions between the Company and the consolidated subsidiaries should be noted in “Number” column.
(1) Number 0 represents the parent company.
(2) The subsidiaries are numbered in order from number 1.
Note B: 1 refers to the parent company to the subsidiary.
3 refers to the subsidiary to the subsidiary.
Note C: Except for no comparable transactions from related parties, sales prices were similar to non-related parties transactions and the collection period was 30~120 days; the purchases from related parties were at market
prices and payment term was 30~120 days upon receipt of goods.
Note D: Amount disclosure standard: purchases, sales and receivables from related parties in excess of $100 million or 20% of capital.
Table 6, Page 2
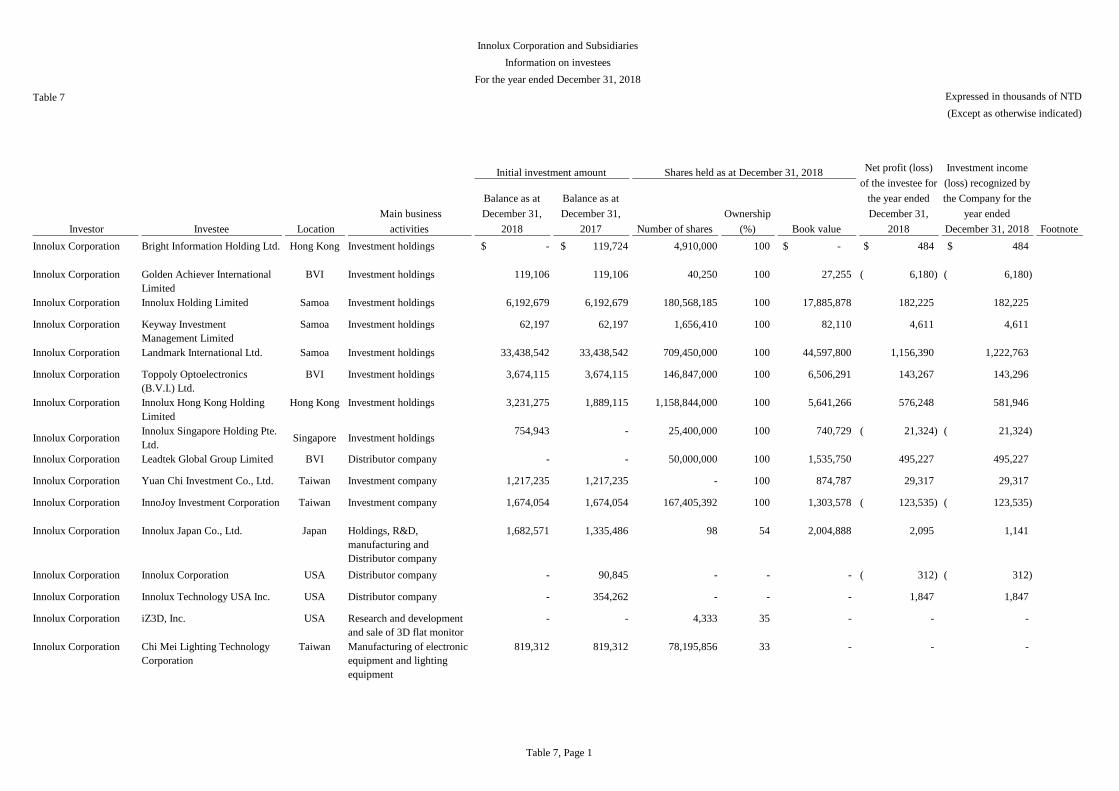
Balance as at
December 31,
2018
Balance as at
December 31,
2017 Number of shares
Ownership
(%) Book value
Innolux Corporation Bright Information Holding Ltd. Hong Kong Investment holdings $ - $ 119,724 4,910,000 100 -$ 484$ 484$
Innolux Corporation Golden Achiever International
Limited
BVI Investment holdings 119,106 119,106 40,250 100 27,255 6,180)( 6,180)(
Innolux Corporation Innolux Holding Limited Samoa Investment holdings 6,192,679 6,192,679 180,568,185 100 17,885,878 182,225 182,225
Innolux Corporation Keyway Investment
Management Limited
Samoa Investment holdings 62,197 62,197 1,656,410 100 82,110 4,611 4,611
Innolux Corporation Landmark International Ltd. Samoa Investment holdings 33,438,542 33,438,542 709,450,000 100 44,597,800 1,156,390 1,222,763
Innolux Corporation Toppoly Optoelectronics
(B.V.I.) Ltd.
BVI Investment holdings 3,674,115 3,674,115 146,847,000 100 6,506,291 143,267 143,296
Innolux Corporation Innolux Hong Kong Holding
Limited
Hong Kong Investment holdings 3,231,275 1,889,115 1,158,844,000 100 5,641,266 576,248 581,946
Innolux CorporationInnolux Singapore Holding Pte.
Ltd.Singapore Investment holdings
754,943 - 25,400,000 100 740,729 21,324)( 21,324)(
Innolux Corporation Leadtek Global Group Limited BVI Distributor company - - 50,000,000 100 1,535,750 495,227 495,227
Innolux Corporation Yuan Chi Investment Co., Ltd. Taiwan Investment company 1,217,235 1,217,235 - 100 874,787 29,317 29,317
Innolux Corporation InnoJoy Investment Corporation Taiwan Investment company 1,674,054 1,674,054 167,405,392 100 1,303,578 123,535)( 123,535)(
Innolux Corporation Innolux Japan Co., Ltd. Japan Holdings, R&D,
manufacturing and
Distributor company
1,682,571 1,335,486 98 54 2,004,888 2,095 1,141
Innolux Corporation Innolux Corporation USA Distributor company - 90,845 - - - 312)( 312)(
Innolux Corporation Innolux Technology USA Inc. USA Distributor company - 354,262 - - - 1,847 1,847
Innolux Corporation iZ3D, Inc. USA Research and development
and sale of 3D flat monitor
- - 4,333 35 - - -
Innolux Corporation Chi Mei Lighting Technology
Corporation
Taiwan Manufacturing of electronic
equipment and lighting
equipment
819,312 819,312 78,195,856 33 - - -
Information on investees
For the year ended December 31, 2018
Table 7 Expressed in thousands of NTD
(Except as otherwise indicated)
Innolux Corporation and Subsidiaries
Net profit (loss)
of the investee for
the year ended
December 31,
2018
Investment income
(loss) recognized by
the Company for the
year ended
December 31, 2018 Footnote Investor Investee Location
Main business
activities
Initial investment amount Shares held as at December 31, 2018
Table 7, Page 1

Balance as at
December 31,
2018
Balance as at
December 31,
2017 Number of shares
Ownership
(%) Book value
Net profit (loss)
of the investee for
the year ended
December 31,
2018
Investment income
(loss) recognized by
the Company for the
year ended
December 31, 2018 Footnote Investor Investee Location
Main business
activities
Initial investment amount Shares held as at December 31, 2018
Innolux Corporation Ampower Holding Ltd. Cayman Investment holdings $ 1,717,714 $ 1,717,714 14,062,500 50 956,577$ 40,934$ 20,467$
Innolux Corporation FI Medical Device
Manufacturing Co., Ltd.
Taiwan Production and selling of
the absorption for medical
element
73,500 73,500 7,350,000 49 655,827 891,803 436,983
Innolux Corporation GIO Optoelectronics Corp. Taiwan Sales and manufacture of
TFT-LCD parts and
components
800,892 800,892 10,494,001 24 115,610 23,782 5,674
Innolux Corporation eLux, Inc. USA R&D of MicroLED
technology
91,155 - 300,000 38 74,135 80,583)( 16,955)(
Innolux Holding
Limited
Rockets Holding Ltd. Samoa Investment holdings 5,222,180 5,222,180 160,504,550 100 11,755,619 27,224 27,224
Innolux Holding
Limited
Suns Holding Ltd. Samoa Investment holdings 555,422 555,422 18,177,052 100 5,896,175 155,001 155,001
Innolux Holding
Limited
Lakers Trading Ltd. Samoa Distributor company - - 1 100 234,005 - -
Toppoly
Optoelectronics (B.V.I.)
Ltd.
Toppoly Optoelectronics
(Cayman) Ltd.
Cayman Investment holdings 3,650,192 3,650,192 146,817,000 100 6,505,932 143,267 143,296
Innolux Hong Kong
Holding Limited
Innolux Optoelectronics Hong
Kong Holding Limited
Hong Kong Investment holdings - - 162,897,802 100 1,557,546 190,912 190,912
Innolux Hong Kong
Holding Limited
Innolux Hong Kong Limited Hong Kong Distributor company - - 35,000,000 100 504,440 292,656 292,656
Innolux Hong Kong
Holding Limited
Innolux Europe B.V. Netherlands Holding, R&D testing and
Distributor company
1,994,102 3,209,158 375,810 100 683,992 84,949 84,949
Innolux Hong Kong
Holding Limited
Innolux Japan Co.,Ltd. Japan Holdings, R&D,
manufacturing and
Distributor company
1,815,603 1,815,603 82 46 1,677,860 2,095 954
Innolux Japan Co.,Ltd. Innolux USA, Inc. USA Selling of electronic
equipment and computer
monitors
369,092 2,400 12,842 100 666,022 19,772 19,772
Rockets Holding Ltd. Stanford Developments Ltd. Samoa Investment holdings 5,391,125 5,391,125 164,000,000 100 11,727,222 28,751 28,751
Rockets Holding Ltd. Nets Trading Ltd. Samoa Investment company 27,477 27,477 900,001 100 28,260 1,528)( 1,528)(
Suns Holding Ltd. Warriors Technology
Investments Ltd.
Samoa Investment company 555,422 555,422 18,177,052 100 5,896,173 155,001 155,001
Innolux Europe B.V. Innolux Technology Germany
GmbH
Germany Testing and maintenance
company
33,735 33,735 100,000 100 72,080 10,767 10,767
Innolux Singapore
Holding Pte. Ltd.
Innolux Optoelectronics India
Private LimitedIndia Distributor company
176,997 - 39,500,000 100 152,400 21,429)( 21,429)(
Innolux Singapore
Holding Pte. Ltd.
Innolux Optoelectronics
Philippines Corp.Philippines
Manufacturer and
distributor
28,733 - 5,000,000 100 28,398 767)( 767)(
Table 7, Page 2
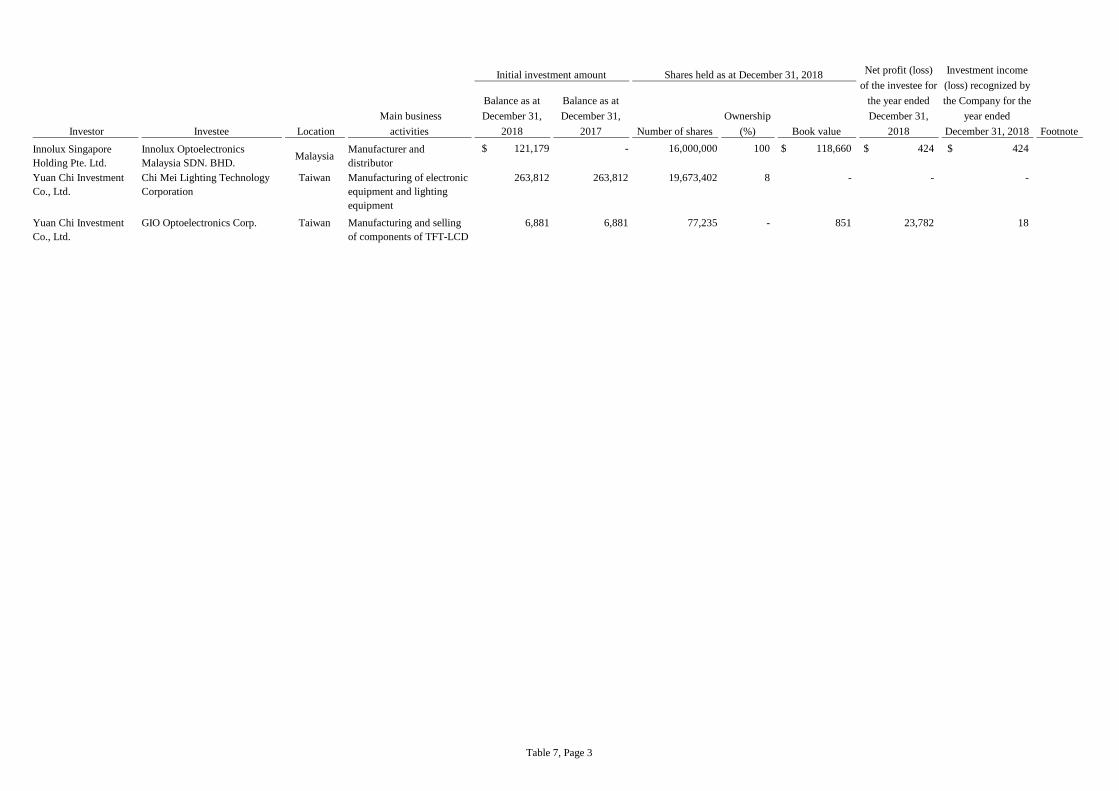
Balance as at
December 31,
2018
Balance as at
December 31,
2017 Number of shares
Ownership
(%) Book value
Net profit (loss)
of the investee for
the year ended
December 31,
2018
Investment income
(loss) recognized by
the Company for the
year ended
December 31, 2018 Footnote Investor Investee Location
Main business
activities
Initial investment amount Shares held as at December 31, 2018
Innolux Singapore
Holding Pte. Ltd.
Innolux Optoelectronics
Malaysia SDN. BHD.Malaysia
Manufacturer and
distributor
$ 121,179 - 16,000,000 100 118,660$ 424$ 424$
Yuan Chi Investment
Co., Ltd.
Chi Mei Lighting Technology
Corporation
Taiwan Manufacturing of electronic
equipment and lighting
equipment
263,812 263,812 19,673,402 8 - - -
Yuan Chi Investment
Co., Ltd.
GIO Optoelectronics Corp. Taiwan Manufacturing and selling
of components of TFT-LCD
6,881 6,881 77,235 - 851 23,782 18
Table 7, Page 3
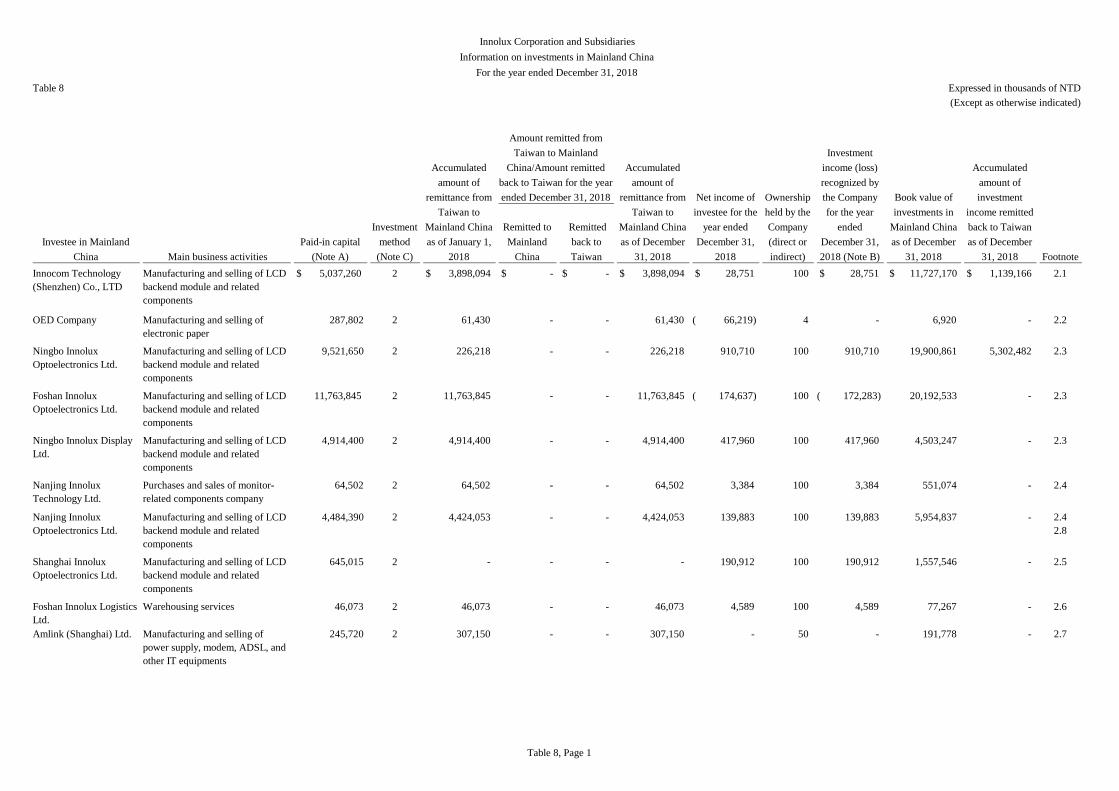
Remitted to
Mainland
China
Remitted
back to
Taiwan
Innocom Technology
(Shenzhen) Co., LTD
Manufacturing and selling of LCD
backend module and related
components
$ 5,037,260 2 $ 3,898,094 $ - $ - $ 3,898,094 $ 28,751 100 $ 28,751 $ 11,727,170 $ 1,139,166 2.1
OED Company Manufacturing and selling of
electronic paper
287,802 2 61,430 - - 61,430 ( 66,219) 4 - 6,920 - 2.2
Ningbo Innolux
Optoelectronics Ltd.
Manufacturing and selling of LCD
backend module and related
components
9,521,650 2 226,218 - - 226,218 910,710 100 910,710 19,900,861 5,302,482 2.3
Foshan Innolux
Optoelectronics Ltd.
Manufacturing and selling of LCD
backend module and related
components
11,763,845 2 11,763,845 - - 11,763,845 ( 174,637) 100 ( 172,283) 20,192,533 - 2.3
Ningbo Innolux Display
Ltd.
Manufacturing and selling of LCD
backend module and related
components
4,914,400 2 4,914,400 - - 4,914,400 417,960 100 417,960 4,503,247 - 2.3
Nanjing Innolux
Technology Ltd.
Purchases and sales of monitor-
related components company
64,502 2 64,502 - - 64,502 3,384 100 3,384 551,074 - 2.4
Nanjing Innolux
Optoelectronics Ltd.
Manufacturing and selling of LCD
backend module and related
components
4,484,390 2 4,424,053 - - 4,424,053 139,883 100 139,883 5,954,837 - 2.4
2.8
Shanghai Innolux
Optoelectronics Ltd.
Manufacturing and selling of LCD
backend module and related
components
645,015 2 - - - - 190,912 100 190,912 1,557,546 - 2.5
Foshan Innolux Logistics
Ltd.
Warehousing services 46,073 2 46,073 - - 46,073 4,589 100 4,589 77,267 - 2.6
Amlink (Shanghai) Ltd. Manufacturing and selling of
power supply, modem, ADSL, and
other IT equipments
245,720 2 307,150 - - 307,150 - 50 - 191,778 - 2.7
Amount remitted from
Taiwan to Mainland
China/Amount remitted
back to Taiwan for the year
ended December 31, 2018
Innolux Corporation and Subsidiaries
Information on investments in Mainland China
For the year ended December 31, 2018
Table 8 Expressed in thousands of NTD
(Except as otherwise indicated)
Investee in Mainland
China Main business activities
Paid-in capital
(Note A)
Investment
method
(Note C)
Accumulated
amount of
remittance from
Taiwan to
Mainland China
as of January 1,
2018 Footnote
Accumulated
amount of
remittance from
Taiwan to
Mainland China
as of December
31, 2018
Net income of
investee for the
year ended
December 31,
2018
Ownership
held by the
Company
(direct or
indirect)
Investment
income (loss)
recognized by
the Company
for the year
ended
December 31,
2018 (Note B)
Book value of
investments in
Mainland China
as of December
31, 2018
Accumulated
amount of
investment
income remitted
back to Taiwan
as of December
31, 2018
Table 8, Page 1

Remitted to
Mainland
China
Remitted
back to
Taiwan
Interface Optoelectronics
(Shenzhen) Co., Ltd.
Development of new type of flat
panel display, monitor and
peripherals, production and
management, and offer of after-
sales service
$ 2,954,783 2 $ 414,653 $ - $ - $ 414,653 $ 490,966 7 $ - $ 2,177,460 $ - 2.2
Ningbo Innolux
Electronics Ltd.
R&D, Manufacturing and selling
of LCD backend module and
related components
134,259 3 - - - - 97,411 100 97,411 460,838 - 3.1
Foshan Innolux Flnet
Electronics Ltd.
Commodity agency 4,475 3 - - - - 263 100 263 5,997 - 3.2
Ningbo Innolux Flnet
Electronics Ltd.
Commodity agency 4,475 3 - - - - 1,630 100 1,630 9,025 - 3.2
Shenzhen PixinLED
Technology Co., Ltd.
Development and selling of MINI
LED
44,753 3 - - - - ( 1,879) 100 ( 1,879) 42,910 - 3.3
Innolux Automations and
Intelligence Systems
(ShenZhen) Co., Ltd.
Development and selling of
software
4,475 3 - - - - ( 4,730) 49 ( 2,318) ( 80) - 3.3
Amount remitted from
Taiwan to Mainland
China/Amount remitted
back to Taiwan for the year
ended December 31, 2018
Investee in Mainland
China Main business activities
Paid-in capital
(Note A)
Investment
method
(Note C)
Accumulated
amount of
remittance from
Taiwan to
Mainland China
as of January 1,
2018
Accumulated
amount of
investment
income remitted
back to Taiwan
as of December
31, 2018 Footnote
Accumulated
amount of
remittance from
Taiwan to
Mainland China
as of December
31, 2018
Net income of
investee for the
year ended
December 31,
2018
Ownership
held by the
Company
(direct or
indirect)
Investment
income (loss)
recognized by
the Company
for the year
ended
December 31,
2018 (Note B)
Book value of
investments in
Mainland China
as of December
31, 2018
Table 8, Page 2

Ceiling on investments in Mainland China:
Company name
Accumulated amount of remittance
from Taiwan to Mainland China as
of December 31, 2018
Innolux Corporation 27,620,564$
Note A: The relevant figures were listed in NT$. Where foreign currencies were involved, the figures were converted to NT$ using exchange rate.
Note B: Profit or loss recognized for the year ended December 31, 2018 was audited by independent accountants.
Note C: The investment methods are as follows:
1. Directly investing in Mainland China.
2. Through investing in companies in the third area, which then invested in the investee in Mainland China.
2.1. Through investing in Stanford Developments Ltd. in the third area, which then invested in the investee in Mainland China.
2.2. Through investing in Warriors Technology Investments Ltd. in the third area, which then invested in the investee in Mainland China.
2.3. Through investing in Landmark International Ltd. in the third area, which then invested in the investee in Mainland China.
2.4. Through investing in Toppoly Optoelectronics (Cayman) Ltd. in the third area, which then invested in the investee in Mainland China.
2.5. Through investing in Innolux Optoelectronics Hong Kong Holding Limited in the third area, which then invested in the investee in Mainland China.
2.6. Through investing in Keyway Investment Management Limited in the third area, which then invested in the investee in Mainland China.
2.7. Through investing in Ampower Holding Ltd. in the third area, which then invested in the investee in Mainland China.
2.8. Nanjing Innoloux Optoelectornics Ltd. acquired Kunpal Optoelectronics Ltd. by merger, which was approved by the Investment Commission of the Ministry of Economic Affairs in November 2017.
3. Others.
3.1. The company invested in the company via investee company in Mainland China, Ningbo Innolux Display Ltd. Except for the investment via the holding companies in Mainland China, other investments shall be not
approved by Investment Commission of the Ministry of Economic Affairs.
3.2 The company invested via Foshan Innolux Optoelectronics Ltd. and Ningbo Innolux Optoelectronics Ltd. which are the company investment entities in Mainland China to invest in Foshan Innolux Flnet Electronics Ltd.
and Ningbo Innolux Flnet Electronics Ltd. Except for the investment via the holding companies in Mainland China, other investments shall be not approved by Investment Commission of the Ministry of Economic Affairs.
3.3.The company invested via Innocom Technology (Shenzhen) Co., LTD, which are the company investment entities in Mainland China to invest in Shenzhen PixinLED Technology Co.,Ltd., Innolux Automations
and Intelligence Systems (ShenZhen) Co., Ltd. Except for the investment via the holding companies in Mainland China, other investments shall be not approved by Investment Commission of the Ministry of Economic Affairs.
Note D: In accordance with “Rules Governing Applications for Investment or Technical Cooperation in Mainland China”, the Company has obtained the certificate of being qualified for operating headquarters, issued by the Industrial Development
Bureau of the Ministry of Economic Affairs, the ceiling amount of the investment in Mainland China is not applicable to the Company.
I. The amount approved by the Investment Commission of Ministry of Economic Affairs (MOEA) is USD 10,300 thousand, Vap Optoelectronics (NanJing) Corp. has finished liquidation in October 2018 but not apply the cancellation of
investment with Investment Commission of MOEA yet.
Investment amount approved
by the Investment
Commission of the Ministry
of Economic Affairs (MOEA)
36,825,118$
Ceiling on investments in
Mainland China imposed by the
Investment Commission of
MOEA
(Note D)
Table 8, Page 3