innovating for a better world tomorrow
TRANSCRIPT
INNOVATING FOR A
BETTER WORLDTOMORROW
Fresh Del Monte Produce Inc.Investor Relations
August 4, 2021
This presentation contains certain forward-looking statements regarding the intent, beliefs or
current expectations of the Company or its officers with respect to the Company’s plans and
future performance. These forward-looking statements are based on information currently
available to the Company and the Company assumes no obligation to update these statements.
It is important to note that these forward-looking statements are not guarantees of future
performance and involve risks and uncertainties.
All forward-looking statements in this presentation are based on information available to the
Company on the date hereof, and the Company assumes no obligation to update any such
forward-looking statements. The Company’s plans and performance may also be affected by the
factors described in Item 1A. – “Risk Factors” in Fresh Del Monte Produce Inc.’s Quarterly Report
on Form 10-Q for the quarter and its Annual Report on Form 10-K for fiscal year 2020 along with
other reports that the Company has on file with the Securities and Exchange Commission.
Forward-Looking Statements
2
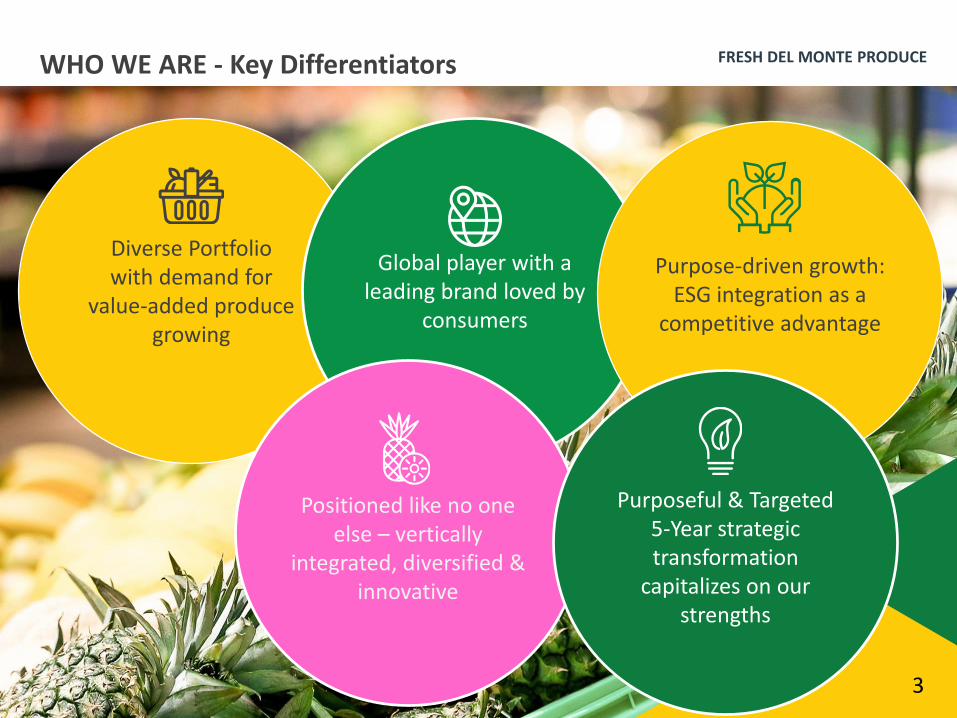
Diverse Portfoliowith demand for
value-added produce growing
FRESH DEL MONTE PRODUCE WHO WE ARE - Key Differentiators
3
Global player with a leading brand loved by
consumers
Positioned like no one else – vertically
integrated, diversified & innovative
Purpose-driven growth: ESG integration as a
competitive advantage
Purposeful & Targeted5-Year strategic transformation
capitalizes on our strengths
FRESH DEL MONTE PRODUCE AT A GLANCEHOW WE GOT THERE - Decades of Growth
4
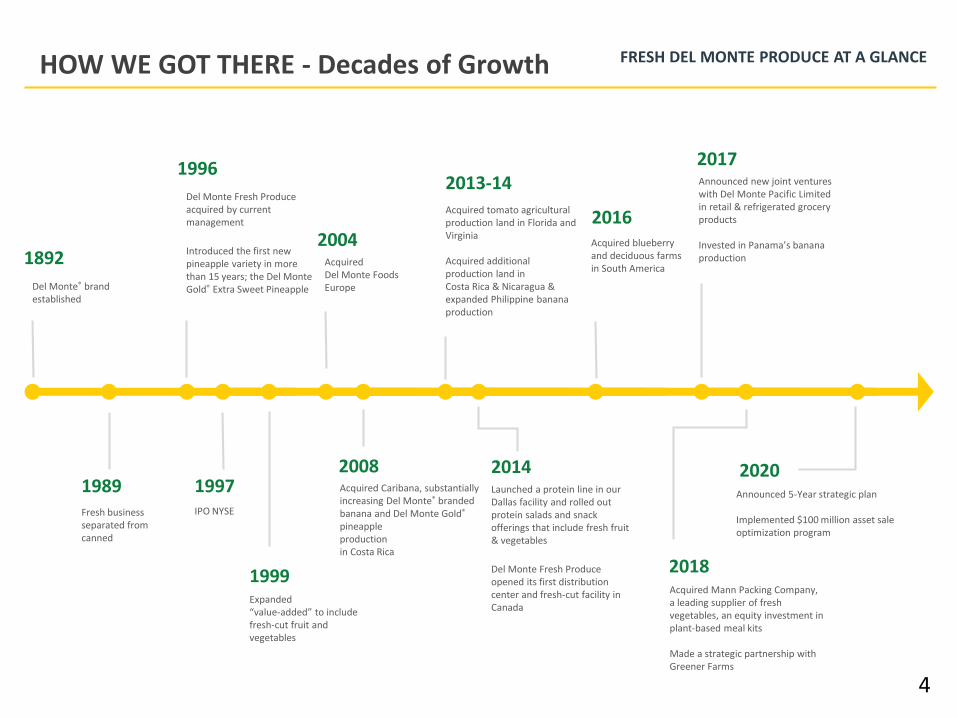
Acquired Mann Packing Company, a leading supplier of fresh vegetables, an equity investment in plant-based meal kits
Made a strategic partnership with Greener Farms
Launched a protein line in our Dallas facility and rolled out protein salads and snack offerings that include fresh fruit & vegetables
Del Monte Fresh Produce opened its first distribution center and fresh-cut facility in Canada
1892
Del Monte® brand established
Fresh business separated from canned
Del Monte Fresh Produce acquired by current management
Introduced the first new pineapple variety in more than 15 years; the Del Monte Gold® Extra Sweet Pineapple
IPO NYSE
1989
1996
1997
1999
2004
2008
2013-14
2014
2016
2017
2018
Acquired tomato agricultural production land in Florida and Virginia
Acquired additional production land in Costa Rica & Nicaragua & expanded Philippine banana production
Expanded “value-added” to include fresh-cut fruit and vegetables
AcquiredDel Monte FoodsEurope
Acquired Caribana, substantially increasing Del Monte® branded banana and Del Monte Gold®
pineappleproductionin Costa Rica
Acquired blueberry and deciduous farms in South America
Announced new joint ventures with Del Monte Pacific Limited in retail & refrigerated grocery products
Invested in Panama’s banana production
Announced 5-Year strategic plan
Implemented $100 million asset sale optimization program
2020
A Diversified Company Positioned for
Long-Term Growth…
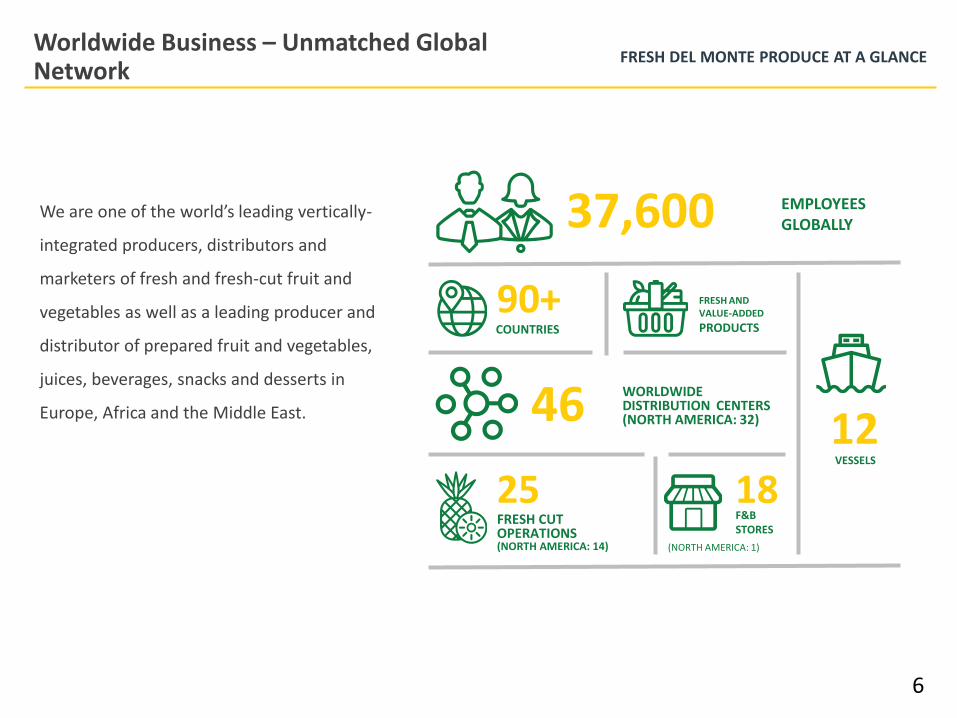
FRESH DEL MONTE PRODUCE AT A GLANCEWorldwide Business – Unmatched Global Network
We are one of the world’s leading vertically-
integrated producers, distributors and
marketers of fresh and fresh-cut fruit and
vegetables as well as a leading producer and
distributor of prepared fruit and vegetables,
juices, beverages, snacks and desserts in
Europe, Africa and the Middle East.
6
37,600
COUNTRIES
90+ FRESH AND VALUE-ADDED
PRODUCTS
EMPLOYEESGLOBALLY
46 WORLDWIDEDISTRIBUTION CENTERS(NORTH AMERICA: 32)
25FRESH CUT OPERATIONS(NORTH AMERICA: 14)
1218F&BSTORES
VESSELS
(NORTH AMERICA: 1)
IN 2020
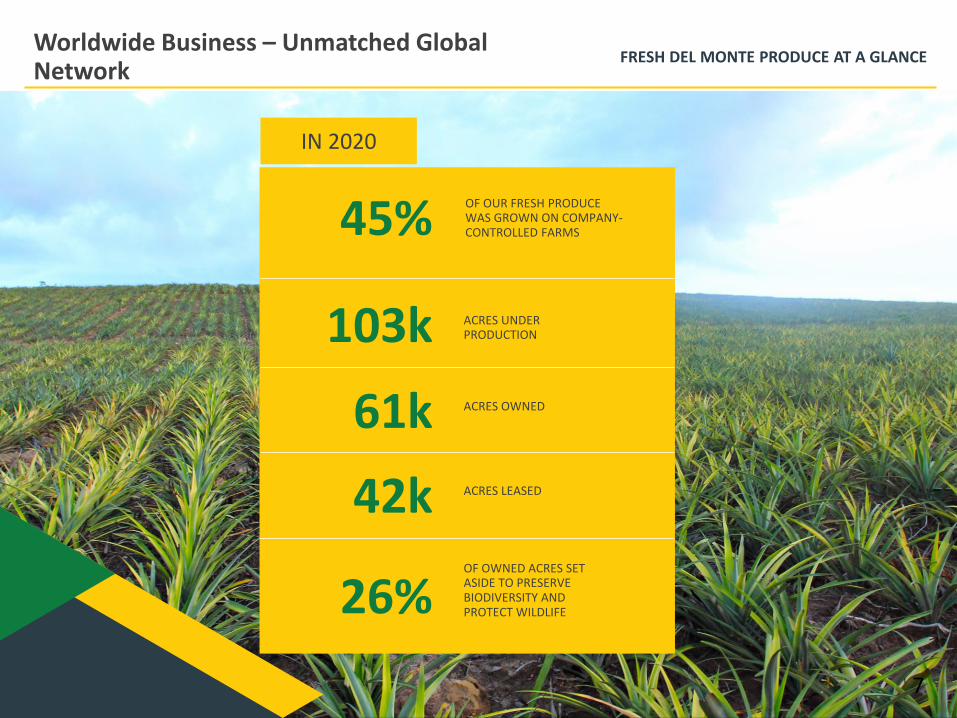
FRESH DEL MONTE PRODUCE AT A GLANCEWorldwide Business – Unmatched Global Network
OF OUR FRESH PRODUCE WAS GROWN ON COMPANY-CONTROLLED FARMS
ACRES UNDER PRODUCTION103k
ACRES OWNED61k
ACRES LEASED42k
45%
OF OWNED ACRES SET ASIDE TO PRESERVE BIODIVERSITY AND PROTECT WILDLIFE26%
7
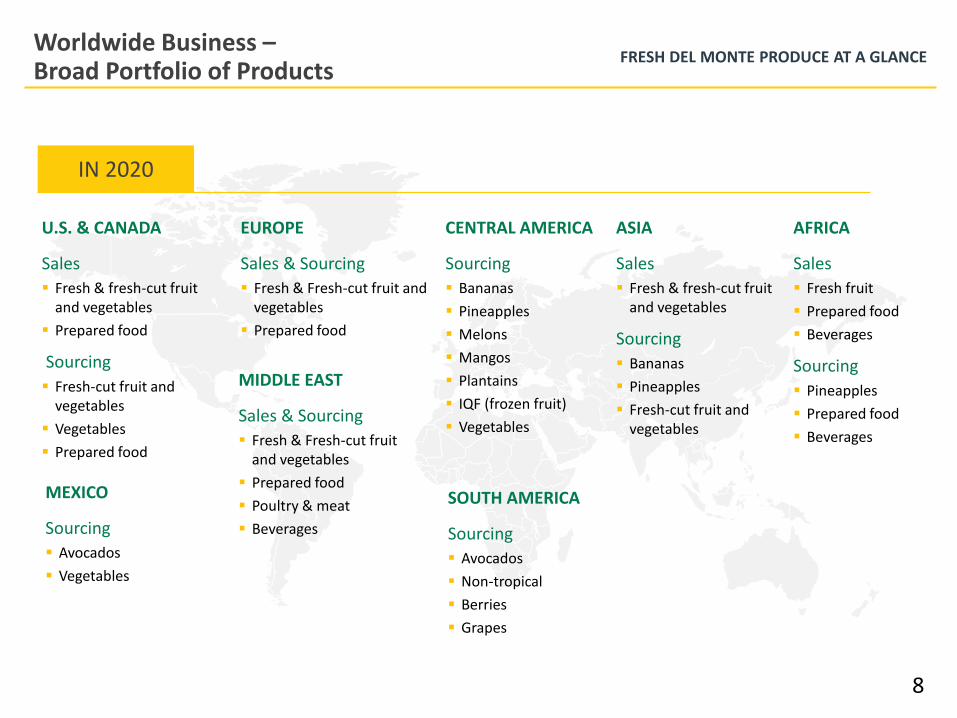
FRESH DEL MONTE PRODUCE AT A GLANCEWorldwide Business –Broad Portfolio of Products
U.S. & CANADA
Sales
▪ Fresh & fresh-cut fruit and vegetables
▪ Prepared food
Sourcing
▪ Fresh-cut fruit and vegetables
▪ Vegetables
▪ Prepared food
MEXICO
Sourcing
▪ Avocados
▪ Vegetables
CENTRAL AMERICA
Sourcing
▪ Bananas
▪ Pineapples
▪ Melons
▪ Mangos
▪ Plantains
▪ IQF (frozen fruit)
▪ Vegetables
SOUTH AMERICA
Sourcing
▪ Avocados
▪ Non-tropical
▪ Berries
▪ Grapes
MIDDLE EAST
Sales & Sourcing
▪ Fresh & Fresh-cut fruit and vegetables
▪ Prepared food
▪ Poultry & meat
▪ Beverages
EUROPE
Sales & Sourcing
▪ Fresh & Fresh-cut fruit and vegetables
▪ Prepared food
AFRICA
Sales
▪ Fresh fruit
▪ Prepared food
▪ Beverages
Sourcing
▪ Pineapples
▪ Prepared food
▪ Beverages
ASIA
Sales
▪ Fresh & fresh-cut fruit and vegetables
Sourcing
▪ Bananas
▪ Pineapples
▪ Fresh-cut fruit and vegetables
8
IN 2020
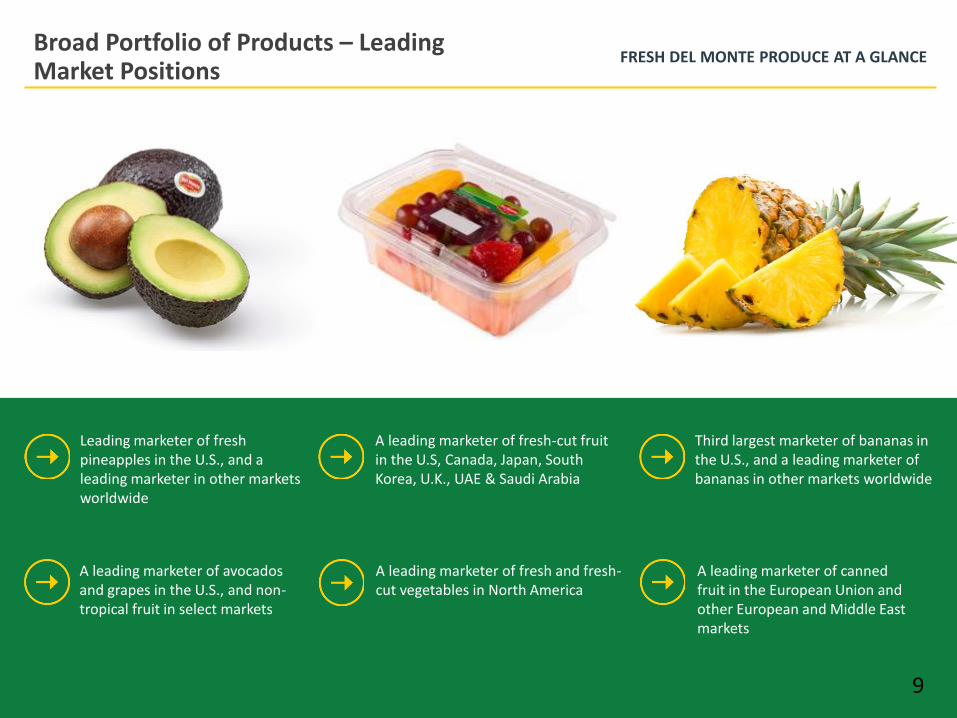
FRESH DEL MONTE PRODUCE AT A GLANCEBroad Portfolio of Products – Leading Market Positions
Leading marketer of fresh pineapples in the U.S., and a leading marketer in other markets worldwide
A leading marketer of avocados and grapes in the U.S., and non-tropical fruit in select markets
A leading marketer of fresh-cut fruit in the U.S, Canada, Japan, South Korea, U.K., UAE & Saudi Arabia
A leading marketer of fresh and fresh-cut vegetables in North America
Third largest marketer of bananas in the U.S., and a leading marketer of bananas in other markets worldwide
A leading marketer of canned fruit in the European Union and other European and Middle East markets
9
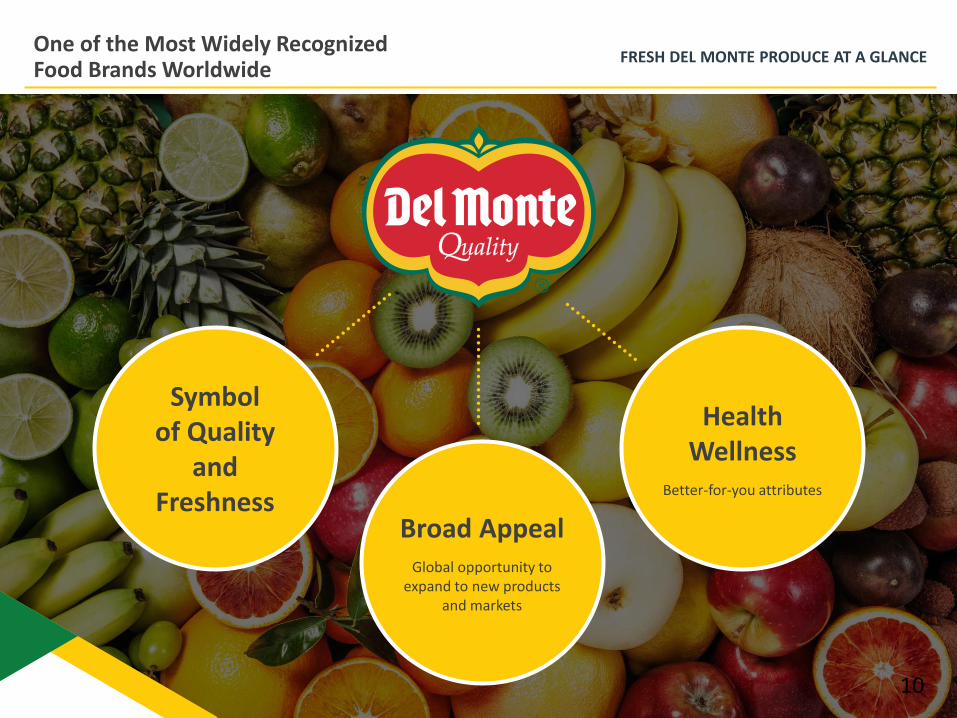
FRESH DEL MONTE PRODUCE AT A GLANCEOne of the Most Widely Recognized Food Brands Worldwide
10
Symbol of Quality
and Freshness
Broad AppealGlobal opportunity to
expand to new products and markets
Health Wellness
Better-for-you attributes
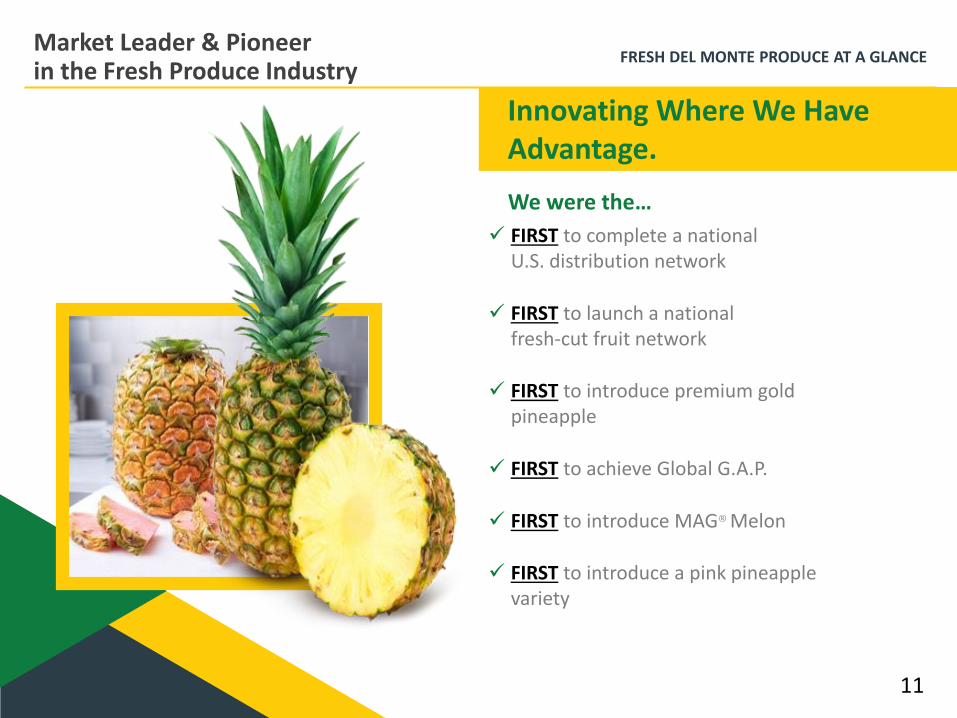
FRESH DEL MONTE PRODUCE AT A GLANCEMarket Leader & Pioneer in the Fresh Produce Industry
✓ FIRST to complete a national U.S. distribution network
✓ FIRST to launch a national fresh-cut fruit network
✓ FIRST to introduce premium gold pineapple
✓ FIRST to achieve Global G.A.P.
✓ FIRST to introduce MAG® Melon
✓ FIRST to introduce a pink pineapple variety
Innovating Where We Have Advantage.
11
We were the…
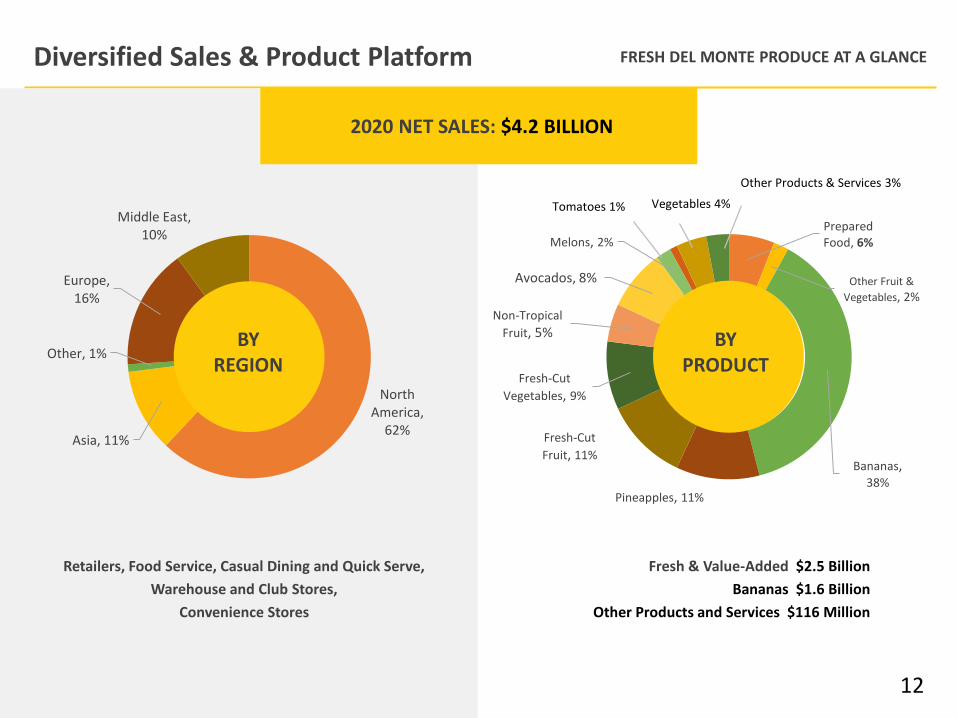
Prepared Food, 6%
Other Fruit &
Vegetables, 2%
Bananas, 38%
Pineapples, 11%
Fresh-Cut
Fruit, 11%
Fresh-Cut
Vegetables, 9%
Non-Tropical
Fruit, 5%
Avocados, 8%
Melons, 2%
Other Products & Services 3%
North America,
62%Asia, 11%
Other, 1%
Europe, 16%
Middle East, 10%
FRESH DEL MONTE PRODUCE AT A GLANCEDiversified Sales & Product Platform
Fresh & Value-Added $2.5 Billion
Bananas $1.6 Billion
Other Products and Services $116 Million
BY PRODUCT
2020 NET SALES: $4.2 BILLION
BY REGION
Vegetables 4% Tomatoes 1%
Retailers, Food Service, Casual Dining and Quick Serve,
Warehouse and Club Stores,
Convenience Stores
12
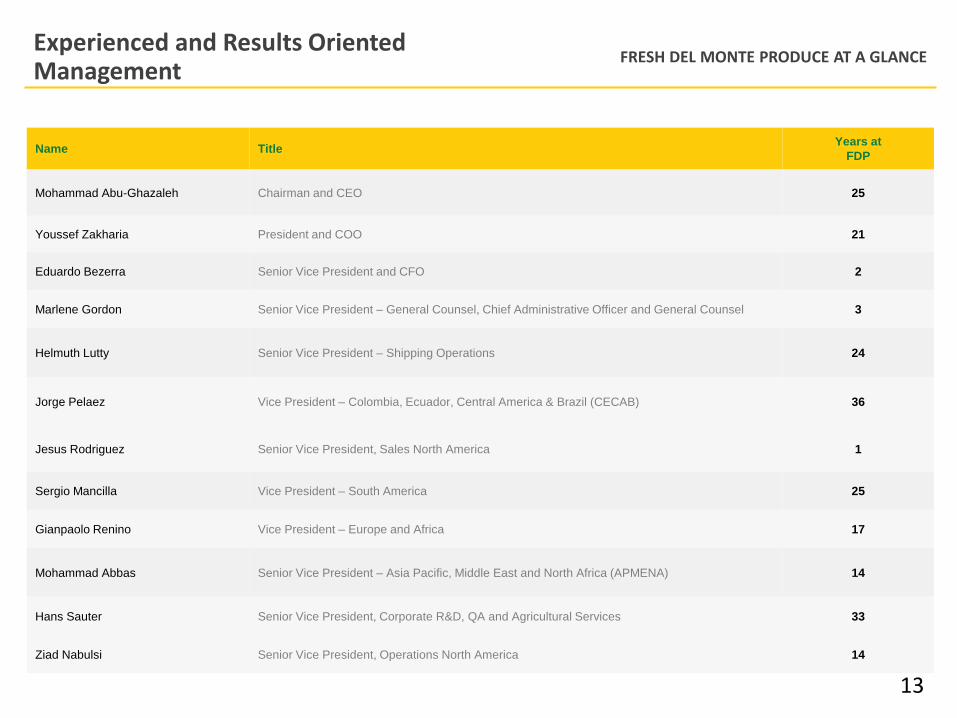
FRESH DEL MONTE PRODUCE AT A GLANCEExperienced and Results Oriented Management
13
Name TitleYears at
FDP
Mohammad Abu-Ghazaleh Chairman and CEO 25
Youssef Zakharia President and COO 21
Eduardo Bezerra Senior Vice President and CFO 2
Marlene Gordon Senior Vice President – General Counsel, Chief Administrative Officer and General Counsel 3
Helmuth Lutty Senior Vice President – Shipping Operations 24
Jorge Pelaez Vice President – Colombia, Ecuador, Central America & Brazil (CECAB) 36
Jesus Rodriguez Senior Vice President, Sales North America 1
Sergio Mancilla Vice President – South America 25
Gianpaolo Renino Vice President – Europe and Africa 17
Mohammad Abbas Senior Vice President – Asia Pacific, Middle East and North Africa (APMENA) 14
Hans Sauter Senior Vice President, Corporate R&D, QA and Agricultural Services 33
Ziad Nabulsi Senior Vice President, Operations North America 14
Inspiring healthy lifestyles through wholesome and convenient products
14
Our Vision
15
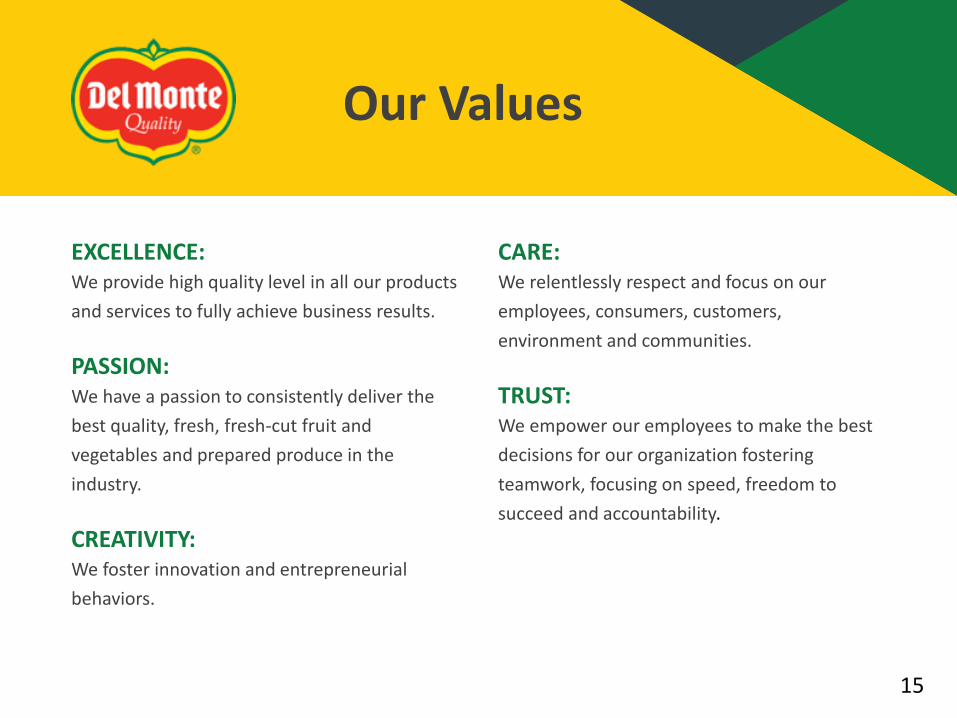
Our Values
EXCELLENCE: We provide high quality level in all our products
and services to fully achieve business results.
PASSION: We have a passion to consistently deliver the
best quality, fresh, fresh-cut fruit and
vegetables and prepared produce in the
industry.
CREATIVITY: We foster innovation and entrepreneurial
behaviors.
CARE: We relentlessly respect and focus on our
employees, consumers, customers,
environment and communities.
TRUST: We empower our employees to make the best
decisions for our organization fostering
teamwork, focusing on speed, freedom to
succeed and accountability.
Sustainable Growth Strategy
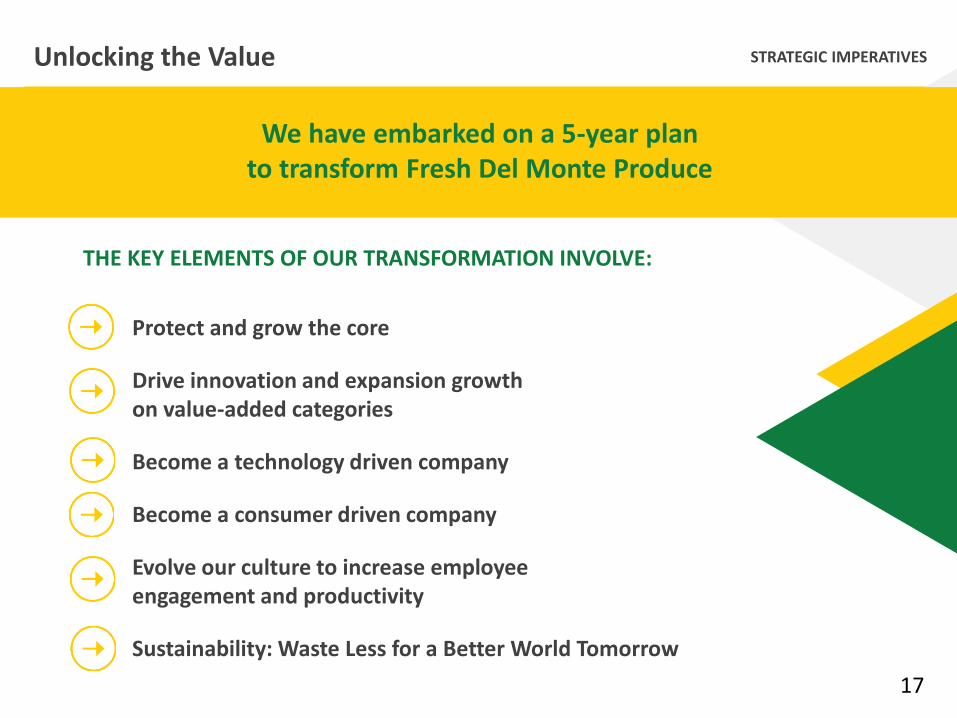
STRATEGIC IMPERATIVESUnlocking the Value
We have embarked on a 5-year plan to transform Fresh Del Monte Produce
Protect and grow the core
Drive innovation and expansion growth on value-added categories
Become a technology driven company
Become a consumer driven company
Evolve our culture to increase employee engagement and productivity
Sustainability: Waste Less for a Better World Tomorrow
THE KEY ELEMENTS OF OUR TRANSFORMATION INVOLVE:
17
UNLOCKING THE VALUE
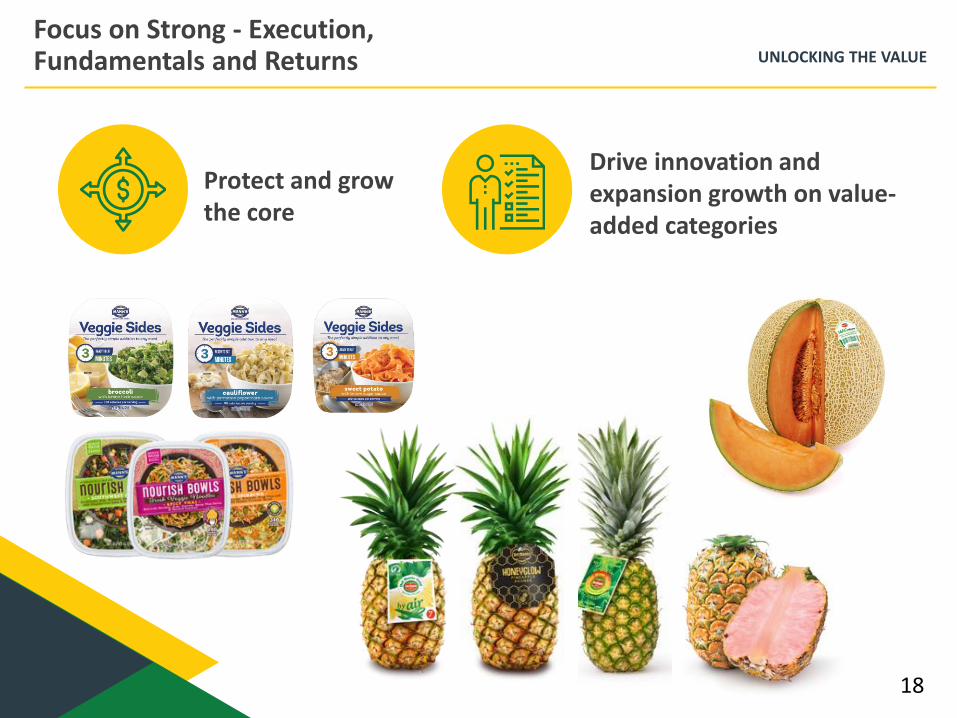
Focus on Strong - Execution, Fundamentals and Returns
Protect and grow the core
Drive innovation and expansion growth on value-added categories
18
19
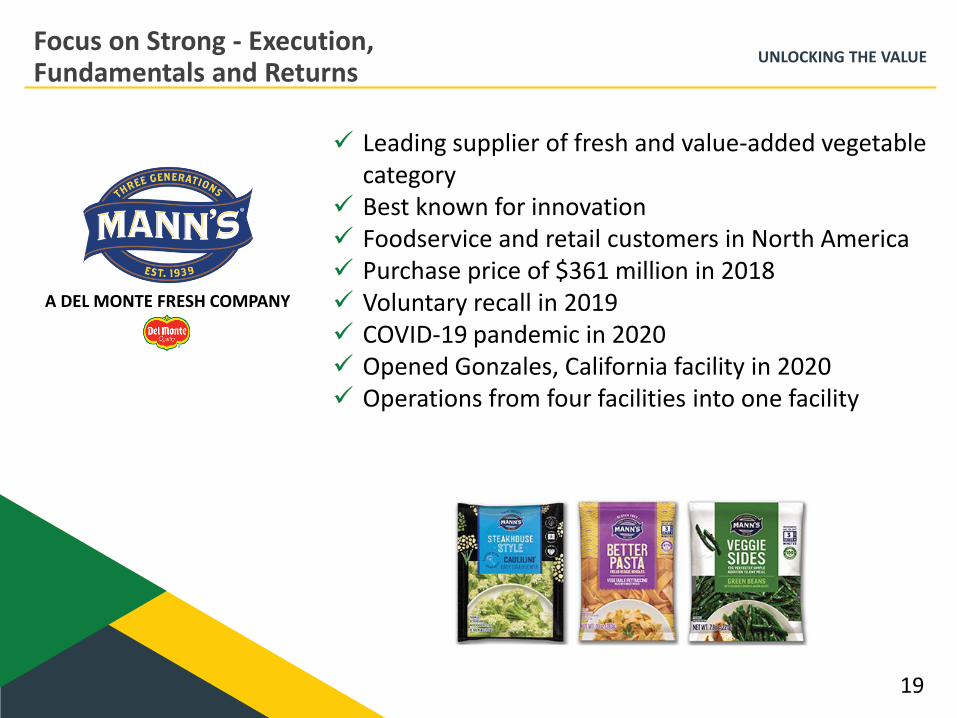
A DEL MONTE FRESH COMPANY
✓ Leading supplier of fresh and value-added vegetable category
✓ Best known for innovation✓ Foodservice and retail customers in North America✓ Purchase price of $361 million in 2018✓ Voluntary recall in 2019✓ COVID-19 pandemic in 2020✓ Opened Gonzales, California facility in 2020 ✓ Operations from four facilities into one facility
Focus on Strong - Execution, Fundamentals and Returns
UNLOCKING THE VALUE

UNLOCKING THE VALUEFocus on Leadership Area -Quality and Safety
To demonstrate compliance with international
regulations and standards on environmental
protection, food safety and social accountability, our
farms and our facilities are certified by one or more
of the following standards:
▪ Global GAP
▪ ISO 14001 and ISO 9001
▪ SCS Sustainably Grown
▪ OHSAS 18001
▪ SIFAV
▪ Rainforest Alliance
▪ Global GAP GRASP
▪ PrimusGFS
▪ FSSC / ISO 22000
▪ SQF
▪ BRC
▪ USFA / EU Organic
20
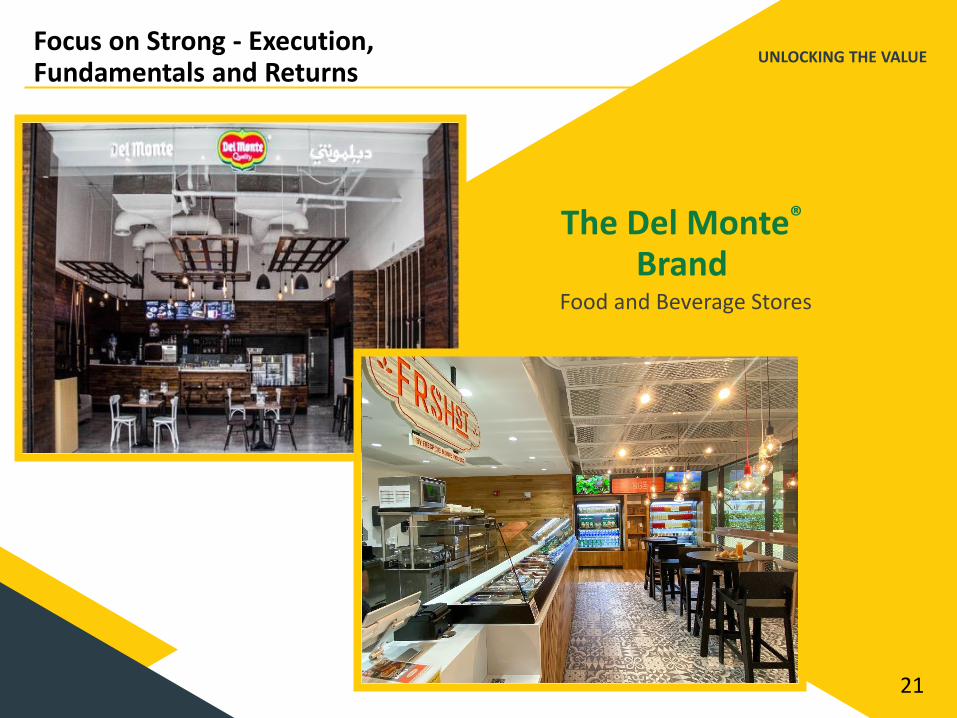
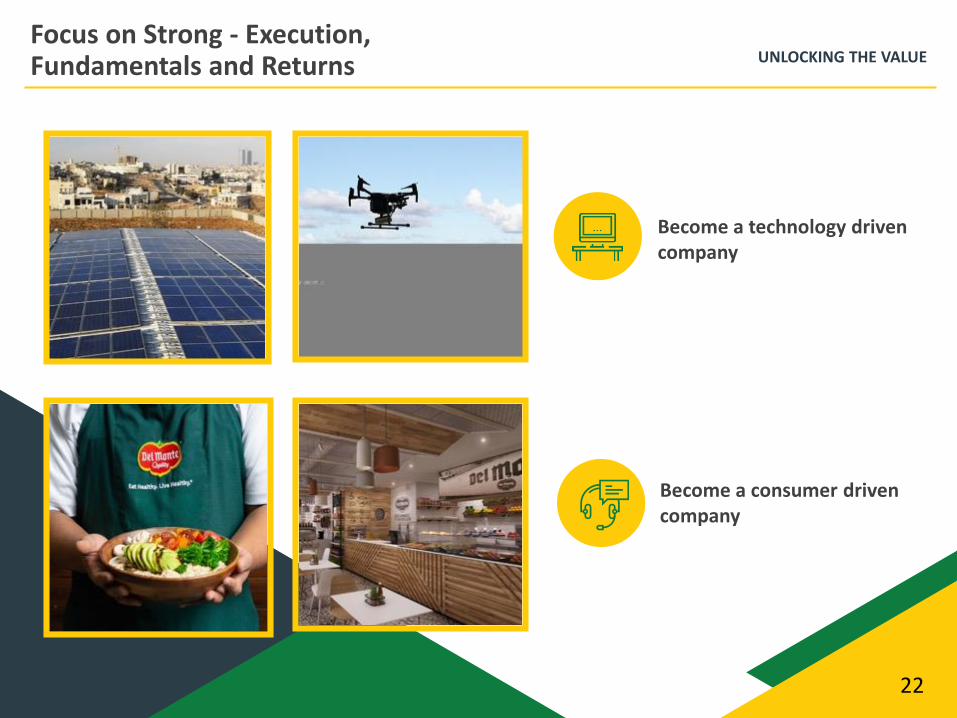
UNLOCKING THE VALUEFocus on Strong - Execution, Fundamentals and Returns
The Del Monte®
BrandFood and Beverage Stores
21
UNLOCKING THE VALUE
Become a technology driven company
Become a consumer driven company
Focus on Strong - Execution, Fundamentals and Returns
22
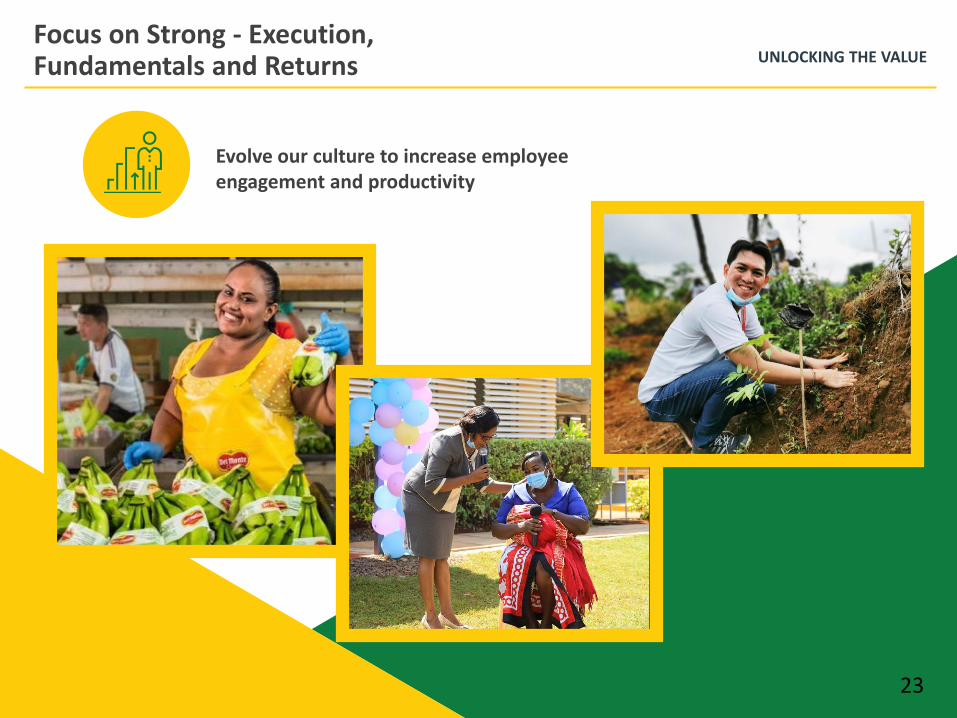
UNLOCKING THE VALUEFocus on Strong - Execution, Fundamentals and Returns
Evolve our culture to increase employee engagement and productivity
23
We strive to foster a culture of diversity and inclusion (“D&I”) so
all employees feel respected and no employee feels
discriminated against. We are proud of our diversity across our
organization and especially our leadership team, of which 25%
identifies as Hispanic, 17% identifies as Black and 25% identifies
as Middle Eastern. We embrace diversity throughout our
company as we have employees across six different generations
and many different backgrounds. In 2019, we launched an
internal diversity audit to better understand diversity, equity and
inclusion within our organization. We have adopted this audit
and are currently in the process of our second iteration. In 2021,
a formal council comprised of senior leadership will work to
connect our D&I efforts with our overall business strategy to
communicate our goals, develop mechanisms to achieve those
goals and track our progress. We believe a diverse workforce
fosters innovation and cultivates an environment of unique
perspectives. As a result, diversity and inclusion help us meet
the needs of our customers around the world.
Source: 2020 10-K
Diversity and Inclusion
Focus on Strong - Execution, Fundamentals and Returns
UNLOCKING THE VALUE
UNLOCKING THE VALUE
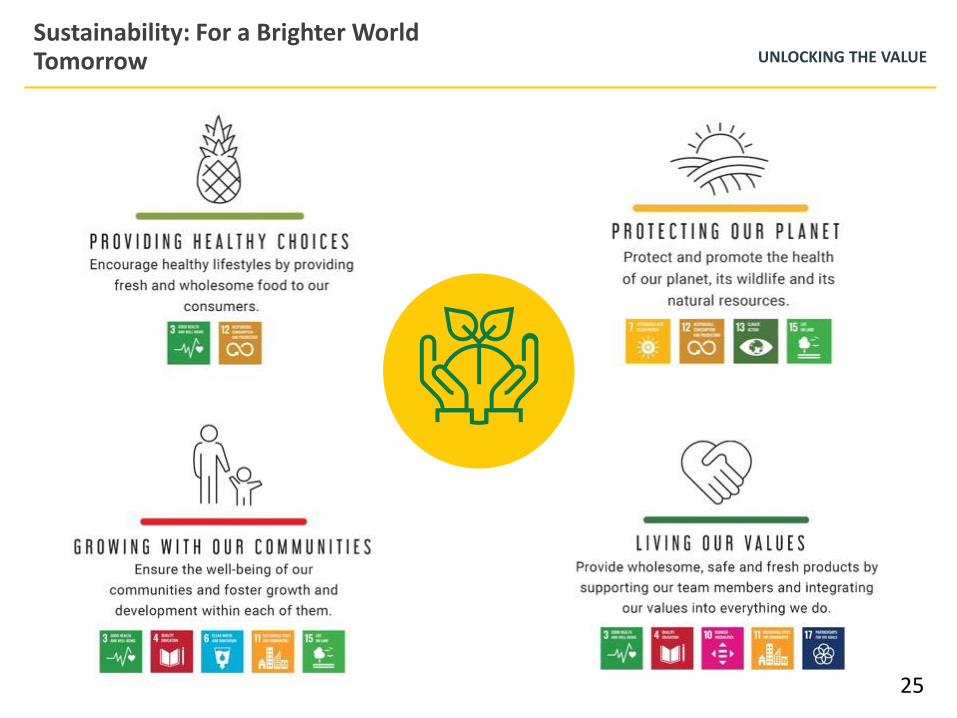
Sustainability: For a Brighter World Tomorrow
25
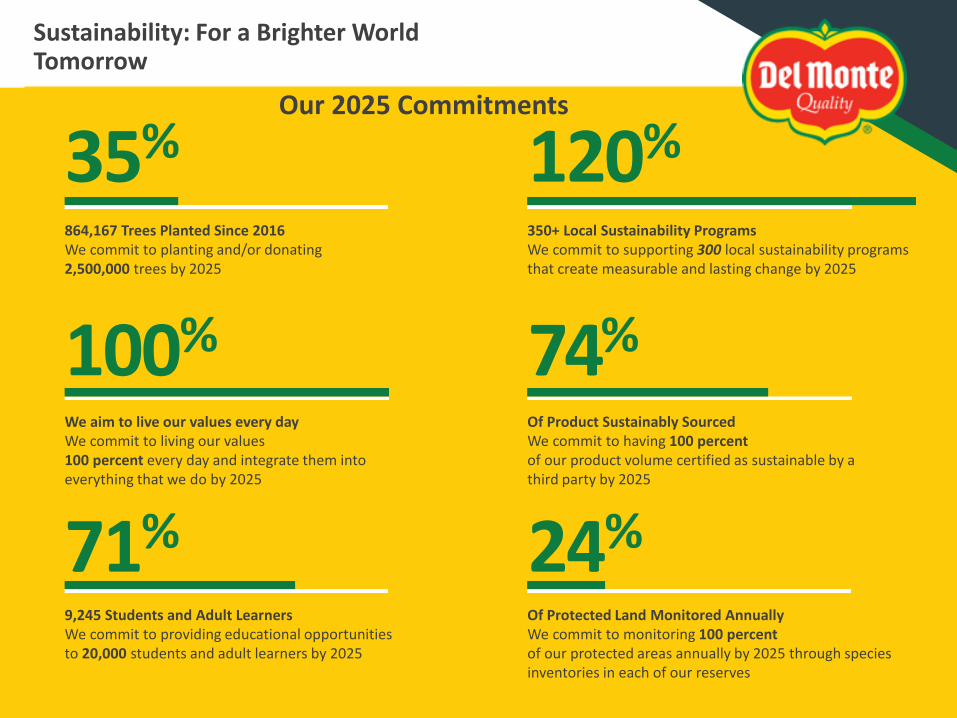
Our 2025 Commitments
35%
100%
120%
74%
71% 24%
864,167 Trees Planted Since 2016We commit to planting and/or donating2,500,000 trees by 2025
We aim to live our values every dayWe commit to living our values100 percent every day and integrate them into everything that we do by 2025
9,245 Students and Adult LearnersWe commit to providing educational opportunities to 20,000 students and adult learners by 2025
Of Protected Land Monitored AnnuallyWe commit to monitoring 100 percentof our protected areas annually by 2025 through species inventories in each of our reserves
Of Product Sustainably SourcedWe commit to having 100 percentof our product volume certified as sustainable by a third party by 2025
350+ Local Sustainability ProgramsWe commit to supporting 300 local sustainability programs that create measurable and lasting change by 2025
Sustainability: For a Brighter World Tomorrow
Sustainability: For a Brighter World Tomorrow
UNLOCKING THE VALUE
28
Sustainability: For a Brighter World Tomorrow

FinancialReview
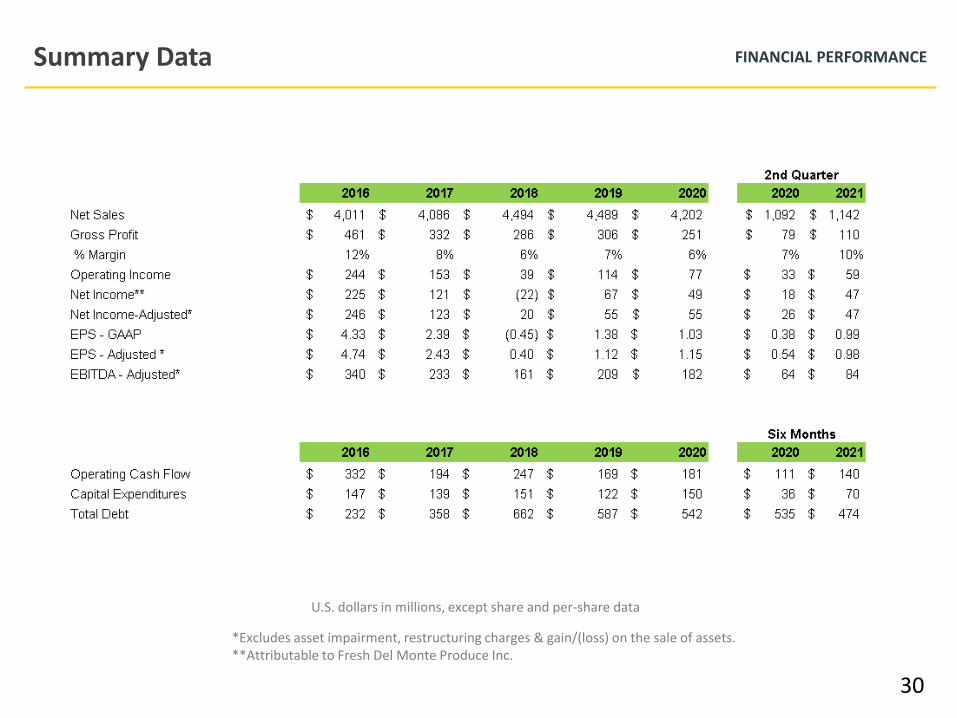
FINANCIAL PERFORMANCESummary Data
*Excludes asset impairment, restructuring charges & gain/(loss) on the sale of assets.**Attributable to Fresh Del Monte Produce Inc.
30
U.S. dollars in millions, except share and per-share data
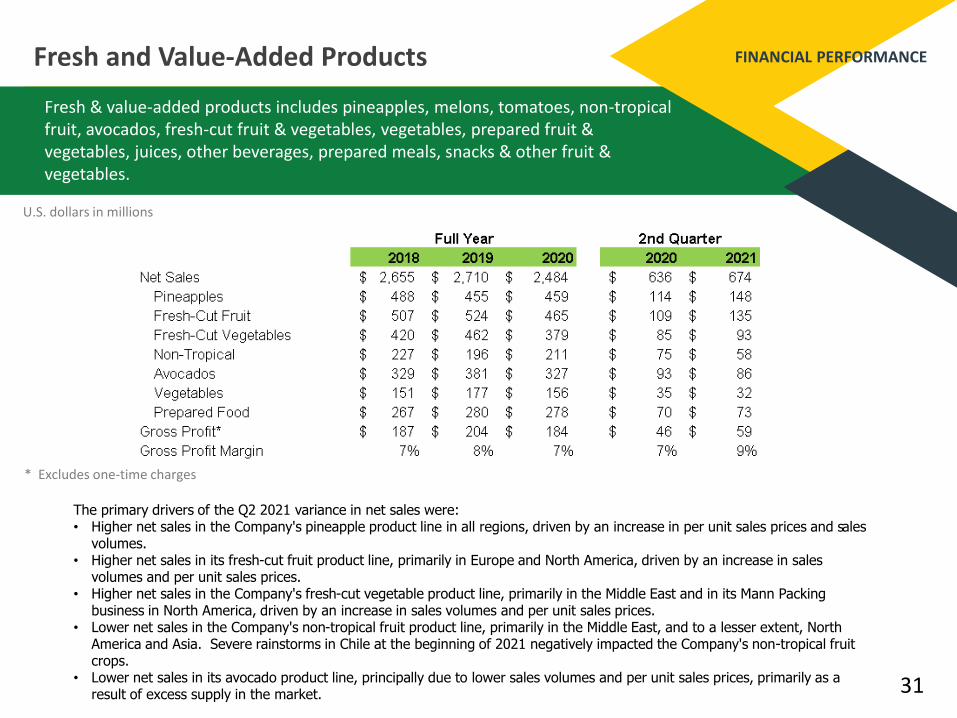
The primary drivers of the Q2 2021 variance in net sales were:• Higher net sales in the Company's pineapple product line in all regions, driven by an increase in per unit sales prices and sales
volumes.• Higher net sales in its fresh-cut fruit product line, primarily in Europe and North America, driven by an increase in sales
volumes and per unit sales prices.• Higher net sales in the Company's fresh-cut vegetable product line, primarily in the Middle East and in its Mann Packing
business in North America, driven by an increase in sales volumes and per unit sales prices.• Lower net sales in the Company's non-tropical fruit product line, primarily in the Middle East, and to a lesser extent, North
America and Asia. Severe rainstorms in Chile at the beginning of 2021 negatively impacted the Company's non-tropical fruit crops.
• Lower net sales in its avocado product line, principally due to lower sales volumes and per unit sales prices, primarily as aresult of excess supply in the market.
FINANCIAL PERFORMANCEFresh and Value-Added Products
Fresh & value-added products includes pineapples, melons, tomatoes, non-tropical fruit, avocados, fresh-cut fruit & vegetables, vegetables, prepared fruit & vegetables, juices, other beverages, prepared meals, snacks & other fruit & vegetables.
31
U.S. dollars in millions
* Excludes one-time charges
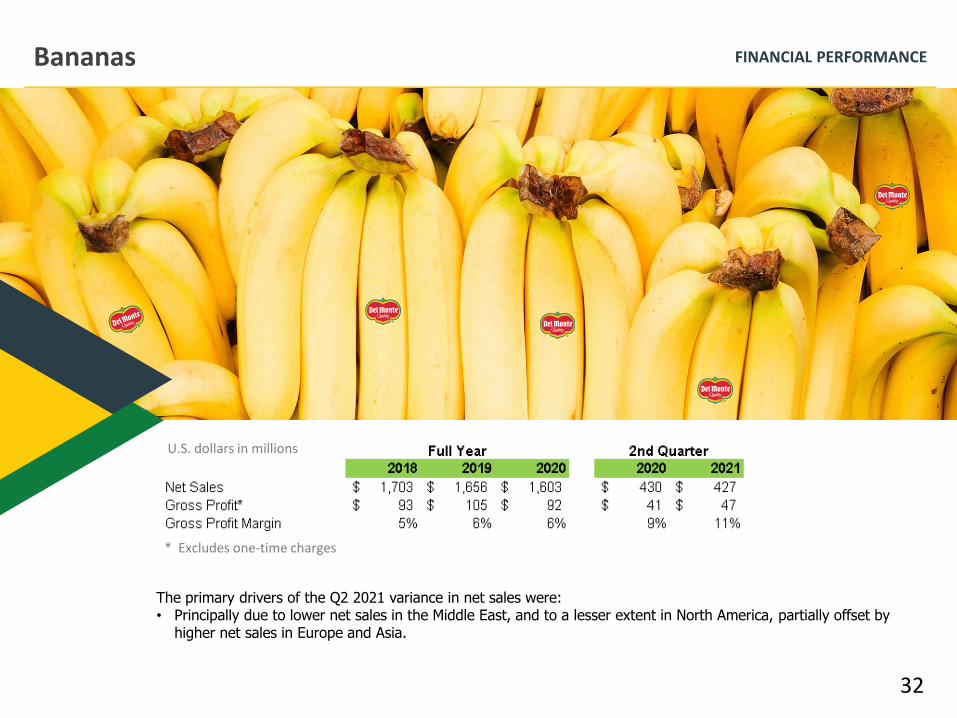
FINANCIAL PERFORMANCEBananas
32
U.S. dollars in millions
* Excludes one-time charges
The primary drivers of the Q2 2021 variance in net sales were:• Principally due to lower net sales in the Middle East, and to a lesser extent in North America, partially offset by
higher net sales in Europe and Asia.
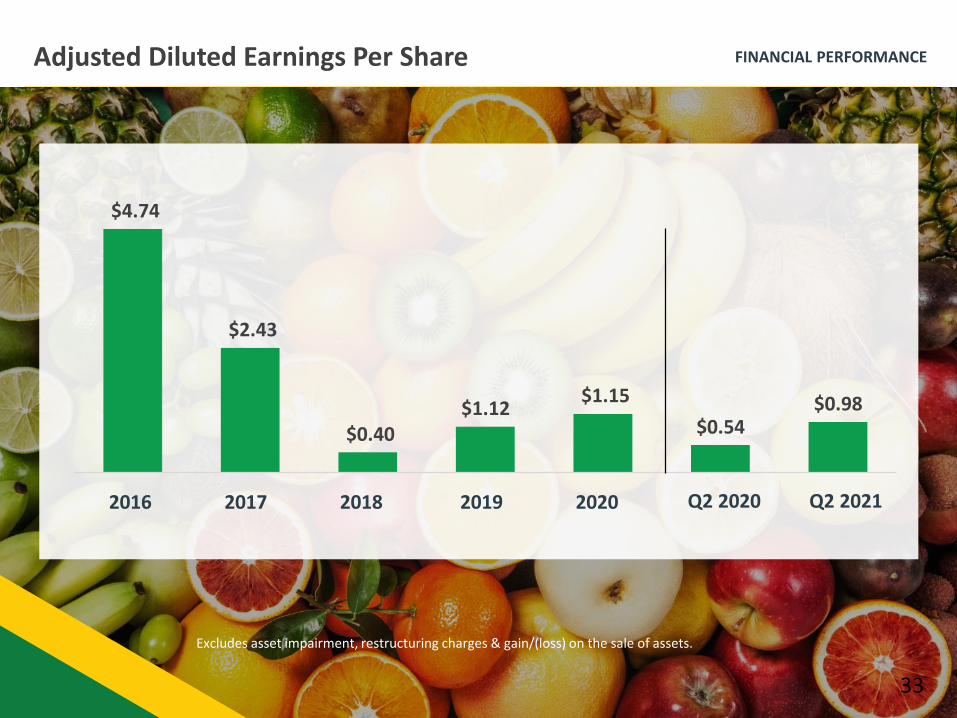
FINANCIAL PERFORMANCEAdjusted Diluted Earnings Per Share
$4.74
$2.43
$0.40 $1.12
$1.15
$0.54$0.98
Excludes asset impairment, restructuring charges & gain/(loss) on the sale of assets.
2016 2017 2018 2019 2020 Q2 2020 Q2 2021
33
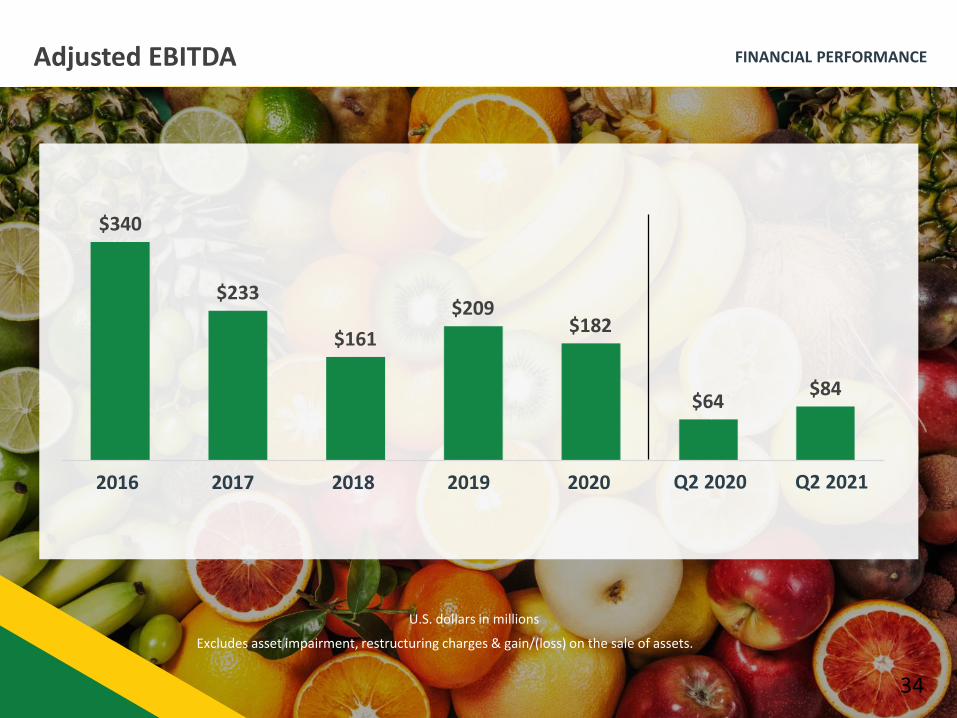
FINANCIAL PERFORMANCEAdjusted EBITDA
Excludes asset impairment, restructuring charges & gain/(loss) on the sale of assets.
$340
$233
$161
$209$182
$64$84
2016 2017 2018 2019 2020
34
Q2 2020 Q2 2021
U.S. dollars in millions
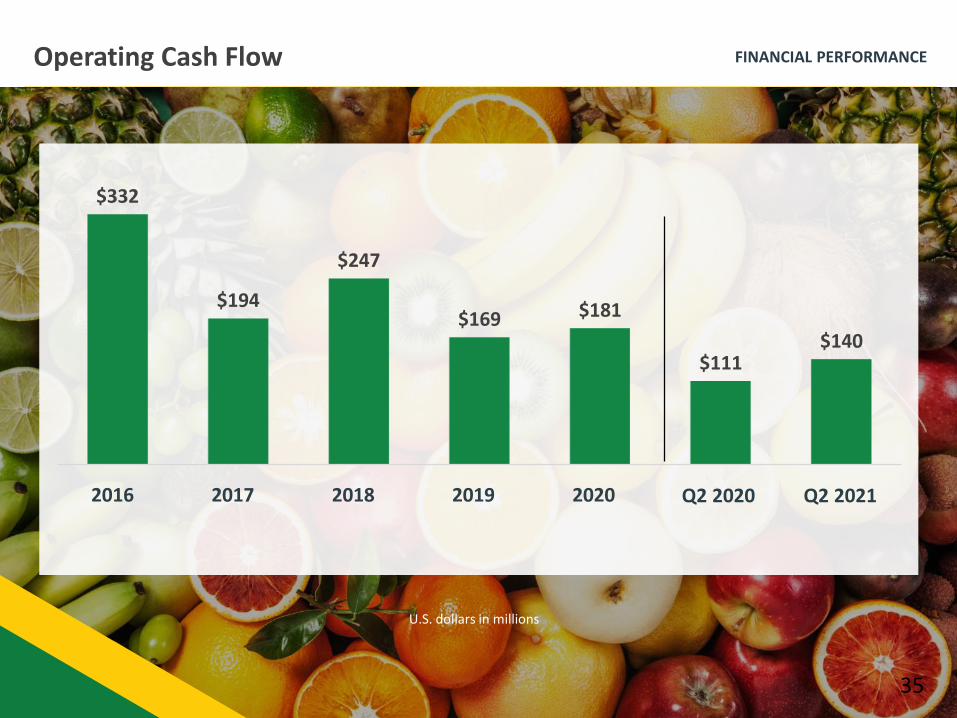
FINANCIAL PERFORMANCEOperating Cash Flow
$332
$194
$247
$169 $181
$111$140
35
2016 2017 2018 2019 2020 Q2 2020 Q2 2021
U.S. dollars in millions
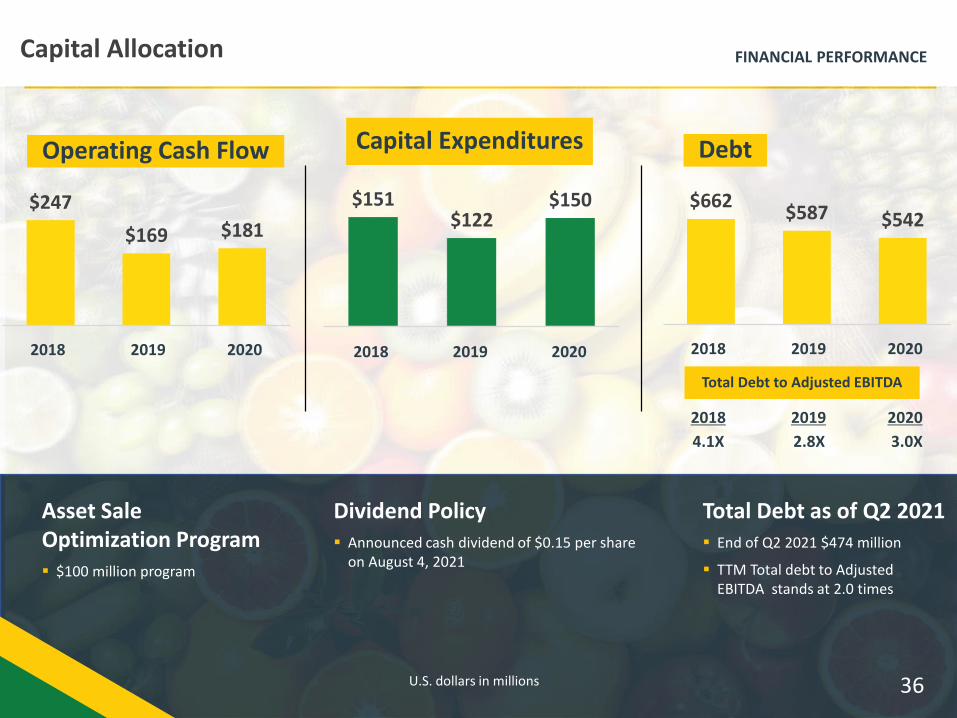
FINANCIAL PERFORMANCECapital Allocation
$151$122
$150
2018 2019 2020
$662$587 $542
2018 2019 2020
Debt
Total Debt as of Q2 2021▪ End of Q2 2021 $474 million
▪ TTM Total debt to Adjusted EBITDA stands at 2.0 times
Dividend Policy▪ Announced cash dividend of $0.15 per share
on August 4, 2021
Asset Sale Optimization Program▪ $100 million program
Capital Expenditures
36U.S. dollars in millions
$247
$169 $181
2018 2019 2020
Operating Cash Flow
4.1X 2.8X 3.0X
Total Debt to Adjusted EBITDA
2018 2019 2020
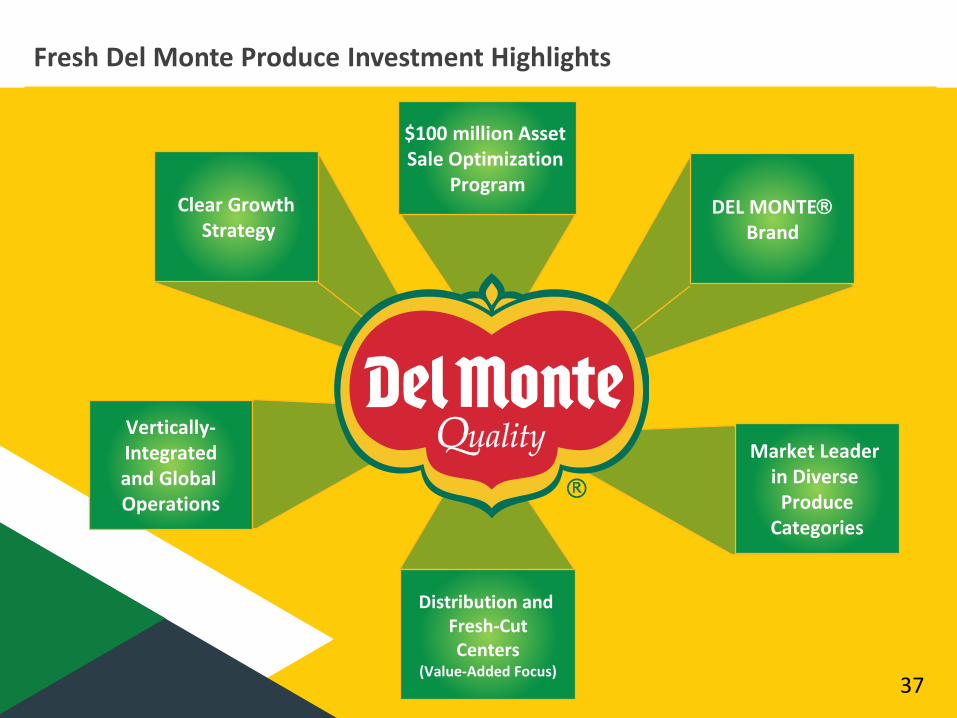
Fresh Del Monte Produce Investment Highlights
Vertically-Integratedand Global Operations
Clear GrowthStrategy
DEL MONTEBrand
Distribution and Fresh-CutCenters
(Value-Added Focus)
Market Leader in Diverse
ProduceCategories
37
$100 million Asset Sale Optimization
Program
Appendix
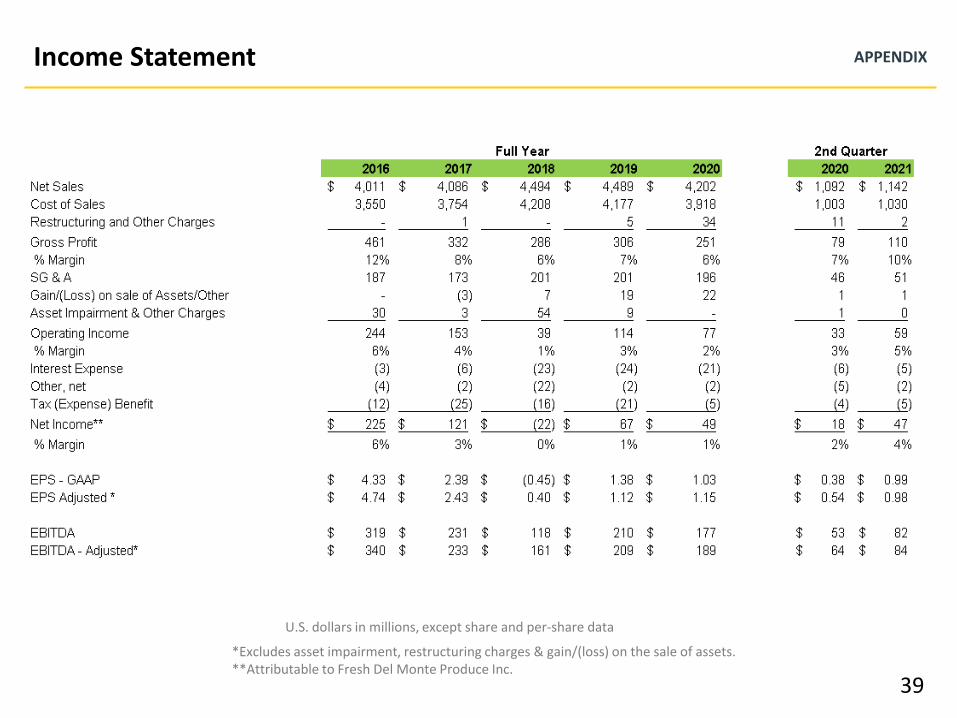
APPENDIXIncome Statement
39
U.S. dollars in millions, except share and per-share data
*Excludes asset impairment, restructuring charges & gain/(loss) on the sale of assets.**Attributable to Fresh Del Monte Produce Inc.
APPENDIXNon-GAAP Measures
40
The Company's results are determined in accordance with U.S. generally accepted accounting principles (GAAP). Certain information presented in this press release reflects adjustments to GAAP measures such as amounts related to restructuring, asset impairmentand other charges (credits), net, gain on disposal of property, plant and equipment, net, other product-related charges and certain other non-recurring items, if any. These adjustments result in non-GAAP financial measures and are referred to in this press release as Adjusted Gross profit, Adjusted Operating income, Adjusted FDP Net income, and Adjusted Diluted EPS. Management believes these adjustments provide a more comparable analysis of the underlying operating performance of the business.
This press release also includes non-GAAP measures such as EBITDA, Adjusted EBITDA, EBITDA margin, and Adjusted EBITDA margin. EBITDA is defined as net income attributable to Fresh Del Monte Produce Inc. excluding interest expense, net, provision for income taxes, depreciation and amortization, and share-based compensation expense. Adjusted EBITDA represents EBITDA with additional adjustments for non-recurring items. EBITDA margin represents EBITDA as a percentage of net sales, and adjusted EBITDA margin represents adjusted EBITDA as a percentage of net sales.
Adjusted Gross profit, Adjusted Operating income, Adjusted FDP Net income, and Adjusted EBITDA provide the Company with an understanding of the results from the primary operations of its business. The Company uses these metrics because management believes they provide more comparable measures to evaluate period-over-period operating performance since they exclude special items that are not indicative of the Company's core business or operations. These measures may be useful to an investor in evaluating the underlying operating performance of the Company's business because these measures:
1. Are used by investors to measure a company's comparable operating performance;2. Are financial measurements that are used by lenders and other parties to evaluate creditworthiness; and3. Are used by the Company's management for various purposes, including as measures of performance of its operating entities, as a
basis of strategic planning and forecasting, and in certain cases as a basis for incentive compensation.
Because all companies do not use identical calculations, the Company's presentation of these non-GAAP financial measures may notbe comparable to similarly titled measures used by other companies. Reconciliations of non-GAAP financial measures to the most directly comparable GAAP financial measures are provided in the financial tables that accompany this release.
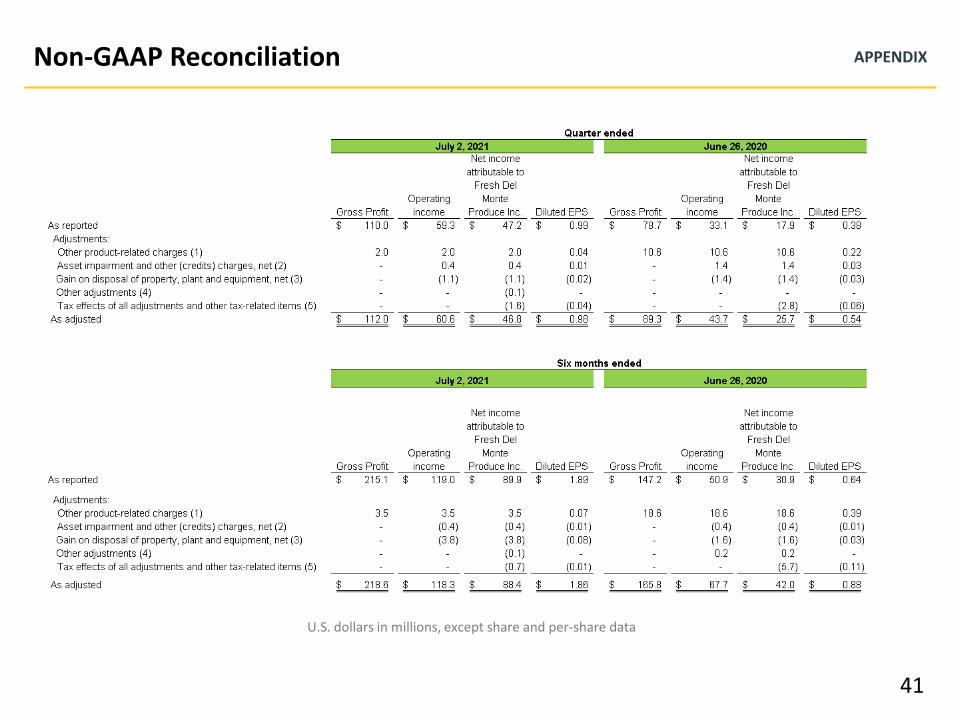
APPENDIXNon-GAAP Reconciliation
41
U.S. dollars in millions, except share and per-share data
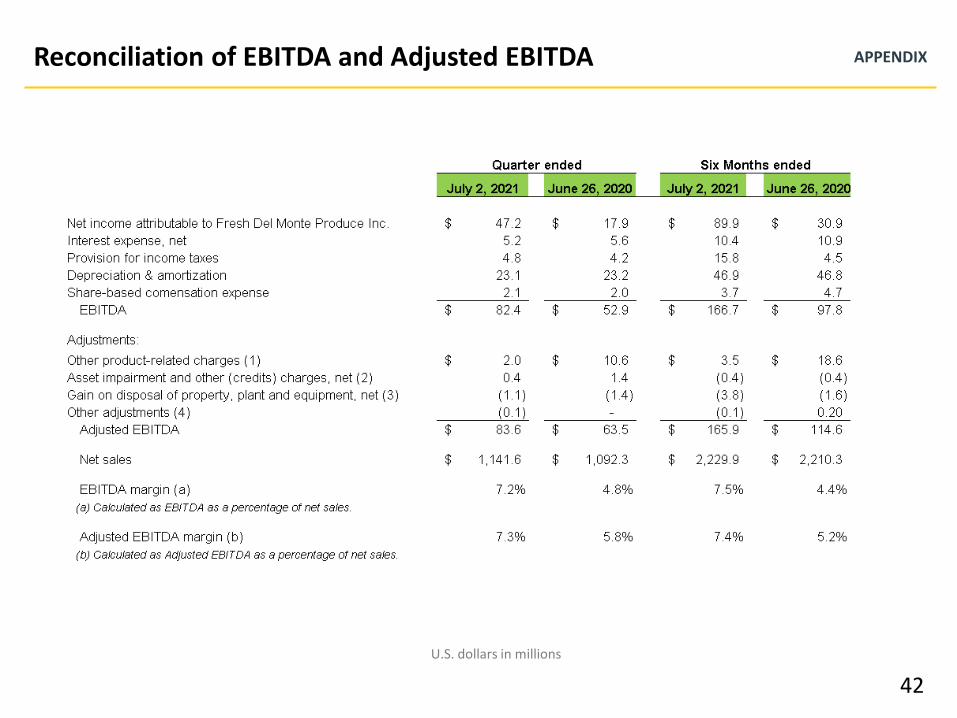
APPENDIXReconciliation of EBITDA and Adjusted EBITDA
42
U.S. dollars in millions
APPENDIX
43
(1) Other product-related charges for the quarter ended July 2, 2021 primarily included (1) a $1.3 million inventory write-off incurred in connection with the contracted sale of production equipment in the Middle East, which will be recognized in a future quarter (2) $0.4 million in additional repair expenses related to hurricane damage to the Company's Guatemala banana operations in the fourth quarter of 2020, and (3) $0.3 million in incremental inventory write-offs related to inclement weather in Chile which affected the Company's non-tropical fruit crops in the first quarter of 2021. For the six months ended July 2, 2021, other product-related charges primarily consisted of (1) $3.4 million of non-tropical fruit inventory write-offs due to inclement weather in Chile, (2) $1.4 million in repair expenses related to hurricane damage in Guatemala, and (3) a $1.3 million inventory write-off due to the contracted sale of certain production equipment. Partially offsetting these other product-related charges for the six months ended July 2, 2021 was a $2.5 million insurance recovery associated with the Guatemala hurricane damage. Other product-related charges for the quarter and six months ended June 26, 2020 primarily related to inventory write-offs resulting from lower demand for certain of the Company's products due to the COVID-19 pandemic, principally related to the fresh and value-added products segment. The COVID-19 pandemic led to volatile supply and demand conditions across the Company's key global markets in the first six months of 2020 which negatively affected the pricing and demand for its products, including within its foodservice distribution channel.
(2) Asset impairment and other charges (credits), net for the quarter ended July 2, 2021 primarily related to severance expenses incurred in connection with the exit from a facility in Europe. Asset impairment and other charges (credits), net for the six months ended July 2, 2021 also included a $0.8 million insurance recovery associated with damages to fixed assets in Guatemala caused by two hurricanes in the fourth quarter of 2020. Asset impairment and other charges (credits), net for the six months ended June 26, 2020 primarily consisted of (1) a $6.0 million insurance recovery related to the 2019 voluntary product recall, (2) a $2.0 million charge relating to a settlement with the California Air Resource Board (refer to the Form 10-K for the year ended January 1, 2021 for further information on this matter), (3) $2.1 million in impairments of property, plant, and equipment associated with production facilities in North America and Europe, (4) $0.7 million in severance expense related to the reorganization of the North America sales and marketing function, and (5) $0.7 million in asset impairment charges associated with low-yielding banana plants in the Philippines.
(3) Gain on disposal of property, plant and equipment, net for the quarter ended July 2, 2021, primarily related to a $1.1 million gain on the sale of vacant land in the Middle East. For the six months ended July 2, 2021, gain on disposal of property, plant and equipment, net also included a $2.4 million gain on the sale of a refrigerated vessel. Gain on disposal of property, plant and equipment, net for the six months ended June 26, 2020 primarily related to gains on the sale of surplus land in Chile and marine equipment.
(4) Other adjustments for the quarter and six months ended July 2, 2021, primarily related to the portions of the gain on disposal of property, plant, and equipment, net and other product-related charges which were attributable to a minority interest partner, reflected in net income (loss) attributable to redeemable and noncontrolling interests. Other adjustments for the six months ended June 26, 2020 related to estimated trade receivable credit losses, reflected in selling, general, and administrative expenses, primarily associated with the Company's foodservice customer base as a direct result of the COVID-19 pandemic.
(5) Tax effects are calculated in accordance with ASC 740, Income Taxes, using the same methodology as the GAAP provision of income taxes. Income tax effects of non-GAAP adjustments are calculated based on the applicable statutory tax rate for each jurisdiction in which such charges were incurred, except for those items which are non-taxable for which the tax provision (benefit) was calculated at 0%. Certain non-GAAP adjustments were subject to valuation allowances and therefore were calculated at 0%. The quarter and six months ended July 2, 2021 included a $0.8 million tax benefit associated with the Coronavirus Aid, Relief, and Economic Security (CARES) Act, while the six months ended June 26, 2020 included a $1.7 million CARES Act tax benefit.
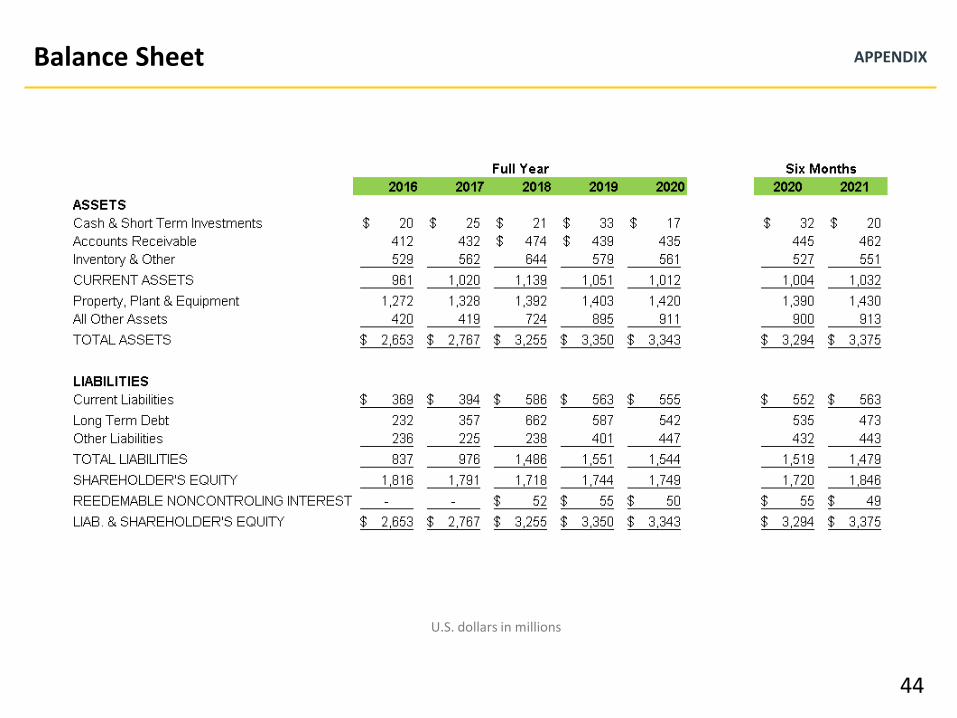
APPENDIXBalance Sheet
44
U.S. dollars in millions
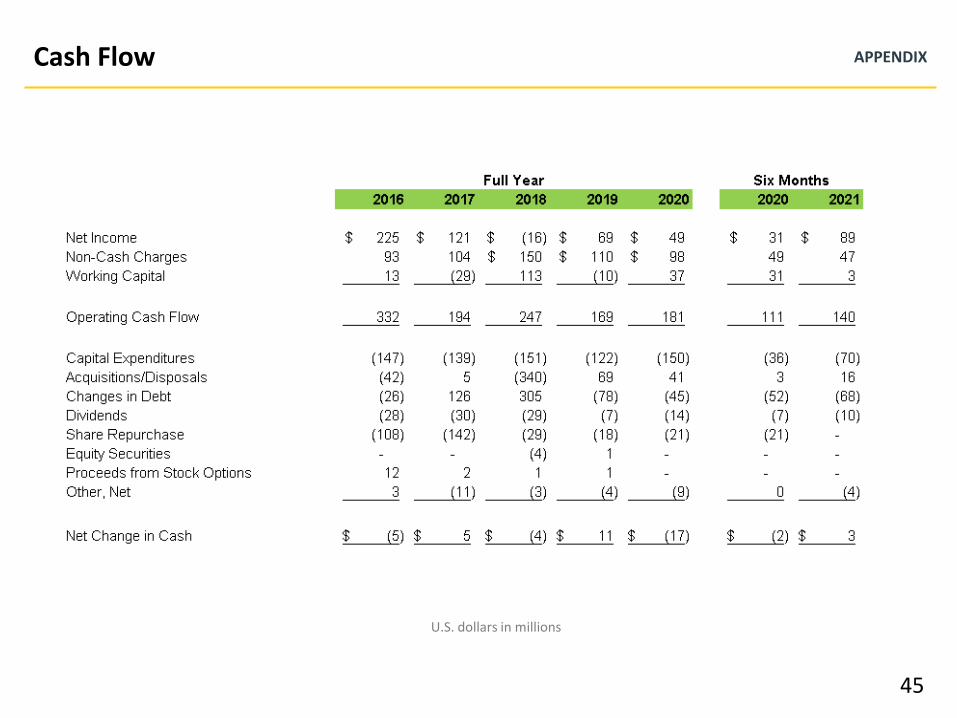
APPENDIXCash Flow
45
U.S. dollars in millions