innovating in science and engineering or cashing in on ... files/16-067_3d306ef8-09a1-42b3... ·...
TRANSCRIPT
Innovating in Science and Engineering or "Cashing In" on Wall Street? Evidence on Elite STEM Talent Pian Shu
Working Paper 16-067
Working Paper 16-067
Copyright © 2015, 2016 by Pian Shu
Working papers are in draft form. This working paper is distributed for purposes of comment and discussion only. It may not be reproduced without permission of the copyright holder. Copies of working papers are available from the author.
Innovating in Science and Engineering or “Cashing In" on Wall Street? Evidence on Elite STEM Talent
Pian Shu Harvard Business School
Innovating in Science and Engineering or “Cashing In” on Wall Street?
Evidence on Elite STEM Talent
Pian Shu∗
November, 2016
∗Harvard Business School, Harvard University, Boston, MA 02163. Email: [email protected] paper was previously circulated under the title: “Are the ’Best and Brightest’ Going into Fi-nance? Skill Development and Career Choice of MIT Graduates.” I have benefited from the helpfulcomments and suggestions of Daron Acemoglu, David Autor, David Dorn, JB Doyle, Shane Green-stein, Robin Greenwood, Gordon Hanson, Victoria Ivashina, Ben Jones, Steven Kaplan, LawrenceKatz, Josh Lerner, John S. Reed, Antoinette Schoar, Erin Scott, Paula Stephan, Scott Stern, JialanWang, Heidi Williams, and seminar participants at numerous universities and conferences. I amgrateful to Suzanne Berger, Maggy Bruzelius, Claude Canizares, Daniel Hastings, Ke-wei Huang,Elizabeth Hicks, Deborah Liverman, Brendon Puffer, Joseph Recchio, Ri Romano, Stuart Schmill,Lydia Snover, Ingrid Vargas, and especially Gregory Harris for help with data collection. KristianaLaugen, Eamon O’Brien, Rohan Thavarajah, and Yue Wang provided excellent research assistance.This project was supported by the Kauffman Foundation and the Division of Research at HarvardBusiness School. All errors are my own.
Abstract
Using data on MIT bachelor’s graduates from 1994 to 2012, this paper empiricallyexamines the extent to which the inflow of elite talent into the financial industry affectsthe supply of innovators in science and engineering (S&E). I first show that finance doesnot systematically attract those who are best prepared at college graduation to innovatein S&E sectors. Among graduates who majored in S&E, cumulative GPA strongly andpositively predicts long-term patenting; this result is robust to controlling for choices ofmajor and career. In contrast, GPA negatively predicts the probability of taking a firstjob in finance after college. There is suggestive evidence that S&E and finance valuedifferent sets of skills: innovating in S&E calls for in-depth knowledge and/or interestin a specific subject area, whereas finance tends to value a combination of generalanalytic skills and social skills over academic specialization. I then provide evidencethat anticipated career incentives influence students’ acquisition of S&E human capitalduring college. The 2008–09 financial crisis, which substantially reduced the availabilityof jobs in finance and led to a worsening labor market in general, prompted somestudents to major in S&E instead of management or economics and/or to improvetheir academic performance. This response to the shock is driven by students withbelow-average academic credentials who were freshmen at the peak of the crisis.
1 Introduction
Finance is among the most popular career destinations for top U.S. college graduates.
At elite universities like Massachusetts Institute of Technology (MIT), Harvard, Yale, and
Princeton, finance consistently attracted between 20 and 30 percent of graduating seniors
who entered the labor market prior to the recent financial crisis (Hastings et al., 2010;
Rampell, 2011).1 The inflow of top talent into finance may not be optimal for long-term
economic growth if talented individuals are forgoing alternative career paths that offer lower
private returns but produce higher social returns (Baumol, 1990; Murphy et al., 1991). The
high relative wage in finance among top talent is well documented in the literature,2 but the
social returns of jobs in finance remain debatable and may not justify the private returns.3
In contrast, there is a longstanding consensus that scientific and technological inno-
vations generate large and positive externalities (Nelson, 1959; Arrow, 1962; Jones, 2005;
Bloom et al., 2013), and that a nation’s supply of scientists and engineers is critical to its
innovation and growth (Atkinson, 1990; Murphy et al., 1991; Stephan, 1996; Goolsbee, 1998;
Romer, 2000). The degree to which finance may divert talent from innovating in science
and engineering (S&E) thus has key implications for productivity. The possibility of such a
substitution has been a worry widely shared in the popular press by prominent economists
1This calculation excludes graduating seniors who entered graduate school immediately aftercollege.
2Oyer (2008) and Goldin and Katz (2008) find that, among Stanford MBA graduates andHarvard bachelor’s graduates, those who work in finance earn substantially more than the rest.Kaplan and Rauh (2010) show that in 2004 the top 25 hedge-fund managers jointly earned morethan all the CEOs of Standard & Poor’s 500 companies combined. Philippon and Reshef (2012)find that the wage gap between financiers and engineers, conditional on earning a post-graduatedegree, grew from less than 5 percent to over 30 percent between 1980 and the early 2000s. Belland Van Reenen (2014) show that finance accounted for the majority of the increase in the top1-percent earners’ share of the UK wage bill since 1999.
3The theoretical literature treats moral hazard as an inherent feature of the financial sector, sincethe job content is complex and effort is difficult to monitor. Myerson (2012), Axelson and Bond(2015), and Biais and Landier (2015) use overlapping generation models to investigate how moralhazard in finance affects compensation structure, credit cycle, job assignment, and skill acquisition.Biais et al. (2015) and Bolton et al. (2016) argue that the equilibrium size of the financial sectorcould be larger than optimal due to excess entry of managers or dealers who extract informationalrents.
1
and policymakers (e.g., Romer 2009; Shiller 2013; Mullainathan 2015; Obama 2016) and has
motivated research on optimal taxation policy (Philippon, 2010; Lockwood et al., 2016). In
2009 the then-chair of the Council of Economic Advisers, Christina Romer, cautioned in a
policy speech that “some of our brightest minds make small fortunes arranging the deals,
rather than pursuing potentially more socially valuable careers in such fields as science,
medicine, and education.” President Barack Obama echoes this sentiment in an October
2016 essay published in The Economist, pointing out that “[t]oo many potential physicists
and engineers spend their careers shifting money around in the financial sector, instead of
applying their talents to innovating in the real economy.”
This paper empirically examines the extent to which the inflow of top talent into finance
influences the supply of innovators in S&E. I focus on elite college graduates instead of
the general population because they are disproportionately innovative.4 Conceptually, such
influence could occur via two possible channels. First, finance may directly reward skills that
are critical for innovating in S&E.5 A basic Roy model would predict that, if the returns to
innovation skills are higher in finance than in S&E sectors, the most innovative individuals
would self-select into finance. This scenario would be particularly detrimental to the produc-
tion of innovations in S&E, since star scientists and engineers generate a disproportionately
large fraction of knowledge production and spillovers (Cole and Cole, 1972; Azoulay et al.,
2010; Waldinger, 2010; Oettl, 2012). Alternatively, to the extent that finance values those
skills less and that skill development is endogenous, the lure of finance could reduce talented
students’ incentives to develop the skills that are valuable for innovating in S&E.
I use detailed data on MIT bachelor’s graduates to investigate the intensity of each
4Bell et al. (2016) find that graduates of the ten most inventive U.S. colleges (defined as thosewhose 1999–2012 graduates were awarded the most U.S. patents between 1996 and 2014) accountfor only 3.7% of U.S. college enrollments but 15% of citation-weighted patents. They are more thantwice as likely to become inventors by age 30 as graduates of the ten next-most inventive collegesand 28 times as likely to do so as the average U.S. resident.
5Philippon and Reshef (2012) and Kirilenko and Lo (2013) document the growing complexity oftasks in finance and the recent rise of algorithm trading, indicating the increasing value of analyticaland quantitative skills in finance.
2
channel. Although my sample is highly selective, it is particularly suitable for my research
question since MIT graduates represent some of the best S&E talent and have made sub-
stantial contributions to national and local economies via innovation and entrepreneurship
(Roberts and Eesley, 2009; Roberts et al., 2015).6 I begin by showing that, at MIT, finance
does not systematically attract those who are best prepared at college graduation to innovate
in S&E sectors. I find that the college grade-point average (GPA) of S&E majors positively
and significantly predicts post-college inventive output but negatively predicts the probabil-
ity of entering finance. Among S&E majors in the classes of 1994–2008, and controlling for
cohort, major, and demographics, a one-standard-deviation increase in GPA is on average
associated with 28-percent, 40-percent, and 33-percent increases in, respectively, the prob-
ability of becoming an inventor after college, the number of patents produced after college,
and the number of citations received for those patents. These relationships are robust to
controlling for selection into careers and graduate programs. In contrast, among S&E majors
in the classes of 2006–2008, a one-standard-deviation increase in college GPA is associated
with a 44-percent (or 3.9-percentage-point) decrease in the probability of entering finance
after graduation.7 There is negative selection into both quantitative jobs (such as trading
and quantitative analysis) and non-quantitative jobs (such as investment banking). College
GPA positively and significantly predicts the probability of entering S&E sectors, which is
driven by selection into S&E graduate programs.
The positive link between college academic performance and post-college inventive output
is consistent with the observation that the production of innovations is highly cumulative
and typically requires specialized knowledge and expertise (Jones, 2009, 2010).8 I further
6Roberts et al. (2015) estimate that companies founded by MIT alumni generate annual globalrevenues of $1.9 trillion and employ 4.6 million individuals worldwide.
7Around 8.8 percent of S&E majors from the classes of 2006–2008 entered finance immediatelyafter graduation.
8That knowledge generates more new knowledge is a central observation of macroeconomictheory on endogenous growth (Romer, 1990; Grossman and Helpman, 1991; Aghion and Howitt,1992; Jones, 1995). Furman and Stern (2011), Williams (2013), and Galasso and Schankerman(2015) provide empirical evidence that institutional forces that help transfer or protect knowledge,such as biological resource centers and intellectual-property protection, can have significant positive
3
find that, across grades in each year of college, grades in senior year—when students take
the most advanced courses in their field—have the strongest and most significant correlation
with future patenting.
By contrast to those who specialize academically, finance attracts individuals who pursue
diverse activities in college, and differences in skill development between the two groups are
already evident at college entry. Compared to those who pursue S&E graduate degrees
or take a first job in S&E industries at college graduation, those who enter finance earn
significantly lower grades in each year of college— the difference is largest in senior year—and
take fewer courses during their first two years. They are also more likely to join a Greek
society or a varsity sports team, both time-consuming activities that students typically decide
to pursue on arrival at MIT.9 Graduates’ self-reported assessments of skill improvement
between college entry and college graduation reveal that those who enter finance report
significantly less improvement in an array of critical-thinking and scientific-reasoning skills,
especially in their ability to acquire in-depth knowledge of a field.
The results thus far indicate that, for elite talent, the returns to academic specialization
in S&E subject areas are lower in finance than in S&E sectors, which could be driven by both
skill demand in finance and top students’ tastes for working in S&E.10 To the extent that
finance may reward specialized S&E human capital less, it is possible that the prospect of a
career in finance could discourage talented students from majoring in S&E and/or investing
in coursework during college. The 2008–09 financial crisis, which drastically reduced job
prospects in finance and led to the Great Recession, provides an opportunity to examine
whether MIT students’ skill-development paths are sensitive to sudden changes in anticipated
career incentives. I find that members of the class of 2012, who were freshmen at the peak
effects (in the case of transferring) or negative effects (in the case of protection) on follow-oninnovations.
9Rush at MIT takes place in the fall of freshman year.10Stern (2004) finds that postdoctoral biologists are willing to forgo better compensation for
opportunities to perform independent research. See also Roach and Sauermann (2010) and Agarwaland Ohyama (2012) for evidence on the sorting of S&E doctoral candidates into academia versusindustry.
4
of the crisis, are more likely to major in S&E and less likely to major in management or
economics than the preceding cohorts. However, those whose choices of major are sensitive to
the shock—between 3 and 4 percent of the cohort—have below-average academic credentials
at college entry. Conditional on majoring in S&E, the class of 2012 also earned better grades
on average, a phenomenon that is primarily driven by a large improvement in grades at the
bottom of the grade distribution. There is no evidence that the crisis affected the choices
of major or academic performance of the 2010 and 2011 cohorts, who were juniors and
sophomores at the peak of the crisis.11
In the last part of the empirical analysis, I show that my findings about self-selection
extend to other samples of top S&E talent. In particular, I hand-collect data on the career
paths of 462 graduates from 82 universities using publicly available lists of top performers on
the William Lowell Putnam Mathematical Competition. Within this sample of talented math
students, I find that outcomes for MIT students do not differ significantly from outcomes for
other students. I also find that the competition winners are significantly less likely to work
in finance and more likely to work in academia or research-focused positions.
My findings suggest that, without taking into account both the investment in human
capital required to innovate and the skill-development choices of elite talent, discussions of
talent allocation may overstate the extent to which finance diverts the most skilled S&E
graduates away from innovating in S&E. To the extent that such diversions exist, they are
more likely to occur at college entry than at college graduation.
This study contributes to the literature on the labor supply of engineers and scientists. In
contrast to the large body of evidence on individuals’ decisions to pursue a bachelor’s degree
in S&E (e.g., Freeman, 1975a,b; Ryoo and Rosen, 2004; Stinebrickner and Stinebrickner,
2014; Arcidiacono et al., 2016), relatively little is known about the career choices of S&E
degree-earners. This paper provides new evidence on this topic. Recent work uses population
11These results are consistent with Wiswall and Zafar (2014), who find that choices of majormade by students at an earlier stage of college are more responsive to changes in future earnings,and that those with higher abilities have stronger preferences.
5
data to study selection into finance (Philippon and Reshef, 2012; Celerier and Vallee, 2015;
Bohm et al., 2015) and characteristics of inventors (Aghion et al., 2016; Bell et al., 2016).
This study relates to both literatures but with a distinct focus on top talent.
Section 2 of this paper describes the data. Section 3 presents the main results on the re-
lationships among academic achievement, future patenting, and selection into initial careers.
Section 4 provides additional evidence using more detailed data on skill development during
college. Section 5 analyzes changes in students’ skill development after the financial crisis.
Section 6 examines the career paths of the top performers on the Putnam Competition.
Section 7 concludes.
2 Data and Descriptive Statistics
I collect administrative and survey data from MIT about bachelor’s graduates between
1994 and 2012 and observe such demographics as gender, birth year, ethnicity/nationality,
high-school location, and financial aid received during senior year. I also observe major(s) at
graduation and cumulative GPA in college. I exclude transfer students12 from my analysis
and use a graduate’s class year, as self-reported to the Alumni Association, to determine his
or her cohort.13
2.1 Long-term inventive output
I match MIT graduates to patent-inventor records in the U.S. Patent and Inventor
Database, which includes all USPTO patents granted between 1976 and March 2013.14 Ap-
pendix A.1 discusses the specifics and robustness of my matching procedure, which uses
the graduates’ names, locations, and employers (when available) and a Bayesian matching
12Transfer students make up around 2.7% of the classes of 1994–2012.13The self-reported cohort is typically based on the year of college entry and occasionally differs
from the graduation-year cohort.14The data can be downloaded at https://github.com/funginstitute/downloads. See Li et al.
(2014) for a data description.
6
algorithm similar to the methodology developed by Torvik et al. (2005) and Smalheiser
and Torvik (2009). For each graduate, I construct three variables: whether the graduate
becomes an inventor (defined as having been granted at least one utility patent since college
graduation), how many utility patents he or she has been granted since graduation, and how
many citations he or she has received for those patents.15
Table 1 reports the average inventive output of the classes of 1994–2008. Given patent ap-
plications’ long processing time—close to three years, on average (Lerner and Seru, 2015)—I
exclude the younger cohorts since they have had little time to be granted patents.16 Among
graduates in the classes of 1994–2008, those who majored in S&E (87.5% of all majors) are
much more inventive than those who did not major in S&E.: around 13.4% of the S&E
majors but only 3% of the non-S&E majors become inventors. An average S&E major from
the classes of 1994–2008 has been granted 0.57 patents and received 2.23 citations between
college graduation and March 2013. The average inventor who majored in S&E has been
granted 4.24 patents and received 16.7 citations.
Bell et al. (2016) find that 5.6% of graduates of the ten most inventive U.S. colleges
(defined as those whose 1999–2012 graduates were awarded the most U.S. patents between
1996 and 2014) have been awarded a patent by age 30. I find comparable but slightly higher
rates among MIT graduates: 7.2% of S&E majors in the classes of 1994–2008 (and 6.5% of
all majors) have a patent by age 30.
2.2 Selection into sectors
For the classes of 2006 to 2008, I identify the sector that a graduate enters immediately
after college using the Graduating Student Surveys, which are administered to students in
the spring of senior year by Career Services.17 By using the cohorts that graduated in 2008
15I exclude patents applied for before college graduation, which are extremely rare.16Only nine individuals in the classes of 2009–2012 had been granted a patent by March 2013.17MIT grants degrees in February, June, and September; only June graduates, who represent the
vast majority, are sent Graduating Student Surveys. Individual-level data with identifiers that canbe linked to other administrative data are not available for the earlier cohorts.
7
and earlier, I study selection into finance before the financial crisis, when the sector was
at its largest. Using the self-reported initial career outcome (intended graduate degree or
future employer), I construct four indicators of initial sectors: (1) S&E graduate programs;
(2) S&E industries (e.g., software, manufacturing, life sciences, and energy); (3) finance; and
(4) other.18 I consider a graduate to enter an S&E sector if he or she pursues graduate study
in science or engineering or employment in an S&E industry. Given that non-S&E majors
are unlikely to be inventive in S&E sectors, I focus on examining the initial career choices of
S&E majors. Nearly 70 percent of 2006–2008 graduates who took a first job in finance had
majored in S&E.19
A complicating factor when studying initial career outcomes is that some graduates may
pursue their initial choice only briefly before changing sectors, such as earning a master’s
degree in S&E and then entering finance. To identify graduates’ long-term sectors, I find
their LinkedIn profiles using their names and MIT degrees, and then identify the sector listed
as current on their LinkedIn profiles as of August 2014 (at least six years after graduation
for the classes of 2006–2008).20 For 676 S&E graduates in the classes of 2006–2008, I observe
both the initial sector listed on the Graduating Student Surveys and the long-term sector
listed on LinkedIn. Figure A.1 plots the distribution of long-term sector by initial sector and
shows that transitions between finance and S&E sectors are uncommon. Nearly 90 percent
of graduates who started out in S&E—either by pursuing a graduate degree in S&E or by
working for an employer in an S&E industry—remained in S&E as of August 2014; under 5
percent switched to finance over the long term. The majority of graduates (61 percent) who
started out in finance stayed in finance long-term.
18Assignment of an employer to an industry is performed manually via online search. In casesof missing information on an employer, I use the industry self-reported in the survey. Examplesof “other” outcomes include entering a non-S&E graduate program, entering a non-S&E industryother than finance such as consulting, law, or architecture, and pursuing an activity other thanemployment or graduate school (e.g., a fellowship, travel, the military, and volunteer work).
19Excluded from the analysis are economics and management majors who do not pursue a secondmajor in engineering or science. Although they have a high probability of entering finance, theyare few in number and are thus a minority among graduates who took a first job in finance.
20For other studies that use LinkedIn data to study career trajectories, see Ge et al. (2016).
8
Table 2 reports mean characteristics of S&E majors by initial sector. I observe the initial
sectors of 55% of S&E majors in the classes of 2006–2008.21 Compared to all S&E majors, the
sample of S&E majors whose initial sector I observe consists of more female graduates, more
Caucasian and Asian American graduates, fewer Hispanic and African American graduates,
and fewer non-American graduates. Oversampling of particular genders or ethnicities could
bias my results on selection into finance if selection differs substantially by these character-
istics. I investigate this possibility in supplementary analysis in the Appendix.
Of S&E majors whose initial post-graduation sectors are observed, 46.4 percent pursued
graduate degrees in S&E and 19 percent pursued jobs in S&E. Around 9 percent took a first
job in finance, making finance the most popular industry among S&E graduates entering
the labor market.22 Compared to those pursuing graduate degrees or jobs in S&E, those
entering finance are on average much less likely to be female or Caucasian American and
more likely to be Asian American or non-American; they also received less financial aid at
MIT, on average, and are more likely to be engineering majors than science majors.
Figure 1 shows the distribution of S&E majors and the proportion of graduates in each
major who entered finance right after college graduation. The propensity to enter finance
ranges widely, from 24.5 percent for mathematics majors to 0 percent for earth sciences ma-
jors. Overall, the propensity to enter finance is higher among engineering and mathematics
majors than other science majors; nearly 11.1 percent of engineering and mathematics majors
took a first job in finance. In contrast, only 1.2 percent of other S&E majors (i.e., physics,
life sciences, chemistry, and earth sciences) did so. Jointly, engineering and mathematics
majors account for nearly 97 percent of S&E graduates who took a first job in finance.23
21This response rate is higher than those of Oyer (2008) and Goldin and Katz (2008), whichreport response rates of around 40% to surveys on the career outcomes of Stanford MBA graduatesand Harvard bachelor’s graduates respectively.
22Finance is 50 percent more popular than the most popular S&E industry, Computer/IT, whichattracted 5.8 percent of S&E graduates.
23Using LinkedIn profiles, I find that the proportion of graduates in each major who work infinance several years after graduation exhibits largely consistent patterns: the propensity to remainin finance over the long term is relatively high for engineering and mathematics majors and low forscience majors in fields other than mathematics and physics. Physics majors have a low propensity
9
2.3 Skill development in college
I collect several measures of academic and non-academic skills in addition to cumulative
GPA. I use these variables to study how academic skill development in college relates to
subsequent patenting and how students with different initial career outcomes differ in their
skill development during college. For all classes in my sample, I observe the number of course
units passed in each term and GPA in most terms.24 To capture academic qualifications at
college entry, I use an index score constructed by MIT’s Admissions Office and available
for the classes of 2006 and later. The admission index score consists of a weighted average
of objective measures of academic achievement in high school, including standardized test
scores, high-school grades, and the difficulty of high-school courses. Figure A.2 in the Ap-
pendix shows that admission index score and cumulative GPA are strongly and positively
correlated. (The correlation between the two variables for the classes of 2006–2012 is 0.43.)
For the classes of 2006 and 2008, I also collect student responses to Senior Surveys inquiring
about participation in extracurricular activities during college and self-reported improvement
in an array of critical-thinking and scientific-reasoning skills.25
I use the classes of 2006 to 2012 to examine the impact of the 2008–09 financial crisis
on students’ academic skill development. For these cohorts, I also obtain a student’s first
declared major to capture his or her early academic interest. Around 90 percent of students
in the classes of 2006–2012 first declared a major in the fall semester of sophomore year.
Conditional on declaring a first major in S&E, around 14 percent of students did not graduate
in the major they had first declared, but only 3 percent switched to non-S&E majors.26
to take a first job in finance (1.4 percent overall) but a fairly high propensity to work in financeover the long term (9.5 percent overall).
24For the classes of 2005 and earlier, I do not observe GPA in the first year; in that era, studentsonly received a pass or no record during the first year. For the classes of 2006 and later, I do notobserve GPA in the first term.
25Senior Surveys are administered every other year, and thus were not distributed to the class of2007. The response rate in my sample is around 61%.
26The propensity to switch majors in my sample is similar to what Zafar (2011) finds usingsurvey data on Northwestern University undergraduates; around 12% of the students in his samplechanged majors between the fall of sophomore year and the fall of junior year.
10
3 College GPA, Post-College Patenting, and Selection into Ca-
reers
This section examines whether the most highly skilled S&E majors at college graduation
are self-selecting into finance. Figure 2 illustrates how college GPA, post-college patenting,
and probability of entering finance relate to each other. Among S&E majors in the classes
of 1994–2008, the average number of patents produced after college increases sharply with
GPA quartile. In contrast, the probability of entering finance declines sharply with GPA
quartile among S&E majors in the classes of 2006–2008. Moreover, graduates in the top
GPA quartile of S&E majors are especially inventive, producing 2.7 times as many patents
as those in the bottom GPA quartile, and they are also disproportionately less likely to enter
finance. Figure A.3 in the Appendix shows that these patterns also hold within the sample
of mathematics and engineering majors, who among S&E majors have the highest tendencies
to enter finance.
3.1 GPA and future patenting
To formally study the correlation between academic performance in college and post-
college patenting, I estimate the following regression specification:
InventiveOutputi = G(α + βGPAi + γDCohort
i + θDMajori + δχi + εi
)(3.1)
where the dependent variable is whether individual i becomes an inventor after college, the
number of patents that individual i produced since college graduation, or the number of
citations that individual i received for those patents; GPAi is cumulative GPA in college
standardized among the S&E majors in each cohort; DCohorti is the full set of cohort dummies;
DMajori is the full set of major dummies, including an indicator for graduating with more than
one major; and χi is the set of demographic controls for gender, age, ethnicity, high-school
11
region, and financial aid. For probability of becoming an inventor, I estimate the regressions
using Logit models. For the other two outcomes, I estimate the regressions using quasi-
maximum-likelihood Poisson models. I report robust standard errors clustered by cohort
and major.27
Table 3 presents the marginal effects from estimating Equation (3.1) with and without
controls. For all three measures of inventive output, the coefficient estimates for GPA are
positive and statistically significant; the estimates are not sensitive to the inclusion of con-
trols. Controlling for cohort, major, and demographics, a one-standard-deviation increase
in GPA is on average associated with 28-percent, 40-percent, and 33-percent increases in,
respectively, the probability of becoming an inventor after college, the number of patents
produced after college, and the number of citations received for those patents.
Table 4 shows that the relationship between college GPA and subsequent patenting is
robust to controlling for selection into initial sectors using S&E majors from the classes of
2006–2008. Column (1) uses the same specification as in Table 3, column (4). Although the
classes of 2006–2008 on average produce far fewer patents than the earlier cohorts, because
they graduated from college more recently, the relationship between GPA and patenting
remains strongly positive and significant. Column (2) restricts the sample to those whose
initial sectors are observed, but uses the same specification as column (1); column (3) adds
detailed sector dummies for whether the graduate enters an S&E graduate program, Com-
puter/IT, another S&E industry, finance, or consulting; column (4) restricts the sample to
those who initially pursued a graduate degree or a job in S&E and includes dummies for
whether the graduate enters an S&E graduate program or Computer/IT. The results hold
in all three columns. Among S&E majors in the classes of 2006–2008 who initially pursued
a graduate degree or a job in S&E, a one-standard-deviation increase in cumulative GPA is
associated with a 51.8 percent increase in patenting. Table A.1 in the Appendix shows that
these results are robust to controlling for selection into long-term sectors.
27For students with more than one major, each combination of majors in a cohort is a separatecluster.
12
3.2 GPA and selection into careers
To examine the correlation between academic performance and propensity to enter fi-
nance, I estimate regressions of the following form:
Pr (Finance) = G(α + βGPAi + γDCohort
i + θDMajori + δχi + εi
), (3.2)
where the dependent variable is whether a graduate enters finance immediately after college
graduation; GPAi is cumulative GPA in college; and DCohorti , DMajor
i , and χi are defined as
in Equation (3.1). I estimate the regression in Logit models and use robust standard errors
clustered by cohort and major.
Table 5 reports the estimated marginal effects. Columns (1) to (3) show that GPA
negatively and significantly predicts the probability of entering finance; the results are robust
to inclusion of various levels of controls. Among S&E majors in the classes of 2006–2008,
conditional on cohort, major, and demographics, a one-standard-deviation increase in GPA
is associated with a 3.9 percentage-point decrease in the proportion of graduates entering
finance, equivalent to a 44.3 percent decrease from the baseline probability of 8.8 percent.
Columns (4) and (5) show that there is negative selection into both quantitative and non-
quantitative jobs in finance with similar magnitudes.28
Table A.2 in the Appendix shows that selection into finance differs significantly by gender
but not by ethnicity: compared to male students, female students exhibit less negative corre-
lations between college GPA and propensity to enter finance. Since the proportion of female
students is larger in my sample of graduates with non-missing initial career choices than in
the MIT student body as a whole (Table 2), it is possible that my results underestimate
overall negative selection into finance at MIT based on college academic performance.
Table 6 compares selection into finance to selection into S&E sectors. In contrast to
28To identify quantitative jobs in finance, I construct an indicator variable that equals 1 if theemployer is a hedge fund or if the job entails trading or quantitative analysis. The most commonnon-quantitative job in finance is investment-banking analyst.
13
negative selection into finance based on college GPA (column (1)), S&E majors are positively
selected into S&E sectors (column (2)). More specifically, college GPA has a strong and
positive correlation with entry into S&E graduate programs (column (3)); a one-standard-
deviation increase in GPA is associated with a 42.5-percent increase in the probability of
entering a S&E graduate program. There is negative selection into employment in S&E
industries, and in unreported regressions I find that selection into finance is not significantly
different from selection into S&E industries. Therefore, the most academically accomplished
S&E graduates at college graduation are not systematically entering finance. Instead, they
tend to pursue advanced degrees in S&E immediately after graduation.
4 Additional Evidence on Skill Development in College
This section uses additional skill measures to provide further evidence that finance does
not systematically attract the S&E majors who are best prepared to innovate at college
graduation. I first investigate how academic skill development in college relates to subsequent
patenting. I then examine how students who pursue different career outcomes differ in their
skill-development paths during college. I report results only for mathematics and engineering
majors—the vast majority of S&E majors who enter finance—but my key findings extend
to all S&E majors.
To earn a bachelor’s degree from MIT, a student must satisfy the requirements of the
core curriculum—which consists of courses on subjects ranging from science and engineering
to humanities—and those of his or her department of choice. Freshmen and sophomores
typically take core-curriculum courses and introductory courses in their fields of interest.
In their junior and senior years, having declared majors, students take specialized courses.
Figure 3 plots the relationships between future patenting and academic performance in high
school and in each of the four years of college. I estimate each coefficient separately using
the same specification as in Table 4, column (4), which restricts the analysis to those who
entered S&E and controls for their initial outcomes. To make sure the sample is consistent
14
across the regressions, I include only graduates who earned a bachelor’s degree in exactly
eight semesters.29 I standardize each measure of academic performance by cohort within
the sample. Figure 3 shows that academic performance during the senior year of college
correlates most strongly and significantly with future patenting. The magnitude of the effect
is quite large: a one-standard-deviation increase in senior-year GPA is associated with a
nearly 100% increase in the number of post-college patents (or a 0.083 percentage-point
increase from the baseline average of 0.083). Academic performance in the second year of
college exhibits the second-strongest correlation: the magnitude of the coefficient estimate
is around 58% of that of the estimate for senior-year GPA (or 0.048 percentage points).
GPAs in the first and third years of college also predict future patenting positively but
the coefficient estimates are smaller and marginally insignificant, possibly because GPAs in
these years are relatively noisy measures of academic skills.30 Academic performance in high
school exhibits the weakest and most insignificant correlations with patenting. Overall, the
correlations between grades and post-college patenting increase over the course of college.
This pattern suggests that both general academic skill and field-specific knowledge/interest
are valuable for inventing, but that the latter is particularly important.
Having established the link between academic specialization and post-college patenting,
I next investigate the extent to which math and engineering students with different career
outcomes pursue different skill-development paths in college. I provide evidence on both
academic and non-academic skill development. For each skill measure, such as admission
index score or GPA in each of the four years in college, I estimate in OLS the conditional
means that capture the differences between those who enter finance and those who enter
S&E sectors, controlling for cohort, major, and demographics and using robust standard
29This sample restriction eliminates around 16 percent of the math and engineering graduates.Reasons for not graduating in eight semesters include early graduation, taking a gap year, andreturning to finish a degree after a hiatus.
30Due to MIT policies, the first-year GPA consissts only of grades during the second term .During junior year many students study abroad, and grading standards in exchange programs canvary widely.
15
errors clustered by cohort and majors.
Figure 4 plots the conditional means for academic skill measures. The sample includes
all math and engineering majors from the classes of 2006–2008 who earned a bachelor’s
degree in exactly eight semesters and whose initial post-graduation sectors I observe. All
skill measures are standardized by cohort within the sample. Panel I illustrates differences in
academic performance over time between the math and engineering majors who enter S&E
graduate programs or take first jobs in S&E and those who enter finance. The former group
has significantly better admission index scores and significantly better GPAs in every year
of college. The average difference in admission index score is relatively small (around 0.17
standard deviations); the differences in GPAs are much larger, and the largest is in the senior
year. (The coefficient estimates are, in the order of college year, 0.45, 0.45, 0.42, and 0.63
standard deviations.) Panel II further shows that the former group also takes more courses
every year; the differences are significant in the first two years. However, the magnitudes of
the differences in course load are small: the average differences are only around 2.6 units in
the first year and 5.1 units in the second year; a typical MIT course carries 12 units of credit.
Figure A.4 in the Appendix shows that the differences in grades and course load decrease
somewhat after controlling for decile dummies for admission index score but still remain large
and significant; controlling for high-school academic achievement, the estimated difference in
first-year GPA is 0.37 standard deviations and the estimated difference in senior-year GPA
is 0.58 standard deviations.
Two other patterns in Figure 4 are interesting. First, differences in grades and course
load do not grow in the second and third years. Thus, it is unlikely the case that unexpected
poor academic performance in the freshman year systematically prompts students who will
enter finance to expend even less academic effort in their second and third years. Second,
differences in GPA become more negative during senior year, which suggests that differences
in investment in coursework intensify once students have more or less chosen their future
careers.
16
Table 7 reports the means and conditional means of graduates’ rates of participation in
various activities during college by initial sector. I subdivide these activities into four sets:
fraternities and sororities, intercollegiate sports, performing arts (music, theater, and dance),
and clubs (community service, student government, and student publications). Compared
to math and engineering graduates who pursue a graduate degree or take a first job in
S&E, those entering finance are 20.3 percentage points or 54 percent more likely to belong
to a fraternity or sorority; they are also 15 percentage points or 50 percent more likely to
participate in varsity sports. The two groups have similar rates of participation in performing
arts. Those entering S&E are more likely to participate in student groups, but the differences
are not significant. In unreported regressions I find that the differences in participation in
extracurricular activities persist when controlling for admission index scores.
Table 8 compares graduates’ self-reported improvement between college entry and grad-
uation in an array of critical-thinking and scientific-reasoning skills. For each skill, Senior
Surveys ask graduates to rate change in their skill level from 0 (“weaker”) to 4 (“much
stronger”); I standardize the responses and construct a z-score for the respondents to Senior
Surveys. I include decile dummies of admission index score as additional controls, so that the
reported conditional means hold constant college-entry qualifications. Table 8, Column (1),
shows that, on average, math and engineering majors who enter S&E sectors report slightly
better skill improvement than the average survey respondent; column (2) shows that math
and engineering majors who enter finance report worse skill improvement than the average
survey respondent. Column (3) shows that the differences between the two groups are signif-
icant at the 95-percent level for improvement in four skills: (1) gaining in-depth knowledge
of a field; (2) understanding the process of science and experimentation; (3) planning and
executing complex projects; and (4) formulating and creating original ideas and solutions.
The largest and most significant difference is in the self-reported improvement in the ability
to gain in-depth knowledge of a field. This finding is consistent with the previous finding
that differences in academic performance between the two groups increase over time and are
17
largest in senior year.
Taken together, the results in this section suggest that innovating in S&E calls for field-
specific knowledge/interest, which students accumulate by investing in coursework during
college. However, those who enter finance tend to pursue diverse activities in college instead
of specializing in academics, which could be driven by both their abilities and preferences.
To the extent that a student’s admission index score is only a coarse measure of his or her
underlying academic capability, it is possible that those who enter finance may simply be
less academically skilled than those who enter S&E. Alternatively, students with similar
academic aptitudes may choose to spend their time and energy in college differently due to
preferences for activities and/or intended careers. Moreover, participating in a Greek society
or a varsity sports team could have a causal impact on a student’s academic achievement
and propensity to enter finance.31 All of these scenarios imply that the returns to academic
specialization in S&E subject areas are lower in finance than in S&E sectors.
5 The Impact on Skill Development of the Financial Crisis and
Great Recession
Given the differential returns to skills, it is possible that the lure of finance could reduce
students’ incentives to develop specialized S&E human capital. The 2008–09 financial crisis
provides an opportunity to identify whether students’ skill-development choices are sensitive
to sudden changes in anticipated career incentives. In the fall of 2008, Lehman Brothers filed
for Chapter 11 bankruptcy protection, Merrill Lynch was acquired under duress by Bank of
America, and the U.S. Treasury and Federal Reserve Bank issued a $700 billion emergency
bailout. In addition to directly shrinking the pool of available jobs in finance, the crisis and
events like the Occupy Wall Street protests may also have increased the perceived riskiness
of a career in finance and diminished its perceived social value. The MIT cohorts that
31Prior studies have found peer effects on time use in college (Stinebrickner and Stinebrickner,2006) and on career choice (Marmaros and Sacerdote, 2002).
18
graduated after the crisis are substantially less likely to enter finance. For instance, only 5.3
percent of S&E majors in the 2009 cohort took a first job in finance, 40 percent fewer than
S&E majors in the 2006–2008 cohorts. After the financial crisis the U.S. economy entered
the Great Recession, during which the unemployment rate increased from 5.8 percent in
2008 to 9.3 percent in 2009. The worsening overall job market may also have had an effect
on undergraduates’ skill development regardless of their interest in finance.32 This section
first studies the impact of the crisis and recession on students’ choices of major, and then
examines its impact on investment in coursework conditional on choices of major.
5.1 Impact on choice of major
To examine the impact of economic crisis on students’ choices of major, I estimate the
following regressions:
Pr(Majori = S) = αS + βSDCohorti + δSχi + θSf (AIi) + εS,i (5.1)
where the dependent variable is an indicator variable that captures either first declared major
or major at graduation; and DCohorti and χi are cohort dummies and demographic controls,
both defined earlier. I also include decile dummies for admission index scores (f (AIi) ) to
control for high-school academic achievement. The class of 2008, who graduated from college
immediately before the peak of the financial crisis, is the omitted group. The identifying
assumption is that students who graduated after 2008 would have exhibited patterns of
majors similar to those of the classes of 2008 and earlier if not for the influence of the crisis
and Great Recession.
Figure 5 plots the coefficient estimates of βS and 95-percent confidence intervals by cohort.
32Blom et al. (2015) find that students pursue more technical and difficult majors, such asSTEM fields, during bad economic conditions. Altonji et al. (2015) show that the Great Recessionhad a particularly severe and negative impact on recent college graduates’ earnings, and that themagnitude of the impact is larger than that of other recessions. Bedard and Herman (2008) find thatstudents are more likely to enter graduate school when they graduate during periods of economiccrisis.
19
No statistically significant differences are evident between the 2008 cohort and those who
graduated by 2010—who had declared first majors before the financial crisis; nor does the
class of 2011, who were sophomores in late 2008, exhibit statistically significant differences in
choice of major. Compared to the previous cohorts, the class of 2012, who were freshmen in
late 2008, was significantly less likely to major in management/economics and significantly
more likely to major in S&E. The magnitude of the decrease in propensity to major in
management/economics, relative to the class of 2008, is around 3.6 percentage points, which
is comparable to the corresponding magnitude of the increase in propensity to major in S&E
(3.0 percentage points). This shift is apparent as early as fall 2009, when most of the 2012
cohort first declared majors (panel II).
The 3-percentage-point increase in propensity to major in S&E may seem small compared
to the baseline probability of doing so (around 88 percent in 2008); it could have large
implications for innovation, however, if it consists of the students with the best academic
credentials at college entry. To examine the qualifications of students at the margin between
management/economics and S&E majors, I use an empirical test similar to that of Gruber
et al. (1999) and Chandra and Staiger (2007):
Yi = α + δSj + εi (5.2)
where the dependent variable is the standardized admission index and Sj is the share of
management/economics majors in cohort j. The regression is estimated only within the
sample of management/economics majors. Intuitively, δ measures how much the average
admission index of management/economics majors changes when they are more numerous. A
negative δ implies that students who remain management/economics majors are more highly
qualified than students who switch to another major. Similarly, estimating the equation
within the sample of S&E majors—where Sj is the share of S&E majors in cohort j—shows
how each additional S&E major compares to the average S&E major.
Table 9, column (1), shows that marginal management/economics majors have much
20
lower admission-index scores than the average management/economics major; the estimated
difference is almost half of the standard deviation. Column (2) shows that, although there
are fewer management/economics majors in the 2012 cohort, their average admission index
is higher than those of management/economics majors in previous cohorts. The coefficient
estimates in both columns are statistically significant. Columns (3) and (4) show that
marginal S&E majors are also less qualified than the average S&E major; the differences
are not statistically significant because the fluctuations in the proportion of S&E majors are
relatively small.
Comparing the raw numbers yields conclusions similar to those of Table 9. Around 12
percent of the class of 2008 majored in management/economics; their mean admission index
is 0.06. Around 8 percent of the class of 2012 majored in management/economics; their mean
admission index is 0.26. A back-of-the-envelope calculation shows that those who would have
majored in management/economics if they had belonged to the 2008 cohort instead of the
2012 cohort have a mean admission index that is 0.34 standard deviations below the cohort
mean.
5.2 Impact on academic performance
To study changes in students’ academic performance, I estimate the following specifica-
tion:
GPAi = α + βDCohorti + µDMajor
i + δχi + θf (AIi) + εi (5.3)
where the dependent variable is cumulative GPA. This specification is similar to Equation
(5.1) but with controls for selection into major (i.e., dummies for major and a dummy for
graduating with more than one major). I report only the results for S&E majors, but the
results for all majors are very similar.
Figure 5 plots the OLS coefficient estimates for β with robust standard errors. There
21
are no statistically significant differences between the 2008 cohort and the cohorts who
graduated before 2012. But the S&E majors in the class of 2012 earned significantly better
grades than the previous cohorts. The estimated average increase in cumulative GPA for
the 2012 cohort is 0.096, which is 23 percent of the standard deviation within the sample
(0.419). This magnitude is non-trivial, since a 0.23-standard-deviation increase in overall
GPA among S&E majors is associated with a 9.3 percent increase in post-college patenting
not controlling for post-college career outcomes (Table 3).
In addition to OLS, I also estimate Equation (5.3) using quantile regressions. Figure 7
shows that, among the cohorts that graduated before 2012, there are small and insignificant
differences across GPA distributions. Together with Figure 5, this result indicates that the
increase in grades for the class of 2012 is unlikely to be driven by institutional forces such as
grade inflation. Figure 7 also shows that the increase in GPA for S&E majors in the class of
2012 is primarily driven by those in the lower half of the grade distribution; the magnitudes
of the coefficient estimates decline substantially with GPA percentile. The estimated changes
at the 10th, 50th, and 80th percentile are respectively 0.19, 0.084, and 0.034.
The results in this section show that the financial crisis and subsequent recession had a sig-
nificant impact on the academic skill development of below-average MIT students who were
freshmen at the peak of the crisis. One potential concern is that there may be unobserved
differences between the class of 2012 and the previous cohorts. There is no indication that
MIT drastically changed its admission policies for the class of 2012. To provide additional
robustness checks, I collect information on participation in and leadership of extracurricular
activities in high school, which is available for the classes of 2010–2012.33 Table A.3 in the
Appendix shows that adding these variables as controls does not change the key findings.
33The data came from surveys conducted by the Admissions Office; comparable data are notavailable for the earlier cohorts.
22
6 Career Outcomes of Top Performers on the Putnam Competi-
tion
Focusing on a single institution, MIT, allows me to observe students’ characteristics, skill
measures, and outcomes in detail. However, it is possible that the self-selection of MIT S&E
graduates differs from that of S&E graduates of other top programs. The most academically
skilled MIT S&E graduates, for instance, may have strong preferences for innovating that
equally qualified S&E students at other institutions do not share. This section uses data
on top scorers on the William Lowell Putnam Mathematical Competition to examine the
external validity of my key findings. The Putnam Competition, established in 1938, is an
annual math competition for undergraduates enrolled in North American universities. The
competition takes place on a single day; contestants are asked to solve 12 questions in two
three-hour sittings. The questions range in difficulty and are designed to test both technical
competence and originality. In 2011, 4440 students from 572 institutions took part in the
competition (Gallian, 2015). The names and schools of the top 100 individual scorers are
published in American Mathematical Monthly each year, and historical lists dating back to
1994 are available online.34 These lists of top performers allow me to construct a sample
of comparably skilled math students across multiple universities. The focus on math is
informative, since math is the S&E major with the highest percentage of MIT graduates
who pursue careers in finance (Figure 1).
Around 860 individuals have been among the top 100 individual scorers between 1994 and
2014.35 I hand collected the career outcomes of 462 individuals based on LinkedIn profiles,
personal websites, and other online sources. Using this data, I regress career outcomes on
five dummies for the institutions with the most top performers (MIT, Harvard, Princeton,
Stanford, and California Institute of Technology), and dummies for the most recent year
34The lists can be accessed at http://kskedlaya.org/putnam-archive/.35A given student can participate in the Putnam Competition up to four times and thus can
appear as a top performer multiple times.
23
in which the individual was a top scorer (as a proxy for his or her college cohort). I also
include a dummy for whether the individual is a Putnam Fellow, which is awarded to the
five individuals with the highest scores each year along with a cash prize of $2500. Putnam
Fellows represent the very best math talent in the world; past Putnam Fellows include three
Field Medalists (David Mumford, Daniel Quillen, and Paul Cohen), two Nobel laureates
in physics (Richard Feynman and Kenneth Wilson), four American Mathematical Society
presidents, and 16 National Academy of Sciences members (Gallian, 2015).
Table 10 shows no significant university-level differences in the career outcomes of top
performers with the exception of Harvard graduates, who are much more likely to work in
finance. It also shows that compared to all the top performers on the Putnam Competition,
Putnam Fellows are significantly less likely to have had any experience in finance, including
an internship during college, a first job in finance after graduation, or long-term employment
in finance. They are instead much more likely to enter a graduate program in S&E (typically
a doctoral program in math) immediately after college graduation and to work in academia
or a research sector over the long term. The results thus indicate that there is also negative
selection into finance among the best math students across a range of colleges.36
7 Conclusion
How does the inflow of top college graduates into the financial industry affect the supply
of innovators in S&E? Using data on MIT bachelor’s graduates, I find that the S&E majors
who are most academically accomplished at the time of college graduation—those with the
highest potential to produce inventions in the future—are not systematically entering finance.
In contrast, finance tends to attract S&E majors who are less academically oriented but more
socially oriented. These findings are consistent with two explanations that are not mutually
36A related piece of evidence is that the top performers on the Putnam Competition are onaverage much less likely to take a first job in finance than the average math major at MIT. Around10.2 percent of top Putnam performers in the 2006–2008 cohorts took a first job in finance, lessthan half of the same figure for math majors from the MIT classes of 2006–2008 (Figure 1).
24
exclusive. First, finance may prize specialized S&E human capital less than S&E sectors do,
and may call for other skills, such as social skills, more than those sectors do. In this scenario,
finance does not attract the most inventive future scientists and engineers from MIT; it hires
those who will be best suited to working in finance. Second, employers in finance may
seek the most academically talented S&E students, but find that these students have strong
preferences for careers in S&E. In both cases, the returns to academic specialization in S&E
subject areas are lower in finance than in S&E sectors. This pattern is not unique to MIT
graduates, as I also find negative selection into finance and positive selection into S&E sectors
among top math students across a range of North American universities.
The 2008–09 financial crisis and the subsequent Great Recession encouraged some MIT
students in the class of 2012 to major in S&E and/or to improve their academic performance,
which indicates that anticipated career incentives do influence the acquisition of specialized
S&E human capital during college. However, there is no evidence that those who were
sophomores and juniors at the peak of the crisis changed their skill-development paths in
response, suggesting that skill-development choices become much less elastic after the first
year of college. Moreover, the students with the best academic qualifications are the least
responsive to the shock. These findings have implications for policies intended to influence
top college students’ career choices—to the extent that they are warranted.
Beyond directly affecting the supply of innovators in S&E, the inflow of top talent into
finance could influence the production of innovations in other ways that I did not examine
in this paper. Without becoming prolific inventors, S&E graduates could still support the
production of innovations in S&E sectors via other job functions, such as managing R&D
projects. The talent inflow into finance could also promote the production of innovations
by improving the financing of innovations and R&D (Kortum and Lerner, 2000; Hall and
Lerner, 2010). Further investigations of the social returns of different career paths are needed
in order to determine the optimal talent allocation, which I leave to future work.
25
References
Agarwal, Rajshree and Atsushi Ohyama, “Industry or Academia, Basic or Applied?Career Choices and Earnings Trajectories of Scientists,” Management Science, October2012, 59 (4), 950–970.
Aghion, Philippe and Peter Howitt, “A Model of Growth Through Creative Destruc-tion,” Econometrica, March 1992, 60 (2), 323–351.
, Ufuk Akcigit, Ari Hyytinen, and Otto Toivanen, “Living the American Dream inFinland: The Social Mobility of Inventors,” Working Paper, July 2016.
Altonji, Joseph G., Lisa B. Kahn, and Jamin D. Speer, “Cashier or Consultant?Entry Labor Market Conditions, Field of Study, and Career Success,” Journal of LaborEconomics, December 2015, 34 (S1), S361–S401.
Arcidiacono, Peter, Esteban M. Aucejo, and V. Joseph Hotz, “University Dif-ferences in the Graduation of Minorities in STEM Fields: Evidence from California,”American Economic Review, March 2016, 106 (3), 525–562.
Arrow, Kenneth, “Economic Welfare and The Allocation of Resources for Invention,” in“The Rate and Direction of Inventive Activity,” Princeton University Press and NBER,1962, pp. 609–25.
Atkinson, Richard C., “Supply and Demand for Scientists and Engineers: A NationalCrisis in the Making,” Science, 1990, 248 (4954), 425–32.
Axelson, Ulf and Philip Bond, “Wall Street Occupations,” The Journal of Finance,October 2015, 70 (5), 1949–1996.
Azoulay, Pierre, Joshua S. Graff Zivin, and Jialan Wang, “Superstar Extinction,”The Quarterly Journal of Economics, May 2010, 125 (2), 549–589.
Baumol, William J., “Entrepreneurship: Productive, Unproductive, and Destructive,”Journal of Political Economy, October 1990, 98 (5-1), 893–921.
Bedard, Kelly and Douglas A. Herman, “Who Goes to Graduate/Professional School?The Importance of Economic Fluctuations, Undergraduate Field, and Ability,” Economicsof Education Review, 2008, 27 (2), 197–210.
Bell, Alexander, Raj Chetty, Xavier Jaravel, Neviana Petkova, and John VanReenen, “The Lifecycle of Inventors,” Working Paper, June 2016.
Bell, Brian and John Van Reenen, “Bankers and Their Bonuses,” The Economic Jour-nal, February 2014, 124 (574), F1–F21.
Biais, Bruno and Augustin Landier, “Endogenous Agency Problems and the Dynamicsof Rents,” Working Paper, May 2015.
26
, Jean-Charles Rochet, and Paul Woolley, “Dynamics of Innovation and Risk,”Review of Financial Studies, May 2015, 28 (5), 1353–1380.
Blom, Erica, Brian C. Cadena, and Benjamin J. Keys, “Investment Over the BusinessCycle: Insights from College Major Choice,” Working Paper, September 2015.
Bloom, Nicholas, Mark Schankerman, and John Van Reenen, “Identifying Technol-ogy Spillovers and Product Market Rivalry,” Econometrica, July 2013, 81 (4), 1347–1393.
Bohm, Michael, Daniel Metzger, and Per Stromberg, “Since you’re so rich, you mustbe really smart: Talent and the Finance Wage Premium,” Working Paper, 2015.
Bolton, Patrick, Tano Santos, and Jose A. Scheinkman, “Cream-Skimming in Fi-nancial Markets,” The Journal of Finance, April 2016, 71 (2), 709–736.
Celerier, Claire and Boris Vallee, “Returns to Talent and the Finance Wage Premium,”Working Paper, 2015.
Chandra, Amitabh and Douglas Staiger, “Productivity Spillovers in Health Care: Ev-idence from the Treatment of Heart Attacks,” Journal of Political Economy, 2007, 115,103–140.
Cole, Jonathan R. and Stephen Cole, “The Ortega Hypothesis,” Science, October 1972,178 (4059), 368–375.
Freeman, Richard B., “Cobweb Model of the Supply and Starting Salary of New Engi-neers, A,” Industrial and Labor Relations Review, 1975, 29, 236.
, “Supply and Salary Adjustments to the Changing Science Manpower Market: Physics,1948-1973,” American Economic Review, March 1975, 65 (1), 27–39.
Furman, Jeffrey L. and Scott Stern, “Climbing atop the Shoulders of Giants: TheImpact of Institutions on Cumulative Research,” The American Economic Review, August2011, 101 (5), 1933–1963.
Galasso, Alberto and Mark Schankerman, “Patents and Cumulative Innovation:Causal Evidence from the Courts,” The Quarterly Journal of Economics, February 2015,130 (1), 317–369.
Gallian, Joseph, “The Putnam Competition from 1938-2015,” 2015.
Ge, Chunmian, Ke-Wei Huang, and Ivan P. L. Png, “Engineer/scientist careers:Patents, online profiles, and misclassification bias,” Strategic Management Journal, Jan-uary 2016, 37 (1), 232–253.
Goldin, Claudia and Lawrence F. Katz, “Transitions: Career and Family Life Cycles ofthe Educational Elite,” American Economic Review: Papers and Proceedings, May 2008,98 (2), 363–369.
27
Goolsbee, Austan, “Does Government R&D Policy Mainly Benefit Scientists and Engi-neers?,” American Economic Review: Papers and Proceedings, May 1998.
Grossman, Gene M. and Elhanan Helpman, “Quality Ladders in the Theory ofGrowth,” Review of Economic Studies, January 1991, 58 (1), 43–61.
Gruber, Jonathan, Phillip Levine, and Douglas Staiger, “Abortion Legalization andChild Living Circumstances: Who is The ”Marginal Child”?,” Quarterly Journal of Eco-nomics, 1999, 114 (1), 263–291.
Hall, Bronwyn and Josh Lerner, “The Financing of R&D and Innovation,” in B.H. Halland N. Rosenberg, eds., Elsevier Handbook of Economics of Innovation, Elsevier, April2010, pp. 609–639.
Hastings, Daniel, Steven Lerman, and Melanie Parker, “The Demand for MIT Grad-uates,” MIT Faculty Newsletter, February 2010, XXII (3).
Jones, Benjamin F., “The Burden of Knowledge and the ”Death of the RenaissanceMan”: Is Innovation Getting Harder?,” Review of Economic Studies, January 2009, 76(1), 283–317.
Jones, Benjamin F, “Age and Great Invention,” Review of Economics and Statistics,January 2010, 92 (1), 1–14.
Jones, Charles I., “R & D-Based Models of Economic Growth,” Journal of Political Econ-omy, August 1995, 103 (4), 759–784.
, “Chapter 16 - Growth and Ideas,” in Philippe Aghion and Steven N. Durlauf, ed.,Handbook of Economic Growth, Vol. 1, Part B, Elsevier, 2005, pp. 1063–1111.
Kaplan, Steven N. and Joshua Rauh, “Wall Street and Main Street: What Contributesto the Rise in the Highest Incomes?,” Review of Financial Studies, March 2010, 23 (3),1004–1050.
Kirilenko, Andrei A. and Andrew W. Lo, “Moore’s Law versus Murphy’s Law: Algo-rithmic Trading and Its Discontents,” Journal of Economic Perspectives, April 2013, 27(2), 51–72.
Kortum, Samuel and Josh Lerner, “Assessing the Contribution of Venture Capital toInnovation,” RAND Journal of Economics, 2000, 31 (4), 674–692.
Lerner, Josh and Amit Seru, “The Use and Misuse of Patent Data: Issues for CorporateFinance and Beyond,” Mimeo, Harvard University, 2015.
Li, Guan-Cheng, Ronald Lai, Alexander D’Amour, David M. Doolin, Ye Sun,Vetle I. Torvik, Amy Z. Yu, and Lee Fleming, “Disambiguation and co-authorshipnetworks of the U.S. patent inventor database (1975-2010),” Research Policy, July 2014,43 (6), 941–955.
28
Lockwood, Benjamin B., Charles Nathanson, and E. Glen Weyl, “Taxation andthe Allocation of Talent,” Journal of Political Economy, April 2016, Forthcoming.
Marmaros, David and Bruce Sacerdote, “Peer and social networks in job search,”European Economic Review, May 2002, 46 (4-5), 870–879.
Mullainathan, Sendhil, “Why a Harvard Professor Has Mixed Feelings When StudentsTake Jobs in Finance,” The Upshot, NYTimes.com, April 2015.
Murphy, Kevin M., Andrei Shleifer, and Robert W. Vishny, “The Allocation ofTalent: Implications for Growth,” The Quarterly Journal of Economics, May 1991, 106(2), 503–530.
Myerson, Roger B., “A Model of Moral-Hazard Credit Cycles,” Journal of Political Econ-omy, October 2012, 120 (5), 847–878.
Nelson, Richard R., “The Simple Economics of Basic Scientific Research,” Journal ofPolitical Economy, 1959, 67 (3), 297–306.
Obama, Barack, “The way ahead,” The Economist, October 2016.
Oettl, Alexander, “Reconceptualizing Stars: Scientist Helpfulness and Peer Performance,”Management Science, January 2012, 58 (6), 1122–1140.
Oyer, Paul, “The Making of an Investment Banker: Stock Market Shocks, Career Choice,and Lifetime Income,” Journal of Finance, December 2008, 63 (6), 2601–2628.
Philippon, Thomas, “Financiers versus Engineers: Should the Financial Sector be Taxedor Subsidized?,” American Economic Journal: Macroeconomics, 2010, 2 (3), 158–182.
and Ariell Reshef, “Wages and human capital in the U.S. finance industry: 1909-2006,”The Quarterly Journal of Economics, November 2012, 127 (4), 1551–1609.
Rampell, Catherine, “Out of Harvard, and Into Finance,” The Economix Blog, NY-Times.com, 2011.
Roach, Michael and Henry Sauermann, “A taste for science? PhD scientists’ academicorientation and self-selection into research careers in industry,” Research Policy, April2010, 39 (3), 422–434.
Roberts, Edward B. and Charles E. Eesley, “Entrepreneurial Impact: The Role ofMIT,” Report to the Kauffman Foundation, February 2009.
, Fiona Murray, and J. Daniel Kim, “Entrepreneurship and Innovation at MIT:Continuing Global Growth and Impact,” MIT Innovation Initiative Report, December2015.
Romer, Christina, “Growth without Bubbles,” May 2009.
29
Romer, Paul M., “Endogenous Technological Change,” Journal of Political Economy,October 1990, 98 (5), S71–S102.
, “Should the Government Subsidize Supply or Demand in the Market for Scientists andEngineers?,” Innovation Policy and the Economy, January 2000, 1, 221–252.
Roy, A. D., “Some Thoughts on the Distribution of Earnings,” Oxford Economic Papers,1951, 3 (2), 135–146.
Ryoo, Jaewoo and Sherwin Rosen, “The Engineering Labor Market,” Journal of Polit-ical Economy, February 2004, 112 (S1), S110–S140.
Shiller, Robert J., “The Best, Brightest, and Least Productive?,” Project Syndicate,September 2013.
Smalheiser, Neil R. and Vetle I. Torvik, “Author name disambiguation,” Annual Re-view of Information Science and Technology, January 2009, 43 (1), 1–43.
Stephan, Paula E., “The Economics of Science,” Journal of Economic Literature, Septem-ber 1996, 34 (3), 1199–1235.
Stern, Scott, “Do Scientists Pay to Be Scientists?,” Management Science, June 2004, 50(6), 835–853.
Stinebrickner, Ralph and Todd R. Stinebrickner, “What can be learned about peereffects using college roommates? Evidence from new survey data and students fromdisadvantaged backgrounds,” Journal of Public Economics, September 2006, 90 (8-9),1435–1454.
and , “A Major in Science? Initial Beliefs and Final Outcomes for College Major andDropout,” Review of Economic Studies, January 2014, 81 (1), 426–472.
Torvik, Vetle I., Marc Weeber, Don R. Swanson, and Neil R. Smalheiser, “Aprobabilistic similarity metric for Medline records: A model for author name disambigua-tion,” Journal of the American Society for Information Science and Technology, January2005, 56 (2), 140–158.
Waldinger, Fabian, “Quality Matters: The Expulsion of Professors and the Consequencesfor PhD Student Outcomes in Nazi Germany,” Journal of Political Economy, August 2010,118 (4), 787–831.
Williams, Heidi L., “Intellectual Property Rights and Innovation: Evidence from theHuman Genome,” Journal of Political Economy, 2013, 121 (1), 1–27.
Wiswall, Matthew and Basit Zafar, “Determinants of College Major Choice: Identifi-cation using an Information Experiment*,” The Review of Economic Studies, December2014.
Zafar, Basit, “How Do College Students Form Expectations?,” Journal of Labor Economics,April 2011, 29 (2), 301–348.
30
Table 1. Patent and Citation Statistics. Sample: Classes of 1994–2008
Major S&E Non-S&EInventor 13.4% 3.0%Number of patents 0.57 0.10Number of citations 2.23 0.43Number of patents per inventor 4.24 3.21Number of citations per inventor 16.7 14.4N 13,167 1,888Note: Person-level observations.
Table 2. Mean Characteristics of Graduates by Initial Sector. Sample: S&E Majors fromClasses of 2006–2008
Sample All InitialSector
Observed
S&E Grad.Programs/Industries
Finance
(1) (2) (3) (4)N 2,562 1,411 923 124Female 42.4% 46.0% 45.9% 25.0%Age at graduation 22.2 22.2 22.2 22.2Caucasian American 36.8% 39.3% 40.4% 33.9%Asian American 27.7% 29.2% 27.6% 37.9%Hispanic American 10.4% 9.4% 9.5% 6.5%African American 4.8% 3.7% 4.0% 1.6%Non-American 8.7% 7.0% 7.0% 10.5%Financial aid received in senior year $13,193 $13,115 $13,436 $12,081Engineering 68.2% 69.4% 69.6% 75.8%Science 38.9% 38.5% 39.4% 32.3%
Initial Career OutcomeS&E graduate programs 46.4%S&E industries 19.0%Finance 8.8%Other 25.8%Notes: Person-level observations. In column (1), the sample consists of non-transfer graduates from the 2006–2008 cohorts witha major in engineering or science. In column (2), the sample consists of non-transfer graduates from the 2006–2008 cohorts witha major in engineering or science and whose initial sectors I observe. In column (3), the sample consists of graduates from the2006–2008 cohorts with a major in engineering or science who pursued a graduate degree in S&E or took a first job in an S&Eindustry after college graduation. In column (4), the sample consists of graduates from the 2006–2008 cohorts with a major inengineering or science who took a first job in finance after college graduation. Financial aid received in senior year is in 2008dollars.
Table 3. Estimated Correlation between College GPA and Patenting. Sample: S&E Majors from Classes of 1994–2008
Dependent variable Becoming an inventor Number of patents Number of citations(1) (2) (3) (4) (5) (6)
Standardized GPA 0.037** 0.038** 0.228** 0.229** 0.722˜ 0.744*(0.005) (0.003) (0.045) (0.039) (0.387) (0.345)
Model Logit Logit Poisson Poisson Poisson PoissonControls N Y N Y N YN 13,167 13,167 13,167 13,167 13,167 13,167Mean DV 0.134 0.134 0.567 0.567 2.233 2.233Notes: Person-level observations. Coefficients reported are marginal effects from Logit models (columns (1) and (2)) or quasi–maximum-likelihood Poisson models(columns (3)–(6)). Robust standard errors clustered by cohort and majors are shown in parentheses. ˜ p < 0.10; * p < 0.05; ** p < 0.01. The sample consists ofnon-transfer graduates from the 1994–2008 cohorts with a major in engineering or science. In columns (1) and (2), the dependent variable is whether the graduate isawarded any patents after college. In columns (3) and (4), the dependent variable is number of patents awarded after college. In columns (5) and (6), the dependentvariable is number of citations received by patents awarded after college. Standardized GPA is cumulative GPA standardized within the engineering and sciencemajors in each cohort. Controls include a dummy for being female, dummies for age (equals 22, greater than 22), dummies for ethnicity (Caucasian American, AsianAmerican, Hispanic American, African American, and non-American), dummies for high-school region (northeast, midwest, south, and west), dummies for cohort,dummies for majors at graduation, a dummy for graduating with more than one major, and financial aid received in senior year in 2008 dollars.
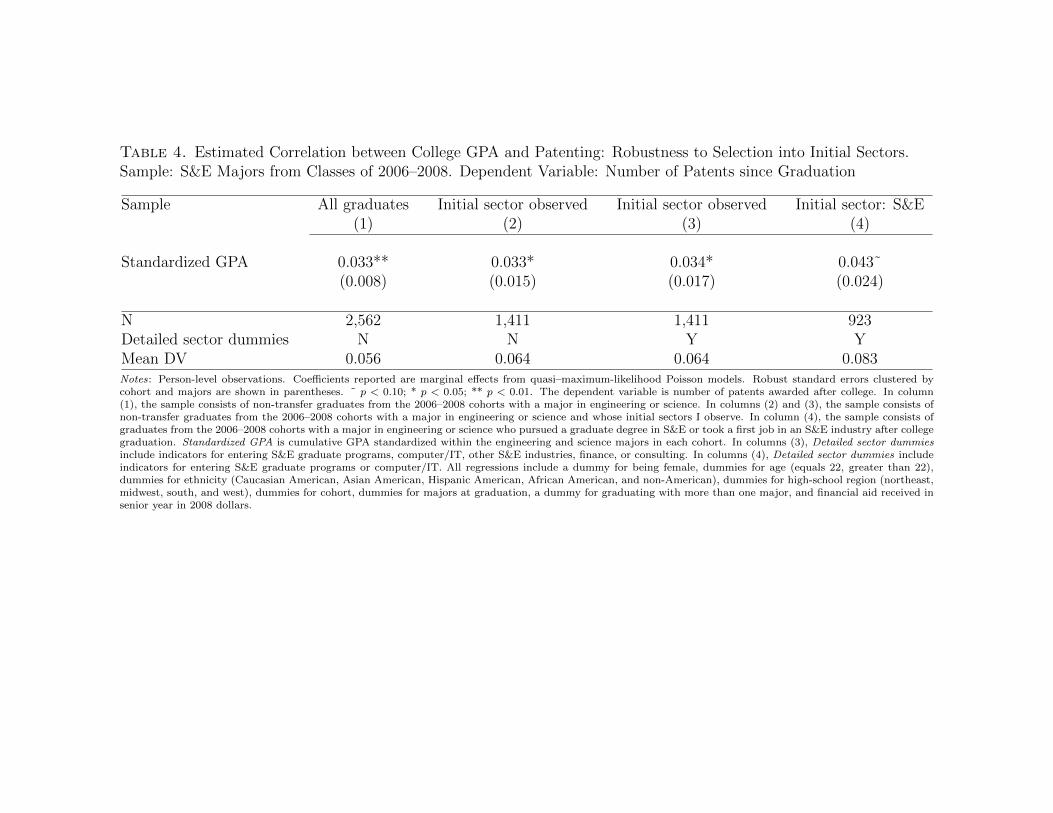
Table 4. Estimated Correlation between College GPA and Patenting: Robustness to Selection into Initial Sectors.Sample: S&E Majors from Classes of 2006–2008. Dependent Variable: Number of Patents since Graduation
Sample All graduates Initial sector observed Initial sector observed Initial sector: S&E(1) (2) (3) (4)
Standardized GPA 0.033** 0.033* 0.034* 0.043˜(0.008) (0.015) (0.017) (0.024)
N 2,562 1,411 1,411 923Detailed sector dummies N N Y YMean DV 0.056 0.064 0.064 0.083Notes: Person-level observations. Coefficients reported are marginal effects from quasi–maximum-likelihood Poisson models. Robust standard errors clustered bycohort and majors are shown in parentheses. ˜ p < 0.10; * p < 0.05; ** p < 0.01. The dependent variable is number of patents awarded after college. In column(1), the sample consists of non-transfer graduates from the 2006–2008 cohorts with a major in engineering or science. In columns (2) and (3), the sample consists ofnon-transfer graduates from the 2006–2008 cohorts with a major in engineering or science and whose initial sectors I observe. In column (4), the sample consists ofgraduates from the 2006–2008 cohorts with a major in engineering or science who pursued a graduate degree in S&E or took a first job in an S&E industry after collegegraduation. Standardized GPA is cumulative GPA standardized within the engineering and science majors in each cohort. In columns (3), Detailed sector dummiesinclude indicators for entering S&E graduate programs, computer/IT, other S&E industries, finance, or consulting. In columns (4), Detailed sector dummies includeindicators for entering S&E graduate programs or computer/IT. All regressions include a dummy for being female, dummies for age (equals 22, greater than 22),dummies for ethnicity (Caucasian American, Asian American, Hispanic American, African American, and non-American), dummies for high-school region (northeast,midwest, south, and west), dummies for cohort, dummies for majors at graduation, a dummy for graduating with more than one major, and financial aid received insenior year in 2008 dollars.
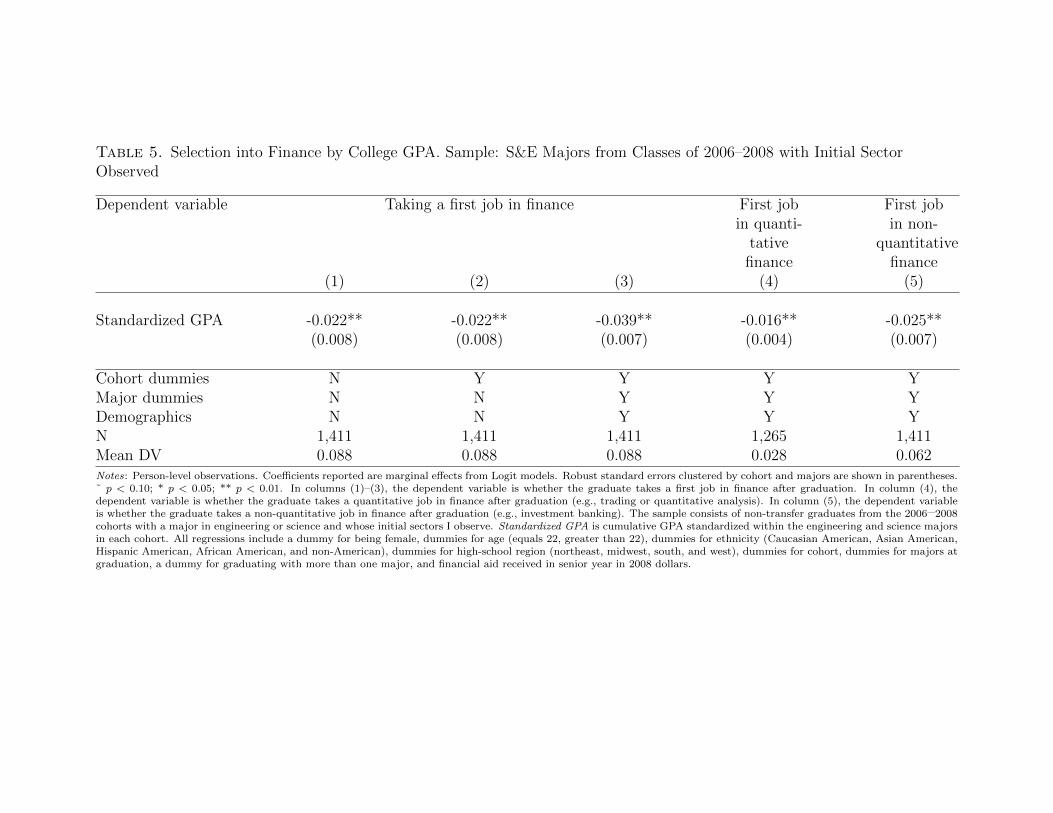
Table 5. Selection into Finance by College GPA. Sample: S&E Majors from Classes of 2006–2008 with Initial SectorObserved
Dependent variable Taking a first job in finance First jobin quanti-
tativefinance
First jobin non-
quantitativefinance
(1) (2) (3) (4) (5)
Standardized GPA -0.022** -0.022** -0.039** -0.016** -0.025**(0.008) (0.008) (0.007) (0.004) (0.007)
Cohort dummies N Y Y Y YMajor dummies N N Y Y YDemographics N N Y Y YN 1,411 1,411 1,411 1,265 1,411Mean DV 0.088 0.088 0.088 0.028 0.062Notes: Person-level observations. Coefficients reported are marginal effects from Logit models. Robust standard errors clustered by cohort and majors are shown in parentheses.˜ p < 0.10; * p < 0.05; ** p < 0.01. In columns (1)–(3), the dependent variable is whether the graduate takes a first job in finance after graduation. In column (4), thedependent variable is whether the graduate takes a quantitative job in finance after graduation (e.g., trading or quantitative analysis). In column (5), the dependent variableis whether the graduate takes a non-quantitative job in finance after graduation (e.g., investment banking). The sample consists of non-transfer graduates from the 2006–2008cohorts with a major in engineering or science and whose initial sectors I observe. Standardized GPA is cumulative GPA standardized within the engineering and science majorsin each cohort. All regressions include a dummy for being female, dummies for age (equals 22, greater than 22), dummies for ethnicity (Caucasian American, Asian American,Hispanic American, African American, and non-American), dummies for high-school region (northeast, midwest, south, and west), dummies for cohort, dummies for majors atgraduation, a dummy for graduating with more than one major, and financial aid received in senior year in 2008 dollars.
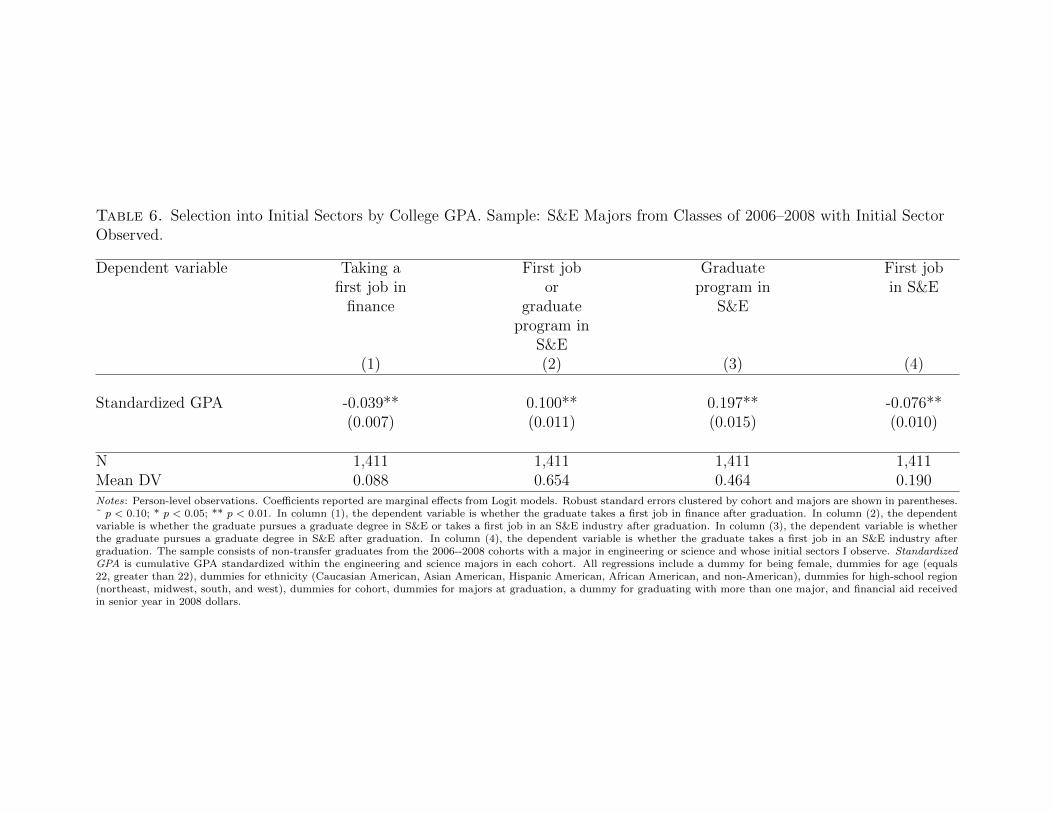
Table 6. Selection into Initial Sectors by College GPA. Sample: S&E Majors from Classes of 2006–2008 with Initial SectorObserved.
Dependent variable Taking afirst job in
finance
First jobor
graduateprogram in
S&E
Graduateprogram in
S&E
First jobin S&E
(1) (2) (3) (4)
Standardized GPA -0.039** 0.100** 0.197** -0.076**(0.007) (0.011) (0.015) (0.010)
N 1,411 1,411 1,411 1,411Mean DV 0.088 0.654 0.464 0.190Notes: Person-level observations. Coefficients reported are marginal effects from Logit models. Robust standard errors clustered by cohort and majors are shown in parentheses.˜ p < 0.10; * p < 0.05; ** p < 0.01. In column (1), the dependent variable is whether the graduate takes a first job in finance after graduation. In column (2), the dependentvariable is whether the graduate pursues a graduate degree in S&E or takes a first job in an S&E industry after graduation. In column (3), the dependent variable is whetherthe graduate pursues a graduate degree in S&E after graduation. In column (4), the dependent variable is whether the graduate takes a first job in an S&E industry aftergraduation. The sample consists of non-transfer graduates from the 2006--2008 cohorts with a major in engineering or science and whose initial sectors I observe. StandardizedGPA is cumulative GPA standardized within the engineering and science majors in each cohort. All regressions include a dummy for being female, dummies for age (equals22, greater than 22), dummies for ethnicity (Caucasian American, Asian American, Hispanic American, African American, and non-American), dummies for high-school region(northeast, midwest, south, and west), dummies for cohort, dummies for majors at graduation, a dummy for graduating with more than one major, and financial aid receivedin senior year in 2008 dollars.
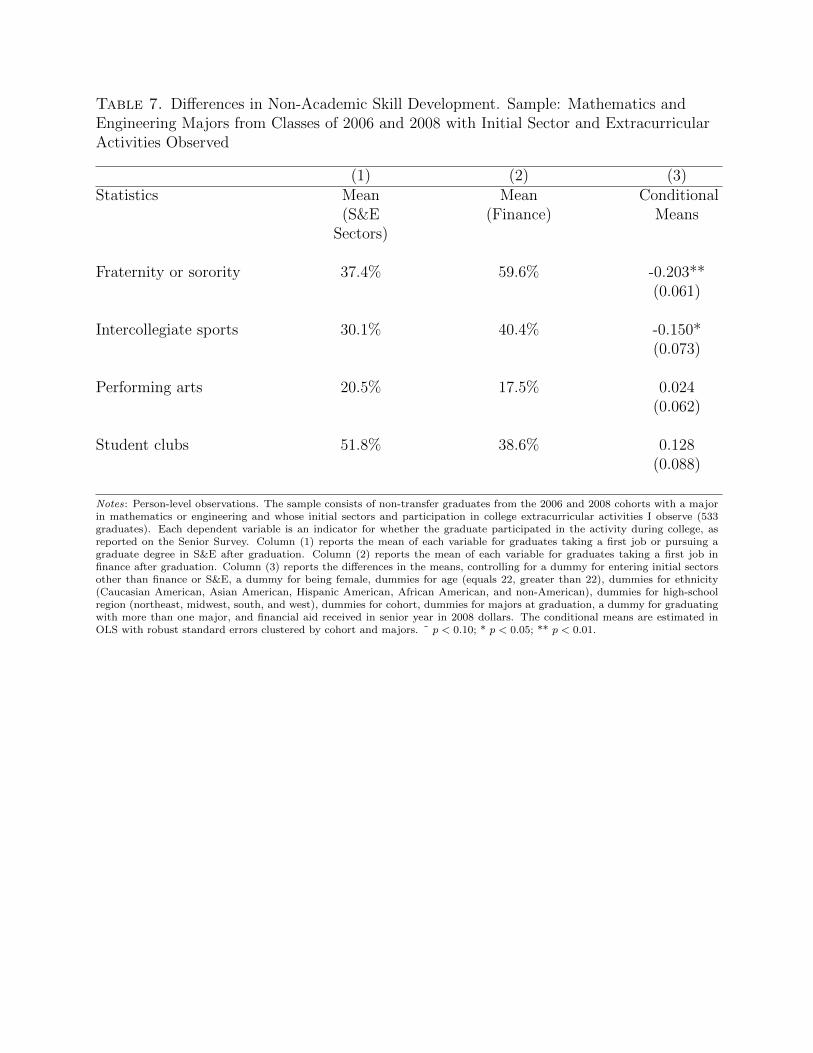
Table 7. Differences in Non-Academic Skill Development. Sample: Mathematics andEngineering Majors from Classes of 2006 and 2008 with Initial Sector and ExtracurricularActivities Observed
(1) (2) (3)Statistics Mean
(S&ESectors)
Mean(Finance)
ConditionalMeans
Fraternity or sorority 37.4% 59.6% -0.203**(0.061)
Intercollegiate sports 30.1% 40.4% -0.150*(0.073)
Performing arts 20.5% 17.5% 0.024(0.062)
Student clubs 51.8% 38.6% 0.128(0.088)
Notes: Person-level observations. The sample consists of non-transfer graduates from the 2006 and 2008 cohorts with a majorin mathematics or engineering and whose initial sectors and participation in college extracurricular activities I observe (533graduates). Each dependent variable is an indicator for whether the graduate participated in the activity during college, asreported on the Senior Survey. Column (1) reports the mean of each variable for graduates taking a first job or pursuing agraduate degree in S&E after graduation. Column (2) reports the mean of each variable for graduates taking a first job infinance after graduation. Column (3) reports the differences in the means, controlling for a dummy for entering initial sectorsother than finance or S&E, a dummy for being female, dummies for age (equals 22, greater than 22), dummies for ethnicity(Caucasian American, Asian American, Hispanic American, African American, and non-American), dummies for high-schoolregion (northeast, midwest, south, and west), dummies for cohort, dummies for majors at graduation, a dummy for graduatingwith more than one major, and financial aid received in senior year in 2008 dollars. The conditional means are estimated inOLS with robust standard errors clustered by cohort and majors. ˜ p < 0.10; * p < 0.05; ** p < 0.01.
Table 8. Differences in Self-Reported Skill Improvement in College Conditional onHigh-School Academic Achievement. Sample: Mathematics and Engineering Majors fromClasses of 2006 and 2008 with Initial Sector, Admission Index Score, and Self-ReportedSkill Improvement Observed
(1) (2) (3)Statistics Mean
(S&ESectors)
Mean(Finance)
Cond.Means
Self-reported improvement in ability to (z-score):
Gain in-depth knowledge of a field 0.140 -0.335 0.538**(0.130)
Think analytically and logically 0.090 -0.043 0.239(0.208)
Acquire new skills and knowledge on one’s own 0.043 -0.095 0.211(0.155)
Formulate and create original ideas and solutions 0.055 -0.247 0.377*(0.155)
Synthesize and integrate ideas and information 0.044 -0.165 0.248˜(0.145)
Plan and execute complex projects 0.127 -0.265 0.396*(0.193)
Understand process of science and experimentation 0.063 -0.504 0.503**(0.170)
Notes: Person-level observations. The sample consists of non-transfer graduates from the 2006–2008 cohorts with a majorin mathematics or engineering for whom I observe initial sectors, admission index scores, and self-reported skill improvement(438 graduates). Each dependent variable is a z-scored measure of self-reported improvement in the skill between collegeentry and college graduation, where the original responses range from 0 (“weaker”) to 4 (“much stronger”). The measures arestandardized among respondents to the Senior Survey. Column (1) reports the mean of each variable for graduates taking a firstjob or pursuing a graduate degree in S&E after graduation. Column (2) reports the mean of each variable for graduates takinga first job in finance after graduation. Column (3) reports the differences in the means, controlling for nine decile dummies foradmission index score, a dummy for entering initial sectors other than finance or S&E, a dummy for being female, dummiesfor age (equals 22, greater than 22), dummies for ethnicity (Caucasian American, Asian American, Hispanic American, AfricanAmerican, and non-American), dummies for high-school region (northeast, midwest, south, and west), dummies for cohort,dummies for majors at graduation, a dummy for graduating with more than one major, and financial aid received in senioryear in 2008 dollars. The conditional means are estimated in OLS with robust standard errors clustered by cohort and majors.˜ p < 0.10; * p < 0.05; ** p < 0.01.
Table 9. Marginal and Average College Qualifications, Majors inManagement/Economics and S&E. Sample: Classes of 2006–2012
Sample Management/Economics S&EDep. Var. = Admission Index (1) (2) (3) (4)∆(Marginal - Average) -0.446˜ -0.671
(0.234) (0.878)D2012 0.228* -0.023
(0.109) (0.038)N 735 735 5,769 5,769Notes: Person-level observation. All estimates are from ordinary-least-squares (OLS) with robust standard errors. ˜ p < 0.10;* p < 0.05; ** p < 0.01. The dependent variable is admission index normalized within the cohort. The sample for columns(1) –(2) consists of graduates from the 2006–2012 cohorts with a major in management or economics. The sample for columns(3)–(4) consists of graduates from the 2006–2012 cohorts with a major in S&E. D2012: indicator variable for the 2012 cohort.
Table 10. Selection into Careers among Top Performers on the William Lowell Putnam Competition, 1994–2014
Dependent variable Any
experience
in finance
First job in
finance
Graduate
program in
S&E
First job in
S&E
Long-term
research
(1) (2) (3) (4) (5)
Putnam Fellow -0.154* -0.095** 0.128* -0.022 0.201**
(0.068) (0.024) (0.061) (0.044) (0.060)
Dummies for five schools with the most top performers
MIT -0.026 0.017 -0.016 0.052 -0.020
(0.051) (0.037) (0.035) (0.046) (0.032)
Harvard 0.181* 0.139* -0.094 -0.037 0.004
(0.081) (0.049) (0.061) (0.031) (0.067)
Stanford -0.008 -0.003 -0.116 0.106 0.011
(0.067) (0.044) (0.081) (0.062) (0.119)
Princeton 0.047 0.045 -0.095 -0.062 0.093
(0.117) (0.063) (0.090) (0.046) (0.082)
CalTech 0.059 0.014 0.009 -0.045 -0.120
(0.109) (0.047) (0.083) (0.046) (0.103)
N 462 462 462 462 462
Mean DV 0.255 0.082 0.751 0.102 0.366
Notes: Person-level observations. Coefficients reported are from linear probability models. Robust standard errors clustered by the year when an individual last appeared as atop performer are shown in parentheses. ˜ p < 0.10; * p < 0.05; ** p < 0.01. In column (1), the dependent variable is whether the individual has had any experience in finance(including internship). In column (2), the dependent variable is whether the individual takes a first job in finance after graduation. In column (3), the dependent variable iswhether the individual pursues a graduate degree in S&E immediately after graduation. In column (4), the dependent variable is whether the individual takes a first job inan S&E industry after graduation. In column (5), the dependent variable is whether the individual works in academia or research as of May 2016. The sample consists ofindividuals who earned honorable mention or above for individual performance in the William Lowell Putnam Mathematical Competition between 1994 and 2014, and for whomI observe the initial and long-term sectors. Putnam Fellow is an indicator for whether the individual was among the five top-ranking individuals in any year. All regressionsinclude dummies for the year an individual last appeared as a top performer.
Figure 1. Distribution and Probability of Entering Finance by Major. Sample: S&EMajors from Classes of 2006–2008
Notes: Person-level observations. This figure plots the share of S&E graduates in each major and the proportion of graduates ineach major who took a first job in finance after graduation. The sample consists of non-transfer graduates from the 2006–2008cohorts with a major in engineering or science.
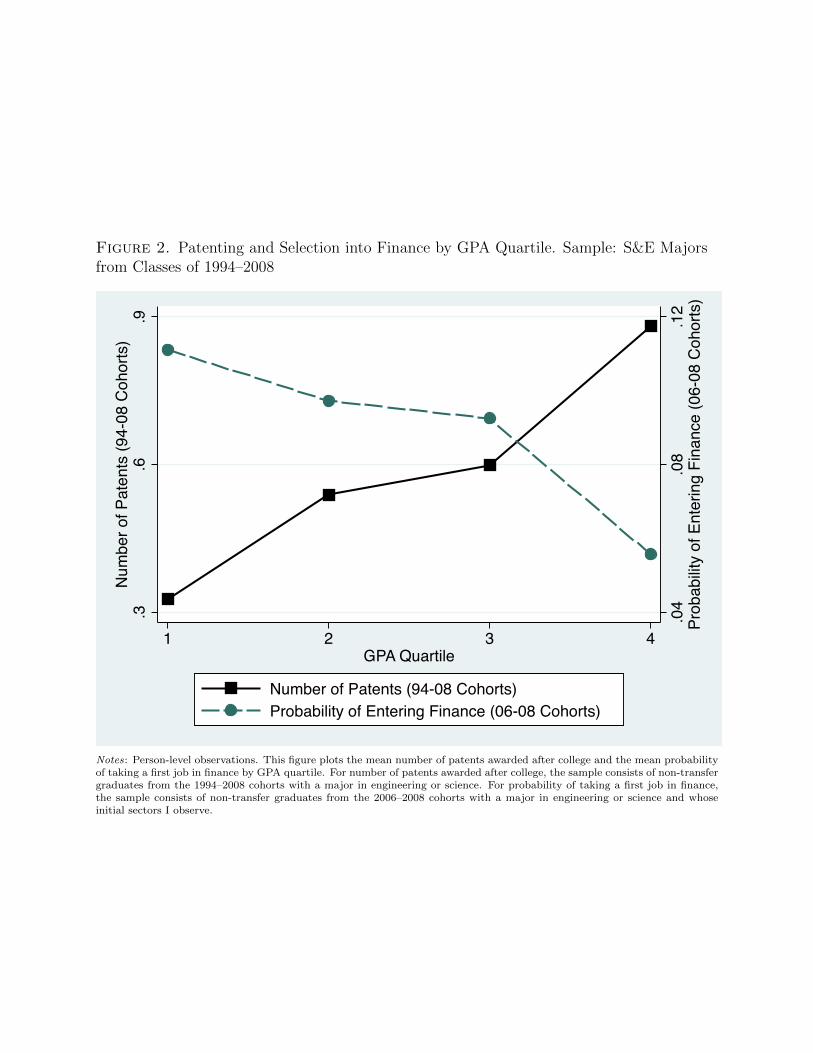
Figure 2. Patenting and Selection into Finance by GPA Quartile. Sample: S&E Majorsfrom Classes of 1994–2008
.04
.08
.12
Prob
abilit
y of
Ent
erin
g Fi
nanc
e (0
6-08
Coh
orts
)
.3.6
.9N
umbe
r of P
aten
ts (9
4-08
Coh
orts
)
1 2 3 4GPA Quartile
Number of Patents (94-08 Cohorts)Probability of Entering Finance (06-08 Cohorts)
Notes: Person-level observations. This figure plots the mean number of patents awarded after college and the mean probabilityof taking a first job in finance by GPA quartile. For number of patents awarded after college, the sample consists of non-transfergraduates from the 1994–2008 cohorts with a major in engineering or science. For probability of taking a first job in finance,the sample consists of non-transfer graduates from the 2006–2008 cohorts with a major in engineering or science and whoseinitial sectors I observe.
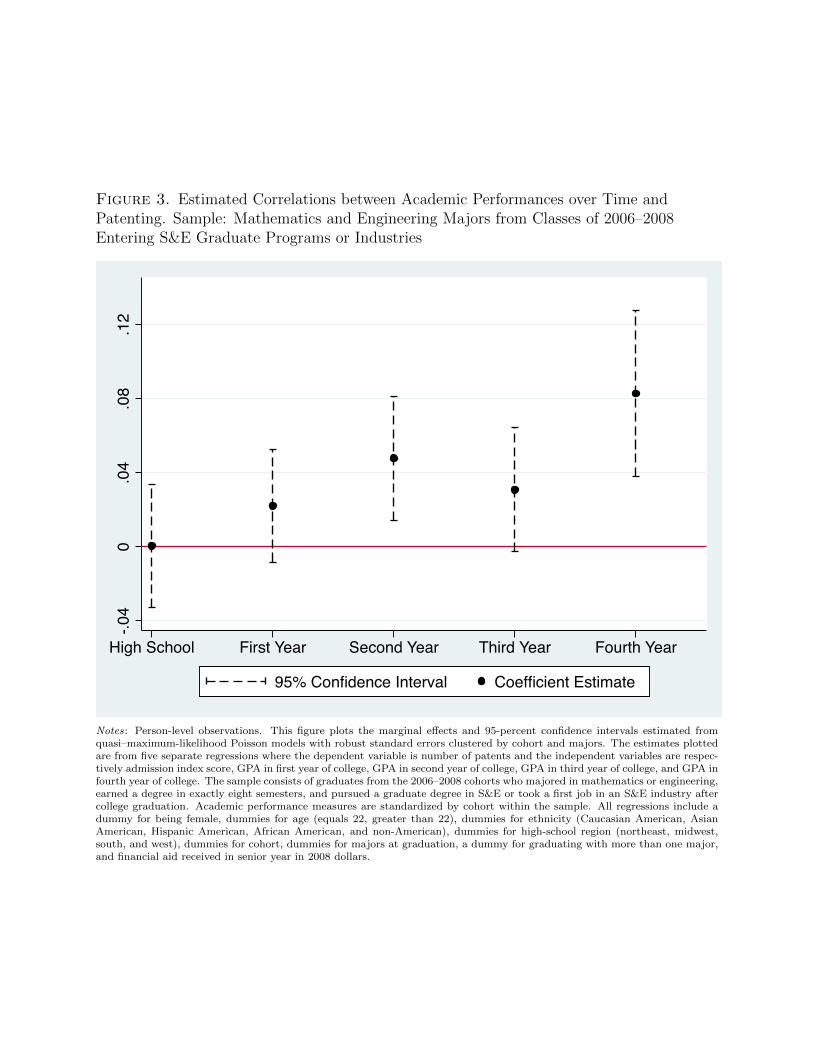
Figure 3. Estimated Correlations between Academic Performances over Time andPatenting. Sample: Mathematics and Engineering Majors from Classes of 2006–2008Entering S&E Graduate Programs or Industries
-.04
0.0
4.0
8.1
2
High School First Year Second Year Third Year Fourth Year
95% Confidence Interval Coefficient Estimate
Notes: Person-level observations. This figure plots the marginal effects and 95-percent confidence intervals estimated fromquasi–maximum-likelihood Poisson models with robust standard errors clustered by cohort and majors. The estimates plottedare from five separate regressions where the dependent variable is number of patents and the independent variables are respec-tively admission index score, GPA in first year of college, GPA in second year of college, GPA in third year of college, and GPA infourth year of college. The sample consists of graduates from the 2006–2008 cohorts who majored in mathematics or engineering,earned a degree in exactly eight semesters, and pursued a graduate degree in S&E or took a first job in an S&E industry aftercollege graduation. Academic performance measures are standardized by cohort within the sample. All regressions include adummy for being female, dummies for age (equals 22, greater than 22), dummies for ethnicity (Caucasian American, AsianAmerican, Hispanic American, African American, and non-American), dummies for high-school region (northeast, midwest,south, and west), dummies for cohort, dummies for majors at graduation, a dummy for graduating with more than one major,and financial aid received in senior year in 2008 dollars.
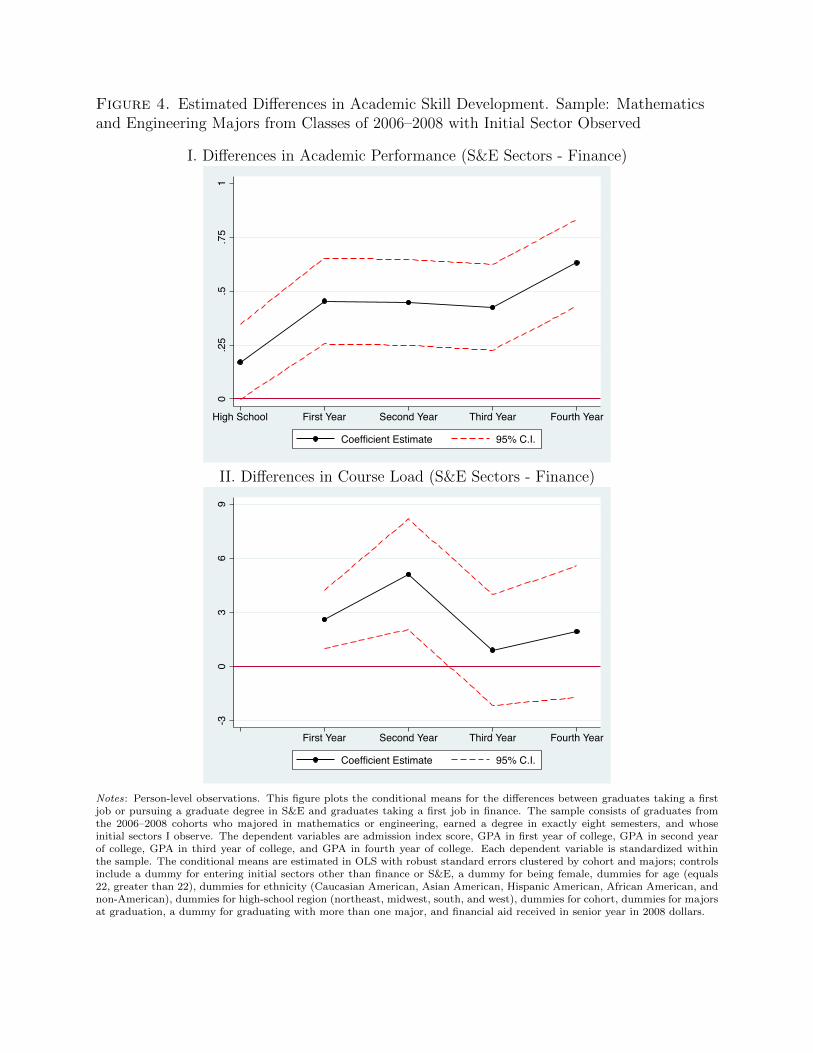
Figure 4. Estimated Differences in Academic Skill Development. Sample: Mathematicsand Engineering Majors from Classes of 2006–2008 with Initial Sector Observed
I. Differences in Academic Performance (S&E Sectors - Finance)
0.2
5.5
.75
1
High School First Year Second Year Third Year Fourth Year
Coefficient Estimate 95% C.I.
II. Differences in Course Load (S&E Sectors - Finance)
-30
36
9
First Year Second Year Third Year Fourth Year
Coefficient Estimate 95% C.I.
Notes: Person-level observations. This figure plots the conditional means for the differences between graduates taking a firstjob or pursuing a graduate degree in S&E and graduates taking a first job in finance. The sample consists of graduates fromthe 2006–2008 cohorts who majored in mathematics or engineering, earned a degree in exactly eight semesters, and whoseinitial sectors I observe. The dependent variables are admission index score, GPA in first year of college, GPA in second yearof college, GPA in third year of college, and GPA in fourth year of college. Each dependent variable is standardized withinthe sample. The conditional means are estimated in OLS with robust standard errors clustered by cohort and majors; controlsinclude a dummy for entering initial sectors other than finance or S&E, a dummy for being female, dummies for age (equals22, greater than 22), dummies for ethnicity (Caucasian American, Asian American, Hispanic American, African American, andnon-American), dummies for high-school region (northeast, midwest, south, and west), dummies for cohort, dummies for majorsat graduation, a dummy for graduating with more than one major, and financial aid received in senior year in 2008 dollars.
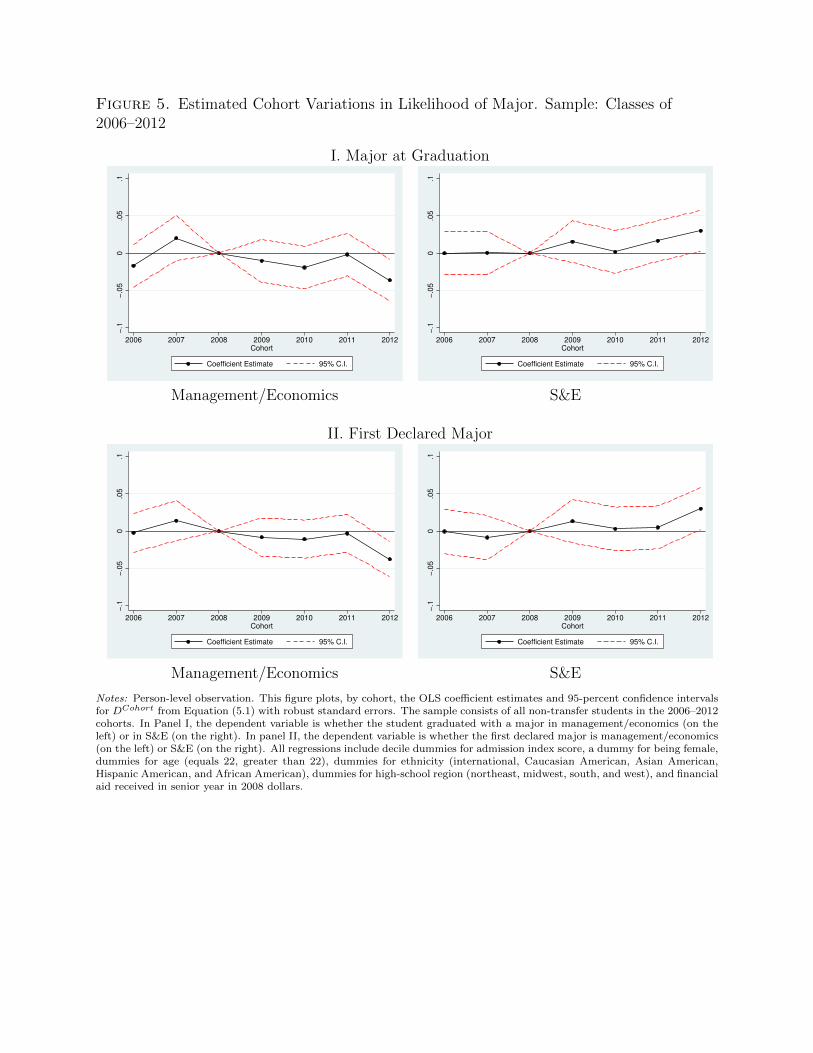
Figure 5. Estimated Cohort Variations in Likelihood of Major. Sample: Classes of2006–2012
I. Major at Graduation
−.1
−.0
50
.05
.1
2006 2007 2008 2009 2010 2011 2012
Cohort
Coefficient Estimate 95% C.I.
−.1
−.0
50
.05
.1
2006 2007 2008 2009 2010 2011 2012
Cohort
Coefficient Estimate 95% C.I.
Management/Economics S&E
II. First Declared Major
−.1
−.0
50
.05
.1
2006 2007 2008 2009 2010 2011 2012
Cohort
Coefficient Estimate 95% C.I.
−.1
−.0
50
.05
.1
2006 2007 2008 2009 2010 2011 2012
Cohort
Coefficient Estimate 95% C.I.
Management/Economics S&E
Notes: Person-level observation. This figure plots, by cohort, the OLS coefficient estimates and 95-percent confidence intervalsfor DCohort from Equation (5.1) with robust standard errors. The sample consists of all non-transfer students in the 2006–2012cohorts. In Panel I, the dependent variable is whether the student graduated with a major in management/economics (on theleft) or in S&E (on the right). In panel II, the dependent variable is whether the first declared major is management/economics(on the left) or S&E (on the right). All regressions include decile dummies for admission index score, a dummy for being female,dummies for age (equals 22, greater than 22), dummies for ethnicity (international, Caucasian American, Asian American,Hispanic American, and African American), dummies for high-school region (northeast, midwest, south, and west), and financialaid received in senior year in 2008 dollars.
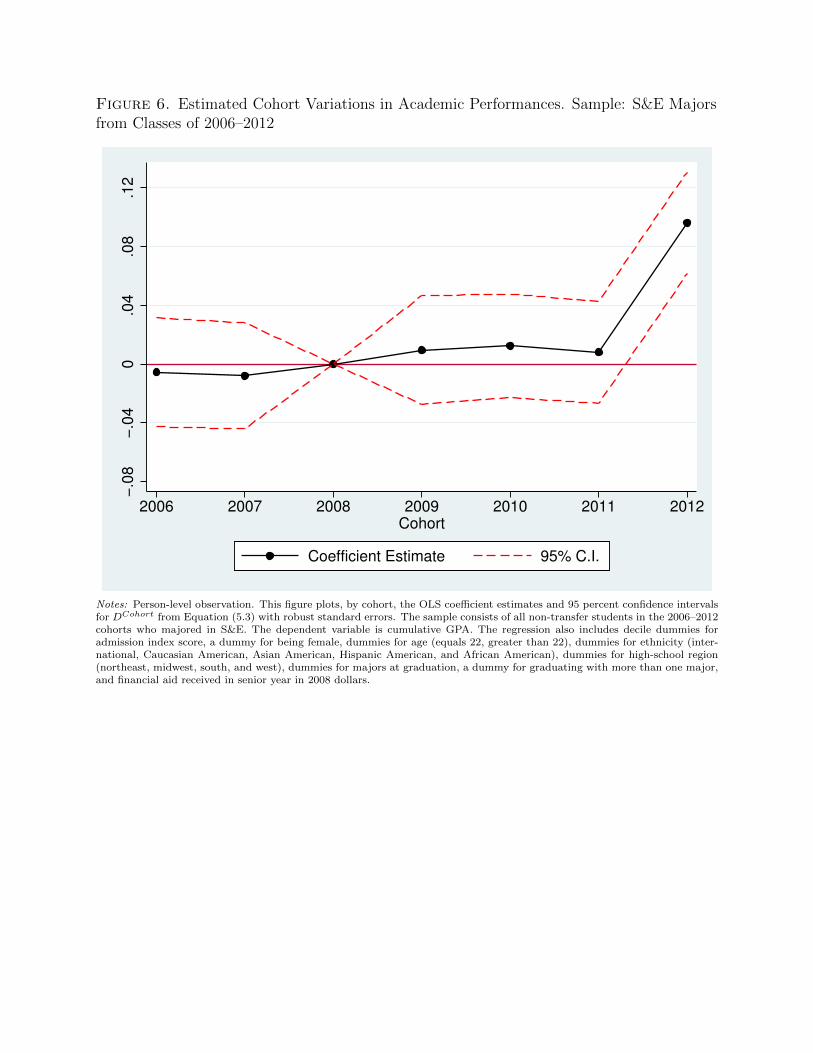
Figure 6. Estimated Cohort Variations in Academic Performances. Sample: S&E Majorsfrom Classes of 2006–2012
−.0
8−
.04
0.0
4.0
8.1
2
2006 2007 2008 2009 2010 2011 2012
Cohort
Coefficient Estimate 95% C.I.
Notes: Person-level observation. This figure plots, by cohort, the OLS coefficient estimates and 95 percent confidence intervalsfor DCohort from Equation (5.3) with robust standard errors. The sample consists of all non-transfer students in the 2006–2012cohorts who majored in S&E. The dependent variable is cumulative GPA. The regression also includes decile dummies foradmission index score, a dummy for being female, dummies for age (equals 22, greater than 22), dummies for ethnicity (inter-national, Caucasian American, Asian American, Hispanic American, and African American), dummies for high-school region(northeast, midwest, south, and west), dummies for majors at graduation, a dummy for graduating with more than one major,and financial aid received in senior year in 2008 dollars.
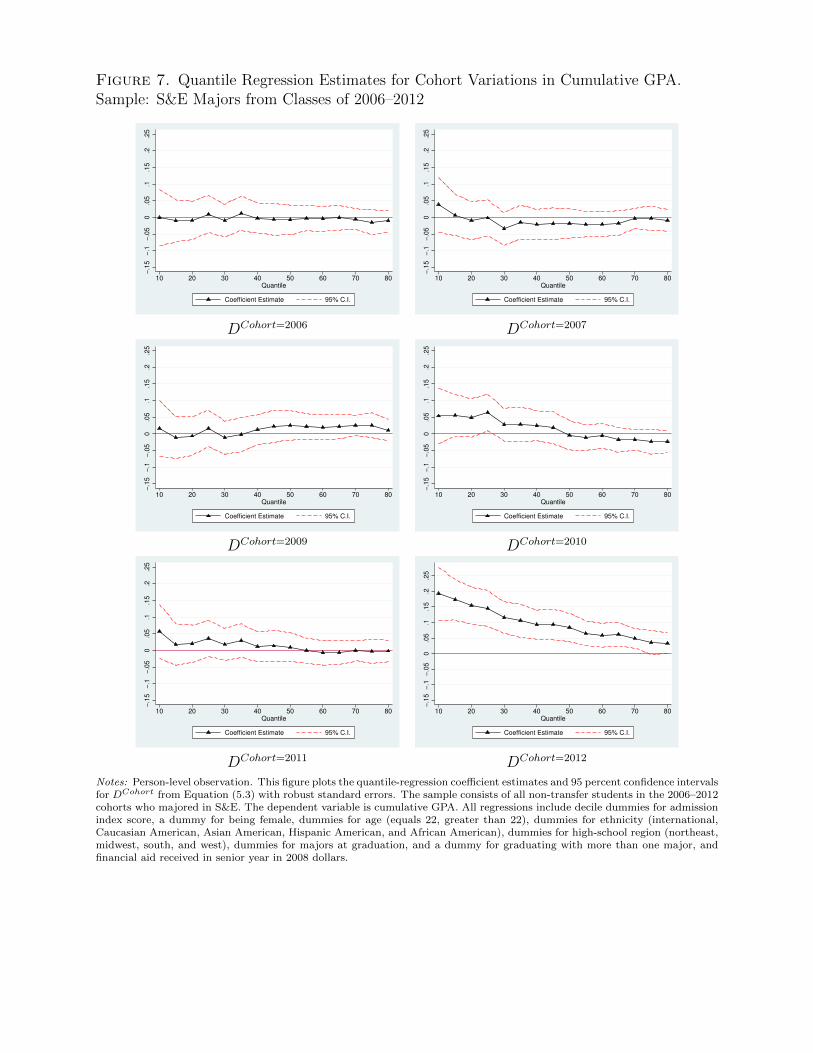
Figure 7. Quantile Regression Estimates for Cohort Variations in Cumulative GPA.Sample: S&E Majors from Classes of 2006–2012
−.1
5−
.1−
.05
0.0
5.1
.15
.2.2
5
10 20 30 40 50 60 70 80
Quantile
Coefficient Estimate 95% C.I.
−.1
5−
.1−
.05
0.0
5.1
.15
.2.2
5
10 20 30 40 50 60 70 80
Quantile
Coefficient Estimate 95% C.I.
DCohort=2006 DCohort=2007
−.1
5−
.1−
.05
0.0
5.1
.15
.2.2
5
10 20 30 40 50 60 70 80
Quantile
Coefficient Estimate 95% C.I.
−.1
5−
.1−
.05
0.0
5.1
.15
.2.2
5
10 20 30 40 50 60 70 80
Quantile
Coefficient Estimate 95% C.I.
DCohort=2009 DCohort=2010
−.1
5−
.1−
.05
0.0
5.1
.15
.2.2
5
10 20 30 40 50 60 70 80
Quantile
Coefficient Estimate 95% C.I.
−.1
5−
.1−
.05
0.0
5.1
.15
.2.2
5
10 20 30 40 50 60 70 80
Quantile
Coefficient Estimate 95% C.I.
DCohort=2011 DCohort=2012
Notes: Person-level observation. This figure plots the quantile-regression coefficient estimates and 95 percent confidence intervalsfor DCohort from Equation (5.3) with robust standard errors. The sample consists of all non-transfer students in the 2006–2012cohorts who majored in S&E. The dependent variable is cumulative GPA. All regressions include decile dummies for admissionindex score, a dummy for being female, dummies for age (equals 22, greater than 22), dummies for ethnicity (international,Caucasian American, Asian American, Hispanic American, and African American), dummies for high-school region (northeast,midwest, south, and west), dummies for majors at graduation, and a dummy for graduating with more than one major, andfinancial aid received in senior year in 2008 dollars.
Appendix
A.1 Matching MIT alumni to USPTO patents
I match MIT graduates to the U.S. Patent and Inventor Database constructed by Li, Lai,
D’Amour, Doolin, Sun, Torvik, Yu, and Fleming (2014). My matching procedure consists
of three main steps. The first step generates the sample of potential matches using first and
last names. The matching is done at the graduate/patent/inventor level. The second step
uses additional information, such as middle names and locations, to calculate a likelihood
score for each graduate/patent/inventor pair. Pairs that generate sufficiently high scores
are considered correct matches. The final step ensures that each patent-inventor record is
matched to only one graduate and collapses the data at the graduate/patent level. I discuss
each step in detail below.
A.1.1 Initial matching using first and last names
The first step employs both exact and fuzzy name matching. I use records from the MIT
Registrar’s Office, the Alumni Association, and LinkedIn to capture possible name variations
and name changes for MIT graduates. The patent-inventor records include inventors’ full
names and distinguish between first and last name fields; middle names can be included in
either name field. I treat the first word in an inventor’s first-name field and the last word
in his or her last-name field as first and last names respectively. In cases of exact matching,
an MIT graduate’s first and last name perfectly match an inventor’s imputed first and last
name.37 In cases of fuzzy matching, a graduate’s first and last names both appear in an
inventor’s full name and the remainder of the name could match. I drop pairs in which both
graduate and inventor have middle names but those middle names are completely different.
37In cases in which a graduate has a two-word first or last name (e.g., MARY JANE), I createpermutations of the name (e.g., MARY and MARYJANE).

A.1.2 Determining the likelihood of a match
The second step calculates the likelihood that each graduate/patent/inventor pair is a
correct match based on (a) how well the middle names match, (b) how well the locations
match, and (c) how rare the first and last names are. Intuitively, if the middle names and
locations match well and the graduate has an uncommon name, the pair is very likely to
be a correct match. If the names are common and the additional information does not
quite match, the pair is unlikely to be a correct match. I follow the Bayesian methodology
developed by Torvik, Weeber, Swanson, and Smalheiser (2005) and Smalheiser and Torvik
(2009) to calculate a likelihood score. The detailed steps are:
1. For each graduate/patent/inventor pair, construct a two-dimensional vector x = (x1, x2),
where x1 measures how well the middle names match and x2 measures how well the
locations match. The values of x1 are determined as follows:
• 4: the two middle names match exactly, or neither has a middle name.
• 3: one or both names are initials and the initials match; or the middle names are
not initials but one includes the other.
• 2: the graduate has a middle name but the inventor’s middle name is missing
(possibly because he or she did not list a middle name on patents); or the first
and last names are fuzzily matched and the middle names are similar.
• 1: the graduate does not have a middle name but the inventor does.
The values of x2 are determined as follows:
• 4: both are from the same U.S. city, or the distance between listed cities and/or
zip codes is less than 15 miles.
• 3: both are from the same state, or the distance between their locations is less
than 50 miles.
• 2: the inventor’s location is in Massachusetts or California, or the distance is less
than 150 miles,
• 1: all other cases (including international/mismatched/missing locations)
2. Calculate the probability of x conditional on being a correct match, P (x|M), using a
training dataset with highly likely matches. The highly likely matches satisfy all of
the following criteria:
• The assignee of the patent matches one of the organizations that the graduate
has worked for or studied in post-college, according to his/her profile on LinkedIn
and the Alumni Directory (excluding MIT). The matching between assignees and
organizations follows the methodology developed by Autor, Dorn, Hanson, Pisano,
and Shu (2016).
• The application year on the patent is not earlier than the year of college gradua-
tion.
Some graduates list their patents on their LinkedIn profiles; those patents are added
to the training data. P (x|M) is calculated as the number of highly likely matches for
a given x divided by the total number of highly likely matches.
3. Calculate the probability of x conditional on being an incorrect match, P (x|N), using
a training dataset with highly unlikely matches. The highly unlikely matches satisfy
one of the following criteria:
• If an inventor record is matched to multiple graduates and one of them is a highly
likely match, as determined above, the rest of the matches are considered highly
unlikely.
• The patent is applied for more than four years before college graduation.
As above, P (x|N) is calculated as the number of highly unlikely matches for a given
x divided by the total number of highly unlikely matches.

4. Calculate the raw likelihood ratio r̃ (x) = P (x|M)P (x|N)
and apply monotonic smoothing. The
likelihood ratio, r (x), is calculated as having the closest sum of distance squared to
r̃ (x) conditional on the monotonic constraint. The monotonic constraint is that for
two xa and xb where xa1 ≥ xb1 and xa2 ≥ xb2, r (xa) ≥ r(xb). The correlation between
the raw ratio and the monotonically smoothed ratio is 0.952.
5. Calculate the a priori match probability P (M) based on the commonality of first and
last names. For each first and last name, I calculate the number of unique grad-
uate/inventor pairs who share the names; a higher number means a more common
name. I regress the probability of being a highly likely match on the log of this
number, within the training data of highly likely and unlikely matches. P (M) is the
predicted probability from the logistic regression.
6. Based on Bayes’ Theorem, the likelihood score is then calculated as
P (M |x) =1
1 + 1−P (M)P (M)
1r(x)
.
I consider a pair to be a match if the likelihood score is above a certain threshold (and
not a highly unlikely match). Torvik, Weeber, Swanson, and Smalheiser (2005) use 0.5 as
the cutoff, which means that false-positive matches are penalized to the same degree as
false-negative matches. In my case, however, the false-positive matches are more damaging
than the false-negative matches since patenting is a relatively rare event. After manually
inspecting the matching pairs at the margin, I choose a threshold of 0.845, which is at the
95th percentile for highly unlikely matches and the 12th percentile for highly likely matches.
Using a slightly higher or lower threshold does not change my key empirical findings.
A.1.3 Finalizing the data
In the rare cases where the same patent-inventor record is matched to multiple graduates,
I apply the following tie-breakers:
1. Keep the graduate who appears in the training data of highly likely matches, if any.
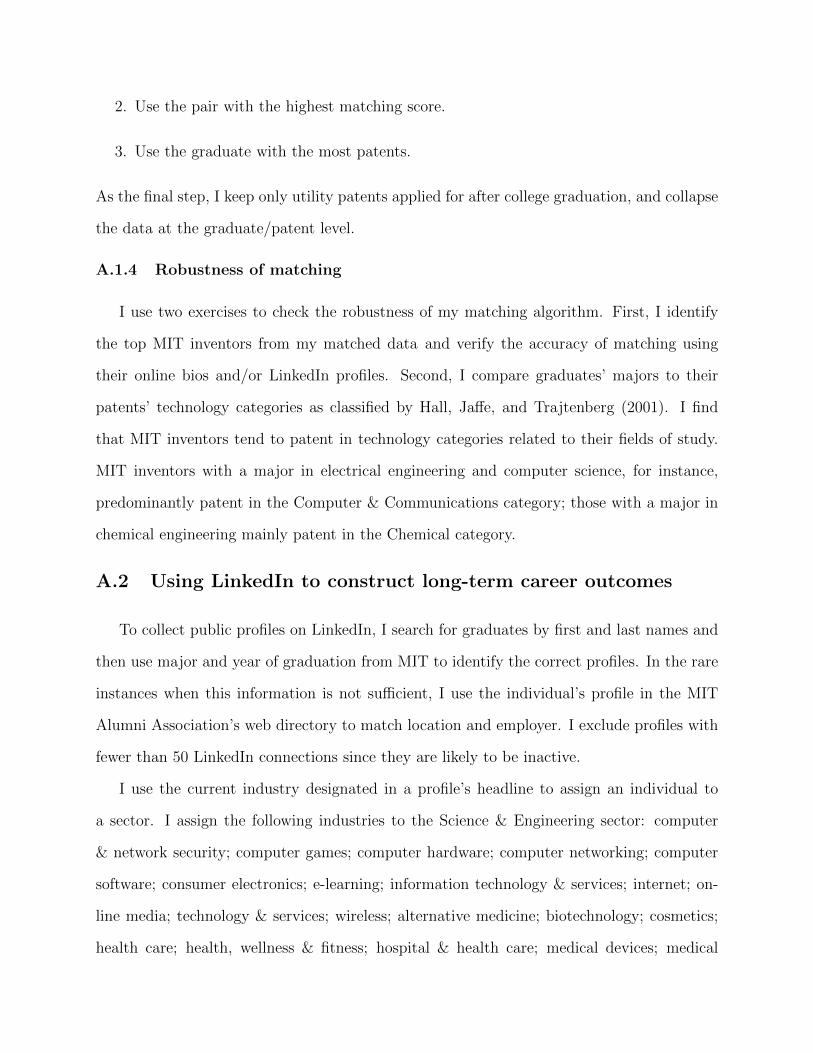
2. Use the pair with the highest matching score.
3. Use the graduate with the most patents.
As the final step, I keep only utility patents applied for after college graduation, and collapse
the data at the graduate/patent level.
A.1.4 Robustness of matching
I use two exercises to check the robustness of my matching algorithm. First, I identify
the top MIT inventors from my matched data and verify the accuracy of matching using
their online bios and/or LinkedIn profiles. Second, I compare graduates’ majors to their
patents’ technology categories as classified by Hall, Jaffe, and Trajtenberg (2001). I find
that MIT inventors tend to patent in technology categories related to their fields of study.
MIT inventors with a major in electrical engineering and computer science, for instance,
predominantly patent in the Computer & Communications category; those with a major in
chemical engineering mainly patent in the Chemical category.
A.2 Using LinkedIn to construct long-term career outcomes
To collect public profiles on LinkedIn, I search for graduates by first and last names and
then use major and year of graduation from MIT to identify the correct profiles. In the rare
instances when this information is not sufficient, I use the individual’s profile in the MIT
Alumni Association’s web directory to match location and employer. I exclude profiles with
fewer than 50 LinkedIn connections since they are likely to be inactive.
I use the current industry designated in a profile’s headline to assign an individual to
a sector. I assign the following industries to the Science & Engineering sector: computer
& network security; computer games; computer hardware; computer networking; computer
software; consumer electronics; e-learning; information technology & services; internet; on-
line media; technology & services; wireless; alternative medicine; biotechnology; cosmetics;
health care; health, wellness & fitness; hospital & health care; medical devices; medical

practice; mental health care; pharmaceuticals; veterinary; airlines & aviation; automotive;
aviation & aerospace; chemicals; civil engineering; construction; consumer goods; defense
& space; design; electrical/electronic manufacturing; energy; environment; environment &
renewable energy; environmental services; food & beverages; food production; industrial au-
tomation; logistics & supply chain; maritime; mechanical or industrial engineering; metals;
mining & metals; nanotechnology; oil & energy; packaging & containers; renewables & envi-
ronment; semiconductors; space; sporting goods; telecommunications; textiles; transporta-
tion/trucking/railroad; utilities; warehousing; wine & spirits; higher education; military; and
research.
I assign the following industries to Finance: banking; capital markets; financial services;
insurance; investment banking; investment management; private equity; and venture capital
& private equity.
The following industries are categorized as Other: accounting; animation; apparel &
fashion; architecture & planning; arts & crafts; broadcast media; building materials; civic &
social organization; commercial real estate; consumer services; diplomatic service; education
management; entertainment; executive office; fashion; fine art; foreign affairs; fund rais-
ing; gambling & casinos; government administration; government relations; graphic design;
gambling casinos; hospitality; human resources; individual & family services; international
affairs; international trade & development; law enforcement; law practice; legal services;
leisure travel & tourism; libraries; luxury goods & jewelry; management consulting; market
research; marketing & advertising; media production; motion pictures & film; museums
& institutions; music; non-profit organization management; performing arts; philanthropy;
photography; political organization; printing; primary/secondary education; professional
training & coaching; program development; public policy; public relations and communi-
cations; public safety; public service; publishing; real estate; restaurants; retail; sports;
security & investigations; staffing & recruiting; sports; supermarkets; think tanks; tourism;
and writing & editing.

A.3 Additional Tables and Figures
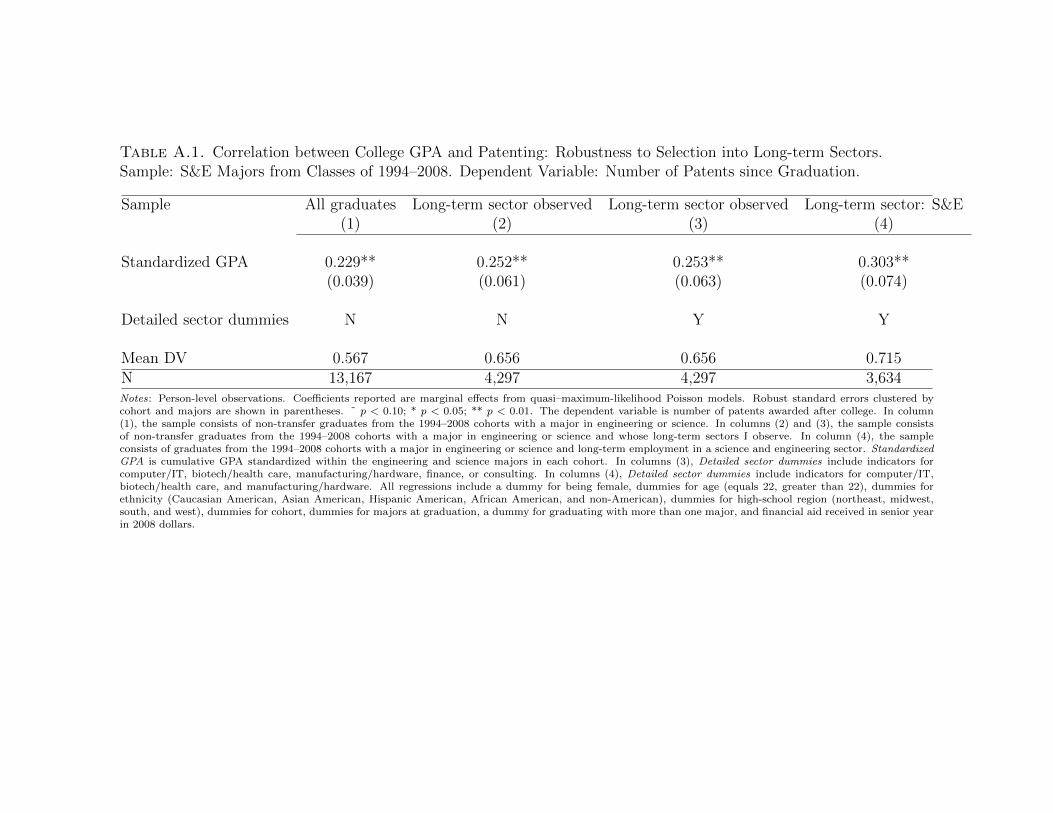
Table A.1. Correlation between College GPA and Patenting: Robustness to Selection into Long-term Sectors.Sample: S&E Majors from Classes of 1994–2008. Dependent Variable: Number of Patents since Graduation.
Sample All graduates Long-term sector observed Long-term sector observed Long-term sector: S&E(1) (2) (3) (4)
Standardized GPA 0.229** 0.252** 0.253** 0.303**(0.039) (0.061) (0.063) (0.074)
Detailed sector dummies N N Y Y
Mean DV 0.567 0.656 0.656 0.715N 13,167 4,297 4,297 3,634Notes: Person-level observations. Coefficients reported are marginal effects from quasi–maximum-likelihood Poisson models. Robust standard errors clustered bycohort and majors are shown in parentheses. ˜ p < 0.10; * p < 0.05; ** p < 0.01. The dependent variable is number of patents awarded after college. In column(1), the sample consists of non-transfer graduates from the 1994–2008 cohorts with a major in engineering or science. In columns (2) and (3), the sample consistsof non-transfer graduates from the 1994–2008 cohorts with a major in engineering or science and whose long-term sectors I observe. In column (4), the sampleconsists of graduates from the 1994–2008 cohorts with a major in engineering or science and long-term employment in a science and engineering sector. StandardizedGPA is cumulative GPA standardized within the engineering and science majors in each cohort. In columns (3), Detailed sector dummies include indicators forcomputer/IT, biotech/health care, manufacturing/hardware, finance, or consulting. In columns (4), Detailed sector dummies include indicators for computer/IT,biotech/health care, and manufacturing/hardware. All regressions include a dummy for being female, dummies for age (equals 22, greater than 22), dummies forethnicity (Caucasian American, Asian American, Hispanic American, African American, and non-American), dummies for high-school region (northeast, midwest,south, and west), dummies for cohort, dummies for majors at graduation, a dummy for graduating with more than one major, and financial aid received in senior yearin 2008 dollars.
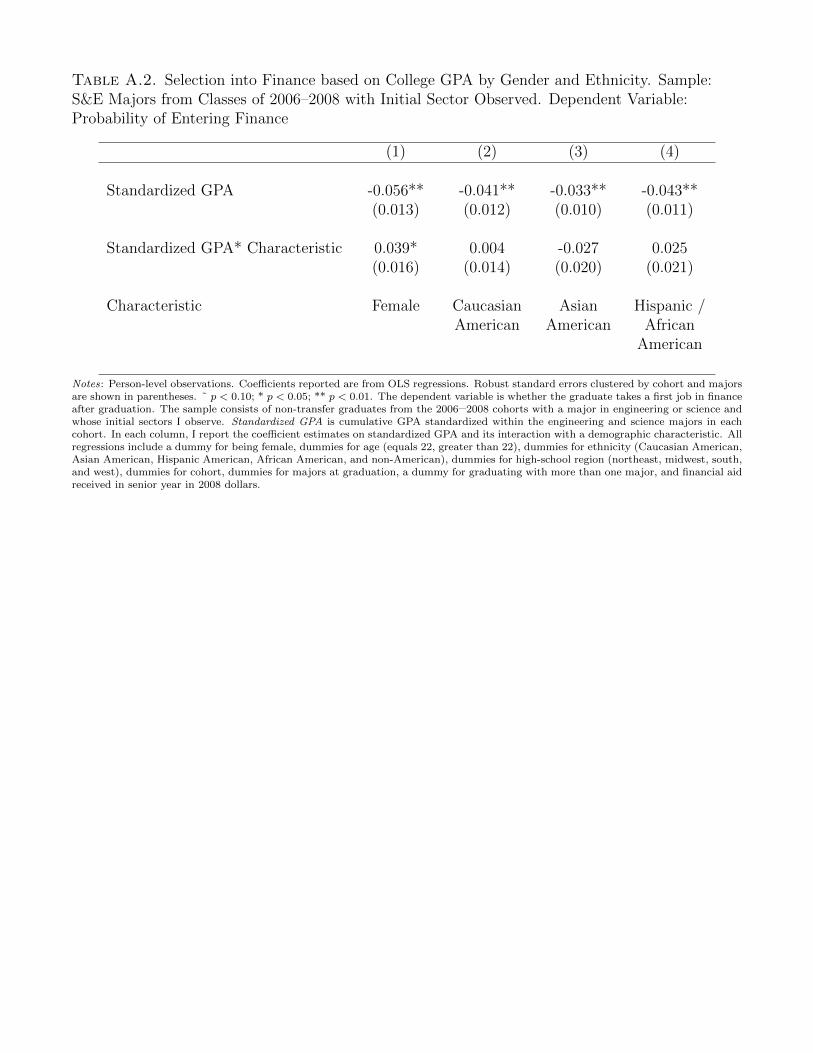
Table A.2. Selection into Finance based on College GPA by Gender and Ethnicity. Sample:S&E Majors from Classes of 2006–2008 with Initial Sector Observed. Dependent Variable:Probability of Entering Finance
(1) (2) (3) (4)
Standardized GPA -0.056** -0.041** -0.033** -0.043**(0.013) (0.012) (0.010) (0.011)
Standardized GPA* Characteristic 0.039* 0.004 -0.027 0.025(0.016) (0.014) (0.020) (0.021)
Characteristic Female CaucasianAmerican
AsianAmerican
Hispanic /African
American
Notes: Person-level observations. Coefficients reported are from OLS regressions. Robust standard errors clustered by cohort and majorsare shown in parentheses. ˜ p < 0.10; * p < 0.05; ** p < 0.01. The dependent variable is whether the graduate takes a first job in financeafter graduation. The sample consists of non-transfer graduates from the 2006–2008 cohorts with a major in engineering or science andwhose initial sectors I observe. Standardized GPA is cumulative GPA standardized within the engineering and science majors in eachcohort. In each column, I report the coefficient estimates on standardized GPA and its interaction with a demographic characteristic. Allregressions include a dummy for being female, dummies for age (equals 22, greater than 22), dummies for ethnicity (Caucasian American,Asian American, Hispanic American, African American, and non-American), dummies for high-school region (northeast, midwest, south,and west), dummies for cohort, dummies for majors at graduation, a dummy for graduating with more than one major, and financial aidreceived in senior year in 2008 dollars.
Table A.3. Estimated Cohort Variations in College Skill Development Conditional on High-School Activities.Sample: Classes of 2010–2012
Dep. Var. First Major in Mgmt/Econ First Major in S&E Major in S&E Cumulative GPA(1) (2) (3) (4) (5) (6) (7) (8)
D2011 0.007 0.004 0.002 0.004 0.016 0.017 -0.004 -0.005(0.013) (0.013) (0.015) (0.015) (0.014) (0.014) (0.017) (0.017)
D2012 -0.032** -0.031** 0.034* 0.033* 0.035* 0.034* 0.083** 0.083**(0.012) (0.012) (0.015) (0.015) (0.014) (0.014) (0.017) (0.017)
High-school activities Y Y Y YMajor dummies Y YN 2,658 2,658 2,658 2,658 2,658 2,658 2,658 2,658
Notes: Person-level observation. All estimates are from OLS with robust standard errors. ˜ p < 0.10; * p < 0.05; ** p < 0.01. The sample consists of graduatesfrom the 2010–2012 cohorts with valid responses on high-school activities (97.7 percent of the 2010–2012 cohorts). In columns (1)–(2), the dependent variable is anindicator variable for declaring a first major in management or economics. In columns (3)–(4), the dependent variable is an indicator variable for declaring a firstmajor in S&E. In columns (5)–(6), the dependent variable is an indicator variable for graduating with a major in S&E. In columns (7)–(8), the dependent variable iscumulative GPA. D2011: indicator variable for the 2011 cohort. D2012: indicator variable for the 2012 cohort. High-school activities include indicator variables forparticipation in varsity sports, performing arts (music/theater/dance), and clubs (community service, student government, student publications) and for leadershipin these activities. Major dummies include dummies for majors at graduation and a dummy for graduating with more than one majors. All regressions includedecile dummies for admission index score, a dummy for being female, dummies for age (equals 22, greater than 22), dummies for ethnicity (Caucasian American,Asian American, Hispanic American, African American, and non-American), dummies for high-school region (northeast, midwest, south, and west), and financial aidreceived in senior year in 2008 dollars.
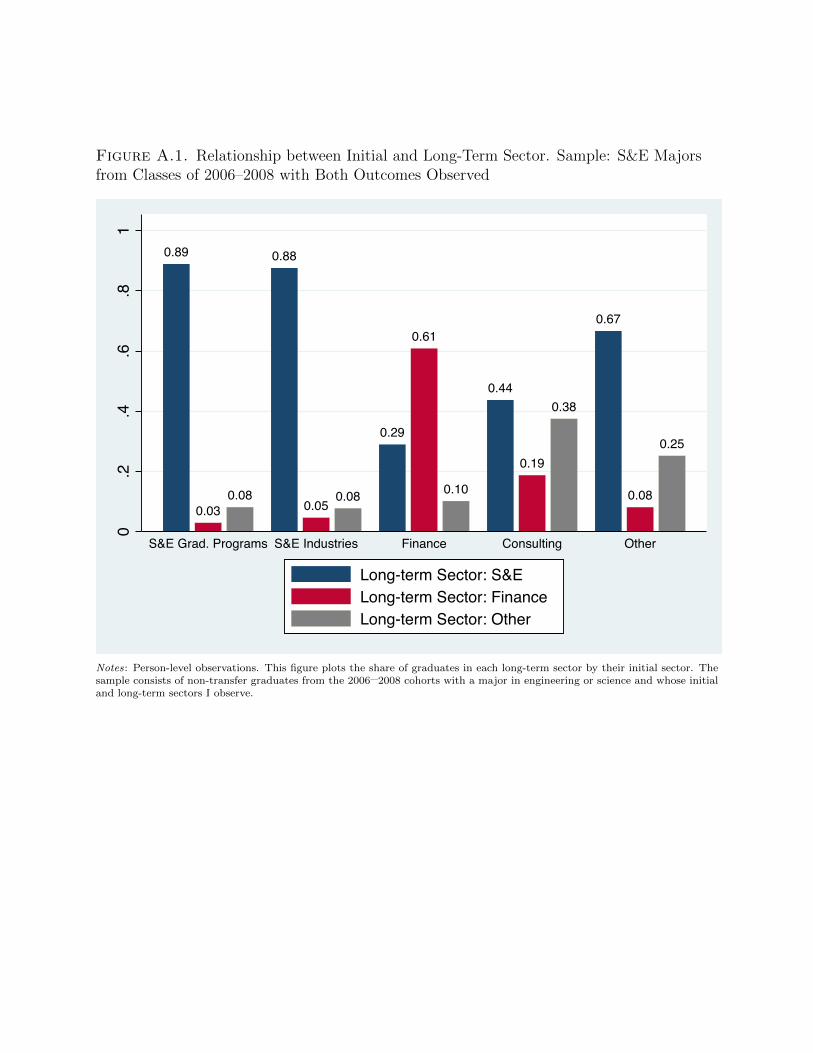
Figure A.1. Relationship between Initial and Long-Term Sector. Sample: S&E Majorsfrom Classes of 2006–2008 with Both Outcomes Observed
0.89
0.030.08
0.88
0.050.08
0.29
0.61
0.10
0.44
0.19
0.38
0.67
0.08
0.25
0.2
.4.6
.81
S&E Grad. Programs S&E Industries Finance Consulting Other
Long-term Sector: S&ELong-term Sector: FinanceLong-term Sector: Other
Notes: Person-level observations. This figure plots the share of graduates in each long-term sector by their initial sector. Thesample consists of non-transfer graduates from the 2006–2008 cohorts with a major in engineering or science and whose initialand long-term sectors I observe.
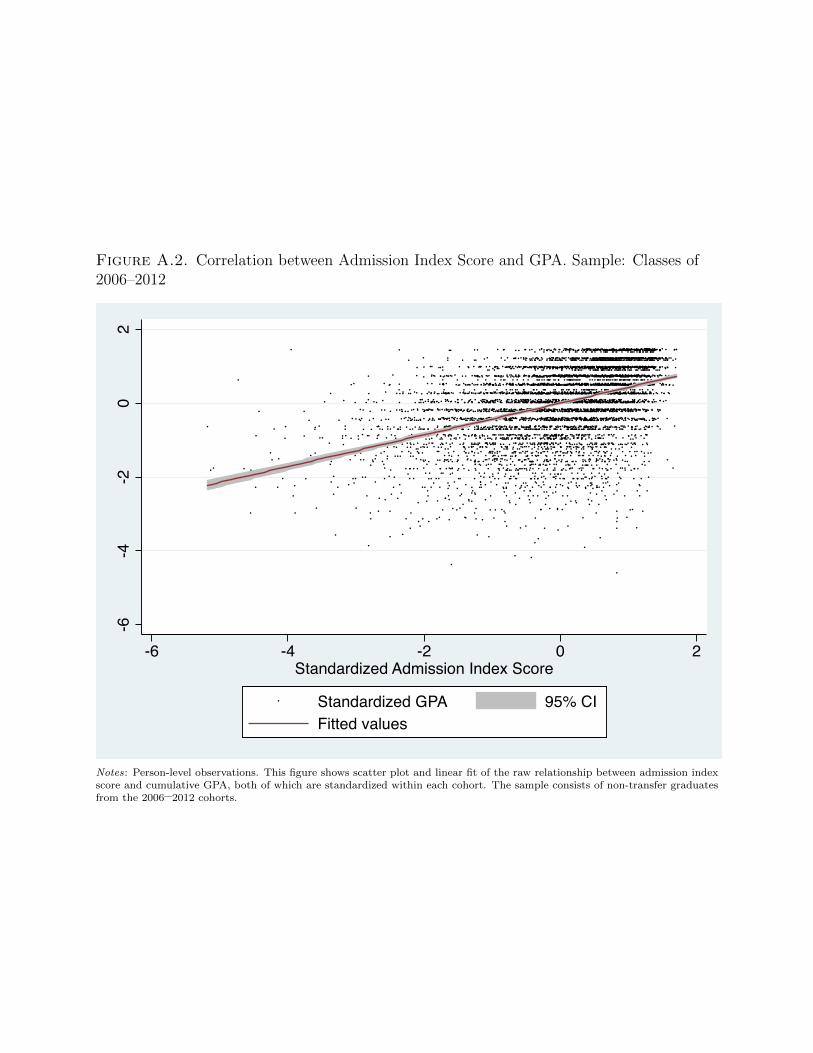
Figure A.2. Correlation between Admission Index Score and GPA. Sample: Classes of2006–2012
-6-4
-20
2
-6 -4 -2 0 2Standardized Admission Index Score
Standardized GPA 95% CIFitted values
Notes: Person-level observations. This figure shows scatter plot and linear fit of the raw relationship between admission indexscore and cumulative GPA, both of which are standardized within each cohort. The sample consists of non-transfer graduatesfrom the 2006–2012 cohorts.
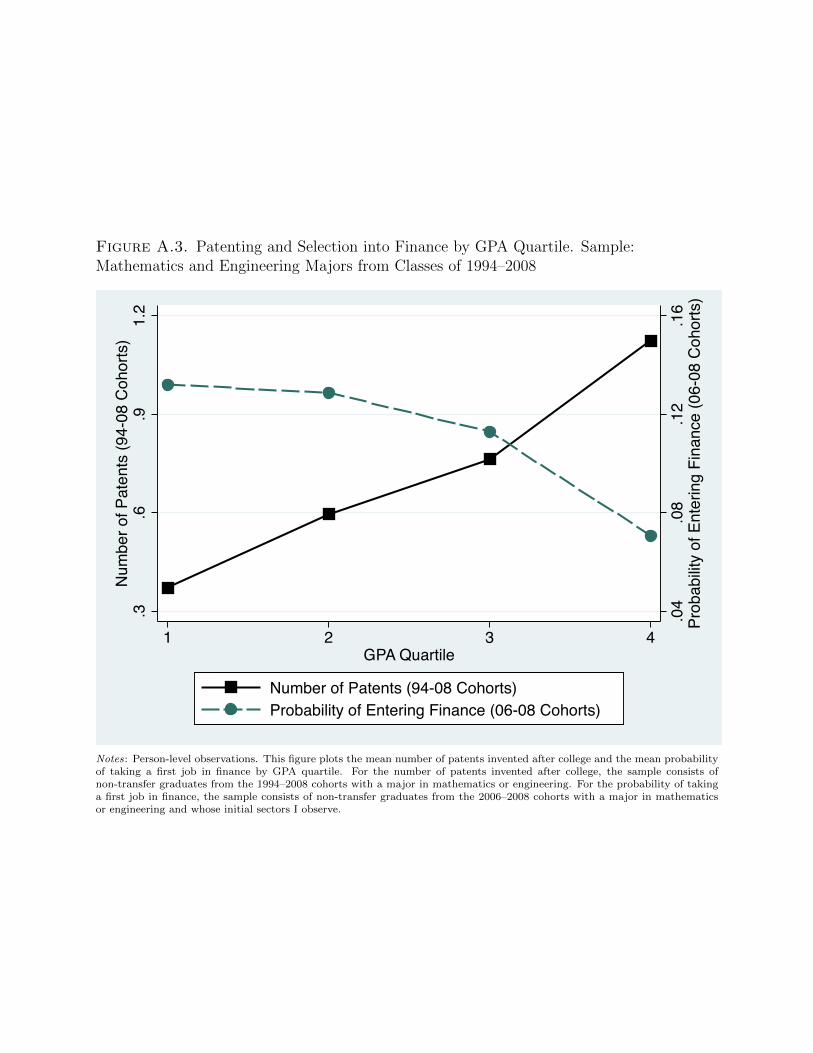
Figure A.3. Patenting and Selection into Finance by GPA Quartile. Sample:Mathematics and Engineering Majors from Classes of 1994–2008
.04
.08
.12
.16
Prob
abilit
y of
Ent
erin
g Fi
nanc
e (0
6-08
Coh
orts
)
.3.6
.91.
2N
umbe
r of P
aten
ts (9
4-08
Coh
orts
)
1 2 3 4GPA Quartile
Number of Patents (94-08 Cohorts)Probability of Entering Finance (06-08 Cohorts)
Notes: Person-level observations. This figure plots the mean number of patents invented after college and the mean probabilityof taking a first job in finance by GPA quartile. For the number of patents invented after college, the sample consists ofnon-transfer graduates from the 1994–2008 cohorts with a major in mathematics or engineering. For the probability of takinga first job in finance, the sample consists of non-transfer graduates from the 2006–2008 cohorts with a major in mathematicsor engineering and whose initial sectors I observe.
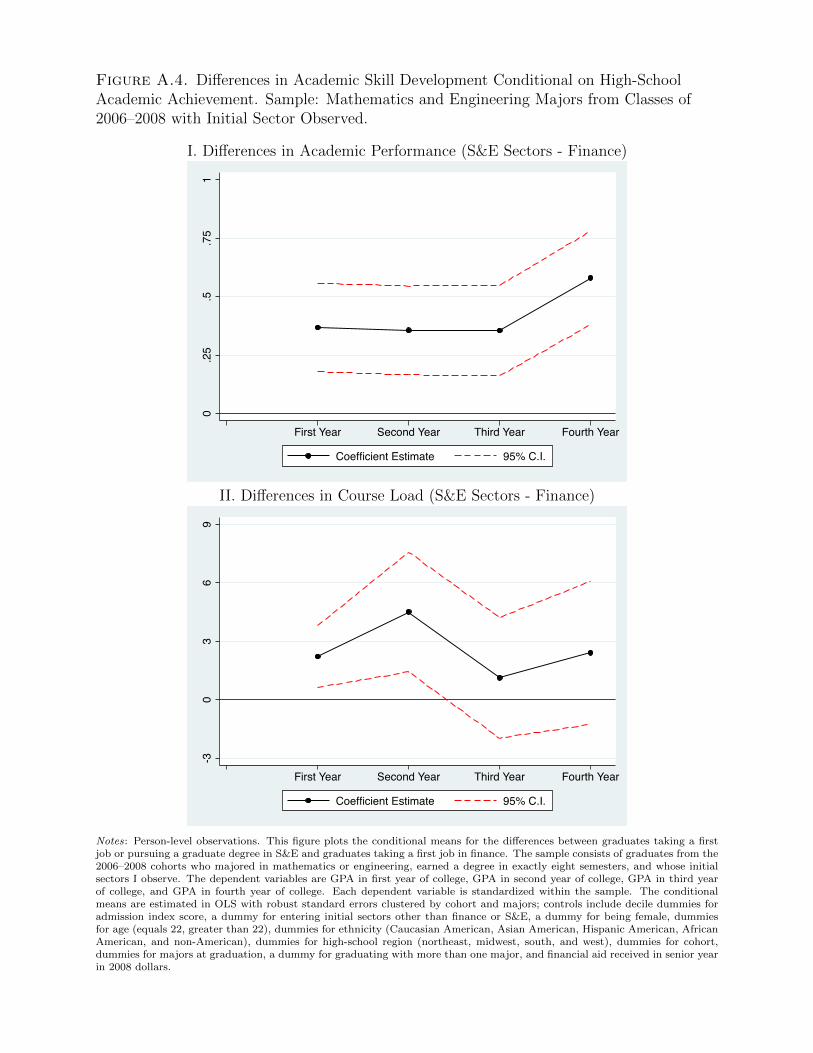
Figure A.4. Differences in Academic Skill Development Conditional on High-SchoolAcademic Achievement. Sample: Mathematics and Engineering Majors from Classes of2006–2008 with Initial Sector Observed.
I. Differences in Academic Performance (S&E Sectors - Finance)
0.2
5.5
.75
1
First Year Second Year Third Year Fourth Year
Coefficient Estimate 95% C.I.
II. Differences in Course Load (S&E Sectors - Finance)
-30
36
9
First Year Second Year Third Year Fourth Year
Coefficient Estimate 95% C.I.
Notes: Person-level observations. This figure plots the conditional means for the differences between graduates taking a firstjob or pursuing a graduate degree in S&E and graduates taking a first job in finance. The sample consists of graduates from the2006–2008 cohorts who majored in mathematics or engineering, earned a degree in exactly eight semesters, and whose initialsectors I observe. The dependent variables are GPA in first year of college, GPA in second year of college, GPA in third yearof college, and GPA in fourth year of college. Each dependent variable is standardized within the sample. The conditionalmeans are estimated in OLS with robust standard errors clustered by cohort and majors; controls include decile dummies foradmission index score, a dummy for entering initial sectors other than finance or S&E, a dummy for being female, dummiesfor age (equals 22, greater than 22), dummies for ethnicity (Caucasian American, Asian American, Hispanic American, AfricanAmerican, and non-American), dummies for high-school region (northeast, midwest, south, and west), dummies for cohort,dummies for majors at graduation, a dummy for graduating with more than one major, and financial aid received in senior yearin 2008 dollars.