innovation & investment - infratil
TRANSCRIPT

01
Innovation & Investment
Infratil Annual Report 2021
The lack of preparation for the covid pandemic resulted in extreme measures to protect people and maintain economic equilibrium. Because they were considered necessary to save lives many measures crossed established boundaries of personal freedoms and cost, without causing social backlash (mainly).
While covid remains a threat, attention is now focused on other environmental and social concerns. And fueled by the experience of covid, there is both urgency to get ahead of the challenges and willingness to undertake big, if not extreme, measures.
But there are other lessons that should be taken from the covid response. The benefits of social unity and shared responsibility, and the efficiency which comes from good planning and management (and the cost when planning and execution are poor).
Covid, climate change, species extinction, social dislocation,
deprivation and loss of personal fulfilment, are all challenges with shared consequences. “Privatising profits and socialising costs” is in focus and is impacting how companies prioritise their responsibilities to their owners and to society and the environment. To be successful for its owners a company must show that it is positively contributing to its people, to those who use its services, to its community and to the environment.
Especially with climate change, corporate profits are no solace if global warming continues with terrible consequences.
But anyone who wants to see social and environmental challenges met and surmounted, should also want to enlist corporate innovation, investment and capability. Companies cannot invest to only deliver social and environmental goods. If they don’t provide a return on financial capital that capital will be withdrawn, but they must also deliver
positive returns on all of financial, human, social and natural capital.
Infratil’s goal is to provide good risk-adjusted returns for shareholders and in so doing to allocate capital and to manage its activities in recognition of wider responsibilities. It must also be accountable through measurement, reporting, and transparency.
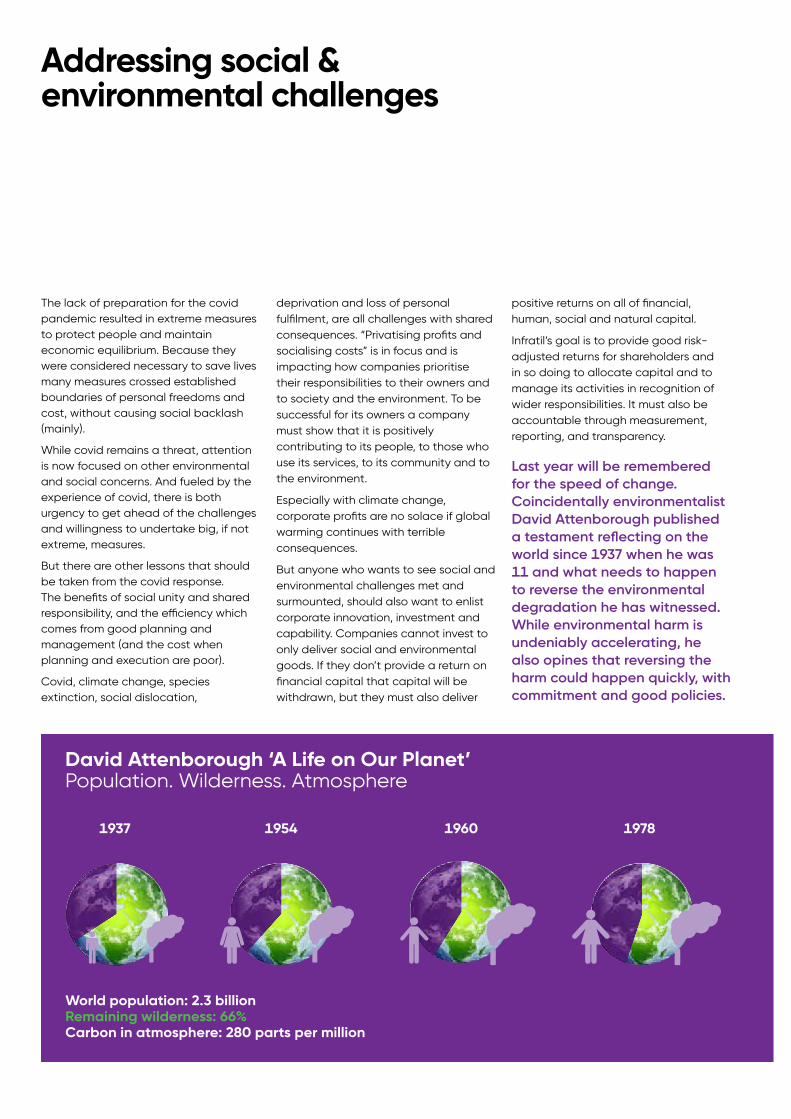
Last year will be remembered for the speed of change. Coincidentally environmentalist David Attenborough published a testament reflecting on the world since 1937 when he was 11 and what needs to happen to reverse the environmental degradation he has witnessed. While environmental harm is undeniably accelerating, he also opines that reversing the harm could happen quickly, with commitment and good policies.
Addressing social & environmental challenges
1954 1960 19781937
World population: 2.3 billion Remaining wilderness: 66% Carbon in atmosphere: 280 parts per million
David Attenborough ‘A Life on Our Planet’Population. Wilderness. Atmosphere
01
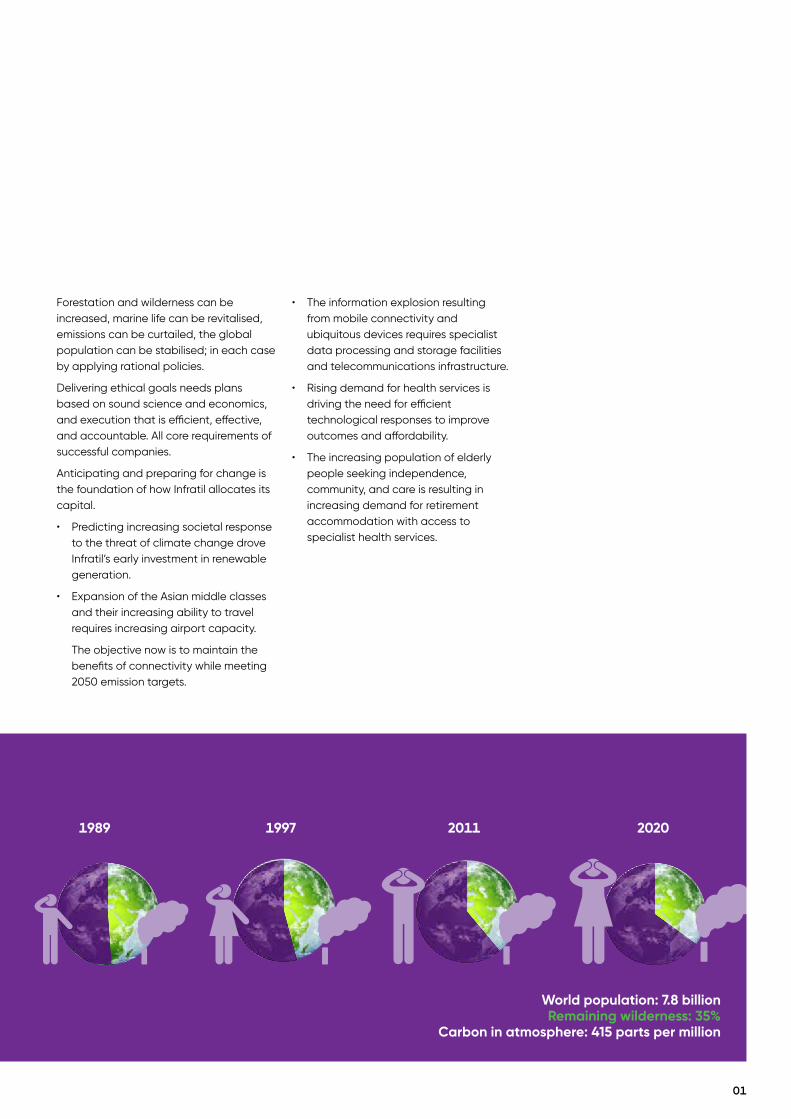
1989 20111997 2020
World population: 7.8 billion Remaining wilderness: 35%
Carbon in atmosphere: 415 parts per million
Forestation and wilderness can be increased, marine life can be revitalised, emissions can be curtailed, the global population can be stabilised; in each case by applying rational policies.
Delivering ethical goals needs plans based on sound science and economics, and execution that is efficient, effective, and accountable. All core requirements of successful companies.
Anticipating and preparing for change is the foundation of how Infratil allocates its capital.
• Predicting increasing societal response to the threat of climate change drove Infratil’s early investment in renewable generation.
• Expansion of the Asian middle classes and their increasing ability to travel requires increasing airport capacity.
The objective now is to maintain the benefits of connectivity while meeting 2050 emission targets.
• The information explosion resulting from mobile connectivity and ubiquitous devices requires specialist data processing and storage facilities and telecommunications infrastructure.
• Rising demand for health services is driving the need for efficient technological responses to improve outcomes and affordability.
• The increasing population of elderly people seeking independence, community, and care is resulting in increasing demand for retirement accommodation with access to specialist health services.

Tilt Renewables
02
Tilt Renewables Doing well. Doing good
2007Manawatu
2008South Australia
2011Otago
1999Manawatu
Households receiving electricity: 17,000 CO2 reduction per year: 54,000 tonnes
2014South Australia
73 metres high
Infratil has contracted to sell its 65.5% shareholding in Tilt Renewables (“Tilt”) for $2,000.2 million. Settlement is expected to occur later in the year following regulatory approvals.Infratil’s net investment into Tilt was $108.2 million. The $1,892.0 million gain on sale reflects a series of decisions starting in 1994.
Through Trustpower and then Tilt, Infratil was an early backer of wind powered generation in New Zealand and Australia. All up the two companies invested $2,150 million building 1,106MW of capacity with annual output of 3,768GWh. The largest installation of capacity of any Australasian wind-generation developer.
The original reasons for getting into wind generation were simply that wind was the lowest-cost form of renewable generation, could be scaled to suit requirements and opportunities, offered short development times, and a lot of renewable generation was going to be required as climate change became a motivating concern.
Given Tilt’s pipeline and the continuing likely demand for more renewable generation on both sides of the Tasman, the reasons to sell are more complex.
The key consideration was that the sale price of the Australian assets placed a large value on Tilt’s development pipeline. On a like for like basis (comparing the Australian and New Zealand asset values) the development pipeline attracted a value of approximately $1 billion. For the buyers there is a value in that potential, including strategic benefits, which Infratil would struggle to match.
Also, Infratil is actively undertaking renewables projects in the U.S.A. and Europe and considers that there are investment opportunities in those regions which offer the prospect of better returns on the funds released from the Tilt sale.
It should be noted that while the successful outcome of Infratil’s investment was based on a series of key decisions starting in 1994, the performance of Tilt’s management was crucial. Following the demerger from Trustpower, Deion Campbell and his team developed a high performing culture based on strong values. Their outstanding delivery reflected excellence across the full life-cycle of each project; early stage development, investment analysis and decisions, construction, power sales terms, funding, and operations.
They created an industry leading platform that delivered the great outcome for investors, and Infratil’s highest ever exit value.

Doing Well While Doing GoodTilt’s operational wind farms (including the one sold in 2019) cost $2,150 million to build. In a year of normal wind they are expected to generate 3,768GWh of electricity, sufficient for about 540,000 average households. Giving an average capital cost per household of about $4,000.
Were the same electricity generated by efficient gas-fired power stations it would result in emissions of about 1.7 million tonnes of CO2 a year (coal-fired generation would produce about twice this amount of CO2). That is about 4% of New Zealand’s total CO2 emissions.
At current New Zealand emission prices, gas-fired generation emitting 1.7 million tonnes of CO2 would incur an annual cost of about $60 million, giving wind generation an appreciable relative advantage, which will increase if the price of emissions increases.
While all of Tilt’s generation cost $2,150 million to build, Snowtown 2 which cost $453 million was sold in 2019. Deducting this sold asset gives a $1,697 million cost to build everything else which has a $3,238 million value at the acquisition price (debt and equity). This is however a little misleading as a significant part of Tilt’s value on sale was its development pipeline which is not reflected in the historic construction costs.
An Infratil shareholder may look back at the September 2020 $913.7 million value of Infratil’s Tilt shareholding and wonder if they could have anticipated the increase to $2,000.2 million seven months later. That would have been difficult, but they could have gauged if there was an option value intrinsic to the asset and factored in some anticipation of that value being realised, albeit with no certainty of timing.
Infratil’s long-term shareholder returns of 18.8% per annum over 27 years have been based precisely on creating investment options. They do not reflect buying a business and selling the same business five years later. The returns have arisen because after its purchase, the business will have invested in expanding its capacity and will have built a pipeline of future investment opportunities.
The value created for Infratil comes from both the increased earnings the business would have generated from investing in its activities and from the potential for future investment and hence future earnings growth. This second part is the option value.
03
Households receiving electricity: 540,000 CO2 reduction per year: 1,700,000 tonnes
2014South Australia
2018Victoria
2021Taranaki
2021Victoria
189 metres high
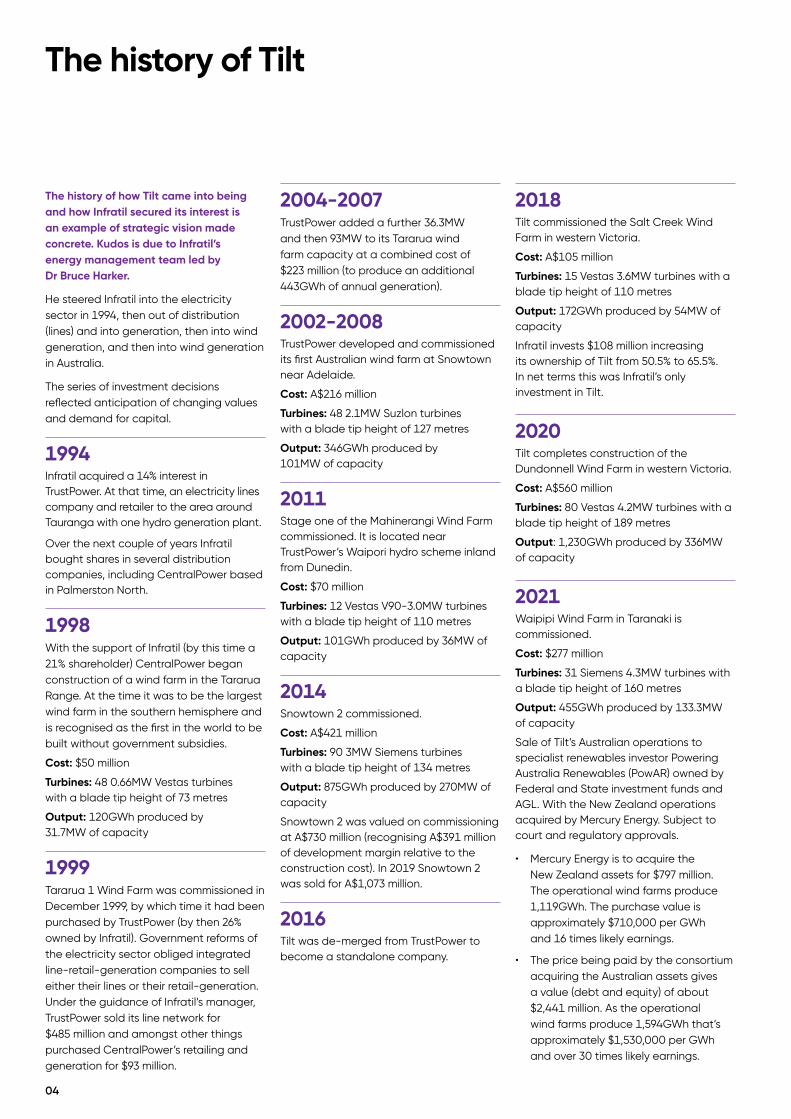
The history of how Tilt came into being and how Infratil secured its interest is an example of strategic vision made concrete. Kudos is due to Infratil’s energy management team led by Dr Bruce Harker.
He steered Infratil into the electricity sector in 1994, then out of distribution (lines) and into generation, then into wind generation, and then into wind generation in Australia.
The series of investment decisions reflected anticipation of changing values and demand for capital.
1994Infratil acquired a 14% interest in TrustPower. At that time, an electricity lines company and retailer to the area around Tauranga with one hydro generation plant.
Over the next couple of years Infratil bought shares in several distribution companies, including CentralPower based in Palmerston North.
1998With the support of Infratil (by this time a 21% shareholder) CentralPower began construction of a wind farm in the Tararua Range. At the time it was to be the largest wind farm in the southern hemisphere and is recognised as the first in the world to be built without government subsidies.
Cost: $50 million
Turbines: 48 0.66MW Vestas turbines with a blade tip height of 73 metres
Output: 120GWh produced by 31.7MW of capacity
1999
Tararua 1 Wind Farm was commissioned in December 1999, by which time it had been purchased by TrustPower (by then 26% owned by Infratil). Government reforms of the electricity sector obliged integrated line-retail-generation companies to sell either their lines or their retail-generation. Under the guidance of Infratil’s manager, TrustPower sold its line network for $485 million and amongst other things purchased CentralPower’s retailing and generation for $93 million.
2004-2007 TrustPower added a further 36.3MW and then 93MW to its Tararua wind farm capacity at a combined cost of $223 million (to produce an additional 443GWh of annual generation).
2002-2008 TrustPower developed and commissioned its first Australian wind farm at Snowtown near Adelaide.
Cost: A$216 million
Turbines: 48 2.1MW Suzlon turbines with a blade tip height of 127 metres
Output: 346GWh produced by 101MW of capacity
2011 Stage one of the Mahinerangi Wind Farm commissioned. It is located near TrustPower’s Waipori hydro scheme inland from Dunedin.
Cost: $70 million
Turbines: 12 Vestas V90-3.0MW turbines with a blade tip height of 110 metres
Output: 101GWh produced by 36MW of capacity
2014 Snowtown 2 commissioned.
Cost: A$421 million
Turbines: 90 3MW Siemens turbines with a blade tip height of 134 metres
Output: 875GWh produced by 270MW of capacity
Snowtown 2 was valued on commissioning at A$730 million (recognising A$391 million of development margin relative to the construction cost). In 2019 Snowtown 2 was sold for A$1,073 million.
2016 Tilt was de-merged from TrustPower to become a standalone company.
2018
Tilt commissioned the Salt Creek Wind Farm in western Victoria.
Cost: A$105 million
Turbines: 15 Vestas 3.6MW turbines with a blade tip height of 110 metres
Output: 172GWh produced by 54MW of capacity
Infratil invests $108 million increasing its ownership of Tilt from 50.5% to 65.5%. In net terms this was Infratil’s only investment in Tilt.
2020Tilt completes construction of the Dundonnell Wind Farm in western Victoria.
Cost: A$560 million
Turbines: 80 Vestas 4.2MW turbines with a blade tip height of 189 metres
Output: 1,230GWh produced by 336MW of capacity
2021Waipipi Wind Farm in Taranaki is commissioned.
Cost: $277 million
Turbines: 31 Siemens 4.3MW turbines with a blade tip height of 160 metres
Output: 455GWh produced by 133.3MW of capacity
Sale of Tilt’s Australian operations to specialist renewables investor Powering Australia Renewables (PowAR) owned by Federal and State investment funds and AGL. With the New Zealand operations acquired by Mercury Energy. Subject to court and regulatory approvals.
• Mercury Energy is to acquire the New Zealand assets for $797 million. The operational wind farms produce 1,119GWh. The purchase value is approximately $710,000 per GWh and 16 times likely earnings.
• The price being paid by the consortium acquiring the Australian assets gives a value (debt and equity) of about $2,441 million. As the operational wind farms produce 1,594GWh that’s approximately $1,530,000 per GWh and over 30 times likely earnings.
The history of Tilt
04

New Zealand
Sources of Electricity Generation
Australia
World
Valuation differences between Tilt’s New Zealand and Australian assets are likely to reflect expected net earnings from existing wind farms (due to different offtake prices and required rates of return) and more materially, differences in expected new-build prospects. Australia needs a very large investment in renewable generation to allow the phase out of the use of coal. Tilt’s Australian options are well positioned to benefit as they are located on quality buildable sites on the strongest parts of the transmission grid. As shown by Tilt’s track record, building wind farms can provide a healthy development margin and this will have been factored into the acquirers’ valuations.
The cost per GWh of generation over the 22 years spanned by Tilt’s projects does not provide a straightforward case study. Different projects have different land and transmission costs, but converting the nominal costs into real costs gives a reasonable idea of how wind farm economics have improved. The first of Tilt’s projects; Tararua 1 cost about $0.6 million per GWh, a similar nominal cost to the most recent at Waipipi. Taking price inflation into account, that is a 55% fall in the real cost per unit of generation.
The cost per GWh of Dundonnell is a little lower than Waipipi’s and both fit comfortably within the “best in class” cost range identified by international studies of new onshore wind generation.
Hydro
Wind/Solar
Geothermal
Other Renewable
Gas
Coal/Oil
Hydro
Wind/Solar
Other Renewable
Gas
Coal/Oil
Hydro
Wind/Solar
Other Renewable
Nuclear
Gas
Coal/Oil
05
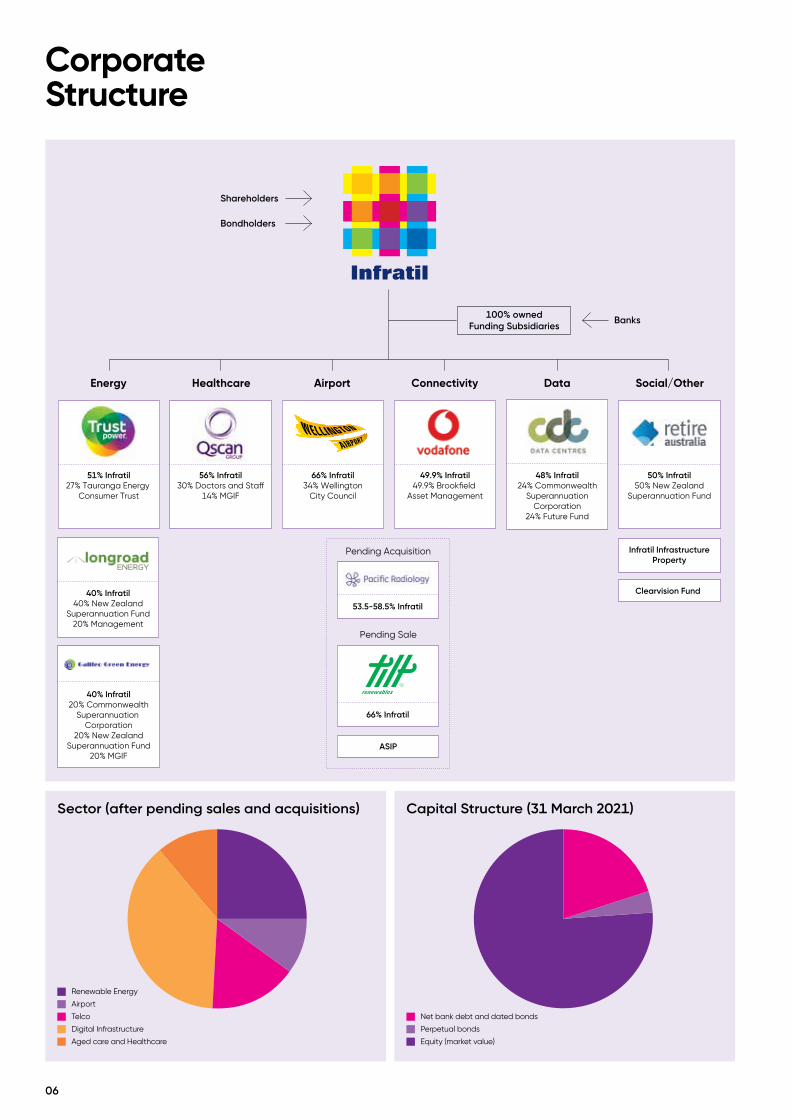
Corporate Structure
Airport
66% Infratil34% Wellington
City Council
Connectivity
49.9% Infratil49.9% Brookfield
Asset Management
66% Infratil
Energy
51% Infratil27% Tauranga Energy
Consumer Trust
40% Infratil40% New Zealand
Superannuation Fund20% Management
40% Infratil20% Commonwealth
Superannuation Corporation
20% New ZealandSuperannuation Fund
20% MGIF
Shareholders
Banks100% ownedFunding Subsidiaries
Bondholders
Pending Sale
53.5-58.5% Infratil
Pending Acquisition
Data
48% Infratil24% Commonwealth
SuperannuationCorporation
24% Future Fund
Social/Other
50% Infratil50% New Zealand
Superannuation Fund
Clearvision Fund
Infratil InfrastructureProperty
Healthcare
56% Infratil30% Doctors and Sta�
14% MGIF
ASIP
Sector (after pending sales and acquisitions) Capital Structure (31 March 2021)
Renewable Energy
Airport
Telco
Digital Infrastructure
Aged care and Healthcare
Net bank debt and dated bonds
Perpetual bonds
Equity (market value)
06

Financial Highlights
FY 2021 FY 2020
Net Parent surplus/(loss) ($49.2m) $241.2m
Proportionate EBITDAF 1 $398.8m $370.2m
Proportionate capital expenditure 2 $1,235.3m $2,268.3m
Net debt 3 $1,715.3m $1,774.7m
Dividends declared 17.75cps 17.25cps
Shareholder returns 91.9%pa (2.1%pa)
1. EBITDAF is a non-GAAP measure of net earnings before interest, tax, depreciation, amortisation, financial derivative movements, revaluations, and non-operating gains or losses on the sales of investments and assets. EBITDAF does not have a standardised meaning and should not be viewed in isolation, nor considered a substitute for measures reported in accordance with NZ IFRS, as it may not be comparable to similar financial information presented by other entities. Proportionate EBITDAF shows Infratil’s operating costs and its share of the EBITDAF of the companies it has invested in. It excludes discontinued operations and management incentive fees. A reconciliation of net profit after tax to Proportionate EBITDAF is provided in the 31 March 2021 Annual Results Presentation.
2. Investment and capital spending by Infratil and its 100% subsidiaries and Infratil’s share of investee company capital spending.
3. Infratil parent and 100% subsidiaries.
Infratil’s businesses performed credibly during a difficult year, as illustrated by the uplift to Proportionate EBITDAF.
The $290.4 million adverse swing in net surplus reflected $238.6 million less contribution from Tilt and a $98.1 million increase in incentive fee accrual. Last year Infratil recorded a $511.5 million gain when Tilt sold its Snowtown 2 wind farm.
The incentive fee accrual reflects incentive terms whereby management receives 20% of gains over 12% per annum on certain offshore assets.
Over the year Infratil invested $332.4 million, $309.6 million of which was purchasing an interest in Qscan. Infratil's proportionate share of investments undertaken by the companies it has an interest in amounted to
$902.9 million. Investment is what drives future value and dividend growth.
Reflecting Infratil’s good year and strong financial position, the final dividend was raised to 11.5 cps from 11 cps in the prior year. Total shareholder return for the year was an exceptional 91.9% per annum; reflecting the uplift in the value of Infratil’s assets and the bounce-back from the market slump of March 2020.
07

Governance: Directors
08
Infratil’s shareholders elect directors for three year terms to look after their interests. Directors are expected to:
• Maintain a dialogue with shareholders, to understand concerns and priorities.
• Participate in the formation and evolution of the Company’s strategy.
• Ensure effective articulation to external stakeholders of strategy, goals, risks and performance. Including with regards to environmental, social and governance metrics.
• Monitor strategy implementation, financial performance, risks and legal compliance.
• Maintain awareness of relevant societal and market developments and provide diversity of perspective and knowledge relevant to the Company.
• Monitor the performance of Infratil’s manager H.R.L. Morrison & Co. Morrison & Co is a specialist manager of infrastructure investments and performs this role for Infratil under an investment management agreement. Infratil benefits from having a management team with great breadth and depth of skills, however the Board must be vigilant about potential conflicts of interest and satisfied that the cost is reasonable relative to the alternative.
Further commentary on the Board is set out on pages 129-133 of this report.
Mark Tume, independent chair appointed 2007, last elected 2018. Member of the Nomination & Remuneration and Management Engagement and (ex officio) Audit & Risk committees.
I maintain ties with Infratil’s many stakeholders and ensure that directors are delivering on their responsibilities. My experience in finance and from serving on a number of boards gives me an appreciation of the issues faced by Infratil and its businesses.
Jason Boyes, director and chief executive. Appointed 2021. Available for election in 2021.
As CEO I am responsible for working with board and management on shaping Infratil’s strategies and goals, and for ensuring that management delivers accordingly. Management has to identify opportunities, ensure that Infratil’s businesses are performing to their potential, and ensure that risks are monitored, managed and are within acceptable and agreed parameters.
Alison Gerry, independent director appointed 2014, last elected 2019. Chair of the Audit & Risk committee, and member of the Nomination & Remuneration, and Management Engagement committees.
My experience in finance and risk management helps me appreciate Infratil’s strategic opportunities and threats from financial markets, technology, regulation and the natural environment. Executing strategy is about allocating capital and about developing a culture which reflects the value we place on people, customers, and communities.
Paul Gough, independent director appointed 2012, last elected 2018. Member of the Nomination & Remuneration, and Management Engagement committees.
As a Kiwi who works in London I’m very aware of how global events impact in
New Zealand and Australia. In London I managed investments in similar fields to Infratil’s, but often with more development risk. Achieving the best outcome requires the best from people. The focus on performance and people is consistent with what I see at Infratil.
Kirsty Mactaggart, independent director appointed and elected in 2019. Member of the Audit & Risk and Management Engagement committees.
I have 25 years of financial market experience across multiple countries and sectors. My transactional experience as a banker; and governance focus as an investor, is applied to ensure the manager delivers for all Infratil stakeholders.
Catherine Savage, independent director appointed and elected in 2019. Member of the Audit & Risk and Management Engagement committees.
I have 30 years of involvement in funds management and capital markets. It is extremely important to me to be part of a company that maintains the highest standard of corporate governance and transparency, and delivers long-term value add to its stakeholders through good strategic choices about capital allocation and by focusing on people and culture.
Peter Springford, independent director appointed 2016. Last elected 2020. Member of the Management Engagement committee.
Having led a major industrial company based in New Zealand and Australia, businesses in Asia, and been chair or director of companies operating internationally, I recognise that a key ingredient of successful investment is having the right people who provide diversity of experience and perspective. This is a challenging investment environment, but there are good opportunities available to Infratil because of its capabilities and access to capital.

09
Management
Infratil’s management comprises people employed by Infratil’s manager, H.R.L. Morrison & Co (Morrison & Co), and those employed by Infratil’s subsidiaries and investee companies.
As a specialist infrastructure investment manager, Morrison & Co also manages investments on behalf of other superannuation funds; including the New Zealand Superannuation Fund, the Commonwealth Superannuation Corporation and the Australian Future Fund, each of which has investments in partnership with Infratil.
Infratil benefits from its management having the expertise of a larger and more expert group of individuals than a company of Infratil’s scale could normally hope to retain and from the manager’s contacts and relationships.
Jason Boyes, Chief Executive, Director of Infratil, Chair of Longroad Energy and Galileo Green Energy
Phillippa Harford, Chief Financial Officer, Director RetireAustralia and Wellington Airport
Marko Bogoievski, Chair Vodafone NZ
Greg Boorer, Chief Executive CDC Data Centres
Ralph Brayham, Technology
Michael Brook, Director Qscan
Tim Brown, Capital Markets and Economic Regulation, Chair Wellington Airport
Deion Campbell, Chief Executive Tilt Renewables
Kellee Clark, Head of Legal. Compliance, transaction structuring and execution
Peter Coman, Head of Real Estate and Social Infrastructure. Chair RetireAustralia. Director Trustpower and Infratil Infrastructure Property
Mark Flesher, Capital Markets and Investor Relations
Paul Gaynor, Chief Executive Longroad Energy
Vincent Gerritsen, Private Markets Europe, Director Galileo Green Energy
Bruce Harker, Chair Tilt Renewables
Andrew Lamb, Development Director Infratil Infrastructure Property
Nick Lough, Company Secretary and Legal. Compliance, transaction structuring and execution
Hamish Mikkelsen, Infratil Finance
Chris Munday, Chief Executive Qscan
Paul Newfield, Chief Investment Officer, Head of Australia and New Zealand for Morrison & Co. Strategy, sector analysis and transaction execution. Director Tilt Renewables and Qscan
Jason Paris, Chief Executive Vodafone NZ
Nicole Patterson, Director CDC Data Centres NZ
David Prentice, Chief Executive Trustpower
Alicia Quirke, Infratil Tax
Paul Ridley-Smith, Chair Trustpower
Brett Robinson, Chief Executive RetireAustralia
Matthew Ross, Infratil Finance Director and Risk Manager
Steve Sanderson, Chief Executive Wellington Airport
Maddy Simmonds, Infratil Finance
William Smales, Private Markets investment activity. Director Vodafone NZ, CDC Data Centres and Longroad Energy
Vimal Vallabh, Energy team. Director Tilt Renewables, Longroad Energy and Galileo Green Energy
Ingmar Wilhelm, Chief Executive Galileo Green Energy
Somali Young, Infratil Finance
10

110111 1

12

Management: Changing Chief Executive
In January 2009 Marko Bogoievski became Infratil’s second chief executive and managing director, following founder Lloyd Morrison.
Twelve years on Marko stepped aside for Jason Boyes.
It is worth reflecting on the changes overseen by Marko and what may occur under Jason's leadership. Noting that while Marko is no longer chief executive and director of Infratil, he retains those roles at H.R.L. Morrison & Co, the manager of Infratil.
When Marko assumed leadership of Infratil, the company had delivered 18.0% per annum for its shareholders over its first 15 years, but the Global Financial Crisis had resulted in a 40% fall in its market value and the Company was in a tricky position with its capital structure and some of its investments not performing.
Notwithstanding headwinds, Marko’s first year characterised his approach; think carefully about what is required, and then do it. Both his judgement about what to do and his willingness to act quickly in FY2010 laid the platform for Infratil’s revival and the exceptional 19.8% per annum after tax return delivered for shareholders during his 12 years (that amounts to a 774% total return).
What Happened to the Class of ‘09
60% of Infratil’s assets owned on 31 March 2009 are still owned. The remaining 40% were sold for a mixture of gains and losses.
2009
Retained Sold at a gain Sold at a loss
Infratil’s Asset Mix
Under Marko’s leadership Infratil’s portfolio changed, while still being based on a mixture of solid cash-generating businesses and ones that could produce higher returns by satisfying strong demand growth.
2009 2021
Renewables BusAirport OtherAustralian Energy Telco
Data Aged care and healthcare
13
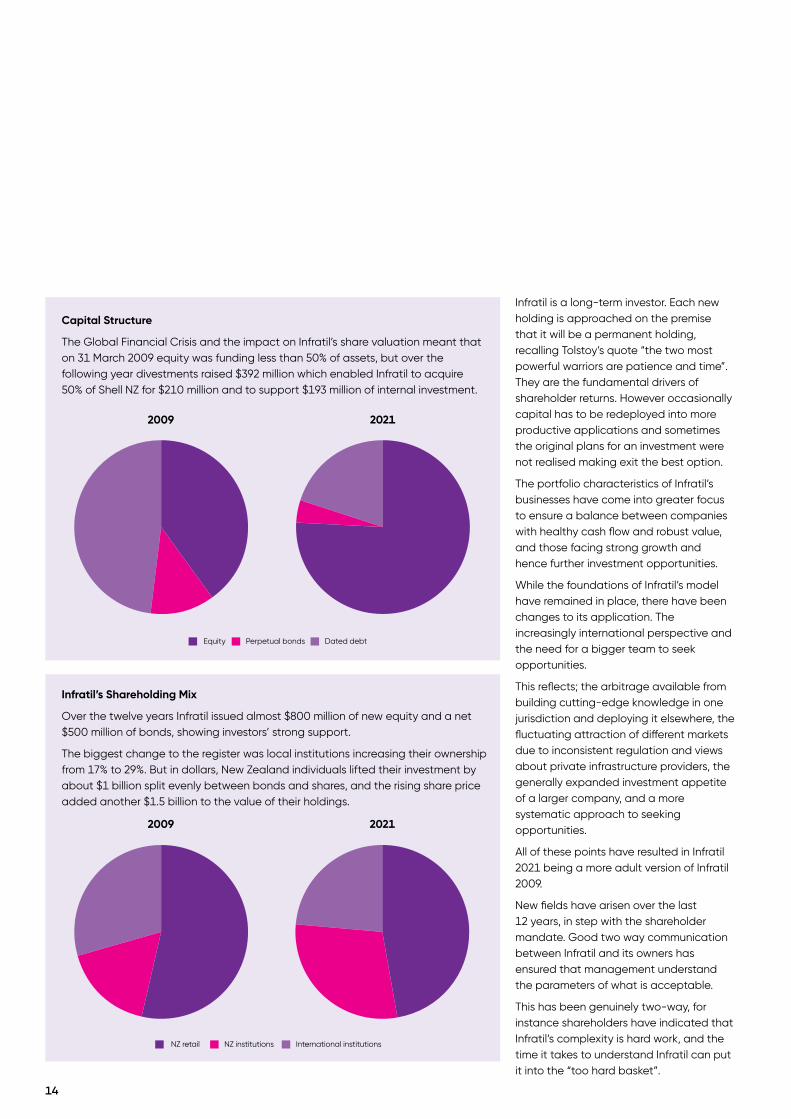
Capital Structure
The Global Financial Crisis and the impact on Infratil’s share valuation meant that on 31 March 2009 equity was funding less than 50% of assets, but over the following year divestments raised $392 million which enabled Infratil to acquire 50% of Shell NZ for $210 million and to support $193 million of internal investment.
Infratil’s Shareholding Mix
Over the twelve years Infratil issued almost $800 million of new equity and a net $500 million of bonds, showing investors’ strong support.
The biggest change to the register was local institutions increasing their ownership from 17% to 29%. But in dollars, New Zealand individuals lifted their investment by about $1 billion split evenly between bonds and shares, and the rising share price added another $1.5 billion to the value of their holdings.
2009
2009 2021
Infratil is a long-term investor. Each new holding is approached on the premise that it will be a permanent holding, recalling Tolstoy’s quote “the two most powerful warriors are patience and time”. They are the fundamental drivers of shareholder returns. However occasionally capital has to be redeployed into more productive applications and sometimes the original plans for an investment were not realised making exit the best option.
The portfolio characteristics of Infratil’s businesses have come into greater focus to ensure a balance between companies with healthy cash flow and robust value, and those facing strong growth and hence further investment opportunities.
While the foundations of Infratil’s model have remained in place, there have been changes to its application. The increasingly international perspective and the need for a bigger team to seek opportunities.
This reflects; the arbitrage available from building cutting-edge knowledge in one jurisdiction and deploying it elsewhere, the fluctuating attraction of different markets due to inconsistent regulation and views about private infrastructure providers, the generally expanded investment appetite of a larger company, and a more systematic approach to seeking opportunities.
All of these points have resulted in Infratil 2021 being a more adult version of Infratil 2009.
New fields have arisen over the last 12 years, in step with the shareholder mandate. Good two way communication between Infratil and its owners has ensured that management understand the parameters of what is acceptable.
This has been genuinely two-way, for instance shareholders have indicated that Infratil’s complexity is hard work, and the time it takes to understand Infratil can put it into the “too hard basket”.
2021
Equity Perpetual bonds Dated debt
NZ retail NZ institutions International institutions
14

Minimising complexity is one reason Infratil’s investments now have to tick the box, “could this get to be worth $1 billion?”.
However, it is probably fair to say that the impact of this initiative has been limited. Infratil has strong support from New Zealand retail and institutional investors where most people hold shares for many years and many clearly take the time to get to understand the Company. However, international fund managers have less patience, and this is reflected in their low level of aggregate ownership.
Jason Boyes joined Infratil’s management in FY2010, initially as Head of Legal, which led to people management, governance and investment roles. Unlike Marko he isn’t assuming leadership during a time of stress, but nevertheless there is no shortage of threats and opportunities. To note the more material ones:
• Financial market conditions are the proverbial 300kg gorilla. The values of most assets are interlinked and reflect quiescent consumer price inflation and low interest rates. Infratil has a conservative capital structure “just in case”, but it only takes a couple of minutes reading about the 1970s stagflation era to be reminded of how devastating a rerun would be.
• Technological change and the impact on people’s lives are accelerating. That is an important factor behind Infratil’s ownership of CDC, Vodafone NZ, Qscan and Pacific Radiology. It isn’t going to stop there. Over the next couple of years electric autonomous vehicles will be deployed in scale, decarbonising energy will require the largest investment of capital and new technology in human history, and in fields like health, technology will play an expanding role (public health agencies allowing).
Infratil gets a view of the cutting edge via Clearvision in California, but it would be good to participate more in research and development in New Zealand and Australia.
• Private provision of infrastructure in partnership with government remains an area of opportunity and challenge.
Political philosophies come and go and Infratil’s success has been built on being open to new approaches as well as a reliable partner and good manager. Many of Infratil’s investments are in partnership with government and community interests; Wellington City Council, the New Zealand Superannuation Fund, the Tauranga Energy Consumer Trust, Commonwealth Superannuation Corporation and Future Fund.
It is notable that in the 23 years of co-investing in Wellington Airport, the directors appointed by the two shareholders have only ever been unanimous on resolutions. This has been achieved by ensuring that the priorities of the Company reflect the needs of the City and the shareholders. As in any successful partnership, both parties spend time understanding the other’s interests and seeking compromises which suit both.
Today this involves ensuring we understand social and environmental objectives, be that access to high-speed internet, decarbonising energy and transport systems, or improving healthcare.
Infratil’s guiding philosophy is to “invest wisely in ideas that matter”, seeking to address issues facing our societies. So whatever political philosophy prevails we hope to find more alignment than friction with governments and communities. As a New Zealand
company with a global outlook and expertise we believe we should continue to be seen to be a welcome partner.
• A new area of potential partnership is emerging with Māori/iwi. Their ownership of resources is increasing as are their social responsibilities. While for philosophical reasons government may decide that it must own all the schools, hospitals, etc. in which it provides education and health services, iwi may be more inclined to focus on efficient provision and recognise that means working with the best people and partners.
Marko made Infratil a more structured business. A great deal of time and effort now goes into scoping sectors before specific opportunities are sought, rather than the more opportunistic approach which suited the Company’s early years. There is also more signaling to investors to ensure they will support investments in fields such as data, telecommunications, diagnostic imaging, and renewable generation development far beyond New Zealand and Australia.
Infratil shareholders can expect more of the same under Jason, along with vigilance about financial market risk, progressing opportunities created by technology and decarbonisation, and seeking positive partnerships with local and central government, and other community interests.
15

Report of the Chief Executive
This is my first report as Infratil’s Chief Executive, a role I’m proud to occupy following Marko Bogoievski and Lloyd Morrison.
Leading Infratil presents obvious and not-so obvious challenges. As with any company, a large part of the role involves having the right team of people working with common purpose for the right goals. But with Infratil there is an unusual degree of flexibility to change the allocation of the group’s capital.
As I have actively participated over the last decade in managing Infratil’s investments and divestments, I’m not planning anything dramatic. But we are all aware that changes unfold around us and flexibility is desirable.
For example, decarbonisation requires an unprecedented mobilisation of capital and Infratil; through Trustpower, Tilt, Longroad and Galileo; is participating in multiple jurisdictions. While wind farms in Taranaki, South Australia, Texas and Ireland may be physically similar, returns will reflect individual market circumstances and how each government regulates and intervenes. By monitoring these factors closely we hope we can allocate Infratil’s capital to deliver good returns with acceptable risk.
Last year will be remembered for many things. For Infratil I’m sure it will be the remarkable flexibility of our people as they adjusted to covid related restrictions. But more telling was how quickly and thoroughly most businesses and asset values recovered after the March 2020 plunge.
Much of the credit goes to central bank and government interventions. “Whatever it takes” worked. But it does raise concerns about moral hazard and whether individuals and companies should henceforth consider themselves to be insured by a giant bailout fund? As we have experienced both pros and cons from government interventions over the years, we will take nothing for granted.
Governments everywhere have assumed far more than normal prominence over the last year. And, even before the covid crisis has been resolved, the focus has shifted to climate change, working out how to pay for all the extra debt, addressing inequality, and improving stretched public services. It is to be hoped that the measures introduced in these areas involve partnerships with the private sector and business has a role in delivering the desired outcomes.
FY2021 Earnings & Reported SurplusOver the long-term, returns comprise growing cash earnings and growing investment values. While FY2021 saw satisfactory operating earnings, they were overshadowed by rising valuations, in particular with Tilt and CDC.
Anomalously this reduced the reported surplus, because the very high returns generated by Infratil’s offshore assets (of which Tilt and CDC make up about 80%) gave rise to a management incentive accrual.
FY2021 InitiativesDuring the year Infratil raised $300 million via an equity issue and invested $310 million acquiring 56.3% of Australian diagnostic imaging company Qscan in partnership with staff and another fund.
Subsequent to balance date Infratil announced the acquisition of between
53.5% and 58.5% of New Zealand medical diagnostics company Pacific Radiology for between $312 million and $344 million (final ownership and cost will depend on how much ownership staff retain).
We believe that this sector, and these companies in particular, fits Infratil’s investment criteria and offers the prospect of attractive returns in a field where there are excellent growth prospects. The rationale is explained further from page 60 of this report.
As also explained at length elsewhere (pages 2-5) Infratil has agreed to sell its 65.5% shareholding in Tilt Renewables for $2,000.2 million. Clearly this has been an outstanding investment for Infratil, but we feel we can redeploy the capital more productively elsewhere.
While Infratil’s track record demonstrates that it is a long-term holder of investments, the manager’s key responsibility is to ensure capital is optimally allocated.
We are also supporting Trustpower’s review of its utility retailing operations. Many of our infrastructure businesses comprise an asset intensive core (power stations, mobile network, airfield, etc) with a “shop front” which can have a range of functions complementary to the core. But it is always worth reconsidering. Does the airport benefit from providing car parking? Does Vodafone NZ drive more traffic onto its network by providing retail services? Does Trustpower reduce its risk by retailing electricity?
Infratil also supported Wellington Airport when aviation all but ceased during the lockdowns. We were delighted that our co-shareholder, Wellington City Council, partnered with us in this. It is worth noting the cost to Auckland ratepayers of Auckland Council not participating in the equity injection required by their airport.
16

17Te Raukura, Te Wharewaka o Pōneke.

Funding Debt & EquityDuring the year Infratil raised $300 million through an equity issue. We are confident that the mechanism used (a tender to institutions and pro-rata offer to retail shareholders) produced the best possible outcome, for shareholders who participated and for those who did not. We are extremely sensitive to ensuring that any share issue is value enhancing for shareholders, whether they participate or not.
Infratil also issued $83.3 million of bonds maturing March 2026 at a yield of 3% per annum. The bonds are part of Infratil’s risk-minimising approach to funding. We seek to use only equity and longer-term bonds for core funding, with banks used sparingly. On 31 March 2021 debt made up 25% of the capital employed by Infratil and 100% subsidiaries.
FY2022In anticipation of receiving the funds from the sale from Tilt, management has been particularly active developing reinvestment options, however Infratil’s shareholders can be assured that we know it is better to be patient than wrong, and we prioritise growth from our existing businesses rather than from buying something new.
Infratil’s approach to allocating capital uses “investment platforms”; businesses which can invest in themselves. People from our management team are involved at both governance and coalface levels, but most of the heavy lifting is done by the people of the relevant investment vehicle, be that Longroad, CDC Data Centres, Wellington Airport, etc.
We are flexible about this, Infratil’s track record has numerous examples where we have built sector expertise in one jurisdiction and then exported that elsewhere. Sometimes that means setting
up a new business, eg. Longroad and Galileo. Sometimes it means supporting one of our businesses to expand as Trustpower did in Australia and CDC is now doing in New Zealand.
Renewable Generation: Both Longroad and Galileo are on track to undertake substantial investments in generation which are expected to result in calls on shareholders. Any allocation of additional capital to Trustpower is pending clarification of the ownership review of its retailing operations.
Wellington Airport: In FY2021 Infratil and Wellington City Council underwrote $75.8 million of additional equity (Infratil’s share $50 million) which has not yet been drawn. The Airport is now reviewing its capital structure in the light of updated traffic and capex forecasts and this may result in a call on shareholders.
Data: CDC Data Centres seems likely to be able to fund organic growth from its own financial resources, although support is always available for step-change expansions. As data centre utilisation increases CDC’s risk declines and its access to bank funding increases.
Telecommunications: It is anticipated that Vodafone New Zealand has the financial capability to meet its investment goals in FY2022.
Diagnostic imaging: It is hoped that both organic and bolt-on investments can be found in this sector in FY2022.
Retirement: RetireAustralia is now making good progress reigniting growth and increasing village occupation. At least over FY2022 it is anticipated that it will be able to meet capital needs from internal sources.
New fields: Although I expect most incremental investment to be in and around the fields noted above, we will continue to scan new opportunities.
Infratil’s most successful investments have arisen by being ahead of others in identifying opportunities or because our flexibility allows us to be opportunistic.
Guidance & Dividends Guidance for Proportionate EBITDAF for FY2022 is between $470 million and $520 million. FY2021’s result was $398.8 million. The guidance for FY2022 assumes that Infratil sells its interest in Tilt, excludes Pacific Radiology, and assumes only internal investments occur.
FY2021 was an exceptional year for our shareholders. It included the bounce in market values which followed the March 2020 plunge, the offer for Infratil which opened a lot of eyes about Infratil’s latent value, the crystallisation of the values intrinsic to Tilt’s development pipeline, and the ongoing growth in the value of CDC.
Looking forward, we hope we can continue to allocate Infratil’s capital to deliver value uplift and a rising dividend. Approximately half of Infratil’s shares are owned by New Zealand retail investors and we are aware that cash income matters to many of them.
As dividends reflect cash earnings, prospects and financial capability it is imprudent to be too confident about payouts too far into the future, but with that caveat we recognise that shareholders benefit from having guidance. In 2019 we indicated that we expected dividends to be flat for three years given the pressures associated with the Vodafone NZ acquisition and our then cashflow forecast.
Based on FY2021 outcomes, Infratil’s current financial capability, our expectation of the Tilt sale closing later in the year, and updated earnings and capital allocation forecasts:
18

The final dividend for FY2021 to be paid on 22 June to shareholders of record on 9 June will be 11.5 cps cash plus 3.5 cps of imputation credits. This lifts the total annual cash payment to 17.75 cps from 17.25 cps the prior year.
The dividend reinvestment plan will not operate on this occasion.
We anticipate dividends increasing further as cash earnings from CDC Data Centres and Vodafone NZ rise, and contributions are received from the new investments in diagnostic imaging.
We have looked at share buybacks and special dividends. The former is always an option when a gap opens between the intrinsic value of the shares and the market value. We doubt special dividends are the best use of funds.
Jason BoyesChief Executive
19
20
At the start of FY2021 the global economic outlook was very uncertain and financial markets were in turmoil.
However, following the GFC, your Board has been very focused on ensuring that Infratil is positioned to withstand shocks, even of the scale unleashed by covid. Once we had made sure that our own house was in order, our interest shifted to opportunities and I feel this starting position was the foundation on which the developments of the year were based.
The Board’s role is to represent shareholders and with that in mind I’ve sought to address four questions that are likely to be of interest.
• What happened with the takeover offer for Infratil?
• Why is Infratil selling Tilt Renewables and what are the likely uses of the proceeds?
• Is the Board comfortable with the terms of the agreement with Infratil’s manager, Morrison & Co?
• Has anything happened to change the previously indicated ten year shareholder return goal of 11-15%?
The takeover offerIn October 2020 Infratil’s independent directors were approached to support an offer for Infratil by an Australian superannuation fund. Consideration was $6.40 per share, made up of $4.69 in cash and a pro rata distribution of the shares Infratil owns in Trustpower.
The proposal was rejected by the Board and in November a new proposal was tabled valuing each Infratil share at $7.43, comprising $5.79 cash and distribution of 0.221 Trustpower shares (which coincidentally also had a market value of $7.43) for each Infratil share owned.
Report of the Board Chair
The Board also rejected this offer as undervaluing what is both a special group of businesses and a unique and relatively unconstrained operating model. The Board has a close understanding of the businesses and their value potential. This reflects Infratil’s approach to investment which involves stakes in a small number of companies over which it has control or influence where we believe Infratil’s active management can add value.
Also, a number of material projects would have needed to have been put on hold had the bid progressed.
On balance the Board believed that the interests of shareholders were better served by not engaging with the bidder.
Feedback on the decision was mainly positive. Several commentators noted that Infratil provides New Zealand investors with access to opportunities which would not otherwise be available.
Why sell Tilt and where will the proceeds go?As set out on pages 2 to 5 of this Report, the sale price represents a substantial premium to the value of Tilt’s operational assets. However, Tilt’s value also includes the development margins it expects to derive from its pipeline of projects as they come to fruition over the next few years.
We had to ask ourselves if we should hold on to Tilt and get the benefit of those development margins over time, or if we should bank some of the margin now and recycle that capital into other areas.
Fortunately, we have been investing in new generation in North America and Europe and have a good idea of what new projects are possible and what returns they offer. Comparable opportunities are also available from Infratil’s investment in diagnostic imaging, and the other fields management are investigating.
Is Infratil well managed at a fair cost?The Board has absolute confidence in Infratil’s management. The track record under Marko Bogoievski is set out on pages 13 to 15 of this Report. 19.8% per annum after tax returns over 12 years speaks for itself. While it’s impossible not to feel some sadness that he is stepping aside, we are excited to be able to appoint a replacement of Jason Boyes’ calibre.
The more complex issue is “fair cost”. Your directors have considerable relevant expertise and, based on this, are comfortable that manager remuneration terms are fair. This encompasses what Infratil gets from its manager, the cost, and the cost of alternatives.
The Board regularly has the Management Agreement terms independently reviewed. Recently we addressed whether a modern management contract would deliver better outcomes for shareholders, reflecting that Infratil’s contract was agreed in 1994 and last amended in 2005.
The review undertaken last year noted that not all the features of the contract are ideal or “modern”, but “…the current remuneration structure under the Agreement has, in totality, been demonstrably beneficial to Infratil shareholders over the 26 years.”
We have naturally received robust questioning of some terms within the Agreement (none of which has led to an actual cost) and we agree that it is not ideal, but as a package it has served shareholders well.
Management incentivesLast year we reported that the $879.7 million uplift in the value of Infratil’s portfolio of mature offshore investments had given rise to $125.0 million of management incentive entitlements.

Te Raukura, Te Wharewaka o Pōneke.21
22
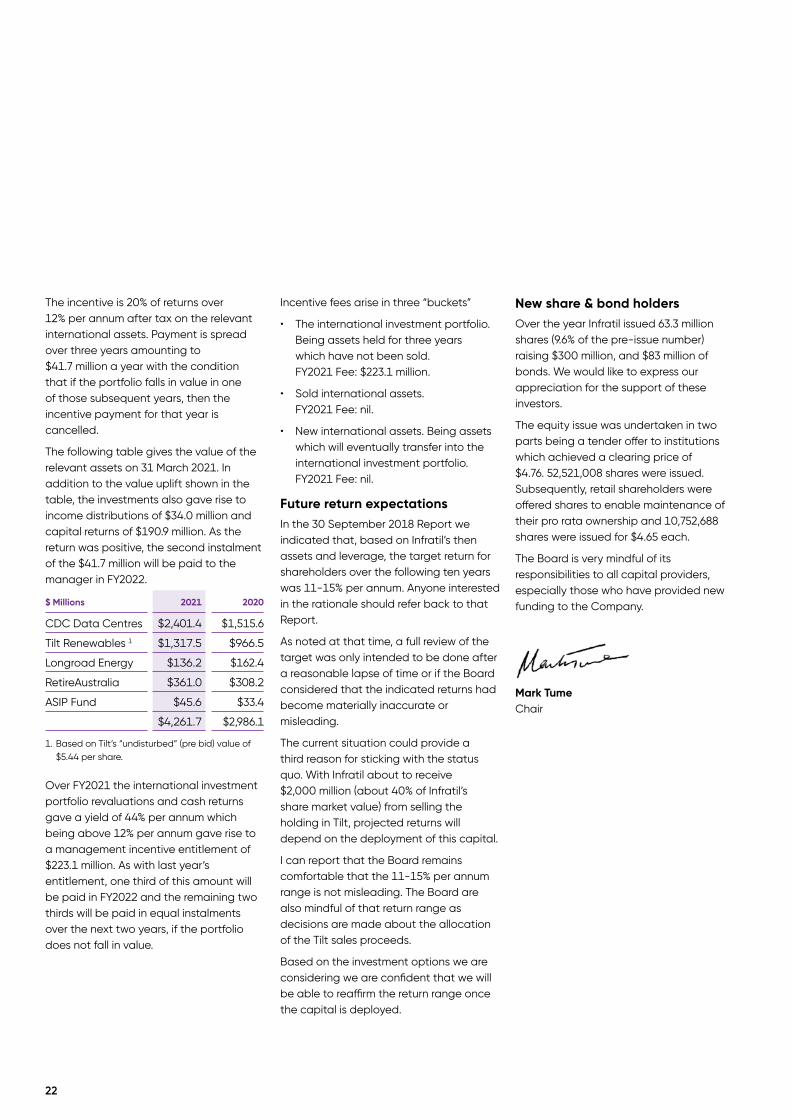
The incentive is 20% of returns over 12% per annum after tax on the relevant international assets. Payment is spread over three years amounting to $41.7 million a year with the condition that if the portfolio falls in value in one of those subsequent years, then the incentive payment for that year is cancelled.
The following table gives the value of the relevant assets on 31 March 2021. In addition to the value uplift shown in the table, the investments also gave rise to income distributions of $34.0 million and capital returns of $190.9 million. As the return was positive, the second instalment of the $41.7 million will be paid to the manager in FY2022.
$ Millions 2021 2020
CDC Data Centres $2,401.4 $1,515.6
Tilt Renewables 1 $1,317.5 $966.5
Longroad Energy $136.2 $162.4
RetireAustralia $361.0 $308.2
ASIP Fund $45.6 $33.4
$4,261.7 $2,986.1
1. Based on Tilt’s “undisturbed” (pre bid) value of $5.44 per share.
Over FY2021 the international investment portfolio revaluations and cash returns gave a yield of 44% per annum which being above 12% per annum gave rise to a management incentive entitlement of $223.1 million. As with last year’s entitlement, one third of this amount will be paid in FY2022 and the remaining two thirds will be paid in equal instalments over the next two years, if the portfolio does not fall in value.
Incentive fees arise in three “buckets”
• The international investment portfolio. Being assets held for three years which have not been sold. FY2021 Fee: $223.1 million.
• Sold international assets. FY2021 Fee: nil.
• New international assets. Being assets which will eventually transfer into the international investment portfolio. FY2021 Fee: nil.
Future return expectationsIn the 30 September 2018 Report we indicated that, based on Infratil’s then assets and leverage, the target return for shareholders over the following ten years was 11-15% per annum. Anyone interested in the rationale should refer back to that Report.
As noted at that time, a full review of the target was only intended to be done after a reasonable lapse of time or if the Board considered that the indicated returns had become materially inaccurate or misleading.
The current situation could provide a third reason for sticking with the status quo. With Infratil about to receive $2,000 million (about 40% of Infratil’s share market value) from selling the holding in Tilt, projected returns will depend on the deployment of this capital.
I can report that the Board remains comfortable that the 11-15% per annum range is not misleading. The Board are also mindful of that return range as decisions are made about the allocation of the Tilt sales proceeds.
Based on the investment options we are considering we are confident that we will be able to reaffirm the return range once the capital is deployed.
New share & bond holdersOver the year Infratil issued 63.3 million shares (9.6% of the pre-issue number) raising $300 million, and $83 million of bonds. We would like to express our appreciation for the support of these investors.
The equity issue was undertaken in two parts being a tender offer to institutions which achieved a clearing price of $4.76. 52,521,008 shares were issued. Subsequently, retail shareholders were offered shares to enable maintenance of their pro rata ownership and 10,752,688 shares were issued for $4.65 each.
The Board is very mindful of its responsibilities to all capital providers, especially those who have provided new funding to the Company.
Mark TumeChair

232323MRI Scanner, Qscan Windsor Clinic, Brisbane

24
Environment. Society. Governance. “ESG”
As an investor in critical infrastructure and services, Infratil has, since inception, been acutely aware that capital providers will only achieve satisfactory returns if the needs and expectations of users and adjacent communities are satisfied.
In addition, societal ethics and goals (and their evolution) must be recognised, anticipated, and factored into plans and how capital is allocated. Over the years, Infratil’s Reports and Update newsletters have set out many case studies.
Now, investors, governments, and regulators are demanding more formalised reporting protocols, especially with regard to Climate Change. As explained below, this is not a trivial exercise and is complicated by the range of reporting and measurement initiatives coincidentally unfolding.
Prior to 2009 the Financial Stability Forum, a supra-government agency, had responsibility for monitoring global financial risks. After it missed giving warning of the Global Financial Crisis it was rebranded as the Financial Stability Board, and in 2017 its subsidiary, the Task Force on Climate-Related Financial Disclosures (“TFCD”), handed down a suite of recommendations on “Climate-related Financial Disclosures”.
Many Governments, including New Zealand’s, are now making climate-related disclosures mandatory. In New Zealand the details of what has to be disclosed will, in due course, be determined by the External Reporting Board (XRB), the body responsible for setting financial reporting and auditing rules and standards for companies such as Infratil.
Because the XRB hasn’t yet done its job we don’t know what the Climate-related Disclosures will be, but it is possible to look at the TFCD report to see what they are likely to cover:
• Governance. Confirming that Climate Change risks and transition costs are being monitored and addressed by the Company’s governance arrangements.
• Strategy & Risk Management. Reporting entities are likely to be required to identify risks and show they are factoring them into strategies.
• Measurement & Goals. Presumably this is where readers of the relevant disclosures will be able to see details of a reporting entity’s emissions and emission goals, and threats from Climate Change and decarbonisation transition initiatives, and so on.
For an enterprise like Wellington Airport, the disclosures are likely to entail identifying physical risks such as the potential cost of weather disruptions and damage to infrastructure (the Airport is to replace its sea protections in anticipation of more damaging storm surges. This is the sort of cost which will in future have to be identified and reported), and transition risks including higher insurance costs and how decarbonisation policies could impact air travel. They will also require
reporting Phase 1 and 2 emissions and reduction goals (these are the emissions directly related to an enterprise’s activities).
For a company such as Infratil, which invests in operational businesses rather than directly, it’s less obvious what will have to be disclosed.
GRESB & Other ESG MeasurementsThe accounting standards outlined above are intended to cover financial metrics related to Climate Change. Many people also have wider concerns about the environment, employees, contractors, specific issues such as weapons manufacture, and more general factors such as governance and risk management.
Many agencies now undertake reviews of ESG metrics and score companies. This includes MSCI, FTSE Russell, Sustainalytics, Moody’s, S&P, Refinitiv, Morningstar and FactSet. But often the results are inconsistent, sometimes even perverse.
An article in the Credit Suisse Investment Yearbook 2020 shows how divergent agencies can be in their ratings. For instance, MSCI ranks Tesla at the top of
0 25 50 75 100 0 25 50 75 100
0 25 50 75 100
100 2020
0 25 50 75 100
0 25 50 75 100
0 25 50 75 100
3
3
ESG
Social
Governance
Environmental
ESG
Social
Governance
Environmental
Facebook JPMorgan Chase
Walmart Pfizer
FTSE Sustainalytics
Stakeholder Engagement
Risk Management
Reporting
Policies
LeadershipEmployees
Health & Safety
WasteWater
Air pollutionEmissions
Energy
100
Biodiversity & Habitat
Customers Awards
MSCI
0 25 50 75 100 0 25 50 75 100 0 25 50 75 100
0 25 50 75 100 0 25 50 75 100 0 25 50 75 100
ESG
Social
Covernance
Environmental
Facebook JPMorgan Chase Johnson & Johnson
Wells Fargo Walmart Pfizer
ESG
FTSE
Social
Covernance
Environmental
Sustainalytics MSCI
500
FTSE Sustainalytics MSCI (0=poor 100=excellent)
Divergent ratings of large US companies

25
sustainability for the car industry but FTSE ranks it as the worst. MSCI focuses on the cars being manufactured, FTSE focuses on factory emissions. The graphics on the previous page show similar ratings divergence for other major US companies.
Recently the New Zealand market saw the consequences of perverse ESG ratings. In 2020 S&P created a global index of sustainable companies which initially only included 19 companies from around the world, including Contact Energy and Mercury Energy. Global fund managers then set up Funds specifically to invest in this index and a flood of money into the Funds resulted in massive purchases of the 19 companies, reportedly amounting to almost 10% of the two NZX listed companies. Recently the S&P index was broadened to include many more companies, which resulted in Funds selling down the initial 19 stocks to buy the new entrants.
Between 1st December 2020 and 1st March 2021 Contact saw its share price rise 37% and then fall 37%. Meridian’s rose 46% and fell 40%.
GRESB reports are an alternative. Rather than an external agency creating subjective (and inconsistent) scores, the GRESB template is tailored for each participating company and completed by the company. A number of mechanisms ensure the information provided is honest.
GRESB was established in Holland in 2009 to provide ESG rating of real estate companies for institutional investors. Its remit was later expanded to include a wider range of companies and it is widely used by institutional investors to assess the ESG performance of companies they invest in or may invest in.
Wellington Airport’s GRESB report is 76 pages and publicly available for anyone interested, but the key findings are summarised in the infographics on the right.
0 25 50 75 100 0 25 50 75 100
0 25 50 75 100
100 2020
0 25 50 75 100
0 25 50 75 100
0 25 50 75 100
3
3
ESG
Social
Governance
Environmental
ESG
Social
Governance
Environmental
Facebook JPMorgan Chase
Walmart Pfizer
FTSE Sustainalytics
Stakeholder Engagement
Risk Management
Reporting
Policies
LeadershipEmployees
Health & Safety
WasteWater
Air pollutionEmissions
Energy
100
Biodiversity & Habitat
Customers Awards
MSCI
0 25 50 75 100 0 25 50 75 100 0 25 50 75 100
0 25 50 75 100 0 25 50 75 100 0 25 50 75 100
ESG
Social
Covernance
Environmental
Facebook JPMorgan Chase Johnson & Johnson
Wells Fargo Walmart Pfizer
ESG
FTSE
Social
Covernance
Environmental
Sustainalytics MSCI
500
To explain the graphic:
1. The Airport was required to report on 15 areas ranging from Employees (it got a score of 98%) to Corporate Awards (0%).
2. The 15 areas were weighted by importance (risk management is the most important at 19.6% while Awards was the least important at 2.4%).
3. The shaded area is the average score of other airports rated by GRESB. The red line shows Wellington’s score.
4. While Wellington performed credibly relative to other airports scored by GRESB, to understand the score it is
useful to look at the details. For instance, Wellington scored only 60% on Air Pollution, but as anyone who has visited Wellington Airport would know, less polluted air is hard to find. The score was reduced because in Wellington City there isn’t widespread air quality measurement against which air around the Airport can be compared.
Wellington Airport’s overall score was 78 against a peer average of 70. The management score was 41 (out of 50), peer’s 38. The performance score was 37, peer’s 32.
Wellington Airport GRESB Benchmarking Report
Wellington’s rating Average airport rating

26
Financial TrendsThe graphs were chosen to illustrate key aspects of Infratil’s decade.
Proportionate EBITDAF 1 The calculation of Proportionate EBITDAF is on page 28 of this report. It is intended to show Infratil’s share of the earnings of the companies in which it has a shareholding.
The figures include the contribution of assets held for sale.
Infratil's Assets
Proportionate Investment
0
10
20
30
40
50
60
70
80
90
100
%
Infratil's Capital Structure
0
5
10
15
20
0
100
200
300
400
500
600
700
Dividend, cents per share$Millions
$Millions
EBITDAF, Free Cash Flows, Dividends
Sources of Consolidated EBITDAF
0
$Millions
Data Other SocialTransport Telecommunications Energy
100
-100
200
300
400
500
600
Perpetual bondsEquity (market value) Net bank debt and dated bonds
Operating cash flowInterest, tax, working capital Dividend (rhs)
200
400
600
0
800
1,000
1,200
1,400
1,600
1,800
2,000
500
1,000
1,500
2,000
2,500
3,500
3,000
Sold RetireAustralia Wellington Airport
Trustpower
Vodafone NZ
Other
0
2021
4,500
4,000
$Millions
5,000
6,000
5,500
2021 2020 2018 2019 2012 2013 2014 201720162015
2020 2018 2019 2011 2012 2013 2014 20172016 2015
2021
2020 2018 2019 2011 2012 2013 2014 20172016 2015
CDC
2020 2018 2019 2012 2013 2014 20172016 2015
Tilt Renewables
2020 2018 2019 2012 2013 2014 20172016 2015
0
200
400
600
800
1,000
1,400
1,200
Longroad
RetireAustralia Wellington Airport Trustpower
Other
Qscan
Qscan
2021
1,800
1,600
$Millions
2,000
CDC
Vodafone NZ Tilt Renewables
2020 2018 2019 2012 2013 2014 20172016 2015
Longroad
RetireAustralia Wellington Airport Trustpower
Sold
Total
Corporate
CDC
Vodafone NZ Tilt Renewables
0
100
200
300
400
500
60%
40%
20%
-20%
2018 20202019
Dividend Return Capital Return
20172012 2013 2014 2015
Accumulation Index
80%
100%
Annual Return
2016
0
2021
0
100
200
300
400
500
60%
40%
20%
0
-20%
-40%
2018 20202019
Dividend Return Capital Return
20172012 2013 2014 2015
Accumulation Index
Accumulation Index
70%
80%
Annual Return
2016 2021
$50
$100
$150
$200
$250
$300
02032 2029 2030 2022 2028 20312023 2024 20272026 2025
$50
$100
$150
$200
$250
$300
02032 2029 2030 2022 2028 20312023 2024 20272026 2025
AccumulationIndex
Qscan
Shareholder Returns Between 1 April 2011 and 31 March 2021 Infratil provided its shareholders with an average annual return of 20.1%. This is after tax, using the corporate rate of 28%.
$100 invested at the start of the period would have compounded to $623 by the end, assuming that all distributions were reinvested.
The spectacular returns delivered over FY2021 to an extent reflected a recovery from the market slump of March 2020, and the increase in the value of several of the companies Infratil owns (as partially reflected by the increase in the values shown in the graph Infratil Assets on the facing page).
Infratil's Assets
Proportionate Investment
0
10
20
30
40
50
60
70
80
90
100
%
Infratil's Capital Structure
0
5
10
15
20
0
100
200
300
400
500
600
700
Dividend, cents per share$Millions
$Millions
EBITDAF, Free Cash Flows, Dividends
Sources of Consolidated EBITDAF
0
$Millions
Data Other SocialTransport Telecommunications Energy
100
-100
200
300
400
500
600
Perpetual bondsEquity (market value) Net bank debt and dated bonds
Operating cash flowInterest, tax, working capital Dividend (rhs)
200
400
600
0
800
1,000
1,200
1,400
1,600
1,800
2,000
500
1,000
1,500
2,000
2,500
3,500
3,000
Sold RetireAustralia Wellington Airport
Trustpower
Vodafone NZ
Other
0
2021
4,500
4,000
$Millions
5,000
6,000
5,500
2021 2020 2018 2019 2012 2013 2014 201720162015
2020 2018 2019 2011 2012 2013 2014 20172016 2015
2021
2020 2018 2019 2011 2012 2013 2014 20172016 2015
CDC
2020 2018 2019 2012 2013 2014 20172016 2015
Tilt Renewables
2020 2018 2019 2012 2013 2014 20172016 2015
0
200
400
600
800
1,000
1,400
1,200
Longroad
RetireAustralia Wellington Airport Trustpower
Other
Qscan
Qscan
2021
1,800
1,600
$Millions
2,000
CDC
Vodafone NZ Tilt Renewables
2020 2018 2019 2012 2013 2014 20172016 2015
Longroad
RetireAustralia Wellington Airport Trustpower
Sold
Total
Corporate
CDC
Vodafone NZ Tilt Renewables
0
100
200
300
400
500
60%
40%
20%
-20%
2018 20202019
Dividend Return Capital Return
20172012 2013 2014 2015
Accumulation Index
80%
100%
Annual Return
2016
0
2021
0
100
200
300
400
500
60%
40%
20%
0
-20%
-40%
2018 20202019
Dividend Return Capital Return
20172012 2013 2014 2015
Accumulation Index
Accumulation Index
70%
80%
Annual Return
2016 2021
$50
$100
$150
$200
$250
$300
02032 2029 2030 2022 2028 20312023 2024 20272026 2025
$50
$100
$150
$200
$250
$300
02032 2029 2030 2022 2028 20312023 2024 20272026 2025
AccumulationIndex
Qscan
1. Proportionate EBITDAF is an unaudited non-GAAP measure and is defined on page 7.
27
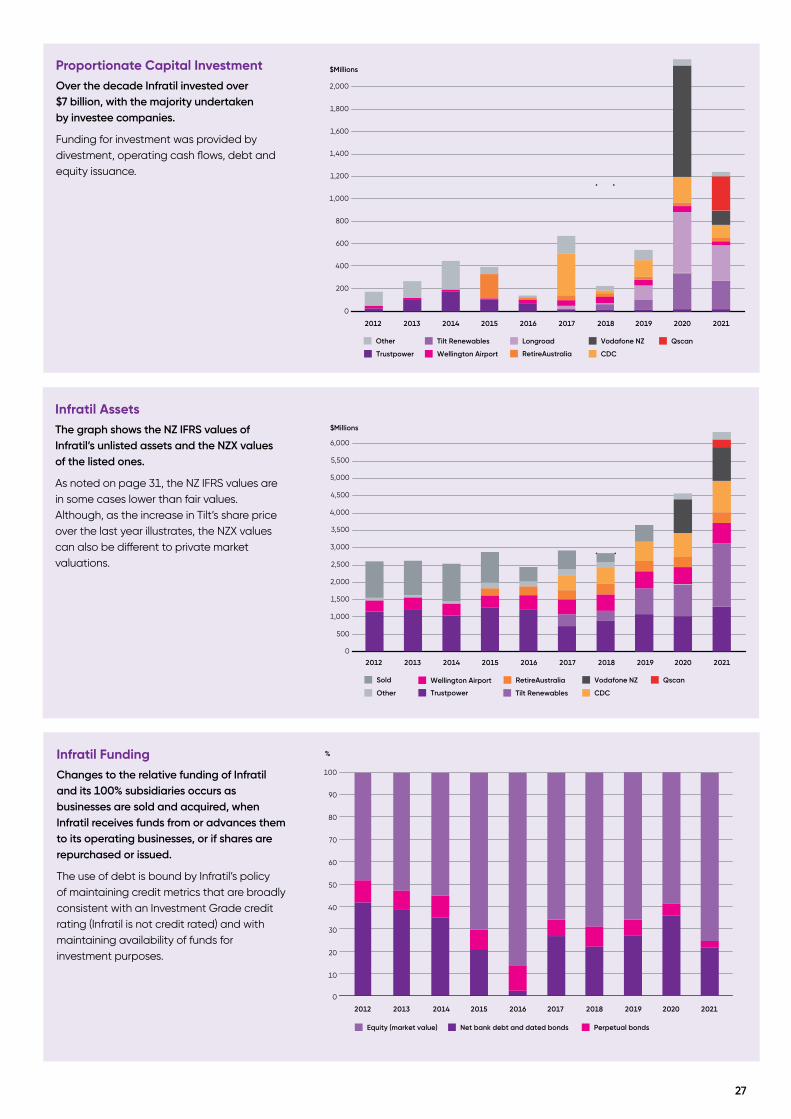
Infratil AssetsThe graph shows the NZ IFRS values of Infratil’s unlisted assets and the NZX values of the listed ones.
As noted on page 31, the NZ IFRS values are in some cases lower than fair values. Although, as the increase in Tilt’s share price over the last year illustrates, the NZX values can also be different to private market valuations.
Infratil's Assets
Proportionate Investment
0
10
20
30
40
50
60
70
80
90
100
%
Infratil's Capital Structure
0
5
10
15
20
0
100
200
300
400
500
600
700
Dividend, cents per share$Millions
$Millions
EBITDAF, Free Cash Flows, Dividends
Sources of Consolidated EBITDAF
0
$Millions
Data Other SocialTransport Telecommunications Energy
100
-100
200
300
400
500
600
Perpetual bondsEquity (market value) Net bank debt and dated bonds
Operating cash flowInterest, tax, working capital Dividend (rhs)
200
400
600
0
800
1,000
1,200
1,400
1,600
1,800
2,000
500
1,000
1,500
2,000
2,500
3,500
3,000
Sold RetireAustralia Wellington Airport
Trustpower
Vodafone NZ
Other
0
2021
4,500
4,000
$Millions
5,000
6,000
5,500
2021 2020 2018 2019 2012 2013 2014 201720162015
2020 2018 2019 2011 2012 2013 2014 20172016 2015
2021
2020 2018 2019 2011 2012 2013 2014 20172016 2015
CDC
2020 2018 2019 2012 2013 2014 20172016 2015
Tilt Renewables
2020 2018 2019 2012 2013 2014 20172016 2015
0
200
400
600
800
1,000
1,400
1,200
Longroad
RetireAustralia Wellington Airport Trustpower
Other
Qscan
Qscan
2021
1,800
1,600
$Millions
2,000
CDC
Vodafone NZ Tilt Renewables
2020 2018 2019 2012 2013 2014 20172016 2015
Longroad
RetireAustralia Wellington Airport Trustpower
Sold
Total
Corporate
CDC
Vodafone NZ Tilt Renewables
0
100
200
300
400
500
60%
40%
20%
-20%
2018 20202019
Dividend Return Capital Return
20172012 2013 2014 2015
Accumulation Index
80%
100%
Annual Return
2016
0
2021
0
100
200
300
400
500
60%
40%
20%
0
-20%
-40%
2018 20202019
Dividend Return Capital Return
20172012 2013 2014 2015
Accumulation Index
Accumulation Index
70%
80%
Annual Return
2016 2021
$50
$100
$150
$200
$250
$300
02032 2029 2030 2022 2028 20312023 2024 20272026 2025
$50
$100
$150
$200
$250
$300
02032 2029 2030 2022 2028 20312023 2024 20272026 2025
AccumulationIndex
Qscan
Proportionate Capital InvestmentOver the decade Infratil invested over $7 billion, with the majority undertaken by investee companies.
Funding for investment was provided by divestment, operating cash flows, debt and equity issuance.
Infratil's Assets
Proportionate Investment
0
10
20
30
40
50
60
70
80
90
100
%
Infratil's Capital Structure
0
5
10
15
20
0
100
200
300
400
500
600
700
Dividend, cents per share$Millions
$Millions
EBITDAF, Free Cash Flows, Dividends
Sources of Consolidated EBITDAF
0
$Millions
Data Other SocialTransport Telecommunications Energy
100
-100
200
300
400
500
600
Perpetual bondsEquity (market value) Net bank debt and dated bonds
Operating cash flowInterest, tax, working capital Dividend (rhs)
200
400
600
0
800
1,000
1,200
1,400
1,600
1,800
2,000
500
1,000
1,500
2,000
2,500
3,500
3,000
Sold RetireAustralia Wellington Airport
Trustpower
Vodafone NZ
Other
0
2021
4,500
4,000
$Millions
5,000
6,000
5,500
2021 2020 2018 2019 2012 2013 2014 201720162015
2020 2018 2019 2011 2012 2013 2014 20172016 2015
2021
2020 2018 2019 2011 2012 2013 2014 20172016 2015
CDC
2020 2018 2019 2012 2013 2014 20172016 2015
Tilt Renewables
2020 2018 2019 2012 2013 2014 20172016 2015
0
200
400
600
800
1,000
1,400
1,200
Longroad
RetireAustralia Wellington Airport Trustpower
Other
Qscan
Qscan
2021
1,800
1,600
$Millions
2,000
CDC
Vodafone NZ Tilt Renewables
2020 2018 2019 2012 2013 2014 20172016 2015
Longroad
RetireAustralia Wellington Airport Trustpower
Sold
Total
Corporate
CDC
Vodafone NZ Tilt Renewables
0
100
200
300
400
500
60%
40%
20%
-20%
2018 20202019
Dividend Return Capital Return
20172012 2013 2014 2015
Accumulation Index
80%
100%
Annual Return
2016
0
2021
0
100
200
300
400
500
60%
40%
20%
0
-20%
-40%
2018 20202019
Dividend Return Capital Return
20172012 2013 2014 2015
Accumulation Index
Accumulation Index
70%
80%
Annual Return
2016 2021
$50
$100
$150
$200
$250
$300
02032 2029 2030 2022 2028 20312023 2024 20272026 2025
$50
$100
$150
$200
$250
$300
02032 2029 2030 2022 2028 20312023 2024 20272026 2025
AccumulationIndex
Qscan
Infratil FundingChanges to the relative funding of Infratil and its 100% subsidiaries occurs as businesses are sold and acquired, when Infratil receives funds from or advances them to its operating businesses, or if shares are repurchased or issued.
The use of debt is bound by Infratil’s policy of maintaining credit metrics that are broadly consistent with an Investment Grade credit rating (Infratil is not credit rated) and with maintaining availability of funds for investment purposes.
Infratil's Assets
Proportionate Investment
0
10
20
30
40
50
60
70
80
90
100
%
Infratil's Capital Structure
0
5
10
15
20
0
100
200
300
400
500
600
700
Dividend, cents per share$Millions
$Millions
EBITDAF, Free Cash Flows, Dividends
Sources of Consolidated EBITDAF
0
$Millions
Data Other SocialTransport Telecommunications Energy
100
-100
200
300
400
500
600
Perpetual bondsEquity (market value) Net bank debt and dated bonds
Operating cash flowInterest, tax, working capital Dividend (rhs)
200
400
600
0
800
1,000
1,200
1,400
1,600
1,800
2,000
500
1,000
1,500
2,000
2,500
3,500
3,000
Sold RetireAustralia Wellington Airport
Trustpower
Vodafone NZ
Other
0
2021
4,500
4,000
$Millions
5,000
6,000
5,500
2021 2020 2018 2019 2012 2013 2014 201720162015
2020 2018 2019 2011 2012 2013 2014 20172016 2015
2021
2020 2018 2019 2011 2012 2013 2014 20172016 2015
CDC
2020 2018 2019 2012 2013 2014 20172016 2015
Tilt Renewables
2020 2018 2019 2012 2013 2014 20172016 2015
0
200
400
600
800
1,000
1,400
1,200
Longroad
RetireAustralia Wellington Airport Trustpower
Other
Qscan
Qscan
2021
1,800
1,600
$Millions
2,000
CDC
Vodafone NZ Tilt Renewables
2020 2018 2019 2012 2013 2014 20172016 2015
Longroad
RetireAustralia Wellington Airport Trustpower
Sold
Total
Corporate
CDC
Vodafone NZ Tilt Renewables
0
100
200
300
400
500
60%
40%
20%
-20%
2018 20202019
Dividend Return Capital Return
20172012 2013 2014 2015
Accumulation Index
80%
100%
Annual Return
2016
0
2021
0
100
200
300
400
500
60%
40%
20%
0
-20%
-40%
2018 20202019
Dividend Return Capital Return
20172012 2013 2014 2015
Accumulation Index
Accumulation Index
70%
80%
Annual Return
2016 2021
$50
$100
$150
$200
$250
$300
02032 2029 2030 2022 2028 20312023 2024 20272026 2025
$50
$100
$150
$200
$250
$300
02032 2029 2030 2022 2028 20312023 2024 20272026 2025
AccumulationIndex
Qscan

28
Infratil’s Financial Performance & Position
Consolidated ResultsFor the year to 31 March 2021 the net parent result was a loss of $49.2 million, down from a surplus of $241.2 million the prior year. The breakdown of both periods’ results are provided on the facing page.
The main source of difference was the $511.5 million gain recorded on the sale of the Snowtown 2 wind farm in the prior year. This year includes the $98.1 million increase in the international incentive fee accrual explained on page 22 of the report.
The accrual of incentive fees was $223.1 million. The fee reflects 20% of the gains returned above the 12% hurdle on Infratil’s investment in CDC, Tilt, Longroad, RetireAustralia, and ASIP.
For 2021 the average exchange rates were NZ$/A$0.9338 and NZ$/US$0.6711 (0.9501 and 0.6474 in 2020).
Year Ended 31 March ($Millions) 2021 2020
Operating revenue $1,241.6 $1,189.5
Operating expenses ($864.4) ($848.0)
International Portfolio Incentive fee ($223.1) ($125.0)
Depreciation & amortisation ($82.8) ($71.2)
Net interest ($138.5) ($145.0)
Tax expense $4.2 ($9.5)
Revaluations & realisations ($24.6) $14.4
Discontinued operations $71.6 $479.0
Net profit after tax ($16.0) $484.2
Minority earnings ($33.2) ($243.0)
Net parent surplus ($49.2) $241.2
Year Ended 31 March ($Millions) Share 2021 2020
Trustpower 51% $102.1 $95.1
Longroad Energy 40% $0.1 $19.2
Wellington Airport 66% $23.7 $68.1
CDC Data Centres 48% $75.8 $59.6
Vodafone NZ 50% $223.5 $154.9
Qscan 56% $11.0 -
RetireAustralia 50% $10.4 $8.9
Corporate/Other ($47.8) ($35.6)
Proportionate EBITDAF 1 $398.8 $370.2
International Portfolio Incentive Fee ($223.1) ($125.0)
Tilt 66% $52.6 $81.1
Discontinued operations - $15.0
Total $228.3 $341.3
For 2021 the average exchange rates were NZ$/A$0.9338 and NZ$/US$0.6711 (0.9501 and 0.6474 in 2020).
1. Proportionate EBITDAF is an unaudited non-GAAP measure and is defined on page 7.
Proportionate EBITDAFThis table shows Infratil’s Proportionate EBITDAF contributions from its continuing operations, management costs, excluding international portfolio incentive fees, and contributions from businesses sold or held for sale.
To illustrate the calculation of Proportionate EBITDAF. Infratil owns 51% of Trustpower, Trustpower’s EBITDAF for the period was $200.2 million, and 51% of that is $102.1 million.
Also shown is the total which includes the above noted exclusions.
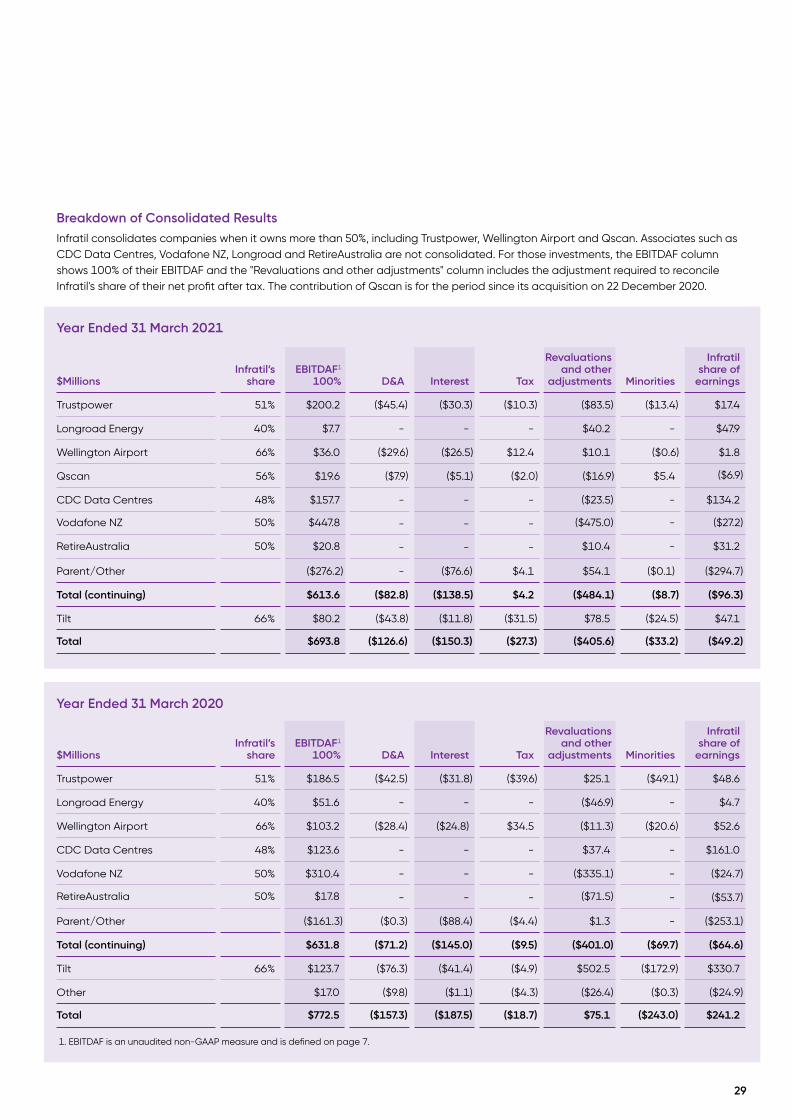
Breakdown of Consolidated ResultsInfratil consolidates companies when it owns more than 50%, including Trustpower, Wellington Airport and Qscan. Associates such as CDC Data Centres, Vodafone NZ, Longroad and RetireAustralia are not consolidated. For those investments, the EBITDAF column shows 100% of their EBITDAF and the "Revaluations and other adjustments" column includes the adjustment required to reconcile Infratil's share of their net profit after tax. The contribution of Qscan is for the period since its acquisition on 22 December 2020.
Year Ended 31 March 2021
$MillionsInfratil’s
shareEBITDAF1
100% D&A Interest Tax
Revaluations and other
adjustments Minorities
Infratil share of
earnings
Trustpower 51% $200.2 ($45.4) ($30.3) ($10.3) ($83.5) ($13.4) $17.4
Longroad Energy 40% $7.7 - - - $40.2 - $47.9
Wellington Airport 66% $36.0 ($29.6) ($26.5) $12.4 $10.1 ($0.6) $1.8
Qscan 56% $19.6 ($7.9) ($5.1) ($2.0) ($16.9) $5.4 ($6.9)
CDC Data Centres 48% $157.7 - - - ($23.5) - $134.2
Vodafone NZ 50% $447.8 - - - ($475.0) - ($27.2)
RetireAustralia 50% $20.8 - - - $10.4 - $31.2
Parent/Other ($276.2) - ($76.6) $4.1 $54.1 ($0.1) ($294.7)
Total (continuing) $613.6 ($82.8) ($138.5) $4.2 ($484.1) ($8.7) ($96.3)
Tilt 66% $80.2 ($43.8) ($11.8) ($31.5) $78.5 ($24.5) $47.1
Total $693.8 ($126.6) ($150.3) ($27.3) ($405.6) ($33.2) ($49.2)
Year Ended 31 March 2020
$MillionsInfratil’s
shareEBITDAF1
100% D&A Interest Tax
Revaluations and other
adjustments Minorities
Infratil share of
earnings
Trustpower 51% $186.5 ($42.5) ($31.8) ($39.6) $25.1 ($49.1) $48.6
Longroad Energy 40% $51.6 - - - ($46.9) - $4.7
Wellington Airport 66% $103.2 ($28.4) ($24.8) $34.5 ($11.3) ($20.6) $52.6
CDC Data Centres 48% $123.6 - - - $37.4 - $161.0
Vodafone NZ 50% $310.4 - - - ($335.1) - ($24.7)
RetireAustralia 50% $17.8 - - - ($71.5) - ($53.7)
Parent/Other ($161.3) ($0.3) ($88.4) ($4.4) $1.3 - ($253.1)
Total (continuing) $631.8 ($71.2) ($145.0) ($9.5) ($401.0) ($69.7) ($64.6)
Tilt 66% $123.7 ($76.3) ($41.4) ($4.9) $502.5 ($172.9) $330.7
Other $17.0 ($9.8) ($1.1) ($4.3) ($26.4) ($0.3) ($24.9)
Total $772.5 ($157.3) ($187.5) ($18.7) $75.1 ($243.0) $241.2
1. EBITDAF is an unaudited non-GAAP measure and is defined on page 7.
29
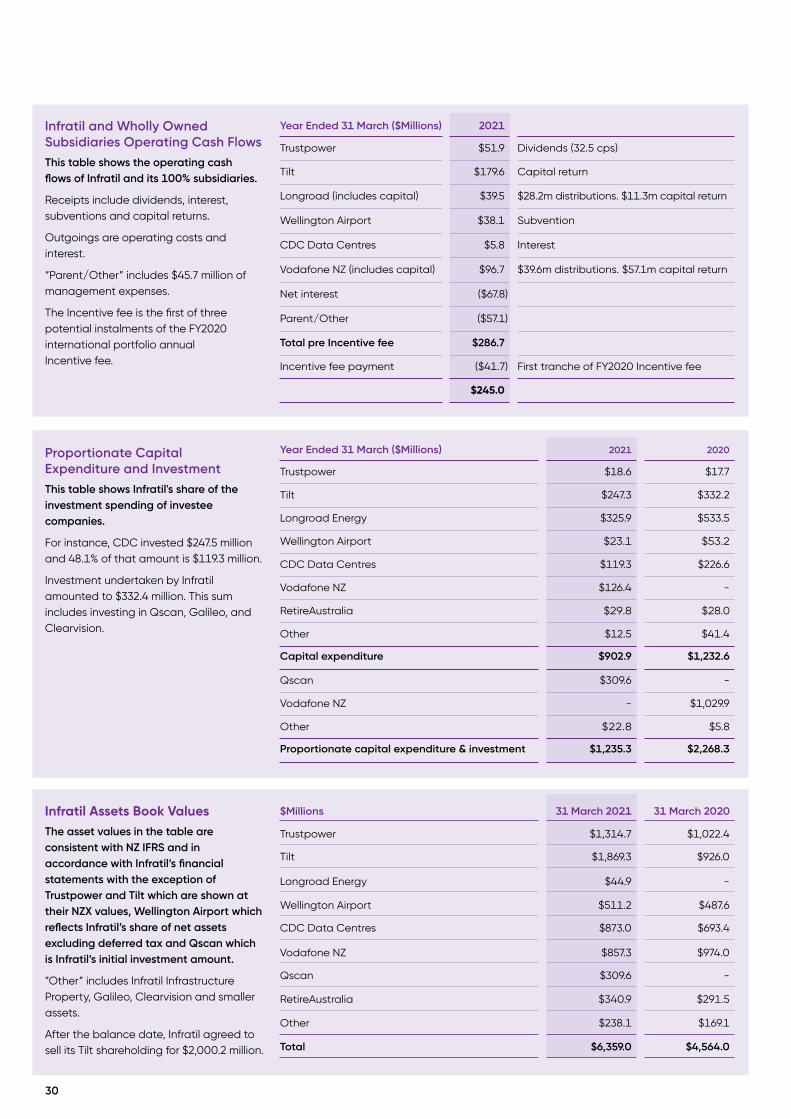
30
Infratil Assets Book ValuesThe asset values in the table are consistent with NZ IFRS and in accordance with Infratil’s financial statements with the exception of Trustpower and Tilt which are shown at their NZX values, Wellington Airport which reflects Infratil’s share of net assets excluding deferred tax and Qscan which is Infratil’s initial investment amount.
”Other” includes Infratil Infrastructure Property, Galileo, Clearvision and smaller assets.
After the balance date, Infratil agreed to sell its Tilt shareholding for $2,000.2 million.
$Millions 31 March 2021 31 March 2020
Trustpower $1,314.7 $1,022.4
Tilt $1,869.3 $926.0
Longroad Energy $44.9 -
Wellington Airport $511.2 $487.6
CDC Data Centres $873.0 $693.4
Vodafone NZ $857.3 $974.0
Qscan $309.6 -
RetireAustralia $340.9 $291.5
Other $238.1 $169.1
Total $6,359.0 $4,564.0
Year Ended 31 March ($Millions) 2021
Trustpower $51.9 Dividends (32.5 cps)
Tilt $179.6 Capital return
Longroad (includes capital) $39.5 $28.2m distributions. $11.3m capital return
Wellington Airport $38.1 Subvention
CDC Data Centres $5.8 Interest
Vodafone NZ (includes capital) $96.7 $39.6m distributions. $57.1m capital return
Net interest ($67.8)
Parent/Other ($57.1)
Total pre Incentive fee $286.7
Incentive fee payment ($41.7) First tranche of FY2020 Incentive fee
$245.0
Infratil and Wholly Owned Subsidiaries Operating Cash FlowsThis table shows the operating cash flows of Infratil and its 100% subsidiaries.
Receipts include dividends, interest, subventions and capital returns.
Outgoings are operating costs and interest.
“Parent/Other” includes $45.7 million of management expenses.
The Incentive fee is the first of three potential instalments of the FY2020 international portfolio annual Incentive fee.
Proportionate Capital Expenditure and InvestmentThis table shows Infratil's share of the investment spending of investee companies.
For instance, CDC invested $247.5 million and 48.1% of that amount is $119.3 million.
Investment undertaken by Infratil amounted to $332.4 million. This sum includes investing in Qscan, Galileo, and Clearvision.
Year Ended 31 March ($Millions) 2021 2020
Trustpower $18.6 $17.7
Tilt $247.3 $332.2
Longroad Energy $325.9 $533.5
Wellington Airport $23.1 $53.2
CDC Data Centres $119.3 $226.6
Vodafone NZ $126.4 -
RetireAustralia $29.8 $28.0
Other $12.5 $41.4
Capital expenditure $902.9 $1,232.6
Qscan $309.6 -
Vodafone NZ - $1,029.9
Other $22.8 $5.8
Proportionate capital expenditure & investment $1,235.3 $2,268.3

Capital of Infratil and 100% SubsidiariesOn 31 March 2021 Infratil and 100% subsidiaries had $695.0 million of bank facilities drawn to $342.0 million. $13.8 million was on deposit.
Over the year no bonds matured or were repaid. $83.3 million of bonds maturing March 2026 were issued.
In June 2021, $93.9 million of bonds mature and $65.0 million of bank facilities are due in February 2022.
Infratil has provided shareholder backing for letters of credit issued by Longroad which on 31 March 2021 amounted to $86.9 million (2020 $94.6 million). Infratil also had commitments to provide up to $50.0 million of equity funding to Wellington Airport, up to A$10.0 million to RetireAustralia and shareholder backing
Infratil AssetsThe asset values in this table use the values which were commissioned by the Infratil board from independent parties to determine the fair values of the assets held within the International Portfolio subject to annual incentive fees (Longroad, CDC, RetireAustralia, ASIP). Explanation of the basis of each valuation is contained on the section of this report which covers each of Infratil’s investments.
The NZX value for Tilt is shown. Since 31 March 2021 Infratil has agreed to sell this holding for $2,000.2 million.
Infratil does not commission independent valuations for its other assets.
$Millions 31 March 2021 31 March 2020
Net debt of 100% subsidiaries 328.2 $470.9
Dated Infrastructure Bonds $1,155.2 $1,071.9
Perpetual Infrastructure Bonds $231.9 $231.9
Market value Infratil equity $5,151.0 $2,579.3
Total capital $6,866.3 $4,354.0
Dated debt/total capital 21.6% 35.4%
Total debt/total capital 25.0% 40.8%
Debt per Infratil share $2.37 $2.69
for letters of credit issued by Galileo of up to EUR40 million.
During the year Infratil issued 63,273,696 shares at an average price of $4.74 raising $300 million.
Excluding treasury stock, over the year Infratil’s shares on issue rose to 722,952,533 from 659,678,837. The share price rose from $3.91 to $7.13.
$Millions 31 March 2021 31 March 2020
Trustpower $1,314.7 $1,022.4
Longroad Energy $136.2 $162.4
Wellington Airport $511.2 $487.6
CDC Data Centres $2,401.4 $1,515.6
Vodafone NZ $857.3 $974.0
Qscan $309.6 -
RetireAustralia $361.0 $308.2
Other $238.1 $169.1
$6,129.5 $4,639.3
Tilt $1,869.3 $966.5
$7,998.8 $5,605.8
Per Infratil share $11.06 $8.51
For 2021 exchange rates of NZ$/A$ 0.9182, NZ$/US$ 0.6989 and NZ$/EUR 0.5961 were used (2020 0.9740, 0.5997 and 0.5445 respectively).
31

32
Shareholder Returns & Ownership
27 Year Track Record
Over the year to 31 March 2021 Infratil’s share price rose from $3.91 to $7.13. Two dividends were paid amounting to 17.25 cps cash and 4.25 cps in imputation credits. In addition, retail shareholders had the right to purchase 1 new share for each 7.46 shares owned at a price of $4.65. Institutional shareholders were offered shares via a tender and these shares were purchased at a price of $4.75 each.
The total return to shareholders was 91.9% for the year comprising 4.3% after tax (28% tax rate) dividend return and 87.6% capital gain, including the rights issue. The calculation of capital gains assumes that all dividends and rights are reinvested so the shareholder neither takes out nor puts in any cash.
31 March 2021 31 March 2020Million shares Million shares
NZ retail investors 343 47.4% 316 47.9%
NZ institutional investors 211 29.2% 184 27.9%
Offshore parties 169 23.4% 160 24.2%
723 660
Infratil’s after tax return since listing in March 1994 has been 18.8% per annum after tax and over the last ten years 20.1% per annum after tax.
A shareholder who purchased $1,000 of shares on 31 March 1994 would have a holding valued at $104,205 27 years later (assuming all dividends and rights were reinvested).
OwnershipDuring the year 52,521,008 shares were issued to institutional investors at $4.76 each and 10,752,688 were issued to retail investors at $4.65 each.
At the start of the year 659,678,837 shares were on issue, with 722,952,533 on issue at the end.
0
1000
2000
4000
3000
5000
6000
7000
9000
8000
10000
60%
40%
20%
0
-20%
-40%
20192017 202120152013201120092007200520032001199919971995
Dividend Return Capital Return
Accumulation Index
80%
100%
AnnualReturn
Accum
ulation Ind
ex

333333Prospero 1, 380MW solar generation, Andrews County, Texas

34
Bondholders
On this page of the Annual Report we seek to cover topics of potential interest to holders of Infratil Infrastructure Bonds which is not otherwise available in the Report.
In the main this covers what bonds Infratil has issued and redeemed over the year and secondary market activity in the bonds.
New issuesDuring the year Infratil issued $83,293,000 of bonds maturing March 2026, with an issue yield of 3.0% per annum.
Maturities No bonds matured or were bought back over the year.
The next bond maturity is in June 2021. Infratil anticipates offering holders a reinvestment option.
Secondary marketLast year’s annual report addressed the spike in yields which occurred over March with particular focus on whether there was anything unusual about the market yields on Infratil’s bonds and whether Infratil could have justified buying back bonds.
It was shown that while the spike in yields was startling, Infratil’s bonds traded in unison with much of the market. For about a month there were far more sellers than buyers, across the board.
Because the whole market was behaving badly there was little benefit from Infratil seeking to normalise rates on its own bonds. In retrospect buying bonds at that time was a good investment, but at that time few knew what would happen next.
Infratil’s Bond MaturitiesInfratil’s bond maturity profile is set out on the right.
The goal with the bond maturities is that they are evenly spread to minimise refinancing pressure in any one year.
With $1,387 million of bonds on issue, Infratil is one of the largest borrowers from the domestic corporate bond market.
Perpetual bonds have no maturity date.
5 Year Bond YieldThe graph on the right shows the market yield on Infratil’s five year bond and the five year government bond. Once the panic of March/April subsided, the yield on Infratil’s bonds was reasonably logical. Some of the pricing of government bonds is harder to explain. In September 2020 investors in the government bonds were willing to accept a negative yield. Buying bonds for a price that was higher than the value of all the principal and coupon to be paid out over the following five years.
$50
$100
$150
$200
$250
$300
0Perpetual2029 20302022 20282023 2024 202720262025
$Millions
Financial Years
1
2
0
% per annum
3
4
6
5
31 Mar 2021 31 Dec 2020 31 Mar 2020 30 Sep 2020 30 Jun 2020
Infratil 5 year bondMarket yield
NZ Government 5 year bondMarket yield
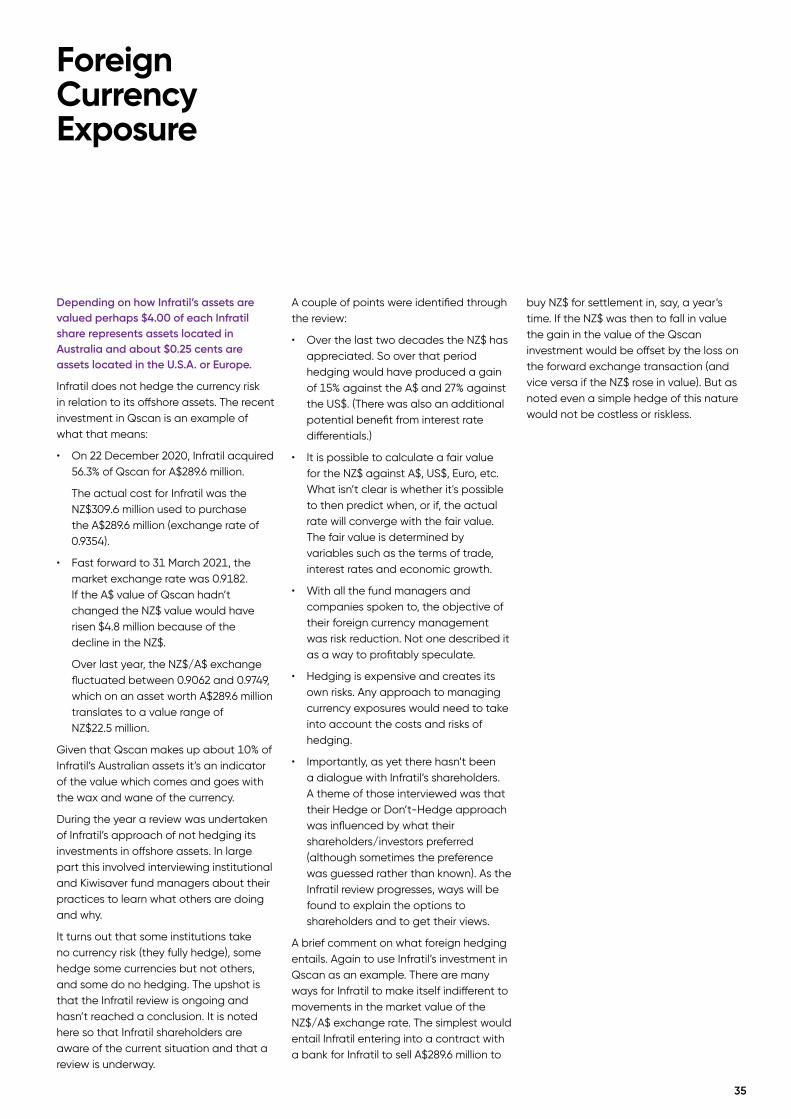
35
Foreign Currency Exposure
Depending on how Infratil’s assets are valued perhaps $4.00 of each Infratil share represents assets located in Australia and about $0.25 cents are assets located in the U.S.A. or Europe.
Infratil does not hedge the currency risk in relation to its offshore assets. The recent investment in Qscan is an example of what that means:
• On 22 December 2020, Infratil acquired 56.3% of Qscan for A$289.6 million.
The actual cost for Infratil was the NZ$309.6 million used to purchase the A$289.6 million (exchange rate of 0.9354).
• Fast forward to 31 March 2021, the market exchange rate was 0.9182. If the A$ value of Qscan hadn’t changed the NZ$ value would have risen $4.8 million because of the decline in the NZ$.
Over last year, the NZ$/A$ exchange fluctuated between 0.9062 and 0.9749, which on an asset worth A$289.6 million translates to a value range of NZ$22.5 million.
Given that Qscan makes up about 10% of Infratil’s Australian assets it’s an indicator of the value which comes and goes with the wax and wane of the currency.
During the year a review was undertaken of Infratil’s approach of not hedging its investments in offshore assets. In large part this involved interviewing institutional and Kiwisaver fund managers about their practices to learn what others are doing and why.
It turns out that some institutions take no currency risk (they fully hedge), some hedge some currencies but not others, and some do no hedging. The upshot is that the Infratil review is ongoing and hasn’t reached a conclusion. It is noted here so that Infratil shareholders are aware of the current situation and that a review is underway.
A couple of points were identified through the review:
• Over the last two decades the NZ$ has appreciated. So over that period hedging would have produced a gain of 15% against the A$ and 27% against the US$. (There was also an additional potential benefit from interest rate differentials.)
• It is possible to calculate a fair value for the NZ$ against A$, US$, Euro, etc. What isn’t clear is whether it's possible to then predict when, or if, the actual rate will converge with the fair value. The fair value is determined by variables such as the terms of trade, interest rates and economic growth.
• With all the fund managers and companies spoken to, the objective of their foreign currency management was risk reduction. Not one described it as a way to profitably speculate.
• Hedging is expensive and creates its own risks. Any approach to managing currency exposures would need to take into account the costs and risks of hedging.
• Importantly, as yet there hasn’t been a dialogue with Infratil’s shareholders. A theme of those interviewed was that their Hedge or Don’t-Hedge approach was influenced by what their shareholders/investors preferred (although sometimes the preference was guessed rather than known). As the Infratil review progresses, ways will be found to explain the options to shareholders and to get their views.
A brief comment on what foreign hedging entails. Again to use Infratil’s investment in Qscan as an example. There are many ways for Infratil to make itself indifferent to movements in the market value of the NZ$/A$ exchange rate. The simplest would entail Infratil entering into a contract with a bank for Infratil to sell A$289.6 million to
buy NZ$ for settlement in, say, a year’s time. If the NZ$ was then to fall in value the gain in the value of the Qscan investment would be offset by the loss on the forward exchange transaction (and vice versa if the NZ$ rose in value). But as noted even a simple hedge of this nature would not be costless or riskless.

36
Trustpower
Infratil 51% Tauranga Energy Consumer Trust 27% Public 22%
Lake Coleridge Power Station
Coleridge Power Station was commissioned in 1916 and upgraded in 1930 and 2000. If resource consents allowed, it could be further upgraded to produce an additional 30GWh a year and improve dry year back-up.

37
Trustpower delivered a credible result, notwithstanding the challenges of an eventful year. EBITDAF was $200.2 million up from $186.5 million for the prior period and underlying earnings were $94 million up from $75 million.
Utility retailing maintained stable energy customer numbers, telco customers rose 8% and customers with more than one service were up 6%. The performance of retailing was particularly credible given covid-related disruptions and its EBITDAF contribution of $47 million demonstrated the resilience of the business.
Dry weather, especially over the last six months, resulted in Trustpower’s generation being 209GWh below long-run averages. At the 14.4c/kWh average
wholesale electricity price for the year, the lack of water equates to an opportunity cost of over $30 million (recognising that high prices and low generation, and vice versa, tend to go together). That Trustpower was still able to lift earnings is testament to good risk management and hedging.
Retail reviewTrustpower instigated a review of its retailing activities.
Originally, electricity retailing was an almost necessary adjunct to generation. It created a hedge because wholesale electricity prices and retail margins tend to move inversely. When retail was having a good year generation would be down, and vice versa.
From that starting point, Trustpower built on its electricity retailing by adding gas, internet and mobile connectivity; based
on the premise that it was good at providing utilities to customers who value service, and it was cost efficient.
The review is intended to address if the rationale remains valid. With a more efficient wholesale electricity market there are now other ways to hedge the ups and downs of generation earnings. And increasing digitalisation of customer-systems means that a larger business or one with additional products may have lower costs or additional revenues.
An important aspect of the review was the position of the Tauranga Electricity Consumer Trust. The Trust’s beneficiaries are the original consumers of the Tauranga Electric Power Board which became Trustpower in 1993. Following consultation, in which two thirds of submissions were supportive, the Trust concluded that the proposal is the best solution to take forward.
Over the last decade, hydo-power made up 57% of total generation in New Zealand (other renewables contributed 23%).
Lakes commonly hold sufficient water to enable generation for several months should there be low natural inflows.
As the graph on the right shows, the level of lake storage over the first quarter of 2021 fell to unusually low levels.
As lake levels fall, power companies that control water storage (mainly Meridian Energy) impose rationing. It’s logical and increases the price of electricity. Users exposed to high prices curtail use and greater use is made of generation with high variable costs (mainly gas and coal).
Any party (user or generator) which doesn’t want exposure to price volatility can contractually fix prices, potentially for up to several years.
1,000
2,000
3,000
4,000
5,000
GWh
0
2017 2018 2019 2020 202110 year average
Oct Nov DecAug SepJan Feb Mar Apr JulJunMay
National hydro storage

38
Year Ended 31 March 2021 2020
Generation 1,708GWh 1,759GWh
Retail electricity sales 1,824GWh 1,817GWh
Electricity accounts 265,000 266,102
Gas accounts 44,000 41,298
Telco accounts 111,965 103,642
Av. Wholesale electricity price 14.4c/kWh 10.7c/kWh
EBITDAF 1 $200.2m $186.5m
Underlying profit after tax $94m $75m
Capital expenditure $36.4m $34.8m
Net debt $726.8m $617.2m
Infratil holding value 2 $1,314.7m $1,022.4m
1. EBITDAF is an unaudited non-GAAP measure and is defined on page 7.
2. NZX market value at period end.
The New Zealand Battery ProjectOver the three decades since the New Zealand electricity market was established (previously being government controlled) several Ministerial and other official reviews have found it to be efficient; which meant 100% reliable at the least cost. A third goal has now been added, “sustainable”. Electricity should be reliable, cheap and with low/no emissions.
By in large, most in the industry (give or take the odd dinosaur) advocate for a price on emissions as the way to reduce emissions. If it costs a lot to produce electricity using gas or coal, less will be used. Last year had Trustpower used gas to generate its electricity rather than water, about 800,000 tonnes of CO2 would have been emitted, which at today’s emission price would have cost about $28 million. Which illustrates the incentive to not use gas.
Unsurprisingly Government has instigated another review, but this one is different. It
has a budget of over $100 million, and Government has already indicated that it has a preferred solution; a new lake that would be built in the hills above the Roxburgh dam. It is unlikely to happen. It would take at least a decade to be operational, is estimated to cost up to $10 billion, would be at risk from the Alpine Fault, would be a net consumer of electricity (the lake wouldn’t fill naturally. Its water would be pumped up-hill from the Clutha River), and it faces environmental and Treaty barriers.
However, in the meantime Trustpower and other industry participants (users and generators) have to cope with the risk of a major disrupting event. It is not likely, but it is a risk and a diversion.
The Tiwai SmelterThe aluminium smelter is a legacy of the last bout of Government Think Big which continues to cause problems. Uncertainty about its length of operation (and consumption of 13% of New Zealand’s
total electricity) has hovered for years. If it closes, there would be an electricity glut for several years; low prices and poor returns on generation assets.
Until recently it was expected to close and this caused a pause in the construction of new generation. Now it seems to be highly profitable and to have a good future. Tiwai aluminium is of unusual purity, strength, and presumably value, and it is low carbon because it uses hydro electricity and this is starting to have a higher value than aluminium smeltered using electricity produced by coal-fired generation.
Climate Change Policies At present the Climate Change Commission (“CCC”) is working through 15,000 submissions on its draft recommendation to government. One of the 15,000 came from Trustpower. Perhaps due to oversight the CCC’s draft report hardly commented on the desirability of government lowering regulatory costs associated with building, operating, and improving all forms of renewable generation.
At present, the regulatory costs associated with operating and maintaining Trustpower’s 26 hydro power schemes are onerous. Furthermore, the barriers to enhancement are impermeable in many situations. The result is that a great deal of relatively low-cost hydro generation capacity and flexibility isn’t available notwithstanding its potential to contribute to the goals of reliable-cheap-sustainable electricity.

39
Customers and retail electricity salesThe attraction of Trustpower’s utility retailing offer is apparent from the graph.
However, Trustpower’s electricity sales per customer have fallen by about 20% over the period, while costs per customer have been stable.
Customer Accounts
0
4,000
3,500
3,000
2,500
2,000
1,500
1,000
500
GWh
200,000
150,000
100,000
50,000
0
250,000
300,000
350,000
400,000
2018 2012 2013 2016 2017 2015 2014
Electricity Accounts: TelcoGas
2021 2020
Total Retail Electricity Sales (GWh)
2019
Total Retail Electricity Sales
EBITDAF 1 & GenerationOver the last ten years Trustpower’s hydro generation has mainly fluctuated with the level of rainfall in its catchments.
EBITDAF has been relatively flat with changes reflecting generation levels, wholesale electricity prices, and the contribution from utility retailing.
0
500
1,500
1,000
2,000
2,500
3,000
GWh
$50
0
$100
$150
$200
$250
EBITDAF$Millions
$300
2021202020182012 2013 2016 201720152014 2019
Generation (GWh) EBITDAF
EBITDAF
EBITDAF 1 per unit of generation and the average market price of electricityHistorically Trustpower’s success as a utilities retailer has meant that earnings per unit of generation have been higher than had the generation been sold straight into the wholesale market.
The review of retailing is intending to address if this benefit is still worth the value of retaining the activities.
0
12
14
10
8
6
4
2
Cents/kwh
$80,000
$60,000
$40,000
$20,000
0
$100,000
$120,000
$140,000
EBITDAFper GWh of generation
2021202020182012 2013 2016 201720152014 2019
EBITDAF per GWh
NZ Market price(Cents/kWh)
NZ Market price
1 EBITDAF is an unaudited non-GAAP measure and is defined on page 7.
40
Tilt Renewables
Infratil 66% Mercury Energy 20% Public 14%
Dundonnell wind farm
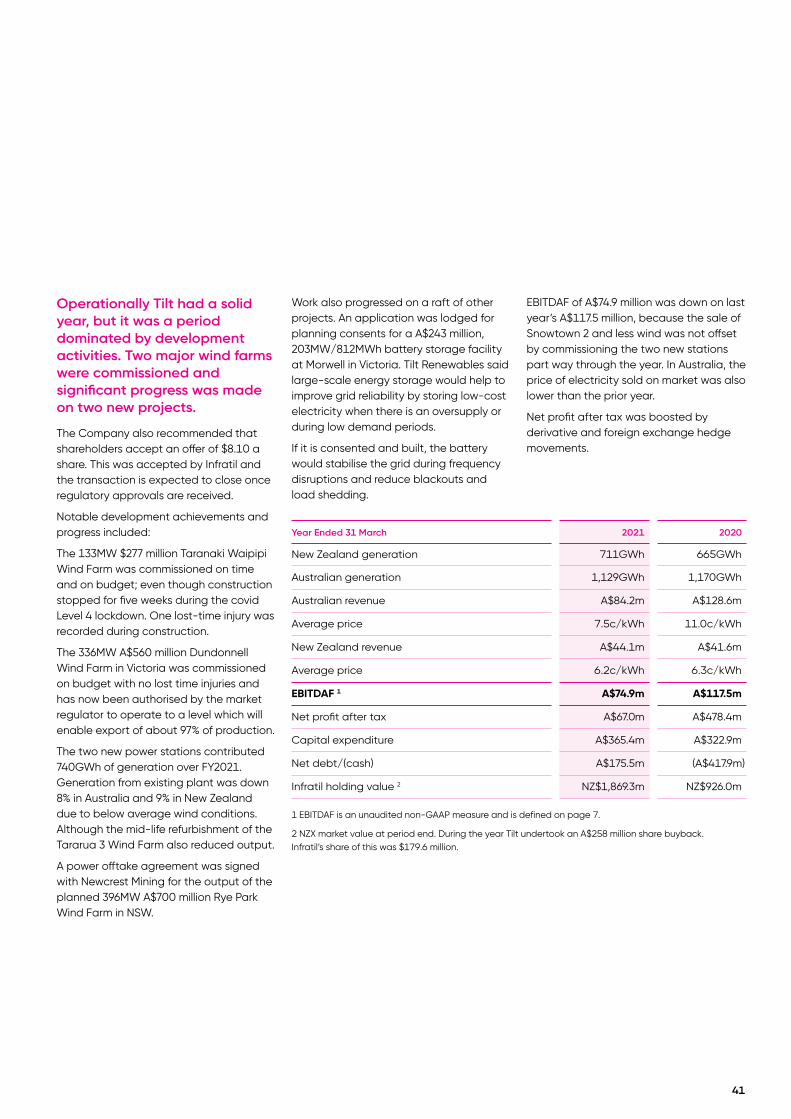
Operationally Tilt had a solid year, but it was a period dominated by development activities. Two major wind farms were commissioned and significant progress was made on two new projects.
The Company also recommended that shareholders accept an offer of $8.10 a share. This was accepted by Infratil and the transaction is expected to close once regulatory approvals are received.
Notable development achievements and progress included:
The 133MW $277 million Taranaki Waipipi Wind Farm was commissioned on time and on budget; even though construction stopped for five weeks during the covid Level 4 lockdown. One lost-time injury was recorded during construction.
The 336MW A$560 million Dundonnell Wind Farm in Victoria was commissioned on budget with no lost time injuries and has now been authorised by the market regulator to operate to a level which will enable export of about 97% of production.
The two new power stations contributed 740GWh of generation over FY2021. Generation from existing plant was down 8% in Australia and 9% in New Zealand due to below average wind conditions. Although the mid-life refurbishment of the Tararua 3 Wind Farm also reduced output.
A power offtake agreement was signed with Newcrest Mining for the output of the planned 396MW A$700 million Rye Park Wind Farm in NSW.
Year Ended 31 March 2021 2020
New Zealand generation 711GWh 665GWh
Australian generation 1,129GWh 1,170GWh
Australian revenue A$84.2m A$128.6m
Average price 7.5c/kWh 11.0c/kWh
New Zealand revenue A$44.1m A$41.6m
Average price 6.2c/kWh 6.3c/kWh
EBITDAF 1 A$74.9m A$117.5m
Net profit after tax A$67.0m A$478.4m
Capital expenditure A$365.4m A$322.9m
Net debt/(cash) A$175.5m (A$417.9m)
Infratil holding value 2 NZ$1,869.3m NZ$926.0m
1 EBITDAF is an unaudited non-GAAP measure and is defined on page 7.
2 NZX market value at period end. During the year Tilt undertook an A$258 million share buyback. Infratil’s share of this was $179.6 million.
Work also progressed on a raft of other projects. An application was lodged for planning consents for a A$243 million, 203MW/812MWh battery storage facility at Morwell in Victoria. Tilt Renewables said large-scale energy storage would help to improve grid reliability by storing low-cost electricity when there is an oversupply or during low demand periods.
If it is consented and built, the battery would stabilise the grid during frequency disruptions and reduce blackouts and load shedding.
EBITDAF of A$74.9 million was down on last year’s A$117.5 million, because the sale of Snowtown 2 and less wind was not offset by commissioning the two new stations part way through the year. In Australia, the price of electricity sold on market was also lower than the prior year.
Net profit after tax was boosted by derivative and foreign exchange hedge movements.
41

42
Longroad Energy
Infratil 40% New Zealand Superannuation Fund 40% Management 20%
Prospero Solar project, Texas, USA.
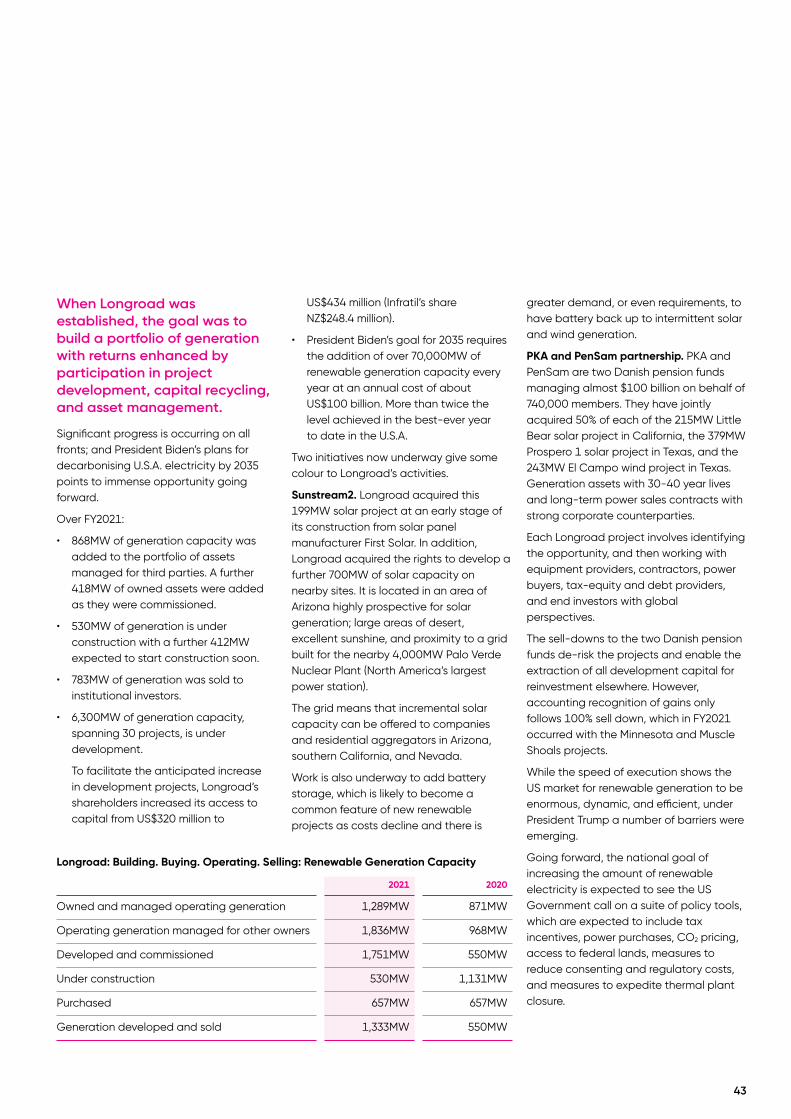
43
When Longroad was established, the goal was to build a portfolio of generation with returns enhanced by participation in project development, capital recycling, and asset management.
Significant progress is occurring on all fronts; and President Biden’s plans for decarbonising U.S.A. electricity by 2035 points to immense opportunity going forward.
Over FY2021:
• 868MW of generation capacity was added to the portfolio of assets managed for third parties. A further 418MW of owned assets were added as they were commissioned.
• 530MW of generation is under construction with a further 412MW expected to start construction soon.
• 783MW of generation was sold to institutional investors.
• 6,300MW of generation capacity, spanning 30 projects, is under development.
To facilitate the anticipated increase in development projects, Longroad’s shareholders increased its access to capital from US$320 million to
Longroad: Building. Buying. Operating. Selling: Renewable Generation Capacity
2021 2020
Owned and managed operating generation 1,289MW 871MW
Operating generation managed for other owners 1,836MW 968MW
Developed and commissioned 1,751MW 550MW
Under construction 530MW 1,131MW
Purchased 657MW 657MW
Generation developed and sold 1,333MW 550MW
US$434 million (Infratil’s share NZ$248.4 million).
• President Biden’s goal for 2035 requires the addition of over 70,000MW of renewable generation capacity every year at an annual cost of about US$100 billion. More than twice the level achieved in the best-ever year to date in the U.S.A.
Two initiatives now underway give some colour to Longroad’s activities.
Sunstream2. Longroad acquired this 199MW solar project at an early stage of its construction from solar panel manufacturer First Solar. In addition, Longroad acquired the rights to develop a further 700MW of solar capacity on nearby sites. It is located in an area of Arizona highly prospective for solar generation; large areas of desert, excellent sunshine, and proximity to a grid built for the nearby 4,000MW Palo Verde Nuclear Plant (North America’s largest power station).
The grid means that incremental solar capacity can be offered to companies and residential aggregators in Arizona, southern California, and Nevada.
Work is also underway to add battery storage, which is likely to become a common feature of new renewable projects as costs decline and there is
greater demand, or even requirements, to have battery back up to intermittent solar and wind generation.
PKA and PenSam partnership. PKA and PenSam are two Danish pension funds managing almost $100 billion on behalf of 740,000 members. They have jointly acquired 50% of each of the 215MW Little Bear solar project in California, the 379MW Prospero 1 solar project in Texas, and the 243MW El Campo wind project in Texas. Generation assets with 30-40 year lives and long-term power sales contracts with strong corporate counterparties.
Each Longroad project involves identifying the opportunity, and then working with equipment providers, contractors, power buyers, tax-equity and debt providers, and end investors with global perspectives.
The sell-downs to the two Danish pension funds de-risk the projects and enable the extraction of all development capital for reinvestment elsewhere. However, accounting recognition of gains only follows 100% sell down, which in FY2021 occurred with the Minnesota and Muscle Shoals projects.
While the speed of execution shows the US market for renewable generation to be enormous, dynamic, and efficient, under President Trump a number of barriers were emerging.
Going forward, the national goal of increasing the amount of renewable electricity is expected to see the US Government call on a suite of policy tools, which are expected to include tax incentives, power purchases, CO2 pricing, access to federal lands, measures to reduce consenting and regulatory costs, and measures to expedite thermal plant closure.
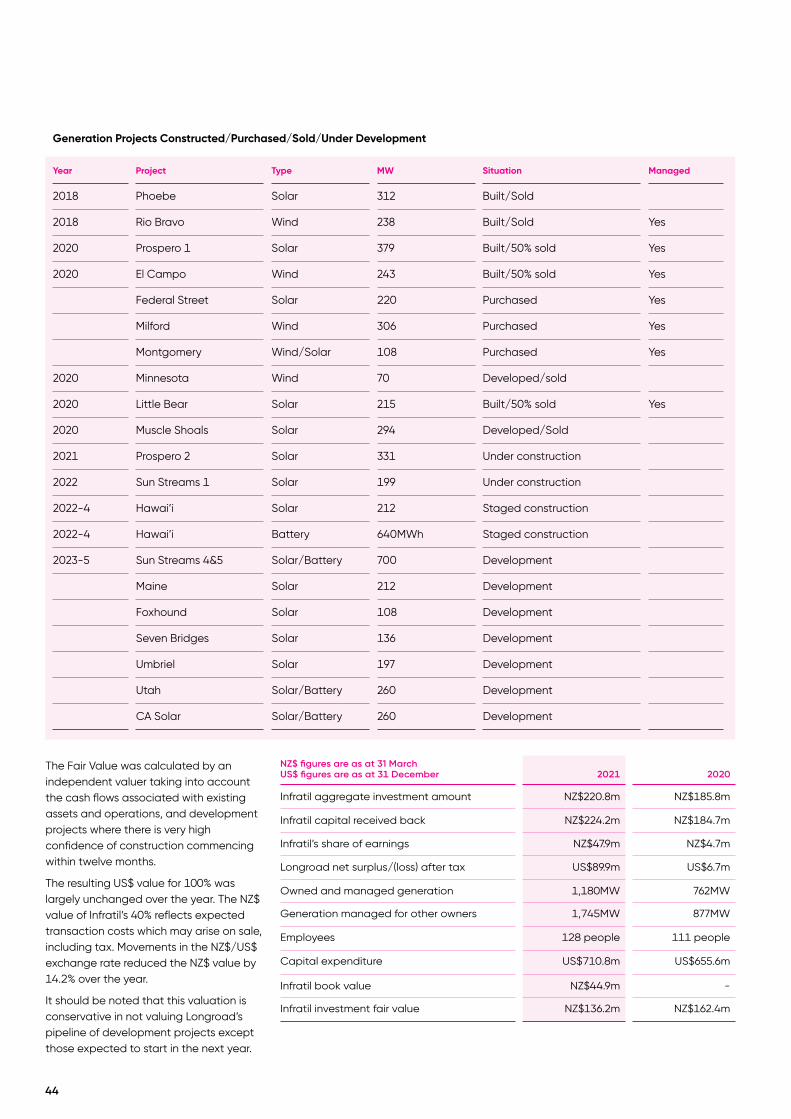
44
NZ$ figures are as at 31 March US$ figures are as at 31 December 2021 2020
Infratil aggregate investment amount NZ$220.8m NZ$185.8m
Infratil capital received back NZ$224.2m NZ$184.7m
Infratil’s share of earnings NZ$47.9m NZ$4.7m
Longroad net surplus/(loss) after tax US$89.9m US$6.7m
Owned and managed generation 1,180MW 762MW
Generation managed for other owners 1,745MW 877MW
Employees 128 people 111 people
Capital expenditure US$710.8m US$655.6m
Infratil book value NZ$44.9m -
Infratil investment fair value NZ$136.2m NZ$162.4m
Generation Projects Constructed/Purchased/Sold/Under Development
Year Project Type MW Situation Managed
2018 Phoebe Solar 312 Built/Sold
2018 Rio Bravo Wind 238 Built/Sold Yes
2020 Prospero 1 Solar 379 Built/50% sold Yes
2020 El Campo Wind 243 Built/50% sold Yes
Federal Street Solar 220 Purchased Yes
Milford Wind 306 Purchased Yes
Montgomery Wind/Solar 108 Purchased Yes
2020 Minnesota Wind 70 Developed/sold
2020 Little Bear Solar 215 Built/50% sold Yes
2020 Muscle Shoals Solar 294 Developed/Sold
2021 Prospero 2 Solar 331 Under construction
2022 Sun Streams 1 Solar 199 Under construction
2022-4 Hawai’i Solar 212 Staged construction
2022-4 Hawai’i Battery 640MWh Staged construction
2023-5 Sun Streams 4&5 Solar/Battery 700 Development
Maine Solar 212 Development
Foxhound Solar 108 Development
Seven Bridges Solar 136 Development
Umbriel Solar 197 Development
Utah Solar/Battery 260 Development
CA Solar Solar/Battery 260 Development
The Fair Value was calculated by an independent valuer taking into account the cash flows associated with existing assets and operations, and development projects where there is very high confidence of construction commencing within twelve months.
The resulting US$ value for 100% was largely unchanged over the year. The NZ$ value of Infratil’s 40% reflects expected transaction costs which may arise on sale, including tax. Movements in the NZ$/US$ exchange rate reduced the NZ$ value by 14.2% over the year.
It should be noted that this valuation is conservative in not valuing Longroad’s pipeline of development projects except those expected to start in the next year.

45
Milford Wind 306MW
Montgomery Street Wind 108MW
Little Bear Solar (50% sold)215MW
Phoebe Solar 315MW
Sunstream Solar 2 & 3 700MW
Sunstream Solar 1 199MW
Hawaii Solar 160MW
Muscle Shoals 294MW
Prospero I Solar (50% sold) 379MW
Prospero 2 Solar 331MW
El Campo Wind (50% sold) 243MW
Rio Wind 238MW
Minnesota Wind* (sold) 70MW
Federal Street Solar
220MW
Built and sold
Owned and operated
Under development
Utah Solar/Battery 260MW
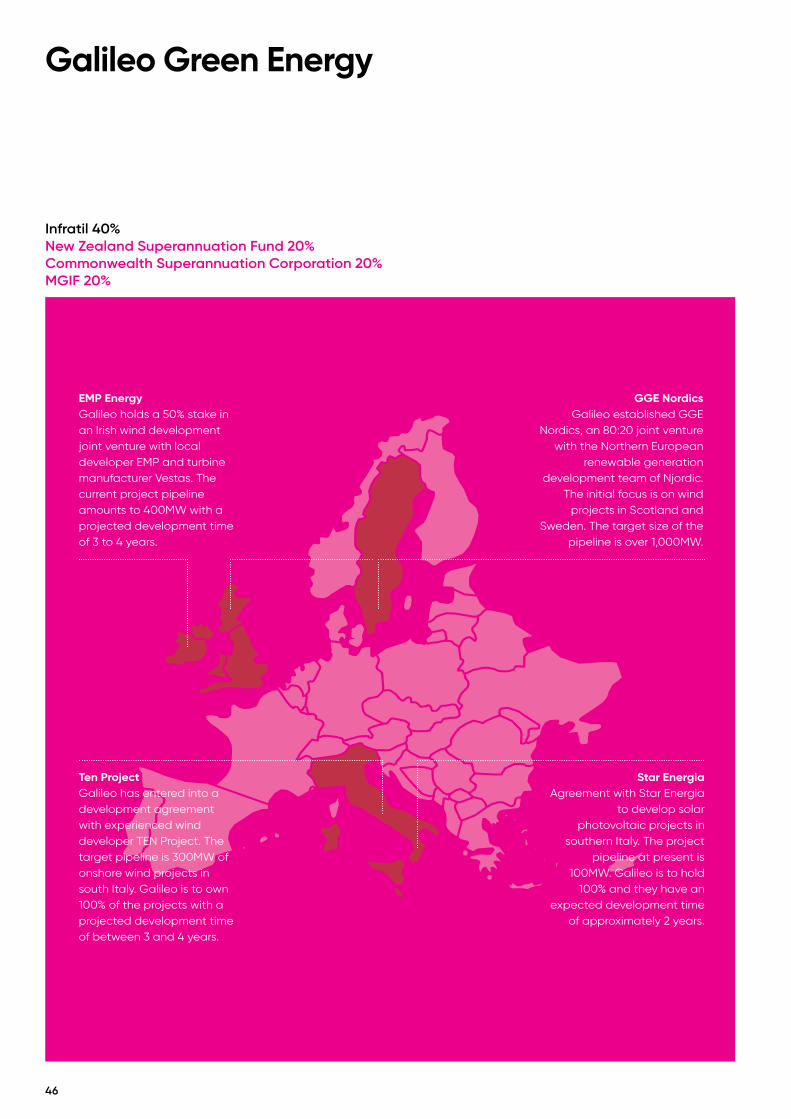
46
Galileo Green Energy
Infratil 40% New Zealand Superannuation Fund 20% Commonwealth Superannuation Corporation 20% MGIF 20%
GGE NordicsGalileo established GGE
Nordics, an 80:20 joint venture with the Northern European
renewable generation development team of Njordic.
The initial focus is on wind projects in Scotland and
Sweden. The target size of the pipeline is over 1,000MW.
Star Energia Agreement with Star Energia
to develop solar photovoltaic projects in
southern Italy. The project pipeline at present is
100MW. Galileo is to hold 100% and they have an
expected development time of approximately 2 years.
Ten Project Galileo has entered into a development agreement with experienced wind developer TEN Project. The target pipeline is 300MW of onshore wind projects in south Italy. Galileo is to own 100% of the projects with a projected development time of between 3 and 4 years.
EMP Energy Galileo holds a 50% stake in an Irish wind development joint venture with local developer EMP and turbine manufacturer Vestas. The current project pipeline amounts to 400MW with a projected development time of 3 to 4 years.

47
Galileo was established in February 2020 to take advantage of investment opportunities created by the European push to increase renewable electricity generation.
It brings together the expertise of Infratil’s manager and the European management team created by Ingmar Wilhelm, and flexible capital provided by Infratil and its partners.
The partners’ initial capital commitment is EUR220 million. Infratil’s share amounts to NZ$150 million.
During the last year $11.8 million was advanced bringing Infratil’s total investment to $14.3 million.
As with Longroad Energy, the objective with Galileo is participation in the development, construction and operation of renewable generation assets, with electricity price risk managed through sound off-take contracts.
The scale of the opportunity is staggering. Over the course of the decade to 2030, across Europe the goal is to increase renewable generation from 38% to over 60% in the total power mix. This will require the addition of more than 500,000MW of new capacity generating over 1,000,000GWh of electricity per year.
By way of comparison, over 21 years, Trustpower/Tilt invested NZ$2,150 million building 1,106MW of capacity to generate 3,768GWh of electricity per annum. The required European investment over the next decade amounts to over 300 times the scale of Tilt’s over two decades.
Over its first year, notwithstanding the challenges of covid-related restrictions, Galileo has entered into agreements with local developers to progress four projects summarised on the facing map.
Galileo’s team of 16 are also working on similar opportunities in France, Germany, Poland, and Spain, with 2025 objectives of:
• A pipeline of 10,000MW of projects.
• Development of 500MW of investable renewable power projects per year.
• EUR500 million of total investment potential per year, including sell-down opportunities.
• Engagement in at least 10 countries and a Galileo team of 50 people.
The scale of the European market, its diversity, and the plethora of national champions and national decarbonisation plans naturally raises concerns about an entity such a Galileo’s capacity to play a significant role and to develop attractive investable opportunities.
The key element is the commitment of a very experienced and well-connected European management team. This is led by Ingmar Wilhelm and includes individuals from Italy, Germany, Spain, Ireland, and the UK. They have decades of sector experience with major energy utilities, international development platforms, and financial investors.
Existing contacts and new ones with local developers ensures the Galileo team is aware of a diverse range of potential projects and has the expertise to concentrate on those with the greatest potential.
Alongside their connections with local developers, and consequent access to sites with good wind/sun resource and connectivity to the grid, the Galileo team also have the credibility and expertise to ensure optimal power sales terms are secured. Counterparties are expected to include traders, wholesalers/aggregators, and energy users seeking electricity from renewable sources.
In a dynamic market environment, Galileo’s flexibility will be an advantage in arranging power sales terms which match the output and risk features of both individual and portfolio generation projects.

48
Wellington Airport
Infratil 66% Wellington City Council 34%
Wellington Airport measures and reports on its Scope 1 and 2 operational emissions, which in FY2021 amounted to 984 tonnes of CO2e. Scope 1 comes from the Airport’s vehicles, heating, cooling, and emergency electricity generation. Scope 2 relates to emissions from electricity generated elsewhere and used by the Airport. In all cases the emissions are captured by the NZ ETS and require the surrender of NZUs, for which the Airport pays, albeit indirectly.
The Airport’s 2030 goal is emissions which are at least 30% lower than the level of 2017. Initiatives include electric vehicles, LED lighting, building efficiencies, ground-source heating, and reduced emissions during construction work.
The Airport is also committed to helping its users reduce emissions. Electric vehicle charging has been installed in the car park, work is underway to facilitate electric public transport links with the CBD, and a raft of airfield activities are being electrified.
Pictured is the Airport’s sustainability manager Nicola Cordner explaining to Deputy Mayor and Green Councillor Sarah Free and Airport Chair Tim Brown the operation of an electric pushback tug and aircraft ground power, which are part of a wider electrification plan.
Low/no emission aircraft fuels are available but are prohibitively expensive. Until investment and research lowers their cost, emission reductions will come from improved aircraft performance.
The newest variant of the Airbus short-haul fleet, the A321 which is taking off in the background of the picture, produces 20% less emissions per passenger than its predecessor the A320, according to manufacturer specifications.
The Airport is also actively reducing its net footprint through support of local tree planting, the provision of infrastructure for bikes, and its planning for fuel flexibility.

49
For Wellington Airport it was a remarkable and difficult year, but the future is looking positive. Air New Zealand, Qantas, JetStar and Soundsair promptly resumed services as soon as restrictions were lifted.
It is hoped that Fijian, Singapore Airlines and Virgin will also return in due course.
In April 2020 air travel virtually ceased; a dramatic turn-around from two months earlier when the Airport’s focus had been on a $1 billion investment programme.
The Airport’s priority is the provision of safe and efficient facilities which requires a 20 year view of potential demand and preparing accordingly. Prior to March 2020 extensive consultation between Airport and airlines had been underway to ensure that the Airport’s capital works programme aligned capacity with demand, including resilience measures.
In April 2020, covid-related disruptions saw all but resilience projects put on hold. They continued and absorbed the bulk of the $35 million invested over the year; earthquake strengthening (buildings and carpark), safety (runway resurfacing), and climate protection (seawall).
The Airport-airline capital works discussion was part of the five-yearly price consultation. Normally charges are fixed for five years which means the Airport carries the risk of unexpected changes to traffic, costs, and capital spending. For the current five year period (to 31 March 2024) the level of uncertainty saw Airport and airlines settle on charges with elements of “wash up” at the end of the period.
Constructive consultation over infrastructure and pricing reflects the good working relationship between Airport and airlines. All parties want an efficient Airport and fair charges.
Another pre-covid arrangement which became a challenge during April’s travel restrictions was the Airport’s use of debt. In FY2020 interest was less than a quarter of EBITDAF, but April’s earnings were less than the interest bill which required remedial action.
Airport costs were reduced which unfortunately meant 32 people were made redundant. All management and directors took a pay cut of at least 20%. Four day working weeks were instituted. Non-critical capital spending was curtailed.
Year Ended 31 March 2021 2020
Passengers domestic 2,968,960 5,225,999
Passengers international 162 919,741
Scope 1 & 2 emissions CO2e tonnes 984 1,344
Aeronautical income $34.0m $80.8m
Passenger services income $18.2m $45.2m
Property/other income $12.7m $13.5m
Operating costs ($28.9m) ($36.3m)
EBITDAF 1 $36.0m $103.2m
Net profit/(loss) after tax ($35.7m) $28.9m
Capital expenditure $35.0m $80.6m
Net debt $595.9m $516.9m
Infratil cash income $38.1m $44.3m
Infratil holding value 2 $511.2m $487.6m
1 EBITDAF is an unaudited non-GAAP measure and is defined on page 7.
2 Infratil's share of net assets excluding deferred tax at period end.
Shareholders committed $75.8 million of equity the Airport could call on.
Cost reductions and shareholder backing saw Wellington Airport maintain the support of its lenders and allowed continuation of resilience investment.
While the support of shareholders was crucial in ensuring that Wellington Airport got through the worst of the travel restrictions Wellington City Council’s subsequent withdrawal of support for necessary strengthening of sea protection infrastructure was disappointing. The seawall protects Council sewerage pipes, a public road, and the airfield (in that order). Waves of up to 13 metres occur at this location and a rupture of sea protection would have catastrophic consequences, not least being the escape of 3 cubic metres per second of raw sewage into Lyall Bay.
Looking forward, aviation is expected to fully recover. This isn’t so much about whether airlines survive. It reflects the social needs of New Zealanders and the economic imperatives of connectivity.
The last Census found that 27.4% of New Zealand residents weren’t born in New Zealand. Almost 700,000 New Zealanders live in Australia. For the country furthest from global markets, air travel is a crucial part of commerce, not to mention the value of tourism and foreign students.
This begs the question of aviation’s emissions. Globally they make up 2% of total and 10% of transport emissions. If aviation is to continue to provide its current level of connectivity, aviation gas is going to have to be replaced with bio or electro fuels (synthetic fuels manufactured using renewable electricity).
Today, bio fuel costs 140% more and electro fuel 300% more than av-gas. At current fuel prices, an Auckland to Wellington airline ticket includes approximately $17 for fuel and $3 for ETS emission charges. Bio fuel would cost an extra $24, but research and investment will narrow the price gap.
Calls to restrict air travel to reduce emissions reflects a misunderstanding of New Zealand’s Emission Trading Scheme. Under the ETS all emissions require the surrender of NZU. Just as the number of chairs in the game musical chairs sets the number of people seated, the number of NZU issued sets maximum emissions.
As New Zealand transitions to net zero emissions the availability of NZU will be reduced. Unless ways are found to inexpensively cut emissions, it is likely that the NZU price and hence cost of emissions will rise. That would raise the cost of using av-gas and spur development of bio and electro fuels. In the meantime, reducing air travel does not lower total emissions, it just means less from aviation which means more can come from other sources.
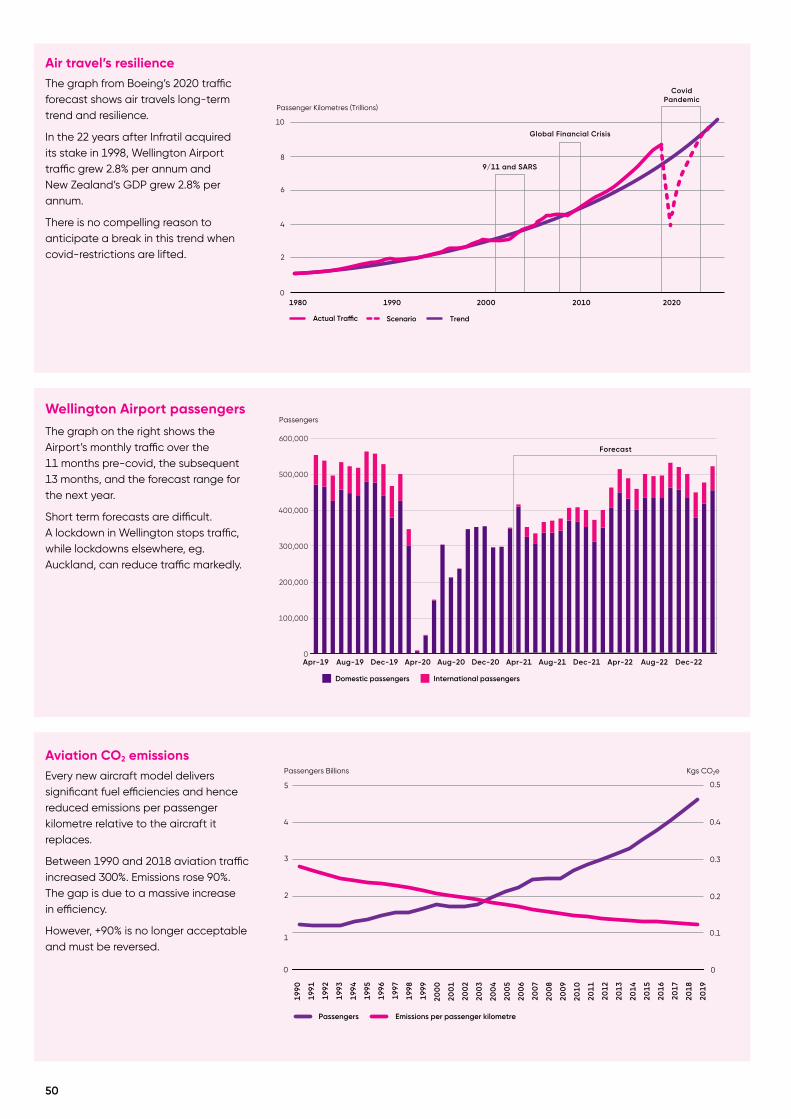
50
Air travel’s resilienceThe graph from Boeing’s 2020 traffic forecast shows air travels long-term trend and resilience.
In the 22 years after Infratil acquired its stake in 1998, Wellington Airport traffic grew 2.8% per annum and New Zealand’s GDP grew 2.8% per annum.
There is no compelling reason to anticipate a break in this trend when covid-restrictions are lifted.
Wellington Airport passengers
The graph on the right shows the Airport’s monthly traffic over the 11 months pre-covid, the subsequent 13 months, and the forecast range for the next year.
Short term forecasts are difficult. A lockdown in Wellington stops traffic, while lockdowns elsewhere, eg. Auckland, can reduce traffic markedly.
Aviation CO2 emissionsEvery new aircraft model delivers significant fuel efficiencies and hence reduced emissions per passenger kilometre relative to the aircraft it replaces.
Between 1990 and 2018 aviation traffic increased 300%. Emissions rose 90%. The gap is due to a massive increase in efficiency.
However, +90% is no longer acceptable and must be reversed.
Passenger Kilometres (Trillions)
10
8
6
4
2
0
Actual Tra�c Scenario Trend
1980 1990 2000
9/11 and SARS
Global Financial Crisis
CovidPandemic
2010 2020
1
1990
1991
1992
1993
1994
1995
1996
1997
1998
1999
200
0
200
1
200
2
200
3
200
4
200
5
200
6
200
7
2019
200
8
200
9
2010
2011
2012
2013
2014
2015
2016
2017
2018
5 0.5
4 0.4
3 0.3
2 0.2
0.1
00
Passengers
Passengers Billions Kgs CO2e
Emissions per passenger kilometre
100,000
200,000
300,000
400,000
500,000
600,000
0Apr-19 Aug-19 Dec-19 Apr-20 Aug-20 Dec-20 Apr-21 Aug-21 Dec-21 Apr-22 Aug-22 Dec-22
Domestic passengers
Passengers
International passengers
Forecast

EBITDAF 1 & Passengers In the decade to FY2020, passengers rose 2% a year and earnings 4%. It is expected that the trend will resume once covid is beaten.
Aeronautical & services incomeAirport revenue from passengers is higher from those on international services. Wellington’s relatively modest per passenger revenue drop in 2021 is because normally 80% of its traffic is domestic.
Consequently going from 20% international to 0% only reduced per passenger income by 14%.
The cost of travelPre-covid, the cost of domestic air travel was largely stable in real terms (fares rose at the same rate as the CPI, with annual fluctuations of +/- 10%).
The cost of international air travel fell nominally and in real terms. Given increases in average income, an airline ticket which would have cost 25 hours of wages in 2011, would have taken 15 hours in 2020.
0
$20
$60
$40
$80
$100
0
1
2
3
4
5
6
7
PassengersMillions
EBITDAF$Millions
202120182012 2013 2016 201720152014 20202019
Domestic passengers International passengers
EBITDAF
EBITDAF
$0
$5
$10
$15
$20
$ Income Per Passenger
2021 2018 2012 2013 2016 2017 2015 2014 2020 2019
Aeronautical income Services income
Statistics New Zealand
International air travel cost index Domestic air travel cost index CPI
Index
20212011 2012 2013 2014 2017 2018 2019 202020162015 0
20
40
60
80
100
120
140
160
1 EBITDAF is an unaudited non-GAAP measure and is defined on page 7.
100,000
200,000
300,000
400,000
500,000
600,000
0Apr-19 Aug-19 Dec-19 Apr-20 Aug-20 Dec-20 Apr-21 Aug-21 Dec-21 Apr-22 Aug-22 Dec-22
Domestic passengers
Passengers
International passengers
Forecast
51
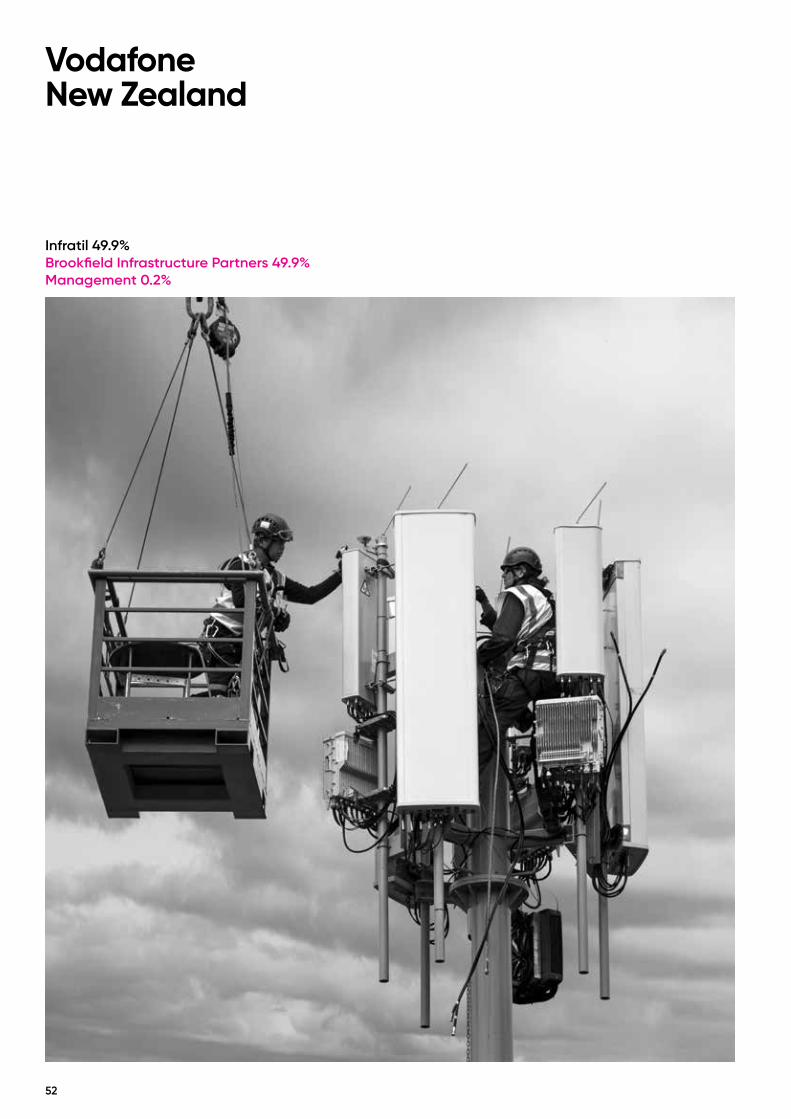
52
Vodafone New Zealand
Infratil 49.9% Brookfield Infrastructure Partners 49.9% Management 0.2%

53
Vodafone New Zealand’s year comprised two distinct threads; keeping the country connected while accommodating explosive demand growth and covid-related disruptions; and progressing strategic initiatives to grow the value of the company.
Operationally, FY2021 saw a massive increase in data transmission on fixed-price plans, a significant drop in roaming income due to fewer offshore visitors, and people spending more time at home using their mobile devices less for accessing data and more for voice calls and apps. It is estimated that the combined impact of these disruptions reduced VNZ’s FY2021 EBITDAF by $64 million.
Despite this, VNZ delivered EBITDAF of $447.8 million, at the upper end of guidance.
$253.4 million was invested in service and network improvements.
On a different level, local ownership of VNZ ensures support for policies and values relevant to employees, customers, and location. This includes VNZ’s Whārikihia strategy which recognises, respects and takes on Māori cultural values in recognition of Treaty obligations, and the desirability of having a corporate culture and values which align with those of staff and customers.
Customer services and systemsVNZ aims to be a cost-efficient provider of excellent easy to use mobile and fixed-connectivity, with additional services available for customers with more sophisticated needs.
To help deliver on the first of these goals VNZ is removing a plethora of legacy products, simplifying customer management systems, and improving customers’ ability to self-serve online.
For business customers, working with partners such as AWS, VNZ offers additional products such as security, contact centre management, data and cloud services, and facilitation of “internet of things” requirements such as smart metering.
Progress with the strategic plan is apparent with the vast majority of customer interactions now digital, best ever scores in customer satisfaction surveys, and cost reductions.
The goal with services is to grow traffic over VNZ’s network and to do so profitably; which depends on customers being retained by their service experiences, having low cost-to-serve with customers with lower needs, and having the right suite of products for customers with more complex “value-add” requirements.
Upgrading the mobile networkThe Commerce Commission Telecommunications Monitoring Report released in March 2021 indicates that over the last five years wireless broadband connections increased 8.2 times and mobile data use 4.6 times. (fixed broadband connections increased only 5% over the same period, with data rising 4.1 times).
However, rising demand for data transmission presents a challenge for a mobile network that is a mixture of 3rd and 4th generation equipment. Which is where 5th generation (5G) capability comes into its own. It can carry much greater amounts of data, at greater speeds, and at lower cost. With the caveat that 5G requires a large upfront investment.
VNZ has a market lead in 5G coverage, however expanding availability to areas with sparse population is economically challenging. Practically this means VNZ installing 5G capability where it is viable and sharing towers and sometimes equipment with other telecommunications companies where unique ownership is not physically or commercially practicable. In some rural areas it also means partnering with Crown Infrastructure Partners to co-invest under the auspices of government’s Rural Broadband Initiative.
While infrastructure sharing ensures greater geographic coverage than would otherwise be viable, it is important to note that mobile differs in key ways to New Zealand’s single monopoly fibre network. The mobile market is more dynamic, technology constantly changes, and each generation of the mobile network is integrated with the previous generations on which it is built. In a decade fibre will still be fibre, while mobile is likely to moving towards 6th or 7th generation technology.
The 5th generation mobile network now being installed does more than just cope with rising demand, it provides the instantaneous connectivity required to realise the benefits that are coming from new technologies and the “Internet of
Things”. For instance, motor vehicle sensors are now collecting enormous amounts of data to improve driving performance and maintenance. In the near future, these sensors will be connected to central processors via extremely fast 5G mobile data transmission allowing the instantaneous response required as vehicles become autonomous; navigating roads without a human driver.
Broadband Last year’s huge increase in data was boosted by lockdowns and remote working, but reflected the trend resulting from better devices, greater availability of high-resolution content, online meetings, and consumers switching from other forms of dissemination/transmission.
As noted in the Commerce Commission report, New Zealand has good coverage of high-speed fibre and charges that are about 50% of Australia’s.
However, the huge increase in demand and extremely competitive prices makes profitability a challenge for all providers. VNZ’s approach is to deliver internet access to its customers through the medium that best meets their needs. If large amounts of data are required in a fixed location, then fibre is often best. In other situations; for example, rural areas without fibre or customers with less demanding data requirements; the mobile network offers a lower cost, is easier and quicker to install, and provides everything customers need.
Good progressGood progress is being made on all strategic initiatives. Customer services are being improved and costs reduced. Broadband profitability is being addressed by ensuring that customers get the medium of delivery that best suits their requirements.
5G installation is ongoing and 4G capacity is also being expanded to ensure the network can cope with rising data demand, and ways are being found to accomplish this efficiently via network sharing without compromising competition which has driven so much innovation and such low user costs.
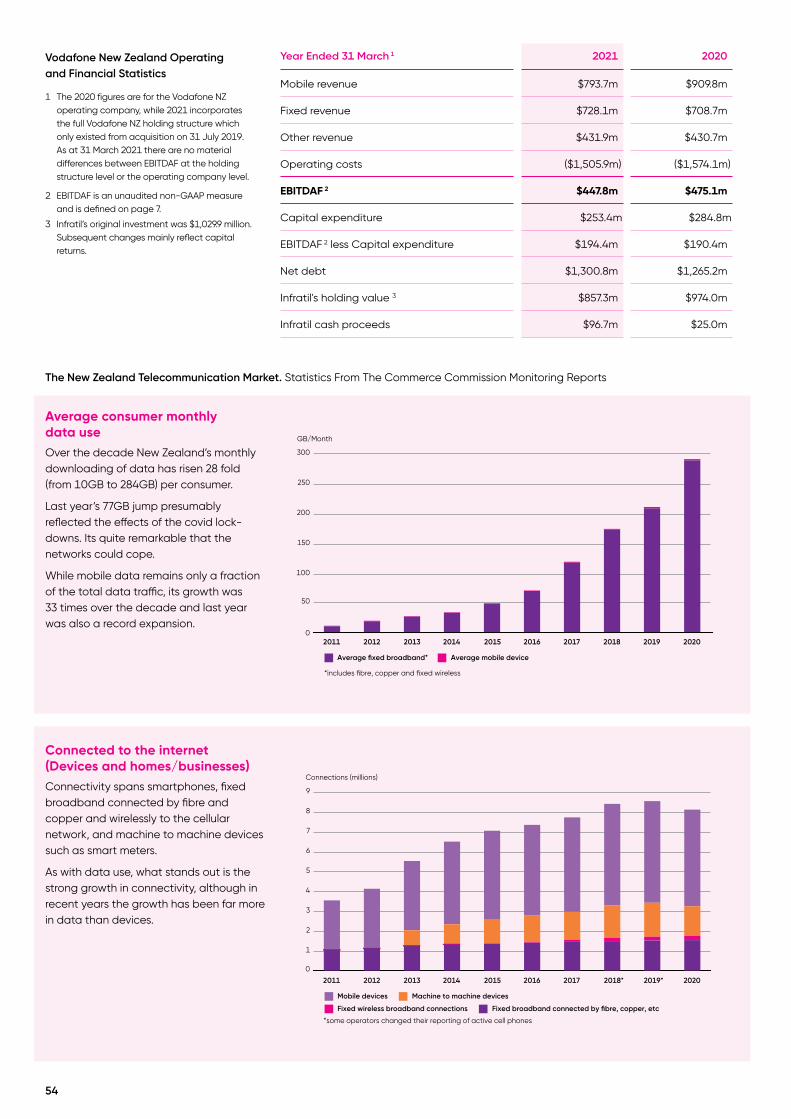
54
Year Ended 31 March 1 2021 2020
Mobile revenue $793.7m $909.8m
Fixed revenue $728.1m $708.7m
Other revenue $431.9m $430.7m
Operating costs ($1,505.9m) ($1,574.1m)
EBITDAF 2 $447.8m $475.1m
Capital expenditure $253.4m $284.8m
EBITDAF 2 less Capital expenditure $194.4m $190.4m
Net debt $1,300.8m $1,265.2m
Infratil's holding value 3 $857.3m $974.0m
Infratil cash proceeds $96.7m $25.0m
Average consumer monthly data useOver the decade New Zealand’s monthly downloading of data has risen 28 fold (from 10GB to 284GB) per consumer.
Last year’s 77GB jump presumably reflected the effects of the covid lock-downs. Its quite remarkable that the networks could cope.
While mobile data remains only a fraction of the total data traffic, its growth was 33 times over the decade and last year was also a record expansion.
Connected to the internet (Devices and homes/businesses)Connectivity spans smartphones, fixed broadband connected by fibre and copper and wirelessly to the cellular network, and machine to machine devices such as smart meters.
As with data use, what stands out is the strong growth in connectivity, although in recent years the growth has been far more in data than devices.
GB/Month
Average fixed broadband*
*includes fibre, copper and fixed wireless
Average mobile device
0
300
250
200
150
100
50
2020 2018 2011 2012 2013 2016 2017 2015 2014 2019
9
8
7
6
5
4
3
2
1
0
Connections (millions)
Mobile devices Machine to machine devices
Fixed wireless broadband connections Fixed broadband connected by fibre, copper, etc
2020 2018* 2011 2012 2013 2016 2017 2015 2014 2019*
*some operators changed their reporting of active cell phones
The New Zealand Telecommunication Market. Statistics From The Commerce Commission Monitoring Reports
Vodafone New Zealand Operating and Financial Statistics
1 The 2020 figures are for the Vodafone NZ operating company, while 2021 incorporates the full Vodafone NZ holding structure which only existed from acquisition on 31 July 2019. As at 31 March 2021 there are no material differences between EBITDAF at the holding structure level or the operating company level.
2 EBITDAF is an unaudited non-GAAP measure and is defined on page 7.
3 Infratil’s original investment was $1,029.9 million. Subsequent changes mainly reflect capital returns.

55
Industry investmentTo enable transmission of the huge increase in data demand, the industry has invested $15.7 billion over the last decade. It is now anticipated that the investment in fibre will decline (reflecting its national coverage) while investment in 5G mobile infrastructure will rise.
Industry revenueAs shown by the other graphs, users are getting a lot more telecommunications connectivity and capacity, and this is requiring very substantial annual investment. Yet the sector’s revenue has remained flat.
The Department of Statistics hasn't produced household cost estimates for 2020.
Vodafone NZ connectionsOver the decade VNZ’s number of mobile connections has remained reasonably flat (although of course the amount of data transmitted has grown in line with the market’s 28-33 fold increase). Over the last two years VNZ had 40% of mobile phones. This may not however be the whole story as there is a growing trend for third parties to lease network capacity and to retail this via their own branded phones. ComCom data shows that in 2020 this only amounted to 88,000 phones, but it is expected to increase.
VNZ’s share of the broadband market was slightly down at 23% in 2020, although it provides a much greater share of wireless broadband connections.
1,800
200
400
600
800
1,000
1,200
1,400
1,600
0
$Millions
Other MobileIT Fibre
2020 2018 2011 2012 2013 2016 2017 2015 2014 2019
6,000
$Millions Average monthly household telecommunication cost
1,000
2,000
3,000
4,000
5,000
0
$145
$140
$150
$130
$135
Fixed line annual revenue Mobile annual revenue Average monthly household telecommunication cost
2020 2018 2011 2012 2013 2016 2017 2015 2014 2019
3.5
3.0
Millions
0.5
1.0
1.5
2.0
2.5
2018 2011 2012 2013 2016 2017 2015 2014
00
Mobile connections Broadband connections
2020 2019
5656
CDC Data Centres
Infratil 48% Commonwealth Superannuation Corporation 24% Future Fund 24% Management 4%
CDC data centre prior to internal fit out

57
CDC continues to experience growing demand for its data centres and is responding by building capacity in each of Auckland, Sydney and Canberra.
Over the year, EBITDAF rose 25% to A$147.3 million and available capacity increased 27%. Capital investment was A$231.6 million.
Investment in expanding capacity is undertaken in two stages; the building and the fit out, with the former occurring over approximately 12-18 months of construction, while the latter is rolled out as capacity is taken up by clients.
CDC’s 164% EBITDAF increase over the last three years, reflects the three new data centres with 66MW of capacity commissioned over that period and the A$738.2 million of capex invested over FY2019 and FY2020.
In the next two years CDC will be undertaking a similar step up in capex and capacity. The four data centres currently under construction will progressively become income generating from early FY2023.
Although customers may contract to take up capacity as it becomes available, which reduces CDC’s risk, they only start paying once the capacity is actually available.
With the success of its expansion beyond Canberra (first to Sydney and then to Auckland), assessment of additional regions is underway, in all cases based on opportunities relevant to CDC’s particular offering:
• High security facilities that meet the needs of government, defence, hyperscale and critical infrastructure clients. Hyperscale refers to cloud companies which require very large data centre capacity for their own
and their customer needs. The main companies in this category are usually taken to be AWS, Microsoft, and Google.
• Data centres which are systemically resilient including with regards to connectivity and are efficient users of water and energy.
• Flexibility to meet the requirements of different users and the creation of large-scale ecosystems with access to cloud-based services.
• Clients get certainty of data location in facilities with 100% Australian and New Zealand ownership at a time of growing recognition of the value of data sovereignty and security.
These features of CDC’s data centres are why it is qualified as Certified Strategic under the Australian Government’s data hosting certification framework.
Financial & Operational Statistics
Year Ended 31 March 2021 2020
Data centre capacity 133MW 105MW
Average lease term 14.4 years 15.9 years
EBITDAF 1 A$147.3m A$117.5m
Infratil share of EBITDAF NZ$75.8m NZ$59.6m
Net profit after tax A$234.2m A$289.1m
Net contribution to Infratil NZ$134.3m NZ$161.0m
Capital expenditure A$231.6m A$446.6m
Net debt A$1,041.4m A$912.4m
Infratil holding book value NZ$873.0m NZ$693.4m
Infratil holding market value range 2 NZ$2,317-2,492m NZ$1,355-1,711m
1 EBITDAF is an unaudited non-GAAP measure and is defined on page 7.
2 Based on an independent valuation as at 31 March.
Over the year Infratil subscribed for an additional $8.3 million of capital and received cash income from CDC of $5.8 million.

5858
200
180
160
140
120
100
80
60
40
20
Data Centre Capacity (MW) EBITDAF (A$Millions)
0
$180
$160
$140
$120
$100
$80
$60
$40
$20
$0
Capacity EBITDAF 1
2017 2018 2019 2020 2022Forecast
2021
CDC Capacity & EBITDAF
The general trend of bringing data together under one roof and locating it physically close to its application was illustrated by the benefits BNZ noted in a press release which explained its intention to repatriate data and processing to Auckland.
BNZ reported that the attraction of using local data centres included speed of access (for instance when checking hundreds of credit card transactions per second, to identify fraud and being able to immediately notify merchants and customers) and data residency requirements which makes it desirable that New Zealand client information is held in New Zealand.
It is difficult to convey the magnitude of the growing demand for data storage and processing, but to illustrate:
• Most individuals will regularly use some of video calls, home schooling platforms, entertainment streaming, and the myriad of apps for banking, maps, and so on. In all cases using cloud-computing.
• Data and applications are held in data centres accessible via the internet rather than being stored on a device.
• For companies, the cloud provides access to to data storage and computing power at the click of a button which can be scaled up and down with great flexibility. It also gives access to communication, security, and processing functions.
• Global research company Gartner estimates that in 2021 US$305 billion will be spent on cloud services, almost 20% more than in 2020. This was evidenced in the March quarter revenues of the largest cloud companies. Amazon revenue of
US$109 billion, with cloud subsidiary AWS’s earnings +32%. Microsoft revenue of US$42 billion including cloud revenue up 21% at US$15 billion. Google revenue US$55 billion +34%.
• Another growth wave is expected as 5th generation mobile telecommunication networks are installed. This will enable the communication of far more data at far faster speed than is available now; facilitating artificial intelligence computing (AI) and the Internet of Things (IoT). Tools required for autonomous vehicles and automated and remote health monitoring and diagnosis.
These growth thematics, the evidence of demand for CDC’s facilities, and CDC’s proven ability to respond with its construction programme, underpinned the 47% lift in the independent valuation of the Company over the year to give a mid-point of A$4,726 million as at 31 March 2021.
• Accelerating demand is resulting in CDC bringing projects forward, increasing the scale of planned centres, and adding additional developments to the project pipeline.
• The diversity of customer relationships is increasing as new customers commit and contracts are renewed.
• Risk is reduced by the length of contracts, pre-contracting capacity in data centres before construction completes, the track record of strong revenue growth, and good management of construction projects.
• There is also increasing confidence about sector demand growth, and evidence of sector valuations from other transactions and listed companies.
1 EBITDAF is an unaudited non-GAAP measure and is defined on page 7.

59
Centre Capacity Contracted 1 Commissioned
Hume 1 & 2 12MW 93% 2008 and 2011
Fyshwick 1 18MW >95% 2015
Hume 3 9MW 100% 2016
Fyshwick 2 21MW 80% 2018
Eastern Creek 1 (acquired) 7MW >85% 2018
Eastern Creek 2 13MW 100% 2019
Hume 4 25MW 70% 2019
Eastern Creek 3 28MW 75% 2020
Auckland 1 & 2 20MW 80% 2022
Eastern Creek 4 37MW 30% 2022
Hume 5 20MW - 2022
Future Hume 120MW - -
Future Fyshwick 50MW - Pre 2030
Future Eastern Creek 70MW - Pre 2030
1. Contracted capacity includes reserved and first right of refusal. Based on space.
Sydney
Eastern Creek
Hume
Fyshwick
Auckland 1
Auckland 2
Canberra
Auckland

60
Radiology/ Diagnostic Imaging
MRI Scanner, Qscan Clayfield Clinic, Brisbane

On 22 December 2020, Infratil acquired 56.25% of Australian based Qscan for A$289.6 million (NZ$309.6 million).
On 31 May 2021 Infratil is to purchase between 53.5% and 58.5% of New Zealand based Pacific Radiology for between $312 million and $344 million, depending on the number of shares retained by doctors and management along with other completion adjustments.
It is worth taking a moment to understand the background to the approximately $650 million investment before taking in the features of each business.
The core premise is that diagnostic imaging is an essential service benefitting from macroeconomic tailwinds and a growing and ageing population. The sector also benefits from considerable government funding. All of which provides support for above-market growth, and there is the potential for superior providers to grow through mergers and acquisitions.
Investing in healthPopulations are ageing and as they do their healthcare needs increase.
• Approximately 15% of New Zealanders
are over 65 years old, about 765,000 people. The number has risen 25% in a decade (over that period the population younger than 65 rose 14%).
• Approximately 16% of Australians are now over 65, about 4.2 million people. An increase of 32% in a decade (during which time the rest of the population increased 12%).
The increasing elderly population drives increasing healthcare expenditure.
• OECD data shows that Australian healthcare costs have been rising 4.2% per annum over the last decade and now amount to 9.4% of GDP.
• New Zealand’s figures are 3.6% per annum and 10.0% (US health costs amount to 17% of GDP).
The need to look after the health of a growing elderly population is focussing attention on how to deliver this cost efficiently. Vaccines, preventative screening, and smarter treatments are all examples of good cost/benefit health measures.
Bill Gates claims that his funding of vaccinations produces benefits 20 times
the cost. In New Zealand and Australia, free or subsidised screening is available for a wide range of conditions on the premise of a “stitch in time” means it will be cheaper to identify a potential problem than to treat an actual problem. And once someone has a problem, smarter forms of treatment can lower costs and speed up recovery.
Infratil’s investment criteria for healthcare providers• A substantial and growing need
• A real capability to efficiently improve patient outcomes
• Engaged and supportive medical specialists
• Stable complementary regulatory regime
• Scale and incumbency advantages
This package of features should result in acceptable risks for a business and an opportunity for investment-led growth in earnings. Recognising that healthcare has challenges with clinical risks, recruiting and retaining doctors, and integrating and managing constantly improving technology and systems.
People with a chronic disease The incidence of cancer
100%
80%
90%
70%
60%
50%
40%
30%
20%
10%
Males Females Age
Australian Bureau of Statistics
0-14 15-24 25-34 35-44 55-64 65-74 75+45-540
4,000
Per 100,000 people
3,000
3,500
2,500
2,000
1,500
1,000
500
Males Females
0-9 10-19 20-29 30-39 50-59 60-69 70-79 80-89 90+40-490
Australian Institute of Health & Welfare
Age
61
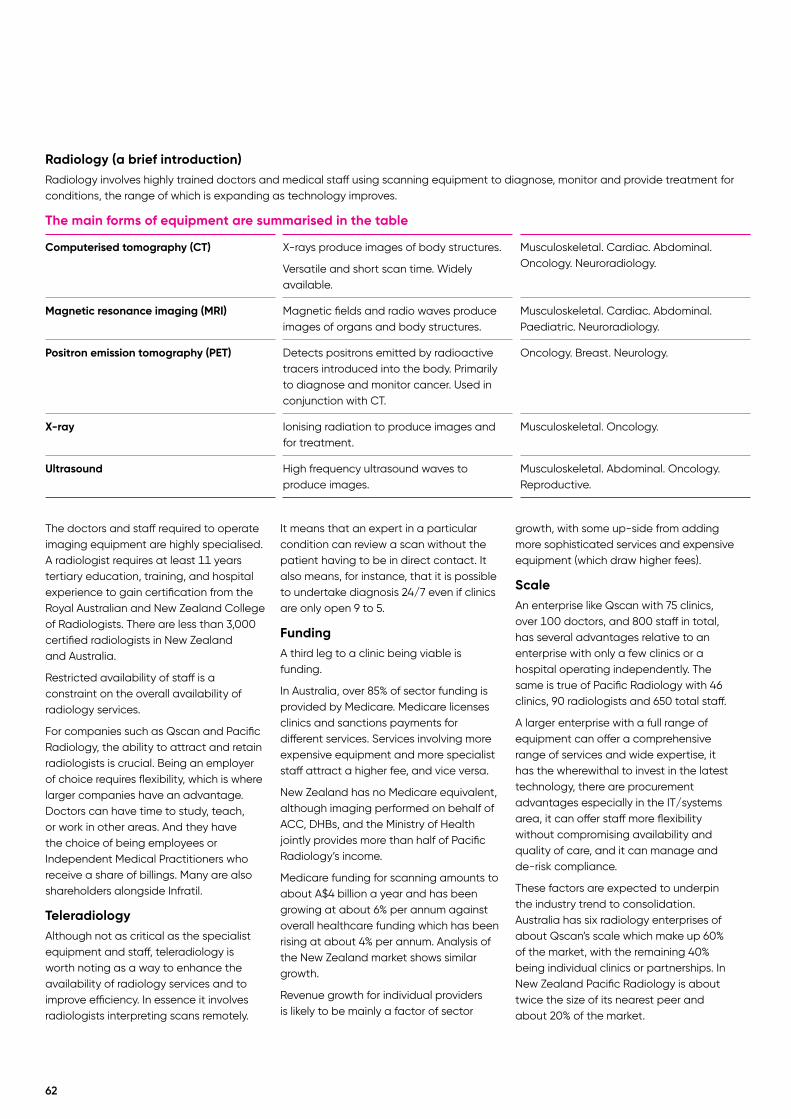
62
Radiology (a brief introduction)Radiology involves highly trained doctors and medical staff using scanning equipment to diagnose, monitor and provide treatment for conditions, the range of which is expanding as technology improves.
The main forms of equipment are summarised in the table
Computerised tomography (CT) X-rays produce images of body structures.
Versatile and short scan time. Widely available.
Musculoskeletal. Cardiac. Abdominal. Oncology. Neuroradiology.
Magnetic resonance imaging (MRI) Magnetic fields and radio waves produce images of organs and body structures.
Musculoskeletal. Cardiac. Abdominal. Paediatric. Neuroradiology.
Positron emission tomography (PET) Detects positrons emitted by radioactive tracers introduced into the body. Primarily to diagnose and monitor cancer. Used in conjunction with CT.
Oncology. Breast. Neurology.
X-ray Ionising radiation to produce images and for treatment.
Musculoskeletal. Oncology.
Ultrasound High frequency ultrasound waves to produce images.
Musculoskeletal. Abdominal. Oncology. Reproductive.
The doctors and staff required to operate imaging equipment are highly specialised. A radiologist requires at least 11 years tertiary education, training, and hospital experience to gain certification from the Royal Australian and New Zealand College of Radiologists. There are less than 3,000 certified radiologists in New Zealand and Australia.
Restricted availability of staff is a constraint on the overall availability of radiology services.
For companies such as Qscan and Pacific Radiology, the ability to attract and retain radiologists is crucial. Being an employer of choice requires flexibility, which is where larger companies have an advantage. Doctors can have time to study, teach, or work in other areas. And they have the choice of being employees or Independent Medical Practitioners who receive a share of billings. Many are also shareholders alongside Infratil.
TeleradiologyAlthough not as critical as the specialist equipment and staff, teleradiology is worth noting as a way to enhance the availability of radiology services and to improve efficiency. In essence it involves radiologists interpreting scans remotely.
It means that an expert in a particular condition can review a scan without the patient having to be in direct contact. It also means, for instance, that it is possible to undertake diagnosis 24/7 even if clinics are only open 9 to 5.
FundingA third leg to a clinic being viable is funding.
In Australia, over 85% of sector funding is provided by Medicare. Medicare licenses clinics and sanctions payments for different services. Services involving more expensive equipment and more specialist staff attract a higher fee, and vice versa.
New Zealand has no Medicare equivalent, although imaging performed on behalf of ACC, DHBs, and the Ministry of Health jointly provides more than half of Pacific Radiology’s income.
Medicare funding for scanning amounts to about A$4 billion a year and has been growing at about 6% per annum against overall healthcare funding which has been rising at about 4% per annum. Analysis of the New Zealand market shows similar growth.
Revenue growth for individual providers is likely to be mainly a factor of sector
growth, with some up-side from adding more sophisticated services and expensive equipment (which draw higher fees).
ScaleAn enterprise like Qscan with 75 clinics, over 100 doctors, and 800 staff in total, has several advantages relative to an enterprise with only a few clinics or a hospital operating independently. The same is true of Pacific Radiology with 46 clinics, 90 radiologists and 650 total staff.
A larger enterprise with a full range of equipment can offer a comprehensive range of services and wide expertise, it has the wherewithal to invest in the latest technology, there are procurement advantages especially in the IT/systems area, it can offer staff more flexibility without compromising availability and quality of care, and it can manage and de-risk compliance.
These factors are expected to underpin the industry trend to consolidation. Australia has six radiology enterprises of about Qscan’s scale which make up 60% of the market, with the remaining 40% being individual clinics or partnerships. In New Zealand Pacific Radiology is about twice the size of its nearest peer and about 20% of the market.

63
Qscan Infratil 56.2%. Staff 29.7%. MGIF 14.1%
On 22 December 2020, Infratil acquired 56.25% of Qscan for A$289.6 million (NZ$309.6 million). Qscan owns 75 radiology clinics, mainly in NSW and Queensland. The purchase price gave an enterprise value to Qscan of A$735 million.
The attraction of Qscan for Infratil is the growth potential, which is well illustrated by developments over the three years to 30 June 2020. During that period, Qscan invested A$54 million adding 11 clinics and upgrading equipment.
Pacific RadiologyInfratil 53.5-58.5%. Doctors and management 41.5-46.5%
On 31 May 2021 Infratil is to purchase between 53.5% and 58.5% of New Zealand based Pacific Radiology for between $312 million and $344 million depending on the number of shares retained by doctors and management.
The acquisition price gives an enterprise value for the company of $867 million.
Pacific Radiology is the largest diagnostic imaging service provider in New Zealand, operating 46 clinics in the South Island and lower North Island with 90 radiologists and 650 other medical and management staff.
Revenue/Activities
Revenue/Activities
Sector Revenue/Sources*
Revenue/Sources
Approximately 60% of Qscan’s revenue comes from more complex diagnoses and treatment involving CT (over 55 machines), MRI (over 20 machines) and PET/nuclear (over 10 machines).
Across its clinics Pacific Radiology provides a comprehensive range of radiology diagnostics, including positron emission tomography (PET). It owns 2 of the 5 PET machines in New Zealand.
The Australian radiology sector’s revenue is heavily underwritten by Medicare, with approximately 10% provided by patients.
* Medicare 2019; Radiology Funding Sources
The most obvious difference in the sources of revenue between the Australian industry and New Zealand is that the former is over 85% sourced from the government, while in New Zealand the figure is less than 60%.
MRI
MRI
PET/Nuclear
PET/Nuclear Insurance
Other
Other Patients
Ultrasound
Ultrasound
Medicare
ACC
Insurance
DHB
Patients
Ministry of Health
X-ray
X-ray
CT
CT

64
RetireAustralia
Infratil 50% New Zealand Superannuation Fund 50%
Glengara Retirement Village, Central Coast.

65
On all fronts, it was a remarkably successful year for RetireAustralia; for residents, staff and shareholders.
It is hard to imagine a period with more challenges. A contagious virus with especially adverse health consequences for the elderly. A housing market beset by lockdowns and uncertainty. An evolving regulatory backdrop following media exposés and a Royal Commission of Inquiry. And RetireAustralia with a new leadership team to navigate the challenges.
The most important success was in keeping residents safe from covid and socially engaged during enforced isolation. None of RetireAustralia’s over 5,000 residents contracted covid and surveys showed the highest ever levels of satisfaction with life in a RetireAustralia community. Not surprisingly, staff surveys mirrored these findings.
These achievements were reflected in Sue Nelson, manager of the Newling Gardens Village in Armidale, receiving industry recognition by winning the Australian Retirement Living Council Village Manager of the Year Award for NSW and the ACT. RetireAustralia also won the RLC’s Innovation Award for its use of the AlayaCare technology platform to deliver in-home care services to residents.
RetireAustralia is part way through a significant investment so it can offer a full suite of care capabilities for residents. The goal is to be able to help residents stay healthy, with the offer of facilities and services if their needs increase. Flexible home care is now available at 16 villages and in 2020 RetireAustralia opened its first specialised care-apartment facility at its Glengara Village on the NSW Central Coast.
There are many challenges in the move from largely providing accommodation, to being able to offer health services and facilities, especially to the level required by people with critical needs. It demands the right management, technology, facilities, care-staff and funding.
New Zealanders are familiar with retirement villages that offer both independent living and a whole range of options to meet resident health and care needs. This has evolved because health and social authorities provide funding which recognises that the model is both kinder and costs taxpayers less, especially if the alternative is a public hospital. The Australian Royal Commission into Aged Care Quality and Safety arrived at the same finding which is resulting in funding becoming more available for “Ageing in Place”.
An underpinning reason for Infratil’s investment in the retirement living sector is the expanding population of elderly people. There are now about 1,000,000 Australians over 80 years old. In 2011 there were 840,000. This is translating into robust demand for specialist accommodation. Official figures indicated that in 2016 approximately 220,000 Australians lived in retirement villages and the number was rising about 5% per annum.
However, it is apparent that RetireAustralia has not fully benefited from these demographics, experiencing a high level of vacancy in some villages and only a modest level of development expansion. Both shortcomings are being addressed.
Over the year, 343 occupation rights were purchased for RetireAustralia units and apartments, including 323 in existing communities. On average there were 294 resales in each of the previous five years.
Last year our absolute priority was to keep our residents safe. We achieved this because we have good systems, good communication, and all our staff played their part. I’m very proud of what we achieved and how everyone rose to the challenge.
Looking after people’s needs in a time like this involves both physical and emotional care. It also makes you aware of where we could do better and we are on track to deliver significantly more. The Royal Commission into Australian Aged Care Quality and Safety has highlighted an opportunity for us to take a more active role in providing services our residents need, something we will be actively pursuing. Technology is providing better tools, especially around early warning and when people are living by themselves.
The challenge is to do more; efficiently and effectively, and to make sure that potential residents know what is available, and to ensure they have access to live the life they choose as they age.
Dr Brett Robinson Chief Executive
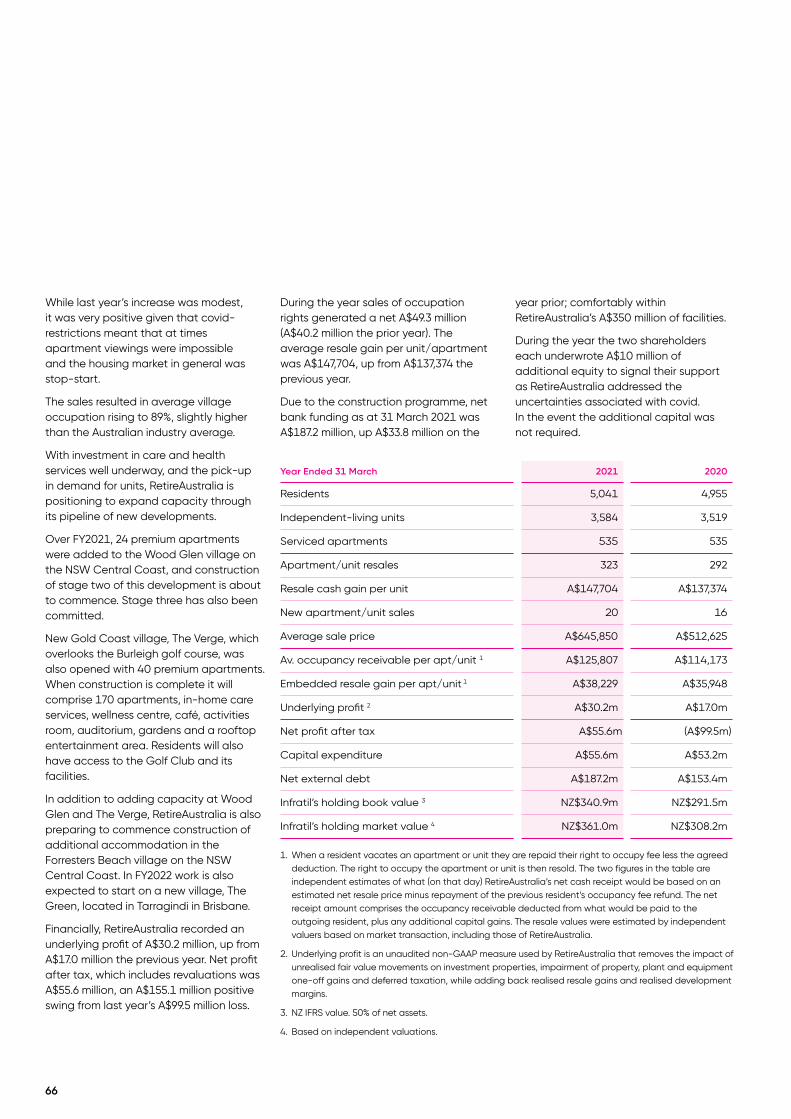
66
Year Ended 31 March 2021 2020
Residents 5,041 4,955
Independent-living units 3,584 3,519
Serviced apartments 535 535
Apartment/unit resales 323 292
Resale cash gain per unit A$147,704 A$137,374
New apartment/unit sales 20 16
Average sale price A$645,850 A$512,625
Av. occupancy receivable per apt/unit 1 A$125,807 A$114,173
Embedded resale gain per apt/unit 1 A$38,229 A$35,948
Underlying profit 2 A$30.2m A$17.0m
Net profit after tax A$55.6m (A$99.5m)
Capital expenditure A$55.6m A$53.2m
Net external debt A$187.2m A$153.4m
Infratil’s holding book value 3 NZ$340.9m NZ$291.5m
Infratil’s holding market value 4 NZ$361.0m NZ$308.2m
1. When a resident vacates an apartment or unit they are repaid their right to occupy fee less the agreed deduction. The right to occupy the apartment or unit is then resold. The two figures in the table are independent estimates of what (on that day) RetireAustralia’s net cash receipt would be based on an estimated net resale price minus repayment of the previous resident’s occupancy fee refund. The net receipt amount comprises the occupancy receivable deducted from what would be paid to the outgoing resident, plus any additional capital gains. The resale values were estimated by independent valuers based on market transaction, including those of RetireAustralia.
2. Underlying profit is an unaudited non-GAAP measure used by RetireAustralia that removes the impact of unrealised fair value movements on investment properties, impairment of property, plant and equipment one-off gains and deferred taxation, while adding back realised resale gains and realised development margins.
3. NZ IFRS value. 50% of net assets.
4. Based on independent valuations.
While last year’s increase was modest, it was very positive given that covid-restrictions meant that at times apartment viewings were impossible and the housing market in general was stop-start.
The sales resulted in average village occupation rising to 89%, slightly higher than the Australian industry average.
With investment in care and health services well underway, and the pick-up in demand for units, RetireAustralia is positioning to expand capacity through its pipeline of new developments.
Over FY2021, 24 premium apartments were added to the Wood Glen village on the NSW Central Coast, and construction of stage two of this development is about to commence. Stage three has also been committed.
New Gold Coast village, The Verge, which overlooks the Burleigh golf course, was also opened with 40 premium apartments. When construction is complete it will comprise 170 apartments, in-home care services, wellness centre, café, activities room, auditorium, gardens and a rooftop entertainment area. Residents will also have access to the Golf Club and its facilities.
In addition to adding capacity at Wood Glen and The Verge, RetireAustralia is also preparing to commence construction of additional accommodation in the Forresters Beach village on the NSW Central Coast. In FY2022 work is also expected to start on a new village, The Green, located in Tarragindi in Brisbane.
Financially, RetireAustralia recorded an underlying profit of A$30.2 million, up from A$17.0 million the previous year. Net profit after tax, which includes revaluations was A$55.6 million, an A$155.1 million positive swing from last year’s A$99.5 million loss.
During the year sales of occupation rights generated a net A$49.3 million (A$40.2 million the prior year). The average resale gain per unit/apartment was A$147,704, up from A$137,374 the previous year.
Due to the construction programme, net bank funding as at 31 March 2021 was A$187.2 million, up A$33.8 million on the
year prior; comfortably within RetireAustralia’s A$350 million of facilities.
During the year the two shareholders each underwrote A$10 million of additional equity to signal their support as RetireAustralia addressed the uncertainties associated with covid. In the event the additional capital was not required.
67
Other Investments
Australian Social Infrastructure Partners (ASIP)Infratil first invested in the ASIP fund in FY2015. At the time ASIP was actively pursuing a number of projects involving private provision of schools, hospitals and other social infrastructure.
While several projects ASIP supported were successful it became apparent that scale was going to be problematic so a sell down was instigated.
ASIP has now contracted to sell its last asset, and Infratil expects to receive a final distribution from the fund before the end of June 2021.
Infratil Infrastructure Property IIP was formed to develop and dispose of the land holdings of previous Infratil subsidiary NZ Bus.
During FY2021, the sale of the Kilbirnie bus depot in Wellington was closed for $35 million, leaving IIP with one remaining asset, the 1.7 hectare site in the Wynyard Quarter which is a growth area in the Auckland CBD.
IIP’s first stage of developing this large site was completed in October 2020 with the opening of the $70 million 154 room Travelodge hotel, carpark and retail precinct.
Covid-related disruptions at that time significantly impacted the initial occupancy of the hotel and carpark and demand for retail space, which had some flow-through to the 31 March 2021 valuation. However, by the end of the period, income from each activity was improving.
It is anticipated that revenues will continue to improve as covid-related restrictions are removed and businesses return to normalcy. Options for the Wynyard site include disposal or further stages of development and both are under consideration.
ClearvisionIn FY2016 Infratil committed to invest US$25 million through California based Clearvision to gain exposure to start-up ventures of relevance to Infratil’s core sectors. In addition to a positive return, the objective with these investments is direct exposure to technology which could disrupt traditional infrastructure sectors, providing Infratil with early warning of risks and opportunities, as well as strategic insights.
There may also be benefits if Infratil’s companies find opportunities relevant to their activities. An example is Clearvision’s portfolio company RapidDeploy which recently sold licences to their emergency response intelligence software to the New Zealand Police with Vodafone NZ as a channel partner utilising VNZ’s secure communication network.
US$22.6 million of the initial commitment had been advanced by 31 March 2021 (US$21.0 million a year prior).
Based on the positive experience, and indications of a good financial outcome, Infratil committed an additional US$25 million to a second Clearvision fund of which US$5.5 million has now been advanced.
The book value of both funds was US$51.6 million, a gain of US$23.5 million on the US$28.1 million investment.
Much of this appreciation came from one of Clearvision’s largest investments; ChargePoint.
ChargePoint has established the world’s largest network of electric vehicle charging stations and on 1 March 2021 it listed on the NYSE (traded as ChargePoint Holdings, Inc. ticker CHPT) with a market capitalisation of over US$7 billion.

68

69
Financial StatementsFor the year ended 31 March 2021
Consolidated Statement of Comprehensive Income 70
Consolidated Statement of Financial Position 71
Consolidated Statement of Cash Flows 72
Consolidated Statement of Changes in Equity 73
Notes to the Financial Statements 75
Corporate Governance 129

70
Consolidated Statement of Comprehensive Income
The accompanying notes form part of these consolidated financial statements.
For the year ended 31 March 2021
Notes2021
$Millions2020
$Millions
Operating revenue 11 1,059.0 1,102.1
Dividends - 0.6
Total revenue 1,059.0 1,102.7
Share of earnings of associate companies 6 182.6 86.8
Total income 1,241.6 1,189.5
Depreciation 14 70.1 60.1
Amortisation of intangibles 12.7 11.1
Employee benefits 120.2 88.0
Other operating expenses 12 967.3 885.1
Total operating expenditure 1,170.3 1,044.3
Operating surplus before financing, derivatives, realisations and impairments 71.3 145.3
Net gain/(loss) on foreign exchange and derivatives (56.4) 15.2
Net realisations, revaluations and impairments 31.8 (0.8)
Interest income 1.6 3.1
Interest expense 140.1 148.1
Net financing expense 138.5 145.0
Net surplus/(loss) before taxation (91.8) 14.7
Taxation expense/(credit) 13 (4.2) 9.5
Net surplus/(loss) for the year from continuing operations (87.6) 5.2
Net gain/(loss) from discontinued operations after tax 10 71.6 479.0
Net surplus/(loss) for the year (16.0) 484.2
Net surplus/(loss) attributable to owners of the Company (49.2) 241.2
Net surplus/(loss) attributable to non-controlling interests 33.2 243.0
Other comprehensive income, after tax
Items that will not be reclassified to profit and loss:
Net change in fair value of property, plant & equipment recognised in equity 260.9 63.3
Share of other comprehensive income of associate companies 8.0 (21.3)
Net change in equity investments at fair value through other comprehensive income 46.1 (0.5)
Ineffective portion of hedges taken to profit and loss - -
Fair value movements in relation to the executive share scheme - 5.1
Income tax effect of the above items (90.4) (22.8)
Items that may subsequently be reclassified to profit and loss:
Differences arising on translation of foreign operations 90.0 (17.8)
Realisations on disposal of subsidiary, reclassified to profit and loss - (22.5)
Effective portion of changes in fair value of cash flow hedges 218.5 (75.0)
Income tax effect of the above items (28.1) 20.8
Total other comprehensive income/(loss) after tax 505.0 (70.7)
Total comprehensive income/(loss) for the year 489.0 413.5
Total comprehensive income for the year attributable to owners of the Company 335.4 207.9
Total comprehensive income for the year attributable to non-controlling interests 153.6 205.6
Earnings per share
Basic and diluted (cents per share) from continuing operations 4 (17.0) (37.1)
Basic and diluted (cents per share) 4 (6.9) 37.6

Consolidated Statement of Financial Position
As at 31 March 2021
Notes2021
$Millions2020
$Millions
Cash and cash equivalents 22.1 133.8 730.3
Trade and other accounts receivable and prepayments 22.1 315.4 174.8
Derivative financial instruments 22.4 76.2 18.9
Inventories 1.9 -
Income tax receivable 17.6 9.3
Assets held for sale 10 2,253.4 -
Current assets 2,798.3 933.3
Trade and other accounts receivable and prepayments 22.1 13.5 18.7
Property, plant and equipment 14 3,238.7 3,958.2
Investment properties 15 260.1 266.7
Right of use assets 16.1 115.5 161.2
Derivative financial instruments 22.4 92.0 65.5
Intangible assets 40.6 35.1
Goodwill 17 770.7 113.1
Investments in associates 6 2,126.9 1,961.9
Other investments 7 80.9 71.4
Non-current assets 6,738.9 6,651.8
Total assets 9,537.2 7,585.1
Accounts payable, accruals and other liabilities 305.8 227.3
Interest bearing loans and borrowings 18 94.1 134.7
Lease liabilities 16.2 20.3 21.8
Derivative financial instruments 22.4 89.2 8.0
Income tax payable 4.1 4.6
Infrastructure bonds 19 93.8 -
Trustpower bonds 20 83.0 -
Wellington International Airport bonds 21 75.0 25.0
Liabilities directly associated with the assets held for sale 10 906.7 -
Total current liabilities 1,672.0 421.4
Interest bearing loans and borrowings 18 916.2 835.0
Other liabilities 195.4 86.5
Lease liabilities 16.2 182.3 225.1
Deferred tax liability 13.3 269.4 314.6
Derivative financial instruments 22.4 66.9 121.3
Infrastructure bonds 19 1,053.2 1,061.3
Perpetual Infratil Infrastructure bonds 19 231.9 231.9
Trustpower bonds 20 350.0 432.2
Wellington International Airport bonds and senior notes 21 510.7 515.9
Non-current liabilities 3,776.0 3,823.8
Attributable to owners of the Company 2,644.0 2,132.2
Non-controlling interest in subsidiaries 1,445.2 1,207.7
Total equity 4,089.2 3,339.9
Total equity and liabilities 9,537.2 7,585.1
Net tangible assets per share ($ per share) 2.54 3.01
Approved on behalf of the Board on 18 May 2021
Alison Gerry Mark Tume Director Director
The accompanying notes form part of these consolidated financial statements.
71

72
Consolidated Statement of Cash Flows
For the year ended 31 March 2021
Notes2021
$Millions2020
$Millions
Cash flows from operating activitiesCash was provided from:Receipts from customers 1,175.0 1,495.0 Distributions received from associates 73.6 75.2 Other dividends - 0.6 Interest received 6.1 10.8
1,254.7 1,581.6 Cash was disbursed to:Payments to suppliers and employees (953.1) (1,253.3)Interest paid (159.9) (177.5)Taxation paid (50.3) (50.8)
(1,163.3) (1,481.6)Net cash inflow from operating activities 24 91.4 100.0 Cash flows from investing activitiesCash was provided from:Proceeds from sale of associates - 169.7 Capital returned from associates 68.2 - Proceeds from sale of subsidiaries (net of cash sold) - 593.3 Proceeds from sale of property, plant and equipment - 19.4 Proceeds from sale of investment property 34.8 - Proceeds from sale of investments 0.7 19.7 Return of security deposits 127.6 14.4
231.3 816.5 Cash was disbursed to:Purchase of investments (65.0) (1,132.5)Lodgement of security deposits (219.4) (5.5)Purchase of intangible assets (9.4) (12.9)Interest capitalised on construction of fixed assets - (4.4)Purchase of shares in subsidiaries, net of cash acquired (284.0) (5.2)Purchase of investment properties (16.0) (22.9)Purchase of property, plant and equipment (459.8) (463.3)
(1,053.6) (1,646.7)Net cash inflow / (outflow) from investing activities (822.3) (830.2)Cash flows from financing activitiesCash was provided from:Proceeds from issue of shares 294.1 396.8 Bank borrowings 579.3 1,436.2 Issue of bonds 184.6 544.5
1,058.0 2,377.5 Cash was disbursed to:Repayment of bank debt (295.0) (824.4)Repayment of lease liabilities (10.9) (12.1)Loan establishment costs (6.2) (10.1)Repayment of bonds (25.0) (288.2)Infrastructure bond issue expenses (2.6) (6.0)Share buyback - (3.7)Share buyback of non-wholly owned subsidiary (96.2) - Dividends paid to non-controlling shareholders in subsidiary companies (65.3) (92.3)Dividends paid to owners of the Company 3 (117.7) (113.7)
(618.9) (1,350.5)Net cash inflow / (outflow) from financing activities 439.1 1,027.0 Net increase / (decrease) in cash and cash equivalents (291.8) 296.8 Foreign exchange gains / (losses) on cash and cash equivalents 36.9 (10.4)Cash and cash equivalents at beginning of the year 730.3 414.3 Adjustment for cash classified as assets held for sale 10 (341.6) 29.6 Cash and cash equivalents at end of the year 133.8 730.3
The accompanying notes form part of these consolidated financial statements.
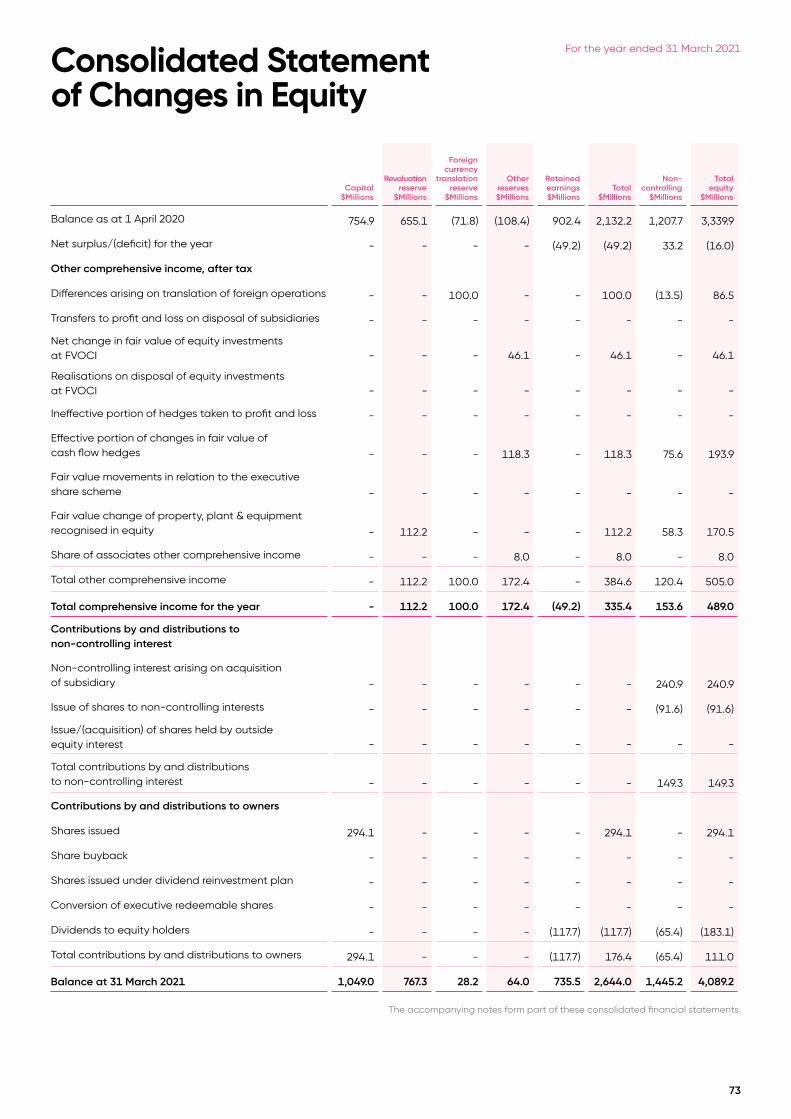
73
Consolidated Statement of Changes in Equity
For the year ended 31 March 2021
Capital$Millions
Revaluation reserve
$Millions
Foreign currency
translation reserve
$Millions
Other reserves$Millions
Retained earnings$Millions
Total$Millions
Non-controlling
$Millions
Total equity
$Millions
Balance as at 1 April 2020 754.9 655.1 (71.8) (108.4) 902.4 2,132.2 1,207.7 3,339.9
Net surplus/(deficit) for the year - - - - (49.2) (49.2) 33.2 (16.0)
Other comprehensive income, after tax
Differences arising on translation of foreign operations - - 100.0 - - 100.0 (13.5) 86.5
Transfers to profit and loss on disposal of subsidiaries - - - - - - - -
Net change in fair value of equity investments at FVOCI - - - 46.1 - 46.1 - 46.1
Realisations on disposal of equity investments at FVOCI - - - - - - - -
Ineffective portion of hedges taken to profit and loss - - - - - - - -
Effective portion of changes in fair value of cash flow hedges - - - 118.3 - 118.3 75.6 193.9
Fair value movements in relation to the executive share scheme - - - - - - - -
Fair value change of property, plant & equipment recognised in equity - 112.2 - - - 112.2 58.3 170.5
Share of associates other comprehensive income - - - 8.0 - 8.0 - 8.0
Total other comprehensive income - 112.2 100.0 172.4 - 384.6 120.4 505.0
Total comprehensive income for the year - 112.2 100.0 172.4 (49.2) 335.4 153.6 489.0
Contributions by and distributions to non-controlling interest
Non-controlling interest arising on acquisition of subsidiary - - - - - - 240.9 240.9
Issue of shares to non-controlling interests - - - - - - (91.6) (91.6)
Issue/(acquisition) of shares held by outside equity interest - - - - - - - -
Total contributions by and distributions to non-controlling interest - - - - - - 149.3 149.3
Contributions by and distributions to owners
Shares issued 294.1 - - - - 294.1 - 294.1
Share buyback - - - - - - - -
Shares issued under dividend reinvestment plan - - - - - - - -
Conversion of executive redeemable shares - - - - - - - -
Dividends to equity holders - - - - (117.7) (117.7) (65.4) (183.1)
Total contributions by and distributions to owners 294.1 - - - (117.7) 176.4 (65.4) 111.0
Balance at 31 March 2021 1,049.0 767.3 28.2 64.0 735.5 2,644.0 1,445.2 4,089.2
The accompanying notes form part of these consolidated financial statements.

74
Consolidated Statement of Changes in Equity
For the year ended 31 March 2020
Capital$Millions
Revaluation reserve
$Millions
Foreign currency
translation reserve
$Millions
Other reserves$Millions
Retained earnings$Millions
Total$Millions
Non-controlling
$Millions
Total equity
$Millions
Balance as at 1 April 2019 361.8 685.0 (65.4) (50.4) 715.0 1,646.0 1,098.5 2,744.5
Net surplus/(deficit) for the year - - - - 241.2 241.2 243.0 484.2
Other comprehensive income, after tax
Differences arising on translation of foreign operations - - (22.7) - - (22.7) 5.2 (17.5)
Transfers to profit and loss on disposal of subsidiaries - (21.5) 16.3 0.4 - (4.8) (17.7) (22.5)
Net change in fair value of equity investments at FVOCI - - - (1.0) - (1.0) - (1.0)
Realisations on disposal of equity investments at FVOCI - - - (2.5) 2.5 - - -
Ineffective portion of hedges taken to profit and loss - - - - - - - -
Effective portion of changes in fair value of cash flow hedges - - - (32.7) - (32.7) (21.3) (54.0)
Fair value movements in relation to the executive share scheme - - - (0.9) - (0.9) - (0.9)
Fair value change of property, plant & equipment recognised in equity - 22.9 - - 27.2 50.1 (3.6) 46.5
Share of associates other comprehensive income - - - (21.3) - (21.3) - (21.3)
Total other comprehensive income - 1.4 (6.4) (58.0) 29.7 (33.3) (37.4) (70.7)
Total comprehensive income for the year - 1.4 (6.4) (58.0) 270.9 207.9 205.6 413.5
Contributions by and distributions to non-controlling interest
Non-controlling interest arising on acquisition of subsidiary - - - - - - - -
Issue of shares to non-controlling interests - - - - - - 1.7 1.7
Issue/(acquisition) of shares held by outside equity interest - - - - - - (5.2) (5.2)
Total contributions by and distributions to non-controlling interest - - - - - - (3.5) (3.5)
Disposal of Snowtown 2 - (31.3) - - 30.2 (1.1) (0.6) (1.7)
Contributions by and distributions to owners
Share issued 390.9 - - - - 390.9 - 390.9
Share buyback (3.7) - - - - (3.7) - (3.7)
Shares issued under the dividend reinvestment plan 5.0 - - - - 5.0 - 5.0
Conversion of executive redeemable shares 0.9 - - - - 0.9 - 0.9
Dividends to equity holders - - - - (113.7) (113.7) (92.3) (206.0)
Total contributions by and distributions to owners 393.1 - - - (113.7) 279.4 (92.3) 187.1
Balance at 31 March 2020 754.9 655.1 (71.8) (108.4) 902.4 2,132.2 1,207.7 3,339.9
The accompanying notes form part of these consolidated financial statements.

75
Notes to the Financial Statements
For the year ended 31 March 2021
1 Accounting policies
A Reporting entityInfratil Limited ('the Company') is a company domiciled in New Zealand and registered under the Companies Act 1993. The Company is listed on the NZX Main Board ('NZX') and Australian Securities Exchange ('ASX'), and is an FMC Reporting Entity in terms of Part 7 of the Financial Markets Conduct Act 2013.
B Basis of preparation
The consolidated financial statements have been prepared in accordance with New Zealand Generally Accepted Accounting Practices (‘NZ GAAP’) and comply with New Zealand equivalents to International Financial Reporting Standards ('NZ IFRS') and other applicable financial reporting standards as appropriate for profit-oriented entities. The consolidated financial statements comprise the Company, its subsidiaries and associates ('the Group'). The presentation currency used in the preparation of these consolidated financial statements is New Zealand dollars, which is also the Group's functional currency, and is presented in $Millions unless otherwise stated. The principal accounting policies adopted in the preparation of these consolidated financial statements are set out below. These policies have been consistently applied to all the periods presented, unless otherwise stated. Comparative figures have been restated where appropriate to ensure consistency with the current period.
The consolidated financial statements comprise statements of the following: comprehensive income; financial position; changes in equity; cash flows; significant accounting policies; and the notes to those statements. The consolidated financial statements are prepared on the basis of historical cost, except certain property, plant and equipment which is valued in accordance with accounting policy (D), investment property valued in accordance with accounting policy (E), and financial derivatives valued in accordance with accounting policy (K).
Accounting estimates and judgements
The preparation of consolidated financial statements in conformity with NZ IFRS requires management to make estimates and assumptions that affect the reported amounts of assets and liabilities at the date of the consolidated financial statements and the reported amounts of revenues and expenses during the reporting period. Future outcomes could differ from those estimates. The principal areas of judgement in preparing these consolidated financial statements are set out below.
Valuation of property, plant and equipment
Property, plant and equipment is recorded at cost less accumulated depreciation and impairment losses, or at fair value less accumulated depreciation and impairment losses. Where property, plant and equipment is recorded at fair value, valuations can include an assessment of the net present value of the future earnings of the assets, the depreciated replacement cost, and other market-based information in accordance with asset valuation standards. The key inputs and assumptions that are used in valuations, that require judgement, can include projections of future revenues, volumes, operational and capital expenditure profiles, capacity, terminal values, the application of discount rates and replacement values. Key inputs and assumptions are reassessed at each balance date to ensure there has been no material change that may impact the valuation.
With respect to assets held at cost, judgements are made about whether costs incurred relate to bringing an asset to its working condition for its intended use, and therefore are appropriate for capitalisation as part of the cost of the asset. The determination of the appropriate life for a particular asset requires judgements about, among other factors, the expected future economic benefits of the asset and the likelihood of obsolescence.
Assessing whether an asset is impaired involves estimating the future cash flows that the asset is expected to generate. This will, in turn, involve a number of assumptions, including the assessment of the key inputs that impact the valuation.
Valuation of investments including Associates
Infratil completes an assessment of the carrying value of investments at least annually and considers objective evidence for impairment on each investment, taking into account observable data on the investment, the status or context of markets, its own view of fair value, and its long-term investment intentions. Infratil notes the following matters which are specifically considered in terms of objective evidence of impairment of its investments, and whether there is a significant or prolonged decline from cost, which should be recorded as an impairment, and taken to profit and loss: any known loss events that have occurred since the initial recognition date of the investments, including its investment performance, its long-term investment horizon, specific initiatives which reflect the strategic or influential nature of its existing investment position and internal valuations; and the state of markets. The assessment also requires judgements about the expected future performance and cash flows of the investment.
Derivatives
Certain derivatives are classified as financial assets or financial liabilities at fair value through profit or loss. The key assumptions and risk factors for these derivatives relate to energy price hedges and their valuation. Energy price hedges are valued with reference to financial models of future energy prices or market values for the relevant derivative. Accounting judgements have been made in determining hedge designation for the different types of derivatives employed by the Group to hedge risk exposures. Other derivatives including interest rate instruments and foreign exchange contracts are valued based on market information and prices.
Covid pandemic
Since the World Health Organisation characterised the outbreak of the novel strain of coronavirus (‘covid’) as a pandemic on 11 March 2020, there have been extraordinary and wide-ranging actions and measures undertaken by local public health authorities and governments worldwide to slow and contain the spread of the virus. The containment efforts taken to fight this health crisis have included the implementation of travel bans, border closings, quarantine periods and social distancing. Significant economic stimulus packages were also deployed in countries in which Infratil’s portfolio companies operate, including reductions in the Official Cash Rate and other monetary policy measures in both Australia and New Zealand, a Wage Subsidy policy in New Zealand and the JobKeeper programme in Australia.
Taken as a whole, the Group has performed strongly despite the challenges posed by the pandemic. Many of Infratil’s portfolio companies provide essential services and demonstrated their resilience throughout the financial year.

76
Known material impacts of the covid pandemic on the financial position and/or performance of Infratil’s portfolio companies during the year are summarised below.
Wellington International Airport (‘WIAL’)
Covid has had a significant impact on the aviation industry and on WIAL’s business. WIAL experienced a significant reduction in passengers for the year ending 31 March 2021, and the longer-term effects of covid and the potential impacts of the pandemic continue to evolve. Whilst passenger traffic continues to improve as domestic travel recovers, there remains uncertainty around forecast domestic and international air travel from the ongoing impacts of covid, and on WIAL’s cash flows as a consequence.
During the year ended 31 March 2021 WIAL secured a temporary waiver of certain financial covenants with its banking group and USPP lender until the first compliance date, which is no later than 31 March 2022. WIAL also increased its bank facilities from $100.0 million to $170.0 million and extended its bank facility maturity dates. In addition, in May 2020 WIAL also put in place a $75.8 million shareholder support agreement, in the form of a commitment from both its shareholders for redeemable preference shares. The shareholder support was not called upon during the year. WIAL also issued a $100 million retail bond in August 2020, the proceeds of which have been earmarked to pre-fund WIAL’s $75 million bond maturity in May 2021.
Vodafone New Zealand (‘Vodafone’)
Vodafone experienced a reduction in roaming, pre-paid and retail revenues during the year ended 31 March 2021 as a result of the significant reduction in international travel to and from New Zealand.
RetireAustralia
In response to the high level of uncertainty associated with covid, RetireAustralia focused on ensuring certainty of funding to continue delivering operational activities and resident safety priorities by obtaining support from both its lenders and shareholders in the first quarter of the financial year. RetireAustralia’s lenders provided a waiver of certain covenants under bank facility agreements until 31 December 2020 and agreed to an increase in the core debt facility by A$30 million. The additional A$30 million was not utilised by RetireAustralia during the year.
RetireAustralia’s shareholders also committed to a capital contribution of up to A$20 million (Infratil share: A$10 million) if required by the Group to continue its operations. The commitment was not called upon during the year.
There were no other known material impacts of covid on the Group's financial performance for the year ended 31 March 2021, or balance sheet as at 31 March 2021.
C Basis of preparing consolidated financial statements
Principles of consolidation
The consolidated financial statements are prepared by combining the financial statements of all the entities that comprise the consolidated entity. A list of significant subsidiaries and associates is shown in Note 8. Consistent accounting policies are employed in the preparation and presentation of the Group consolidated financial statements.
D Property, plant and equipment
Property, plant and equipment (‘PPE’) is recorded at cost less accumulated depreciation and impairment losses, or at fair value less accumulated depreciation and impairment losses. Where property, plant and equipment is recorded at fair value, valuations are undertaken on a systematic basis. No individual asset is included at an independent external valuation undertaken more than five years previously. PPE that is revalued, is revalued to its fair value determined by an independent valuer or by the Directors with reference to independent experts, in accordance with NZ IAS 16 Property, Plant and Equipment. Where the assets are of a specialised nature and do not have observable market values in their existing use, depreciated replacement cost is used as the basis of the valuation. Depreciated replacement cost measures net current value as the most efficient, lowest cost which would replace existing assets and offer the same amount of utility in their present use. For non-specialised assets where there is no observable market, an income-based approach is used.
Land, buildings, vehicles, plant and equipment, leasehold improvements and civil works are measured at fair value or cost.
Renewable generation assets are shown at fair value, based on periodic valuations by independent external valuers or by Directors with reference to independent experts, less subsequent depreciation.
Depreciation is provided on a straight line basis and the major depreciation periods (in years) are:
Buildings and civil works 5-80
Vehicles, plant and equipment 3-20
Renewable generation 12-200
Land not depreciated
Leasehold improvements 10-40
Capital work in progress not depreciated until asset in use
E Investment propertiesInvestment properties are property (either owned or leased) held to earn rental income. Investment properties are measured at fair value with any change therein recognised in profit or loss. Property that is being constructed for future use as investment property is measured at fair value and classified as investment properties. Where a leased property is held to earn rental income, the right of use asset is included within Investment properties.
F Receivables
Receivables are initially recognised at fair value and subsequently measured at amortised cost, less any provision for expected credit losses. The Group applies the simplified approach to measuring expected credit losses using a lifetime expected loss allowance for all trade receivables and contract assets. These provisions take into account known commercial factors impacting specific customer accounts, as well as the overall profile of the debtor portfolio. In assessing the provision, factors such as past collection history, the age of receivable balances, the level of activity in customer accounts, as well as general macro-economic trends, are also taken into account.

77
G Investments in associates
Associates are those entities in which the Group has significant influence, but not control, over the financial and operating policies. Investments in associates are accounted for using the equity method. Under the equity method, the investment in the associate is carried at cost plus the Group’s share of post-acquisition changes in the net assets of the associate and any impairment losses. The Group's share of the associates’ post-acquisition profits or losses is recognised in profit or loss, and the Group’s share of post-acquisition movements in reserves is recognised in other comprehensive income.
H Goodwill
The carrying value of goodwill is subject to an annual impairment test to ensure the carrying value does not exceed the recoverable amount at balance date. For the purpose of impairment testing, goodwill is allocated to the individual cash-generating units to which it relates. Any impairment losses are recognised in the statement of comprehensive income. In determining the recoverable amount of goodwill, fair value is assessed, including the use of valuation models to calculate the present value of expected future cash flows of the cash-generating units, and where available with reference to listed prices.
I Assets and disposal groups held for saleAssets and disposal groups classified as held for sale are measured at the lower of carrying amount or fair value less costs to sell. Assets and disposal groups are classified as held for sale if their carrying amount will be recovered through a sale transaction rather than through continuing use. This condition is regarded as met only when the sale is highly probable and the asset (or disposal group) is available for immediate sale in its present condition and the sale of the asset (or disposal group) is expected to be completed within one year from the date of classification.
J Taxation
Income tax comprises both current and deferred tax. Current tax is the expected tax payable on the taxable income for the year, using tax rates enacted or substantively enacted at the balance date, and any adjustment to tax payable in respect of previous years. Deferred tax is recognised in respect of the differences between the carrying amounts of assets and liabilities for financial reporting purposes and the carrying amounts used for taxation purposes.
The amount of deferred tax provided is based on the expected manner of realisation or settlement of the carrying amount of assets and liabilities, using tax rates enacted or substantively enacted at the balance sheet date. A deferred tax asset is recognised only to the extent that it is probable that future taxable profits will be available against which the asset can be utilised, or there are deferred tax liabilities to offset it.
Preparation of the consolidated financial statements requires estimates of the amount of tax that will ultimately be payable, the availability and recognition of losses to be carried forward and the amount of foreign tax credits that will be received.
K Derivative financial instruments
When appropriate, the Group enters into agreements to manage its interest rate, foreign exchange, operating and investment risks.
In accordance with the Group's risk management policies, the Group does not hold or issue derivative financial instruments for
speculative purposes. However, certain derivatives do not qualify for hedge accounting and are required to be accounted for at fair value through profit or loss. Derivative financial instruments are recognised initially at fair value at the date they are entered into. Subsequent to initial recognition, derivative financial instruments are stated at fair value at each balance sheet date. The resulting gain or loss is recognised in the profit or loss immediately unless the derivative is designated effective as a hedging instrument, in which event, recognition of any resultant gain or loss depends on the nature of the hedging relationship. The Group identifies certain derivatives as hedges of highly probable forecast transactions to the extent the hedge meets the hedge designation tests.
Hedge accounting
The Group designates certain hedging instruments as either cash flow hedges or hedges of net investments in equity. At the inception of the hedge relationship the Group documents the relationship between the hedging instrument and hedged item, along with its risk management objectives and its strategy for undertaking various hedge transactions. Furthermore, at the inception of the hedge and on an on-going basis, the Group documents whether the hedging instrument that is used in the hedging relationship is highly effective in offsetting changes in fair values or cash flows of the hedged item.
The effective portion of changes in the fair value of derivatives that are designated and qualify as cash flow hedges are recognised in other comprehensive income and presented in equity. The gain or loss relating to the ineffective portion is recognised in profit or loss. The amounts presented in equity are recognised in profit or loss in the periods when the hedged item is recognised in profit or loss.
Hedge accounting is discontinued when the Group revokes the hedging relationship, the hedging instrument expires or is sold, terminated, or exercised, or no longer qualifies for hedge accounting. Any cumulative gain or loss recognised in equity at that time remains in equity and is recognised when the forecast transaction is ultimately recognised in profit or loss. When a forecast transaction is no longer expected to occur, the cumulative gain or loss that was recognised in equity is recognised in profit or loss.
Foreign currency differences arising on the retranslation of a financial liability designated as a hedge of a net investment in a foreign operation are recognised directly in equity, in the foreign currency translation reserve, to the extent that the hedge is effective. To the extent that the hedge is ineffective, such differences are recognised in profit or loss. When the hedged net investment is disposed of, the cumulative amount in equity is transferred to profit or loss as an adjustment to the profit or loss on disposal.
L Foreign currency transactions
Transactions in foreign currencies are translated to the respective functional currencies of Group entities at exchange rates at the dates of the transactions. Monetary assets and liabilities denominated in foreign currencies at the reporting date are translated to the functional currency at the exchange rate at that date. The foreign currency gain or loss on monetary items is the difference between amortised cost in the functional currency at the beginning of the period, adjusted for interest and payments during the period, and the amortised cost in foreign currency translated at
78
the exchange rate at the end of the period. Non-monetary assets and liabilities denominated in foreign currencies that are measured at fair value are translated to the functional currency at the exchange rate at the date that the fair value was determined. Foreign currency differences arising on translation are recognised in profit or loss, except for differences arising on the translation of the net investment in a foreign operation.
Foreign operations
The assets and liabilities of foreign operations including goodwill and fair value adjustments arising on acquisition, are translated to New Zealand dollars at exchange rates at the reporting date. The income and expenses of foreign operations are translated to New Zealand dollars at the average rate for the reporting period.
M Impairment of assets
At each reporting date, the Group reviews the carrying amounts of its assets to determine whether there is any indication that those assets have suffered an impairment loss. If any such indication exists, the recoverable amount of the asset is estimated in order to determine the extent of the impairment loss (if any). Where the asset does not generate cash flows that are independent from other assets, the Group estimates the recoverable amount of the cash-generating unit to which the asset belongs. Goodwill, intangible assets with indefinite useful lives and intangible assets not yet available for use are tested for impairment annually and whenever there is an indication that the asset may be impaired.
N Revenue recognition
Revenue is measured based on the consideration specified in a contract with a customer. A description of the nature and timing of the various performance obligations in the Group’s contracts with customers and when revenue is recognised is outlined at Note 11 (Revenue).
Interest revenues are recognised as accrued, taking into account the effective yield of the financial asset. Revenue from services is recognised in the profit or loss over the period of service. Dividend income is recognised when the right to receive the payment is established.
O Borrowings
Borrowings are recorded initially at fair value, net of transaction costs. Subsequent to initial recognition, borrowings are measured at amortised cost with any difference between the initial recognised amount and the redemption value being recognised in profit or loss over the period of the borrowing using the effective interest rate. Bond and bank debt issue expenses, fees and other costs incurred in arranging finance are capitalised and amortised over the term of the relevant debt instrument or debt facility.
P Discontinued operations Classification as a discontinued operation occurs on disposal, or when the operation meets the criteria to be classified as a non-current asset or disposal group held for sale (see note (I)), if earlier, and represents a separate major line of business or geographical area of operations. When an operation is classified as a discontinued operation, the comparative statement of comprehensive income is re-presented as if the operation had been discontinued from the start of the comparative year.
Q Segment reporting
An operating segment is a component of the Group that engages in business activities from which it may earn revenues and incur expenses, including revenues and expenses that relate to transactions with any of the Group's other components. All operating segments' operating results are reviewed regularly by the Group's Board of Directors to make decisions about resources to be allocated to the segment and assess its performance, and for which discrete financial information is available.
The Group is organised into six main business segments, Trustpower, Tilt Renewables, Wellington International Airport, Qscan Group, Associate Companies and Other. Other comprises investment activity not included in the specific categories.
R Adoption status of relevant new financial reporting standards and interpretations
The Group has early adopted amendments to NZ IAS 1 Presentation of Financial Statements for the year ended 31 March 2021. The amendments clarify the classification of liabilities as current or non-current. The Group has applied this amended classification of current and non-current liabilities in determining the classification of loan facilities within these financial statements.
S New standards, amendments and pronouncements not yet adopted by the Group
There are no new standards that are not yet effective that would be expected to have a material impact on the Group, in the current or future reporting periods, and foreseeable future transactions.
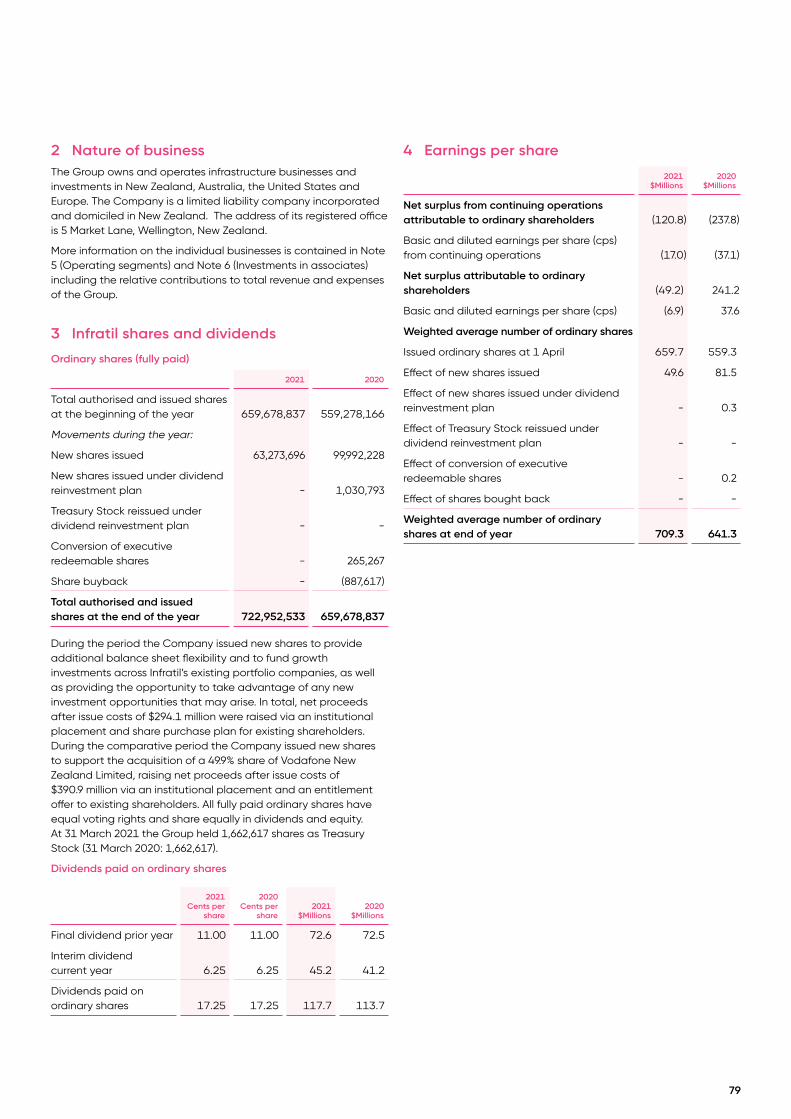
79
2 Nature of businessThe Group owns and operates infrastructure businesses and investments in New Zealand, Australia, the United States and Europe. The Company is a limited liability company incorporated and domiciled in New Zealand. The address of its registered office is 5 Market Lane, Wellington, New Zealand.
More information on the individual businesses is contained in Note 5 (Operating segments) and Note 6 (Investments in associates) including the relative contributions to total revenue and expenses of the Group.
3 Infratil shares and dividends
Ordinary shares (fully paid)
2021 2020
Total authorised and issued shares at the beginning of the year 659,678,837 559,278,166
Movements during the year:
New shares issued 63,273,696 99,992,228
New shares issued under dividend reinvestment plan - 1,030,793
Treasury Stock reissued under dividend reinvestment plan - -
Conversion of executive redeemable shares - 265,267
Share buyback - (887,617)
Total authorised and issued shares at the end of the year 722,952,533 659,678,837
During the period the Company issued new shares to provide additional balance sheet flexibility and to fund growth investments across Infratil’s existing portfolio companies, as well as providing the opportunity to take advantage of any new investment opportunities that may arise. In total, net proceeds after issue costs of $294.1 million were raised via an institutional placement and share purchase plan for existing shareholders. During the comparative period the Company issued new shares to support the acquisition of a 49.9% share of Vodafone New Zealand Limited, raising net proceeds after issue costs of $390.9 million via an institutional placement and an entitlement offer to existing shareholders. All fully paid ordinary shares have equal voting rights and share equally in dividends and equity. At 31 March 2021 the Group held 1,662,617 shares as Treasury Stock (31 March 2020: 1,662,617).
Dividends paid on ordinary shares
2021Cents per
share
2020 Cents per
share2021
$Millions2020
$Millions
Final dividend prior year 11.00 11.00 72.6 72.5
Interim dividend current year 6.25 6.25 45.2 41.2
Dividends paid on ordinary shares 17.25 17.25 117.7 113.7
4 Earnings per share
2021 $Millions
2020 $Millions
Net surplus from continuing operations attributable to ordinary shareholders (120.8) (237.8)
Basic and diluted earnings per share (cps) from continuing operations (17.0) (37.1)
Net surplus attributable to ordinary shareholders (49.2) 241.2
Basic and diluted earnings per share (cps) (6.9) 37.6
Weighted average number of ordinary shares
Issued ordinary shares at 1 April 659.7 559.3
Effect of new shares issued 49.6 81.5
Effect of new shares issued under dividend reinvestment plan - 0.3
Effect of Treasury Stock reissued under dividend reinvestment plan - -
Effect of conversion of executive redeemable shares - 0.2
Effect of shares bought back - -
Weighted average number of ordinary shares at end of year 709.3 641.3

80
5 Operating segmentsTrustpower and Tilt Renewables are renewable generation investments, Wellington International Airport is an airport investment and Qscan Group is a diagnostic imaging investment. Associates comprises Infratil's investments that are not consolidated for financial reporting purposes including CDC Data Centres, Vodafone New Zealand, RetireAustralia, Longroad Energy and Galileo Green Energy. Further information on these investments is outlined in Note 6. The Group's investment in Tilt Renewables was classified as Held for Sale and treated as a Discontinued Operation as at 31 March 2021. Further information on this investment is outlined in Note 10.1. All other segments and corporate predominately includes the activities of the Parent Company. The group has no significant reliance on any one customer. Inter-segment revenue primarily comprises dividends from Trustpower and subvention income from Wellington International Airport.
TrustpowerNew Zealand
$Millions
Tilt RenewablesAustralasia
$Millions
Wellington International
AirportNew Zealand
$Millions
Qscan Group
Australia$Millions
Associates$Millions
All other segments
and corporate
New Zealand$Millions
Eliminations and
discontinued operations
$MillionsTotal
$Millions
For the year ended 31 March 2021
Total revenue 952.8 137.4 68.8 65.5 - 100.2 (137.4) 1,187.3
Share of earnings of associate companies - - - - 182.6 - - 182.6
Inter-segment revenue - - - - - (90.0) (38.3) (128.3)
Total income 952.8 137.4 68.8 65.5 182.6 10.2 (175.7) 1,241.6
Operating expenses (752.5) (57.2) (32.8) (62.9) - (187.5) 5.4 (1,087.5)
Interest income 0.5 3.2 0.7 - - 0.3 (3.1) 1.6
Interest expense (30.8) (15.0) (27.2) (5.1) - (76.9) 14.9 (140.1)
Depreciation and amortisation (45.4) (43.8) (29.6) (7.9) - - 43.9 (82.8)
Net gain/(loss) on foreign exchange and derivatives (83.5) 78.5 1.4 - - 25.6 (78.4) (56.4)
Net realisations, revaluations and impairments - - 8.7 - - 23.1 - 31.8
Taxation expense (10.3) (31.5) 12.4 (2.0) - 4.2 31.4 4.2
Net surplus/(loss) for the year 30.8 71.6 2.4 (12.4) 182.6 (201.0) (161.6) (87.6)
Net surplus/(loss) attributable to owners of the company 17.4 47.1 1.8 (7.0) 182.6 (201.0) (161.7) (120.8)
Net surplus/(loss) attributable to non-controlling interests 13.4 24.5 0.6 (5.4) - - 0.1 33.2
Current assets 340.9 404.6 96.8 43.6 - 63.6 1,848.8 2,798.3
Non-current assets 2,001.5 1,803.2 1,399.1 897.2 2,126.9 359.8 (1,848.8) 6,738.9
Current liabilities 317.6 65.4 117.9 41.9 - 288.0 841.2 1,672.0
Non-current liabilities 937.9 841.3 705.3 350.7 - 1,782.0 (841.2) 3,776.0
Net assets 1086.9 1,301.1 672.7 548.2 2,126.9 (1,646.6) - 4,089.2
Non-controlling interest percentage 49.0% 34.4% 34.0% 43.7% - - -
Capital expenditure and investment 36.4 377.4 35.0 309.6 55.1 23.5 - 837.0
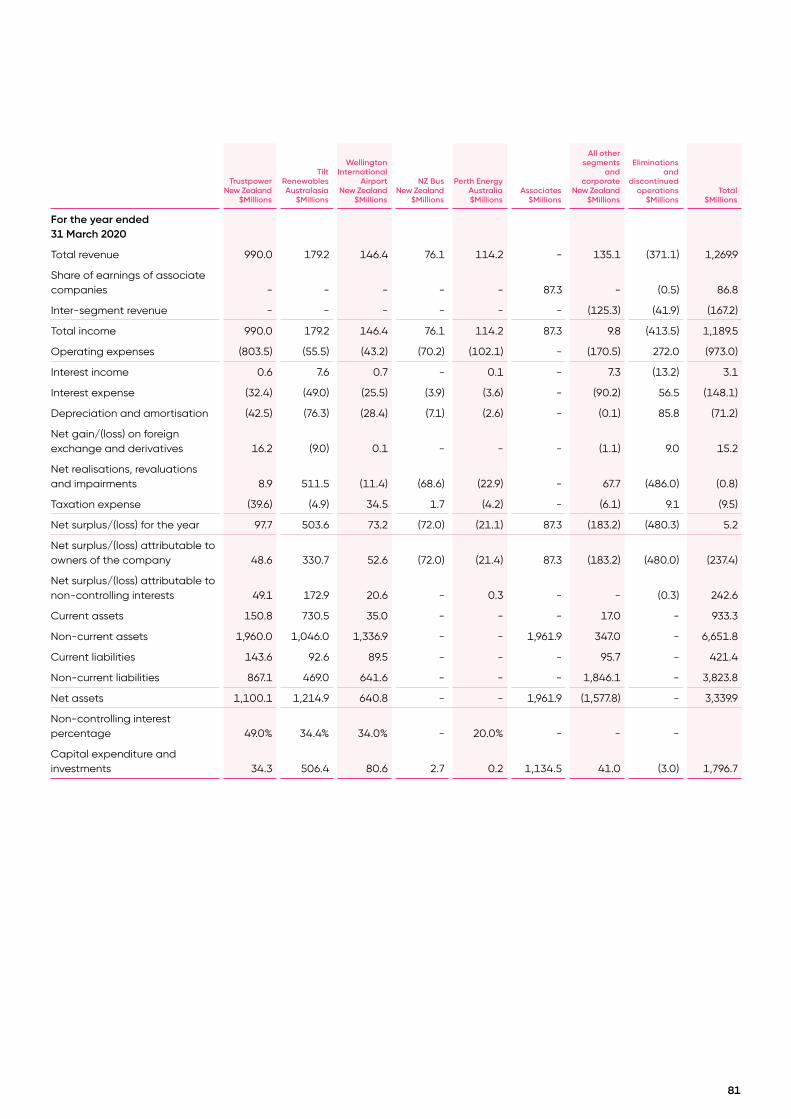
TrustpowerNew Zealand
$Millions
Tilt RenewablesAustralasia
$Millions
Wellington International
AirportNew Zealand
$Millions
NZ BusNew Zealand
$Millions
Perth EnergyAustralia$Millions
Associates$Millions
All other segments
and corporate
New Zealand$Millions
Eliminations and
discontinued operations
$MillionsTotal
$Millions
For the year ended 31 March 2020
Total revenue 990.0 179.2 146.4 76.1 114.2 - 135.1 (371.1) 1,269.9
Share of earnings of associate companies - - - - - 87.3 - (0.5) 86.8
Inter-segment revenue - - - - - - (125.3) (41.9) (167.2)
Total income 990.0 179.2 146.4 76.1 114.2 87.3 9.8 (413.5) 1,189.5
Operating expenses (803.5) (55.5) (43.2) (70.2) (102.1) - (170.5) 272.0 (973.0)
Interest income 0.6 7.6 0.7 - 0.1 - 7.3 (13.2) 3.1
Interest expense (32.4) (49.0) (25.5) (3.9) (3.6) - (90.2) 56.5 (148.1)
Depreciation and amortisation (42.5) (76.3) (28.4) (7.1) (2.6) - (0.1) 85.8 (71.2)
Net gain/(loss) on foreign exchange and derivatives 16.2 (9.0) 0.1 - - - (1.1) 9.0 15.2
Net realisations, revaluations and impairments 8.9 511.5 (11.4) (68.6) (22.9) - 67.7 (486.0) (0.8)
Taxation expense (39.6) (4.9) 34.5 1.7 (4.2) - (6.1) 9.1 (9.5)
Net surplus/(loss) for the year 97.7 503.6 73.2 (72.0) (21.1) 87.3 (183.2) (480.3) 5.2
Net surplus/(loss) attributable to owners of the company 48.6 330.7 52.6 (72.0) (21.4) 87.3 (183.2) (480.0) (237.4)
Net surplus/(loss) attributable to non-controlling interests 49.1 172.9 20.6 - 0.3 - - (0.3) 242.6
Current assets 150.8 730.5 35.0 - - - 17.0 - 933.3
Non-current assets 1,960.0 1,046.0 1,336.9 - - 1,961.9 347.0 - 6,651.8
Current liabilities 143.6 92.6 89.5 - - - 95.7 - 421.4
Non-current liabilities 867.1 469.0 641.6 - - - 1,846.1 - 3,823.8
Net assets 1,100.1 1,214.9 640.8 - - 1,961.9 (1,577.8) - 3,339.9
Non-controlling interest percentage 49.0% 34.4% 34.0% - 20.0% - - -
Capital expenditure and investments 34.3 506.4 80.6 2.7 0.2 1,134.5 41.0 (3.0) 1,796.7
81
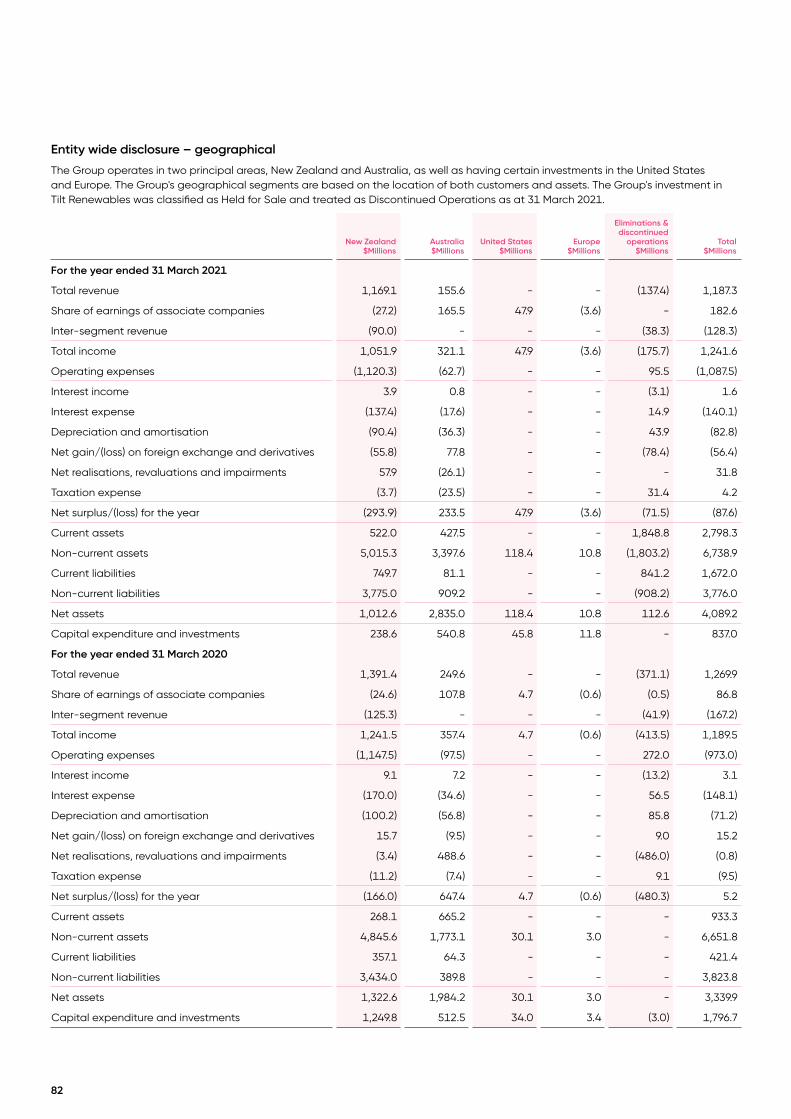
82
New Zealand$Millions
Australia$Millions
United States$Millions
Europe$Millions
Eliminations & discontinued
operations$Millions
Total$Millions
For the year ended 31 March 2021
Total revenue 1,169.1 155.6 - - (137.4) 1,187.3
Share of earnings of associate companies (27.2) 165.5 47.9 (3.6) - 182.6
Inter-segment revenue (90.0) - - - (38.3) (128.3)
Total income 1,051.9 321.1 47.9 (3.6) (175.7) 1,241.6
Operating expenses (1,120.3) (62.7) - - 95.5 (1,087.5)
Interest income 3.9 0.8 - - (3.1) 1.6
Interest expense (137.4) (17.6) - - 14.9 (140.1)
Depreciation and amortisation (90.4) (36.3) - - 43.9 (82.8)
Net gain/(loss) on foreign exchange and derivatives (55.8) 77.8 - - (78.4) (56.4)
Net realisations, revaluations and impairments 57.9 (26.1) - - - 31.8
Taxation expense (3.7) (23.5) - - 31.4 4.2
Net surplus/(loss) for the year (293.9) 233.5 47.9 (3.6) (71.5) (87.6)
Current assets 522.0 427.5 - - 1,848.8 2,798.3
Non-current assets 5,015.3 3,397.6 118.4 10.8 (1,803.2) 6,738.9
Current liabilities 749.7 81.1 - - 841.2 1,672.0
Non-current liabilities 3,775.0 909.2 - - (908.2) 3,776.0
Net assets 1,012.6 2,835.0 118.4 10.8 112.6 4,089.2
Capital expenditure and investments 238.6 540.8 45.8 11.8 - 837.0
For the year ended 31 March 2020
Total revenue 1,391.4 249.6 - - (371.1) 1,269.9
Share of earnings of associate companies (24.6) 107.8 4.7 (0.6) (0.5) 86.8
Inter-segment revenue (125.3) - - - (41.9) (167.2)
Total income 1,241.5 357.4 4.7 (0.6) (413.5) 1,189.5
Operating expenses (1,147.5) (97.5) - - 272.0 (973.0)
Interest income 9.1 7.2 - - (13.2) 3.1
Interest expense (170.0) (34.6) - - 56.5 (148.1)
Depreciation and amortisation (100.2) (56.8) - - 85.8 (71.2)
Net gain/(loss) on foreign exchange and derivatives 15.7 (9.5) - - 9.0 15.2
Net realisations, revaluations and impairments (3.4) 488.6 - - (486.0) (0.8)
Taxation expense (11.2) (7.4) - - 9.1 (9.5)
Net surplus/(loss) for the year (166.0) 647.4 4.7 (0.6) (480.3) 5.2
Current assets 268.1 665.2 - - - 933.3
Non-current assets 4,845.6 1,773.1 30.1 3.0 - 6,651.8
Current liabilities 357.1 64.3 - - - 421.4
Non-current liabilities 3,434.0 389.8 - - - 3,823.8
Net assets 1,322.6 1,984.2 30.1 3.0 - 3,339.9
Capital expenditure and investments 1,249.8 512.5 34.0 3.4 (3.0) 1,796.7
Entity wide disclosure – geographical
The Group operates in two principal areas, New Zealand and Australia, as well as having certain investments in the United States and Europe. The Group's geographical segments are based on the location of both customers and assets. The Group's investment in Tilt Renewables was classified as Held for Sale and treated as Discontinued Operations as at 31 March 2021.
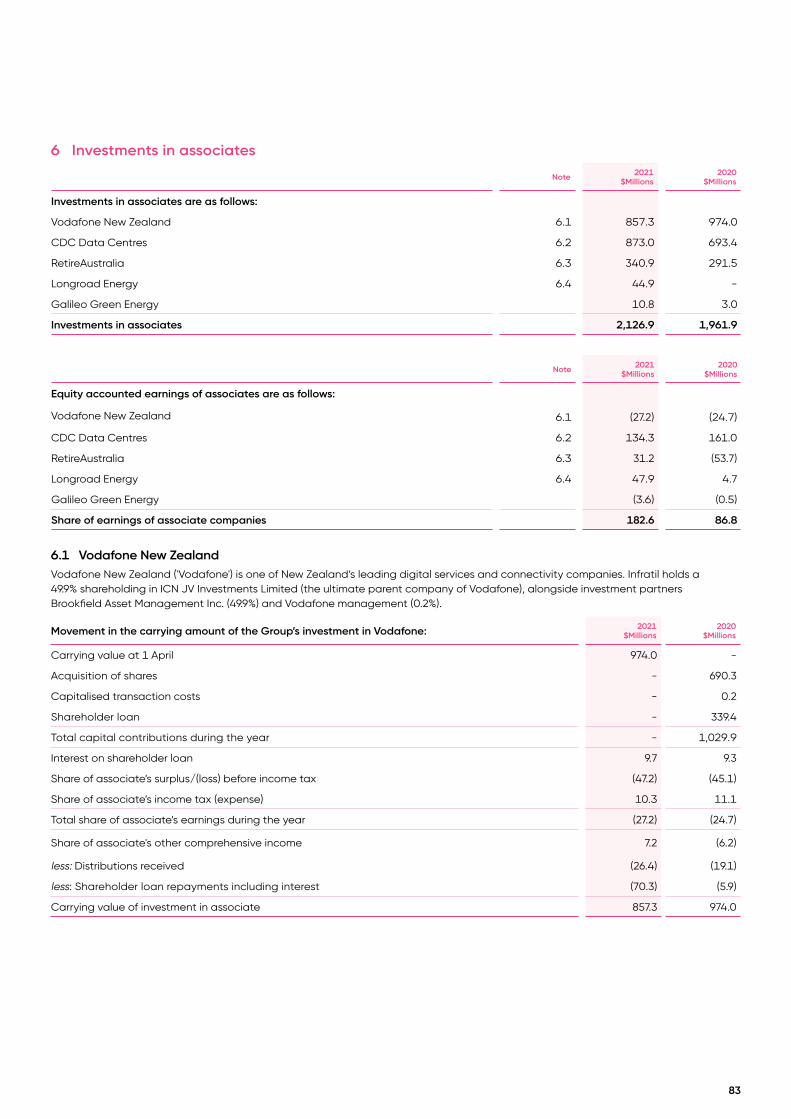
83
6 Investments in associates
Note 2021$Millions
2020$Millions
Investments in associates are as follows:
Vodafone New Zealand 6.1 857.3 974.0
CDC Data Centres 6.2 873.0 693.4
RetireAustralia 6.3 340.9 291.5
Longroad Energy 6.4 44.9 -
Galileo Green Energy 10.8 3.0
Investments in associates 2,126.9 1,961.9
Note 2021$Millions
2020$Millions
Equity accounted earnings of associates are as follows:
Vodafone New Zealand 6.1 (27.2) (24.7)
CDC Data Centres 6.2 134.3 161.0
RetireAustralia 6.3 31.2 (53.7)
Longroad Energy 6.4 47.9 4.7
Galileo Green Energy (3.6) (0.5)
Share of earnings of associate companies 182.6 86.8
6.1 Vodafone New ZealandVodafone New Zealand ('Vodafone') is one of New Zealand’s leading digital services and connectivity companies. Infratil holds a 49.9% shareholding in ICN JV Investments Limited (the ultimate parent company of Vodafone), alongside investment partners Brookfield Asset Management Inc. (49.9%) and Vodafone management (0.2%).
Movement in the carrying amount of the Group’s investment in Vodafone: 2021$Millions
2020$Millions
Carrying value at 1 April 974.0 -
Acquisition of shares - 690.3
Capitalised transaction costs - 0.2
Shareholder loan - 339.4
Total capital contributions during the year - 1,029.9
Interest on shareholder loan 9.7 9.3
Share of associate’s surplus/(loss) before income tax (47.2) (45.1)
Share of associate’s income tax (expense) 10.3 11.1
Total share of associate’s earnings during the year (27.2) (24.7)
Share of associate's other comprehensive income 7.2 (6.2)
less: Distributions received (26.4) (19.1)
less: Shareholder loan repayments including interest (70.3) (5.9)
Carrying value of investment in associate 857.3 974.0
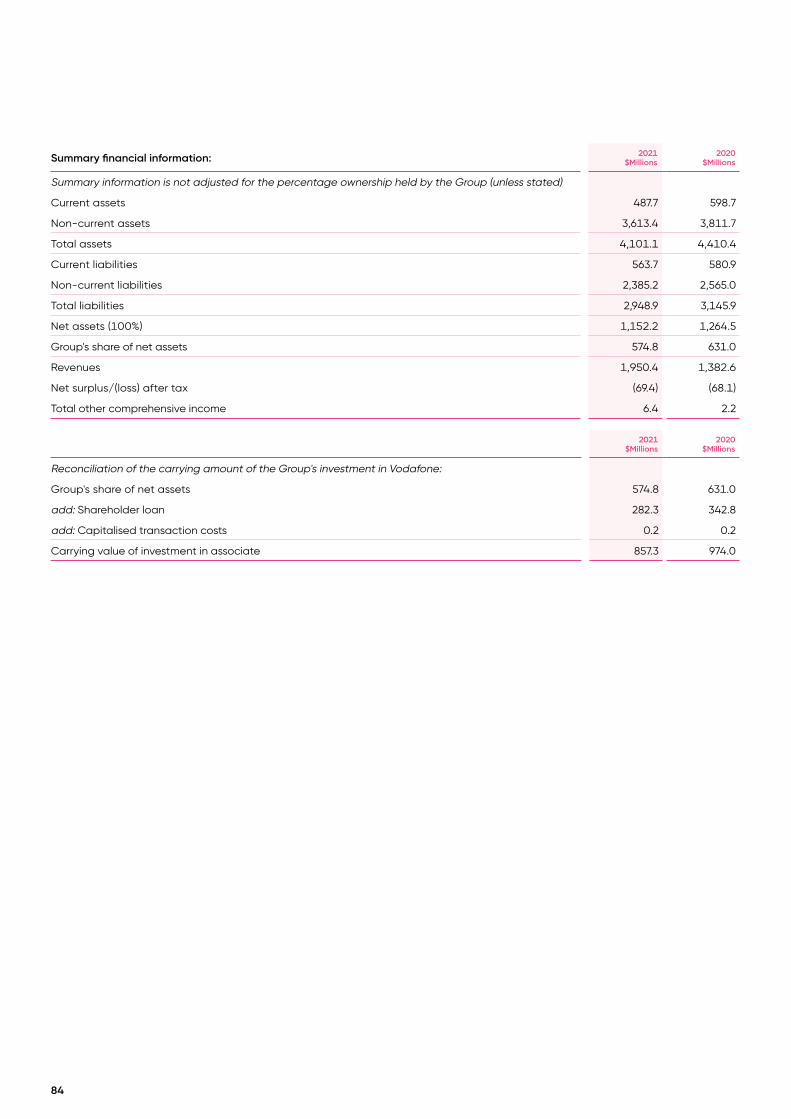
84
Summary financial information: 2021$Millions
2020$Millions
Summary information is not adjusted for the percentage ownership held by the Group (unless stated)
Current assets 487.7 598.7
Non-current assets 3,613.4 3,811.7
Total assets 4,101.1 4,410.4
Current liabilities 563.7 580.9
Non-current liabilities 2,385.2 2,565.0
Total liabilities 2,948.9 3,145.9
Net assets (100%) 1,152.2 1,264.5
Group's share of net assets 574.8 631.0
Revenues 1,950.4 1,382.6
Net surplus/(loss) after tax (69.4) (68.1)
Total other comprehensive income 6.4 2.2
2021$Millions
2020$Millions
Reconciliation of the carrying amount of the Group's investment in Vodafone:
Group's share of net assets 574.8 631.0
add: Shareholder loan 282.3 342.8
add: Capitalised transaction costs 0.2 0.2
Carrying value of investment in associate 857.3 974.0

85
6.2 CDC Data CentresCDC Data Centres ('CDC') is an owner, operator and developer of data centres, with operations in Canberra, Sydney and Auckland. Infratil holds a 48.08% shareholding in CDC Group Holdings Pty Ltd (the ultimate parent company of CDC), alongside investment partners the Commonwealth Superannuation Corporation (24.04%), Future Fund (24.04%) and CDC management (3.84%).
Movement in the carrying amount of the Group's investment in CDC: 2021$Millions
2020$Millions
Carrying value at 1 April 693.4 555.3
Acquisition of shares 8.3 -
Capitalised transaction costs - -
Shareholder loan - 8.1
Total capital contributions during the year 8.3 8.1
Interest on shareholder loan 10.6 14.2
Share of associate’s surplus/(loss) before income tax 178.6 216.6
Share of associate’s income tax (expense) (58.0) (69.8)
add: share of associate's share capital issue, net of dilution 3.1 -
Total share of associate’s earnings during the year 134.3 161.0
Share of associate's other comprehensive income (0.6) -
less: Shareholder loan repayments including interest (5.8) (16.1)
Foreign exchange movements 43.4 (14.9)
Carrying value of investment in associate 873.0 693.4
Summary financial information: 2021A$Millions
2020A$Millions
Summary information is not adjusted for the percentage ownership held by the Group (unless stated)
Current assets 152.3 87.2
Non-current assets 3,202.6 2,703.3
Total assets 3,354.9 2,790.5
Current liabilities 72.2 73.3
Non-current liabilities 1,963.1 1,654.1
Total liabilities 2,035.3 1,727.4
Net assets (100%) 1,319.6 1,063.1
Group's share of net assets 634.5 512.6
Revenues 187.5 173.6
Net surplus/(loss) after tax 234.2 289.1
Total other comprehensive income - -
2021$Millions
2020$Millions
Reconciliation of the carrying amount of the Group's investment in CDC:
Group's share of net assets in NZD 690.9 526.3
add: Shareholder loan 182.1 167.1
Carrying value of investment in associate 873.0 693.4
CDC's functional currency is Australian Dollars (A$) and the summary financial information shown is presented in this currency. The NZD/AUD exchange
rates used to convert the summary financial information to the Group's functional currency (NZ$) were 0.9182 (Spot rate) and 0.9338 (Average rate) (2020:
Spot rate 0.9740, Average rate 0.9501).
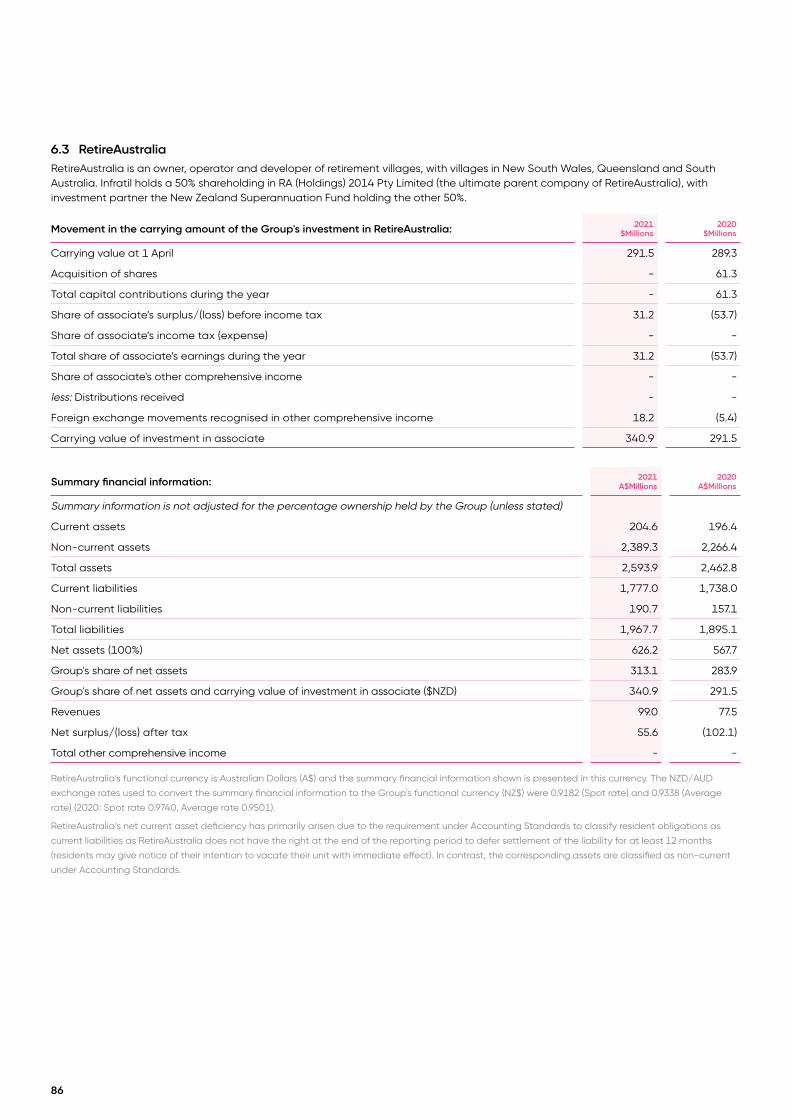
86
6.3 RetireAustraliaRetireAustralia is an owner, operator and developer of retirement villages, with villages in New South Wales, Queensland and South Australia. Infratil holds a 50% shareholding in RA (Holdings) 2014 Pty Limited (the ultimate parent company of RetireAustralia), with investment partner the New Zealand Superannuation Fund holding the other 50%.
Movement in the carrying amount of the Group's investment in RetireAustralia: 2021$Millions
2020$Millions
Carrying value at 1 April 291.5 289.3
Acquisition of shares - 61.3
Total capital contributions during the year - 61.3
Share of associate’s surplus/(loss) before income tax 31.2 (53.7)
Share of associate’s income tax (expense) - -
Total share of associate’s earnings during the year 31.2 (53.7)
Share of associate's other comprehensive income - -
less: Distributions received - -
Foreign exchange movements recognised in other comprehensive income 18.2 (5.4)
Carrying value of investment in associate 340.9 291.5
Summary financial information: 2021A$Millions
2020A$Millions
Summary information is not adjusted for the percentage ownership held by the Group (unless stated)
Current assets 204.6 196.4
Non-current assets 2,389.3 2,266.4
Total assets 2,593.9 2,462.8
Current liabilities 1,777.0 1,738.0
Non-current liabilities 190.7 157.1
Total liabilities 1,967.7 1,895.1
Net assets (100%) 626.2 567.7
Group's share of net assets 313.1 283.9
Group's share of net assets and carrying value of investment in associate ($NZD) 340.9 291.5
Revenues 99.0 77.5
Net surplus/(loss) after tax 55.6 (102.1)
Total other comprehensive income - -
RetireAustralia's functional currency is Australian Dollars (A$) and the summary financial information shown is presented in this currency. The NZD/AUD
exchange rates used to convert the summary financial information to the Group's functional currency (NZ$) were 0.9182 (Spot rate) and 0.9338 (Average
rate) (2020: Spot rate 0.9740, Average rate 0.9501).
RetireAustralia’s net current asset deficiency has primarily arisen due to the requirement under Accounting Standards to classify resident obligations as
current liabilities as RetireAustralia does not have the right at the end of the reporting period to defer settlement of the liability for at least 12 months
(residents may give notice of their intention to vacate their unit with immediate effect). In contrast, the corresponding assets are classified as non-current
under Accounting Standards.
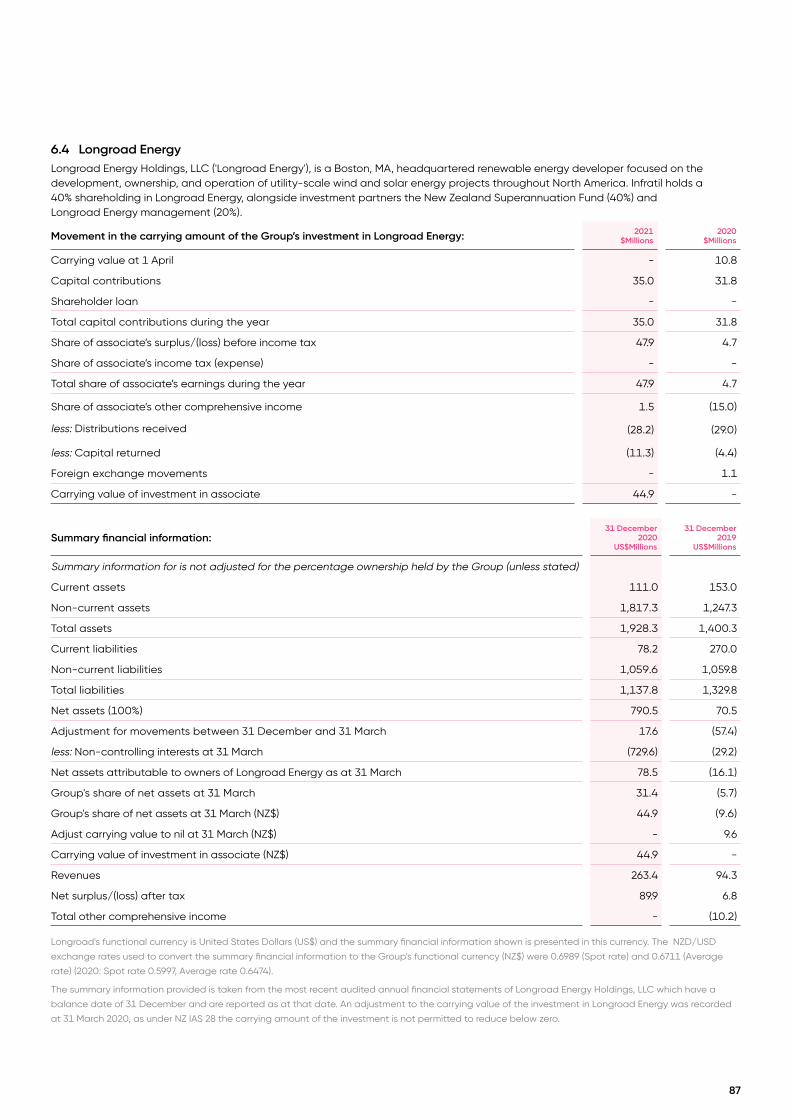
87
6.4 Longroad EnergyLongroad Energy Holdings, LLC ('Longroad Energy'), is a Boston, MA, headquartered renewable energy developer focused on the development, ownership, and operation of utility-scale wind and solar energy projects throughout North America. Infratil holds a 40% shareholding in Longroad Energy, alongside investment partners the New Zealand Superannuation Fund (40%) and Longroad Energy management (20%).
Movement in the carrying amount of the Group’s investment in Longroad Energy: 2021$Millions
2020$Millions
Carrying value at 1 April - 10.8
Capital contributions 35.0 31.8
Shareholder loan - -
Total capital contributions during the year 35.0 31.8
Share of associate’s surplus/(loss) before income tax 47.9 4.7
Share of associate’s income tax (expense) - -
Total share of associate’s earnings during the year 47.9 4.7
Share of associate’s other comprehensive income 1.5 (15.0)
less: Distributions received (28.2) (29.0)
less: Capital returned (11.3) (4.4)
Foreign exchange movements - 1.1
Carrying value of investment in associate 44.9 -
Summary financial information:31 December
2020US$Millions
31 December 2019
US$Millions
Summary information for is not adjusted for the percentage ownership held by the Group (unless stated)
Current assets 111.0 153.0
Non-current assets 1,817.3 1,247.3
Total assets 1,928.3 1,400.3
Current liabilities 78.2 270.0
Non-current liabilities 1,059.6 1,059.8
Total liabilities 1,137.8 1,329.8
Net assets (100%) 790.5 70.5
Adjustment for movements between 31 December and 31 March 17.6 (57.4)
less: Non-controlling interests at 31 March (729.6) (29.2)
Net assets attributable to owners of Longroad Energy as at 31 March 78.5 (16.1)
Group's share of net assets at 31 March 31.4 (5.7)
Group's share of net assets at 31 March (NZ$) 44.9 (9.6)
Adjust carrying value to nil at 31 March (NZ$) - 9.6
Carrying value of investment in associate (NZ$) 44.9 -
Revenues 263.4 94.3
Net surplus/(loss) after tax 89.9 6.8
Total other comprehensive income - (10.2)
Longroad's functional currency is United States Dollars (US$) and the summary financial information shown is presented in this currency. The NZD/USD
exchange rates used to convert the summary financial information to the Group's functional currency (NZ$) were 0.6989 (Spot rate) and 0.6711 (Average
rate) (2020: Spot rate 0.5997, Average rate 0.6474).
The summary information provided is taken from the most recent audited annual financial statements of Longroad Energy Holdings, LLC which have a
balance date of 31 December and are reported as at that date. An adjustment to the carrying value of the investment in Longroad Energy was recorded
at 31 March 2020, as under NZ IAS 28 the carrying amount of the investment is not permitted to reduce below zero.

88
Letter of credit facility
Longroad has obtained an uncommitted secured letter of credit facility of up to US$200 million (31 March 2020: US$150 million) from HSBC Bank. Letters of credit under the Facility are on issue to beneficiaries to support the development and continued operations of Longroad. Infratil has provided shareholder backing of the Longroad Letter of Credit facility, specifically, Infratil (and the New Zealand Superannuation Fund) have collectively agreed to meet up to US$200 million of capital calls (i.e. subscribe for additional units) equal to Longroad’s reimbursement obligation in the event that a Letter of Credit is called and Longroad cannot fund the call, taking into account immediately available working capital. As at 31 March 2021, US$121.4 million (Infratil share: US$60.7 million) (31 March 2020: US$113.5 million) in Letters of Credit are on issue under the Longroad Letter of Credit facility.
7 Other investments2021
$Millions2020
$Millions
Australian Social Infrastructure Partners - 33.4
Clearvision Ventures 73.6 30.1
Other 7.3 7.9
Other investments 80.9 71.4
Australian Social Infrastructure Partners At 31 March 2021, Australian Social Infrastructure Partners ("ASIP") is treated as held for sale, refer to note 10.2.
Clearvision Ventures
In February 2016 Infratil made an initial commitment of US$25 million to the California based Clearvision Ventures. An additional commitment of US$25 million was made in May 2020 bringing Infratil's total commitment to US$50 million. The strategic objective is to help Infratil's businesses identify and engage with technology changes that will impact their activities. As at 31 March 2021 Infratil has made total contributions of US$28.1 million (31 March 2020: US$21.0 million), with the remaining US$21.9 million commitment uncalled at that date.
8 Investment in subsidiaries and associatesThe significant companies of the Infratil Group and their activities are shown below. The financial year end of all the significant subsidiaries and associates is 31 March with exceptions noted.
2021Holding
2020Holding Principal Activity
Subsidiaries
New Zealand
Infratil Finance Limited 100.0% 100.0% Finance
Infratil Infrastructure Property Limited 100.0% 100.0% Property
Tilt Renewables Limited 65.5% 65.6% Electricity generation
Trustpower Limited 51.0% 51.0% Electricity generation and utility retailer
Wellington International Airport Limited 66.0% 66.0% Airport
Australia
Qscan Group Holdings Newco Pty (Qscan Group) 56.3% - Diagnostic imaging
Associates
New Zealand
ICN JV Investments Limited (Vodafone) 49.9% 49.9% Telecommunications
Australia
CDC Group Holdings Pty Limited (CDC) 48.08% 48.22% Data Centres
RA (Holdings) 2014 Pty Limited (RetireAustralia) 50.0% 50.0% Retirement Living
United States
Longroad Energy Holdings, LLC (31 December year end) 40.0% 40.0% Renewable Energy Development
Europe
Galileo Green Energy, LLC 40.0% 40.0% Renewable Energy Development

89
9 Acquisition of subsidiaryOn 22 December 2020, Infratil acquired 56.25% of Qscan Group Holdings Pty Limited (subsequently renamed Qscan Intermediary 1 Pty Limited) (‘Qscan Group’), a comprehensive diagnostic imaging practice located in Australia. Infratil invested in conjunction with the Morrison & Co Growth Infrastructure Fund (‘MGIF’) (14.06%) and existing doctor and management shareholders (29.69%). Infratil has determined that Qscan Group is a subsidiary based on its voting equity interest and has therefore consolidated Qscan Group from the acquisition date.
The transaction was settled in cash through a combination of equity contributions and external debt funding, inclusive of transaction costs relating to the acquisition. Infratil’s cash consideration transferred was A$289.6 million. The non-controlling interest is determined by the cash consideration transferred of A$72.6 million from MGIF and A$152.9 million from doctor and management shareholders.
The nature of the holding structure under which Infratil and its investment partners acquired Qscan Group meant that Qscan Intermediary 1 Pty Limited ultimately acquired 100% of the shares in Qscan Group. As a result, NZ IFRS 3 Business Combinations ('NZ IFRS 3') is required to be applied on acquisition. NZ IFRS 3 requires that the identifiable assets and liabilities acquired as part of the business combination are measured at fair value at the date of acquisition, with any gain recognised through the profit and loss and any deficit recognised as goodwill. Acquisition related costs are recognised in the consolidated statement of comprehensive income as incurred.
The fair value of intangible assets acquired (including hospital contracts and brands) has been measured on a provisional basis. The valuation of the brands and hospital contracts will be conducted post finalisation of the 31 March 2021 financial statements and therefore amounts in the financial statements will be reported as provisional. If new information obtained within one year of the date of acquisition about facts and circumstances that existed at the date of acquisition identifies adjustments to the above amounts, or any additional provisions that existed at the date of acquisition, then the accounting for the acquisition will be revised.
Goodwill has been provisionally recognised at fair value on the carrying value of the identifiable assets and liabilities acquired, including intangible assets. The total consideration transferred, including completion cash adjustments, exceeded the fair values of the net assets acquired and the incremental amount paid of $691.3 million has been recognised as goodwill. The initial recognition exemption in NZ IAS 12 has been applied to goodwill and therefore, no deferred tax deduction has been recognised.
Consideration Transferred
The following table summarises the acquisition date fair value of each major class of consideration transferred.
22 December2020
$Millions
Purchase consideration (100%)
Cash consideration paid 550.3
Completion cash adjustment (28.5)
Total Consideration 521.8

90
The following table summarises the recognised amounts of assets acquired, and liabilities assumed at the date of acquisition:
22 December 2020 Fair Value
(Provisional)$Millions
Assets (100%)
Cash and cash equivalents 12.7
Trade and other accounts receivable and prepayments 13.2
Right of use assets 74.6
Intangible assets 19.3
Property, plant and equipment 101.6
Deferred tax asset 7.7
Total assets at fair value 229.1
Liabilities (100%)
Accounts payable, accruals and other liabilities 35.6
Lease liabilities 78.0
Interest bearing loans and borrowings 271.7
Total liabilities at fair value 385.3
Total identifiable assets at fair value (100%) (156.2)
Goodwill arising on acquisition (provisional) 678.0
Foreign exchange movements during the period 13.3
Goodwill at as at 31 March 2021 691.3
Infratil cash consideration 309.6
Non-controlling interest 240.7
Completion cash adjustment (28.5)
Total cash consideration 521.8

10 Discontinued operations and assets held for sale
Notes2021
$Millions2020
$Millions
Summary of results of discontinued operations
Tilt Renewables 10.1 71.6 503.6
ANU Student Accommodation - 66.6
NZ Bus - (69.2)
Perth Energy - (19.4)
Snapper Services - (2.6)
Net surplus from discontinued operations after tax 71.6 479.0
10.1 Tilt RenewablesOn 15 March 2021, Infratil confirmed its support for the acquisition of Tilt Renewables under a Scheme of Arrangement by a consortium comprising Powering Australian Renewables (‘PowAR’) and Mercury NZ Limited (‘Mercury’). Under the Scheme Implementation Agreement (‘SIA’), it is proposed that PowAR will acquire Tilt's Australian business, and Mercury will acquire Tilt's New Zealand business. Under the original proposal, Tilt shareholders were to receive NZ$7.80 per share in cash on completion. Subsequent to balance date, Tilt Renewables announced that it had amended the SIA to increase the scheme consideration to NZ$8.10 per share. As a result of that increase, Infratil’s gross proceeds are expected to be approximately $2,000.2 million. As the carrying amount of the Group’s investment in Tilt is expected to be recovered through a sale transaction, the investment in Tilt has been classified as held for sale and a discontinued operation at 31 March 2021. The comparative consolidated statement of comprehensive income and respective notes have been re-presented to show the discontinued operation separately from continuing operations. As at 31 March 2021 the expected sales proceeds less costs to sell are higher than the carrying amount and as a result no adjustment has been made to the carrying value of Infratil's investment.
2021 $Millions
2020 $Millions
Results of discontinued operation
Revenue 137.4 179.2
Operating expenses 57.3 55.5
Results from operating activities 80.1 123.7
Depreciation (43.9) (76.3)
Net realisations, revaluations, impairments 78.5 502.5
Net financing expense (12.0) (41.4)
Net surplus/(loss) before tax 102.7 508.5
Taxation (expense)/credit (31.1) (4.9)
Net surplus/(loss) from discontinued operation after tax 71.6 503.6
Basic and diluted earnings per share (cents per share) 17.9 78.5
Current assets 2,207.8 1,482.4
Current liabilities 906.7 561.7
Net assets of discontinued operation 1,301.1 920.7
The profit from the discontinued operation is 65.5% attributable to the owners of the Company in line with Infratil's ownership percentage of Tilt Renewables.
Cash flows from/(used in) discontinued operation
Net cash from/(used in) operating activities 34.8 595.6
Net cash from/(used in) investing activities (391.3) (316.6)
Net cash from/(used in) financing activities (34.9) (99.4)
Net cash flows for the year (391.4) 179.6
91
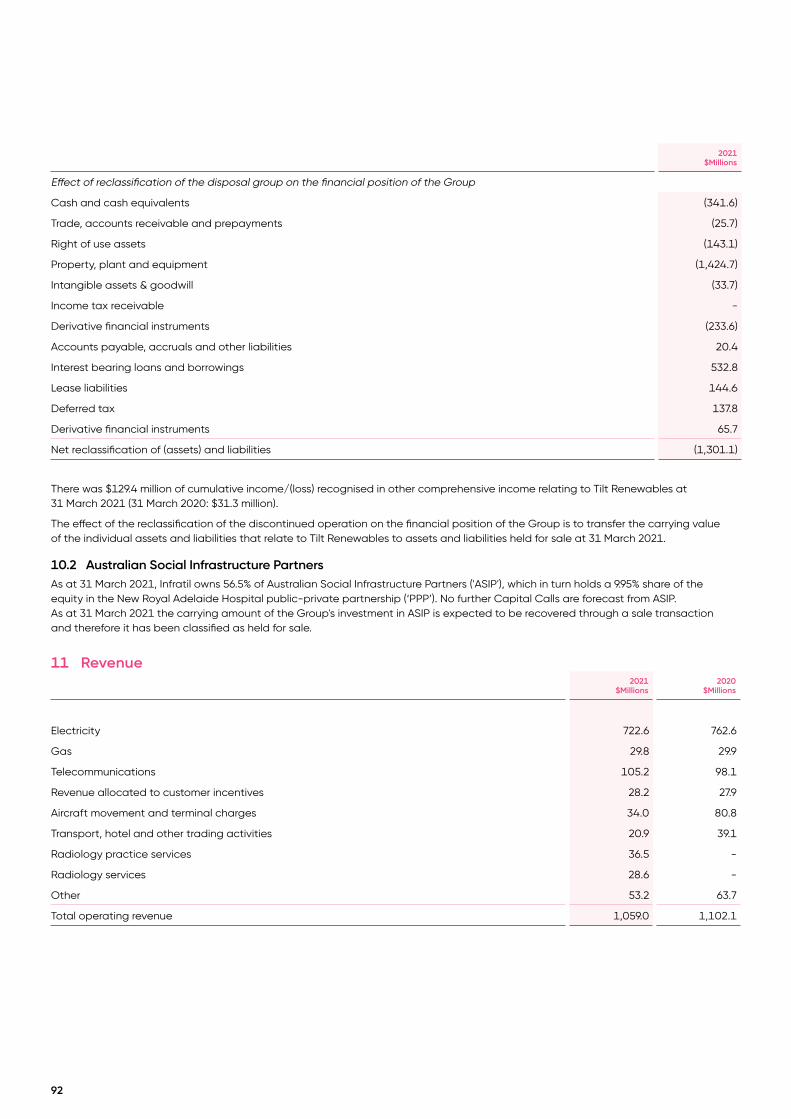
92
2021 $Millions
Effect of reclassification of the disposal group on the financial position of the Group
Cash and cash equivalents (341.6)
Trade, accounts receivable and prepayments (25.7)
Right of use assets (143.1)
Property, plant and equipment (1,424.7)
Intangible assets & goodwill (33.7)
Income tax receivable -
Derivative financial instruments (233.6)
Accounts payable, accruals and other liabilities 20.4
Interest bearing loans and borrowings 532.8
Lease liabilities 144.6
Deferred tax 137.8
Derivative financial instruments 65.7
Net reclassification of (assets) and liabilities (1,301.1)
There was $129.4 million of cumulative income/(loss) recognised in other comprehensive income relating to Tilt Renewables at 31 March 2021 (31 March 2020: $31.3 million).
The effect of the reclassification of the discontinued operation on the financial position of the Group is to transfer the carrying value of the individual assets and liabilities that relate to Tilt Renewables to assets and liabilities held for sale at 31 March 2021.
10.2 Australian Social Infrastructure PartnersAs at 31 March 2021, Infratil owns 56.5% of Australian Social Infrastructure Partners ('ASIP'), which in turn holds a 9.95% share of the equity in the New Royal Adelaide Hospital public-private partnership (‘PPP’). No further Capital Calls are forecast from ASIP. As at 31 March 2021 the carrying amount of the Group's investment in ASIP is expected to be recovered through a sale transaction and therefore it has been classified as held for sale.
11 Revenue 2021
$Millions 2020
$Millions
Electricity 722.6 762.6
Gas 29.8 29.9
Telecommunications 105.2 98.1
Revenue allocated to customer incentives 28.2 27.9
Aircraft movement and terminal charges 34.0 80.8
Transport, hotel and other trading activities 20.9 39.1
Radiology practice services 36.5 -
Radiology services 28.6 -
Other 53.2 63.7
Total operating revenue 1,059.0 1,102.1

93
Revenue Recognition Policies
The nature and timing of the various performance obligations in the Group’s contracts with customers and property leases and when revenue is recognised is outlined below:
Description of performance obligations Timing and satisfaction of performance obligations
Electricity and Gas - Sales to customers
Revenue received or receivable from the sale of electricity and gas to mass market, commercial and industrial customers by Trustpower.
Where Trustpower provides a bundle of services (such as electricity and telecommunications) to a customer and a discount is provided for one of those services, the discount is allocated to each distinct performance obligation based on the relative standalone selling price of those services.
Revenue is recognised at the point in time of supply and customer consumption. Customer consumption of electricity and gas is measured and billed by calendar month for half hourly metered customers and in line with meter reading schedules for non-half hourly metered customers. Accordingly, revenues from electricity and gas sales include an estimated accrual for units sold but not billed at the end of the reporting period for non-half hourly metered customers.
Telecommunications
This category comprises Trustpower’s revenue from the sale of broadband, mobile and other telecommunications services.
Where Trustpower provides a bundle of services (such as electricity and telecommunications) to a customer and a discount is provided for one of those services, the discount is allocated to each distinct performance obligation based on the relative standalone selling price of those services.
Revenue is recognised at the point in time of supply and customer consumption. Generally billed and paid on a monthly billing cycle.
Revenue allocated to customer incentives
Trustpower offers new customers goods, including appliances and modems, as an incentive to enter into a contract for electricity and telecommunications services. These incentives are considered performance obligations in their own right and a proportion of the revenue expected to be received over the contract period is allocated to these physical goods proportionately to their standalone selling price.
Revenue allocated to customer incentives is recognised upon delivery of the goods and a capitalised customer acquisition cost asset is recorded in the statement of financial position. As the customer is invoiced for electricity and telecommunications services over the life of the contract, a portion of this invoiced revenue is allocated to the capitalised customer acquisition cost asset, thereby reducing this asset to zero over the course of the contract term.
Aircraft movement and terminal charges
Aircraft movement and terminal charges consists of Wellington International Airport's airfield income, passenger service charges and terminal service charges.
Airfield income consists of landing charges and aircraft parking charges.
Landing charges and aircraft parking charges are paid by the airlines and recognised as revenue at the point in time the airport facilities are used by the arriving or departing aircraft.
Passenger services charges and terminal service charges relating to arriving, departing and transiting passengers are paid by the airlines and recognised as revenue at the point in time when the passenger travels or the airport facilities are used.
Transport, hotel and other trading activities
Transport, hotel and other trading activities includes Wellington International Airport's hotel and access to the airport’s car parking facilities. This category also includes income from the hotel and carpark owned by Infratil Infrastructure Property Limited.
Revenue from car parking is recognised at the point in time where the utilisation of car parking facilities has been completed.
Revenue from the hotels is recognised at the point in time the service is delivered.
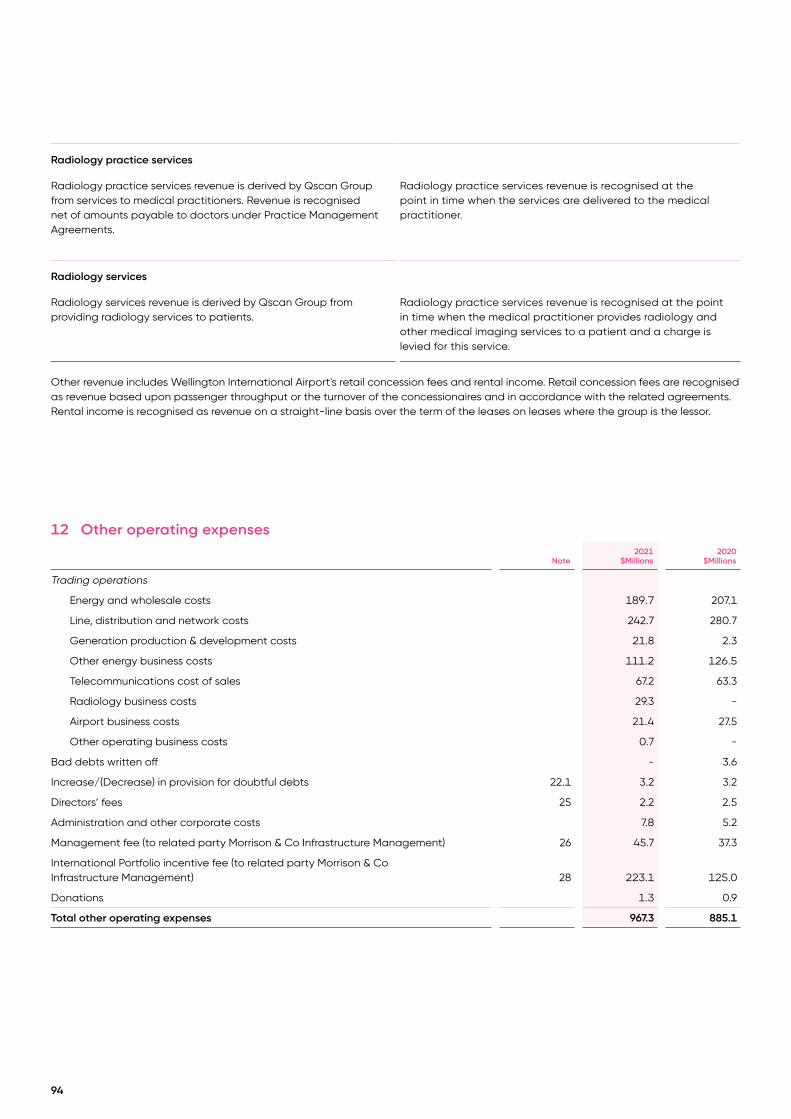
94
Radiology practice services
Radiology practice services revenue is derived by Qscan Group from services to medical practitioners. Revenue is recognised net of amounts payable to doctors under Practice Management Agreements.
Radiology practice services revenue is recognised at the point in time when the services are delivered to the medical practitioner.
Radiology services
Radiology services revenue is derived by Qscan Group from providing radiology services to patients.
Radiology practice services revenue is recognised at the point in time when the medical practitioner provides radiology and other medical imaging services to a patient and a charge is levied for this service.
Other revenue includes Wellington International Airport's retail concession fees and rental income. Retail concession fees are recognised as revenue based upon passenger throughput or the turnover of the concessionaires and in accordance with the related agreements. Rental income is recognised as revenue on a straight-line basis over the term of the leases on leases where the group is the lessor.
12 Other operating expenses
Note2021
$Millions2020
$Millions
Trading operations
Energy and wholesale costs 189.7 207.1
Line, distribution and network costs 242.7 280.7
Generation production & development costs 21.8 2.3
Other energy business costs 111.2 126.5
Telecommunications cost of sales 67.2 63.3
Radiology business costs 29.3 -
Airport business costs 21.4 27.5
Other operating business costs 0.7 -
Bad debts written off - 3.6
Increase/(Decrease) in provision for doubtful debts 22.1 3.2 3.2
Directors’ fees 25 2.2 2.5
Administration and other corporate costs 7.8 5.2
Management fee (to related party Morrison & Co Infrastructure Management) 26 45.7 37.3
International Portfolio incentive fee (to related party Morrison & Co Infrastructure Management) 28 223.1 125.0
Donations 1.3 0.9
Total other operating expenses 967.3 885.1
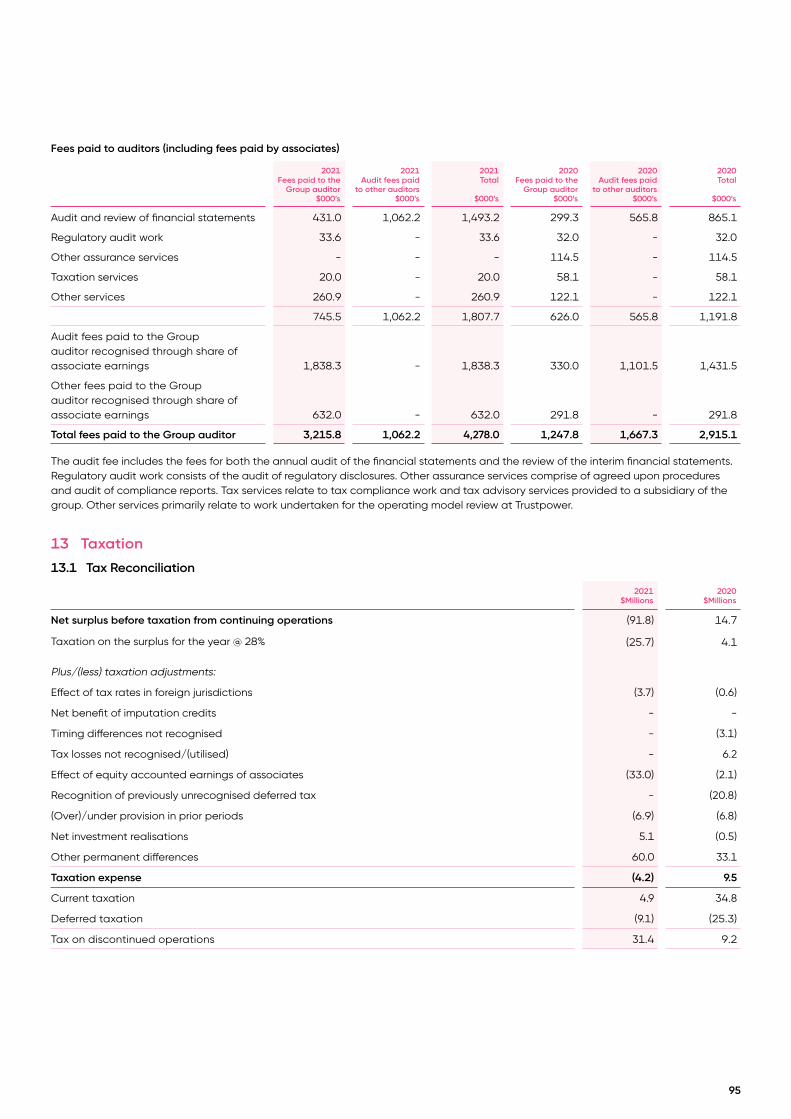
95
Fees paid to auditors (including fees paid by associates)
2021Fees paid to the
Group auditor$000’s
2021 Audit fees paid
to other auditors $000’s
2021Total
$000’s
2020Fees paid to the
Group auditor$000’s
2020Audit fees paid
to other auditors $000’s
2020Total
$000’s
Audit and review of financial statements 431.0 1,062.2 1,493.2 299.3 565.8 865.1
Regulatory audit work 33.6 - 33.6 32.0 - 32.0
Other assurance services - - - 114.5 - 114.5
Taxation services 20.0 - 20.0 58.1 - 58.1
Other services 260.9 - 260.9 122.1 - 122.1
745.5 1,062.2 1,807.7 626.0 565.8 1,191.8
Audit fees paid to the Group auditor recognised through share of associate earnings 1,838.3 - 1,838.3 330.0 1,101.5 1,431.5
Other fees paid to the Group auditor recognised through share of associate earnings 632.0 - 632.0 291.8 - 291.8
Total fees paid to the Group auditor 3,215.8 1,062.2 4,278.0 1,247.8 1,667.3 2,915.1
The audit fee includes the fees for both the annual audit of the financial statements and the review of the interim financial statements. Regulatory audit work consists of the audit of regulatory disclosures. Other assurance services comprise of agreed upon procedures and audit of compliance reports. Tax services relate to tax compliance work and tax advisory services provided to a subsidiary of the group. Other services primarily relate to work undertaken for the operating model review at Trustpower.
13 Taxation
13.1 Tax Reconciliation
2021$Millions
2020$Millions
Net surplus before taxation from continuing operations (91.8) 14.7
Taxation on the surplus for the year @ 28% (25.7) 4.1
Plus/(less) taxation adjustments:
Effect of tax rates in foreign jurisdictions (3.7) (0.6)
Net benefit of imputation credits - -
Timing differences not recognised - (3.1)
Tax losses not recognised/(utilised) - 6.2
Effect of equity accounted earnings of associates (33.0) (2.1)
Recognition of previously unrecognised deferred tax - (20.8)
(Over)/under provision in prior periods (6.9) (6.8)
Net investment realisations 5.1 (0.5)
Other permanent differences 60.0 33.1
Taxation expense (4.2) 9.5
Current taxation 4.9 34.8
Deferred taxation (9.1) (25.3)
Tax on discontinued operations 31.4 9.2
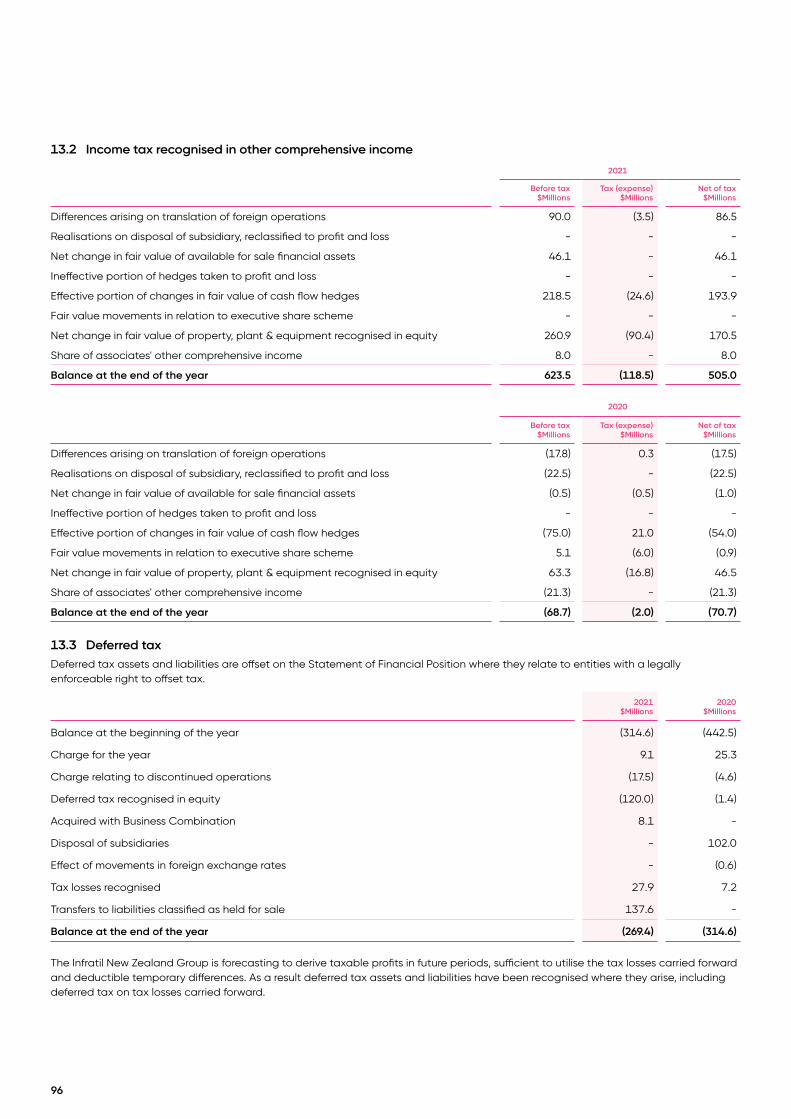
96
13.2 Income tax recognised in other comprehensive income
2021
Before tax$Millions
Tax (expense)$Millions
Net of tax$Millions
Differences arising on translation of foreign operations 90.0 (3.5) 86.5
Realisations on disposal of subsidiary, reclassified to profit and loss - - -
Net change in fair value of available for sale financial assets 46.1 - 46.1
Ineffective portion of hedges taken to profit and loss - - -
Effective portion of changes in fair value of cash flow hedges 218.5 (24.6) 193.9
Fair value movements in relation to executive share scheme - - -
Net change in fair value of property, plant & equipment recognised in equity 260.9 (90.4) 170.5
Share of associates' other comprehensive income 8.0 - 8.0
Balance at the end of the year 623.5 (118.5) 505.0
2020
Before tax$Millions
Tax (expense)$Millions
Net of tax$Millions
Differences arising on translation of foreign operations (17.8) 0.3 (17.5)
Realisations on disposal of subsidiary, reclassified to profit and loss (22.5) - (22.5)
Net change in fair value of available for sale financial assets (0.5) (0.5) (1.0)
Ineffective portion of hedges taken to profit and loss - - -
Effective portion of changes in fair value of cash flow hedges (75.0) 21.0 (54.0)
Fair value movements in relation to executive share scheme 5.1 (6.0) (0.9)
Net change in fair value of property, plant & equipment recognised in equity 63.3 (16.8) 46.5
Share of associates' other comprehensive income (21.3) - (21.3)
Balance at the end of the year (68.7) (2.0) (70.7)
13.3 Deferred taxDeferred tax assets and liabilities are offset on the Statement of Financial Position where they relate to entities with a legally enforceable right to offset tax.
2021$Millions
2020$Millions
Balance at the beginning of the year (314.6) (442.5)
Charge for the year 9.1 25.3
Charge relating to discontinued operations (17.5) (4.6)
Deferred tax recognised in equity (120.0) (1.4)
Acquired with Business Combination 8.1 -
Disposal of subsidiaries - 102.0
Effect of movements in foreign exchange rates - (0.6)
Tax losses recognised 27.9 7.2
Transfers to liabilities classified as held for sale 137.6 -
Balance at the end of the year (269.4) (314.6)
The Infratil New Zealand Group is forecasting to derive taxable profits in future periods, sufficient to utilise the tax losses carried forward and deductible temporary differences. As a result deferred tax assets and liabilities have been recognised where they arise, including deferred tax on tax losses carried forward.

97
13.4 Recognised deferred tax assets and liabilities
Assets $Millions
Liabilities$Millions
Net$Millions
31 March 2021
Property, plant and equipment - (339.0) (339.0)
Investment properties - (4.1) (4.1)
Derivative financial instruments 4.7 (17.7) (13.0)
Employee benefits 7.8 - 7.8
Customer base assets - (2.1) (2.1)
Provisions 2.4 - 2.4
Tax losses carried forward 80.0 - 80.0
Other items 35.1 (36.5) (1.4)
Total 130.0 (399.4) (269.4)
31 March 2020
Property, plant and equipment - (372.5) (372.5)
Investment properties - (4.3) (4.3)
Derivative financial instruments 46.7 - 46.7
Employee benefits 5.4 - 5.4
Customer base assets - (2.4) (2.4)
Provisions 1.3 - 1.3
Tax losses carried forward 38.8 - 38.8
Other items (2.4) (25.2) (27.6)
Total 89.8 (404.4) (314.6)
13.5 Changes in temporary differences affecting tax expense
Tax expense Other comprehensive income
2021$Millions
2020 $Millions
2021$Millions
2020$Millions
Property, plant and equipment 0.1 19.9 (0.3) 45.0
Investment properties 0.2 10.6 - -
Derivative financial instruments (5.1) - (24.6) 52.0
Employee benefits (1.1) (0.1) - (0.5)
Customer base assets 0.4 0.4 - -
Provisions (0.1) 0.5 - -
Tax losses carried forward 16.5 (10.6) - -
Other items (1.8) 4.6 (3.5) 3.6
9.1 25.3 (28.4) 100.1
13.6 Imputation credits available to be used by Infratil Limited2021
$Millions2020
$Millions
Balance at the end of the year 14.2 9.9
Imputation credits that will arise on the payment/(refund) of tax provided for - -
Imputation credits that will arise on the (payment)/receipt of dividends accrued at year end - -
Imputation credits available for use 14.2 9.9
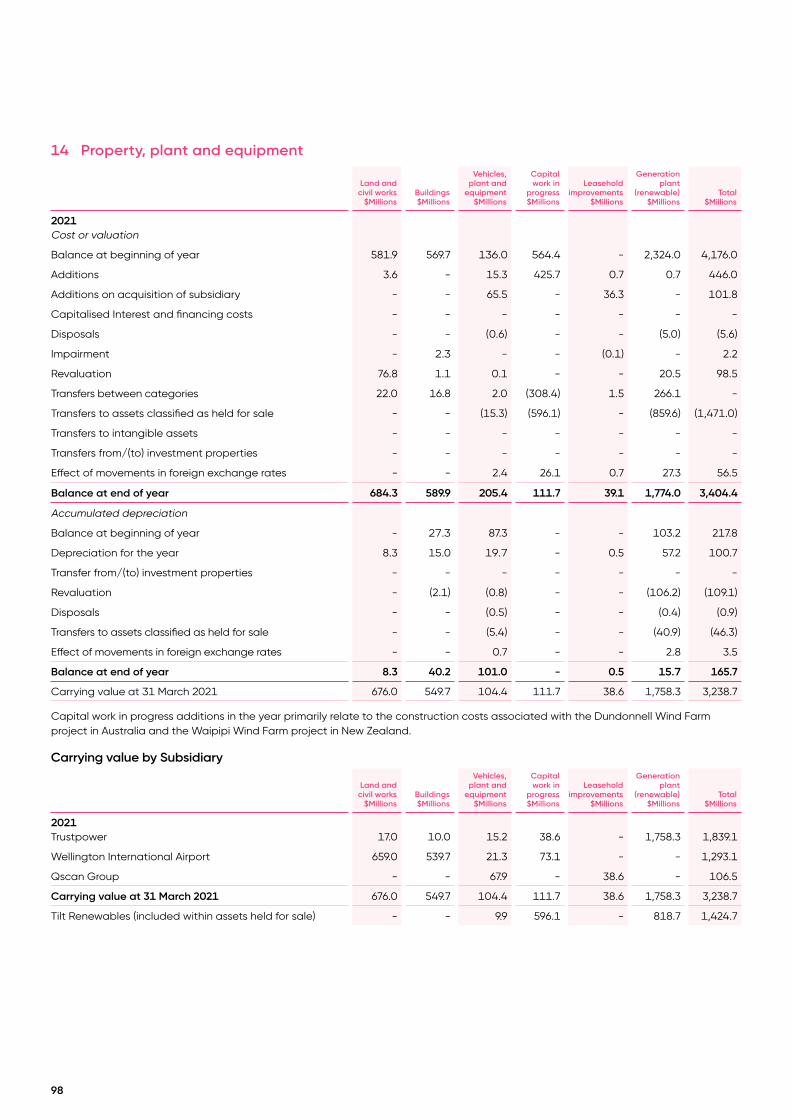
98
14 Property, plant and equipment
Land and civil works
$MillionsBuildings$Millions
Vehicles, plant and
equipment$Millions
Capital work in
progress$Millions
Leasehold improvements
$Millions
Generation plant
(renewable)$Millions
Total$Millions
2021Cost or valuation
Balance at beginning of year 581.9 569.7 136.0 564.4 - 2,324.0 4,176.0
Additions 3.6 - 15.3 425.7 0.7 0.7 446.0
Additions on acquisition of subsidiary - - 65.5 - 36.3 - 101.8
Capitalised Interest and financing costs - - - - - - -
Disposals - - (0.6) - - (5.0) (5.6)
Impairment - 2.3 - - (0.1) - 2.2
Revaluation 76.8 1.1 0.1 - - 20.5 98.5
Transfers between categories 22.0 16.8 2.0 (308.4) 1.5 266.1 -
Transfers to assets classified as held for sale - - (15.3) (596.1) - (859.6) (1,471.0)
Transfers to intangible assets - - - - - - -
Transfers from/(to) investment properties - - - - - - -
Effect of movements in foreign exchange rates - - 2.4 26.1 0.7 27.3 56.5
Balance at end of year 684.3 589.9 205.4 111.7 39.1 1,774.0 3,404.4
Accumulated depreciation
Balance at beginning of year - 27.3 87.3 - - 103.2 217.8
Depreciation for the year 8.3 15.0 19.7 - 0.5 57.2 100.7
Transfer from/(to) investment properties - - - - - - -
Revaluation - (2.1) (0.8) - - (106.2) (109.1)
Disposals - - (0.5) - - (0.4) (0.9)
Transfers to assets classified as held for sale - - (5.4) - - (40.9) (46.3)
Effect of movements in foreign exchange rates - - 0.7 - - 2.8 3.5
Balance at end of year 8.3 40.2 101.0 - 0.5 15.7 165.7
Carrying value at 31 March 2021 676.0 549.7 104.4 111.7 38.6 1,758.3 3,238.7
Capital work in progress additions in the year primarily relate to the construction costs associated with the Dundonnell Wind Farm project in Australia and the Waipipi Wind Farm project in New Zealand.
Carrying value by Subsidiary
Land and civil works
$MillionsBuildings$Millions
Vehicles, plant and
equipment$Millions
Capital work in
progress$Millions
Leasehold improvements
$Millions
Generation plant
(renewable)$Millions
Total$Millions
2021Trustpower 17.0 10.0 15.2 38.6 - 1,758.3 1,839.1
Wellington International Airport 659.0 539.7 21.3 73.1 - - 1,293.1
Qscan Group - - 67.9 - 38.6 - 106.5
Carrying value at 31 March 2021 676.0 549.7 104.4 111.7 38.6 1,758.3 3,238.7
Tilt Renewables (included within assets held for sale) - - 9.9 596.1 - 818.7 1,424.7

99
Land and civil works
$MillionsBuildings$Millions
Vehicles, plant and
equipment$Millions
Capital work in
progress$Millions
Metering$Millions
Generation plant
(renewable)$Millions
Total$Millions
2020
Trustpower 17.0 10.2 18.0 21.1 - 1,770.5 1,836.4
Tilt Renewables - - 9.8 454.1 - 450.7 915.4
Wellington International Airport 564.9 532.2 20.1 89.2 - - 1,206.4
Carrying value at 31 March 2020 581.9 542.4 48.7 564.4 - 2,220.8 3,958.2
Land and civil works
$MillionsBuildings$Millions
Vehicles, plant and
equipment$Millions
Capital work in
progress$Millions
Metering$Millions
Generation plant
(renewable)$Millions
Total$Millions
2020
Cost or valuation
Balance at beginning of year 585.6 551.7 132.4 169.2 67.6 2,961.1 4,467.6
Additions 0.4 - - 520.7 - - 521.1
Additions on acquisition of subsidiary - - - - - - -
Capitalised Interest and financing costs - - - - - - -
Disposals - - (14.4) - (69.5) (623.7) (707.6)
Impairment - (4.4) - (3.6) - (5.6) (13.6)
Revaluation (12.1) 14.7 - - - (5.1) (2.5)
Transfers between categories 24.4 12.6 18.3 (79.6) 1.9 22.0 (0.4)
Transfers to assets classified as held for sale - - - - - - -
Transfer to right of use assets on transition to NZ IFRS 16 - - - - - (23.8) (23.8)
Transfers to intangible assets - - - (0.5) - - (0.5)
Transfers from/(to) investment properties (16.4) (4.9) - (32.4) - - (53.7)
Effect of movements in foreign exchange rates - - (0.3) (9.4) - (0.9) (10.6)
Balance at end of year 581.9 569.7 136.0 564.4 - 2,324.0 4,176.0
Accumulated depreciation
Balance at beginning of year 22.8 13.7 86.5 - 67.0 76.1 266.1
Depreciation for the year 8.0 14.3 14.1 - 0.8 84.5 121.7
Transfer to investment properties - (0.7) - - - - (0.7)
Revaluation (30.8) - - - - (16.3) (47.1)
Disposals - - (13.2) - (67.8) (39.8) (120.8)
Transfers to assets classified as held for sale - - - - - - -
Transfer to right of use assets on transition to NZ IFRS 16 - - - - - (0.7) (0.7)
Effect of movements in foreign exchange rates - - (0.1) - - (0.6) (0.7)
Balance at end of year - 27.3 87.3 - - 103.2 217.8
Carrying value at 31 March 2020 581.9 542.4 48.7 564.4 - 2,220.8 3,958.2
Carrying value by Subsidiary
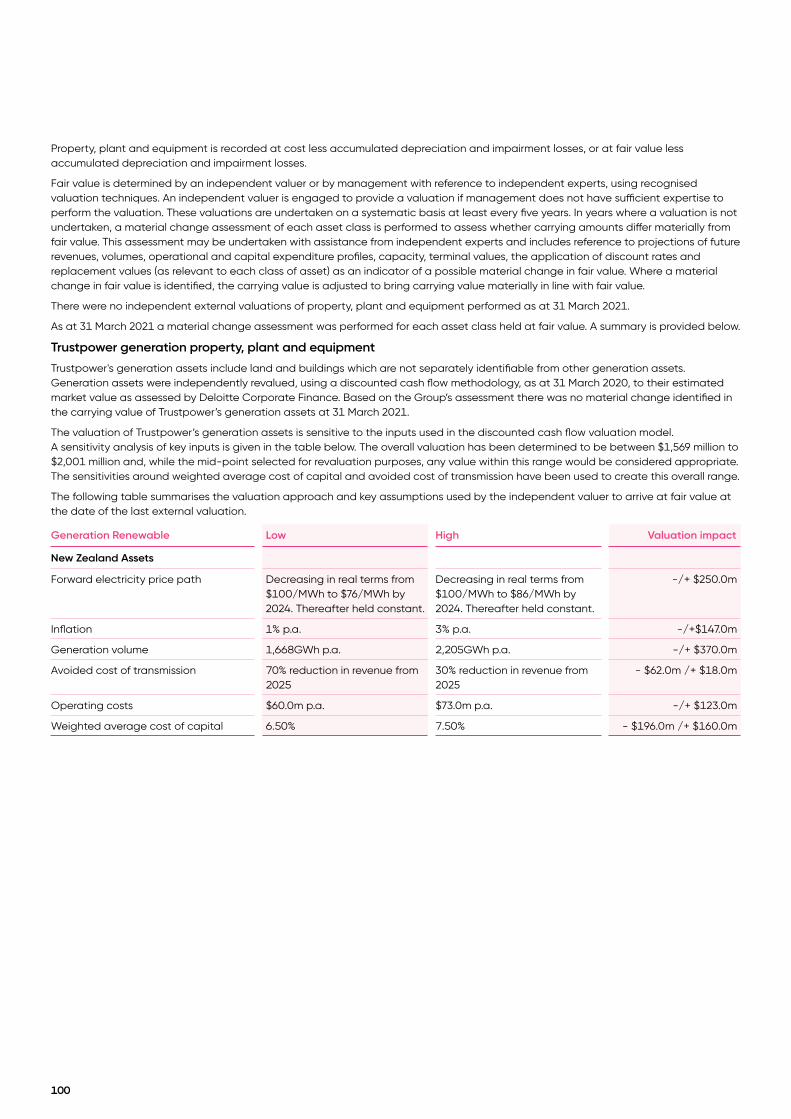
Property, plant and equipment is recorded at cost less accumulated depreciation and impairment losses, or at fair value less accumulated depreciation and impairment losses.
Fair value is determined by an independent valuer or by management with reference to independent experts, using recognised valuation techniques. An independent valuer is engaged to provide a valuation if management does not have sufficient expertise to perform the valuation. These valuations are undertaken on a systematic basis at least every five years. In years where a valuation is not undertaken, a material change assessment of each asset class is performed to assess whether carrying amounts differ materially from fair value. This assessment may be undertaken with assistance from independent experts and includes reference to projections of future revenues, volumes, operational and capital expenditure profiles, capacity, terminal values, the application of discount rates and replacement values (as relevant to each class of asset) as an indicator of a possible material change in fair value. Where a material change in fair value is identified, the carrying value is adjusted to bring carrying value materially in line with fair value.
There were no independent external valuations of property, plant and equipment performed as at 31 March 2021.
As at 31 March 2021 a material change assessment was performed for each asset class held at fair value. A summary is provided below.
Trustpower generation property, plant and equipment
Trustpower's generation assets include land and buildings which are not separately identifiable from other generation assets. Generation assets were independently revalued, using a discounted cash flow methodology, as at 31 March 2020, to their estimated market value as assessed by Deloitte Corporate Finance. Based on the Group’s assessment there was no material change identified in the carrying value of Trustpower’s generation assets at 31 March 2021.
The valuation of Trustpower’s generation assets is sensitive to the inputs used in the discounted cash flow valuation model. A sensitivity analysis of key inputs is given in the table below. The overall valuation has been determined to be between $1,569 million to $2,001 million and, while the mid-point selected for revaluation purposes, any value within this range would be considered appropriate. The sensitivities around weighted average cost of capital and avoided cost of transmission have been used to create this overall range.
The following table summarises the valuation approach and key assumptions used by the independent valuer to arrive at fair value at the date of the last external valuation.
Generation Renewable Low High Valuation impact
New Zealand Assets
Forward electricity price path Decreasing in real terms from $100/MWh to $76/MWh by 2024. Thereafter held constant.
Decreasing in real terms from $100/MWh to $86/MWh by 2024. Thereafter held constant.
-/+ $250.0m
Inflation 1% p.a. 3% p.a. -/+$147.0m
Generation volume 1,668GWh p.a. 2,205GWh p.a. -/+ $370.0m
Avoided cost of transmission 70% reduction in revenue from 2025
30% reduction in revenue from 2025
- $62.0m /+ $18.0m
Operating costs $60.0m p.a. $73.0m p.a. -/+ $123.0m
Weighted average cost of capital 6.50% 7.50% - $196.0m /+ $160.0m
100
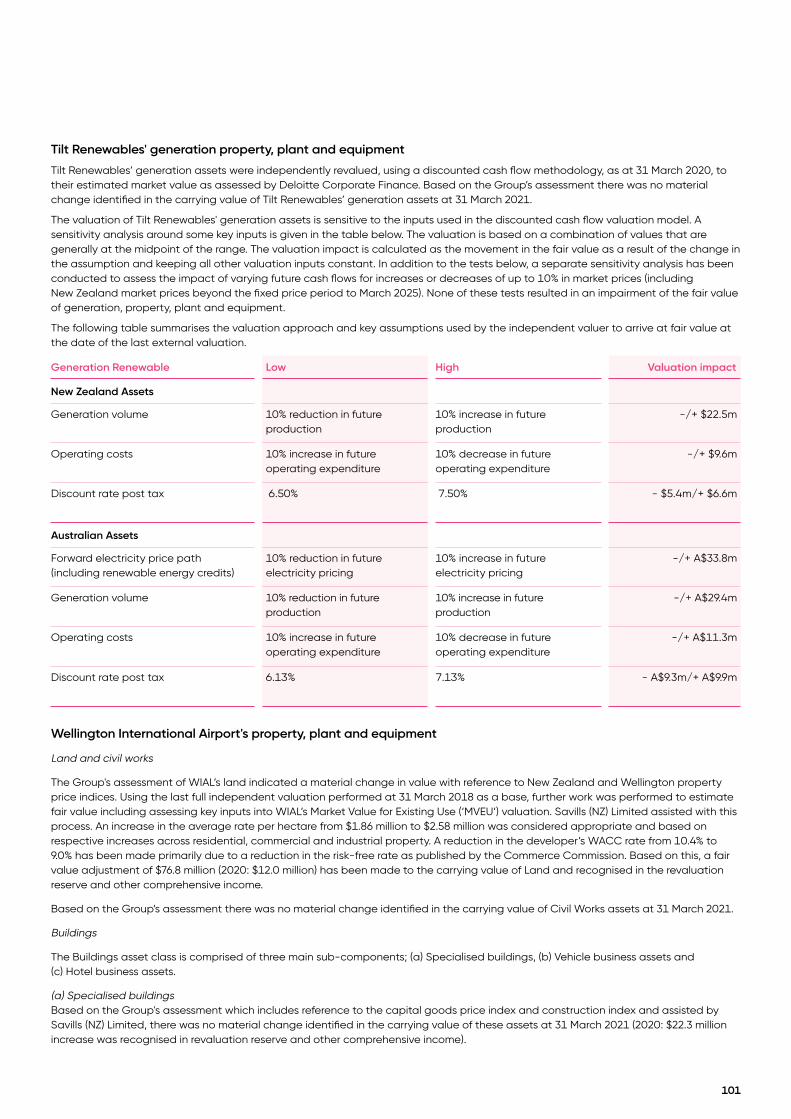
Tilt Renewables' generation property, plant and equipment
Tilt Renewables’ generation assets were independently revalued, using a discounted cash flow methodology, as at 31 March 2020, to their estimated market value as assessed by Deloitte Corporate Finance. Based on the Group’s assessment there was no material change identified in the carrying value of Tilt Renewables’ generation assets at 31 March 2021.
The valuation of Tilt Renewables' generation assets is sensitive to the inputs used in the discounted cash flow valuation model. A sensitivity analysis around some key inputs is given in the table below. The valuation is based on a combination of values that are generally at the midpoint of the range. The valuation impact is calculated as the movement in the fair value as a result of the change in the assumption and keeping all other valuation inputs constant. In addition to the tests below, a separate sensitivity analysis has been conducted to assess the impact of varying future cash flows for increases or decreases of up to 10% in market prices (including New Zealand market prices beyond the fixed price period to March 2025). None of these tests resulted in an impairment of the fair value of generation, property, plant and equipment.
The following table summarises the valuation approach and key assumptions used by the independent valuer to arrive at fair value at the date of the last external valuation.
Generation Renewable Low High Valuation impact
New Zealand Assets
Generation volume 10% reduction in future production
10% increase in future production
-/+ $22.5m
Operating costs 10% increase in future operating expenditure
10% decrease in future operating expenditure
-/+ $9.6m
Discount rate post tax 6.50% 7.50% - $5.4m/+ $6.6m
Australian Assets
Forward electricity price path(including renewable energy credits)
10% reduction in future electricity pricing
10% increase in future electricity pricing
-/+ A$33.8m
Generation volume 10% reduction in future production
10% increase in future production
-/+ A$29.4m
Operating costs 10% increase in future operating expenditure
10% decrease in future operating expenditure
-/+ A$11.3m
Discount rate post tax 6.13% 7.13% - A$9.3m/+ A$9.9m
Wellington International Airport's property, plant and equipment
Land and civil works
The Group's assessment of WIAL’s land indicated a material change in value with reference to New Zealand and Wellington property price indices. Using the last full independent valuation performed at 31 March 2018 as a base, further work was performed to estimate fair value including assessing key inputs into WIAL’s Market Value for Existing Use (‘MVEU’) valuation. Savills (NZ) Limited assisted with this process. An increase in the average rate per hectare from $1.86 million to $2.58 million was considered appropriate and based on respective increases across residential, commercial and industrial property. A reduction in the developer’s WACC rate from 10.4% to 9.0% has been made primarily due to a reduction in the risk-free rate as published by the Commerce Commission. Based on this, a fair value adjustment of $76.8 million (2020: $12.0 million) has been made to the carrying value of Land and recognised in the revaluation reserve and other comprehensive income.
Based on the Group’s assessment there was no material change identified in the carrying value of Civil Works assets at 31 March 2021.
Buildings
The Buildings asset class is comprised of three main sub-components; (a) Specialised buildings, (b) Vehicle business assets and (c) Hotel business assets.
(a) Specialised buildings Based on the Group's assessment which includes reference to the capital goods price index and construction index and assisted by Savills (NZ) Limited, there was no material change identified in the carrying value of these assets at 31 March 2021 (2020: $22.3 million increase was recognised in revaluation reserve and other comprehensive income).
101
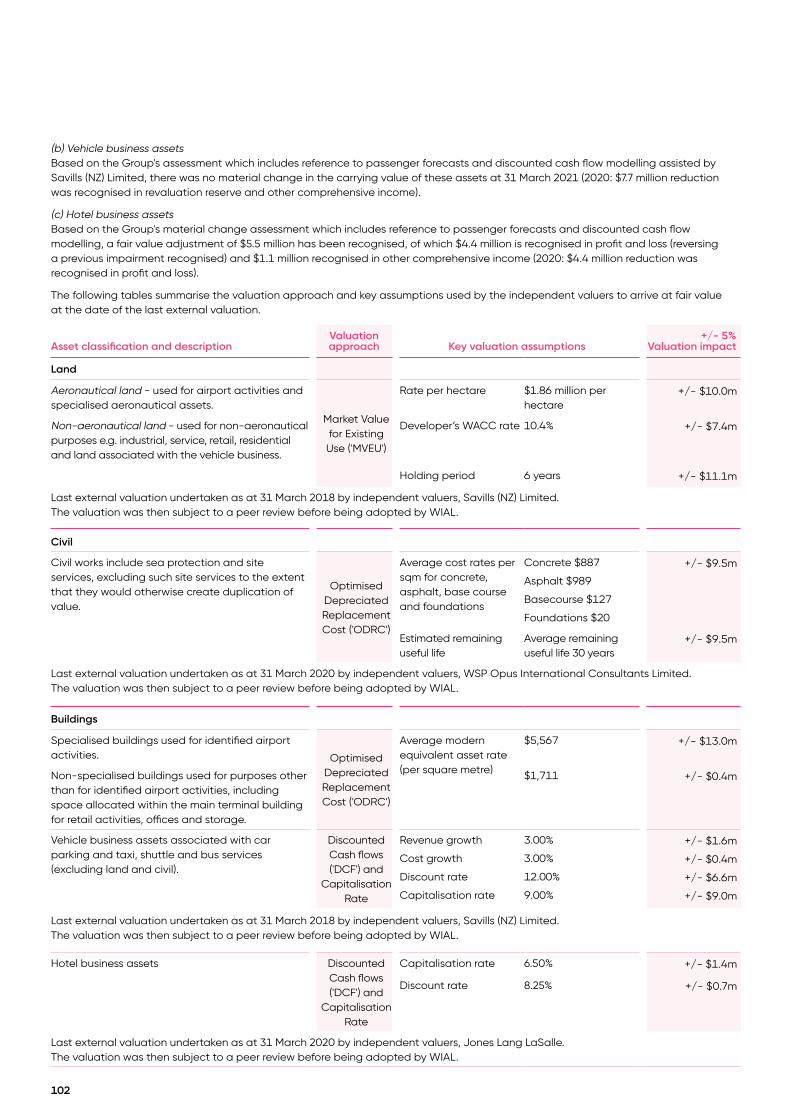
(b) Vehicle business assets Based on the Group's assessment which includes reference to passenger forecasts and discounted cash flow modelling assisted by Savills (NZ) Limited, there was no material change in the carrying value of these assets at 31 March 2021 (2020: $7.7 million reduction was recognised in revaluation reserve and other comprehensive income).
(c) Hotel business assets Based on the Group's material change assessment which includes reference to passenger forecasts and discounted cash flow modelling, a fair value adjustment of $5.5 million has been recognised, of which $4.4 million is recognised in profit and loss (reversing a previous impairment recognised) and $1.1 million recognised in other comprehensive income (2020: $4.4 million reduction was recognised in profit and loss).
The following tables summarise the valuation approach and key assumptions used by the independent valuers to arrive at fair value at the date of the last external valuation.
Asset classification and descriptionValuation approach Key valuation assumptions
+/- 5%Valuation impact
Land
Aeronautical land - used for airport activities and specialised aeronautical assets.
Market Value for Existing Use ('MVEU')
Rate per hectare $1.86 million per hectare
+/- $10.0m
Non-aeronautical land - used for non-aeronautical purposes e.g. industrial, service, retail, residential and land associated with the vehicle business.
Developer’s WACC rate 10.4% +/- $7.4m
Holding period 6 years +/- $11.1m
Last external valuation undertaken as at 31 March 2018 by independent valuers, Savills (NZ) Limited. The valuation was then subject to a peer review before being adopted by WIAL.
Civil
Civil works include sea protection and site services, excluding such site services to the extent that they would otherwise create duplication of value.
Optimised Depreciated Replacement Cost ('ODRC')
Average cost rates per sqm for concrete, asphalt, base course and foundations
Concrete $887
Asphalt $989
Basecourse $127
Foundations $20
+/- $9.5m
Estimated remaining useful life
Average remaining useful life 30 years
+/- $9.5m
Last external valuation undertaken as at 31 March 2020 by independent valuers, WSP Opus International Consultants Limited. The valuation was then subject to a peer review before being adopted by WIAL.
Buildings
Specialised buildings used for identified airport activities. Optimised
Depreciated Replacement Cost ('ODRC')
Average modern equivalent asset rate (per square metre)
$5,567 +/- $13.0m
Non-specialised buildings used for purposes other than for identified airport activities, including space allocated within the main terminal building for retail activities, offices and storage.
$1,711 +/- $0.4m
Vehicle business assets associated with car parking and taxi, shuttle and bus services (excluding land and civil).
Discounted Cash flows ('DCF') and
Capitalisation Rate
Revenue growth
Cost growth
Discount rate
Capitalisation rate
3.00%
3.00%
12.00%
9.00%
+/- $1.6m
+/- $0.4m
+/- $6.6m
+/- $9.0m
Last external valuation undertaken as at 31 March 2018 by independent valuers, Savills (NZ) Limited. The valuation was then subject to a peer review before being adopted by WIAL.
Hotel business assets Discounted Cash flows ('DCF') and
Capitalisation Rate
Capitalisation rate 6.50% +/- $1.4m
Discount rate 8.25% +/- $0.7m
Last external valuation undertaken as at 31 March 2020 by independent valuers, Jones Lang LaSalle. The valuation was then subject to a peer review before being adopted by WIAL.
102

Effect of level 3 fair value measurements on profit or loss and other comprehensive incomeThe following table summarises for property, plant and equipment measured at fair value, classified as level 3 in the fair value hierarchy, the effect of the fair value movements on profit or loss and other comprehensive income for the year.
2021 Level 3 fair value movements
Recognised in profit or loss
$Millions
Recognised in OCI
$MillionsTotal
$Millions
Generation plant (renewable) - 20.5 20.5
Land and civil works - 76.8 76.8
Buildings 4.4 1.1 5.5
4.4 98.4 102.8
2020 Level 3 fair value movements
Recognised in profit or loss
$Millions
Recognised in OCI
$MillionsTotal
$Millions
Generation plant (renewable) (5.6) 11.2 5.6
Land and civil works - 18.7 18.7
Buildings (4.4) 14.7 10.3
(10.0) 44.6 34.6
There were no transfers between property, plant and equipment assets classified as level 1 or level 2, and level 3 of the fair value hierarchy during the year ended 31 March 2021 (2020: none).
Revalued assets at deemed cost
For each revalued class the carrying amount that would have been recognised had the assets been carried on a historical cost basis are as follows:
2021Cost
$Millions
Assets under construction
$Millions
Accumulated depreciation
$MillionsNet book value
$Millions
Generation plant (renewable) 1,022.1 33.9 (289.1) 766.9
Land and civil works 309.9 25.2 (59.9) 275.2
Buildings 555.9 24.2 (169.7) 410.4
1,887.9 83.3 (518.7) 1,452.5
2020Cost
$Millions
Assets under construction
$Millions
Accumulated depreciation
$MillionsNet book value
$Millions
Generation plant (renewable) 678.9 - (107.4) 571.5
Land and civil works 285.5 24.4 (55.2) 254.7
Buildings 409.3 12.5 (101.4) 320.4
1,373.7 36.9 (264.0) 1,146.6
103

15 Investment properties
2021
Owned property $Millions
Right of use assets
$MillionsTotal
$Millions
Balance at beginning of year 184.5 82.2 266.7
Additions 16.1 - 16.1
Disposals (34.8) - (34.8)
Investment properties revaluation net increase/(decrease) 12.2 (0.1) 12.1
Balance at end of year 178.0 82.1 260.1
2020
Owned property $Millions
Right of use assets
$MillionsTotal
$Millions
Balance at beginning of year 86.5 - 86.5
Adoption of NZ IFRS 16 - 80.5 80.5
Additions 25.2 1.7 26.9
Transfers from/(to) property, plant and equipment 53.0 - 53.0
Investment properties revaluation net increase/(decrease) 19.8 - 19.8
Balance at end of year 184.5 82.2 266.7
Where a lease pertains to property held to earn rental income, the right of use asset is included within Investment properties and is measured at fair value. Rental income from investment properties of $13.4 million was recognised in profit or loss during the year (2020: $10.8 million). Direct operating expenses arising from investment properties of $1.7 million were also recognised in profit or loss during the year (2020: $1.4 million).
Wellington International Airport's investment property was valued at 31 March 2021 by Jones Lang LaSalle, registered valuers, at $86.1 million (2020: $81.2 million). Infratil Infrastructure Property Limited's ('IIPL') investment property was valued at 31 March 2021 by Jones Lang LaSalle, registered valuers, at $91.9 million (2020: $49.5 million). There were no capital works in progress included in investment properties at 31 March 2021 (2020: $53.8 million). During the period, the Kilbirnie bus depot was sold for $34.8 million net of transaction costs.
104

2020
Land and Buildings
$Millions
Generation Assets
$Millions
Plant and equipment
$MillionsTotal
$Millions
Cost
Balance at beginning of year - - - -
Adoption of NZ IFRS 16 54.6 22.5 2.0 79.1
Additions - 94.0 10.2 104.2
Disposals (8.8) - - (8.8)
Effect of movements in exchange rates (0.2) (2.7) - (2.9)
Balance at end of year 45.6 113.8 12.2 171.6
Accumulated depreciation -
Balance at beginning of year - - - -
Depreciation for the year 4.3 1.3 4.8 10.4
Effect of movements in exchange rates - - - -
Balance at end of year 4.3 1.3 4.8 10.4
Carrying value at 31 March 2020 41.3 112.5 7.4 161.2
16 Leases
16.1 Right of use assetsRight of use assets related to leased assets that do not meet the definition of investment properties are summarised below. Land and buildings right of use assets include land held under ground leases and rental of office space. Tilt Renewables' generation right of use assets, comprising leases of transmission lines at the Salt Creek and Dundonnell Wind Farms have been transferred to assets held for sale as at 31 March 2021.
2021
Land and Buildings
$Millions
Generation Assets
$Millions
Plant and equipment
$MillionsTotal
$Millions
Cost
Balance at beginning of year 45.6 113.8 12.2 171.6
Additions 20.1 5.2 6.0 31.3
Additions on acquisition of subsidiary 74.8 - - 74.8
Effect of movements in exchange rates 2.7 7.0 - 9.7
Transfers to assets held for sale (25.7) (126.0) - (151.7)
Balance at end of year 117.5 - 18.2 135.7
Accumulated depreciation
Balance at beginning of year 4.3 1.3 4.8 10.4
Depreciation for the year 7.3 4.2 6.4 17.9
Effect of movements in exchange rates 0.2 0.2 - 0.4
Transfers to assets held for sale (2.8) (5.7) - (8.5)
Balance at end of year 9.0 - 11.2 20.2
Carrying value at 31 March 2021 108.5 - 7.0 115.5
105

16.2 Lease liabilities
2021$Millions
2020$Millions
Maturity analysis - contractual undiscounted cash flows
Between 0 to 1 year 26.5 24.4
Between 1 to 2 years 48.7 31.7
Between 2 to 5 years 49.9 58.9
More than 5 years 269.7 514.6
Total undiscounted lease liabilities 394.8 629.6
2021$Millions
2020$Millions
Lease liabilities included in the statement of financial position Split as follows:
Current 20.3 21.8
Non-current 182.3 225.1
202.6 246.9
2021$Millions
2020$Millions
Amounts recognised in the consolidated statement of comprehensive income
Interest on lease liabilities 15.8 10.8
Variable lease payments not included in the measurement of lease liabilities - 2.4
Expenses relating to short-term leases - 0.7
Expenses relating to leases of low-value assets, excluding short-term leases of low-value assets 0.4 0.3
The weighted average incremental borrowing cost applied to lease liabilities at 1 April 2020 was 4.54% (2020: 4.93%). Total cash outflow for leases for the year ended 31 March 2021 was $30.8 million (2020: $17.1 million).
16.3 Leases as a lessor
The Group has receivables from operating leases relating to the lease of premises. The following table sets out a maturity analysis of lease payments, showing the undiscounted lease payments to be received after the reporting date.
2021$Millions
2020$Millions
Operating lease receivables as lessor
Between 0 to 1 year 17.7 30.6
Between 1 to 2 years 13.6 25.8
Between 2 to 5 years 29.3 40.8
More than 5 years 55.1 60.0
Total undiscounted lease payments 115.7 157.2
106

17 Goodwill2021
$Millions2020
$Millions
Balance at beginning of the year 113.1 117.4
Goodwill arising on acquisitions 691.3 -
Goodwill disposed of during the year - (4.3)
Goodwill impaired during the year - -
Transfers to disposal group assets classified as held for sale (33.7) -
Balance at the end of the year 770.7 113.1
The aggregate carrying amounts of goodwill allocated to each cash generating unit are as follows:
Trustpower 79.4 79.4
Tilt Renewables - 33.7
Qscan Group 691.3 -
770.7 113.1
The acquisition of Qscan Group was completed on 22 December 2020, increasing the carrying value of goodwill to $770.7 million (31 March 2020: $113.1 million). Further detail on the acquisition is outlined at Note 9.
The carrying value of goodwill is subject to an annual impairment test to ensure the carrying value does not exceed the recoverable amount at balance date. In determining whether there are any indicators of impairment the fair value of the Company's investments in Trustpower and Tilt Renewables are assessed with reference to the market share price quoted on the NZX at each reporting date. The determination of any indicators of impairment in the fair value of Qscan Group's goodwill has been assessed at 31 March 2021 by evaluating the conditions and events specific to the Group that may be indicative of impairment triggers. This being the first period of operations and having acquired the business on 22 December 2020, recoverable amounts have been assessed by comparing the actual earnings since acquisition with the forecasted earnings used to determine the fair value of the business at acquisition. The acquired business is performing in line with these forecasts.
As at 31 March 2021 there were no indicators of impairment (31 March 2020: there were no indicators of impairment).
107
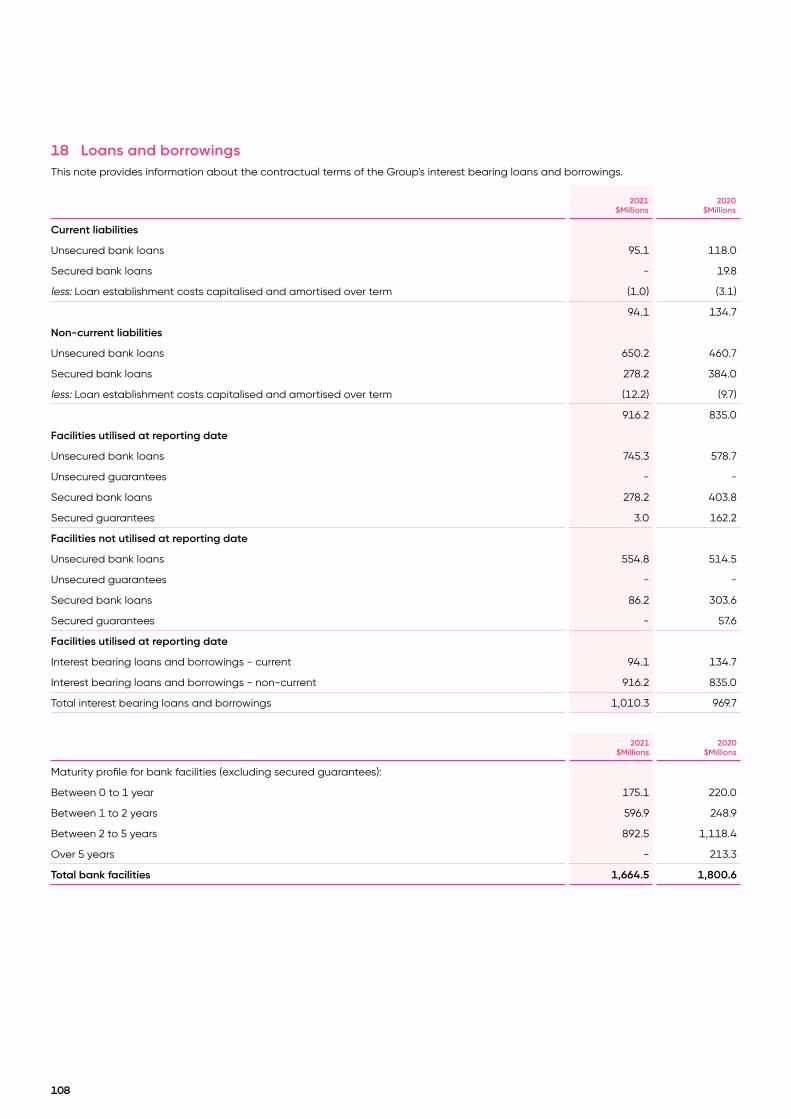
18 Loans and borrowingsThis note provides information about the contractual terms of the Group's interest bearing loans and borrowings.
2021$Millions
2020$Millions
Current liabilities
Unsecured bank loans 95.1 118.0
Secured bank loans - 19.8
less: Loan establishment costs capitalised and amortised over term (1.0) (3.1)
94.1 134.7
Non-current liabilities
Unsecured bank loans 650.2 460.7
Secured bank loans 278.2 384.0
less: Loan establishment costs capitalised and amortised over term (12.2) (9.7)
916.2 835.0
Facilities utilised at reporting date
Unsecured bank loans 745.3 578.7
Unsecured guarantees - -
Secured bank loans 278.2 403.8
Secured guarantees 3.0 162.2
Facilities not utilised at reporting date
Unsecured bank loans 554.8 514.5
Unsecured guarantees - -
Secured bank loans 86.2 303.6
Secured guarantees - 57.6
Facilities utilised at reporting date
Interest bearing loans and borrowings - current 94.1 134.7
Interest bearing loans and borrowings - non-current 916.2 835.0
Total interest bearing loans and borrowings 1,010.3 969.7
2021$Millions
2020$Millions
Maturity profile for bank facilities (excluding secured guarantees):
Between 0 to 1 year 175.1 220.0
Between 1 to 2 years 596.9 248.9
Between 2 to 5 years 892.5 1,118.4
Over 5 years - 213.3
Total bank facilities 1,664.5 1,800.6
108

Financing arrangementsInfratil Finance Limited, a wholly owned subsidiary of the Company, has entered into bank facility arrangements with a negative pledge agreement, which, with limited exceptions does not permit the Infratil Guaranteeing Group (‘IGG’) to grant any security over its assets. The IGG comprises entities subject to a cross guarantee and comprises Infratil Limited, Infratil Finance Limited and certain other wholly owned subsidiaries. The IGG does not incorporate the underlying assets of the Company’s non-wholly owned subsidiaries and associates. The IGG bank facilities also include restrictions over the sale or disposal of certain assets without bank agreement. Liability under the cross guarantee is limited to the amount of debt drawn under the IGG facilities, plus any unpaid interest and costs of recovery. At 31 March 2021 drawn debt and accrued interest under the IGG facilities was $217.3 million (31 March 2020: $355.3 million) and undrawn IGG facilities totalled $353.0 million (2020: $268.0 million).
Infratil Energy New Zealand Limited (‘IENZ’), a wholly owned subsidiary of the Company, is not a member of the IGG and has granted a security interest over assets with a carrying amount of $342.3 million (31 March 2020: $310.2 million) as part of its bank facility arrangements. IENZ has total facilities of $125.0 million, of which $125.0 million was drawn as at 31 March 2021 (31 March 2020: $125.0 million).
The Group’s non-wholly owned subsidiaries also enter into bank facility arrangements. Amounts outstanding under these facilities are included within loans and borrowings in the table above. Wellington International Airport and Trustpower facilities are both subject to negative pledge arrangements, which with limited exceptions does not permit those entities to grant security over their respective assets. Tilt Renewables borrows under syndicated bank debt facilities (both general and project specific) and has granted security over its assets. Qscan Group borrows under syndicated bank debt facilities and has granted security over its assets. All non-wholly owned subsidiary facilities are subject to restrictions over the sale or disposal of certain assets without bank agreement. The various bank facilities across the Group require the relevant borrowing group to maintain certain levels of shareholder funds and operate within defined performance and gearing ratios. Throughout the period the Group has complied with all debt covenant requirements as imposed by the respective lenders (refer to note 21 for information in respect of waivers of certain financial covenants obtained by Wellington International Airport Limited).
Interest rates payable on bank loan facilities are floating rate determined by reference to prevailing money market rates at the time of drawdown plus a margin. Interest rates paid during the year ranged from 0.57% to 4.32% (31 March 2020: 1.45% to 4.10%).
109

19 Infrastructure bonds
2021$Millions
2020$Millions
Balance at the beginning of the year 1,293.2 1,127.6
Issued during the year 84.7 316.4
Exchanged during the year - (29.3)
Matured during the year - (119.7)
Bond issue costs capitalised during the year (1.0) (4.2)
Bond issue costs amortised during the year 2.0 2.4
Balance at the end of the year 1,378.9 1,293.2
Current 93.8 -
Non-current fixed coupon 931.4 939.7
Non-current variable coupon 121.8 121.6
Non-current perpetual variable coupon 231.9 231.9
Balance at the end of the year 1,378.9 1,293.2
Repayment terms and interest rates:
IFT220 maturing in June 2021, 4.90% p.a. fixed coupon rate 93.9 93.9
IFT190 maturing in June 2022, 6.85% p.a. fixed coupon rate 93.7 93.7
IFT240 maturing in December 2022, 5.65% p.a. fixed coupon rate 100.0 100.0
IFT210 maturing in September 2023, 5.25% p.a. fixed coupon rate 122.1 122.1
IFT230 maturing in June 2024, 5.50% p.a. fixed coupon rate 56.1 56.1
IFT260 maturing in December 2024, 4.75% p.a. fixed coupon rate 100.0 100.0
IFT250 maturing in June 2025, 6.15% p.a. fixed coupon rate 43.4 43.4
IFT300 maturing in March 2026, 3.35% p.a. fixed coupon rate 120.3 37.0
IFT280 maturing in December 2026, 3.35% p.a. fixed coupon rate 156.3 156.3
IFT270 maturing in December 2028, 4.85% p.a. fixed coupon rate until 15 December 2023 146.2 146.2
IFTHC maturing in December 2029, 2.75% p.a. variable coupon rate reset annually from 15 December 2021 123.2 123.2
IFTHA Perpetual Infratil infrastructure bonds 231.9 231.9
less: issue costs capitalised and amortised over term (9.5) (10.6)
add: issue premium capitalised and amortised over term 1.3 -
Balance at the end of the year 1,378.9 1,293.2
Fixed couponThe fixed coupon bonds the Company has on issue are at a face value of $1.00 per bond. Interest is payable quarterly on the bonds.
IFTHC bonds
The IFTHC bonds the Company has on issue are at a face value of $1.00 per bond. Interest is payable quarterly on the bonds. For the period to 15 December 2021 the coupon is fixed at 2.75% p.a (for the period to 15 December 2020 the coupon was 3.50%). Thereafter the rate will be reset annually at 2.50% p.a over the then one year swap rate for quarterly payments.
IFT270 bonds
The interest rate of the IFT270 bonds is fixed for the first five years and then reset on 15 December 2023 for a further five years. The interest rate for the IFT270 bonds for the period from (but excluding) 15 December 2023 until the maturity date will be the sum of the five year swap rate on 15 December 2023 plus a margin of 2.50% p.a.
110
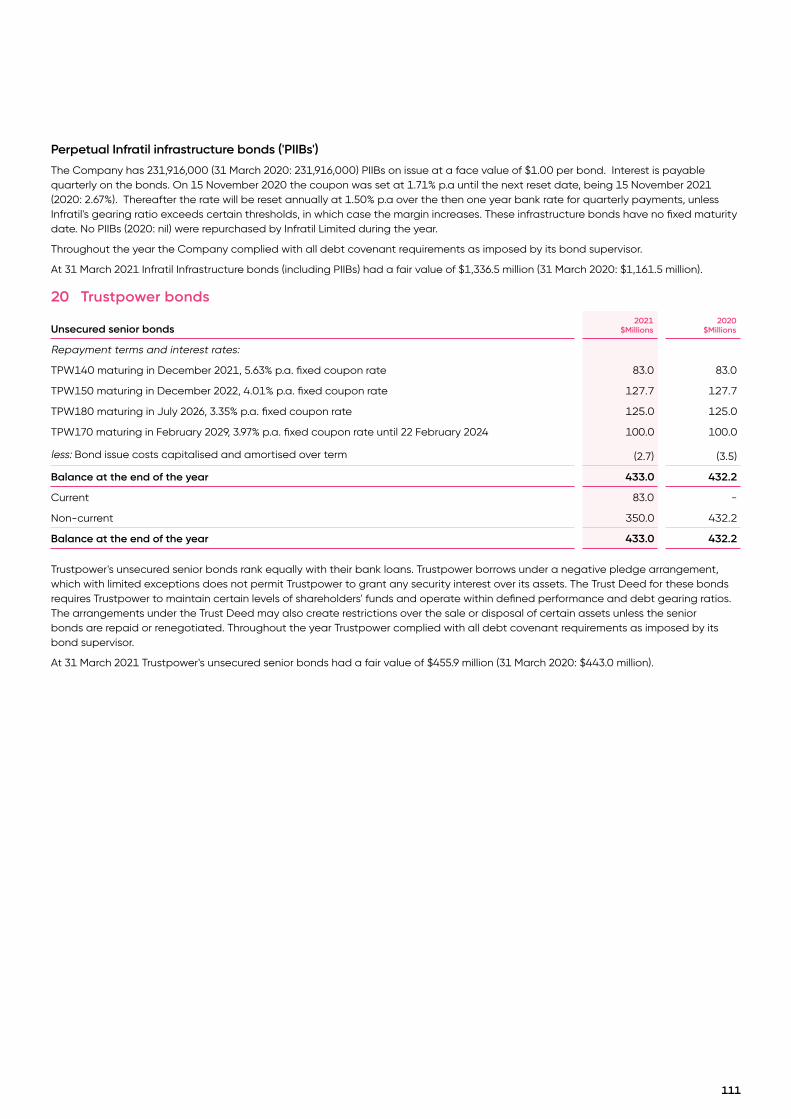
Perpetual Infratil infrastructure bonds ('PIIBs')
The Company has 231,916,000 (31 March 2020: 231,916,000) PIIBs on issue at a face value of $1.00 per bond. Interest is payable quarterly on the bonds. On 15 November 2020 the coupon was set at 1.71% p.a until the next reset date, being 15 November 2021 (2020: 2.67%). Thereafter the rate will be reset annually at 1.50% p.a over the then one year bank rate for quarterly payments, unless Infratil's gearing ratio exceeds certain thresholds, in which case the margin increases. These infrastructure bonds have no fixed maturity date. No PIIBs (2020: nil) were repurchased by Infratil Limited during the year.
Throughout the year the Company complied with all debt covenant requirements as imposed by its bond supervisor.
At 31 March 2021 Infratil Infrastructure bonds (including PIIBs) had a fair value of $1,336.5 million (31 March 2020: $1,161.5 million).
20 Trustpower bonds
Unsecured senior bonds2021
$Millions2020
$Millions
Repayment terms and interest rates:
TPW140 maturing in December 2021, 5.63% p.a. fixed coupon rate 83.0 83.0
TPW150 maturing in December 2022, 4.01% p.a. fixed coupon rate 127.7 127.7
TPW180 maturing in July 2026, 3.35% p.a. fixed coupon rate 125.0 125.0
TPW170 maturing in February 2029, 3.97% p.a. fixed coupon rate until 22 February 2024 100.0 100.0
less: Bond issue costs capitalised and amortised over term (2.7) (3.5)
Balance at the end of the year 433.0 432.2
Current 83.0 -
Non-current 350.0 432.2
Balance at the end of the year 433.0 432.2
Trustpower's unsecured senior bonds rank equally with their bank loans. Trustpower borrows under a negative pledge arrangement, which with limited exceptions does not permit Trustpower to grant any security interest over its assets. The Trust Deed for these bonds requires Trustpower to maintain certain levels of shareholders' funds and operate within defined performance and debt gearing ratios. The arrangements under the Trust Deed may also create restrictions over the sale or disposal of certain assets unless the senior bonds are repaid or renegotiated. Throughout the year Trustpower complied with all debt covenant requirements as imposed by its bond supervisor.
At 31 March 2021 Trustpower's unsecured senior bonds had a fair value of $455.9 million (31 March 2020: $443.0 million).
111

21 Wellington International Airport bonds and USPP notes2021
$Millions2020
$Millions
Repayment terms and interest rates:
WIA0620 Wholesale bonds maturing June 2020, 5.27% p.a. fixed coupon rate - 25.0
WIA020 Retail bonds maturing May 2021, 6.25% p.a. fixed coupon rate 75.0 75.0
WIA030 Retail bonds maturing May 2023, 4.25% p.a. fixed coupon rate 75.0 75.0
WIA040 Retail bonds maturing August 2024, 4.00% p.a. fixed coupon rate 60.0 60.0
WIA050 Retail bonds maturing June 2025, 5.00% p.a. fixed coupon rate 70.0 70.0
WIA060 Retail bonds maturing April 2030, 4.00% p.a. fixed coupon rate until 1 April 2025 101.9 103.0
WIA070 Retail bonds maturing August 2026, 2.50% p.a. fixed coupon rate 100.0 -
USPP Notes - Series A (US$36 million) 54.2 68.1
USPP Notes - Series B (US$36 million) 54.2 68.1
less: Issue costs capitalised and amortised over term (4.6) (3.3)
Balance at the end of the year 585.7 540.9
Current 75.0 25.0
Non-current 510.7 515.9
Balance at the end of the year 585.7 540.9
The Trust Deed for the retail bonds requires Wellington International Airport ('WIAL') to operate within defined performance and debt gearing ratios. The arrangements under the Trust Deed creates restrictions over the sale or disposal of certain assets. Throughout the year WIAL complied with all debt covenant requirements as imposed by the retail bond supervisor.
On 27 July 2017 WIAL completed a United States Private Placement ('USPP') Note issuance, securing US$72 million of long term debt. The USPP comprised two equal tranches, a US$36 million 10 year Note with a coupon of 3.47% and a US$36 million 12 year Note with a coupon of 3.59%. In conjunction with the USPP issuance, WIAL entered into cross currency interest rate swaps to formally hedge the exposure to foreign currency risk over the term of the notes.
At 31 March 2021 WIAL's bonds had a fair value of $481.9 million (2020: $415.7 million), and WIAL's USPP Notes had a fair value of $108.4 million (2020: $122.3 million).
The USPP notes are measured at amortised cost, translated to New Zealand dollars using the spot rate at balance date.
Financial Covenants and Other Restrictions
The impacts of covid have resulted in a significant reduction in WIAL's actual and forecast passenger numbers and income. In response, during the year ended 31 March 2021 WIAL secured a temporary waiver of certain at-risk covenants with its banking group and USPP lender until the first compliance date, which is no later than 31 March 2022. In addition, WIAL increased its bank facilities from $100 million to $170 million and extended its bank facility maturity dates.
22 Financial instrumentsThe Group has exposure to the following risks due to its business activities and financial policies:
• Credit risk
• Liquidity risk
• Market risk
This note presents information about the Group’s exposure to each of the above risks, the Group’s objectives, policies and processes for measuring and managing risk, and the Group’s management of capital.
22.1 Credit riskCredit risk is the risk that a counterparty will default on its contractual obligations, resulting in financial loss to the Group. The Group is exposed to credit risk in the normal course of business including those arising from trade receivables with its customers, financial derivatives and transactions (including cash balances) with financial institutions. The Group minimises its exposure to credit risk of trade receivables through the adoption of counterparty credit limits and standard payment terms. Derivative counterparties and cash transactions are limited to high-credit-quality financial institutions and organisations in the relevant industry. The Group’s exposure and the credit ratings of significant counterparties are monitored, and the aggregate value of transactions concluded are spread amongst approved counterparties. The carrying amounts of financial assets recognised in the Statement of Financial Position best represent the Group’s maximum exposure to credit risk at the reporting date. Generally no security is held on these amounts.
112

2021$Millions
2020$Millions
The Group had exposure to credit risk with financial institutions at balance date from cash deposits held as follows:
Financial institutions with 'AA' credit ratings - -
Financial institutions with 'AA-' credit ratings 106.5 485.9
Financial institutions with 'A+' credit ratings - -
Financial institutions with 'A' credit ratings 25.2 242.7
Unrated financial institutions 2.1 1.7
Total cash deposits with financial institutions 133.8 730.3
Cash on hand - -
Total Cash and cash equivalents 133.8 730.3
Cash and cash equivalents at 31 March 2021 excludes $341.6 million of cash balances held by Tilt Renewables included within assets held for sale. At 31 March 2021 $0.2 million of cash deposits are "restricted" and not immediately available for use by the Group (31 March 2020: $0.1 million). Credit ratings are from S&P Global Ratings or equivalent rating agencies.
Trade and other receivables
The Group has exposure to various counterparties. Concentration of credit risk with respect to trade receivables is limited due to the Group’s large customer base in a diverse range of industries throughout New Zealand and Australia.
Ageing of trade receivables
2021$Millions
2020$Millions
The ageing analysis of trade receivables is as follows:
Not past due 100.3 90.4
Past due 0-30 days 2.3 9.4
Past due 31-90 days 1.9 2.1
Greater than 90 days 4.9 4.0
Total 109.4 105.9
The ageing analysis of impaired trade receivables is as follows:
Not past due (0.3) (1.2)
Past due 0-30 days (0.4) (1.1)
Past due 31-90 days (0.8) (1.0)
Greater than 90 days (4.0) (3.0)
Total (5.5) (6.3)
2021$Millions
2020 $Millions
Movement in the provision for expected credit loss for the year was as follows:
Balance as at 1st April 6.3 3.1
Acquired through acquisition of subsidiary 0.5 -
Expected credit loss recognised (charged to operating expenses) 3.2 3.2
Bad debts recovered - -
Utilised (4.5) -
Transfers to assets classified as held for sale - -
Balance as at 31 March 5.5 6.3
Other prepayments and receivables 225.0 93.9
Total Trade, accounts receivable and prepayments 328.9 193.5
113

22.2 Liquidity riskLiquidity risk is the risk that assets held by the Group cannot readily be converted to cash to meet the Group's contracted cash flow obligations. Liquidity risk is monitored by continuously forecasting cash flows and matching the maturity profiles of financial assets and liabilities. The Group's approach to managing liquidity is to ensure that it will always have sufficient liquidity to meet its liabilities when due and make value investments, under both normal and stress conditions, without incurring unacceptable losses or risking damage to the Group's reputation. The Group manages liquidity risk by maintaining sufficient cash and marketable securities, the availability of funding through an adequate amount of committed credit facilities, the spreading of debt maturities, and its credit standing in capital markets.
The tables below analyse the Group's financial liabilities, excluding gross settled derivative financial liabilities, into relevant maturity groupings based on the earliest possible contractual maturity date at year end. The amounts in the tables below are contractual undiscounted cash flows, which include interest through to maturity. Perpetual Infratil Infrastructure Bonds cash flows have been determined by reference to the longest dated Infratil bond maturity in the year 2029.
Balance sheet
$Millions
Contractual cash flows
$Millions
6 months or less
$Millions6-12 months
$Millions1-2 years$Millions
2-5 years$Millions
5 + years$Millions
31 March 2021
Accounts payable, accruals and other liabilities 501.2 487.5 296.7 - 116.3 74.5 -
Lease liabilities 202.6 394.8 13.2 13.3 48.7 49.9 269.7
Unsecured & secured bank facilities 1,010.3 1,057.7 108.7 38.6 521.3 389.1 -
Infratil Infrastructure bonds 1,147.0 1,362.1 119.2 24.4 235.7 521.6 461.2
Perpetual Infratil Infrastructure bonds 231.9 266.5 2.0 2.0 4.0 11.9 246.6
Wellington International Airport bonds 585.7 688.1 87.0 9.6 19.2 248.5 323.8
Trustpower bonds 433.0 501.1 9.0 90.9 141.3 259.9 -
Derivative financial instruments 156.1 160.1 80.4 23.4 43.7 9.3 3.3
4,267.8 4,917.9 716.2 202.2 1,130.2 1,564.7 1,304.6
31 March 2020
Accounts payable, accruals and other liabilities 313.8 315.5 312.8 0.1 0.2 0.8 1.6
Lease liabilities 246.9 629.6 12.5 11.9 31.7 58.9 514.6
Unsecured & secured bank facilities 969.7 1,325.5 122.3 48.0 309.0 693.3 152.9
Infratil Infrastructure bonds 1,061.3 1,324.4 25.7 25.7 141.7 567.9 563.4
Perpetual Infratil Infrastructure bonds 231.9 292.1 3.1 3.1 6.2 18.6 261.1
Wellington International Airport bonds 540.9 652.1 36.7 11.0 94.7 181.1 328.6
Trustpower bonds 432.2 518.9 9.0 9.0 99.8 156.0 245.1
Derivative financial instruments 129.3 151.2 15.6 13.2 22.6 50.1 49.7
3,926.0 5,209.3 537.7 122.0 705.9 1,726.7 2,117.0
114
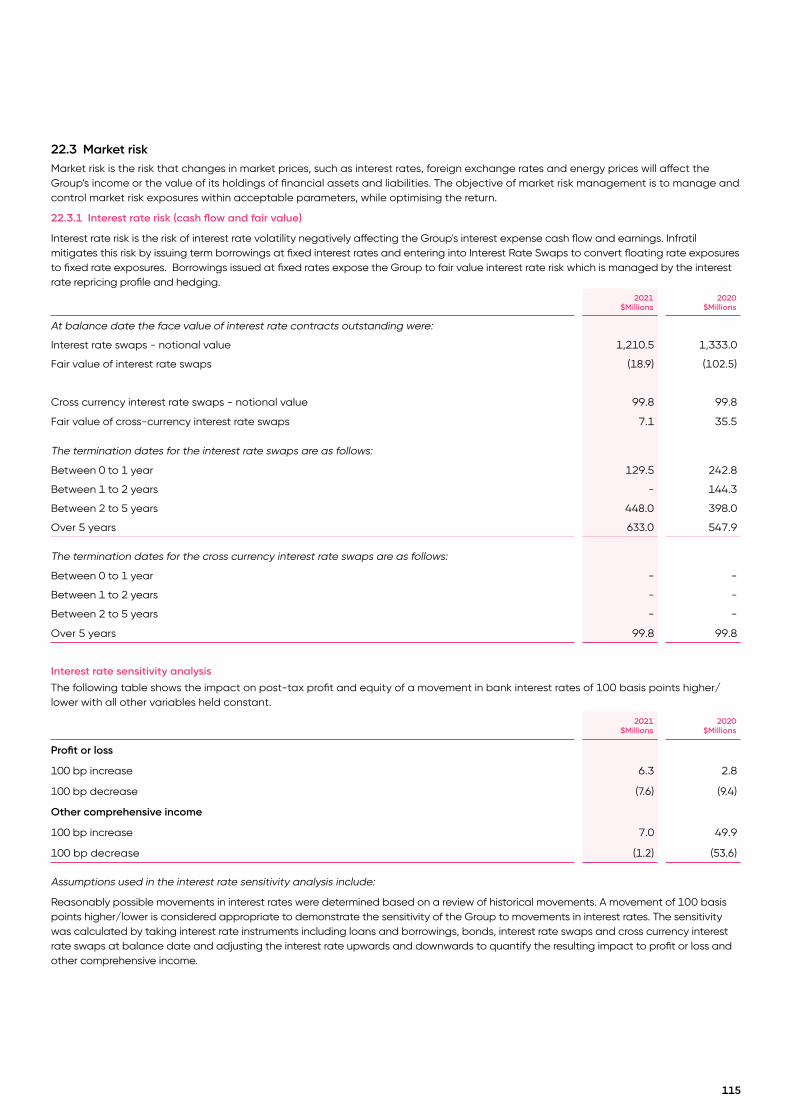
2021$Millions
2020$Millions
At balance date the face value of interest rate contracts outstanding were:
Interest rate swaps - notional value 1,210.5 1,333.0
Fair value of interest rate swaps (18.9) (102.5)
Cross currency interest rate swaps - notional value 99.8 99.8
Fair value of cross-currency interest rate swaps 7.1 35.5
The termination dates for the interest rate swaps are as follows:
Between 0 to 1 year 129.5 242.8
Between 1 to 2 years - 144.3
Between 2 to 5 years 448.0 398.0
Over 5 years 633.0 547.9
The termination dates for the cross currency interest rate swaps are as follows:
Between 0 to 1 year - -
Between 1 to 2 years - -
Between 2 to 5 years - -
Over 5 years 99.8 99.8
Interest rate sensitivity analysis
The following table shows the impact on post-tax profit and equity of a movement in bank interest rates of 100 basis points higher/lower with all other variables held constant.
2021$Millions
2020$Millions
Profit or loss
100 bp increase 6.3 2.8
100 bp decrease (7.6) (9.4)
Other comprehensive income
100 bp increase 7.0 49.9
100 bp decrease (1.2) (53.6)
Assumptions used in the interest rate sensitivity analysis include:
Reasonably possible movements in interest rates were determined based on a review of historical movements. A movement of 100 basis points higher/lower is considered appropriate to demonstrate the sensitivity of the Group to movements in interest rates. The sensitivity was calculated by taking interest rate instruments including loans and borrowings, bonds, interest rate swaps and cross currency interest rate swaps at balance date and adjusting the interest rate upwards and downwards to quantify the resulting impact to profit or loss and other comprehensive income.
22.3 Market riskMarket risk is the risk that changes in market prices, such as interest rates, foreign exchange rates and energy prices will affect the Group’s income or the value of its holdings of financial assets and liabilities. The objective of market risk management is to manage and control market risk exposures within acceptable parameters, while optimising the return.
22.3.1 Interest rate risk (cash flow and fair value)
Interest rate risk is the risk of interest rate volatility negatively affecting the Group's interest expense cash flow and earnings. Infratil mitigates this risk by issuing term borrowings at fixed interest rates and entering into Interest Rate Swaps to convert floating rate exposures to fixed rate exposures. Borrowings issued at fixed rates expose the Group to fair value interest rate risk which is managed by the interest rate repricing profile and hedging.
115

22.3.2 Foreign currency risk
The Group has exposure to foreign currency risk on the value of its net investment in foreign investments, assets and liabilities, future investment obligations and future income. Foreign currency obligations and income are recognised as soon as the flow of funds is likely to occur. Decisions on buying forward cover for likely foreign currency investments is subject to the Group’s expectation of the fair value of the relevant exchange rate.
The Group may enter into forward exchange contracts to reduce the risk from price fluctuations of foreign currency commitments associated with the construction of generation assets and to hedge the risk of its net investment in foreign operations. Any resulting differential to be paid or received as a result of the currency hedging of the asset is reflected in the final cost of the asset. The Group has elected to apply cash flow hedge accounting to these instruments.
The following table shows the impact on post-tax profit and equity if the New Zealand dollar had weakened or strengthened by 10 per cent against the currencies with which the Group has foreign currency risk with, all other variables held constant.
2021 2020
USD $Millions
AUD $Millions
USD$Millions
AUD$Millions
Profit or loss
Strengthened by 10 per cent - (11.1) - (11.6)
Weakened by 10 per cent - 11.1 - 11.6
Other comprehensive income
Strengthened by 10 per cent (5.8) (130.8) (1.1) (99.5)
Weakened by 10 per cent 5.8 133.3 1.1 103.6
Assumptions used in the foreign currency exposure sensitivity analysis include:
Reasonably possible movements in foreign exchange rates were determined based on a review of historical movements. A movement of plus or minus 10% has been applied to the AUD/NZD and USD/NZD exchange rates to demonstrate the sensitivity of foreign currency risk of the company’s investment in foreign operations and associated derivative financial instruments. The sensitivity was calculated by taking the AUD and USD spot rate as at balance date, moving this spot rate by plus and minus 10% and then reconverting the AUD and USD balances with the ‘new spot-rate’.
Unhedged foreign currency exposures
At balance date the Group has the following unhedged exposure to foreign currency risk arising on foreign currency monetary assets and liabilities that fall due within the next twelve months:
2021$Millions
2020$Millions
Cash, short-term deposits and trade receivables
United States Dollars (USD) 1.4 -
Australian Dollars (AUD) 0.2 3.0
22.3.3 Energy price risk
Energy Price Risk is the risk that financial performance will be impacted by fluctuations in spot energy prices. The Group meets its energy sales demand by purchasing energy on spot markets, physical deliveries and financial derivative contracts. This exposes the Group to fluctuations in the spot and forward price of energy. The Group has entered into a number of energy hedge contracts to reduce the energy price risk from price fluctuations. These hedge contracts establish the price at which future specified quantities of energy are purchased and settled. Any resulting differential to be paid or received is recognised as a component of energy costs through the term of the contract. The Group has elected to apply cash flow hedge accounting to those instruments it deems material and which qualify as cash flow hedges. Disclosures at 31 March 2021 exclude amounts relating to Tilt Renewables within assets held for sale.
2021 2020
At balance date the aggregate notional volume of outstanding energy derivatives were:
Electricity (GWh) 2,401.0 5,006.6
Fair value of energy derivatives ($millions) 23.9 20.5
As at 31 March 2021, the Group had energy contracts outstanding with various maturities expected to occur continuously throughout the next five years. The hedged anticipated energy purchase transactions are expected to occur continuously throughout the contract period from balance sheet date consistent with the Group's forecast energy generation and retail energy sales. Gains and losses recognised in the cash flow hedge reserve on energy derivatives as of 31 March 2021 will be continuously released to the income statement in each period in which the underlying purchase transactions are recognised in the profit or loss.
116
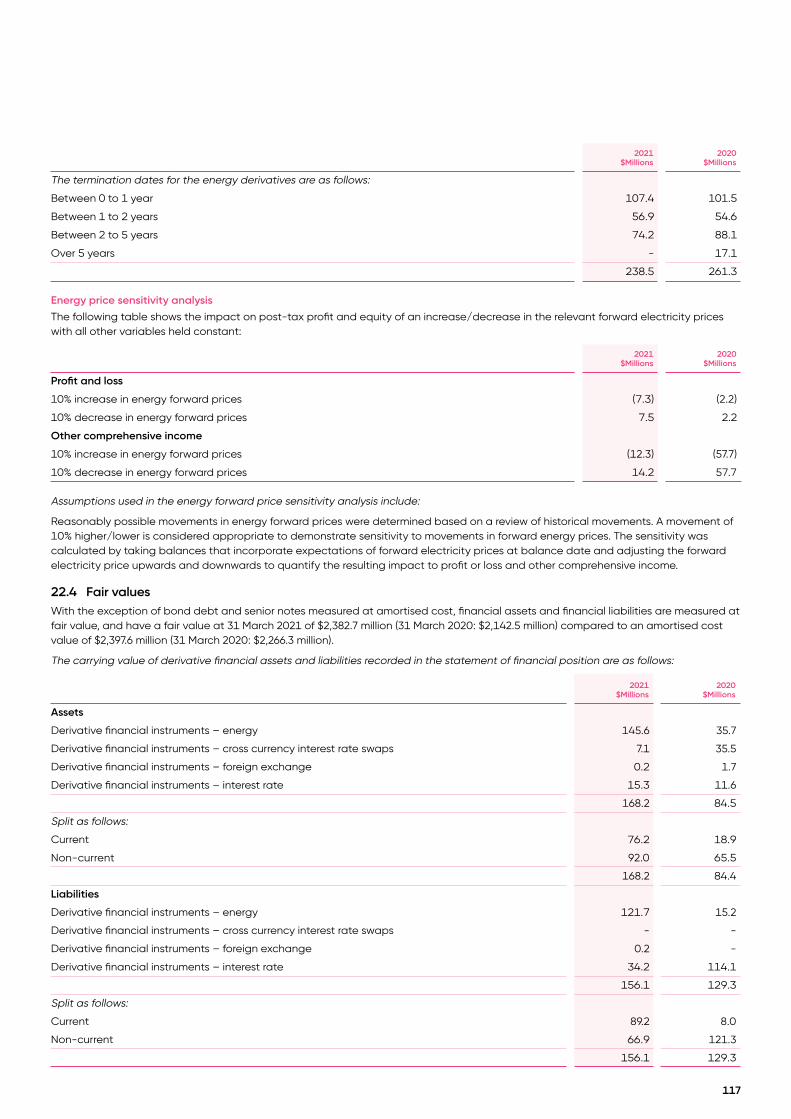
2021 $Millions
2020$Millions
The termination dates for the energy derivatives are as follows:
Between 0 to 1 year 107.4 101.5
Between 1 to 2 years 56.9 54.6
Between 2 to 5 years 74.2 88.1
Over 5 years - 17.1
238.5 261.3
Energy price sensitivity analysis
The following table shows the impact on post-tax profit and equity of an increase/decrease in the relevant forward electricity prices with all other variables held constant:
2021 $Millions
2020$Millions
Profit and loss
10% increase in energy forward prices (7.3) (2.2)
10% decrease in energy forward prices 7.5 2.2
Other comprehensive income
10% increase in energy forward prices (12.3) (57.7)
10% decrease in energy forward prices 14.2 57.7
Assumptions used in the energy forward price sensitivity analysis include:
Reasonably possible movements in energy forward prices were determined based on a review of historical movements. A movement of 10% higher/lower is considered appropriate to demonstrate sensitivity to movements in forward energy prices. The sensitivity was calculated by taking balances that incorporate expectations of forward electricity prices at balance date and adjusting the forward electricity price upwards and downwards to quantify the resulting impact to profit or loss and other comprehensive income.
22.4 Fair valuesWith the exception of bond debt and senior notes measured at amortised cost, financial assets and financial liabilities are measured at fair value, and have a fair value at 31 March 2021 of $2,382.7 million (31 March 2020: $2,142.5 million) compared to an amortised cost value of $2,397.6 million (31 March 2020: $2,266.3 million).
The carrying value of derivative financial assets and liabilities recorded in the statement of financial position are as follows:
2021 $Millions
2020$Millions
Assets
Derivative financial instruments – energy 145.6 35.7
Derivative financial instruments – cross currency interest rate swaps 7.1 35.5
Derivative financial instruments – foreign exchange 0.2 1.7
Derivative financial instruments – interest rate 15.3 11.6
168.2 84.5
Split as follows:
Current 76.2 18.9
Non-current 92.0 65.5
168.2 84.4
Liabilities
Derivative financial instruments – energy 121.7 15.2
Derivative financial instruments – cross currency interest rate swaps - -
Derivative financial instruments – foreign exchange 0.2 -
Derivative financial instruments – interest rate 34.2 114.1
156.1 129.3
Split as follows:
Current 89.2 8.0
Non-current 66.9 121.3
156.1 129.3
117
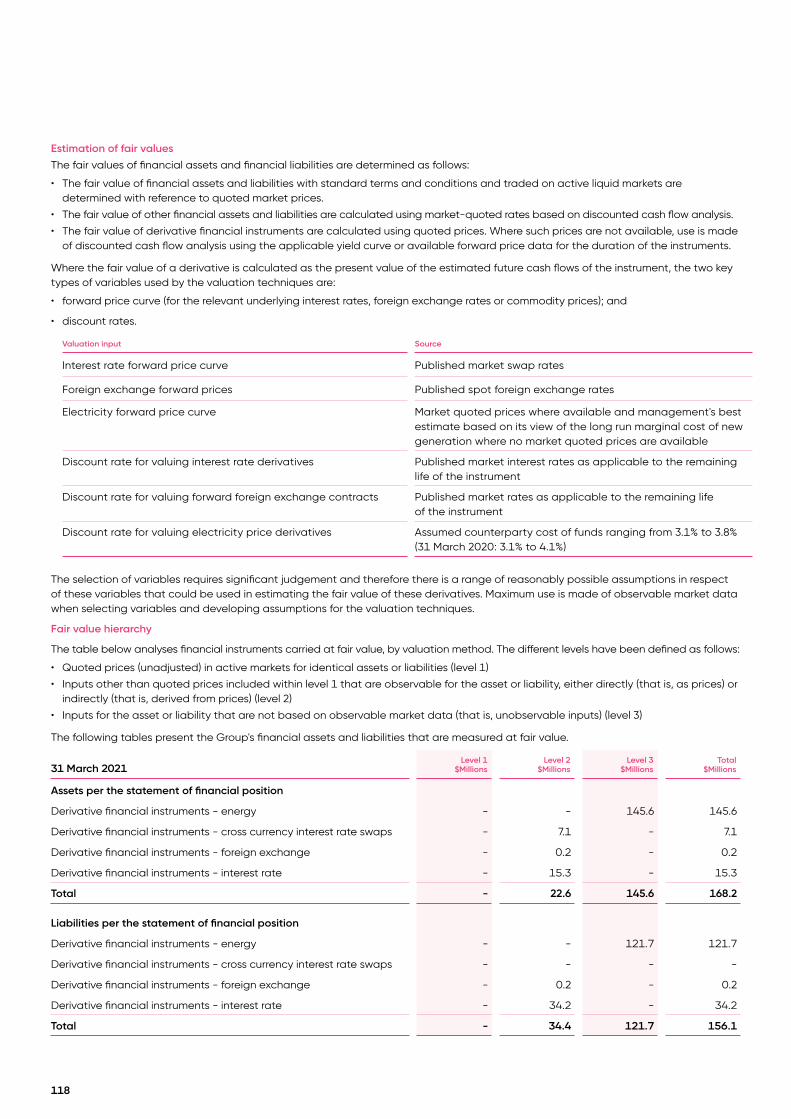
Estimation of fair values
The fair values of financial assets and financial liabilities are determined as follows:
• The fair value of financial assets and liabilities with standard terms and conditions and traded on active liquid markets are determined with reference to quoted market prices.
• The fair value of other financial assets and liabilities are calculated using market-quoted rates based on discounted cash flow analysis.
• The fair value of derivative financial instruments are calculated using quoted prices. Where such prices are not available, use is made of discounted cash flow analysis using the applicable yield curve or available forward price data for the duration of the instruments.
Where the fair value of a derivative is calculated as the present value of the estimated future cash flows of the instrument, the two key types of variables used by the valuation techniques are:
• forward price curve (for the relevant underlying interest rates, foreign exchange rates or commodity prices); and
• discount rates.
Valuation input Source
Interest rate forward price curve Published market swap rates
Foreign exchange forward prices Published spot foreign exchange rates
Electricity forward price curve Market quoted prices where available and management's best estimate based on its view of the long run marginal cost of new generation where no market quoted prices are available
Discount rate for valuing interest rate derivatives Published market interest rates as applicable to the remaining life of the instrument
Discount rate for valuing forward foreign exchange contracts Published market rates as applicable to the remaining life of the instrument
Discount rate for valuing electricity price derivatives Assumed counterparty cost of funds ranging from 3.1% to 3.8% (31 March 2020: 3.1% to 4.1%)
The selection of variables requires significant judgement and therefore there is a range of reasonably possible assumptions in respect of these variables that could be used in estimating the fair value of these derivatives. Maximum use is made of observable market data when selecting variables and developing assumptions for the valuation techniques.
Fair value hierarchy
The table below analyses financial instruments carried at fair value, by valuation method. The different levels have been defined as follows:
• Quoted prices (unadjusted) in active markets for identical assets or liabilities (level 1)
• Inputs other than quoted prices included within level 1 that are observable for the asset or liability, either directly (that is, as prices) or indirectly (that is, derived from prices) (level 2)
• Inputs for the asset or liability that are not based on observable market data (that is, unobservable inputs) (level 3)
The following tables present the Group's financial assets and liabilities that are measured at fair value.
31 March 2021Level 1
$MillionsLevel 2
$MillionsLevel 3
$MillionsTotal
$Millions
Assets per the statement of financial position
Derivative financial instruments - energy - - 145.6 145.6
Derivative financial instruments - cross currency interest rate swaps - 7.1 - 7.1
Derivative financial instruments - foreign exchange - 0.2 - 0.2
Derivative financial instruments - interest rate - 15.3 - 15.3
Total - 22.6 145.6 168.2
Liabilities per the statement of financial position
Derivative financial instruments - energy - - 121.7 121.7
Derivative financial instruments - cross currency interest rate swaps - - - -
Derivative financial instruments - foreign exchange - 0.2 - 0.2
Derivative financial instruments - interest rate - 34.2 - 34.2
Total - 34.4 121.7 156.1
118

31 March 2020Level 1
$MillionsLevel 2
$MillionsLevel 3
$MillionsTotal
$Millions
Assets per the statement of financial position
Derivative financial instruments - energy - 3.1 32.6 35.7
Derivative financial instruments - cross currency interest rate swaps - 35.5 - 35.5
Derivative financial instruments - foreign exchange - 1.7 - 1.7
Derivative financial instruments - interest rate - 11.6 - 11.6
Total - 51.9 32.6 84.5
Liabilities per the statement of financial position
Derivative financial instruments - energy - 0.3 14.9 15.2
Derivative financial instruments - cross currency interest rate swaps - - - -
Derivative financial instruments - foreign exchange - - - -
Derivative financial instruments - interest rate - 114.1 - 114.1
Total - 114.4 14.9 129.3
There were no transfers between derivative financial instrument assets or liabilities classified as level 1 or level 2, and level 3 of the fair value hierarchy during the year ended 31 March 2021 (31 March 2020: none).
The following table reconciles the movements in level 3 Electricity price derivatives that are classified within level 3 of the fair value hierarchy because the assumed location factors which are used to adjust the forward price path are unobservable.
2021$Millions
2020$Millions
Assets per the statement of financial position
Opening balance 32.6 170.6
Foreign exchange movement on opening balance 4.1 0.8
Acquired as part of business combination - -
Gains and (losses) recognised in profit or loss 341.9 (106.0)
Gains and (losses) recognised in other comprehensive income - (32.8)
Transfer to assets held for sale (233.0) -
Closing balance 145.6 32.6
Total gains or (losses) for the year included in profit or loss for assets held at the end of the reporting year 131.5 (33.1)
Liabilities per the statement of financial position
Opening balance 14.9 27.1
Foreign exchange movement on opening balance 1.0 (0.2)
Acquired as part of business combination - -
(Gains) and losses recognised in profit or loss 134.7 (11.2)
(Gains) and losses recognised in other comprehensive income - (0.8)
Transfers to liabilities held for sale (28.9) -
Closing balance 121.7 14.9
Total gains/(losses) for the year included in profit or loss for liabilities held at the end of the reporting year 92.2 3.6
Settlements during the year (18.8) 18.6
119

22.5 Risk Management FrameworkThe Board of Directors has overall responsibility for the establishment and oversight of the Group’s risk management framework. The Group has established an Audit and Risk Committee for Infratil and each of its significant subsidiaries and associates with responsibilities which include reviewing management practices in relation to identification and management of significant business risk areas and regulatory compliance. The Group has developed a comprehensive, enterprise wide risk management framework. Management and Boards throughout the Group participate in the identification, assessment and monitoring of new and existing risks. Particular attention is given to strategic risks that could affect the Group. Management reports to the Audit and Risk Committee and the Board on the relevant risks and the controls and treatments for those risks.
22.6 Capital Management
The Group's capital includes share capital, reserves, retained earnings and non-controlling interests of the Group. From time to time the Group purchases its own shares on the market with the timing of these purchases dependent on market prices, an assessment of value for shareholders and an available window to trade on the NZX. Primarily the shares are intended to be held as treasury stock and may be reissued under the Dividend Reinvestment Plan or cancelled. During the year the Group did not buy back any shares (2020: 887,617 shares). The Company and the Group's borrowings are subject to certain compliance ratios in accordance with the facility agreements or the trust deed applicable to the borrowings. During the year there have been no breaches in the compliance ratios (2020: nil).
The Group seeks to ensure that no more than 20% of its non-bank debt is maturing in any one year period, and to spread the maturities of its bank debt facilities between one and five years. Discussions on refinancing of facilities will normally commence at least six months before maturity. Facilities are maintained with A (2020: A) or above rated financial institutions, and with a minimum number of bank counterparties to ensure diversification. The Group manages its interest rate profile so as to minimise value volatility. This means having interest costs fixed for extended terms. At times when long rates appear to be unsustainably high, the profile may be shortened, and when rates are low the profile may be lengthened.
23 Capital commitments2021
$Millions2020
$Millions
Committed but not contracted for - 5.8
Contracted but not provided for 51.3 500.4
Capital commitments 51.3 506.2
There were no individually material capital commitments as at 31 March 2021. See Note 7 for Infratil's commitments to ASIP and Clearvision Ventures.
24 Reconciliation of net surplus with cash flow from operating activities2021
$Millions2020
$Millions
Net surplus/(loss) for the year (16.0) 484.2
(Add)/Less items classified as investing activity:
(Gain)/Loss on investment realisations and impairments (46.5) (489.3)
Add items not involving cash flows:
Movement in financial derivatives taken to the profit or loss 4.1 (6.2)
Decrease in deferred tax liability excluding transfers to reserves 6.1 (16.2)
Changes in fair value of investment properties (12.0) 5.0
Equity accounted earnings of associate net of distributions received (109.0) (12.1)
Depreciation 114.0 146.0
Movement in provision for bad debts - 6.0
Amortisation of intangibles 13.2 11.3
Other 31.0 19.0
Movements in working capital:
Change in receivables (64.5) 24.7
Change in inventories - 1.2
Change in trade payables (1.3) 51.2
Change in accruals and other liabilities 208.4 (108.9)
Change in current and deferred taxation (36.1) (15.9)
Net cash flow from operating activities 91.4 100.0
120
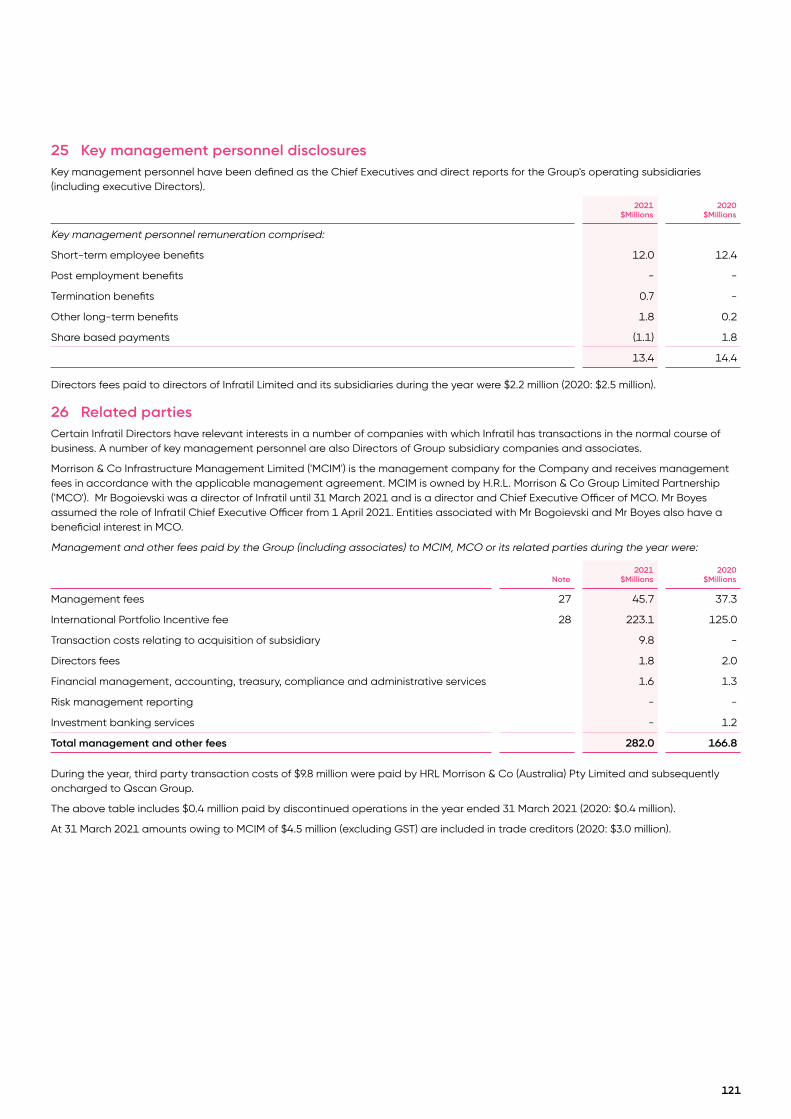
25 Key management personnel disclosuresKey management personnel have been defined as the Chief Executives and direct reports for the Group's operating subsidiaries (including executive Directors).
2021 $Millions
2020$Millions
Key management personnel remuneration comprised:
Short-term employee benefits 12.0 12.4
Post employment benefits - -
Termination benefits 0.7 -
Other long-term benefits 1.8 0.2
Share based payments (1.1) 1.8
13.4 14.4
Directors fees paid to directors of Infratil Limited and its subsidiaries during the year were $2.2 million (2020: $2.5 million).
26 Related partiesCertain Infratil Directors have relevant interests in a number of companies with which Infratil has transactions in the normal course of business. A number of key management personnel are also Directors of Group subsidiary companies and associates.
Morrison & Co Infrastructure Management Limited ('MCIM') is the management company for the Company and receives management fees in accordance with the applicable management agreement. MCIM is owned by H.R.L. Morrison & Co Group Limited Partnership ('MCO'). Mr Bogoievski was a director of Infratil until 31 March 2021 and is a director and Chief Executive Officer of MCO. Mr Boyes assumed the role of Infratil Chief Executive Officer from 1 April 2021. Entities associated with Mr Bogoievski and Mr Boyes also have a beneficial interest in MCO.
Management and other fees paid by the Group (including associates) to MCIM, MCO or its related parties during the year were:
Note2021
$Millions2020
$Millions
Management fees 27 45.7 37.3
International Portfolio Incentive fee 28 223.1 125.0
Transaction costs relating to acquisition of subsidiary 9.8 -
Directors fees 1.8 2.0
Financial management, accounting, treasury, compliance and administrative services 1.6 1.3
Risk management reporting - -
Investment banking services - 1.2
Total management and other fees 282.0 166.8
During the year, third party transaction costs of $9.8 million were paid by HRL Morrison & Co (Australia) Pty Limited and subsequently oncharged to Qscan Group.
The above table includes $0.4 million paid by discontinued operations in the year ended 31 March 2021 (2020: $0.4 million).
At 31 March 2021 amounts owing to MCIM of $4.5 million (excluding GST) are included in trade creditors (2020: $3.0 million).
121
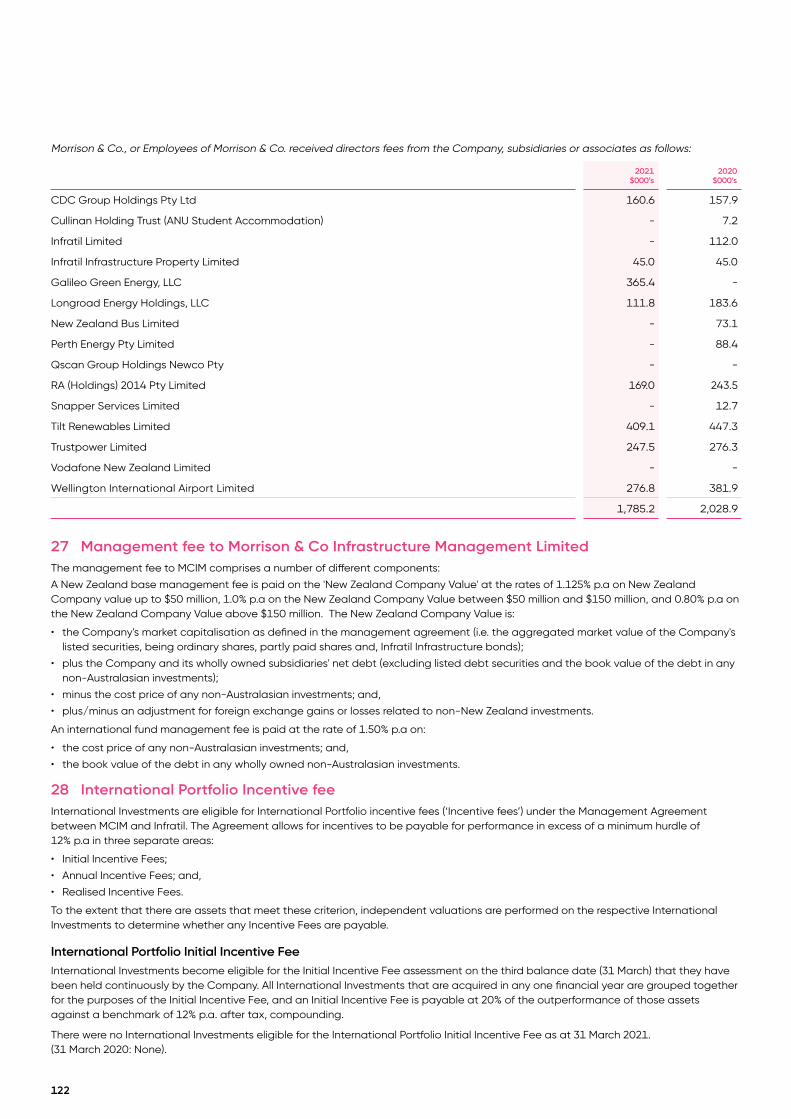
Morrison & Co., or Employees of Morrison & Co. received directors fees from the Company, subsidiaries or associates as follows:
2021$000’s
2020$000’s
CDC Group Holdings Pty Ltd 160.6 157.9
Cullinan Holding Trust (ANU Student Accommodation) - 7.2
Infratil Limited - 112.0
Infratil Infrastructure Property Limited 45.0 45.0
Galileo Green Energy, LLC 365.4 -
Longroad Energy Holdings, LLC 111.8 183.6
New Zealand Bus Limited - 73.1
Perth Energy Pty Limited - 88.4
Qscan Group Holdings Newco Pty - -
RA (Holdings) 2014 Pty Limited 169.0 243.5
Snapper Services Limited - 12.7
Tilt Renewables Limited 409.1 447.3
Trustpower Limited 247.5 276.3
Vodafone New Zealand Limited - -
Wellington International Airport Limited 276.8 381.9
1,785.2 2,028.9
27 Management fee to Morrison & Co Infrastructure Management LimitedThe management fee to MCIM comprises a number of different components:
A New Zealand base management fee is paid on the 'New Zealand Company Value' at the rates of 1.125% p.a on New Zealand Company value up to $50 million, 1.0% p.a on the New Zealand Company Value between $50 million and $150 million, and 0.80% p.a on the New Zealand Company Value above $150 million. The New Zealand Company Value is:
• the Company's market capitalisation as defined in the management agreement (i.e. the aggregated market value of the Company's listed securities, being ordinary shares, partly paid shares and, Infratil Infrastructure bonds);
• plus the Company and its wholly owned subsidiaries' net debt (excluding listed debt securities and the book value of the debt in any non-Australasian investments);
• minus the cost price of any non-Australasian investments; and,
• plus/minus an adjustment for foreign exchange gains or losses related to non-New Zealand investments.
An international fund management fee is paid at the rate of 1.50% p.a on:
• the cost price of any non-Australasian investments; and,
• the book value of the debt in any wholly owned non-Australasian investments.
28 International Portfolio Incentive feeInternational Investments are eligible for International Portfolio incentive fees (‘Incentive fees’) under the Management Agreement between MCIM and Infratil. The Agreement allows for incentives to be payable for performance in excess of a minimum hurdle of 12% p.a in three separate areas:
• Initial Incentive Fees;
• Annual Incentive Fees; and,
• Realised Incentive Fees.
To the extent that there are assets that meet these criterion, independent valuations are performed on the respective International Investments to determine whether any Incentive Fees are payable.
International Portfolio Initial Incentive FeeInternational Investments become eligible for the Initial Incentive Fee assessment on the third balance date (31 March) that they have been held continuously by the Company. All International Investments that are acquired in any one financial year are grouped together for the purposes of the Initial Incentive Fee, and an Initial Incentive Fee is payable at 20% of the outperformance of those assets against a benchmark of 12% p.a. after tax, compounding.
There were no International Investments eligible for the International Portfolio Initial Incentive Fee as at 31 March 2021. (31 March 2020: None).
122
International Portfolio Annual Incentive FeeThereafter International Investments are grouped together, and an Annual Incentive Fee is payable at 20% of the outperformance of those assets against the higher of, a benchmark of 12% p.a. after tax, relative to the most recent 31 March valuation, or cost.
The Company’s investments in CDC Data Centres, Longroad Energy, RetireAustralia, Tilt Renewables and ASIP are eligible for the International Portfolio Annual Incentive fee assessment as at 31 March 2021 (31 March 2020: ASIP, RetireAustralia, CDC Data Centres, Longroad Energy and Tilt Renewables).
Based on independent valuations obtained as at 31 March 2021, an Annual Incentive Fee of $223.1 million is payable to MCIM (31 March 2020: $125.0 million).
International Portfolio Realised Incentive FeeRealised Incentive Fees are payable on the realised gains from the sale or other realisation of International Investments at 20% of the outperformance (since the last valuation date) against the higher of, a benchmark of 12% p.a. after tax, relative to the most recent 31 March valuation, or cost. No Realised Incentive Fees were payable as at 31 March 2020 or 31 March 2021.
2021$000’s
2020$000’s
ASIP 1.6 (0.8)
CDC Data Centres 140.2 105.5
Longroad Energy (8.0) 6.1
RetireAustralia 3.2 (18.0)
Tilt Renewables 86.1 32.2
223.1 125.0
All Incentive fees accrued in 2021 relate to the Annual Incentive Fee assessment. (2020: All incentive fees relate to the Annual incentive fee assessment.)
Payment of Annual Incentive FeesAny Annual Incentive Fee calculated in respect of a Financial Year is earned and paid in three annual instalments, with the second and third instalments only being earned and payable if, at each relevant assessment date, the fair value of the relevant asset (including distributions, if any) exceeds the greater of fair value or cost as at the 31 March for which the Incentive Fee was first calculated.
29 Contingent liabilitiesThe Company and certain wholly owned subsidiaries are guarantors of the bank debt facilities of Infratil Finance Limited under a Deed of Negative Pledge, Guarantee and Subordination and the Company is a guarantor to certain obligations of subsidiary companies.
Shareholder support for Wellington International AirportOn 20 May 2020 Infratil and Wellington City Council entered into a shareholder support agreement with Wellington International Airport to enable the airport to access up to $75.0 million of additional funding by way of non-participating redeemable preference shares, if required. Infratil's contribution to this funding is proportional to its 66% ownership interest.
Shareholder support for RetireAustraliaOn 12 May 2020 Infratil and consortium partner the New Zealand Superannuation Fund entered into a shareholder support agreement with RetireAustralia to enable RetireAustralia to access up to A$20.0 million of additional equity funding, if required. Infratil's contribution to this funding is proportional to its 50% ownership interest.
30 Events after balance date
Dividend On 18 May 2021, the Directors approved a partially imputed final dividend of 11.5 cents per share to holders of fully paid ordinary shares to be paid on 22 June 2021.
Acquisition of Pacific Radiology Group
On 29 April 2021 Infratil announced that it had executed a conditional agreement to acquire between 50.1% and 60% of Pacific Radiology Group Limited ('Pacific Radiology'), a comprehensive Diagnostic Imaging business in New Zealand, from existing Doctor shareholders. Infratil confirmed on 13 May 2021 that the acquisition is now unconditional and that completion of the acquisition is expected to occur on 31 May 2021, for total consideration of approximately $312 million to $344 million.
The initial accounting for the acquisition of Pacific Radiology is incomplete at the date these financial statements were authorised for issue. Pacific Radiology will be a subsidiary of Infratil and consolidated into the Group financial statements from the date of acquisition as Infratil’s ownership interest will be between 53.5% and 58.5%, with voting governance rights consistent with its interest. Business combination accounting for the acquisition will be applied based on the assets and liabilities of Pacific Radiology at the completion date and is expected to give rise to goodwill.
123
© 2021 KPMG, a New Zealand Partnership and a member firm of the KPMG global organisation of independent member firms affiliated with KPMG International Limited, a private English company limited by guarantee. All rights reserved.
Independent Auditor’s Report To the shareholders of Infratil Limited
Report on the audit of the consolidated financial statements
Opinion
In our opinion, the accompanying consolidated financial statements of Infratil Limited (the ’company’) and its subsidiaries (the 'group') on pages 70 to 123:
— present fairly in all material respects the Group’s financial position as at 31 March 2021 and its financial performance and cash flows for the year ended on that date; and
— comply with New Zealand Equivalents to International Financial Reporting Standards and International Financial Reporting Standards.
We have audited the accompanying consolidated financial statements which comprise:
— the consolidated statement of financial position as at 31 March 2021;
— the consolidated statements of comprehensive income, changes in equity and cash flows for the year then ended; and
— notes, including a summary of significant accounting policies and other explanatory information.
Basis for opinion
We conducted our audit in accordance with International Standards on Auditing (New Zealand) (‘ISAs (NZ)’). We believe that the audit evidence we have obtained is sufficient and appropriate to provide a basis for our opinion.
We are independent of the group in accordance with Professional and Ethical Standard 1 International Code of Ethics for Assurance Practitioners (Including International Independence Standards) (New Zealand) issued by the New Zealand Auditing and Assurance Standards Board and the International Ethics Standards Board for Accountants’ International Code of Ethics for Professional Accountants (including International Independence Standards) (‘IESBA Code’), and we have fulfilled our other ethical responsibilities in accordance with these requirements and the IESBA Code.
Our responsibilities under ISAs (NZ) are further described in the auditor’s responsibilities for the audit of the consolidated financial statements section of our report.
Our firm has also provided other services to the group in relation to taxation services, audit of regulatory disclosures, other assurance engagements and other consultancy services. Subject to certain restrictions, partners and employees of our firm may also deal with the group on normal terms within the ordinary course of trading activities of the business of the group. These matters have not impaired our independence as auditor of the group. The firm has no other relationship with, or interest in, the group.
Scoping
The scope of our audit is designed to ensure that we perform adequate work to be able to give an opinion on the consolidated financial statements as a whole, taking into account the structure of the group, the significance and risk profile of each investment it owns, the group’s accounting processes and controls, and the industry in which the investments operates.
124

2
In establishing the overall approach to the group audit, we determined the type of work that needed to be performed at the component level by us, as the group engagement team, or component auditors operating under our instruction.
A full scope audit was performed on the most significant investments for the group using component materialities which were lower than group materiality. The component materiality took into account the size and the risk profile of each component.
Where the work was performed by component auditors, we determined the level of involvement we needed to have in the audit work at those investments to be able to conclude whether sufficient appropriate audit evidence had been obtained as a basis for our opinion on the group financial statements as a whole. We kept in regular communication with component audit teams throughout the year with phone calls, discussions and written instructions and ensured that the component audit teams had the appropriate skills and competencies which are needed for the audit. We reviewed the work undertaken by component auditors in order to ensure the quality and adequacy of their work.
Materiality
The scope of our audit was influenced by our application of materiality. Materiality helped us to determine the nature, timing and extent of our audit procedures and to evaluate the effect of misstatements, both individually and on the consolidated financial statements as a whole. The materiality for the consolidated financial statements as a whole was set at $40 million determined with reference to a benchmark of group total assets. We chose total assets given the asset intensive nature of the group’s underlying investments and that this is a more stable and relevant measure than a profit measure. Materiality represents 0.5% of the selected benchmark.
Key audit matters
Key audit matters are those matters that, in our professional judgement, were of most significance in our audit of the consolidated financial statements in the current period. We summarise below those matters and our key audit procedures to address those matters in order that the shareholders as a body may better understand the process by which we arrived at our audit opinion. Our procedures were undertaken in the context of and solely for the purpose of our statutory audit opinion on the consolidated financial statements as a whole and we do not express discrete opinions on separate elements of the consolidated financial statements.
The key audit matter How the matter was addressed in our audit
Valuation of Property, Plant and Equipment
As disclosed in note 14 of the financial statements, the group has property, plant and equipment of $3,239 million (2020: $3,958 million), with renewable generation assets, land and civil works and buildings making up the majority of this balance. The group has a policy of recording classes of property, plant and equipment at cost less accumulated depreciation, or at valuation, with valuations undertaken at least every 5 years with a material change assessment carried out in the intervening years.
Renewable generation assets ($1,758 million)
Valuation of renewable generation assets is considered to be a key audit matter due to both its magnitude and the judgement involved in the assessment of the fair value of these assets by the group’s Directors. The judgement relates to the valuation methodology used and the assumptions included within that methodology.
A full revaluation of both hydro generation assets was carried out as at 31 March 2020 with a material change assessment carried out in the current year.
Our procedures over the renewable generation asset valuations included:
− Comparing the forward electricity price path used in the independent valuation to current externally derived market data and our independent estimate of the price path;
− Comparing forecast generation volumes and operating costs assumed in the independent valuation against actual realised volumes and operating costs incurred;
125

3
The key audit matter How the matter was addressed in our audit
The assumptions included in the valuations that have the largest impact on fair value are:
− Forward electricity price path forecasts;
− Future generation volumes;
− The impact of future changes to the voided Cost of Transmission pricing regime in New Zealand;
− Discount rates applied to the estimated future cash flows to determine a present-day value; and
− Forecast costs of operating the generation schemes.
− Assessing the appropriateness of forecast Avoided Cost of Transmission revenue included within the valuation, considering the assumptions applied by management and latest Electricity Authority announcements; and
− Using valuation specialists to assess the appropriateness of the discount rate applied to the estimated future cash flows by comparing this to rates used by other market participants.
Land and civil works ($676 million) and Buildings ($550 million).
Valuation of land and civil works and buildings, specifically in relation to airport assets, is considered to be a key audit matter due to the magnitude and judgement involved in the assessment of the fair value of these assets by the group’s Directors. The judgement relates to the valuation methodologies used and the assumptions included in each of those methodologies.
In 2021, Management have considered, and sought, input from the independent valuers as to any changes to the key assumptions used in the valuation methodologies and whether these changes indicate a material change in the value of the property, plant and equipment held at fair value.
The assumptions that have the largest impact on the valuations are:
− The potential value of the airport land if there was no airport on the site, primarily driven by the weighted average cost of capital;
− The replacement cost of buildings including the main terminal building;
− The replacement cost of civil assets including the runway, taxiways and roads;
− The estimated future passenger numbers and resulting cash flows; and
− Discount rates applied to the estimated future cash flows from the vehicle and accommodation assets.
Our procedures to assess the land and civil works and buildings valuations included utilising valuation specialists to assess the changes in key judgemental assumptions which have the largest impact on the valuation. This included:
− Comparing the valuation methodologies used by the valuer for the group, to the valuation methodologies used by other airports within New Zealand;.
− Assessing the changes to the weighted average cost of capital and discount rates against observable market data;
− Assessing the changes in the cost of buildings and civil assets;
− Assessing the changes in the value of underlying land prices with reference to observable market transactions and relevant indices; and
− Assessing the future cash flows against budgets, forecast passenger numbers and historical financial performance.
126
4
The key audit matter How the matter was addressed in our audit
Carrying value of investment in associates
The carrying value of the group’s investment in associates as at 31 March 2021 was $2,127 million. Investments in associates contribute a significant portion of the group’s net surplus and total assets.
Given the significance of these investments to the group, we consider this to be a key audit matter.
Our procedures performed to assess the carrying value of associates included, amongst others:
− Recalculating the share of profit from equity accounted investments using investee financial information;
− Testing a sample of acquisitions made and distributions received from associates during the year;
− Consideration of associate’s performance to date with reference to the most recent audited financial statements and assessment of relevant indicators of impairment; and
− Where valuation models have been used to support carrying value, we have utilised our valuation specialists to consider the discount rates and cash flow projections used within the models.
Other information
The Directors, on behalf of the group, are responsible for the other information included in the entity’s Annual Report. Other information includes the reports of the Chief Executive and the Chair, Infratil’s summary financial information, and disclosures relating to strategy, corporate governance, Infratil’s businesses and statutory information (on pages 1 to 69 and page 129 to 144). Our opinion on the consolidated financial statements does not cover any other information and we do not express any form of assurance conclusion thereon.
In connection with our audit of the consolidated financial statements our responsibility is to read the other information and, in doing so, consider whether the other information is materially inconsistent with the consolidated financial statements or our knowledge obtained in the audit or otherwise appears materially misstated. If, based on the work we have performed, we conclude that there is a material misstatement of this other information, we are required to report that fact. We have nothing to report in this regard.
Use of this independent auditor’s report
This independent auditor’s report is made solely to the shareholders as a body. Our audit work has been undertaken so that we might state to the shareholders those matters we are required to state to them in the independent auditor’s report and for no other purpose. To the fullest extent permitted by law, we do not accept or assume responsibility to anyone other than the shareholders as a body for our audit work, this independent auditor’s report, or any of the opinions we have formed.
127

5
Responsibilities of the Directors for the consolidated financial
statements
The Directors, on behalf of the company, are responsible for:
— the preparation and fair presentation of the consolidated financial statements in accordance with generally accepted accounting practice in New Zealand (being New Zealand Equivalents to International Financial Reporting Standards);
— implementing necessary internal control to enable the preparation of a consolidated set of financial statements that is fairly presented and free from material misstatement, whether due to fraud or error; and
— assessing the ability to continue as a going concern. This includes disclosing, as applicable, matters related to going concern and using the going concern basis of accounting unless they either intend to liquidate or to cease operations or have no realistic alternative but to do so.
Auditor’s responsibilities for the audit of the consolidated financial
statements Our objective is:
— to obtain reasonable assurance about whether the consolidated financial statements as a whole are free from material misstatement, whether due to fraud or error; and
— to issue an independent auditor’s report that includes our opinion.
Reasonable assurance is a high level of assurance but is not a guarantee that an audit conducted in accordance with ISAs NZ will always detect a material misstatement when it exists.
Misstatements can arise from fraud or error. They are considered material if, individually or in the aggregate, they could reasonably be expected to influence the economic decisions of users taken on the basis of these consolidated financial statements.
A further description of our responsibilities for the audit of these consolidated financial statements is located at the External Reporting Board (XRB) website at:
http://www.xrb.govt.nz/standards-for-assurance-practitioners/auditors-responsibilities/audit-report-1/
This description forms part of our independent auditor’s report.
The engagement partner on the audit resulting in this independent auditor's report is Brent Manning. For and on behalf of
KPMG Wellington 18 May 2021
128

Corporate GovernanceThe Board is committed to undertaking its role in accordance with internationally accepted best practice, within the context of Infratil’s business. Infratil’s corporate governance practices have been prepared with reference to the Financial Markets Authority’s Corporate Governance Handbook, the requirements of the NZX Listing Rules and the recommendations in the NZX Corporate Governance Code (“NZX Code”).
Copies of Infratil’s key corporate governance documents are available on the corporate governance section of Infratil’s website: www.infratil.com/about-us/corporate-governance/. These include Infratil’s Constitution, the Management Agreement, the Board and Committee Charters, the Corporate Governance Statement (which discloses Infratil’s compliance with the NZX Code) and key corporate governance policies.
Corporate governance structure The Board is elected by the shareholders with overall responsibility for the governance of Infratil, while the day to day management of Infratil has been delegated to Morrison & Co. The respective roles of the Board and Morrison & Co within this corporate governance structure are summarised below.
The Board
Role of the BoardThe Board’s role and responsibilities are set out in the Board Charter. The primary role of the Board is to approve and monitor the strategic direction of Infratil recommended by Morrison & Co and add long-term value to Infratil’s shares, having appropriate regard to the interests of all material stakeholders.
Further information on the Board’s role is set out in the Corporate Governance Statement and the Board Charter.
Board CommitteesThe Board has established four standing committees, and other committees may be formed when it is efficient or necessary to facilitate efficient decision-making or when required by law:
• Audit and Risk Committee
The Board has established this Committee to oversee financial reporting, accounting policies, financial management, internal control systems, risk management systems, systems for protecting assets and compliance.
• Nomination and Remuneration Committee
The Board has established this Committee to manage the identification, consideration and recommendation of director appointments to the Board, succession planning for Directors, ensuring written agreements are in place for all Directors, the induction programme for new Directors and recommending remuneration for directors for consideration by shareholders.
• Manager Engagement Committee
The Board has established the Manager Engagement Committee to monitor Morrison & Co’s performance and compliance with the Management Agreement.
Further information on the Audit and Risk Committee, Nomination and Remuneration Committee and Manager Engagement Committee is set out in the Corporate Governance Statement.
Board MembershipThe number of Directors is determined by the Board, in accordance with Infratil’s constitution, to ensure it is large enough to provide a range of knowledge, views and experience relevant to Infratil’s business. The composition of the Board will reflect the duties and responsibilities it is to discharge and perform in setting Infratil’s strategy and seeing that it is implemented. The Board Charter requires both a majority of the Board, and the Chairman, to be independent Directors.
The Board currently comprises seven Directors (six independent Directors and one non-independent Director). The composition of the Board, experience and Board tenure are set out below:
Mark Tume (BBS, Dip Bkg Stud) Chairman and Independent DirectorMark Tume has been Chairman since 2013 and a director since 2007. He is a director of RetireAustralia and Chair of Ngai Tahu Holdings Corporation and Te Atiawa Iwi Holdings. Mr Tume’s professional experience has been in banking and funds management.
Jason Boyes (BCA, LLB (Hons)) Non-Independent DirectorJason Boyes is Chief Executive of Infratil and joined the Board on 1 April 2021. He is Chair of Longroad Energy and Galileo Green Energy. He joined Morrison & Co in 2011 after a 15 year legal career in corporate finance and M&A in New Zealand and London. He led Infratil’s strategic review of its stake in Tilt Renewables, led the successful IPO of Z Energy in 2013, and has been instrumental in numerous Infratil investments since, including the acquisition of Vodafone NZ and subsequent capital raise in 2019, and the establishment of Longroad Energy in 2016 and Galileo Green Energy in 2020. Mr Boyes has an interest in Morrison & Co, which has the Management Agreement with Infratil.
Alison Gerry (BMS(Hons), MAppFin) Independent DirectorAlison Gerry joined the Board in 2014 and is Chair of the Audit and Risk Committee. She is a director of Wellington International Airport, ANZ Bank New Zealand, Vero Insurance New Zealand and Chair of Sharesies. Ms Gerry is also a former Deputy Chair of Kiwibank and a former director of Spark, TVNZ, NZX, Queenstown Airport and Pioneer Energy. She has more than 20 years of executive experience working for both corporates and financial institutions in Australia, Asia and London in trading, finance and risk roles. Ms Gerry was also a Visiting Fellow at Macquarie University for 12 years teaching on the Masters of Applied Finance programme in Australia and Asia.
Paul Gough (BCom(Hons)) Independent DirectorPaul Gough joined the Board in 2012. He is managing partner of the UK private equity fund STAR Capital. He is a director of several international companies in the transport, logistics, healthcare, infrastructure and financial services sectors. Mr Gough previously worked for Credit Suisse First Boston in New Zealand and London and is a member of INFINZ.
Kirsty Mactaggart (BAcc, CA) Independent DirectorKirsty Mactaggart joined the Board in 2019. She was most recently the Head of Equity Capital Markets, Corporate Finance and Governance Asia for Fidelity International, and was previously a Managing Director at Citigroup across Hong Kong and London. She has 25 years global financial market experience with a unique investor perspective and a focus on governance. Ms Mactaggart is originally from Scotland but is now a New Zealand resident.
129
Catherine Savage (BCA, FCA) Independent Director
Catherine Savage joined the Board in 2019. She is a highly experienced investor and director with substantial governance experience in the investment management sector. Ms Savage has previously served as Chair of the Guardians of New Zealand Superannuation, Chairperson of the National Provident Fund, an independent director of the Todd Family Office, Kiwibank and Pathfinder Asset Management, and earlier led AMP Capital in New Zealand. Ms Savage is Co-Chair of the New Zealand Chapter for Women Corporate Directors, a Fellow of Chartered Accountants Australia & New Zealand, a Fellow of The Institute of Directors and a Fellow of INFINZ.
Peter Springford (MBA) Independent Director
Peter Springford joined the Board in 2016. He is a director of Zespri and has extensive experience in managing companies in Australia, New Zealand and Asia, including five years based in Hong Kong as President of International Paper (Asia) Limited and four years as Chief Executive Officer and Managing Director of Carter Holt Harvey Limited. Mr Springford is a chartered member of the New Zealand Institute of Directors.
IndependenceThe Board Charter sets out the standards for determining whether a Director is independent for the purposes of service on the Board and committees. These standards reflect the requirements of the NZX Listing Rules.
A Director is independent if the Board affirmatively determines that the Director satisfies these standards. The Board has determined that:
• All the non-executive Directors (namely, M Tume, A Gerry, P Gough, K Mactaggart, C Savage and P Springford) are independent Directors.
• The Chief Executive (J Boyes), as an employee of Morrison & Co and occupying a position analogous to an executive Director, is not an independent Director.
TenureDirectors are not appointed for fixed terms. However, the Constitution and the NZX Listing Rules require all Directors to stand for re-election at the 3rd annual meeting after appointment or after three years (whichever is longer).
A Director appointed by the Board to fill a casual vacancy must also stand for election at the following annual meeting.
Board and Committee MeetingsThe Board will normally hold at least six meetings in each year, and additional Board meetings are held where necessary in order to prioritise and respond to issues as they arise.
The Board and Committee meetings and attendance in Financial Year 2021 are set out below:
Full agenda
board meetings
Limited agenda
board meetings
Audit and risk
committee
Nomination and
remuneration committee3
Manager engagement
committee
M Tume 10/10 15/15 4/5 1/1 9/9
M Bogoievski1 10/10 15/15 - - -
A Gerry 10/10 15/15 5/5 1/1 9/9
P Gough 10/10 15/15 - 1/1 9/9
K Mactaggart 10/10 15/15 5/5 - 9/9
C Savage 10/10 15/15 5/5 - 9/9
P Springford 10/10 15/15 5/5 - 9/9
1 Retired on 31 March 2021
Independent Professional Advice and TrainingWith the approval of the Chairman, Directors are entitled to seek independent professional advice on any aspect of the Directors’ duties, at Infratil’s expense. Directors are also encouraged to identify and undertake training and development opportunities.
Board Performance and SkillsThe Board, the Audit and Risk Committee and individual Directors are subject to a performance appraisal from time to time, further information on which is set out in the Corporate Governance Statement.
Directors’ and Officers’ InsuranceInfratil has arranged Directors’ and Officers’ liability insurance covering Directors acting on behalf of Infratil. Cover is for damages, judgements, fines, penalties, legal costs awarded and defence costs arising from wrongful acts committed while acting for Infratil. The types of acts that are not covered are dishonest, fraudulent, malicious acts or omissions, wilful breach of statute or regulations or duty to Infratil, improper use of information to the detriment of Infratil, or breach of professional duty.
Takeover ProtocolsThe Board has approved protocols that set out the procedure to be followed if there is a takeover offer for Infratil, which reflect the requirements of the Takeovers Code, market practice and recommendations by the Takeovers Panel.
Morrison & Co
Role of Morrison & CoThe day to day management responsibilities have been delegated to Morrison & Co under the Management Agreement. The Management Agreement specifies the duties and powers of Morrison & Co, and the management fee payable to Morrison & Co (which is summarised in note 26 to the Financial Statements on page 121 of this annual report).
The Board determines and agrees with Morrison & Co specific goals and objectives, with a view to achieving the strategic goals of Infratil. Between Board meetings, the Chairman maintains an informal link between the Board and Morrison & Co, and is kept informed by Morrison & Co on all important matters. The Chairman is available to Morrison & Co to provide counsel and advice where appropriate. Decisions of the Board are binding on Morrison & Co. Morrison & Co is accountable to the Board for the achievement of the strategic goals of Infratil. At each of its Board meetings, the
130

Board receives reports from or through Morrison & Co including financial, operational and other reports and proposals.
Infratil’s management comprises people employed by Morrison & Co (including the Chief Executive and Chief Financial Officer), and people employed by Infratil’s subsidiaries and investee companies.
Manager PerformanceA key responsibility of the Board is monitoring Morrison & Co’s performance and compliance with the Management Agreement (including potential conflicts between the interests of Morrison & Co and the interests of Infratil shareholders). Given the importance of this responsibility in the context of Infratil’s business, the Board has established the Manager Engagement Committee as a dedicated Board committee charged with this responsibility.
The Board also recognises the potential for conflicts to arise in the allocation of investment opportunities among clients of Morrison & Co (including Infratil). Infratil has used investment joint ventures for many years and expects to continue to do so, and the Board encourages Morrison & Co to identify aligned parties with which Infratil can co-invest. Accordingly, the Board and Morrison & Co have agreed a deal allocation process so Infratil has visibility of all investment opportunities that fit with Infratil’s investment strategy and clear investment rights in respect of those opportunities.
The Board initiates a review of the Management Agreement from time to time. An external review of the management fee payable to Morrison & Co under the Management Agreement was conducted in Financial Year 2018 (and the key conclusions of that were noted in the 2018 Annual Report).
Health And SafetyHealth and safety is managed by Infratil’s operational businesses and Morrison & Co (rather than in aggregate at a group level), and the Board is provided with regular health and safety reports for those operating businesses and Morrison & Co.
DiversityInfratil has a Diversity Policy, which describes Infratil’s approach to diversity and inclusion and how diversity and inclusion is promoted and embedded within Infratil, portfolio businesses and Morrison & Co as manager of Infratil. The policy applies to the Board and also sets out the diversity principles which Infratil expects portfolio businesses and Morrison & Co as manager of Infratil to adopt for their own businesses.
Further information on the Diversity Policy is set out in the Corporate Governance Statement.
The following table provides a quantitative breakdown as at 31 March 2021 as to the gender composition of the Board, Infratil’s Officers, and senior executives and employees in portfolio businesses and Morrison & Co:
2021 Position Number Proportion
Female Male Female Male
Board 3 4 43% 57%
Officers1 1 2 33% 67%
Morrison & Co 57 80 41% 59%
Senior Executives2 16 65 20% 80%
Organisation3 2,480 2,356 51% 49%
2020 Position Number Proportion
Female Male Female Male
Board 3 4 43% 57%
Officers1 1 2 33% 67%
Morrison & Co 56 82 40% 60%
Senior Executives2 16 57 22% 78%
Organisation3 1,610 2,150 41% 59%
1 Officers comprise the Chief Executive, Chief Financial Officer and
Company Secretary
2 Senior Executives are defined as a CEO or CEO direct report, or a position
that effectively carries executive responsibilities, in portfolio businesses
3 Organisation includes all portfolio businesses
Risk Management
Risk Management and ComplianceThe Audit and Risk Committee is responsible for ensuring that Infratil has an effective risk management framework to identify, treat and monitor key business risks and regulatory compliance, and also reviews management practices in these areas. Formal systems have been introduced for regular reporting to the Board on business risk, including impacts and mitigation strategies and compliance matters.
Morrison & Co (via the Chief Executive and Chief Financial Officer) is required to, and has confirmed to the Audit and Risk Committee and the Board in writing that, in their opinion:
• Financial records have been properly maintained and Infratil’s financial statements present a true and fair view, in all material respects, of Infratil’s financial condition, and operating results are in accordance with relevant accounting standards;
• The financial statements have been prepared in accordance with New Zealand Generally Accepted Accounting Practice and comply with International Financial Reporting Standards and other applicable financial reporting standards for profit-oriented entities;
• This opinion has been formed on the basis of a sound system of risk management and internal control which is operating effectively; and
• That system of risk management and internal control is appropriate and effective internal controls and risk management practices are in place to safeguard and protect Infratil’s assets, to identify, assess, monitor and manage risk, and identify material changes to Infratil’s risk profile.
131

Internal Financial ControlThe Board has overall responsibility for Infratil’s system of internal financial control. Infratil does not have a separate internal audit function, however the Board has established procedures and policies that are designed to provide effective internal financial control:
• Annual budgets, forecasts and reports on the strategic direction of Infratil are prepared regularly and reviewed and agreed by the Board.
• Financial and business performance reports are prepared monthly and reviewed by the Board throughout the year to monitor performance against financial and non-financial targets and strategic objectives.
External AuditorThe Audit and Risk Committee is also responsible for the selection and appointment of the external auditor (which is included within the External Audit Relationship section of the Audit and Risk Committee Charter) and ensuring that the external auditor or lead audit partner is changed at least every five years.
Going ConcernAfter reviewing the current results and detailed forecasts, taking into account available credit facilities and making further enquiries as considered appropriate, the Directors are satisfied that Infratil has adequate resources to enable it to continue in business for the foreseeable future. For this reason, the Directors believe it is appropriate to adopt the going concern basis in preparing the financial statements.
Reporting and Disclosure
Disclosure Infratil is committed to promoting investor confidence by providing forthright, timely, accurate, complete and equal access to information, and to providing comprehensive continuous disclosure to shareholders and other stakeholders, in compliance with the NZX Listing Rules. This commitment is reflected in Infratil’s Disclosure and Communications Policy. Under this policy:
• All shareholder communications and market releases are subject to review by Morrison & Co (including Chief Executive, Chief Financial Officer and legal counsel), and information is only released after proper review and reasonable inquiry.
• Full year and half year results releases are approved by the Audit and Risk Committee and by the Board.
Shareholder and other Stakeholder CommunicationsInfratil aims to communicate effectively, give ready access to balanced and understandable information about Infratil group and corporate proposals and make it easy to participate in general meetings. Infratil seeks to ensure its shareholders are appropriately informed on its operations and results, with the delivery of timely and focused communication, and the holding of shareholder meetings in a manner conducive to achieving shareholder participation.
Shareholder meetings are generally held in a location and at a time which is intended to maximise participation by shareholders. Full participation of shareholders at the annual meeting is encouraged to ensure a high level of accountability and identification with Infratil’s strategies and goals. Shareholders
have the opportunity to submit questions prior to each meeting and Morrison & Co, senior management of portfolio businesses and auditors are present to assist in and provide answers to questions raised by shareholders. There is also generally an opportunity for informal discussion with Directors, Morrison & Co and senior management for a period after the meeting concludes.
Infratil supports the efforts of the New Zealand Shareholders’ Association (“NZSA”) to raise the quality of relations between public companies and their shareholders. Shareholders wishing to learn more about the NZSA can find information on its website (http://www.nzshareholders.co.nz). While Infratil supports the general aims and objectives of the NZSA, its specific actions and views are not necessarily endorsed by Infratil, or representative of Infratil’s view.
Further information on Infratil’s shareholder and other stakeholder communications is set out in the Corporate Governance Statement.
Remuneration and Performance
Directors’ RemunerationThe Board determines the level of remuneration paid to Directors within the amounts approved from time to time by Shareholders, (for the year ended 31 March 2021, this was $1,329,375 per annum, which was approved by Shareholder at the 2019 annual meeting). Directors are paid a base fee and may also be paid, as additional remuneration:
• an appropriate extra fee as Chairman or Member of a Board Committee;
• an appropriate extra fee as a director of an Infratil subsidiary (other than Trustpower and Tilt Renewables); and
• an appropriate extra fee for any special service as a Director as approved by the Board.
In addition, Directors are entitled to be reimbursed for costs directly associated with the performance of their role as Directors, including travel costs. The Chairman approves all Directors’ expenses, and the Chair of the Audit and Risk Committee approves the Chairman’s expenses.
Mr Boyes is not paid fees in his capacity as a Director, and receives no remuneration from Infratil for his role as Chief Executive, and his remuneration as Chief Executive is paid by Morrison & Co.
Remuneration is reviewed annually by the Board, and fees are reviewed against fee benchmarks in New Zealand and Australia and to take into account the size and complexity of Infratil’s business. The fee structure approved by the Board for the years ended 31 March 2021 and 31 March 2022 is set out overleaf:
132

Annual fee structure
Financial year 2021
(NZD)
Financial year 2022
(NZD)
Base Fees:
Chairman of the Board 256,800 273,800
Director 121,750 131,500
Overseas Director (P Gough) 152,188 164,212
CEO (M Bogoievski/J Boyes) Nil Nil
Board Committee Fees:
Audit and Risk Committee
Chair 38,500 40,000
Member 19,700 20,600
Nomination and Remuneration Committee
Chair Nil Nil
Member Nil Nil
Manager Engagement Committee
Chair (ex officio Chairman of the Board) Nil Nil
Member 7,500 7,500
Remuneration paid to Directors (as a Director of Infratil and, where applicable, as a director of an Infratil subsidiary) in respect of the year ended 31 March 2021 (and 31 March 2020) is set out below (note that all amounts exclude GST or VAT where appropriate):
Directors’ Remuneration paid by Infratil
Directors’ remuneration (in their capacity as such) in respect of the year ended 31 March 2021 and 31 March 2020 paid by the Company was as follows (these amounts exclude GST, where appropriate):
Director
Financial year 2021
(NZD)
Financial year 2020
(NZD)
M Tume (Chairman) 256,800 239,800
M Bogoievski - 112,000
A Gerry 167,750 156,500
P Gough 159,688 147,500
K Mactaggart 148,950 128,798
C Savage1 148,950 89,019
P Springford 129,250 129,002
Total 1,011,388 1,049,846
1 Ms Savage was appointed on 1 August 2019
Directors’ Remuneration paid by Infratil Subsidiaries
Directors’ remuneration (in their capacity as such) in respect of the year ended 31 March 2021 and 31 March 2020 paid by subsidiaries was as follows (these amounts exclude GST where appropriate):
Director
Financial year 2021
(NZD)
Financial year 2020
(NZD)
A Gerry (Wellington International Airport Limited) 80,371 104,754
No other benefits have been provided by Infratil or its subsidiaries to a Director for services as a Director or in any other capacity, other than as disclosed in the related party note to the financial statements, or in the ordinary course of business. No loans have been made by Infratil or its subsidiaries to a Director, nor has Infratil or its subsidiaries guaranteed any debts incurred by a Director.
Employee RemunerationDuring the year ended 31 March 2021, the following number of employees (and former employees) of Infratil and its subsidiaries received remuneration and other benefits in their capacity as employees of at least $100,000. These disclosures are provided in accordance with sections 211(1)(g) and 211(2) of the Companies Act 1993 and, accordingly:
• These disclosures provide information in respect of employees (and former employees) of the portfolio businesses which are subsidiaries of Infratil. These business are Infratil Infrastructure Property, Qscan, Tilt Renewables, Trustpower and Wellington International Airport.
• These disclosures do not provide information in respect of employees (or former employees) of the portfolio businesses which are not subsidiaries of Infratil. These businesses are CDC Data Centres, Galileo Green Energy, Longroad Energy, RetireAustralia and Vodafone New Zealand.
• These disclosures do not provide information in respect of employees (or former employees) of Morrison & Co (who include most of the management team listed on pages 10 of this annual report, including the Chief Executive and Chief Financial Officer), as these employees are remunerated by Morrison & Co and the only cost to Infratil of these employees is the Management Fee payable to Morrison & Co.
133
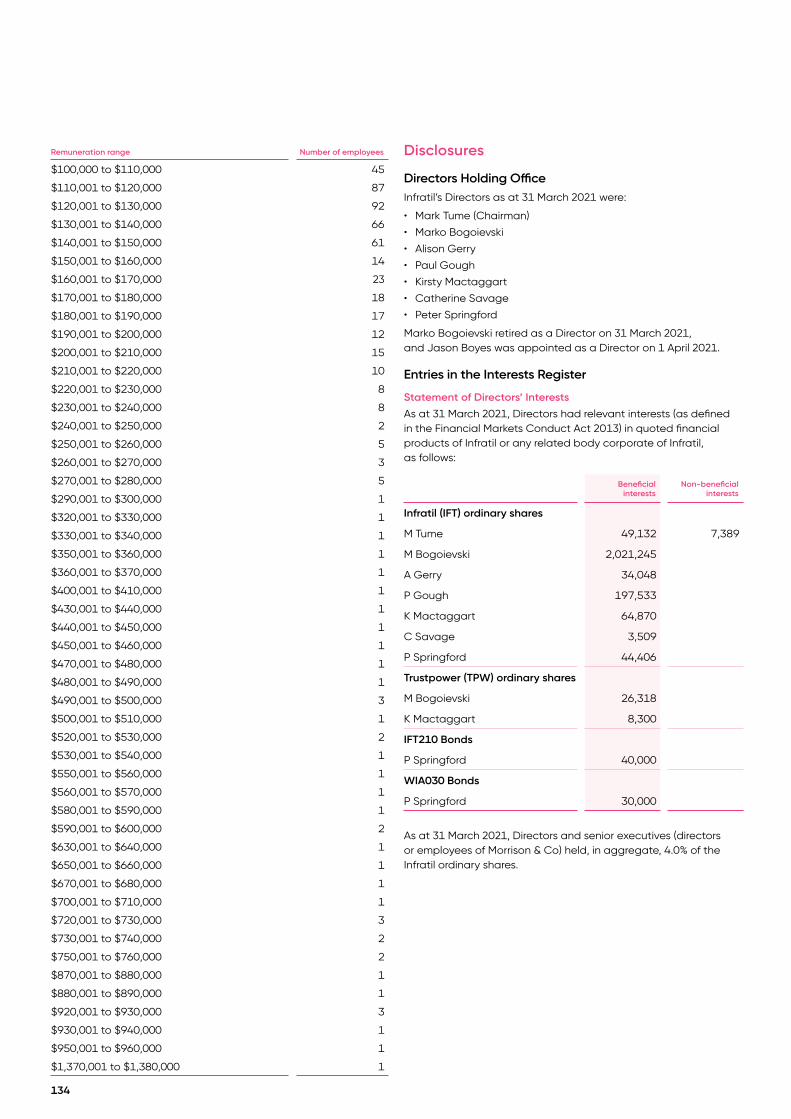
Remuneration range Number of employees
$100,000 to $110,000 45
$110,001 to $120,000 87
$120,001 to $130,000 92
$130,001 to $140,000 66
$140,001 to $150,000 61
$150,001 to $160,000 14
$160,001 to $170,000 23
$170,001 to $180,000 18
$180,001 to $190,000 17
$190,001 to $200,000 12
$200,001 to $210,000 15
$210,001 to $220,000 10
$220,001 to $230,000 8
$230,001 to $240,000 8
$240,001 to $250,000 2
$250,001 to $260,000 5
$260,001 to $270,000 3
$270,001 to $280,000 5
$290,001 to $300,000 1
$320,001 to $330,000 1
$330,001 to $340,000 1
$350,001 to $360,000 1
$360,001 to $370,000 1
$400,001 to $410,000 1
$430,001 to $440,000 1
$440,001 to $450,000 1
$450,001 to $460,000 1
$470,001 to $480,000 1
$480,001 to $490,000 1
$490,001 to $500,000 3
$500,001 to $510,000 1
$520,001 to $530,000 2
$530,001 to $540,000 1
$550,001 to $560,000 1
$560,001 to $570,000 1
$580,001 to $590,000 1
$590,001 to $600,000 2
$630,001 to $640,000 1
$650,001 to $660,000 1
$670,001 to $680,000 1
$700,001 to $710,000 1
$720,001 to $730,000 3
$730,001 to $740,000 2
$750,001 to $760,000 2
$870,001 to $880,000 1
$880,001 to $890,000 1
$920,001 to $930,000 3
$930,001 to $940,000 1
$950,001 to $960,000 1
$1,370,001 to $1,380,000 1
Disclosures
Directors Holding OfficeInfratil’s Directors as at 31 March 2021 were:
• Mark Tume (Chairman)
• Marko Bogoievski
• Alison Gerry
• Paul Gough
• Kirsty Mactaggart
• Catherine Savage
• Peter Springford
Marko Bogoievski retired as a Director on 31 March 2021, and Jason Boyes was appointed as a Director on 1 April 2021.
Entries in the Interests Register
Statement of Directors’ Interests As at 31 March 2021, Directors had relevant interests (as defined in the Financial Markets Conduct Act 2013) in quoted financial products of Infratil or any related body corporate of Infratil, as follows:
Beneficial interests
Non-beneficial interests
Infratil (IFT) ordinary shares
M Tume 49,132 7,389
M Bogoievski 2,021,245
A Gerry 34,048
P Gough 197,533
K Mactaggart 64,870
C Savage 3,509
P Springford 44,406
Trustpower (TPW) ordinary shares
M Bogoievski 26,318
K Mactaggart 8,300
IFT210 Bonds
P Springford 40,000
WIA030 Bonds
P Springford 30,000
As at 31 March 2021, Directors and senior executives (directors or employees of Morrison & Co) held, in aggregate, 4.0% of the Infratil ordinary shares.
134

Dealing in Securities
The following table shows transactions by Directors recorded in respect of those securities during the period from 1 April 2020 to 31 March 2021:
DirectorNo of securities
bought/(sold)Cost/(proceeds)
(NZD)
Infratil Limited (IFT) ordinary shares
Marko Bogoievski – beneficial
Allotted pursuant to Institutional Placement - 15/06/2020 175,264 834,256.64
Allotted pursuant to Share Purchase Plan - 02/07/2020 10,752 49,996.80
Paul Gough – beneficial
Allotted pursuant to Institutional Placement - 15/06/2020 17,220 81,967.20
Peter Springford - beneficial
Allotted pursuant to Share Purchase Plan - 02/07/2020 3,516 16,349.40
On market acquisition – 18/03/21 8,300 60,829.87
On market acquisition - 22/03/21 1,700 12,136.30
Mark Tume - beneficial
Allotted pursuant to Share Purchase Plan - 02/07/2020 4,516 20,999.40
Alison Gerry - beneficial
Allotted pursuant to Share Purchase Plan - 02/07/2020 2,786 12,954.90
On market acquisition – 18/03/21 6,781 49,942.00
Kirsty Mactaggart - beneficial
Allotted pursuant to Share Purchase Plan - 02/07/2020 4,582 21,306.30
On market acquisitions – 23/03/21-25/03/21 20,030 138,004.27
C Savage - beneficial
On market acquisitions – 19/03/21-30/03/21 3,509 27,927.00
Use of Company Information
During the period the Board has received no notices from any Director of the Company or its subsidiaries requesting to use company information received in their capacity as a Director, which would not otherwise have been available to them.
Directors’ Relevant Interests
The following are relevant interests of the Company’s Directors as at 31 March 2021:
M Tume
Director of Yeo Family Trustee Limited
Director of Long Board Limited
Director of Welltest Limited
Director of Koau Capital Partners Ltd
Director of various Infratil wholly owned companies
Director of RetireAustralia Pty Limited
Director of Blink Pay Global Group Limited
Chair of Te Atiawa Iwi Holdings Limited Partnership
Chair of Ngai Tahu Holdings Corporation Limited
M Bogoievski
Director of Zig Zag Farm Limited
Director of various Infratil wholly owned companies
Director and shareholder of Tend Health Limited
Chief Executive of the H.R.L. Morrison & Co group, and Director of H.R.L. Morrison & Co Group GP Limited and companies wholly-owned by the H.R.L. Morrison & Co Group Limited Partnership
A Gerry
Director of Wellington International Airport Limited
Director of Glendora Holdings Limited
Director of Glendora Avocados Limited
Director of Vero Insurance New Zealand Limited
Director of Vero Liability Insurance New Zealand Limited
Director of Asteron Life Limited
Director of On Being Bold Limited
Director of Sharesies AU Group Limited
Director of Sharesies Group Limited
Director of Sharesies Limited
Director of Sharesies Nominee Limited
Director of ANZ Bank New Zealand Limited
135
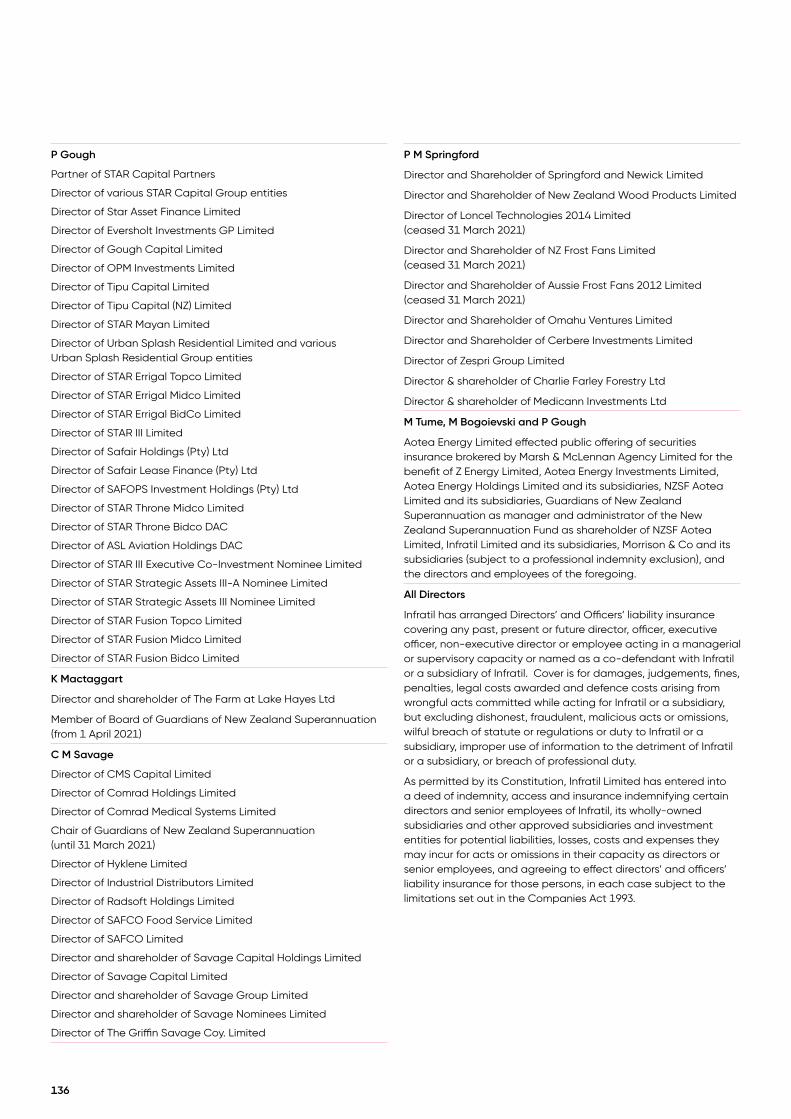
P Gough
Partner of STAR Capital Partners
Director of various STAR Capital Group entities
Director of Star Asset Finance Limited
Director of Eversholt Investments GP Limited
Director of Gough Capital Limited
Director of OPM Investments Limited
Director of Tipu Capital Limited
Director of Tipu Capital (NZ) Limited
Director of STAR Mayan Limited
Director of Urban Splash Residential Limited and various Urban Splash Residential Group entities
Director of STAR Errigal Topco Limited
Director of STAR Errigal Midco Limited
Director of STAR Errigal BidCo Limited
Director of STAR III Limited
Director of Safair Holdings (Pty) Ltd
Director of Safair Lease Finance (Pty) Ltd
Director of SAFOPS Investment Holdings (Pty) Ltd
Director of STAR Throne Midco Limited
Director of STAR Throne Bidco DAC
Director of ASL Aviation Holdings DAC
Director of STAR III Executive Co-Investment Nominee Limited
Director of STAR Strategic Assets III-A Nominee Limited
Director of STAR Strategic Assets III Nominee Limited
Director of STAR Fusion Topco Limited
Director of STAR Fusion Midco Limited
Director of STAR Fusion Bidco Limited
K Mactaggart
Director and shareholder of The Farm at Lake Hayes Ltd
Member of Board of Guardians of New Zealand Superannuation (from 1 April 2021)
C M Savage
Director of CMS Capital Limited
Director of Comrad Holdings Limited
Director of Comrad Medical Systems Limited
Chair of Guardians of New Zealand Superannuation (until 31 March 2021)
Director of Hyklene Limited
Director of Industrial Distributors Limited
Director of Radsoft Holdings Limited
Director of SAFCO Food Service Limited
Director of SAFCO Limited
Director and shareholder of Savage Capital Holdings Limited
Director of Savage Capital Limited
Director and shareholder of Savage Group Limited
Director and shareholder of Savage Nominees Limited
Director of The Griffin Savage Coy. Limited
P M Springford
Director and Shareholder of Springford and Newick Limited
Director and Shareholder of New Zealand Wood Products Limited
Director of Loncel Technologies 2014 Limited (ceased 31 March 2021)
Director and Shareholder of NZ Frost Fans Limited (ceased 31 March 2021)
Director and Shareholder of Aussie Frost Fans 2012 Limited (ceased 31 March 2021)
Director and Shareholder of Omahu Ventures Limited
Director and Shareholder of Cerbere Investments Limited
Director of Zespri Group Limited
Director & shareholder of Charlie Farley Forestry Ltd
Director & shareholder of Medicann Investments Ltd
M Tume, M Bogoievski and P Gough
Aotea Energy Limited effected public offering of securities insurance brokered by Marsh & McLennan Agency Limited for the benefit of Z Energy Limited, Aotea Energy Investments Limited, Aotea Energy Holdings Limited and its subsidiaries, NZSF Aotea Limited and its subsidiaries, Guardians of New Zealand Superannuation as manager and administrator of the New Zealand Superannuation Fund as shareholder of NZSF Aotea Limited, Infratil Limited and its subsidiaries, Morrison & Co and its subsidiaries (subject to a professional indemnity exclusion), and the directors and employees of the foregoing.
All Directors
Infratil has arranged Directors’ and Officers’ liability insurance covering any past, present or future director, officer, executive officer, non-executive director or employee acting in a managerial or supervisory capacity or named as a co-defendant with Infratil or a subsidiary of Infratil. Cover is for damages, judgements, fines, penalties, legal costs awarded and defence costs arising from wrongful acts committed while acting for Infratil or a subsidiary, but excluding dishonest, fraudulent, malicious acts or omissions, wilful breach of statute or regulations or duty to Infratil or a subsidiary, improper use of information to the detriment of Infratil or a subsidiary, or breach of professional duty.
As permitted by its Constitution, Infratil Limited has entered into a deed of indemnity, access and insurance indemnifying certain directors and senior employees of Infratil, its wholly-owned subsidiaries and other approved subsidiaries and investment entities for potential liabilities, losses, costs and expenses they may incur for acts or omissions in their capacity as directors or senior employees, and agreeing to effect directors’ and officers’ liability insurance for those persons, in each case subject to the limitations set out in the Companies Act 1993.
136

Directors of Infratil Subsidiary Companies
Subsidiary Company Director Of Subsidiary
Alpenglow Australia Pty Ltd C Munday
Aotea Energy Holdings Limited M Bogoievski and P Harford
Aotea Energy Holdings No 2 Limited M Bogoievski and P Harford
Aotea Energy Investments Limited M Bogoievski and P Harford
Aotea Energy Limited M Bogoievski and P Harford
Berera Radiology Holdings Pty Ltd C Munday
Blayney and Crookwell Wind Farm Pty Ltd D Campbell and G Swier
Cleveland X-Ray Services Pty Ltd C Munday
Dundonnell Wind Farm Pty Ltd D Campbell and G Swier
Dysart 1 Pty Ltd D Campbell and G Swier
Fiery Creek Wind Farm Holdings Pty Ltd D Campbell and G Swier
Fiery Creek Wind Farm Pty Ltd D Campbell and G Swier
Hopsta Limited D Prentice
HR Clinic Asset Pty Ltd C Munday
HR Clinic Services Pty Ltd C Munday
Ilesilver Pty Ltd C Munday
Infratil 1998 Limited M Bogoievski and M Tume
Infratil 2016 Limited M Bogoievski and M Tume
Infratil 2018 Limited M Bogoievski and M Tume
Infratil 2019 Limited M Bogoievski and M Tume
Infratil Australia Limited M Bogoievski and M Tume
Infratil Energy Limited M Bogoievski and P Harford
Infratil Energy New Zealand Limited M Bogoievski and P Harford
Infratil Europe Limited M Bogoievski and M Tume
Infratil Finance Limited M Bogoievski and M Tume
Infratil Gas Limited M Bogoievski and P Harford
Infratil HC Limited M Bogoievski and M Tume
Infratil Infrastructure Property Limited K Baker and P Coman
Infratil Investments Limited M Bogoievski and M Tume
Infratil No. 1 Limited M Bogoievski and P Harford
Infratil No. 5 Limited M Bogoievski and M Tume
Infratil Outdoor Media Limited M Bogoievski
Infratil PPP Limited M Bogoievski and P Harford
Infratil Renewables Limited M Bogoievski and M Tume
Infratil RV Limited M Bogoievski and P Harford
Infratil Securities Limited M Bogoievski and P Harford
Infratil Trustee Company Limited M Bogoievski and M Tume
Infratil UK Limited M Bogoievski and P Harford
Infratil US Renewables, Inc M Bogoievski and V Vallabh
Infratil Ventures 2 Limited M Bogoievski and M Tume
Infratil Ventures Limited M Bogoievski and P Harford
King Country Energy Holdings Ltd D Prentice
137

Subsidiary Company Director Of Subsidiary
King Country Energy Ltd P Calderwood, R Carter and K Palmer
Liverpool Range Wind Farm Holdings Pty Ltd (formerly Church Lane Wind Farm Pty Ltd) D Campbell and G Swier
Liverpool Range Wind Farm Pty Ltd D Campbell and G Swier
Meitaki Ltd M Harrington, S Sanderson and A Willis
Morwell Energy Hub Pty Ltd D Campbell and G Swier
Nebo 1 Pty Ltd D Campbell and G Swier
New Lynn Central Limited P Coman, A Lamb and A Young
North Coast Radiology Holdings Pty Ltd C Munday
North West Auckland Airport Limited M Bogoievski and T Brown
NZ Airports Limited M Bogoievski and M Tume
Premier Medical Imaging Pty Ltd C Munday
Proximal Pty Ltd C Munday
Qscan Cleveland CT JV Pty Ltd C Munday
Qscan Dental JV Pty Ltd M Hansen and H Rice
Qscan Everton Park CT JV Pty Ltd C Munday
Qscan Everton Park Pty Ltd C Munday
Qscan Group Bidco Pty Ltd P Newfield and M Brook
Qscan Group Holdings Newco Pty LtdP Newfield, M Brook, J Livingston, M Hansen, H Rice, I Cappe, R Singh, R Jyoti, G Shepherd, W Lee and A McCarthy
Qscan Group Midco Pty Ltd P Newfield and M Brook
Qscan Group Pty Ltd C Munday
Qscan Intermediary 1 Pty Ltd (formerly Qscan Group Holdings Pty Ltd) C Munday
Qscan Intermediary 2 Pty Ltd (formerly Qscan Mezzco Pty Ltd) C Munday
Qscan Intermediary 3 Pty Ltd (formerly Qscan Finance Pty Ltd) C Munday
Qscan Intermediary 4 Pty Ltd (formerly Qscan Bidco Pty Ltd) C Munday
Qscan NZ Limited M Brook
Qscan Pty Ltd C Munday
Qscan Services Pty Ltd C Munday
Queensland Cardiovascular Imaging Pty Ltd M Hansen and H Rice
Renew Nominees Limited M Bogoievski and P Harford
Rye Park Holdings Pty Ltd D Campbell and G Swier
Rye Park Renewable Energy Pty Ltd D Campbell and G Swier
Salt Creek Wind Farm Pty Ltd D Campbell and G Swier
Snowtown North Holdings Pty Ltd D Campbell and G Swier
Snowtown North Solar Pty Ltd D Campbell and G Swier
Snowtown Wind Farm Pty Ltd D Campbell and G Swier
South East Radiology Pty Ltd C Munday and M Swain
Swift Transport Limited M Bogoievski and M Tume
Tararua Wind Power Limited B Harker, F Oliver and A Urlwin
Tilt Renewables Australia Pty Ltd D Campbell and G Swier
138
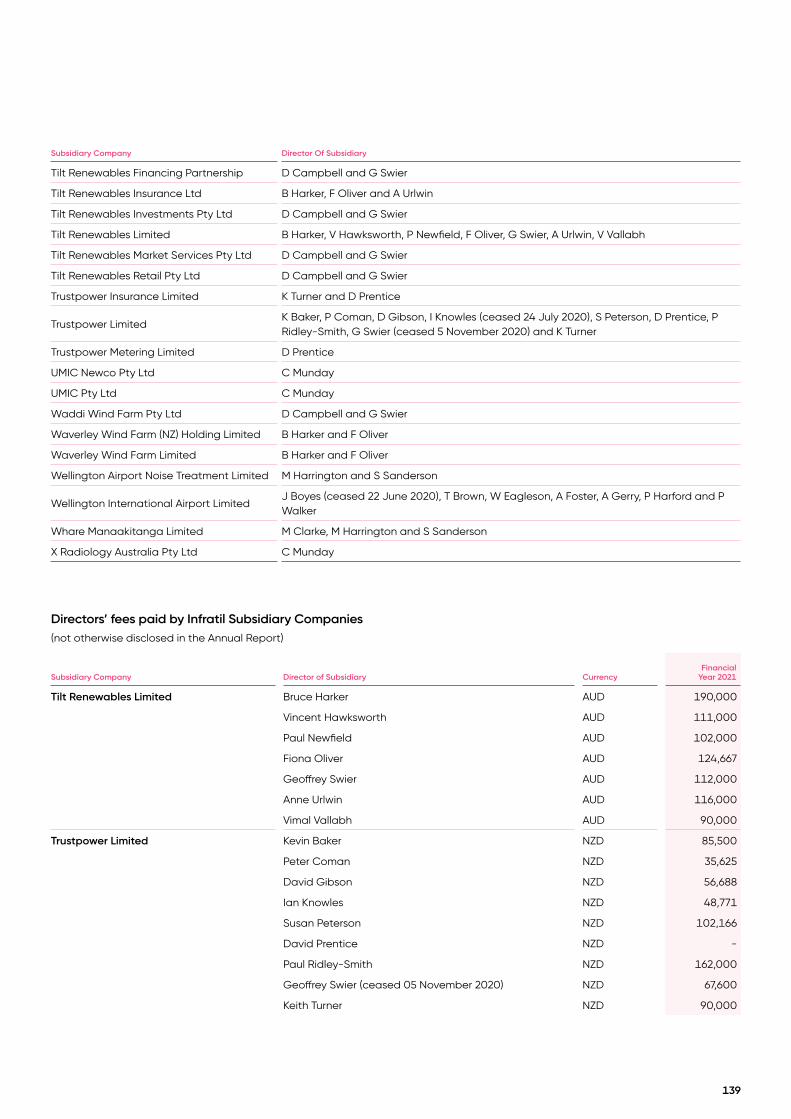
Subsidiary Company Director Of Subsidiary
Tilt Renewables Financing Partnership D Campbell and G Swier
Tilt Renewables Insurance Ltd B Harker, F Oliver and A Urlwin
Tilt Renewables Investments Pty Ltd D Campbell and G Swier
Tilt Renewables Limited B Harker, V Hawksworth, P Newfield, F Oliver, G Swier, A Urlwin, V Vallabh
Tilt Renewables Market Services Pty Ltd D Campbell and G Swier
Tilt Renewables Retail Pty Ltd D Campbell and G Swier
Trustpower Insurance Limited K Turner and D Prentice
Trustpower LimitedK Baker, P Coman, D Gibson, I Knowles (ceased 24 July 2020), S Peterson, D Prentice, P Ridley-Smith, G Swier (ceased 5 November 2020) and K Turner
Trustpower Metering Limited D Prentice
UMIC Newco Pty Ltd C Munday
UMIC Pty Ltd C Munday
Waddi Wind Farm Pty Ltd D Campbell and G Swier
Waverley Wind Farm (NZ) Holding Limited B Harker and F Oliver
Waverley Wind Farm Limited B Harker and F Oliver
Wellington Airport Noise Treatment Limited M Harrington and S Sanderson
Wellington International Airport LimitedJ Boyes (ceased 22 June 2020), T Brown, W Eagleson, A Foster, A Gerry, P Harford and P Walker
Whare Manaakitanga Limited M Clarke, M Harrington and S Sanderson
X Radiology Australia Pty Ltd C Munday
Directors’ fees paid by Infratil Subsidiary Companies (not otherwise disclosed in the Annual Report)
Subsidiary Company Director of Subsidiary CurrencyFinancial
Year 2021
Tilt Renewables Limited Bruce Harker AUD 190,000
Vincent Hawksworth AUD 111,000
Paul Newfield AUD 102,000
Fiona Oliver AUD 124,667
Geoffrey Swier AUD 112,000
Anne Urlwin AUD 116,000
Vimal Vallabh AUD 90,000
Trustpower Limited Kevin Baker NZD 85,500
Peter Coman NZD 35,625
David Gibson NZD 56,688
Ian Knowles NZD 48,771
Susan Peterson NZD 102,166
David Prentice NZD -
Paul Ridley-Smith NZD 162,000
Geoffrey Swier (ceased 05 November 2020) NZD 67,600
Keith Turner NZD 90,000
139

Subsidiary Company Director Of Subsidiary CurrencyFinancial
Year 2021
Wellington International Airport Limited Jason Boyes (ceased 22 June 2020) NZD 15,047
Tim Brown NZD 133,952
Wayne Eagleson NZD 80,371
Andrew Foster NZD 66,976
Alison Gerry
Phillippa Harford
NZD
NZD
80,371
51,929
Phillip Walker NZD 75,906
Qscan Group Holdings Newco Pty Ltd
(acquisition completed 23 December 2020)
Paul Newfield AUD -
Michael Brook AUD -
John Livingston AUD -
Mark Hansen AUD -
Henry Rice AUD -
Ian Cappe AUD -
Rohit Singh AUD -
Rajeev Jyoti AUD -
Gary Shepherd AUD -
Warwick Lee AUD -
Alan McCarthy AUD -
DonationsThe Group made donations of $1.3million during the year ended 31 March 2021 (2020: $1.0 million).
AuditorsIt is proposed that KPMG be reappointed automatically at the annual meeting pursuant to section 200(1) of the Companies Act 1993.
NZX WaiversDuring Financial Year 2021, Infratil was granted and relied on the following waivers from the NZX Listing Rules (all of which are available on Infratil's website: www.infratil.com/for-investors/announcements):
• On 22 May 2020, Infratil was granted a standing waiver from NZX Listing Rule 5.2.1 (this was originally granted on 8 May 2017 from the previous NZX Listing Rule 9.2.1 and was re-documented under NZX’s transition arrangements for the current NZX Listing Rules). The effect of the waiver is to waive the requirement for Infratil to obtain an Ordinary Resolution from shareholders to enter into a Material Transaction with a Related Party to the extent required to allow Infratil to enter into transactions with co-investors that have also engaged an entity related to H.R.L. Morrison & Co Group LP for investment management or advisory services. The waiver is provided on the conditions specified in paragraph 2 of the waiver decision. During Financial Year 2021, Infratil relied on this waiver for the acquisition of Qscan, as reliance was required to permit Infratil to invest alongside MGIF without obtaining shareholder approval (such approval only being required because Infratil and MGIF are both managed by related entities of H.R.L. Morrison & Co Group LP, making them related parties for the purposes of the NZX Listing Rules).
• On 26 June 2020, Infratil was granted a standing waiver from NZX Listing Rule 7.8.5(b) to the extent that rule would otherwise require Infratil to prepare an appraisal report to accompany any Notice of Meeting at which shareholders will consider and vote on, an Ordinary Resolution in accordance with NZX Listing Rule 4.1.1 and NZX Listing Rule 4.2.1, to approve a proposal for the issue of Infratil ordinary shares to Morrison & Co by way of satisfaction of Infratil’s contractual obligation to pay Incentive Fees to Morrison & Co in accordance with the prescribed payment mechanisms set out in the Management Agreement. The waiver is provided on the conditions specified in paragraph 5 of the waiver decision. During Financial Year 2021, Infratil relied on this waiver in seeking approval from shareholders at the 2020 Annual Meeting to give the Board the option to exercise Infratil’s rights under the Management Agreement to issue shares to Morrison & Co to pay the second instalment of the Financial Year 2020 international portfolio annual incentive fee in 2021.
NZX Corporate Governance CodeInfratil considers that, during Financial Year 2021, Infratil materially complied with the NZX Code, but from time to time there may be recommendations which Infratil does not consider appropriate for it, and where it has adopted alternative arrangements which the Board considers are more appropriate:
• CEO Remuneration: Recommendation 5.3 states that an issuer should disclose the remuneration arrangements in place for the CEO in its annual report. Infratil does not disclose remuneration for the CEO in the Annual Report for the reasons set out in the Corporate Governance Statement.
140
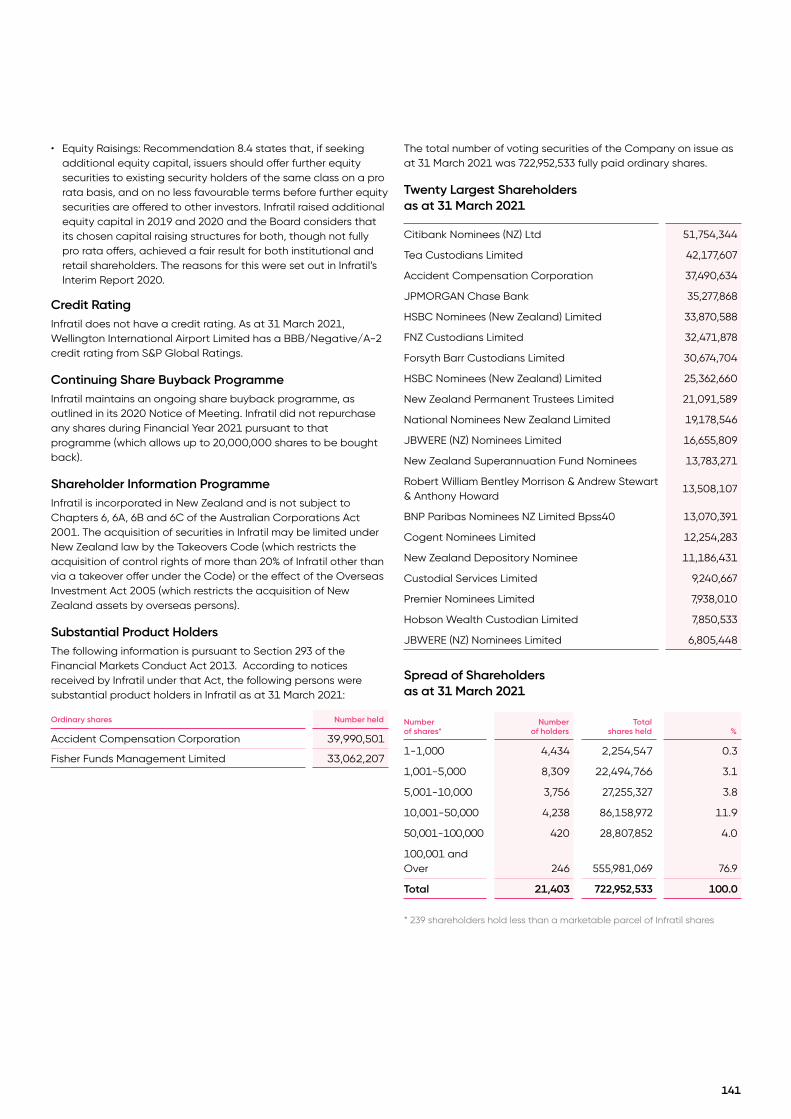
• Equity Raisings: Recommendation 8.4 states that, if seeking additional equity capital, issuers should offer further equity securities to existing security holders of the same class on a pro rata basis, and on no less favourable terms before further equity securities are offered to other investors. Infratil raised additional equity capital in 2019 and 2020 and the Board considers that its chosen capital raising structures for both, though not fully pro rata offers, achieved a fair result for both institutional and retail shareholders. The reasons for this were set out in Infratil’s Interim Report 2020.
Credit RatingInfratil does not have a credit rating. As at 31 March 2021, Wellington International Airport Limited has a BBB/Negative/A-2 credit rating from S&P Global Ratings.
Continuing Share Buyback ProgrammeInfratil maintains an ongoing share buyback programme, as outlined in its 2020 Notice of Meeting. Infratil did not repurchase any shares during Financial Year 2021 pursuant to that programme (which allows up to 20,000,000 shares to be bought back).
Shareholder Information ProgrammeInfratil is incorporated in New Zealand and is not subject to Chapters 6, 6A, 6B and 6C of the Australian Corporations Act 2001. The acquisition of securities in Infratil may be limited under New Zealand law by the Takeovers Code (which restricts the acquisition of control rights of more than 20% of Infratil other than via a takeover offer under the Code) or the effect of the Overseas Investment Act 2005 (which restricts the acquisition of New Zealand assets by overseas persons).
Substantial Product HoldersThe following information is pursuant to Section 293 of the Financial Markets Conduct Act 2013. According to notices received by Infratil under that Act, the following persons were substantial product holders in Infratil as at 31 March 2021:
Ordinary shares Number held
Accident Compensation Corporation 39,990,501
Fisher Funds Management Limited 33,062,207
The total number of voting securities of the Company on issue as at 31 March 2021 was 722,952,533 fully paid ordinary shares.
Twenty Largest Shareholders as at 31 March 2021
Citibank Nominees (NZ) Ltd 51,754,344
Tea Custodians Limited 42,177,607
Accident Compensation Corporation 37,490,634
JPMORGAN Chase Bank 35,277,868
HSBC Nominees (New Zealand) Limited 33,870,588
FNZ Custodians Limited 32,471,878
Forsyth Barr Custodians Limited 30,674,704
HSBC Nominees (New Zealand) Limited 25,362,660
New Zealand Permanent Trustees Limited 21,091,589
National Nominees New Zealand Limited 19,178,546
JBWERE (NZ) Nominees Limited 16,655,809
New Zealand Superannuation Fund Nominees 13,783,271
Robert William Bentley Morrison & Andrew Stewart & Anthony Howard
13,508,107
BNP Paribas Nominees NZ Limited Bpss40 13,070,391
Cogent Nominees Limited 12,254,283
New Zealand Depository Nominee 11,186,431
Custodial Services Limited 9,240,667
Premier Nominees Limited 7,938,010
Hobson Wealth Custodian Limited 7,850,533
JBWERE (NZ) Nominees Limited 6,805,448
Spread of Shareholders as at 31 March 2021
Number of shares*
Number of holders
Total shares held %
1-1,000 4,434 2,254,547 0.3
1,001-5,000 8,309 22,494,766 3.1
5,001-10,000 3,756 27,255,327 3.8
10,001-50,000 4,238 86,158,972 11.9
50,001-100,000 420 28,807,852 4.0
100,001 and Over 246 555,981,069 76.9
Total 21,403 722,952,533 100.0
* 239 shareholders hold less than a marketable parcel of Infratil shares
141
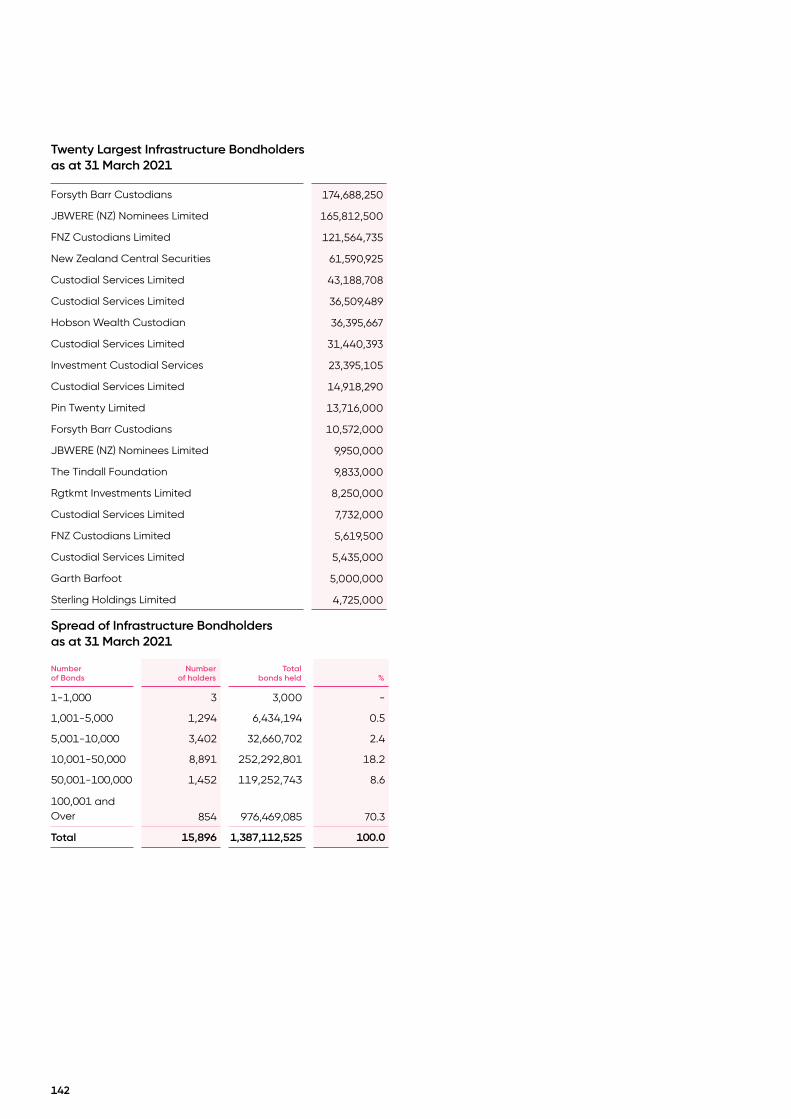
Twenty Largest Infrastructure Bondholders as at 31 March 2021
Forsyth Barr Custodians 174,688,250
JBWERE (NZ) Nominees Limited 165,812,500
FNZ Custodians Limited 121,564,735
New Zealand Central Securities 61,590,925
Custodial Services Limited 43,188,708
Custodial Services Limited 36,509,489
Hobson Wealth Custodian 36,395,667
Custodial Services Limited 31,440,393
Investment Custodial Services 23,395,105
Custodial Services Limited 14,918,290
Pin Twenty Limited 13,716,000
Forsyth Barr Custodians 10,572,000
JBWERE (NZ) Nominees Limited 9,950,000
The Tindall Foundation 9,833,000
Rgtkmt Investments Limited 8,250,000
Custodial Services Limited 7,732,000
FNZ Custodians Limited 5,619,500
Custodial Services Limited 5,435,000
Garth Barfoot 5,000,000
Sterling Holdings Limited 4,725,000
Spread of Infrastructure Bondholders as at 31 March 2021
Number of Bonds
Number of holders
Total bonds held %
1-1,000 3 3,000 -
1,001-5,000 1,294 6,434,194 0.5
5,001-10,000 3,402 32,660,702 2.4
10,001-50,000 8,891 252,292,801 18.2
50,001-100,000 1,452 119,252,743 8.6
100,001 and Over 854 976,469,085 70.3
Total 15,896 1,387,112,525 100.0
142
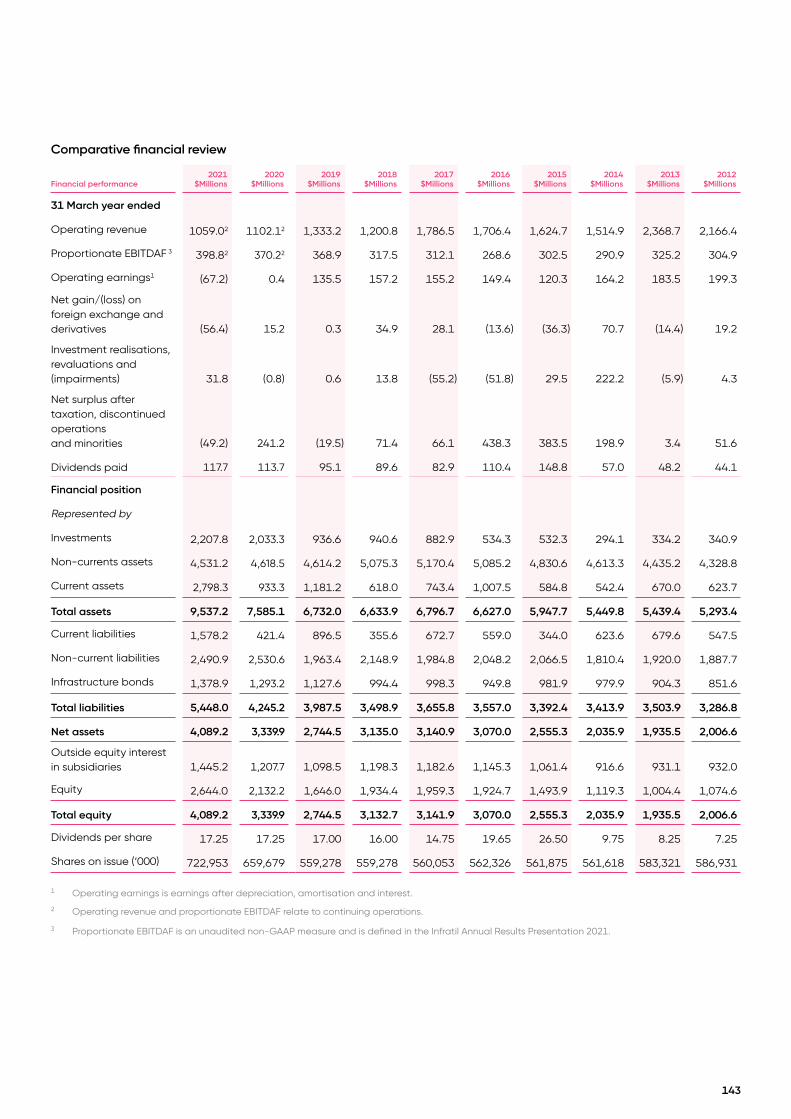
Comparative financial review
Financial performance 2021
$Millions2020
$Millions2019
$Millions2018
$Millions2017
$Millions2016
$Millions2015
$Millions2014
$Millions2013
$Millions2012
$Millions
31 March year ended
Operating revenue 1059.02 1102.12 1,333.2 1,200.8 1,786.5 1,706.4 1,624.7 1,514.9 2,368.7 2,166.4
Proportionate EBITDAF 3 398.82 370.22 368.9 317.5 312.1 268.6 302.5 290.9 325.2 304.9
Operating earnings1 (67.2) 0.4 135.5 157.2 155.2 149.4 120.3 164.2 183.5 199.3
Net gain/(loss) on foreign exchange and derivatives (56.4) 15.2 0.3 34.9 28.1 (13.6) (36.3) 70.7 (14.4) 19.2
Investment realisations, revaluations and (impairments) 31.8 (0.8) 0.6 13.8 (55.2) (51.8) 29.5 222.2 (5.9) 4.3
Net surplus after taxation, discontinued operations and minorities (49.2) 241.2 (19.5) 71.4 66.1 438.3 383.5 198.9 3.4 51.6
Dividends paid 117.7 113.7 95.1 89.6 82.9 110.4 148.8 57.0 48.2 44.1
Financial position
Represented by
Investments 2,207.8 2,033.3 936.6 940.6 882.9 534.3 532.3 294.1 334.2 340.9
Non-currents assets 4,531.2 4,618.5 4,614.2 5,075.3 5,170.4 5,085.2 4,830.6 4,613.3 4,435.2 4,328.8
Current assets 2,798.3 933.3 1,181.2 618.0 743.4 1,007.5 584.8 542.4 670.0 623.7
Total assets 9,537.2 7,585.1 6,732.0 6,633.9 6,796.7 6,627.0 5,947.7 5,449.8 5,439.4 5,293.4
Current liabilities 1,578.2 421.4 896.5 355.6 672.7 559.0 344.0 623.6 679.6 547.5
Non-current liabilities 2,490.9 2,530.6 1,963.4 2,148.9 1,984.8 2,048.2 2,066.5 1,810.4 1,920.0 1,887.7
Infrastructure bonds 1,378.9 1,293.2 1,127.6 994.4 998.3 949.8 981.9 979.9 904.3 851.6
Total liabilities 5,448.0 4,245.2 3,987.5 3,498.9 3,655.8 3,557.0 3,392.4 3,413.9 3,503.9 3,286.8
Net assets 4,089.2 3,339.9 2,744.5 3,135.0 3,140.9 3,070.0 2,555.3 2,035.9 1,935.5 2,006.6
Outside equity interest in subsidiaries 1,445.2 1,207.7 1,098.5 1,198.3 1,182.6 1,145.3 1,061.4 916.6 931.1 932.0
Equity 2,644.0 2,132.2 1,646.0 1,934.4 1,959.3 1,924.7 1,493.9 1,119.3 1,004.4 1,074.6
Total equity 4,089.2 3,339.9 2,744.5 3,132.7 3,141.9 3,070.0 2,555.3 2,035.9 1,935.5 2,006.6
Dividends per share 17.25 17.25 17.00 16.00 14.75 19.65 26.50 9.75 8.25 7.25
Shares on issue (‘000) 722,953 659,679 559,278 559,278 560,053 562,326 561,875 561,618 583,321 586,931
1 Operating earnings is earnings after depreciation, amortisation and interest.
2 Operating revenue and proportionate EBITDAF relate to continuing operations.
3 Proportionate EBITDAF is an unaudited non-GAAP measure and is defined in the Infratil Annual Results Presentation 2021.
143

Directors M Tume (Chairman)
J Boyes
A Gerry
P Gough
K Mactaggart
C M Savage
P M Springford
Company Secretary N Lough
Registered Office - New Zealand5 Market Lane
PO Box 320
Wellington
Telephone: +64 4 473 3663
Internet address: www.infratil.com
Registered Office - AustraliaC/- H.R.L. Morrison & Co Private Markets
Level 31
60 Martin Place
Sydney NSW 2000
Telephone: +61 2 8098 7500
ManagerMorrison & Co Infrastructure Management Limited
5 Market Lane
PO Box 1395
Wellington
Telephone: +64 4 473 2399
Facsimile: +64 4 473 2388
Internet address: www.hrlmorrison.com
Share Registrar - New ZealandLink Market Services
Level 11, Deloitte House
80 Queen Street
PO Box 91976
Auckland
Telephone: +64 9 375 5998
Email: [email protected]
Internet address: www.linkmarketservices.co.nz
Share Registrar - AustraliaLink Market Services
Level 12
680 George Street
Sydney NSW 2000
Telephone: +61 2 8280 7100
Email: [email protected]
Internet address: www.linkmarketservices.com.au
AuditorKPMG
10 Customhouse Quay
PO Box 996
Wellington
Directory
144