innovation and collaboration patterns between … · innovation and collaboration patterns between...
TRANSCRIPT
DPRIETI Discussion Paper Series 15-E-049
Innovation and Collaboration Patternsbetween Research Establishments
INOUE HiroyasuUniversity of Hyogo
NAKAJIMA KentaroTohoku University
SAITO Yukiko UmenoRIETI
The Research Institute of Economy, Trade and Industryhttp://www.rieti.go.jp/en/
RIETI Discussion Paper Series 15-E-049
April 2015
Innovation and Collaboration Patterns between Research Establishments*
INOUE Hiroyasu† University of Hyogo
NAKAJIMA Kentaro‡ Tohoku University
SAITO Yukiko Umeno§
Research Institute of Economy, Trade and Industry
Abstract
This study empirically investigates the determinants of the productivity of knowledge creation by
collaboration. By using the Japanese patent database, we extracted establishment-level patent
co-invention information and found the following results. First, we find an inverse U-shaped pattern
in the relationship between the similarity of knowledge stocks and the quality of patents. That is,
moderate diversity in knowledge stocks between establishments rather than extreme similarity or
extreme diversity is important for knowledge creation. Second, focusing on the differences in
technology class, we find an inverse U-shaped pattern except in the lowest technologies, and the
peak of the inverse U-shape is larger in the higher technologies. This implies that the common
knowledge between establishments is important in the higher technologies. Third, we find that the
physical distance between collaborating establishments has a negative effect on the quality of
patents.
Keywords: Diversity, Knowledge creation
JEL codes: O31; R11; D23
RIETI Discussion Papers Series aims at widely disseminating research results in the form of professional
papers, thereby stimulating lively discussion. The views expressed in the papers are solely those of the
author(s), and neither represent those of the organization to which the author(s) belong(s) nor the Research
Institute of Economy, Trade and Industry.
*We thank Masahisa Fujita, Nobuaki Hamaguchi, Keisuke Kondo, Tomoya Mori, Yasuyuki Todo, and Isamu Yamauchi for their helpful comments. This study was conducted as a part of the Inter-organizational and Inter-inventors Geographical Proximity and Networks project undertaken by the Research Institute of Economy, Trade and Industry (RIETI). We thank the Center for Spatial Information Science, University of Tokyo for providing us with the geocoding service. We gratefully acknowledge the financial support from the Japan Society for the Promotion of Science (Nos. 24530506, 25220502, 25380275, 25780181, and 26245037). †Graduate School of Simulation Studies, University of Hyogo, Computational Science Center Building, 7-1-28 Minatojima-minamimachi, Chuo-Ku Kobe 650-0047, Japan ‡Faculty of Economics, Tohoku University, 27-1 Kawauchi Aoba-ku, Sendai 980-8576, Japan §Research Institute of Economy, Trade, and Industry, 1-3-1, Kasumigaseki Chiyoda-ku, Tokyo 100-8901, Japan
1
1. Introduction
The exchange of ideas between researchers is crucial for knowledge creation. Different researchers have a
different knowledge stock, which causes the exchange of different ideas. However, how large should the
optimal difference in knowledge stocks between researchers be for innovation? Is a larger difference better?
There is much debate on the role of the diversity of knowledge stocks on innovation.
Empirical research on innovation mainly focuses on the diversity of workers’ characteristics, such as gender
and ethnicity, as proxies for the difference in knowledge stocks. In fact, many studies have explored the
role of diversity in innovation and found that more diversity is better for innovation (Breschi, Lissoni, and
Malerba, 2003; Garcia-Vega, 2006; Østergaard, Timmermans, and Kristinsson, 2011).
On the other hand, Berliant and Fujita’s (2008) seminal study theoretically pointed out the nonlinear effects
of diversity on knowledge creation. They pointed out that common knowledge between collaborating
agents is also important. Common knowledge between agents enables them to communicate with each
other, and as a result, they exchange different ideas effectively. That is, moderate diversity in knowledge
stocks between agents rather than extreme similarity or extreme diversity is important for knowledge
creation.
This study empirically tests the nonlinear effect of diversity on knowledge creation by using
establishment-level collaborations from Japanese patent data. Long panel establishment-level collaboration
data in patent creation enables us to capture the similarity/diversity between knowledge stocks of
collaborating establishments. First, we define knowledge stocks in an establishment through the
establishment’s history of patent applications. In particular, we define knowledge stocks in an
establishment as a vector whose elements contain the numbers of the establishment’s applied patents in
each technology class. Then, we define the knowledge similarity between collaborating establishments by
the correlation coefficient of these knowledge stock vectors in each establishment.
This study also focuses on the physical distance between collaborating establishments. Inoue, Nakajima,
and Saito (2013) found that the collaborating relationships between establishments in inventing patents are
geographically localized. This implies that physical distance impedes the collaborations between
establishments. Similarly, physical distance may also matter to the quality of the collaborative patent. This
study estimates how much the geographic distance affects the quality of patents.
As the results, we find an inverse U-shaped pattern between similarity of knowledge stocks and quality of
patents, which strongly supports Berliant and Fujita’s (2008) theoretical prediction. Furthermore, we find
2
that the geographical distance between collaborating establishments has a weak negative effect on the
quality of patents. Second, focusing on the differences in technology class, we find inverse U-shaped
pattern except in lowest technologies, and the peak of the inverse U-shape is larger in the higher
technologies. This implies that the common knowledge between establishments is important in the higher
technologies. Third, we find that the physical distance between collaborating establishments has a negative
effect on the quality of patents.
The next section presents our data and demonstrates how to extract establishment information from the
patent database. Section 3 discusses the empirical strategy and provides definitions of variables. Section 4
shows the result, and Section 5 summarizes and discusses the implication of the results.
2. Data
We extracted establishment-level co-invention dataset from 1993 to 2008 in Japan. We utilized the Institute
of Intellectual Property patent database (Goto and Motohashi, 2007), which includes all patent publications
(the Patent Gazette) in Japan. This database includes basic patent information such as patent ID;
application date, publication date, names and addresses of applicants; and names and addresses of
inventors. The database also includes the number of citations received by each patent. The citation
information is based on citations included in patents and given by reviewers. We used recorded patents
rather than published patents. In Japan, applicants cannot acquire patent rights through patent applications
only. Patents have to pass reviews and must be recorded with payment of fees. That is, recorded patents are
generally better in quality than patents that are just applied for.
Note that the publication date differs from the application date because of the reviewing time. To
appropriately capture the timing of collaboration activities, we used the application date because it is closer
to the timing of collaboration. We then restricted our sample to patents that were applied for from 1986 to 2005.
From this database, we identify patent-creating establishments by taking advantage of a convention of the
Japanese patent system in which inventors register the address of the establishments to which they belong
under “inventor’s address” (Inoue, Nakajima, and Saito, 2013, 2014).
Here, we describe the algorithm for how to identify the establishments from our patent database, following
Inoue, Nakajima, and Saito (2013, 2014). First, firms are identified through the names and addresses of
applicants. We define a firm as an applicant when its name includes the term “company limited” or
“kabushikigaisha” in Japanese. This definition simultaneously excludes all relatively small firms, such as
private limited companies. Second, the patent-creating establishments are identified as follows. We check
3
whether the firm’s name is included in the inventor’s address. We then consider the inventor’s address with
the firm name as the address of the establishment owned by the firm.
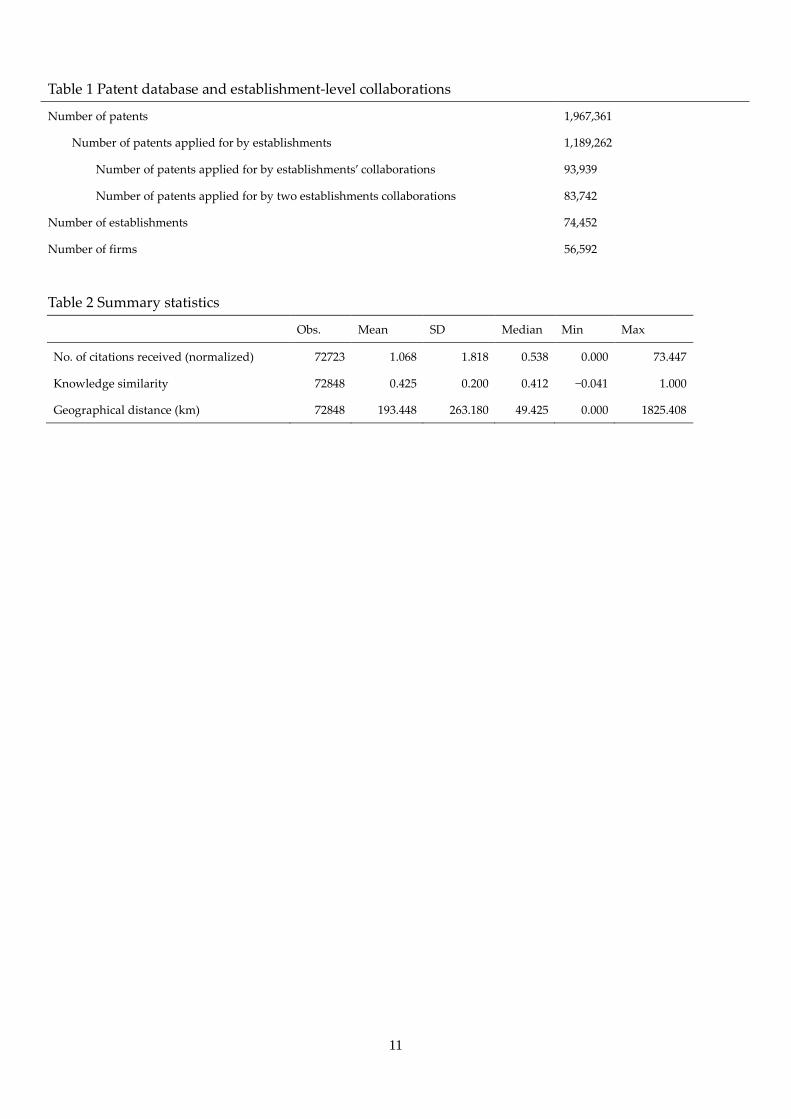
Using this identification method, we gathered the following information. Table 1 gives a summary of the
dataset. The dataset includes 1,967,361 patents. 1,189,262 patents out of them are applied for by
establishments. On the collaboration, number of patents applied for by establishments’ collaborations are
93,939. In the analysis, we use only on the collaborations between two firms because we focus on the
bilateral relationships. Number of patents applied for by two establishments collaborations are 83,742. The
number of firms as applicants is 56,592. The number of patent-creating establishments is 74,452.
[Table 1 here]
3. Empirical Strategy
This study aims to estimate the effect of the similarity of knowledge stocks between collaborating
establishments on the quality of patents created by their collaboration. The estimation equation is as
follows:
log�quality𝑝𝑝𝑝� = 𝛼 + 𝛽1similarity𝑝𝑝𝑝 + 𝛽2(similarity𝑝𝑝𝑝)2 + 𝑍𝑝𝑝𝑝′ 𝛿 + 𝜀𝑝𝑝𝑝 ,
where log�quality𝑝𝑝𝑝� is the log of quality of patent 𝑝 created by the collaboration between establishments
𝑖 and 𝑗, similarity𝑝𝑝𝑝 is the similarity of knowledge stocks between establishments 𝑖 and 𝑗 at the point of
application for patent 𝑝, 𝑍𝑝𝑝𝑝 is the other characteristics of establishments 𝑖 and 𝑗, and their relationships,
and 𝜀𝑝𝑝𝑝 is the error term. We estimate this equation by ordinary least squares.
To measure knowledge quality, we use the number of received citations for each patent. Because the
number of received citations is larger for older patents and differs depending on their technology class, we
normalized the number of received citations by dividing it by the average number of received citations in
all the patents applied for in the same year and in the same technology class (Hall and Jaffe 2000;
Trajtenberg, 1990).
Next, we define the similarity of the knowledge stocks. First, we define the knowledge stock in each
establishment through its history of patent applications. The number of applied patents in each technology
class prior to the establishment’s application for a patent constitutes the knowledge stock of the
establishment in that period. That is, we define knowledge stock as a vector whose elements contain the
numbers of applied patents in each technology class (Benner and Waldfogel, 2008). Second, we define the
4
knowledge similarity between collaborating establishments. When two establishments apply for a patent
through collaboration, each establishment has its own knowledge stock as a vector whose elements contain
the number of applied patents in each technology class. We define knowledge similarity as the correlation
coefficient for these two knowledge stock vectors. In the estimation, we add the quadratic term of this
variable to capture the nonlinear effect of similarity on patent quality.
As the other covariates 𝑍𝑝𝑝𝑝′ , we first introduce geographic distance between collaborating establishments,
which is found to cause collaborating friction. Inoue, Nakajima, and Saito (2013) found that
establishment-level collaborations are significantly localized. This suggests the difficulty of collaborations
between geographically remote establishments. Geographical distance may also reduce the quality of
patents. To capture this effect, we include the physical distance between collaborating establishments as 𝑖
and 𝑗.
We also control for the establishments’ characteristics. The levels of creativity at establishments affect the
quality of their collaborating patents independently from the collaboration characteristics. To control for
the establishment’s creativity, we include the total number of patent inventions from each establishment.
Furthermore, to capture the establishment’s tendency to undertake collaborative works, we include the
total number of collaborative patents from each establishment.
This regression approach focuses on the bilateral relationship between establishments. Therefore, we
restrict our sample to patents created by two establishments. As Table 1 shown, most of the patents created
in collaborations remain in our focus sample.
Table 2 shows the summary statistics of these variables.
[Table 2 here]
4. Results
4.1. Baseline result
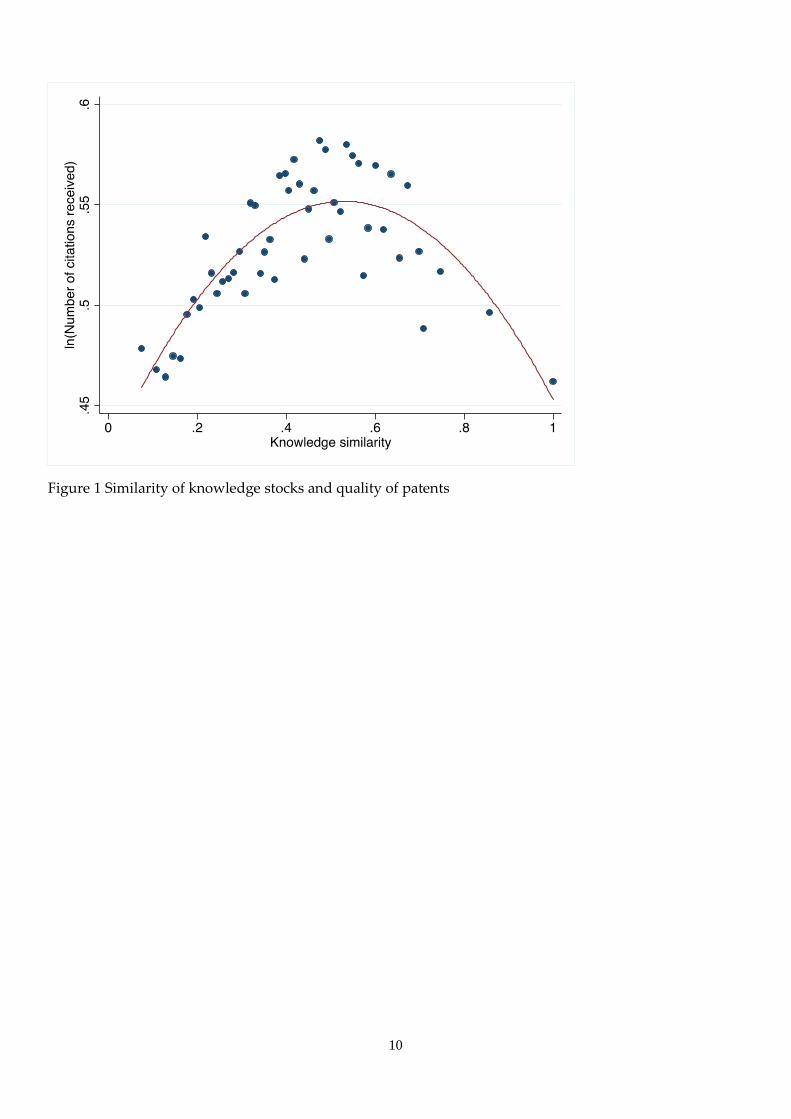
Figure 1 shows the relationship between patent quality and similarity of knowledge stocks by binned
scatterplot. The horizontal axis represents knowledge similarity, and the vertical axis represents patent
quality (log of the normalized number of citations received). We group the knowledge similarity into
equal-sized bins. Then, we compute the means of knowledge similarity and patent quality for each bin and
scatterplot. We can clearly see the inverse U-shaped pattern. That is, both extreme similarity and extreme
diversity of knowledge stocks are not suitable for innovation.
5
[Figure 1 here]
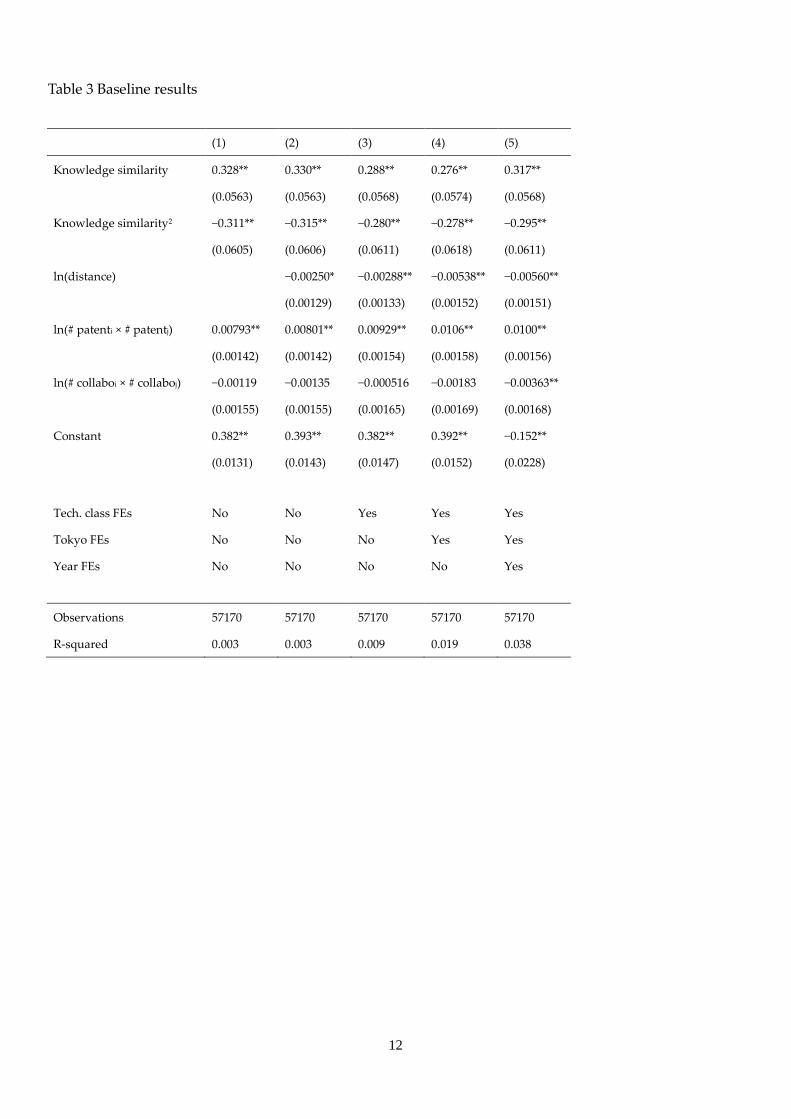
Table 3 shows the estimation results. Column 1 shows the baseline result for the overall period from 1990 to
2005. First, the coefficient for similarity of knowledge is positively significant at the 5% level. Furthermore,
the coefficient for the quadratic term of similarity of knowledge is negatively significant at the 5% level.
This clearly shows the inverse U-shaped pattern of similarity of knowledge stocks in relation to patent
quality. The peak of this inverse U-shape locates 0.567 in similarity. This is very similar to the peak in
Figure 1.
Next, we introduce geographic distance into the estimation equation. Column 2 shows the result. Even if
we control for the distance, the inverse U-shaped pattern can be observed as significant. Interestingly, the
coefficient for the log of physical distance between collaborating partners is negatively significant. This
implies that physical distance may impede the quality of collaborative work.
In this study, we measure patent quality through number of citations. As mentioned above, our normalized
numbers of citations are divided by the average of the number of citations in the same year and in the same
technology class. We especially classified technologies based on three letters in the International
Technological Classification (IPC). However, to control for the remaining technology class heterogeneity,
we introduce three-digit fixed technology class effects. The result is shown in column 3. Even if we control
for that, the results are unchanged.
Patent quality is also affected by the establishments’ locations. In fact, it is indicated that creative
establishments are heavily concentrated in large urban metropolitan areas (Inoue, Nakajima, and Saito,
2014). To control for location effects, we introduce fixed Tokyo effects in the equation, but the results are
unchanged (Column 4). Finally, to capture the periodical characteristics of patent quality, we introduce
fixed year effects, but results are unchanged (Column 5).
In summary, we can robustly find the inverse U-shaped pattern between similarity of knowledge stocks
and patent quality. This inverse U-shaped pattern is robust if we control for the establishment’s creativity
and any other characteristic of collaboration. Furthermore, the coefficient for the log of physical distance
between collaborators is negatively significant. This implies that difficulty of collaboration between
geographically remote establishments may reduce the quality of collaborative patents. Because
collaborations in knowledge creation require face-to-face communications that promote intensive
discussions, sharing tacit information, and so on, geographic remoteness can be considered to impede
communications and reduce the quality of patents.
6
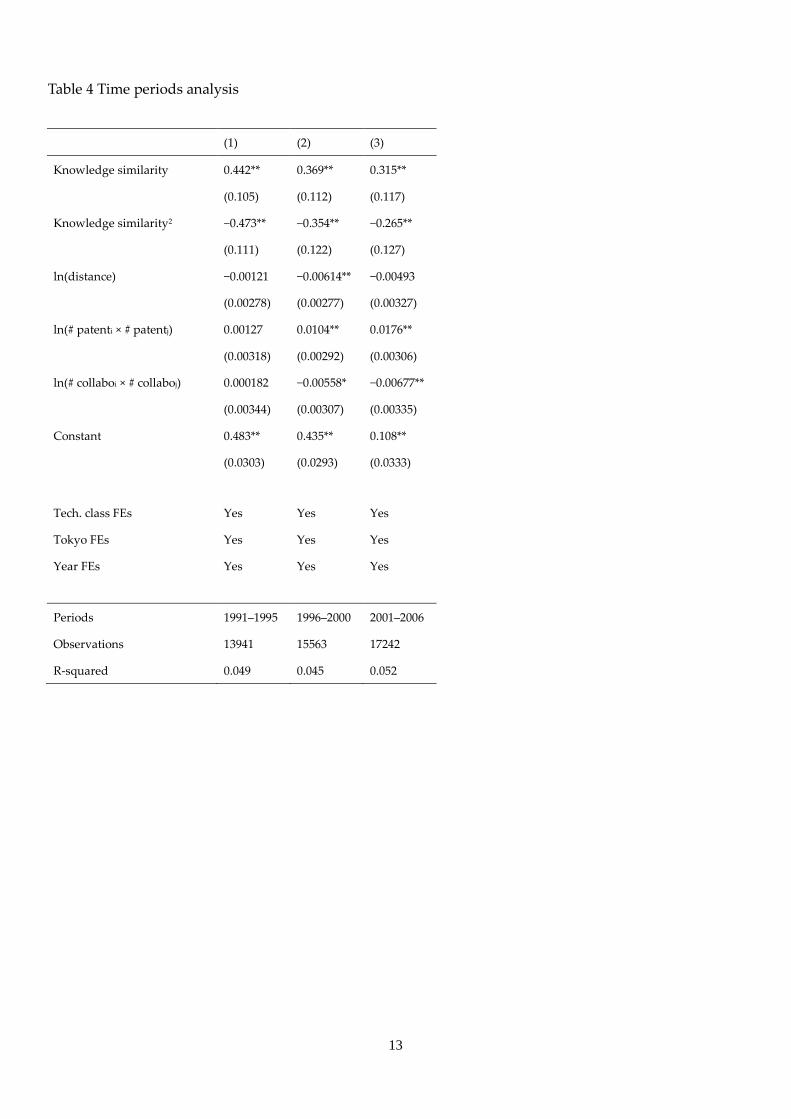
4.2. Time periods
The inverse U-shaped pattern and the role of geographical distance would change with different time
periods. We next conduct the same estimation by a five years window. We use the specification that
introduces fixed technology class, Tokyo, and year effects.
Table 3 shows the results. Column 1 shows the result from 1990 to 1995, column 2 shows that from 1996 to
2000, and column 3 shows that from 2001 to 2006. First, the inverse U-shaped pattern between knowledge
similarity and patent quality can be observed for every period. Furthermore, peaks of the inverse U-shapes
increase per period (0.467, period from 1991 to 1995; 0.521, period from 1996 to 2000; and 0.594, period from
2001 to 2005). This increase of peaks might represent technological progress over the years. Relative to the
earlier periods, recent patents are more technologically advanced, and the required background knowledge
also increases and becomes more specialized. The increase of specialization in each establishment makes it
difficult to communicate with each other, and this may increase the required similarity of background
knowledge stocks between collaborators.
On the other hand, the coefficients for the log of physical distances are not robustly significant in all the
periods. They are only negatively significant in the period from 1996 to 2000. This result contrasts the
results by Inoue, Nakajima, and Saito (2013). They found that geographical distance caused strong frictions
in forming collaboration relationships through the periods in two decades. The difference between our
result and that of Inoue, Nakajima, and Saito (2013) suggests that geographical distance works as an
impediment for forming collaborative relationships, but distance does not work as an impediment on the
quality of the collaborative work in all the periods.
[Table 3 here]
4.3. Technology difference
The role of knowledge similarity may be different throughout technology classes. Patents in
high-technology classes require more advanced knowledge, and this makes it difficult to communicate
with each other. Under these circumstances, sharing common knowledge would become more important.
In this section, we categorize patents by their technology classes, and investigate the inverse U-shaped
pattern in knowledge similarity.
7
4.3.1. Definition of technology class groups
For the analysis, we need to define the height of technology. In general, a higher technology class requires
more investments for invention. Therefore, we define the height of technology by the share of R&D
investment. That is, the technology class that requires more investment for invention can be defined as a
high-class technology.
However, our patent database does not include such R&D information. Therefore, we merge several
databases and obtain information on the share of R&D investments over the total sales in each patent
technology class. The detailed methodology is as follows.
R&D investment information can be obtained from the Basic Survey of Japanese Business Structure and
Activities. It covers firms in the all industries with more than 50 employees and capital stock of over 30
million yen. This database includes each firm’s sales, R&D investment, and industry code (JSIC). We create
R&D intensity by dividing aggregated R&D investment and sales for each three-digit level industry code.
Next, we identified the correspondence between three-digit level industry codes and patent technology
classes. Each patent provides information of the applicant’s name and address; that is, the names and
addresses of firms, which we merge with the Tokyo Shoko Research (TSR) firm database. The TSR covers
826,169 Japanese firms, which is more than half of the total number of firms in Japan. This database
includes the industry code for each firm. Merging TSR data with the patent database by the firm’s name
and address information, we obtain the applicant firms’ industry information for each patent.
Using the merged patent database, we create the composite of the industry code for each technology class.
Precisely, focusing on the patents of one technology class, we calculate the number of patents per industry
to which each applicant firm belongs.
Finally, by using information on industry-level R&D investment shares, and by calculating the weighted
average of R&D investment shares by the above mentioned industry composite, we obtain information on
patent-technology class level R&D investment shares.1
By using this data, we define four types of technology by the quantile of R&D investment shares: low,
mid-low, mid-high, and high technology. Patent technology classes with R&D investment shares that locate
the first quantile are defined as a low-technology class. Similarly, patent technology classes with R&D
1 Results are available upon request.
8
investment shares that locate the fourth quantile are defined as high-technology classes.
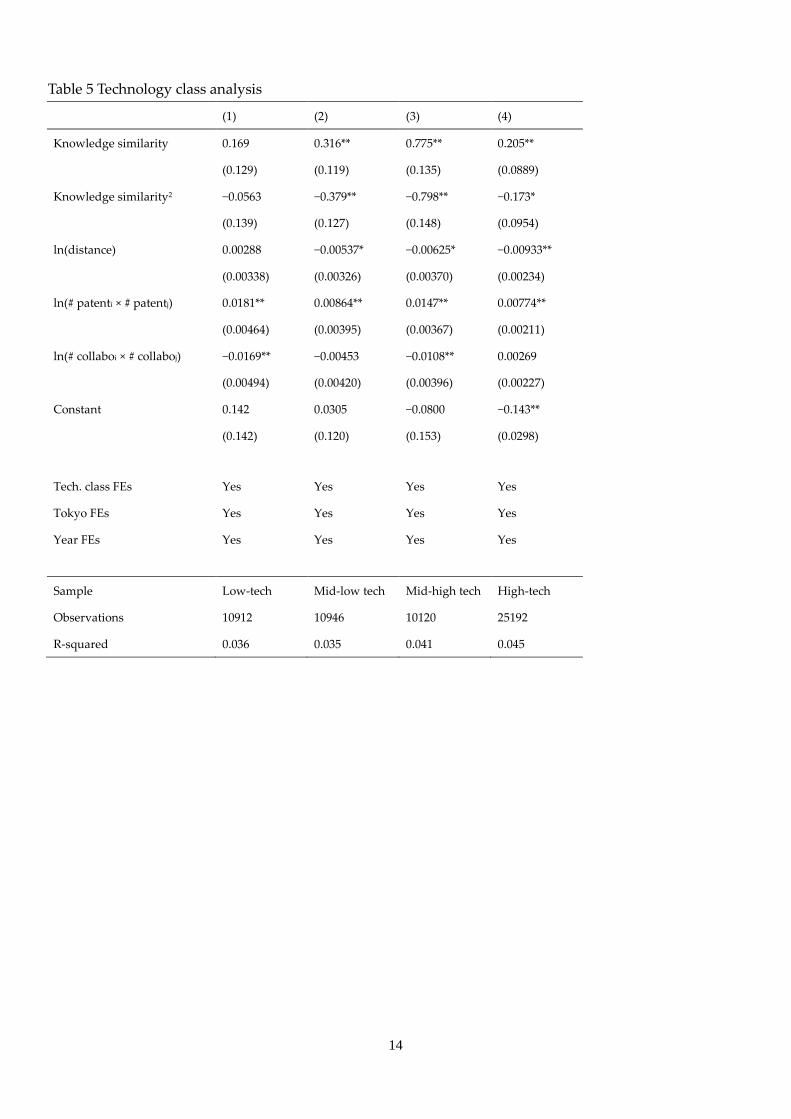
4.3.2. Estimation results
We estimate the equation by categorizing samples according to the four technology classes. Results are
shown in Table 5. Column 1 shows the results for the low-tech patent classes. We cannot find any
significant inverse U-shaped patterns in knowledge similarity and quality of patent. In the low-tech patent
creation, diversity of knowledge does not work. Columns 2, 3, and 4 show the results for mid-low tech,
mid-high tech, and high-tech patent classes, respectively. First, in columns 2, 3, and 4, we can observe
significant inverse U-shaped patterns in knowledge similarity and quality of patents. Inverse U-shaped
patterns can be observed in the relatively high-technology patents. Furthermore, interestingly, peaks of
inverse U-shapes increase with the height of the technology (0.417, mid-low tech; 0.486, mid-high tech; and
0.592, high-tech). This implies the importance of common knowledge for the higher technologies. This may
result from the fact that when there is collaboration in the high technology classes, each collaborating
establishment specializes in a specific field of advanced knowledge, and this makes it difficult to
communicate with each other.
[Table 5 here]
5. Discussion
This study has investigated the determinant for the quality of knowledge creation in collaborative work by
using Japanese patent data. We obtained the following results from our estimations. First, throughout the
periods and specifications, we robustly find inverse U-shaped patterns in the similarity of knowledge
stocks and quality of patents. This strongly supports Berliant and Fujita’s (2008) theoretical prediction. To
achieve high-quality knowledge creation, both extreme similarity and extreme diversity are not efficient.
Moderate diversity, which means sharing a certain amount of common knowledge, is important for
high-quality knowledge creations. However, previous empirical studies on the diversification of innovation
do not consider the importance of common knowledge and focus only on the diversification of workers.
Second, we find that physical distance between collaborators has a negative effect on the quality of patents,
but this effect is not necessarily observed in all periods. Inoue, Nakajima, and Saito (2013) found that
geographical distance caused strong frictions in forming collaboration relationships throughout the period.
This implies that geographical distance works as an impediment for forming collaborative relationships,
but distance does not work as an impediment on the quality of the collaborative work in all the periods.
9
Third, we find heterogeneous patterns in inverse U-shape patterns in relation to technology. In the low-tech
class, there is no inverse U-shaped pattern. On the other hand, we find significant inverse U-shaped
patterns above mid-low technology. Furthermore, peaks of inverse U-shapes increase with the height of the
technology. These imply the importance of common knowledge for the higher technologies, where the
establishments are highly specialized in their own fields.
Following the theory by Berliant and Fujita (2008), under the circumstances, an iteration of collaborations
increases the common knowledge between collaborators, and reduces the productivity of knowledge
creation. Thus, they predict that knowledge-creating agents frequently switch collaborating partners that
have a different knowledge stock. Investigating these switching patterns may be a future project.
References
Berliant, M. and M. Fujita (2008). “Knowledge creation as a square dance on the Hilbert cube,”
International Economic Review, 49(4), pp. 1251–1295.
Benner, M. and J. Waldfogel (2008). “Close to you? Bias and precision in patent-based measures of
technological proximity,” Research Policy, 37(9), pp. 1556–1567.
Breschi, S., F. Lissoni, and F. Malerba (2003). “Knowledge-relatedness in firm technological diversification,”
Research Policy, 32(1), pp. 69–87.
Hall, B and A. Jaffe (2000). The NBER patent citations data file: Lessons, insights and methodological tools.
National Bureau of Economic Research Working Paper 8498.
Inoue, H., K. Nakajima, and Y. U. Saito (2013). “Localization of collaborations in knowledge creation,”
RIETI Discussion Paper Series, 13-E-70.
Inoue, H., K. Nakajima, and Y. U. Saito (2014). “Localization of knowledge-creating establishments,” RIETI
Discussion Paper Series, 14-E-53.
Garcia-Vega, M. (2006). “Does technological diversification promote innovation? An empirical analysis for
European firms,” Research Policy, 35(2), pp. 230–246.
Goto, A. and K. Motohashi (2007). “Construction of a Japanese patent database and a first look at Japanese
patenting activities,” Research Policy, 36(9), pp. 1431–1442.
Østergaard, C., B. Timmermans, and K. Kristinsson (2011). “Does a different view create something new?
The effect of employee diversity on innovation,” Research Policy, 40(3), pp. 500–509.
Trajtenberg, M. (1990). “A penny for your quotes: Patent citations and the value of innovations,” The Rand
Journal of Economics, 21(1), pp. 172–187.
10
Figure 1 Similarity of knowledge stocks and quality of patents
11
Table 1 Patent database and establishment-level collaborations
Number of patents 1,967,361
Number of patents applied for by establishments 1,189,262
Number of patents applied for by establishments’ collaborations 93,939
Number of patents applied for by two establishments collaborations 83,742
Number of establishments 74,452
Number of firms 56,592
Table 2 Summary statistics
Obs. Mean SD Median Min Max
No. of citations received (normalized) 72723 1.068 1.818 0.538 0.000 73.447
Knowledge similarity 72848 0.425 0.200 0.412 −0.041 1.000
Geographical distance (km) 72848 193.448 263.180 49.425 0.000 1825.408
12
Table 3 Baseline results
(1) (2) (3) (4) (5)
Knowledge similarity 0.328** 0.330** 0.288** 0.276** 0.317**
(0.0563) (0.0563) (0.0568) (0.0574) (0.0568)
Knowledge similarity2 −0.311** −0.315** −0.280** −0.278** −0.295**
(0.0605) (0.0606) (0.0611) (0.0618) (0.0611)
ln(distance)
−0.00250* −0.00288** −0.00538** −0.00560**
(0.00129) (0.00133) (0.00152) (0.00151)
ln(# patenti × # patentj) 0.00793** 0.00801** 0.00929** 0.0106** 0.0100**
(0.00142) (0.00142) (0.00154) (0.00158) (0.00156)
ln(# collaboi × # collaboj) −0.00119 −0.00135 −0.000516 −0.00183 −0.00363**
(0.00155) (0.00155) (0.00165) (0.00169) (0.00168)
Constant 0.382** 0.393** 0.382** 0.392** −0.152**
(0.0131) (0.0143) (0.0147) (0.0152) (0.0228)
Tech. class FEs No No Yes Yes Yes
Tokyo FEs No No No Yes Yes
Year FEs No No No No Yes
Observations 57170 57170 57170 57170 57170
R-squared 0.003 0.003 0.009 0.019 0.038
13
Table 4 Time periods analysis
(1) (2) (3)
Knowledge similarity 0.442** 0.369** 0.315**
(0.105) (0.112) (0.117)
Knowledge similarity2 −0.473** −0.354** −0.265**
(0.111) (0.122) (0.127)
ln(distance) −0.00121 −0.00614** −0.00493
(0.00278) (0.00277) (0.00327)
ln(# patenti × # patentj) 0.00127 0.0104** 0.0176**
(0.00318) (0.00292) (0.00306)
ln(# collaboi × # collaboj) 0.000182 −0.00558* −0.00677**
(0.00344) (0.00307) (0.00335)
Constant 0.483** 0.435** 0.108**
(0.0303) (0.0293) (0.0333)
Tech. class FEs Yes Yes Yes
Tokyo FEs Yes Yes Yes
Year FEs Yes Yes Yes
Periods 1991–1995 1996–2000 2001–2006
Observations 13941 15563 17242
R-squared 0.049 0.045 0.052
14
Table 5 Technology class analysis
(1) (2) (3) (4)
Knowledge similarity 0.169 0.316** 0.775** 0.205**
(0.129) (0.119) (0.135) (0.0889)
Knowledge similarity2 −0.0563 −0.379** −0.798** −0.173*
(0.139) (0.127) (0.148) (0.0954)
ln(distance) 0.00288 −0.00537* −0.00625* −0.00933**
(0.00338) (0.00326) (0.00370) (0.00234)
ln(# patenti × # patentj) 0.0181** 0.00864** 0.0147** 0.00774**
(0.00464) (0.00395) (0.00367) (0.00211)
ln(# collaboi × # collaboj) −0.0169** −0.00453 −0.0108** 0.00269
(0.00494) (0.00420) (0.00396) (0.00227)
Constant 0.142 0.0305 −0.0800 −0.143**
(0.142) (0.120) (0.153) (0.0298)
Tech. class FEs Yes Yes Yes Yes
Tokyo FEs Yes Yes Yes Yes
Year FEs Yes Yes Yes Yes
Sample Low-tech Mid-low tech Mid-high tech High-tech
Observations 10912 10946 10120 25192
R-squared 0.036 0.035 0.041 0.045