innovation and entrepreneurship in renewable energyinnovation and entrepreneurship in renewable...
TRANSCRIPT

Innovation and Entrepreneurship in Renewable Energy
Ramana NandaHarvard Business School
Ken YoungePurdue University
Lee FlemingUniversity of California, Berkeley
College of EngineeringUniversity of California, Berkeley
Fung Technical Report No. 2013.07.18 http://www.funginstitute.berkeley.edu/sites/default/!les/Renewable_Energy.pdf
July 18, 2013
130 Blum Hall #5580 Berkeley, CA 94720-5580 | (510) 664-4337 | www.funginstitute.berkeley.edu

Lee Fleming, Faculty Director, Fung Institute
Advisory Board
Coleman FungFounder and Chairman, OpenLink Financial Charles GiancarloManaging Director, Silver Lake PartnersDonald R. Proctor Senior Vice President, O!ce of the Chairman and CEO, CiscoIn Sik RheeGeneral Partner, Rembrandt Venture Partners
Fung Management Lee FlemingFaculty DirectorIkhlaq SidhuChief Scientist and CET Faculty Director Robert Gleeson Executive DirectorKen Singer Managing Director, CET
Copyright © 2013, by the author(s). All rights reserved.
Permission to make digital or hard copies of all or part of this work for personal or classroom use is granted without fee provided that copies are not made or distributed for pro!t or commercial advantage and that copies bear this notice and the full citation on the !rst page. To copy otherwise, to republish, to post on servers or to redistribute to lists, requires prior speci!c permission.
The Coleman Fung Institute for Engineering Leadership, launched in January 2010, prepares engineers and scientists – from students to seasoned professionals – with the multidisciplinary skills to lead enterprises of all scales, in industry, government and the nonpro!t sector.
Headquartered in UC Berkeley’s College of Engineering and built on the foundation laid by the College’s Center for Entrepreneurship & Technology, the Fung Institute combines leadership coursework in technology innovation and management with intensive study in an area of industryspecialization. This integrated knowledge cultivates leaders who can make insightful decisions with the con!dence that comes from a synthesized understanding of technological, marketplace and operational implications.
130 Blum Hall #5580 Berkeley, CA 94720-5580 | (510) 664-4337 | www.funginstitute.berkeley.edu

Innovation�and�Entrepreneurship�in�Renewable�Energy��
Ramana�Nanda�(HBS),�Ken�Younge�(Purdue)��and�Lee�Fleming�(UC�Berkeley)1�
July�2013��
Abstract�
We�document� three� facts� related� to� innovation�and�entrepreneurship� in� renewable�energy.� �First,�we�compare�patenting�by�ventureͲbacked�startups�and�incumbent�firms,�using�data�from�the�US�Patent�and�Trademark�Office.� �Using�a�variety�of�measures,�we�find�that�VCͲbacked�startups�are�engaged� in�more�novel�and�more�highly�cited� innovations,�compared� to� incumbent� firms.� � Incumbent� firms�also�have�a�higher�share�of�patents�that�are�completely�unͲcited�or�selfͲcited,�suggesting�that�incumbents�are�more�likely� to�engage� in� incremental� innovation�compared� to�VCͲbacked�startups.� �Second,�we�document�a�rising� share� of� patenting� by� startups� that� coincided� with� the� surge� in� venture� capital� finance� for�renewable�energy�technologies�in�the�early�2000s.�We�also�show�that�the�availability�of�venture�capital�finance�for�renewable�energy�has�fallen�dramatically�in�recent�years,�with�implications�for�the�rate�and�trajectory� of� innovation� in� this� sector.� � Finally,� we� highlight� a� number� of� structural� factors� about�renewable�energy� that�make� it�hard� to�attract� sustained� financing� from�venture�capital� investors�and�suggest�policies�that�might�facilitate�innovation�and�entrepreneurship�in�renewable�energy.�
�
� �
������������������������������������������������������������1�We�thank�Guido�Buenstorf,�Ronnie�Chaterji,�Jason�Davis,�Chuck�Eesley,�Mazhar�Islam,�Matt�Marx�and�the�participants�at�the�NBER�preͲconference�and�Stanford�Social�Science�and�Technology�Seminar�for�helpful�comments.��Dan�DiPaolo�provided�excellent�research�assistance�and�GuanͲCheng�Li�programmed�the�geographical�visualizations.��For�support�we�thank�the�Division�of�Faculty�Research�and�Funding�at�Harvard�Business�School,�the�Fung�Institute�for�Engineering�Leadership�at�UC�Berkeley,�and�the�National�Science�Foundation�(1064182).�

1. Introduction�The�global�demand�for�energy�is�projected�to�almost�triple�over�the�next�several�decades.��Estimates�suggest�that�a�growing�world�population,�combined�with�rising�living�standards�will�lead�global�energy�consumption�to�reach�about�350,000�TWh�in�2050�from�the�2010�level�of�130,000�TWh.��To�put�this�increase�in�perspective,�it�will�require�the�equivalent�of�setting�up�750�large�coal�burning�power�plants�per�year�for�40�years�in�order�to�meet�to�the�increased�demand�for�energy�in�the�coming�decades.���
Figure�1�provides�a�breakdown�of�the�sources�that�produced�the�energy�consumed�in�2010�based�on�data�from�the�BP�Statistical�Review�of�World�Energy,�2012.��It�highlights�that�87%�of�the�energy�was�produced�from�“conventional�energy”,�namely�Coal,�Oil�and�Natural�Gas.��On�the�other�hand,�Solar,�Wind,�Biomass,�Hydro�and�other�renewables�accounted�for�a�mere�8%�of�global�energy�produced�in�2010.2���
In�addition�to�the�challenges�of�meeting�the�growing�energy�needs�of�the�world’s�population�with�conventional�sources�of�energy,�the�implications�of�continued�dependence�on�fossil�fuels�are�believed�to�be�particularly�stark�for�climate�change.��The�shale�gas�revolution�in�the�US�in�recent�years�has�implied�a�reduced�dependence�on�coal.��Nevertheless,�the�benchmark�of�trying�to�achieve�“zero�emissions”�has�led�the�US�and�several�European�countries�to�focus�more�intensely�on�promoting�innovation�in�renewable�energy�technologies�in�recent�years.��While�there�is�no�clear�winning�alternative�at�present,�there�is�also�a�growing�belief�that�progress�will�come�from�radical�innovations�that�will�allow�us�to�make�the�jump�from�the�status�quo,�whether�it�is�in�renewable�energy�or�other�more�conventional�sources�of�energy�production.��We�examine�the�technological�and�organizational�sources�of�such�innovation�in�renewable�energy,�with�an�eye�towards�understanding�the�factors�that�have�promoted�progress�in�the�past.�
Venture�capital�has�been�a�key�source�of�finance�for�commercializing�radical�innovations�in�the�United�States,�particularly�over�the�last�three�decades�(Kortum�and�Lerner,�2000;�Gompers�and�Lerner,�2002;�Samila�and�Sorenson,�2011).���The�emergence�of�new�industries�such�as�semiͲconductors,�biotechnology�and�the�internet,�as�well�as�the�introduction�of�several�innovations�across�a�spectrum�of�sectors�such�as�healthcare,�IT�and�new�materials,�have�been�driven�in�large�part�by�the�availability�of�venture�capital�for�new�startups.��A�key�attribute�of�ventureͲbacked�innovation�in�the�US�has�been�the�ability�of�private�capital�markets�to�finance�a�wide�variety�of�approaches�in�a�specific�area,�as�opposed�to�choosing�a�specific�winner.��Since�it�is�hard�to�know,�ex�ante,�which�technological�trajectory�will�be�successful�ex�post,�it�seems�vital�that�in�order�to�make�rapid�technological�progress,�we�need�to�proceed�by�conducting�numerous�“economic�experiments”�in�the�energy�sector�(Rosenberg,�1994;�Stern�2003;�Kerr,�
������������������������������������������������������������2�The�BP�study�only�reports�data�on�commercially�traded�fuels,�including�renewable�energy�that�is�commercially�traded.��The�International�Energy�Agency�(IEA)�estimates�a�slightly�higher�share�of�renewables�based�on�estimates�of�the�use�of�wood�chips,�peat�and�other�biomass�used�in�developing�countries�that�is�not�commercially�traded.��Even�so,�their�estimate�of�renewables�including�hydroelectricity�is�13%,�compared�to�the�8%�estimated�by�BP.���
Nanda�and�RhodesͲKropf,�2013).��This�makes�venture�capital�an�ideal�candidate�to�play�a�role�in�financing�radical�innovation�in�renewable�energy�technologies.�
In�fact,�venture�capital�financing�for�renewable�energy�startups�rose�dramatically�in�the�midͲ2000s�after�being�consistently�low�in�the�previous�decades.��Figure�2A�documents�that�between�2006�and�2008,�several�billion�dollars�were�channeled�into�startups�focused�on�solar,�wind�and�biofuels.��In�the�last�few�years,�however,�venture�capital�investment�in�renewable�energy�technologies�has�plummeted,�falling�as�a�share�of�overall�VC�investment�and�even�within�clean�tech,�shifting�away�from�renewable�energy�production�to�investments�in�energy�efficiency,�software,�and�storage�(as�seen�in�Figures�2B�and�2C).�������
In�this�chapter,�we�investigate�the�role�of�venture�capital�in�renewable�energy�innovation�by�comparing�the�patenting�activity�of�VCͲbacked�startups�with�other�types�of�organizations�engaged�in�renewable�energy�innovation.�We�not�only�examine�patenting�rates,�but�also�the�characteristics�of�the�patents�being�filed�by�the�different�types�of�organizations.��Understanding�these�factors�will�help�determine�the�extent�to�which�falling�VC�investment�in�renewable�energy�should�be�seen�as�a�cause�for�concern�as�opposed�to�being�easily�substitutable�by�innovation�by�others�such�as�large�incumbent�firms.��
We�address�these�questions�by�using�patent�data�from�the�U.S.�Patent�and�Trademark�Office�(USPTO)�over�the�thirtyͲyear�period�from�1980�through�2009.��We�find�that�large�incumbent�firms�have�dominated�patenting�in�renewable�energy�for�several�decades.��For�example,�the�top�20�firms�accounted�for�50%�of�the�renewable�energy�patents�and�the�top�50�firms�account�for�nearly�70%�of�such�patents�filed�at�the�USPTO�in�the�early�1990s.��Innovation�became�more�widespread�in�2000s�when�patenting�by�VC�backed�firms�grew,�but�the�top�20�firms�still�accounted�for�40%�of�the�patenting�activity�in�2009.��However,�despite�accounting�for�the�largest�share�of�patents,�we�find�incumbents�are�more�likely�to�file�patents�that�are�either�completely�unͲcited�or�are�selfͲcited,�suggesting�a�greater�focus�on�incremental�or�process�innovation.��Furthermore,�they�are�less�likely�to�have�extremely�influential�patents,�that�we�define�as�being�in�the�top�10�percentiles�of�forward�citations�in�a�given�technology�area�and�given�year.��Finally,�we�create�a�measure�of�novelty�using�textual�analysis�of�the�patent�documents�that�does�not�depend�on�citations.��This�independent�measure�also�suggests�that�on�average,�incumbents�firms�have�been�engaged�in�less�novel�patenting�than�venture�capital�backed�startups,�even�more�so�in�the�period�when�VC�funding�for�startups�increased�dramatically.���
Given�the�important�role�that�VCͲbacked�startups�seem�to�play�in�renewable�energy�innovation�in�the�last�decade,�the�dramatic�fall�in�financing�available�for�such�firms�suggests�that�it�will�have�implications�for�the�nature�of�innovation�we�may�see�going�forward�in�this�sector.��We�highlight�that�at�least�some�of�the�decline�in�VC�financing�for�renewable�energy�is�related�to�structural�factors�that�make�it�very�hard�for�VCs�to�fund�such�startups.��We�therefore�elaborate�on�the�aspects�of�the�institutional�environment�that�have�made�sustained�experimentation�by�VCs�extremely�difficult�in�renewable�energy,�and�suggest�policies�that�may�be�effective�in�helping�to�channel�more�risk�capital�towards�innovation�and�entrepreneurship�in�renewable�energy�technologies.����
The�rest�of�the�chapter�is�structured�as�follows.��In�Section�2,�we�outline�the�data�used�for�our�analysis.��Section�3�provides�a�detailed�description�of�our�main�results�on�the�differences�in�innovation�across�

incumbent�and�ventureͲcapital�backed�firms.��In�Section�4,�we�discuss�the�challenges�faced�by�venture�capital�investors�in�sustaining�the�financing�of�renewable�energy�startups.��Section�5�offers�policies�that�may�make�it�easier�to�finance�such�startups�and�Section�6�concludes.�
2. Data�2.1. Sample�selection�criteria�
Our�focus�in�this�chapter�is�on�patenting�in�sectors�related�to�renewable�energy�production,�namely�solar,�wind,�biofuels,�hydroͲelectric�power�and�geothermal�technologies.�Before�moving�to�a�description�of�the�data,�however,�we�first�outline�the�criteria�for�selecting�our�sample.���
Our�approach�was�to�define�a�set�of�technologies�that�would�first,�allow�us�to�build�a�comprehensive�and�wellͲdelineated�dataset�of�patenting�activity�within�the�chosen�technology,�and�second,�enable�us�to�compare�the�characteristics�of�innovation�between�venture�capital�backed�startups�and�other�firms�engaged�in�innovation.���
This�led�us�to�leave�out�some�technologies�that�are�often�associated�with�clean�energy�production�but�are�not�renewable�energy.��For�example,�although�natural�gas�has�a�lower�carbon�footprint�than�oil�and�coal,�it�is�difficult�to�break�out�innovations�related�to�energy�production�in�this�area,�as�opposed�to�other�businesses�pursued�by�oil�and�gas�companies.�3��On�the�other�hand,�we�have�also�left�out�other�“cleanͲtech”�sectors�that�receive�VC�finance�but�are�not�energy�production.��For�example,�venture�capital�has�been�involved�in�financing�a�number�of�innovations�in�software�related�to�smart�grid�and�energy�efficiency.��These�innovations�are�extremely�difficult�to�isolate�in�a�systematic�manner�from�other�software�patents�that�startups�could�be�working�on�(e.g.�a�GPS�software�that�helps�route�trucks�in�a�manner�that�conserves�fuel�is�hard�to�distinguish�from�other�GPS�patents,�even�when�manually�classifying�patents).���Our�focus,�therefore,�is�on�renewable�energy�production�technologies.��Although�our�scope�is�narrower�than�either�“energy�production”�or�“clean�tech”,�our�hope�is�that�our�tradeoff�buys�us�greater�confidence�in�defining�a�clear�and�consistent�set�of�technologies�within�which�we�can�characterize�both�the�trends�in�patenting�over�time,�and�the�differences�in�the�nature�of�patenting�across�the�various�organizational�forms.�
2.2. Data�used�to�create�the�sample�
We�created�our�sample�using�three�steps.��First,�we�worked�with�a�private�research�firm,�IP�Checkups,�to�define�a�set�of�renewable�energy�patents�at�the�U.S.�Patent�and�Trademark�Office�(USPTO)�in�each�of�the�energy�production�sectors,�of�solar,�wind,�biofuels,�hydro�and�geothermal.��IP�Checkups�has�particular�expertise�in�clean�energy,�including�a�database�of�clean�technology�patents�filed�at�the�US�and�foreign�������������������������������������������������������������3�Similarly,�although�nuclear�energy�is�not�“renewable”,�we�have�collected�data�on�it�given�the�ease�with�which�we�could�classify�patents�in�this�technology�and�the�fact�that�a�few�nuclear�energy�startups�have�recently�been�backed�by�venture�capital�(e.g.�see�Sahlman,�Nanda,�Lassiter�and�McQuade,�2012).�However,�the�level�of�patenting�by�VCͲbacked�startups�in�nuclear�is�extremely�low�in�our�sample,�so�we�have�chosen�not�to�report�the�results�of�nuclear�in�our�main�estimations.��However,�our�results�are�unaffected�by�the�inclusion�or�exclusion�of�nuclear�energy.�
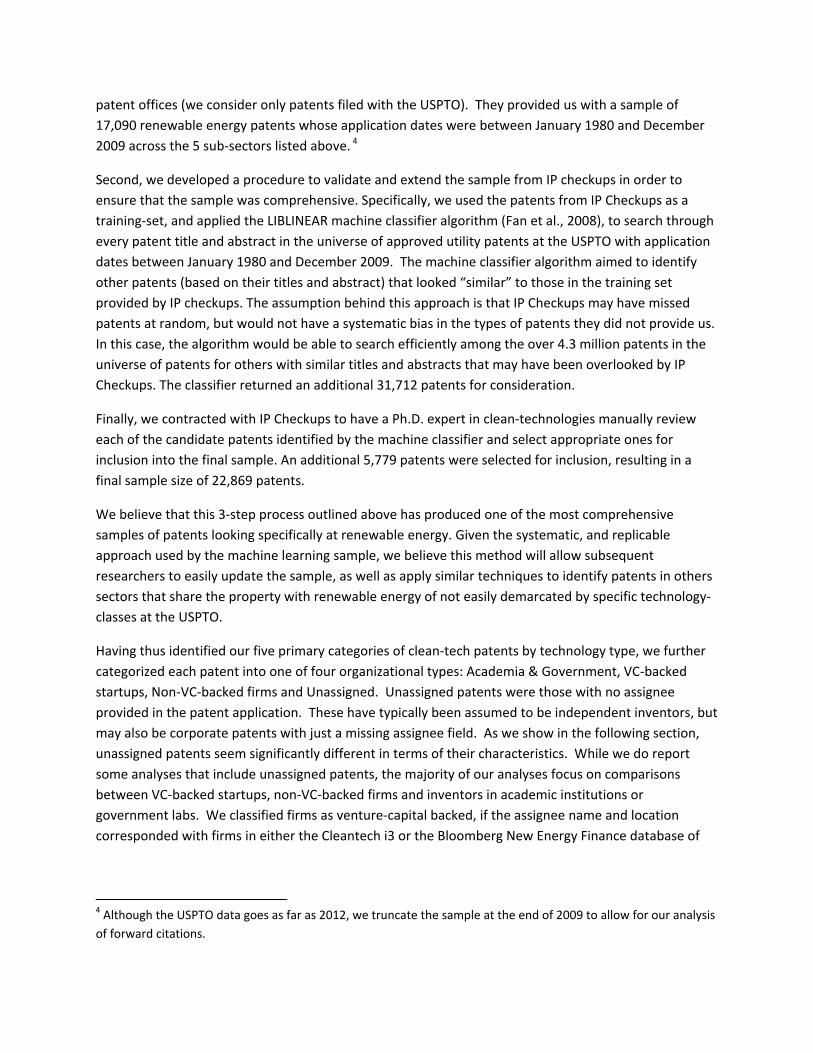
patent�offices�(we�consider�only�patents�filed�with�the�USPTO).��They�provided�us�with�a�sample�of�17,090�renewable�energy�patents�whose�application�dates�were�between�January�1980�and�December�2009�across�the�5�subͲsectors�listed�above.�4���
Second,�we�developed�a�procedure�to�validate�and�extend�the�sample�from�IP�checkups�in�order�to�ensure�that�the�sample�was�comprehensive.�Specifically,�we�used�the�patents�from�IP�Checkups�as�a�trainingͲset,�and�applied�the�LIBLINEAR�machine�classifier�algorithm�(Fan�et�al.,�2008),�to�search�through�every�patent�title�and�abstract�in�the�universe�of�approved�utility�patents�at�the�USPTO�with�application�dates�between�January�1980�and�December�2009.��The�machine�classifier�algorithm�aimed�to�identify�other�patents�(based�on�their�titles�and�abstract)�that�looked�“similar”�to�those�in�the�training�set�provided�by�IP�checkups.�The�assumption�behind�this�approach�is�that�IP�Checkups�may�have�missed�patents�at�random,�but�would�not�have�a�systematic�bias�in�the�types�of�patents�they�did�not�provide�us.��In�this�case,�the�algorithm�would�be�able�to�search�efficiently�among�the�over�4.3�million�patents�in�the�universe�of�patents�for�others�with�similar�titles�and�abstracts�that�may�have�been�overlooked�by�IP�Checkups.�The�classifier�returned�an�additional�31,712�patents�for�consideration.�
Finally,�we�contracted�with�IP�Checkups�to�have�a�Ph.D.�expert�in�cleanͲtechnologies�manually�review�each�of�the�candidate�patents�identified�by�the�machine�classifier�and�select�appropriate�ones�for�inclusion�into�the�final�sample.�An�additional�5,779�patents�were�selected�for�inclusion,�resulting�in�a�final�sample�size�of�22,869�patents.��
We�believe�that�this�3Ͳstep�process�outlined�above�has�produced�one�of�the�most�comprehensive�samples�of�patents�looking�specifically�at�renewable�energy.�Given�the�systematic,�and�replicable�approach�used�by�the�machine�learning�sample,�we�believe�this�method�will�allow�subsequent�researchers�to�easily�update�the�sample,�as�well�as�apply�similar�techniques�to�identify�patents�in�others�sectors�that�share�the�property�with�renewable�energy�of�not�easily�demarcated�by�specific�technologyͲclasses�at�the�USPTO.��
Having�thus�identified�our�five�primary�categories�of�cleanͲtech�patents�by�technology�type,�we�further�categorized�each�patent�into�one�of�four�organizational�types:�Academia�&�Government,�VCͲbacked�startups,�NonͲVCͲbacked�firms�and�Unassigned.��Unassigned�patents�were�those�with�no�assignee�provided�in�the�patent�application.��These�have�typically�been�assumed�to�be�independent�inventors,�but�may�also�be�corporate�patents�with�just�a�missing�assignee�field.��As�we�show�in�the�following�section,�unassigned�patents�seem�significantly�different�in�terms�of�their�characteristics.��While�we�do�report�some�analyses�that�include�unassigned�patents,�the�majority�of�our�analyses�focus�on�comparisons�between�VCͲbacked�startups,�nonͲVCͲbacked�firms�and�inventors�in�academic�institutions�or�government�labs.��We�classified�firms�as�ventureͲcapital�backed,�if�the�assignee�name�and�location�corresponded�with�firms�in�either�the�Cleantech�i3�or�the�Bloomberg�New�Energy�Finance�database�of�
������������������������������������������������������������4�Although�the�USPTO�data�goes�as�far�as�2012,�we�truncate�the�sample�at�the�end�of�2009�to�allow�for�our�analysis�of�forward�citations.��

venture�capital�backed�financings.5��To�classify�assignees�as�university�or�government,�we�used�a�textͲmatching�process�followed�by�manual�review�to�identify�academic�institutions�(assignees�with�words�such�as�“university,”�“universitaet,”�“ecole,”�“regents,”�etc.)�and�governmental�organizations��(assignees�with�words�such�as�“Department�of�Energy,”�“United�States�Army,”�“Lawrence�Livermore,”�“Bundesrepublik,”�etc.)��
Our�residual�category,�therefore,�is�the�category�of�assignees�that�are�notͲVC�backed�and�not�from�academic�institutions�or�the�government.��The�residual�category�can�therefore�be�thought�of�as�incumbent�firms�(keeping�in�mind�the�qualifications�described�above).��As�far�as�possible,�we�manually�matched�subsidiaries�to�their�parent’s�name,�so�that�for�example,�all�known�subsidiaries�of�GE�were�classified�as�GE.��While�this�categorization�is�imperfect,�cases�where�we�missed�matching�a�subsidiary�to�a�parent�will�tend�to�bias�us�towards�finding�less�concentration�in�patenting�and�our�findings�should�be�seen�as�a�lower�bound�to�the�true�level�of�concentration�across�organizations�involved�in�renewable�energy�patenting.���
3. Results�3.1. Patenting�Rates�in�Renewable�Energy�
We�begin�by�providing�an�overview�of�the�patenting�landscape�in�renewable�energy�technologies.��Table�1a�and�Table�1b�provide�a�breakdown�of�the�total�number�of�patents�used�in�our�sample,�broken�down�by�organizational�form�and�technology�area.��Table�1a�reports�the�breakdown�for�the�entire�sample,�while�Table�1b�reports�the�results�for�inventors�who�are�based�in�the�US.6��As�can�be�seen�from�Table�1,�about�85%�of�the�patents�in�our�sample�are�accounted�for�by�solar,�wind�and�biofuels.��Incumbent�firms�account�for�nearly�two�thirds�of�the�patents�in�the�dataset�and�about�55%�of�the�patents�filed�by�USͲbased�inventors.��While�Table�1�provides�a�sense�of�the�most�important�technologies�and�organizational�forms,�it�does�not�give�a�sense�of�shares�over�time�or�the�quality�of�the�innovations.��We�turn�to�these�next.��
������������������������������������������������������������5�Both�databases�have�more�comprehensive�coverage�of�venture�capital�financings�in�clean�energy�than�Thompson�Venture�Economics�and�Dow�Jones�Venture�Source,�that�are�the�two�databases�typically�used�for�studies�on�venture�capital�backed�startups.�
6�Since�our�sample�looks�only�at�patents�at�the�USPTO,�“foreign�inventors”�are�those�who�live�outside�the�US�and�have�chosen�to�patent�their�inventions�in�the�United�States.�Of�course,�there�are�likely�to�be�significant�number�of�renewable�energy�inventions�by�foreign�inventors�that�are�not�patented�at�the�USPTO.�For�example,�a�number�of�patents�related�to�solar�in�Germany�are�not�patented�in�the�US.�However,�given�that�the�US�is�such�an�important�market,�our�prior�is�that�important�patents�would�in�fact�be�patented�in�the�US�in�addition�to�other�countries.�Anecdotal�evidence�suggests�that�this�is�indeed�the�case.��Nevertheless,�the�structure�of�our�sample�does�not�allow�us�to�make�substantive�conclusions�about�US�vs.�Foreign�patents,�or�speak�to�differing�trends�in�patenting�between�US�and�Foreign�inventors�in�renewable�energy�over�time.���
�
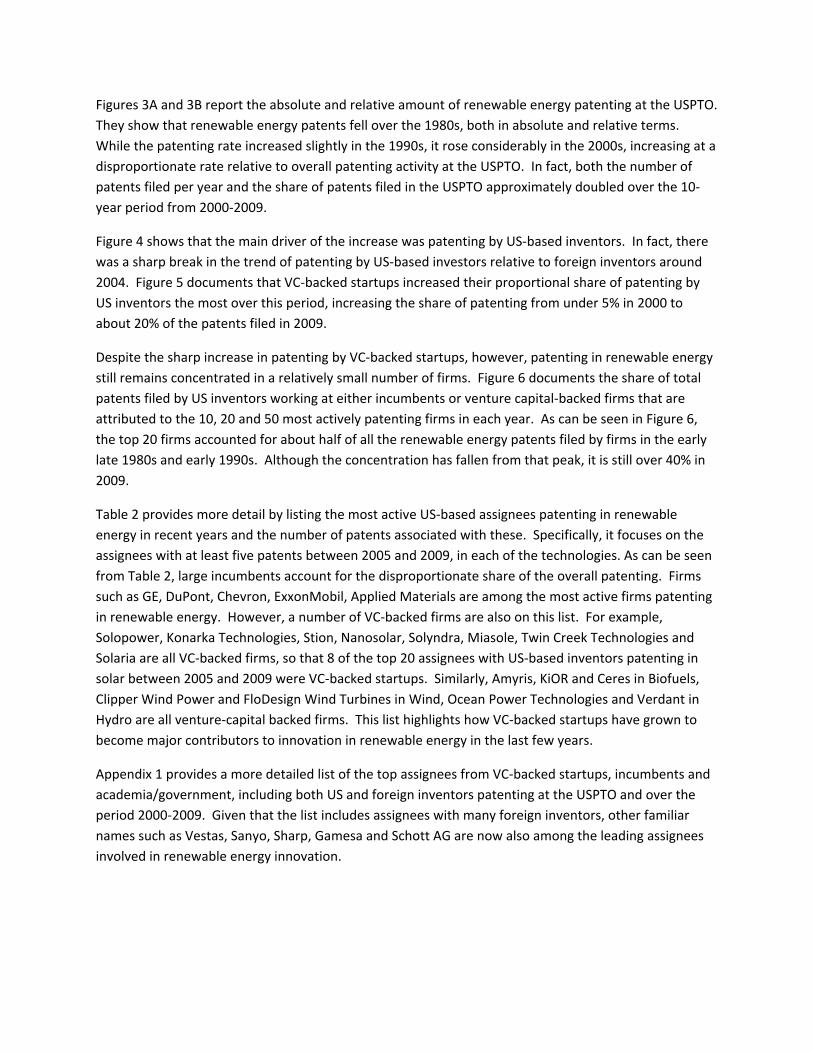
Figures�3A�and�3B�report�the�absolute�and�relative�amount�of�renewable�energy�patenting�at�the�USPTO.��They�show�that�renewable�energy�patents�fell�over�the�1980s,�both�in�absolute�and�relative�terms.��While�the�patenting�rate�increased�slightly�in�the�1990s,�it�rose�considerably�in�the�2000s,�increasing�at�a�disproportionate�rate�relative�to�overall�patenting�activity�at�the�USPTO.��In�fact,�both�the�number�of�patents�filed�per�year�and�the�share�of�patents�filed�in�the�USPTO�approximately�doubled�over�the�10Ͳyear�period�from�2000Ͳ2009.��
Figure�4�shows�that�the�main�driver�of�the�increase�was�patenting�by�USͲbased�inventors.��In�fact,�there�was�a�sharp�break�in�the�trend�of�patenting�by�USͲbased�investors�relative�to�foreign�inventors�around�2004.��Figure�5�documents�that�VCͲbacked�startups�increased�their�proportional�share�of�patenting�by�US�inventors�the�most�over�this�period,�increasing�the�share�of�patenting�from�under�5%�in�2000�to�about�20%�of�the�patents�filed�in�2009.�������
Despite�the�sharp�increase�in�patenting�by�VCͲbacked�startups,�however,�patenting�in�renewable�energy�still�remains�concentrated�in�a�relatively�small�number�of�firms.��Figure�6�documents�the�share�of�total�patents�filed�by�US�inventors�working�at�either�incumbents�or�venture�capitalͲbacked�firms�that�are�attributed�to�the�10,�20�and�50�most�actively�patenting�firms�in�each�year.��As�can�be�seen�in�Figure�6,�the�top�20�firms�accounted�for�about�half�of�all�the�renewable�energy�patents�filed�by�firms�in�the�early�late�1980s�and�early�1990s.��Although�the�concentration�has�fallen�from�that�peak,�it�is�still�over�40%�in�2009.��
Table�2�provides�more�detail�by�listing�the�most�active�USͲbased�assignees�patenting�in�renewable�energy�in�recent�years�and�the�number�of�patents�associated�with�these.��Specifically,�it�focuses�on�the�assignees�with�at�least�five�patents�between�2005�and�2009,�in�each�of�the�technologies.�As�can�be�seen�from�Table�2,�large�incumbents�account�for�the�disproportionate�share�of�the�overall�patenting.��Firms�such�as�GE,�DuPont,�Chevron,�ExxonMobil,�Applied�Materials�are�among�the�most�active�firms�patenting�in�renewable�energy.��However,�a�number�of�VCͲbacked�firms�are�also�on�this�list.��For�example,�Solopower,�Konarka�Technologies,�Stion,�Nanosolar,�Solyndra,�Miasole,�Twin�Creek�Technologies�and�Solaria�are�all�VCͲbacked�firms,�so�that�8�of�the�top�20�assignees�with�USͲbased�inventors�patenting�in�solar�between�2005�and�2009�were�VCͲbacked�startups.��Similarly,�Amyris,�KiOR�and�Ceres�in�Biofuels,�Clipper�Wind�Power�and�FloDesign�Wind�Turbines�in�Wind,�Ocean�Power�Technologies�and�Verdant�in�Hydro�are�all�ventureͲcapital�backed�firms.��This�list�highlights�how�VCͲbacked�startups�have�grown�to�become�major�contributors�to�innovation�in�renewable�energy�in�the�last�few�years.�
Appendix�1�provides�a�more�detailed�list�of�the�top�assignees�from�VCͲbacked�startups,�incumbents�and�academia/government,�including�both�US�and�foreign�inventors�patenting�at�the�USPTO�and�over�the�period�2000Ͳ2009.��Given�that�the�list�includes�assignees�with�many�foreign�inventors,�other�familiar�names�such�as�Vestas,�Sanyo,�Sharp,�Gamesa�and�Schott�AG�are�now�also�among�the�leading�assignees�involved�in�renewable�energy�innovation.���
�
�

3.2 .�Characteristics�of�Patenting�by�Incumbent�vs.�VCͲbacked��Firms�
We�next�compare�the�characteristics�of�the�patents�filed�by�the�different�types�of�organizations.��Our�first�step�is�to�examine�the�citations�to�the�patents�that�they�file.��Since�citations�tend�to�have�a�highly�skewed�distribution,�we�report�the�results�from�count�models.��Table�3�reports�the�results�from�negative�binomial�regressions,�where�the�dependent�variable�is�the�count�of�citations�received�for�each�patent.��Although�we�include�technology�and�year�fixed�effects�to�account�for�fixed�differences�in�patenting�propensities�across�technologies�and�to�account�for�cohort�differences�in�the�number�of�citations,�we�nevertheless�also�account�for�the�fact�that�patents�in�1980�would�have�received�more�citations�than�those�in�1995�by�looking�at�the�cumulative�citations�received�by�patents�five�years�from�the�year�of�application.��Our�measure�of�citations�excludes�selfͲcitations,�so�we�examine�the�influence�of�the�patents�on�other�assignees.���
Columns�1Ͳ3�of�Table�3�report�results�on�both�US�and�foreign�inventors,�while�Columns�4Ͳ6�restrict�the�sample�to�USͲbased�inventors.��We�use�academic�and�government�patents�as�our�reference�group�as�they�are�likely�to�have�remained�the�most�stable�over�the�entire�period.��Table�3�shows�some�interesting�patterns.��First,�as�noted�above�and�consistent�with�prior�findings�(Singh�and�Fleming,�2010),�unassigned�patents�seem�to�be�far�less�influential�than�patents�with�assignees,�both�in�the�full�sample�and�for�USͲbased�inventors.��When�interpreted�as�incidence�rate�ratios,�Column1�in�Table�3�implies�that�unassigned�patents�are�associated�with�a�75%�lower�citation�rate�than�academic�and�government�patents.��Second,�patents�filed�by�incumbent�firms�are�slightly�more�influential�than�academic�patents,�but�only�marginally�so.��The�economic�magnitude�is�small�and�it�is�imprecisely�estimated.��Incumbents�are�associated�with�a�citation�rate�that�is�1.1�times�that�of�university�and�government�patents.��On�the�other�hand,�patents�filed�by�VCͲbacked�firms�are�much�more�likely�to�receive�subsequent�citations.��The�economic�magnitudes�are�large.��The�coefficients�imply�that�VCͲbacked�startups�are�associated�with�a�citation�rate�that�is�1.9�times�that�of�university�and�government�patents.��In�addition,�a�Chi2�test�for�the�difference�in�the�coefficient�between�citations�to�VCͲbacked�firms�and�incumbents�shows�that�the�differences�are�statistically�significant.��The�PͲvalues�lie�well�below�0.05�and�aside�from�Column�4,�are�less�that�0.01�in�each�case.��
The�difference�in�the�overall�level�of�citations�could�come�from�two�different�fronts.��First,�it�is�possible�that�VCͲbacked�firms�have�fewer�marginal,�or�unͲcited�patents,�so�that�the�difference�stems�from�the�left�tail�of�the�citation�distribution�being�better.��Second,�it�is�possible�that�VCͲbacked�firms�are�more�likely�to�have�highlyͲcited�patents,�so�that�even�if�the�left�tail�of�the�distribution�is�no�better,�the�intensive�margin�of�citations�is�higher,�including�a�thicker�right�tail.��To�probe�these�possible�explanations,�we�examine�both�the�share�of�patents�with�at�least�one�citation�and�the�share�of�patents�that�are�highly�cited.���
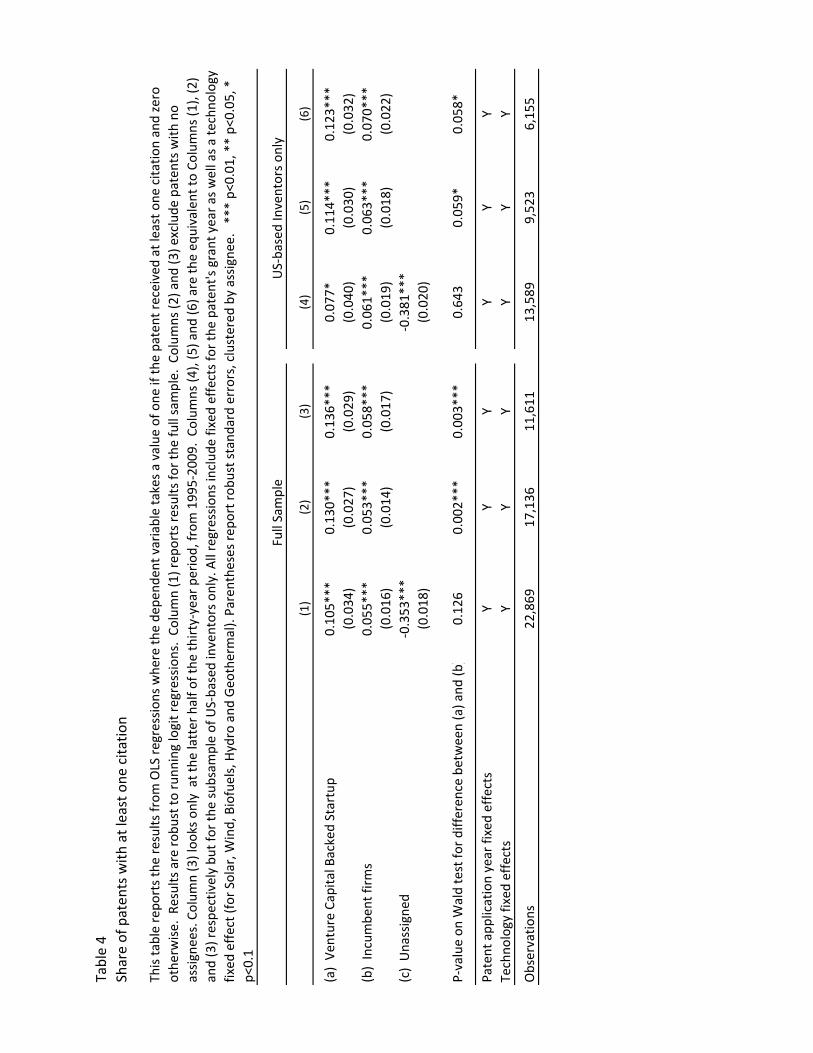
Table�4�reports�the�results�from�OLS�regressions�where�the�dependent�variable�takes�a�value�of�one�if�the�patent�received�at�least�one�citation.��Again,�unassigned�patents�are�far�less�likely�to�receive�a�single�citation.�The�coefficients�imply�a�35Ͳ38�percentage�point�lower�chance�of�being�cited�relative�to�academic�patents,�on�a�baseline�of�a�50%�citation�probability.�Both�VCͲbacked�startups�and�incumbents�have�patents�that�are�more�likely�to�receive�citations�than�patents�by�inventors�in�university�and�

government�labs.��This�of�course,�could�be�due�to�the�basic�nature�of�academic�and�government�R&D.��When�comparing�VCs�and�incumbents,�however,�we�find�that�VCs�have�an�11Ͳ14�percentage�point�higher�likelihood�of�being�cited�relative�to�academic�labs,�compared�to�a�5Ͳ7�percentage�point�higher�probability�for�incumbents.��These�differences�are�statistically�significant,�suggesting�that�on�average,�VCͲbacked�patents�are�less�likely�to�be�marginal�and�more�likely�to�influence�future�R&D.��
Table�5�reports�the�results�from�OLS�regressions�where�the�dependent�variable�is�equal�to�one�if�the�patent�was�highly�cited.�Specifically,�we�define�a�patent�as�being�highly�cited�if�the�citations�for�that�patent�are�in�the�top�10�percent�of�5�year�forward�citations�for�patents�in�that�technology�and�year.��Table�5�shows�that�unassigned�patents�are�much�less�likely�to�have�a�highly�cited�patent.��Since�the�baseline�probability�is�by�definition�about�10%,�the�coefficients�on�unassigned�patents�in�Columns�1�and�4�of�Table�5�point�out�that�the�chance�of�an�such�a�patent�being�highly�influential�is�essentially�zero.��On�the�other�hand,�VCͲbacked�firms�are�almost�twice�as�likely�as�academic�patents�to�be�highly�cited.��Incumbent�firms�have�no�statistically�significant�difference�in�highly�cited�patents�in�the�overall�sample,�and�a�slightly�higher�chance�among�USͲbased�inventors.��However,�importantly,�the�difference�in�the�chance�of�being�highly�cited�between�VCͲbacked�firms�and�incumbents�is�both�statistically�and�economically�significant.���
Thus�far�our�analysis�has�suggested�that�renewable�energy�innovation�by�incumbent�firms�tends�to�be�less�influential.��Innovation�by�incumbents�is�less�likely�to�be�cited�at�all�and�when�it�is,�it�is�less�likely�to�be�highly�cited.��These�results�are�consistent�with�the�literature�that�has�documented�that�incumbent�firms�have�different�goals,�search�process,�competencies�and�opportunity�costs�that�lead�them�towards�more�incremental�innovation�(Tushman�and�Anderson,�1986;�Henderson�and�Clark,�1990;�Tripsas�and�Gavetti,�2000;�Rosenkopf�and�Nerkar,�2001;�Akcigit�and�Kerr,�2011),�although�these�papers�have�not�directly�compared�innovation�by�incumbents�with�that�by�VCͲbacked�startups.�
To�probe�our�results�further,�we�turn�next�to�directly�examine�the�extent�to�which�incumbents�pursue�more�incremental�innovation,�by�examining�the�degree�to�which�they�cite�their�own�prior�work�relative�to�other�types�of�organizations.��Following�Sorensen�and�Stuart�(2000),�we�hypothesize�that�if�firms�are�citing�their�own�patents�at�a�disproportionate�rate,�then�they�may�be�engaged�in�more�“exploitation”�rather�than�“exploration” (March,�1991).��We�therefore�study�the�extent�to�which�inventors�in�the�different�organizational�settings�tend�to�cite�themselves.���
Table�6�reports�the�results�from�negative�binomial�regressions�where�the�dependent�variable�is�the�count�of�the�selfͲcitations�a�focal�patent�makes,�where�a�selfͲcitation�is�defined�as�citing�a�patent�from�the�same�assignee.��The�regressions�control�for�the�total�number�of�citations�the�patent�made,�and�technology�and�patent�application�year�fixed�effects.�As�can�be�seen�from�Table�6,�VCͲbacked�firms�are�no�more�likely�to�cite�themselves�than�academic�labs.��Although�the�coefficient�is�in�fact�negative,�it�is�imprecisely�estimated.��On�the�other�hand,�the�coefficient�on�incumbent�firms�implies�that�they�are�50%�more�likely�to�cite�themselves�compared�to�academic�labs.��Again,�the�difference�between�VC�backed�firms�and�incumbents�is�statistically�significant,�suggesting�that�part�of�the�reason�that�incumbents�have�less�influential�innovations�is�that�they�are�engaged�in�more�incremental�R&D�than�VCͲbacked�startups.�

One�possible�reason�for�not�being�cited�at�all�and�for�citing�one’s�own�work�could�also�be�that�firms�are�engaged�in�extremely�novel�innovations�that�have�not�yet�yielded�citations.��This�could�be�particularly�true�in�nascent�technologies�such�as�renewable�energy.��In�addition,�since�patenting�activity�is�concentrated�in�a�few�incumbent�firms,�it�is�possible�that�some�of�the�higher�selfͲcitation�is�purely�due�to�the�fact�that�the�prior�art�to�be�cited�is�more�likely�to�be�that�of�incumbents�or�that�VCͲbacked�firms�do�not�have�many�prior�patents�to�cite.���
In�order�to�address�these�concerns,�we�use�a�new�measure�of�novelty�that�is�not�based�on�citationͲmeasure.��Instead,�we�draw�on�a�textual�analysis�of�patent�applications�to�look�at�the�similarity�of�patent�claims�and�descriptions�for�patents�in�a�given�technologyͲarea.�Intuitively,�our�definition�is�such�that�patents�with�greater�textual�similarity�to�neighboring�patents�are�considered�to�be�less�novel.�Our�measure�of�novelty�should�be�particularly�useful�in�the�context�of�scienceͲbased�patenting,�where�technical�terms�are�more�unique�and�therefore�more�likely�to�signal�differences�in�the�characteristics�of�innovation,�and�for�more�recent�time�periods,�where�initial�forward�citations�may�be�a�noisy�predictor�of�ultimate�outcomes.�The�measure�also�avoids�problems�with�citationͲbased�measures,�where�citation�patterns�can�suffer�from�selection�biases.�A�more�detailed�description�of�the�measure�is�outlined�in�Appendix�2�(see�also�Younge,�forthcoming,�and�Ullman�and�Rajaraman�2011,�pp.�92Ͳ93).�
As�can�be�seen�from�Table�7,�our�novelty�measure�is�quite�consistent�with�the�other�citationͲbased�measures�of�patenting.��First,�it�highlights�that�in�addition�to�unassigned�patents�not�receiving�many�citations,�they�are�also�less�novel�than�patents�being�developed�in�academic�and�government�labs.��The�regressions�highlight�that�the�novelty�of�the�patents�for�VCͲbacked�startups�is�no�different�from�that�of�academic�labs.��However,�incumbent�firms�have�a�significantly�lower�level�of�novelty.��Although�the�difference�between�the�novelty�of�patenting�by�incumbent�and�VCͲbacked�firms�is�not�significant�for�the�overall�sample,�it�is�close�to�being�significant�at�the�10%�level�for�USͲbased�inventors,�particularly�in�the�latter�part�of�our�sample.���Our�results�therefore�suggest�that�incumbent�firms�have�been�engaged�in�less�novel�and�exploratory�innovation�than�VCs,�in�particular�in�the�US.���
�
4. Venture�Capital�Financing�of�Renewable�Energy�Startups�Thus�far�we�have�documented�that�VCͲbacked�startups�have�increased�their�share�of�patenting�most�substantially�over�the�past�decade�and�that�these�startups�seem�to�be�associated�with�more�radical�and�novel�innovation�than�that�by�incumbent�firms.��The�timing�of�growth�in�renewable�energy�patenting�by�VCͲbacked�firms�is�closely�associated�with�venture�capital�dollars�flowing�into�renewable�energy�startups.��In�2002,�only�43�clean�energy�startups�received�VC�funding�in�the�US,�raising�a�combined�total�of�$�230�M.��In�2008,�over�200�clean�energy�startups�raised�$�4.1�BN�in�venture�capital�in�the�US.7��In�fact,�clean�energy�investments�accounted�for�about�15%�of�the�total�dollars�invested�by�VCs�in�the�US�in�2008,�of�which�a�majority�went�to�renewable�energy�technologies.�
������������������������������������������������������������7�Source:��Ernst�and�Young,�National�Venture�Capital�Association�Press�Releases.�

Although�our�work�cannot�distinguish�whether�VCs�lead�startups�to�engage�in�more�radical�innovation,�or�are�just�able�to�select�more�radical�innovations�than�the�incumbents�tend�to�fund,�it�does�highlight�that�venture�capital�financing�seems�to�have�associated�with�a�more�novel�and�high�impact�innovation�in�renewable�energy,�particularly�in�the�late�2000s�(Conti,�Thursby�and�Thursby,�2012).8��This�seems�important�given�the�need�for�the�widespread�experimentation�required�to�make�progress�in�providing�low�cost,�clean�energy�that�will�support�developing�without�incurring�massive�costs�in�terms�of�climate�change.�To�the�extent�that�the�shift�in�venture�capital�finance�away�from�such�technologies�is�due�to�structural�factors,�this�suggests�that�it�will�have�a�noticeable�impact�on�the�type�of�innovation�being�undertaken�in�renewable�energy�(either�through�the�treatment�or�the�selection�effect�of�venture�capital�investment).�
Needless�to�say,�a�number�of�factors�are�likely�responsible�for�the�rapid�decline�in�VC�financing�for�renewable�energy�startups.��The�economic�collapse�in�2009�had�a�chilling�effect�on�all�venture�capital�investment,�including�clean�energy.��In�addition,�improvements�in�hydroͲfracking�technology�that�opened�up�large�reserves�of�natural�gas�lowered�the�cost�of�natural�gas�considerably�and�changed�the�economics�of�renewable�energy�technologies�in�terms�of�them�being�close�to�“grid�parity”.�Nevertheless,�our�discussions�with�venture�capital�investors�suggest�that�there�are�in�fact�structural�factors,�over�and�above�these�historical�developments,�that�have�led�investors�to�become�unwilling�to�experiment�with�renewable�energy�production�technologies.��In�this�section,�we�outline�these�structural�factors�that�VCs�seem�to�be�facing,�making�sustained�funding�of�entrepreneurship�in�renewable�energy�difficult.���
4.1 Financing�Risk�and�Capital�intensity�of�energy�production�
VCͲbacked�investments�are�extremely�risky,�leading�to�an�extremely�skewed�distribution�of�returns.�Hall�and�Woodward�(2010)�and�Sahlman�(1990;�2010)�document�that�about�60%�of�VC�investments�are�likely�to�go�bankrupt�and�the�vast�majority�of�returns�are�typically�generated�from�about�10%�of�the�investments�that�do�extremely�well.��Furthermore,�Kerr,�Nanda�and�RhodesͲKropf�(2013)�document�how�hard�it�is�for�VCs�to�predict�which�startups�are�likely�to�be�extremely�successful�and�which�will�fail.��VCs�therefore�invest�in�stages,�in�effect�buying�a�series�of�real�options,�where�the�information�gained�from�an�initial�investment�either�justifies�further�financing�or�the�exercise�of�the�VC’s�abandonment�option�to�shut�down�the�investment�(Gompers,�1995;�Bergemann�and�Hege,�2005;�Bergemann,�Hege�and�Peng,�2008;�Guler,�2007).��Hence�properties�of�startups�that�maximize�the�option�value�of�their�investments�make�their�portfolio�more�valuable.��For�example,�investments�that�are�capital�efficient�(cost�of�buying�the�option�is�less),�where�step�ups�in�value�when�positive�information�is�revealed�are�large�relative�to�the�investment�(more�discriminating�“experiments”�being�run�with�the�money�that�is�invested)�and�where�the�information�about�the�viability�of�a�project�is�revealed�in�a�short�period�of�time�are�all�properties�that�make�investments�more�attractive�for�VCs.��Sectors�such�as�IT�and�software,�that�have�relatively�low�levels�of�capital�investment,��and�where�initial�uncertainty�about�the�viability�of�the�technology�is�revealed�quickly,�are�ideal�sectors�for�VCs.��The�high�returns�for�several�of�the�most�
������������������������������������������������������������8�Note�that�simply�looking�at�the�timing�of�the�patents�and�the�investment�will�not�help�untangle�the�causality�as�VCs�will�often�invest�in�firms�that�have�promising�technologies�in�the�anticipation�that�they�will�patent.��

successful�VC�firms�are�based�on�information�technology�investments.��A�classic�example�is�that�of�Google,�that�had�a�market�capitalization�of�$23�billion�at�its�IPO�5�years�after�it�received�its�first�round�of�VC�funding,�and�having�raised�about�$40�M�in�venture�capital�along�the�way.�
On�the�other�hand,�the�unit�economics�of�energy�production�technologies�need�to�be�demonstrated�at�scale,�because�even�if�they�work�in�a�lab,�it�is�hard�to�predict�how�they�will�work�at�scale.�The�fact�that�early�stage�investors�need�to�finance�not�just�the�initial�exploration�around�the�technology,�but�also�the�scale�up�of�the�technology�leads�to�two�challenges�for�renewable�energy�startups.��First,�it�implies�that�the�resolution�of�uncertainty�takes�much�longer,�as�startups�often�need�to�build�demonstration�and�first�commercial�plants�before�it�is�clear�that�the�technology�is�truly�viable.��Second,�since�these�demonstration�plants�face�technology�(rather�than�engineering)�risk,�they�are�too�risky�to�be�financed�through�debt�finance.��VCs�who�back�such�startups�therefore�need�to�finance�the�companies�through�extremely�long�and�capital�intensive�investments.��The�funds�required�to�prove�commercial�viability�for�energy�production�technologies�can�reach�several�hundred�million�dollars�over�a�5Ͳ10�year�period,�compared�to�the�tens�of�millions�that�VCs�are�typically�used�to�investing�in�any�given�startup.�9���
This�level�of�investment�is�not�feasible�from�a�typical�venture�capital�fund�without�severely�compromising�the�diversification�of�the�venture�firm’s�portfolio.��For�example,�investing�only�$8Ͳ15M�in�a�project�that�is�twice�as�capital�intensive�halves�the�dollar�return�if�the�startup�is�successful.�On�the�other�hand,�investing�a�sufficient�amount�to�retain�a�large�share�in�a�successful�exit�requires�making�far�fewer�investments�across�the�portfolio�and�hence�makes�the�portfolio�much�more�risky.��Such�investments�are�thus�typically�too�capital�intensive�for�VCs,�given�the�size�and�structures�of�most�VC�funds�today.���
The�inability�to�raise�either�debt�or�venture�capital�at�the�demonstration�and�first�commercial�stage�has�led�this�stage�of�the�startup’s�life�to�be�known�as�the�“valley�of�death”�(see�Figure�6).��The�fact�that�investors�are�now�acutely�aware�of�this�funding�gap�before�the�firm�gets�to�cash�flow�positive�leads�to�an�unraveling�of�the�entire�financing�chain.��That�is,�since�investors�forecast�that�even�promising�startups�may�have�a�hard�time�getting�financing�when�they�reach�the�stage�of�needing�to�build�a�demonstration�plant,�the�benefits�of�sinking�capital�in�a�startup�at�the�stage�before�may�not�be�worthwhile.��This�logic,�that�VCs�refer�to�as�financing�risk,�works�through�backward�induction�to�the�first�investor.�Thus,�a�forecast�of�limited�future�funding�may�lead�promising�projects�to�not�be�funded,�even�if�when�fully�funded,�they�would�be�viable�and�NPV�positive�investments�(e.g.,�see�Nanda�and�RhodesͲKropf,�2013).�
This�challenge�is�exacerbated�by�the�fact�that�potential�entrepreneurs�who�know�the�energy�space�often�tend�to�be�from�large�oil�companies�or�from�utilities.��Hence,�they�make�good�CEOs�for�the�stage�when�the�startup�is�more�established,�but�they�tend�to�be�relatively�poor�entrepreneurs�at�the�early�stage�of�the�business�where�cash�is�limited�and�needs�to�be�raised�frequently,�the�business�model�is�not�clear,�
������������������������������������������������������������9�For�example,�Solyndra,�a�company�that�manufacturers�photovoltaic�systems�using�thinͲfilm�technology,�has�had�to�raise�$�970�M�in�equity�finance�in�addition�to�a�$�535�M�loan�guarantee�from�the�Department�of�Energy,�prior�to�its�planned�IPO�in�mid�2010.��This�amount�of�capital�to�prove�commercial�viability�is�an�order�of�magnitude�greater�than�the�$40Ͳ$50�M�that�VCs�are�typically�used�to�investing�in�each�company�to�get�them�to�a�successful�exit.�

and�decisions�need�to�be�made�quickly�with�limited�information�at�hand.��On�the�other�hand,�those�with�a�background�of�VC�backed�entrepreneurship�may�be�successful�at�running�small�ITͲrelated,�biotech�or�semiͲconductor�startups,�but�are�illͲpositioned�to�manage�and�grow�energy�production�companies�that�have�different�business�models�and�challenges.��Since�VCs�require�entrepreneurs�to�play�a�central�role�in�fundraising�for�the�large�amounts�of�money�required�for�commercial�testing�of�the�technology,�in�addition�to�managing�large�production�facilities,�international�commodity�pricing�and�anticipating�the�changing�government�policies,�the�combined�skill�set�required�of�such�CEOs�is�one�that�is�in�short�supply�(Kaplan,�Sensoy�and�Stromberg,�2009).�These�factors�greatly�increase�the�operational�risk�of�companies,�and�hence�this�creates�important�challenges�for�running�and�growing�standͲalone�energy�production�companies�that�go�beyond�their�capital�intensity.���
4.2 Exit�opportunities�
VCs�have�invested�in�some�industries�such�as�biotechnology,�semiconductors�and�IT/�networks�that�also�share�the�attributes�of�huge�infrastructure�and�management�requirements�that�are�outside�the�scope�of�a�startup.��However,�in�these�instances,�VCs�bank�on�an�established�exit�mechanism�to�hand�over�their�early�stage�investments�before�they�hit�the�valleys�of�death�in�capital�and�managerial�talent.��For�example,�in�the�biotechnology�industry,�the�VC�model�has�evolved�so�that�pharmaceutical�companies�step�in�to�buy�promising�startups�at�a�point�even�before�commercial�viability�has�been�proven.��This�is�a�key�part�of�the�innovation�ecosystem�as�it�bridges�the�potential�valley�of�death�and�thereby�facilitates�preͲcommercial�VC�investments�in�biotechnology.��The�propensity�of�pharmaceutical�companies�to�buy�promising�startups�also�facilitates�their�IPOs�at�preͲcommercial�stages,�because�public�investors�believe�there�is�sufficient�competition�among�pharmaceutical�firms�for�biotechnology�startups�with�innovative�solutions�that�they�will�be�acquired�well�before�they�hit�the�valley�of�death.��Cisco,�Lucent,�HP�and�Juniper�networks�play�an�equivalent�role�in�the�IT/�networking�industry.��
Thus�far,�however,�energy�producing�firms�and�utilities�that�supply�electricity�to�customers�have�been�far�from�active�in�acquiring�promising�clean�energy�startups.��This�bottleneck�in�the�scalingͲup�process�has�a�knockͲon�effect�on�the�ability�for�VCs�to�fund�preͲcommercial�technologies�in�this�space�as�well.��If�early�stage�venture�investors�face�the�risk�that�they�may�be�unable�to�raise�followͲon�funding�or�to�achieve�an�exit,�even�for�startups�with�otherwise�good�(but�as�yet�unproven)�technologies,�they�run�the�danger�of�sinking�increasing�amounts�of�dollars�for�longer�periods�of�time�to�keep�the�startup�alive.��With�incumbent�firms�unwilling�to�buy�these�startups�at�preͲcommercial�stages,�the�time�to�exit�for�the�typical�startup�is�much�longer�than�the�three�to�five�year�horizon�that�VCs�typically�target�(the�time�to�build�power�plants�and�factories�is�inherently�longer�than�a�software�sales�cycle�and�can�even�take�longer�than�the�life�of�a�VC�fund).��As�shown�in�Figure�6,�this�leads�venture�capitalists�to�withdraw�from�sectors�where�they�could�have�helped�with�the�preͲcommercial�funding,�but�where�they�are�not�certain�that�they�will�be�able�to�either�fund�the�project�through�the�first�commercial�plant,�or�they�are�not�sure�if�they�can�exit�their�investment�at�that�stage�(Nanda�and�RhodesͲKropf�2013).����
In�the�case�of�biotechnology�industry,�a�clear�exit�mechanism�was�facilitated�by�the�fact�that�the�FDA�developed�wellͲunderstood�and�transparent�metrics�for�success�at�each�stage.��Because�the�set�of�buyers�is�uniform�and�the�criteria�for�a�successful�exit�at�each�stage�have�been�developed�and�wellͲ

understood,�VCs�can�work�backwards�and�set�their�own�investment�milestones.��In�this�way,�the�downstream�exit�process�has�important�consequences�for�the�direction�of�upstream�innovation.��The�fact�that�there�is�a�wellͲdeveloped�ecoͲsystem�where�large�pharmaceutical�firms�buy�promising�startups�implies�that�there�is�greater�early�stage�venture�capital�funding�of�such�firms.�Moreover,�stock�market�investors�also�have�an�appetite�for�such�firms,�in�the�knowledge�that�pharmaceutical�firms�will�be�willing�to�acquire�a�promising�target�before�it�hits�the�bottleneck�of�marketing�and�distribution.�This�in�turn�creates�another�exit�avenue�for�venture�investors,�fuelling�further�early�stage�activity.��In�fact,�the�history�of�capital�intensive�industries�such�as�biotechnology,�communications�networking�and�semiconductors�suggests�that�until�the�incumbents�start�buying�startups,�the�innovation�pipeline�does�not�truly�take�off.��
The�extent�to�which�large�energy�companies�will�play�an�equivalent�role�in�the�innovation�pipeline�for�clean�energy�is�not�yet�clear.�While�energy�companies�have�not�chosen�to�be�active�buyers�of�clean�technology�startups,�it�is�still�early�in�the�life�of�the�clean�energy�ecosystem,�comparable�to�the�biotechnology�ecosystem�in�the�late�1980s.�There�are�some�signs�that�this�may�be�changing,�with�the�most�promising�developments�being�in�the�rise�of�a�number�of�corporate�venture�capital�funds�among�the�large�energy�companies�(Nanda�and�Rothenberg,�2011).����
4.3 Global�Commodities�and�Policy�Risk�
A�final�important�difference�between�the�renewable�energy�production�and�the�typical�VCͲbacked�startup�is�that�energy�is�a�commodity.��Success�in�energy�comes�from�being�a�low�cost�provider�rather�than�having�an�innovation�that�can�be�priced�high�due�to�the�willingness�of�end�users�to�pay�(as�is�the�case�for�biotechnology).��While�incumbents�in�other�industries�compete�with�each�other�to�acquire�startups�in�order�to�meet�endͲuser�demand,�the�endͲuser�in�the�energy�market�cannot�distinguish�electrons�produced�from�coal,�the�sun�or�the�wind�(unless�the�government�prices�the�cost�of�carbon�appropriately).���In�the�absence�of�appropriate�price�signals�or�incentives�to�invest�in�renewables,�incumbents�are�therefore�not�pressed�to�acquire�startups�in�this�space.���In�the�case�of�biofuels,�the�inputs�to�their�production�process�are�also�commodities.�Energy�producers�therefore�face�commodity�risk�for�both�raw�materials�and�end�products.�Since�these�markets�can�exhibit�substantial�price�volatility,�it�makes�running�and�managing�these�companies�more�difficult.��For�example,�secondͲ�and�thirdͲgeneration�biofuel�startups�producing�ethanol�or�bioͲcrude�at�$80Ͳ$90�per�barrel�were�competitive�in�2007�prior�to�the�global�recession�when�conventional�oil�prices�topped�$100�a�barrel,�but�most�went�bust�when�oil�prices�plummeted�in�the�subsequent�recession.���
The�challenges�of�backing�a�global�commodity�producer�are�compounded�by�the�fact�that�energy�and�clean�energy�are�sectors�with�large�involvement�by�governments�across�the�world.��Given�that�clean�energy�technologies�have�not�yet�achieved�grid�parity,�government�policy�is�also�critical�in�determining�the�prices�of�inputs�and�finished�products.��Some�governments�choose�to�either�tax�carbon�content�in�conventional�fuels�or�to�buy�clean�energy�at�a�premium.��Others�choose�to�subsidize�clean�energy�companies�through�direct�grants�and�subsidies�or�through�taxͲbreaks.��Regardless�of�the�policy,�it�implies�that�the�extent�to�which�a�given�startup’s�product�is�likely�to�be�profitable�depends�greatly�on�whether�it�

is�included�in�the�subsidy�or�credit,�the�extent�to�which�carbon�is�taxed�or�the�price�premium�at�which�the�government�buys�the�commodity.���
Policy�changes�and�uncertainty�are�thus�major�factors�hindering�the�potential�investment�by�private�sector�players�across�the�clean�energy�investment�landscape�(Bloom,�2009).��This�is�particularly�true�when�the�periodicity�of�the�regulatory�cycle�is�smaller�than�the�investment�cycle�required�for�demonstrating�commercial�viability.��In�such�an�event,�no�one�is�willing�to�invest�in�the�first�commercial�plant�if�they�do�not�know�what�the�regulatory�environment�is�going�to�be�by�the�time�success�has�been�demonstrated�(based�on�the�rules�of�the�prior�regulatory�regime).���
5. Possible�solutions�The�section�above�has�tried�to�demonstrate�that�VCs�enter�markets�where�they�believe�they�can�create�and�then�exercise�growth�options.��VC’s�were�initially�attracted�to�renewable�energy�technologies�in�the�belief�that�there�would�be�a�shift�in�demand�from�society�for�renewable�energy,�and�that�shift�would�create�large�growth�options�for�them�due�to�a�constrained�supply�of�sociallyͲdesired�renewable�energy�alternatives.��This�belief�has�not�yet�panned�out,�and�moreover,�the�cost�of�creating�the�growth�options�have�turned�out�to�be�much�greater,�as�the�innovation�pipeline�is�nascent�and�the�absence�of�incumbents�buying�promising�technologies�means�VC�investors�need�to�finance�the�scale�up�before�they�can�exercise�their�options.��In�this�section,�we�discuss�possible�solutions�that�may�help�drive�a�more�robust�financing�ecosystem�for�renewable�energy�technologies.�
5.1�Private�capital�market�solutions�
With�the�appropriate�price�signals�and�incentives,�incumbents�may�be�incentivized�to�buy�promising�technologies,�thereby�reducing�financing�risk�considerably,�as�took�place�as�the�biotechnology�industry�matured.��We�discuss�these�incentives�in�the�next�subsection.��
In�the�absence�of�energy�companies�and�utilities�playing�an�important�role�in�this�innovation�pipeline,�the�alternative�for�wideͲspread�innovation�by�startups�in�renewable�energy�production�will�require�the�structure�of�the�VC�industry�to�change�in�key�ways.���
First,�it�will�require�significantly�larger�funds�than�is�typical�for�venture�capital�investors,�in�order�to�address�the�challenges�associated�with�financing�risk�and�the�“valley�of�death”.�Indeed�Kleiner�Perkins’�$500�M�Green�Growth�Fund,�and�Khosla�Ventures’�$�750�M�fund�are�examples�of�such�a�trend10,�but�the�sector�will�probably�require�even�larger�funds�to�support�the�scaleͲup�required�by�energy�production�companies.�The�majority�of�venture�capital�investors�in�clean�technology�do�not�have�dedicated�funds�for�this�sector,�and�continue�to�raise�$250Ͳ300�M�funds�and�may�need�to�have�far�greater�levels�of�syndication,�or�preͲset�partnerships�across�VCs�in�order�to�sustain�the�level�of�investment�required�by�
������������������������������������������������������������10�Khosla�Ventures�also�created�a�dual�fund�structure,�where�a�smaller�fund�would�focus�on�early�stage�experiments�while�a�second,�larger�fund�would�guarantee�funding�for�commercialization,�helping�to�reduce�financing�risk.�

this�sector.��Moreover,�if�venture�capital�investment�in�the�energy�sector�is�to�be�sustained�in�the�absence�of�early�exit�opportunities,�it�will�require�a�radical�reworking�of�the�VC�fund�structures�and�terms.���
Overcoming�these�challenges�will�be�compounded�by�another�factor�associated�with�the�emergence�of�a�new�industry:��learning�through�experimentation.��Investors�in�new�technologies�get�feedback�on�their�process�of�due�diligence,�the�types�of�entrepreneurs�who�are�most�successful,�and�an�understanding�of�the�challenges�faced�by�certain�types�of�business�models�over�the�investment�cycle�(Goldfarb�et�al�2007).��This�is�also�a�period�when�a�generation�of�new�entrepreneurs�arises,�driven�in�part�by�the�many�firms�that�fail�due�to�a�technology�that�did�not�work,�but�where�the�entrepreneurs�developed�a�good�working�relationship�with�the�venture�capital�investors.��All�of�these�processes�develop�faster�when�the�cycle�times�for�“experimentation”�by�the�VCs�are�smaller.��In�the�context�of�clean�energy,�the�feedback�is�much�slower,�driven�by�the�dual�stages�of�risk�and�the�longer�cycle�times�of�clean�energy.��Many�players�therefore�see�a�critical�role�for�government�in�supporting�the�growth�of�the�clean�energy�innovation�pipeline.�
5.2�Government�Support�
The�US�government�has�played�an�important�role�in�supporting�clean�technology�innovation�in�the�US.�However,�the�vast�majority�of�this�has�been�on�the�“supply�side”,�through�the�direct�support�of�specific�government�and�university�programs,�grants�to�support�preͲcommercial�funding�of�new�startups�through�the�ARPAͲE�program�and�attempts�to�bridge�the�valley�of�death�for�individual�projects�through�the�Department�of�Energy’s�loan�guarantee�program�(Roberts,�Lassiter�and�Nanda�2010).�
While�clearly�very�helpful�in�attempting�to�address�the�funding�gaps�inherent�in�the�energy�innovation�pipeline,�a�key�aspect�of�ensuring�that�the�pipeline�of�new�projects�continue�to�get�funding�from�the�private�sector�will�be�to�ensure�that�there�is�a�vibrant�set�of�exit�opportunities�for�these�startups�before�they�hit�the�valley�of�death.��While�government�guaranteed�debt�will�help�reduce�some�of�this�risk,�widespread�experimentation�and�deployment�of�new�technologies�can�only�take�place�once�startups�have�a�clear�path�to�being�acquired�or�going�public�on�the�capital�markets.�The�government�can�therefore�do�more�in�terms�of�making�exits�easier.��We�note�three�interesting�ideas�that�have�emerged�through�our�discussions�with�VCs�and�that�are�also�echoed�in�the�broader�community�of�investors�looking�for�solutions�to�the�“valley�of�death”�(Bloomberg�New�Energy�Finance,�2010).�
The�first�area�where�the�government�can�make�a�significant�contribution�is�through�stable,�predictable�and�longͲterm�policy�measures�aimed�at�stimulating�demand�for�clean�energy.��Removing�uncertainty�around�policies�reduces�policy�risk�dramatically�and�makes�it�easier�for�the�private�capital�markets�to�plan�their�investments�accordingly.�Furthermore,�in�the�absence�of�endͲuser�pressure�to�drive�M&A�activity,�the�government�can�create�this�pressure�through�policies�such�as�FeedͲinͲTariffs�(FITs).��While�FITs�have�their�most�direct�effect�on�incremental�improvements�of�commercially�proven�technologies,�solutions�such�as�emerging�technology�auctions�may�be�able�to�successfully�create�the�appropriate�demand�for�new�technologies.���

Second,�the�government�can�directly�stimulate�M&A�activity�either�through�the�regulatory�system�or�through�corporate�incentives.�For�example,�without�decoupling,�utilities�will�have�no�incentive�to�adopt�new�technologies�beyond�anything�that�they�are�mandated�to�do.�Renewable�portfolio�standards�as�they�stand�today�tend�to�bias�utilities�towards�adopting�more�mature,�currentlyͲcheaper�technologies.�The�government�can�also�create�incentives�for�incumbent�firms�to�act�as�first�adopters�for�new�technologies.��These�can�effectively�help�to�bridge�the�“valley�of�death”,�create�more�early�stage�funding�and�drive�the�growth�of�a�sufficient�number�of�startup�firms�to�ultimately�create�large�firms�that�will�compete�with�each�other�to�acquire�for�the�next�generation�of�startups.�
Finally,�the�government�can�create�publicͲprivate�partnership�funds�that�can�help�either�with�first�commercial�testing�or�as�mechanisms�that�effectively�compete�with�the�incumbents.��Creating�this�competition�can�help�stimulate�M&A�activity�in�the�sector�and�hence�drive�the�innovation�pipeline�(Bloomberg�New�Energy�Finance,�2010).��This�could�be�designed�along�the�lines�of�Fernandez,�Stein�and�Lo�(2012)�who�have�begun�to�identify�similar�challenges�in�biotechnology�and�are�suggesting�innovative�financial�engineering�approaches�to�funding�innovation�in�cancer�therapy,�that�could�also�be�applied�to�renewable�energy�technologies.���
6. Conclusion�Innovation�in�renewable�energy�has�grown�in�recent�years,�in�part�due�to�the�sharp�rise�in�venture�capital�finance�for�renewable�energy�startups�in�the�early�2000s.�However,�the�availability�of�venture�capital�finance�for�renewable�energy�has�fallen�dramatically�in�recent�years.�In�this�chapter,�we�ask�whether�we�should�worry�that�the�decline�and�shift�in�VC�will�slow�the�rate�and�alter�the�direction�of�innovation�in�renewable�energy.�
Our�results�suggest�that�startups�backed�by�venture�capital�file�patents�that�are�more�likely�to�have�at�least�one�citation,�are�more�likely�to�be�highly�cited,�have�fewer�selfͲcitations�and�are�more�likely�to�be�novel�than�patents�filed�by�incumbent�firms.��Although�the�lag�in�the�patent�grants�do�not�allow�us�to�directly�observe�how�the�falling�levels�of�VC�finance�relate�to�the�innovations�by�VCͲbacked�startups,�our�results�suggest�VC�financing�is�associated�with�a�greater�degree�of�economic�experimentation�and�therefore,�we�should�worry�that�VCs�have�moved�away�from�funding�such�startups.�
Our�chapter�has�also�aimed�to�shed�light�on�some�of�the�structural�factors�that�have�made�sustained�experimentation�by�VCs�hard,�with�a�particular�emphasis�on�the�difficulty�of�exiting�their�investments�to�incumbent�firms�that�have�the�expertise�and�capital�to�finance�the�scale�up�of�such�technologies.��Larger/longer�Funds�may�be�one�alternative,�since�such�funds�could�get�past�the�uncertainty�and�to�a�stable�place�for�exit),�but�measures�designed�to�incentivize�incumbents�up�the�financing�chain�to�bridge�the�‘valley�of�death’�also�seem�like�possible�solutions.�
We�should�note�that�our�analysis�is�not�meant�to�suggest�that�process�innovations�are�unimportant,�or�that�the�focus�of�VC�on�other�aspects�of�clean�tech�is�not�valuable.��Rather,�our�objective�is�to�highlight�the�fact�that�the�shifting�focus�of�venture�capital�is�likely�to�have�an�impact�on�both�the�rate�and�the�characteristics�of�renewable�energy�innovation�in�the�coming�years.��To�the�extent�that�there�is�still�a�

need�for�experimentation�with�new�technologies�a�desire�to�commercialize�radical�innovations�in�renewable�energy,�our�work�highlights�that�in�addition�to�falling�natural�gas�prices,�there�are�structural�factors�about�energy�that�make�sustained�experimentation�by�VCs�difficult�in�renewable�energy.��Although�it�is�still�early�in�the�life�cycle�of�this�industry,�our�discussion�has�outlined�some�specific�factors�that�may�facilitate�the�deployment�of�large�amounts�of�risk�capital�that�are�necessary�to�finance�renewable�energy�innovations.���
References�
Akcigit,�Ufuk,� and�William� Kerr,� 2011,�Growth� through� heterogeneous� innovations.�Harvard�Business�School�Working�paper.�
Balasubramanian,�Natarajan��and�Jeongsik�Lee,�2008,�Firm�age�and�innovation.�Industrial�and�Corporate�Change,�17:5�1019Ͳ1047.�
Bergemann,�Dirk,�and�Ulrich�Hege.�2005.�The�Financing�of� Innovation:� Learning�and�Stopping."�RAND�Journal�of�Economics,�36:�719Ͳ752.�
Bergemann,� Dirk,� Ulrich� Hege,� and� Liang� Peng.� 2008.� Venture� Capital� and� Sequential� Investments."�Working�Paper.�
Bloom,�Nick.�2009.�The�Impact�of�Uncertianty�Shocks.�Econometrica,�77:�623Ͳ685.�Bloomberg�New�Energy�Finance.�2010.�Crossing�the�Valley�of�Death;�Solutions�to�the�next�generation�
clean�energy�project�financing�gap.�June�2010�white�paper�BP.� 2012.� Statistical� Review� of� World� Energy.� http://www.bp.com/content/dam/bp/pdf/StatisticalͲ
ReviewͲ2012/statistical_review_of_world_energy_2012.pdf��Conti,�Annamaria,� Jerry� Thursby� and�Marie� Thursby.�2012.�Are�Patents� Endogenous�or� Exogenous� to�
Startup�Financing?�Working�Paper�Fan,�RongͲEn�and�KaiͲWei�Chang,�ChoͲJui�Hsieh,�XiangͲRui�Wang,�ChihͲJen�Lin:�LIBLINEAR:�A�Library�for�
Large�Linear�Classification.�Journal�of�Machine�Learning�Research�9:�1871Ͳ1874�(2008).�Fernandez,� JoseͲMaria,�Roger�M�Stein�and�Andrew�W� Lo,�2012,�Commercializing�biomedical� research�
through�securitization�techniques.�Nature�Biotechnology�30,�964–975�Gans,�Joshua,�David�Hsu,�and�Scott�Stern,�2002,�When�does�startͲup�innovation�spur�the�gale�of�creative�
destruction?�RAND�Journal�of�Economics�33,�571Ͳ586.�Goldfarb,�B.,�D.�Kirsch�and�D.�Miller,�2007,�“Was�there�too�Little�Entry�in�the�Dot�Com�Era?”�Journal�of�
Financial�Economics�86(1):��100Ͳ144.�Gompers,�Paul.�1995.�Optimal� Investment,�Monitoring,�and�the�Staging�of�Venture�Capital."�Journal�of�
Finance,�50:�1461Ͳ1489.�Gompers,�Paul,�and�Josh�Lerner,�2002,�The�Venture�Capital�Cycle,�MIT�Press,�Cambridge,�MA.�Guler,�Isin,�2007,�Throwing�Good�Money�After�Bad?�A�MultiͲLevel�Study�of�Sequential�Decision�Making�
in�the�Venture�Capital�Industry.��Administrative�Science�Quarterly,�52:�248Ͳ285�Hall,�Robert,�and�Susan�Woodward,�2010,�The�burden�of�the�nondiversifiable�risk�of�entrepreneurship.�
American�Economic�Review�100:3,�1163Ͳ1194.�Hellman,�Thomas�and�Manju�Puri.�2002.��Venture�Capital�and�the�Professionalization�of�StartͲup�Firms:��
Empirical�Evidence,��Journal�of�Finance�57(1):�169Ͳ197�Henderson,�Rebecca�and�Kim�Clark.�1990.�Architectural�Innovation�Ͳ�the�Reconfiguration�of�Existing�
Product�Technologies�and�the�Failure�of�Established�Firms.��Administrative�Science�Quarterly�35(1):�9Ͳ30.��

Kaplan,�Steve,�Berk�Sensoy,�and�Per�Strömberg,�2009,�Should�investors�bet�on�the�jockey�or�the�horse?�Evidence�from�the�evolution�of�firms�from�early�business�plans�to�public�companies.�Journal�of�Finance�64,�75Ͳ115.�
Kerr,�William,�Ramana�Nanda�and�Matthew�RhodesͲKropf.�2013.�Entrepreneurship�as�Experimentation.�Working�Paper.�
Kortum,� Samuel,� and� Josh� Lerner,� 2000,�Assessing� the� contribution� of� venture� capital� to� innovation.�RAND�Journal�of�Economics�31:4,�674Ͳ692.�
March,� James,�1991,�Exploration�and�exploitation� in�organizational� learning.�Organizational�Science�2,�71Ͳ87.�
Nanda,� Ramana,� and�Matthew� RhodesͲKropf,� 2012,� Financing� Risk� and� Innovation,�Harvard� Business�School�Working�Paper,�No.�11–013.��
Nanda,�Ramana,�and�Matthew�RhodesͲKropf,�2013,�Investment�cycles�and�startup�innovation.�Journal�of�Financial�Economics,�forthcoming.�
Roberts,�Michael,�Joseph�Lassiter�and�Ramana�Nanda.�2010.�U.S.�Department�of�Energy�&�Recovery�Act�Funding:�Bridging�the�"Valley�of�Death".�Harvard�Business�School�Case�810Ͳ144.�
Rosenberg,� Nathan,� 1994,� Economic� experiments.� In� Inside� the� Black� Box,� Cambridge:� Cambridge�University�Press.�
Rosenkopf,� Lori� and� Atul� Nerker,� 2001,� Beyond� Local� Search:� BoundaryͲSpanning,� Exploration,� and�Impact�in�the�Optical�Disk�Industry,�Strategic�Management�Journal,�22:4�287Ͳ306.�
Sahlman,�W.,�1990.�The�structure�and�governance�of�ventureͲcapital�organizations.�Journal�of�Financial�Economics�27,�473Ͳ521.�
Sahlman,�W.,�2010.�Risk�and�reward�in�venture�capital.�Harvard�Business�School�Note�811Ͳ036�Sahlman,�William�A.,� Ramana�Nanda,� Joseph� B.� Lassiter� III,� and� James�McQuade.� 2013.� TerraPower:�
Innovation�in�Nuclear�Energy.�Harvard�Business�School�Case�813Ͳ108�Samila,� Sampsa,� and�Olav� Sorenson,� 2011,� Venture� capital,� entrepreneurship� and� economic� growth.�
Review�of�Economics�and�Statistics�93,�338Ͳ349.�Singh,� Jasjit� and� Lee� Fleming,� 2010,� Lone� Inventors� as� Sources� of� Breakthroughs:�Myth� or� Reality?�
Management�Science�56:1,�41Ͳ56.�Stern,� Scott,� 2005,� Economic� experiments:� the� role� of� entrepreneurship� in� economic� prosperity.� In:�
Understanding� Entrepreneurship:� A� Research� and� Policy� Report,� Ewing� Marion� Kauffman�Foundation.�
Sorensen,� Jesper� and� Toby� E.� Stuart.� 2000.� Aging,� Obsolescence� and� Organizational� Innovation.�Administrative�Science�Quarterly�45:�81Ͳ112.�
Tripsas,�Mary� and�Giovanni�Gavetti.� 2000.� Capabilities,� Cognition� and� Intertia:� Evidence� from�Digital�Imaging.�Strategic�Management�Journal,�21:�1147Ͳ1161.�
Tushman,� Michael� L.,� and� Philip� Anderson.� 1986.� Technological� Discontinuities� and� Organizational�Environments.�Administrative�Science�Quarterly�31(3):�439Ͳ465.�
Ullman,�Jeff�and�Anand�Rajaraman�2011.��Mining�of�Massive�Datasets.��Cambridge�University�Press,�NY,�NY.�
Younge,�Ken.�2013�(forthcoming).��A�Measure�of�Patent�Novelty,�Fung�Institute�Technical�Report.���

Figure�1:�Source�of�Global�Energy�Consumed�in�2010��(Total�=�132,000�TWh)�
�
�
Figure�2A:�Series�A�Financing�for�USͲbased�startups�in�Solar,�Wind�and�Biofuels�
�
�
0
50
100
150
200
250
300
350
2000 2001 2002 2003 2004 2005 2006 2007 2008 2009 2010 2011 2012
Series�A�Financing,�by�Sector�(US,�only�$�MM)
Biofuels Solar Wind

Figure�2B:�Industrial�/�Energy�Share�of�total�VC�investments�(first�series�financings�only)�
�
Figure�2C:�Share�of�Series�A�CleanͲtech�financings�by�VCs�going�to�solar,�wind�and�biofuels�startups�
�
0.0%
0.5%
1.0%
1.5%
2.0%
2.5%
3.0%
3.5%
4.0%
4.5%
5.0%
1995 1996 1997 1998 1999 2000 2001 2002 2003 2004 2005 2006 2007 2008 2009 2010 2011 2012
Industrial�/�Energy�share�of�deals Industrial�/�Energy�share�of�total�dollars
0.0%
10.0%
20.0%
30.0%
40.0%
50.0%
60.0%
2000 2001 2002 2003 2004 2005 2006 2007 2008 2009 2010 2011 2012

�
�
040
080
012
0016
00
Num
ber o
f pat
ents
1980 1983 1986 1989 1992 1995 1998 2001 2004 2007 2010
Figure 3A: Renewable Energy Patents
0.0
02.0
04.0
06.0
08.0
1.0
12.0
14.0
16
Sha
re o
f all
US
PTO
pat
ents
1980 1983 1986 1989 1992 1995 1998 2001 2004 2007 2010
Figure 3B: Renewable Energy Share of All USPTO Patents

�
�
030
060
090
012
00
Num
ber o
f Pat
ents
1980 1983 1986 1989 1992 1995 1998 2001 2004 2007 2010
US Patents Foreign Patents
Figure 4: Renewable Energy Patents by US or Foreign
0.2
.4.6
.81
Stac
ked
Shar
es o
f Tot
al
1980 1983 1986 1989 1992 1995 1998 2001 2004 2007 2010
VC-backed Univ/Govt Incumbents
Figure 5: US Renewable Energy Patents by Organizational Type

�
�
Figure�7:�Funding�Gaps�and�the�“Valley�of�Death”�
�
.2.4
.6.8
Sha
re o
f Tot
al
1980 1983 1986 1989 1992 1995 1998 2001 2004 2007 2010
Top 50 Firms Top 20 Firms Top 10 Firms
Figure 6: Concentration of Renewable Energy Patenting, US Inventors
Idea Vetting & Pre- Commercial
Testing
Establishing Commercial
Viability
Large-Scale Deployment
Inability to bridge “Valley of Death” leads venture capital to
dry up even in the pre-commercial stage
Project / Asset FinanceEstablished CompaniesPublic Equity Markets
Valley of Death

VentureͲbacked�Startups
Incumbent�Firms
Academia�and�Government
UnͲassigned Total Percent
Solar 473 5,937 732 2,502 9,644 42%Wind 169 1,679 70 1,129 3,047 13%Biofuels 177 4,995 884 778 6,834 30%HydroͲelectric 78 1,132 107 1,058 2,375 10%Geothermal 52 597 54 266 969 4%Total 949 14,340 1,847 5,733 22,869 100%
VentureͲbacked�Startups
Incumbent�Firms
Academia�and�Government
UnͲassigned Total Percent
Solar 402 2,797 482 1,884 5,565 41%Wind 71 689 39 693 1,492 11%Biofuels 143 2,987 659 513 4,302 32%HydroͲelectric 41 643 68 757 1,509 11%Geothermal 29 431 42 219 721 5%Total 686 7,547 1,290 4,066 13,589 100%
PANEL�A:��ALL�RENEWABLE�ENERGY�PATENTS�AT�USPTO�(1980Ͳ2009)
PANEL�B:��USͲBASED�INVENTORS�ONLY�
Table�1
This�table�reports�the�breakdown�of�22,869�renewable�energy�patents�at�the�USPTO�that�were�granted�between�1980�and�2009.�Panel�A�provides�a�breakdown�for�the�entire�sample�and�Panel�B�provides�a�breakdown�for�USͲbased�inventors.��Venture�backed�startups�refer�to�patents�where�the�assignee�was�matched�to�a�firm�that�received�Venture�Capital�finance�(identified�using�data�from�Cleantech�i3�and�Bloomberg�New�Energy�Finance).�Patents�granted�to�academic�institutions�or�government�labs�were�identified�using�a�textͲmatching�algorithm�followed�by�manual�review.��Incumbent�firms�refer�to�the�residual�category�of�assignees�who�were�not�classified�as�either�VCͲbacked�or�from�academia�/�government.��Unassigned�patents�are�those�not�affiliated�with�any�organization�and�are�typically�seen�as�independent�inventors.�
Patenting�rates�in�renewable�energy,�by�technology�and�organization�type

Rank
Solar
Patent�
Coun
tBio
Patent�
Coun
tWind
Patent�
Coun
tHy
dro
Patent�
Coun
tGe
othe
rmal
Patent�
Coun
t1
Applied�Materials,�Inc
56Stine�Seed
�Com
pany
212
GE20
4GE
16Ke
lix�Heat�T
ransfer�S
ystems
72
SunP
ower�Corpo
ratio
n35
DuPo
nt78
Gene
dics�Clean
�Ene
rgy,�LLC
9Ocean
�Pow
er�Techn
ologies
12Earth�To
�Air�System
s,�LLC
53
Solopo
wer
33Merschm
an�Seeds
76Clippe
r�Windp
ower�Techn
ology
8Alticor�Corpo
rate�Enterprise
s11
GE5
4GE
31Novo�Grou
p30
Northern�Po
wer�Systems,�Inc.
6Lockhe
ed�M
artin
65
Boeing
25UOP
30FloD
esign�Wind�Turbine�Co
rp.
5Ve
rdant�P
ower
66
Konarka�Techno
logies
24Ch
evron
29Fron
tier�W
ind,�LLC
57
Stion�Co
rporation
24Mon
santo
29Re
nScien
ce�IP
�Holdings�Inc.
58
IBM
20Syngen
ta�AG
259
DuPo
nt18
M.S.�Techn
ologies�L
LC22
10Em
core�Solar�Pow
er,�Inc.
17Do
w21
11Nanosolar,�Inc.
17Michigan�State�University
1712
Guardian
�Indu
strie
s�Corp.
16AD
M13
13Xe
rox
13University
�of�Illinios
1314
Solynd
ra�LLC
12University
�of�W
iscon
sin13
15TE�Con
nectivity
12Am
yris
1216
Twin�Creeks�T
echn
ologies
12Ro
yal�D
SM12
17Lockhe
ed�M
artin
11New
Market�C
orpo
ratio
n11
18Miasole
11U.S.�D
epartm
ent�o
f�Agriculture
1119
Solaria
�Corpo
ratio
n9
GE10
20UTC
9University
�of�C
alifo
rnia
1021
Energy�Inno
vatio
ns,�Inc.
8Ba
ttelle�M
emorial�Institute
922
GM8
Ceres,�Inc.
823
Solexel,�Inc.
8University
�of�Sou
thern�Californ
724
Solfo
cus,�Inc.
8BA
SF6
25University
�of�C
alifo
rnia
8Co
nocoPh
illips�C
ompany
626
World�Factory,�Inc.
8ExxonM
obil
627
Foxcon
n7
ZeaChe
m�Inc.
628
Iostar�Corpo
ratio
n7
Agritop
e/Av
entis
529
North�Carolina�State�Univer
7Ba
ttelle
530
University
�of�C
entral�Florid
a7
Catalytic
�Distillation�Techno
log
531
Xantrex�Techno
logy�Inc.
7Co
skata,�Inc.
532
Chevron
6LU
CA�Techn
ologies,�Inc.
533
Gene
dics�Clean
�Ene
rgy,�LLC
6LenLo�Ch
em,�Inc.
534
Qualcom
m�Inc.
6Pe
nnsylvania�State�University
535
NAS
A6
Rice�University
536
United�Solar�O
vonic�LLC
6Syntroleum
�Corpo
ratio
n5
37Va
rian�Semicon
ductor
6Xyleco,�Inc.
538
AMPT,�LLC
539
Advanced
�Ene
rgy�Indu
strie
s5
40AlcatelͲLucen
t5
41Ap
ple�Inc.
542
Archite
ctural�Glass�and
�Alum
543
Batelle/M
RIGlob
al5
44Plextron
ics,�Inc.
545
Prim
estar�S
olar�Inc.
5
Table�2
Assig
nees�with
�five�or�m
ore�patents�to�USͲbased�inventors

(1)
(2)
(3)
(4)
(5)
(6)
(a)��Ve
nture�Capital�Backed�Startup
0.60
6***
0.63
9***
0.67
2***
0.60
1***
0.64
1***
0.67
0***
(0.165
)(0.158
)(0.177
)(0.181
)(0.173
)(0.199
)(b)��Incumbe
nt�firm
s0.11
80.11
30.09
90.16
3*0.16
4*0.14
3(0.073
)(0.075
)(0.108
)(0.087
)(0.089
)(0.132
)(c)��Unassigne
dͲ1.365
***
Ͳ1.472
***
(0.176
)(0.175
)
PͲvalue�on
�Chi2�test�fo
r�differen
ce�between�(a)�and
�(b)
0.00
2***
<0.001
***
<0.001
***
0.01
1**
0.00
3***
0.00
2***
Patent�app
lication�year�fixed�effects
YY
YY
YY
Techno
logy�fixed�effects
YY
YY
YY
Observatio
ns22
,869
17,136
11,611
13,589
9,52
36,15
5
Full�Sample
USͲbased�Inventors�o
nly
This�table�repo
rts�the
�results�from
�Negative�Bino
mial�regressions�whe
re�th
e�de
pend
ent�variable�is�the�coun
t� of�cum
ulative�citatio
ns�re
ceived
�by�each�paten
t�five�years�from�th
e�patent's�application.��Colum
n�(1)�rep
orts�re
sults�fo
r�the
�full�sample.��Colum
ns�(2
)�and
�(3)�e
xclude
�paten
ts�with
�no�assig
nees.�Colum
n�(3)�
looks�o
nly��at�the
�latter�half�o
f�the
�thirtyͲyear�period,�from
�199
5Ͳ20
09.��Co
lumns�(4
),�(5)�and
�(6)�are�th
e�eq
uivalent�to
�Colum
ns�(1
),�(2)�and
�(3)�respe
ctively�
but�for�th
e�subsam
ple�of�USͲbased�inventors�o
nly.�All�regressio
ns�includ
e�fixed
�effe
cts�for�th
e�patent's�grant�y
ear�a
s�well�as�a
�techno
logy�fixed�effect�(for�
Solar,�Wind,�Biofuels,�Hydro�and
�Geo
thermal).�Parenthe
ses�rep
ort�rob
ust�stand
ard�errors,�clustered
�by�assig
nee.���***�p<
0.01
,�**�p<
0.05
,�*�p<0.1
Table�3
Citatio
ns�to
�paten
ts
(1)
(2)
(3)
(4)
(5)
(6)
(a)��Ve
nture�Capital�Backed�Startup
0.10
5***
0.13
0***
0.13
6***
0.07
7*0.11
4***
0.12
3***
(0.034
)(0.027
)(0.029
)(0.040
)(0.030
)(0.032
)(b)��Incumbe
nt�firm
s0.05
5***
0.05
3***
0.05
8***
0.06
1***
0.06
3***
0.07
0***
(0.016
)(0.014
)(0.017
)(0.019
)(0.018
)(0.022
)(c)��Unassigne
dͲ0.353
***
Ͳ0.381
***
(0.018
)(0.020
)
PͲvalue�on
�Wald�test�fo
r�differen
ce�between�(a)�and
�(b)
0.12
60.00
2***
0.00
3***
0.64
30.05
9*0.05
8*
Patent�app
lication�year�fixed�effects
YY
YY
YY
Techno
logy�fixed�effects
YY
YY
YY
Observatio
ns22
,869
17,136
11,611
13,589
9,52
36,15
5
Table�4
Share�of�paten
ts�with
�at�least�one
�cita
tion
This�table�repo
rts�the
�results�from
�OLS�re
gressio
ns�whe
re�th
e�de
pend
ent�variable�takes�a
�value
�of�o
ne�if�th
e�patent�re
ceived
�at�least�one
�cita
tion�and�zero�
othe
rwise
.��Re
sults�are�ro
bust�to
�runn
ing�logit�regressions.��Co
lumn�(1)�rep
orts�re
sults�fo
r�the
�full�sample.��Colum
ns�(2
)�and
�(3)�e
xclude
�paten
ts�with
�no�
assig
nees.�Colum
n�(3)�loo
ks�only��at�the
�latter�half�o
f�the
�thirtyͲyear�period,�from
�199
5Ͳ20
09.��Co
lumns�(4
),�(5)�and
�(6)�are�th
e�eq
uivalent�to
�Colum
ns�(1
),�(2)�
and�(3)�respe
ctively�bu
t�for�th
e�subsam
ple�of�USͲbased�inventors�o
nly.�All�regressio
ns�includ
e�fixed
�effe
cts�for�th
e�patent's�grant�year�a
s�well�as�a
�techno
logy�
fixed
�effe
ct�(for�Solar,�W
ind,�Biofuels,�Hydro�and
�Geo
thermal).�Parenthe
ses�rep
ort�rob
ust�stand
ard�errors,�clustered
�by�assig
nee.���***�p<
0.01
,�**�p<
0.05
,�*�
p<0.1
Full�Sample
USͲbased�Inventors�o
nly

(1)
(2)
(3)
(4)
(5)
(6)
(a)��Ve
nture�Capital�Backed�Startup
0.07
5***
0.07
5***
0.08
3***
0.08
6***
0.08
6***
0.10
1***
(0.026
)(0.026
)(0.027
)(0.028
)(0.028
)(0.028
)(b)��Incumbe
nt�firm
s0.01
80.01
80.01
50.03
7**
0.03
7**
0.03
1*(0.013
)(0.013
)(0.014
)(0.016
)(0.016
)(0.016
)(c)��Unassigne
dͲ0.125
***
Ͳ0.114
***
(0.015
)(0.015
)
PͲvalue�on
�Wald�test�fo
r�differen
ce�between�(a)�and
�(b)
0.01
8**
0.01
8**
0.00
8***
0.05
4*0.05
4*0.00
9***
Patent�app
lication�year�fixed�effects
YY
YY
YY
Techno
logy�fixed�effects
YY
YY
YY
Observatio
ns22
,869
17,136
11,611
13,589
9,52
36,15
5
Table�5
Share�of�paten
ts�th
at�are�highly�cited
This�table�repo
rts�the
�results�from
�OLS�re
gressio
ns�whe
re�th
e�de
pend
ent�variable�takes�the
�value
�of�o
ne�if�th
e�patent�was�abo
ve�th
e�90
th�percentile�in
�term
sof�cita
tions�re
ceived
,�and
�zero�otherwise
.��Re
sults�are�ro
bust�to
�runn
ing�Logit�regressions.�Percentiles�a
re�calculated�relativ
e�to�cita
tions�re
ceived
�by�othe
r�patents�in�the�same�techno
logy�and
�app
lication�year�and
�are�based
�on�cumulative�citatio
ns�re
ceived
�by�each�paten
t�five�years�from�th
e�patent's�grant.��
Column�(1)�rep
orts�re
sults�fo
r�the
�full�sample.��Colum
ns�(2
)�and
�(3)�e
xclude
�paten
ts�with
�no�assig
nees.�Colum
n�(3)�loo
ks�only��at�the
�latter�half�o
f�the
�thirtyͲ
year�period,�from
�199
5Ͳ20
09.��Co
lumns�(4
),�(5)�and
�(6)�are�th
e�eq
uivalent�to
�Colum
ns�(1
),�(2)�and
�(3)�respe
ctively�bu
t�for�th
e�subsam
ple�of�USͲbased�
inventors�o
nly.�Since�percentiles�a
re�calculated�with
�a�te
chno
logyͲyear�cell,�all�regressions�im
plicitly�includ
e�fixed
�effe
cts�for�th
e�patent's�application�year�as�
well�as�a
�techno
logy�fixed�effect�(for�Solar,�W
ind,�Biofuels,�Hydro�and
�Geo
thermal).�Parenthe
ses�rep
ort�rob
ust�stand
ard�errors,�clustered
�by�assig
nee.���***�
p<0.01
,�**�p<
0.05
,�*�p<0.1
Full�Sample
USͲbased�Inventors�o
nly

(1)
(2)
(3)
(4)
(5)
(6)
(a)��Ve
nture�Capital�Backed�Startup
Ͳ0.340
Ͳ0.338
Ͳ0.213
Ͳ0.135
Ͳ0.130
Ͳ0.146
(0.266
)(0.266
)(0.281
)(0.296
)(0.296
)(0.308
)(b)��Incumbe
nt�firm
s0.40
5**
0.40
5**
0.46
6**
0.37
9**
0.38
0**
0.30
7(0.188
)(0.188
)(0.232
)(0.181
)(0.181
)(0.219
)(c)��Unassigne
dͲ5.259
***
Ͳ5.283
***
(1.045
)(1.082
)
PͲvalue�on
�Chi2�test�fo
r�differen
ce�between�(a)�and
�(b)
0.00
7***
0.00
7***
0.01
3**
0.05
6*0.05
7*0.08
7*
Patent�app
lication�year�fixed�effects
YY
YY
YY
Techno
logy�fixed�effects
YY
YY
YY
Observatio
ns22
,869
17,136
11,611
13,589
9,52
36,15
5
Table�6
Degree
�of�self�cita
tion
This�table�repo
rts�the
�results�from
�Negative�bino
mial�regressions�whe
re�th
e�de
pend
ent�variable�is�the�nu
mbe
r�of�n
umbe
r�of�b
ackw
ard�citatio
ns�th
at�are�se
lfͲcitatio
ns.��All�regressions�con
trol�fo
r�the
�total�num
ber�o
f�backw
ard�citatio
ns,�so�the�coefficients�reflect�th
e�share�of�prio
r�art�being
�cite
d�that�is�se
lfͲcitatio
n.�
They�can
�therefore�be
�interpreted�as�th
e�de
gree
�to�which�th
e�assig
nee�is�en
gaged�in�increm
ental�or�e
xploita
tive�inno
vatio
n.��Colum
n�(1)�rep
orts�re
sults�fo
r�the�full�sample.��Colum
ns�(2
)�and
�(3)�e
xclude
�paten
ts�with
�no�assig
nees.�Colum
n�(3)�loo
ks�only��at�the
�latter�half�o
f�the
�thirtyͲyear�period,�from
�199
5Ͳ20
09.��
Columns�(4
),�(5)�and
�(6)�are�th
e�eq
uivalent�to
�Colum
ns�(1
),�(2)�and
�(3)�respe
ctively�bu
t�for�th
e�subsam
ple�of�USͲbased�inventors�o
nly.�All�regressio
ns�includ
e�fixed
�effe
cts�for�th
e�patent's�application�year�as�w
ell�as�a
�techno
logy�fixed�effect�(for�Solar,�W
ind,�Biofuels,�Hydro�and
�Geo
thermal).�Parenthe
ses�rep
ort�
robu
st�standard�errors,�clustered
�by�assig
nee.���***�p<
0.01
,�**�p<
0.05
,�*�p<0.1 Full�Sample
USͲbased�Inventors�o
nly

(1)
(2)
(3)
(4)
(5)
(6)
(a)��Ve
nture�Capital�Backed�Startup
Ͳ0.020
Ͳ0.017
Ͳ0.022
*0.00
30.01
1Ͳ0.000
(0.014
)(0.015
)(0.012
)(0.018
)(0.022
)(0.017
)(b)��Incumbe
nt�firm
sͲ0.039
***
Ͳ0.039
***
Ͳ0.052
***
Ͳ0.050
***
Ͳ0.049
***
Ͳ0.068
**(0.012
)(0.012
)(0.017
)(0.019
)(0.018
)(0.029
)(c)��Unassigne
dͲ0.009
**Ͳ0.005
(0.004
)(0.005
)
PͲvalue�on
�Wald�test�fo
r�differen
ce�between�(a)�and
�(b)
0.38
00.35
20.22
20.12
10.11
70.10
*
Patent�app
lication�year�fixed�effects
YY
YY
YY
Techno
logy�fixed�effects
YY
YY
YY
Observatio
ns22
,869
17,136
11,611
13,589
9,52
36,15
5
Table�7
Characteristics�o
f�inn
ovation:�paten
t�novelty
This�table�repo
rts�the
�results�from
�OLS�re
gressio
ns�whe
re�th
e�de
pend
ent�variable�is�the�no
velty
�of�the
�paten
t�claim
s,�calculated�as�described
�in�th
e�appe
ndix.��Co
lumn�(1)�rep
orts�re
sults�fo
r�the
�full�sample.��Colum
ns�(2
)�and
�(3)�e
xclude
�paten
ts�with
�no�assig
nees.�Colum
n�(3)�loo
ks�only��at�the
�latter�half�o
f�the�thirtyͲyear�period,�from
�199
5Ͳ20
09.��Co
lumns�(4
),�(5)�and
�(6)�are�th
e�eq
uivalent�to
�Colum
ns�(1
),�(2)�and
�(3)�respe
ctively�bu
t�for�th
e�subsam
ple�of�USͲ
based�inventors�o
nly.�Since�th
e�Novelty�m
easure�is�calculated�for�e
ach�focal�paten
t�at�a
�given
�point�in
�time,�re
lativ
e�to�paten
ts�from
�the�three�previous�years�
in�th
e�same�techno
logy�area,�all�regressio
ns�im
plicitly�includ
e�fixed
�effe
cts�for�time�and�techno
logy.�Paren
theses�re
port�ro
bust�standard�errors,�clustered
�by�
assig
nee.���***�p<
0.01
,�**�p<
0.05
,�*�p<0.1
Full�Sample
USͲbased�Inventors�o
nly

Rank
Incumbe
nts
Patent�
Coun
tVC
Ͳbacked�firms
Patent�
Coun
tAcadem
ia�and
�Governm
ent
Patent�
Coun
t1
GE54
1Ko
narka�Techno
logies,�Inc.
52Indu
stria
l�Techn
ology�Re
search�Institu
t e38
2Du
Pont
235
Solopo
wer,�Inc.
33University
�of�C
alifo
rnia
363
Stine�Seed
�Com
pan y
213
LM�Glasfiber�A/S
30University
�of�W
iscon
sin27
4Ve
stas
136
Repo
wer�Systems�A
G30
Michigan�State�Universit y
225
Cano
n13
1Nanosolar,�Inc.
29U.S.�N
avy
216
Siem
ens
92Stion�Co
rporation
24U.S.�D
epartm
ent�o
f�Agricultur e
197
Boeing
88Clippe
r�Windp
ower�Techn
ology,�Inc.
18North�Carolina�State�University
188
Mitsub
ishi�G
rou p
88Po
werLight�C
orpo
ratio
n14
Fraunh
ofer�Society
179
Novo�Grou
p83
Miasole
13University
�of�Illinios
1710
Merschm
an�Seed s
81Solynd
ra�LLC
12Institu
t�Francais�d
u�Pe
trole
1611
Sanyo
79Tw
in�Creeks�T
echn
ologies,�Inc.
12NAS
A15
12BA
SF76
Xantrex�Techno
logy�Inc.
11University
�of�C
entral�Florid
a15
13Sharp
68Energy�Inno
vatio
ns,�Inc.
10University
�of�Florid
a14
14ExxonM
obil
65Ha
nsen
�Transmissions�International�N
V9
Princeton�University
1315
DKB�Grou
p64
Ocean
�Pow
er�Techn
ologies,�Inc
9Massachusetts�Institu
te�of�T
echn
ology�(M
IT)
1216
Applied�Materials,�Inc
61Solaria
�Corpo
ratio
n9
National�Institute�of�Advanced�Indu
stria
l�Scien
ce�and
�Techn
ology
1217
Chevron
60Ce
res,�Inc.
8Ba
ttelle�M
emorial�Institute
1118
Mon
santo
56Nanosys,�Inc
8U.S.�A
rmy
1019
Samsung
52Solexel,�Inc.
8Iowa�State�Universit y
920
Norde
x�Energy�GmbH
48Solfo
cus,�Inc.
8California�Institu
te�of�T
echn
ology
821
SunP
ower�Corpo
ratio
n45
ZeaChe
m�Inc.
8Ko
rea�Ad
vanced
�Institu
te�of�Scien
ce�and
�Techn
ology
822
Kane
ka�Corpo
ratio
n44
Metabolix�Inc.
7Pe
nnsylvania�State�Universit y
823
Lockhe
ed�M
artin
42Oryxe�Ene
rgy�International,�Inc.
7University
�of�Sou
thern�California
824
Dow
39SunP
ower�Corpo
ratio
n,�Systems
7National�Research�Co
uncil�of�C
anada
725
Sumito
mo
39Co
nverteam
�Ltd
6National�Taiwan
�Universit y
726
Gamesa
38Enlink�Ge
oene
rgy�Services,�Inc.
6U.S.�D
epartm
ent�o
f�Ene
rgy
727
RAG�Foun
datio
n37
Tigo
�Ene
rgy,�Inc.
6University
�of�A
rizon
a7
28Scho
tt�AG
37Ve
rdant�P
ower
6Clem
son�Universit y
629
CSIR
34Co
skata,�Inc.
5Que
en's�University
�at�K
ingston
630
BP33
FloD
esign�Wind�Turbine�Co
rp.
5Rice�Universit y
631
Royal�D
SM32
Kior�Inc.
5Sw
iss�Fed
eral�Institu
te�of�T
echn
ology�(EPFL)
632
UTC
32LU
CA�Techn
ologies,�Inc.
5University
�of�C
olorado
633
IBM
31Marine�Cu
rren
t�Turbine
s�Lim
ited
5University
�of�M
ichigan
634
Royal�D
utch�She
ll31
Plextron
ics,�Inc.
5University
�of�T
oled
o6
35Sony
�Corpo
ratio
n31
Prim
estar�S
olar�Inc.
5Atom
ic�Ene
rgy�Co
uncil
5
Appe
ndix
Assig
nees�with
�the�most�p
aten
ts�between�20
00Ͳ200
9,�includ
ing�US�and�Foreign�inventors

Appendix�2:��New�Measure�of�Novelty�
We�have�developed�a�new�measure�of�Novelty�that�is�not�based�on�citationͲmeasures.��Instead,�we�draw�on�a�textual�analysis�of�patent�applications�to�look�at�the�similarity�of�patent�claims�and�descriptions�for�patents�in�a�given�technologyͲarea.�Intuitively,�our�definition�is�such�that�patents�with�greater�textual�similarity�to�neighboring�patents�are�considered�to�be�less�novel.�Our�measure�of�novelty�should�be�particularly�useful�in�the�context�of�scienceͲbased�patenting,�where�technical�terms�are�more�unique�and�therefore�more�likely�to�signal�differences�in�the�characteristics�of�innovation,�and�for�more�recent�time�periods,�where�initial�forward�citations�may�be�a�noisy�predictor�of�ultimate�outcomes.�
While�a�more�complete�exposition�and�validation�of�the�measure�of�Novelty�is�being�developed�elsewhere�(see�Younge,�2013�Ͳ�ready�this�fall),�the�general�outline�for�the�calculation�of�the�measure�is�as�follows:�
First,�the�calculation�algorithm�reviews�every�patent�claim�and�description�in�the�sample�to�build�a�list�of�all�terms�used;�the�list�of�terms�constitutes�a�highͲdimensional�positive�space�wherein�each�term�represents�a�dimension�into�that�space.�Second,�the�algorithm�positions�each�patent�in�the�vector�space�by�assigning�it�a�set�of�coordinates�where�the�magnitude�of�each�dimension�is�calculated�as�the�"term�frequency�inverse�document�frequency"�(TFͲIDF)�of�each�term�in�the�patent.�Intuitively,�TFͲIDF�gives�a�greater�weight�to�a�dimension�when�a�term�occurs�more�frequently�in�the�patent,�and�gives�a�lesser�weight�to�a�dimension�if�the�word�is�frequently�observed�in�other�patents�as�well.�Third,�the�algorithm�calculates�the�“similarity”�between�every�possible�combination�of�two�patents,�by�calculating�the�cosine�of�the�angle�formed�between�their�vectors.�The�measurement�of�similarity�is�bounded�[0,1],�with�a�measurement�of�1�representing�a�perfect�similarity�between�two�patents.��
Having�thus�arrived�at�a�pairͲwise�list�of�similarity�comparisons,�between�every�possible�combination�of�patents�in�the�sample,�the�algorithm�then�calculates�a�measurement�of�Novelty�for�each�focal�patent�by�examining�the�distribution�of�similarities�relative�to�a�comparison�set�of�patents.�The�comparison�set�is�draw�from�the�prior�three�years�and�from�the�same�technology�area�as�the�focal�patent�(e.g.,�“Solar”).�To�assess�the�“novelty”�of�a�patent�–�a�concept�connoting�few�neighbors�in�the�technology�landscape�–�we�take�the�5th�percentile�of�the�rankͲordered�distribution�of�similarities�tied�to�the�comparison�set.�For�ease�of�interpretation,�we�reverse�the�novelty�measure�by�subtracting�it�from�1,�arriving�at�a�measurement�for�Novelty�that�is�bounded�[0,1],�where�1�represents�a�patent�that�is�entirely�dissimilar�from�all�other�patents.�When�needed,�we�average�patentͲlevel�measures�of�novelty�up�to�the�firm�or�category�level.��
�