innovation and investment in capitalist economies 1870-2000
TRANSCRIPT
0
INNOVATION AND INVESTMENT IN CAPITALIST ECONOMIES 1870-2000:
Kaleckian Dynamics and Evolutionary Life cycles
Jerry Courvisanos
School of Economics University of Tasmania,
Locked Bag 1-315, Launceston, Tasmania, 7250 Australia Facsimile 03-6324 3369
e-mail: [email protected]
and
Bart Verspagen
ECIS - Eindhoven Centre for Innovation Studies, Eindhoven University of Technology,
PO Box 513, 5600 MB Eindhoven,
The Netherlands
Paper presented to the SEVENTH INTERNATIONAL POST KEYNESIAN WORKSHOP
29 June-3 July, 2002 University of Missouri, Kansas City, USA

1
Abstract Ever since the start of the Industrial Revolution in Britain in the 1760s, innovation and investment have been crucial elements in economic explanations of the dynamics of capitalism. Classical economics recognises that innovation embodied in the form of new machines through fixed capital investment is the essential process for realising economic development. This study sets up a theoretical linkage between innovation and investment in historical time, without reference to any static equilibrium model. Instead, a Kaleckian-based investment cycle model is set up with the double-sided profit and investment relationship, upon which is added the innovation industry life-cycle processes that provide the stimulus for investment. By threading together evolutionary life cycle of industry development through innovative processes with Kaleckian extended reproduction through volatility of the investment process, the instability of cycles and their trend growth can be identified. Tension between virtuous and vicious cycle effects operates to create uncertainty and strategic planning that lead to patterns of industry and economy-wide development of cumulative expansion (and booms) along with periods of cumulative destruction and insecurity. The latter produce problematic efforts to innovate, which can result in renewed strong investment expansion or extended periods of small investment (mini-) cycles. A historical quantitative (HQ) approach to time series data is used to understand these dynamic processes for the period 1870 to 2000. Five OECD countries∗ for this period are examined using data on patents (proxy for innovation), GDP and investment. The HQ approach shows the plausibility of these important linkages between innovation and investment that have been missed when examined through static analysis of these relations. In terms of evolutionary industry life-cycle form, the complete period is separated into sub-periods to examine how the changes in technological paradigms through these sub-periods affect differently investment cycles and GDP growth trends. Conclusions from this work indicate the need to re-examine the way strategies are formed and developed in both the private and public sectors for more effective appropriation of innovation into the investment planning process.
∗ The OECD countries in this study are USA, UK, Japan, France and Germany.

2
…Kalecki’s analysis provides for an endogenous rate of growth, albeit one which rests on the stimulating effect of innovation on investment. (Sawyer, 1996, p. 107) 1. The Issue – Dynamics of Innovation and Investment Post Keynesian economics has a strong claim to being dynamic in terms of handling historical time without reference to some statical equilibrium concept. Innovation is a concept that has recently been analysed with much empirical evidence to indicate its crucial role in the long-run dynamics of modern capitalism. Classical economics recognised that innovation embodied in the form of new machines through fixed capital investment is the essential process for realising economic development. Going forward in time, the 1990s strong growth path of the US economy and its satellites (like Australia) show the potency of innovation in helping to deliver this growth. As we move into the new century, it is imperative that innovation becomes an intrinsic endogenous element of investment in Post Keynesian analysis, yet it has been neglected in favour of more short-run effects like financial instability. The quotation above by Sawyer indicates how Kalecki viewed innovation as the stimulating effect on investment and its impact on cycles and growth. Courvisanos (2001) argues for a more inclusive role for innovation in the Post Keynesian analysis through the untapped insights of Kalecki and linking them to the evolutionary economics that has researched innovation very effectively in a long-run context over the last 15 years. This paper attempts to do this with historical data as it shows the relation between innovation and investment and its impact on the instability of business cycles and thus affecting the trend growth of these cycles. This way any strong upswing in a cycle must be related to the following downswing and its implication for new investment and further growth. The next section outlines recent theoretical and empirical investigations into this dynamic link between innovation and investment upon which this paper’s analysis is built. Section three is an exposition of the Kaleckian framework of analysis used in this study to link the two concepts together. The particular historical quantitative approach to the analysis of time series data is set out in Section four, along with a precis of the empirical data used. Section five is the pattern-matching explanation of the time series data, followed by a short section on the limitations of this study. Finally, a summary is presented indicating the policy analysis and future research required both at the statistical and policy levels. 2. A Review of the Literature As the research field of economics deepened over more than two centuries since the Industrial Revolution, the linkage between innovation and investment developed by early classical writers has become more tenuous. Research in innovation and investment has tended to be uncoupled, with linkage between the two becoming sporadic. Only economists examining the economy as a vast interconnected “open systems” canvas continued to maintain this link; notably in respect to the heritage of this study we can identify Karl Marx, Rosa Luxemburg, Michał Kalecki and Joseph Schumpeter. Innovation research has taken two roads, and Post Keynesians have generally ignored both routes. One is the road to broad-based evolutionary change in the long-term structure of

3
capitalism, while the other is the road to narrow-based entrepreneurship studies at the firm level. Attempts to incorporate investment into the theoretical analysis of innovation have been limited (Stoneman, 1983, p. 202). Recent books that review the innovation literature continue to reinforce this theoretical limitation by having no analysis of innovation with investment (Dodgson and Rothwell, 1994; Freeman and Soete, 1997). Two major exceptions to this are Salter (1960) from the neoclassical perspective, and Freeman and Perez (1988) from the evolutionary perspective. Both innovation studies set up economic “snapshots” which provide case study patterns to show the plausibility of the theoretical relations they derive with respect to investment. Salter examines technical change and its implications for the means of production (MOP) increments at the margin in different industry sectors. In an exceptionally insightful manner, Salter recognises the gap between available innovation and its application via investment. He uses market signals to indicate possible postponements in the use of introduction of more innovative MOP and consequent delays in scrapping old MOP, thus the capital stock becomes “fossilised” (Salter, 1960, p. 154). This exposes technical change to different rates of productivity between industries. Freeman and Perez (1988) take a dynamic structural adjustment view of the economy in respect to innovation and note the mismatch of current investment to new available technology. Rather than market signals, this study notes the variations in the climate of confidence related to the type of innovation and the life-cycle of the industries which account for this mismatch, leading to intensified investment instability. The study concludes with a passage that Post Keynesians would be strongly supportive of:
The present wave of technical change sweeping through the world economy is likely to exacerbate the problems of instability in investment, and of structural change at the national and international level and the associated disequilibria in the international economy. (p. 63)
Investment research has also taken two roads. At the aggregate level, the Post Keynesians have led the investment analysis in its capital accumulation form, identifying it as a central role in effective demand of income determination and its impact on business cycles and trend growth. At the firm level, an analysis of investment decision-making has been dominated by neoclassical studies with economic rational determination of investment quantity and relating this to various notions of uncertainty. In both forms, innovation (or technical progress, as it is more generally referred to in the investment literature) is characterised as a deus ex machina that adds an exogenous alteration to the investment configuration, without explaining the link between innovation and investment. The general justification from both perspectives for this is that “…the issues are quite complex and difficult to model.” (Lavoie, 1992, p. 316) From the neoclassical perspective, investment research generally ignores the role of technological innovation except as some exogenous force and only on a single firm basis when the role of entrepreneurship is brought into play. The central neoclassical literature on investment behaviour is based on the seminal work of Dixit and Pindyck (1994) where uncertainty is handled as calculable (or probabilistic) uncertainty, and capital stock is homogenous that implies no role for innovation. At the aggregate level, the endogeneity of technical change in the new neoclassical growth models has still left the linkage highly tenuous. A recent review of this literature in relation to innovation concludes that:

4
Although such [permanent] innovations are important sources of fluctuations in macroeconomic data, they [new growth models] are unable to explain large proportions of fluctuations in observed economic data… Overall, the results reflect the inadequacy of one-factor neoclassical stochastic growth models in describing the dynamic behaviour of (real) macroeconomic variables, and suggest the need for alternative models of economic growth. (Hossain and Chung, 1999, p. 1081)
Alternative investment models with innovation are available. The classic proposition comes from Schumpeter (1939) where the investment function responds to waves of optimism and pessimism that create clusters of innovation and thus, “bunching” of investment (“clust-bun” effect). This leads to susceptibility for unstable investment cycles and the development of a trigger mechanism to initiate fundamentally new innovation systems with long wave implications. Kalecki (1962) reinforces the cycle-trend effect that innovation has on the investment function.1 The intensity of innovation affects both the amplitude of investment cycles and also shifts the trend path of investment growth, by flows of vicious and virtuous circles. Virtuous circle effect occurs as innovation intensity rises, increasing the amplitude of the upper turning point of the investment cycle and shifting the trend path upwards.2 Vicious circle effect increases the amplitude of the lower turning point and shifting the trend downwards. Steindl (1979, p. 7) formalises this by considering the pace of innovation as a shift parameter of the Kaleckian investment function. Mensch (1979) provides an extensive economic history of the cluster innovation effect and its sequencing to investment, in terms of a long wave pattern of economic development. This started off an intense debate on whether there exists a clustering effect. Silverberg and Verspagen (2002) summarises this debate and then runs Poisson regressions to conclude that time series of basic (major) innovations show no long wave clustering effect. Clustering is observed in the form of ‘random’ spells of above (and below) average innovation activity, but these cannot be systematically related to ‘long waves’ in a causal way. This leaves open the possibility that incremental or endogenous innovations are driven by economic motives related to shorter-term investment cycles. This is investigated in this paper using a Kaleckian model. The common Kaleckian feature of expanded reproduction appears in the innovation and investment story that has not been recognised by the protagonists in this clustering debate. The prerequisite for clustering is deep depressions or breakthroughs in technology, both reflect reactions by private sector (in the former case) and public sector (in the latter case) to deep problems in the downswing of the previous business cycle. Then, the bunching requires effective demand stimulus through widespread diffusion of a cyclical cluster effect that can only be done through the availability of a surplus for investment (private profits and public deficit spending). Roadblocks to this “clust-bun” effect reside in the institutional frameworks of nations; particular the ones with still dominant mature industries with older technologies (Freeman and Perez, 1988, pp. 58-65). Increased uncertainty arising from large investment in the new technology systems also adds a roadblock through
1 Kalecki (1991, p. 455) endorses the Schumpeterian view when he states that “…capitalists investing ‘today’ think to have an advantage over those having invested ‘yesterday’ because of technical novelties that have reached them.” Note, Kalecki often uses the word “invention” instead of “innovation” in many of his discussions of technical progress. See Courvisanos (1996, p. 107) for resolution of this confusion. 2 Empirical evidence by Toivanen et al. (1999) support the notion of this virtuous circle effect.

5
increased macroeconomic volatility, which Toivanen et al. (1999) empirically identify as slowing down the diffusion process. Kaldor (1961) and Schmookler (1966) reverse the causality sequencing of innovation and investment, with the rate of investment determining the rate of innovation. Kalecki also recognises this sequence, despite having identified the innovation-driven process (see especially footnote #1 above). Kalecki places this investment-driven process clearly into an appropriate context by viewing this innovation process as “...part and parcel of ‘ordinary’ investment” (Kalecki, 1954, p. 158), or endogenous innovation. Geroski and Walters (1995, p. 926) empirical investigation supports endogenous innovation, concluding that demand matters, “…although it is evident that it plays only a relatively modest role in stimulating innovative activity”. In a statistical note to this study, Collins and Yao (1998) argue that the data does not support this conclusion. Further, Geroski and Walters (1995, p. 925) themselves signal in a footnote (#17) the possibility that “…more basic or fundamental [exogenous] innovations have different cyclical patterns from the less substantive [endogenous] innovations, and this may explain these differences in results.”3 Instead of unidirectional causality, the discussion above clearly leads to a circular flow where one innovation process feeds into the other. Kaldor (1966) introduces the principle of cumulative causation, which is the “self-reinforcing dynamics” in the circular process of investment demand leading to innovation that then stimulates further investment. The distinction between exogenous and endogenous innovation specifies how innovation enters this cumulative causation process. In this context, Gomulka (1990, pp. 45-7) sees research and development (R&D) expenditure as central to the endogenous innovation process, with large firms with strong profit results having the ability to activate large R&D spending. Patents seem to reflect more the clustering of innovations (Baker, 1976; Geroski and Walters, 1995, p. 924). Concluding this literature review on the broad perspective is a study that attempts to provide ergodic closure to the Kalecki trend and cycle theory. The study argues that Kalecki's central role of innovations in preventing the trend rate of unemployment from increasing is unsupportable, as “…the balanced growth rate which Kalecki took to be stable is, in fact, unstable, rendering it unsuitable to serve as the trend growth rate.” (Gomulka et al., 1990, p. 535) Lavoie (1992, pp. 297-327) examines Kalecki’s innovation and investment analysis at the theoretical level and rejects the ergodic closure assumption in Gomulka et al. that ties his theory to the neoclassical mainstream. Kalecki clearly assumes that the rate of capacity utilisation may diverge from its full-capacity rate even in the long run and the “…reserve army of the unemployed are typical features of capitalism at least throughout a considerable part of the cycle.” (Kalecki, 1971, p. 137) This asserts instability, as the dynamic non-ergodic business cycle has innovation creating conditions that move the trend growth away from any analytical “stability”. At the practical level, Kalecki’s time unit of analysis of one year is sufficient to avoid any “…unsuitable solutions of the equation.” (Steindl, 1991) The conclusions here are important, since the next section uses a non-ergodic dynamic Kaleckian model of cycles and trend to link innovation and investment in order to analyse the empirical data subsequently presented. 3 See Courvisanos (1996, pp. 44-50) for more on the distinction between endogenous and exogenous innovation from Kalecki’s use of both these innovation processes.
6
3. The Framework - Kaleckian Macro Environment and Schumpeterian Innovation This section explains our basic theoretical framework. We will attempt to set out an interpretation of the business cycle, more specifically the investment cycle, based on two existing theoretical frameworks: the Kaleckian framework of analysis that tries to explain investment behaviour as a function of the macro environment, and the Schumpeterian framework that describes the dynamics of technology in the long-run. The latter will be exposed first, enabling us to present the Kaleckian framework with reference to long-run trends in technology. The attempt undertaken in this section is to link together the two types of innovations described by Baran and Sweezy (1966), namely “normal” (or endogenous in Kalecki’s terminology) and “epoch-making” (or exogenous from a Kaleckian point of view). We will be building on Freeman and Perez (1988) by looking at short- or middle-long-run investment behaviour in the context of long periods of secular decline or growth in economic development. In this way, the conclusions of the Kaleckian and evolutionary traditions can be integrated. Long-run decline is associated with the limitations of scale production in oligopolistic competition, as the old technology systems are running out of possible new adaptations. Diffusion of the old systems through endogenous innovation slows down and imitators become considerably fewer. The large powerful corporations attempt to protect existing capital values and ignore the new technological systems being developed on the fringe of the corporate world. This tends to exacerbate the mismatch between new technologies and powerful institutional framework based around monopoly capital. It was Steindl, back in 1952, who recognised this secular decline as the incentive to reduce surplus capacity and invest in established monopoly capital sectors. In his 1976 introduction to the 1952 book reprint, Steindl stated that he was “...ready to admit a possibility which I denied in my book: that it might be the result of exhaustion of a long technological wave” (1976, p. xv). In contrast, long-run growth is associated with the intensification of entrepreneurship in innovation. “Under favourable conditions, the Schumpeterian bandwagons roll and business confidence improves, leading to an atmosphere of ‘boom’…” (Freeman and Perez, 1988, p. 43). The inherent uncertainties that exist and are attached to investment decisions are willingly accepted as animal spirits rise. The Kaleckian framework explains why such rising animal spirits become strong enough to create strong investment cycle peaks and very weak investment cycle troughs, with the accompanying rapid diffusion of new innovations. 3.1. Schumpeterian dynamics of technology The most basic point of Schumpeter’s theory of innovation dynamics is the distinction between radical innovations and incremental innovations. Radical innovations are major breakthroughs that provide radical breaks with past technological systems. Examples are the steam engine, the internal combustion engine, the digital computer, or gene technology. Incremental innovations are small improvements of these basic innovations, aimed at refining and exploiting the potential offered by the breakthroughs.

7
Thus, incremental innovation in the Schumpeterian sense is quite similar to Kalecki’s concept of ‘endogenous’ innovation. Such endogenous innovation is of secondary importance from the scientific standpoint, coming as it does from: (i) Slight improvements or adaptations on previous capital equipment; (ii) Some improvement in quality or design or new packaging of old products so that they look
“new” (e.g. fins on an old style car model); (iii) Some new “vein” or extension of previous raw material sources. This innovation is most common and involves new investment spending as a matter of course when business is ongoing. In relation to the Kaleckian investment cycle, such innovation is called endogenous because it is the cycle itself that induces the innovation and with it, higher levels of investment orders.4 This will be considered in more detail below. Schumpeter’s theory states that basic innovations lead to waves of incremental (or endogenous) innovation, in the form of ‘bandwagons’ of imitation and improvements. Such imitation and small improvements take the form of incremental (or endogenous) innovation, and is introduced into the economy by means of new investment. Hence diffusion, incremental innovation and investment are closely interlinked. Such a bandwagon of diffusion gives rise to long periods of rapid economic growth. Ultimately, however, decreasing returns to investment in incremental innovation sets in, because technological opportunities of the basic innovation become exhausted. This is when technology-based growth ceases, and a downturn sets in. Schumpeter thus strongly believes in a long (50-60 years) wave in the economy, driven by radical innovation. His theory states that radical innovations are clustered in the depression phase of the long wave. However, it is exactly this explanation of the upswing of the long wave that has been criticized heavily, e.g., by Kuznets (1940). Kuznets argues that the theoretical underpinning of the question why basic innovations would cluster during the depression phase is weak in the work of Schumpeter. It is indeed hard to see why firms would only invest in the development of basic innovations during depression periods. R&D amounts in aggregate to a large body of investigation going on continuously (at different rates of intensity). This large R&D spending and related innovation effects are bound to lead to major new discoveries that can be interpreted in the Schumpeterian framework as ‘basic innovations’. This discovery may be linked to possible small developments in various laboratories and informal networks between firms and industries that are registered as a series of patents, eventually coming to fruition in some way divorced of any specific competitive behaviour. New technological paradigms come out of such aggregate developments and are the basis of structural change to a new long wave of boom and prosperity (Freeman and Perez, 1988, pp. 47-58). Kalecki, on the other hand, considered basic innovations to be largely exogenous to the part of economic behaviour he was interested in explaining. What interests us in this paper is similar to the original question put by Kalecki: what is the impact of basic (or exogenous) innovations on investment cycles in the economy. However, we take his question one step further by introducing an element of Schumpeter’s theory, namely that ‘exogenous’ (radical) and ‘endogenous’ (incremental) 4 Steindl (1976, p. 133) describes this endogenous innovation very neatly: “Technological innovations accompany the process of investment like a shadow, they do not act on it as a propelling force.”

8
innovations are linked to each other by the notion of a life cycle of basic innovations. This notion of a life cycle of basic innovations is implicit in Schumpeter’s work on long waves, and we choose to make it explicit by distinguishing three stages in the life cycle. Our notion of the life cycle of a basic innovation is similar to the concept of a technological paradigm as used by Freeman and Perez (1988), or Dosi (1982). While clearly taking the Schumpeterian idea of radical innovations on board, we will not strictly adhere to a long wave perspective, partly for the reason that the data we will consider does not seem to provide strong support for a strict long wave pattern. Our Schumpeterian perspective will rather be one in which radical innovations arrive (exogenously) in a somewhat irregular pattern, such as for example, in the case of Poisson distributed random process (see, e.g., Sahal, 1974; and Silverberg and Lehnert, 1993). This implies a ‘liberal’ attitude with regard to the timing of basic innovations compared to the old Schumpeterian hypothesis that basic innovations cluster strongly during depression periods. On the other hand, such a view leaves enough space to consider the process of diffusion of basic innovations as an irregular and non-smooth process over time, in which there are indeed periods during which radical innovation is more important than incremental innovation, or vice versa. Historical circumstances as well as factors endogenous to the investment process may lead to such large historical differences in timing of the diffusion of basic innovations. Our position is thus one of long-run variations in diffusion rates and the associated historical differences in growth, rather than that of the pure long-wave theorist. The first stage of the life cycle of a basic innovation is called the embryonic phase. This is when the new paradigm (or basic innovation) is ‘in the air’. The scientific and technological knowledge necessary to develop a new technological system is available among frontrunners in academia and business. However, there is no ultimately clear understanding of the commercial opportunities of the new paradigm, or of the exact ways in which the technology needs to develop in order for these opportunities to materialize. Thus, the embryonic stage is characterized by a large degree of strong uncertainty, and there is ample opportunity for ‘psychological factors’ to play a large role in technology-investment decisions. The next stage we call the early phase of the life cycle. This corresponds to Schumpeter’s bandwagons of incremental innovations. The technological and commercial opportunities of the basic innovation are now more or less clear. Investment opportunities are high, and decision-making concerning investment is more or less ‘normal’, i.e., less dependent on the psychological factors that were highly important during the embryonic phase. Finally, the maturity phase sets in. In the Schumpeterian setting, this relates to the period when technological opportunities of the basic innovation become exhausted. Profit rates based on the, by now, old paradigm are falling, and competition becomes more intense. In terms of calendar time, this will often overlap with increasing opportunities for new basic innovations, and hence with the embryonic stage of a next paradigm. The brief description of the three stages of the life cycle of a basic innovation already underlines the large role for investment. There is strong two-way interaction between investment and the development of the life cycle of a basic innovation. This is why we stage our theoretical argument in the context of (shorter-run) investment dynamics in the next section.

9
3.2 Kaleckian framework of analysis incorporating Schumpeterian dynamics Using Kalecki’s extended reproduction model, three observable variables are central to Kaleckian investment decision-making firms. These are profits, increasing risk (extending to the gearing or leverage ratio) and excess capacity. Within an institutional framework of monopoly capitalism, a susceptibility cycle model is developed by Courvisanos (1996), which measures the tensions that are built up when investment decisions are being made, with the three variables above acting as the barometers of this tension. During an investment boom, these tensions grow to such an extent that investment is highly susceptible to a collapse. In a historical context, such high susceptibility can be identified with falling profit rates, increased finance costs and gearing ratios, and falling utilisation rates. This build-up of tension is based on the implementation of a long-run firm investment strategy. When high susceptibility is reached, any minor factor (endogenous to the susceptibility cycle or exogenous) can add another small amount of tension that will be enough to suspend or cancel investment orders, sending the investment (activity) cycle down as a result. At the upper turning point of the susceptibility cycle, all firms experience high susceptibility and thus fragility of the situation induces a reversal in investment orders. The investment downturn that follows is timed tightly around the pressures to contract investment which affect all firms to a varying degree, but at around the same time. The timing and amplitude of the lower turning point is much more problematical than the upper turning point. Pressures to contract investment orders come from too high susceptibility across all firms. Pressures to expand investment orders come when susceptibility is low, and it depends on the more problematical issue of when a firm (or industry) wants finally to take the plunge. Tightly owned companies with less risk aversion tend to lead investment orders out of the doldrums, while the State tends to assist firms during this period by reducing costs of production through direct (e.g. subsidies) and indirect (e.g. unemployment benefits) deficit spending. These two factors strongly determine the timing and nature of the upturn. In order to analyse the interaction between ‘Schumpeterian’ and ‘Kaleckian’ dynamics, we will distinguish the situations of high and low susceptibility in the Kaleckian cycle separately, and the three stages of the Schumpeterian life cycle of a basic innovation that were introduced above. The guiding principle for bringing the two types of dynamics together will be the opportunities for incremental, or endogenous, innovation. Incremental innovations play a large role during the early and mature phases of the life cycle, but much less so during the embryonic stage. High (low) technological opportunities are found during the early (mature) stage of the life cycle. Our main theoretical conjectures are summarized in Scheme 1.

10
Scheme 1. Interaction between Schumpeterian and Kaleckian dynamics
Life-cycle stage of basic innovation
Low susceptibility of investment
High susceptibility of investment
Embryonic Cautious and fragile upturns induced by early
diffusion of new technological system; best circumstances for ‘take-
off’ of new paradigm
Possible roadblock to diffusion of new basic
innovations
Early or Growth Long upswings, rapid and strong upturn, rapid
diffusion of new technological system
Short downswings, weak downturn, slow diffusion of new technological system
Mature Rapid build-up of susceptibility: short and weak upswings; pressure for the ‘old’ paradigm to
breakdown
Strong and rapid downturn; possibly long downswings;
best circumstances for ‘sailing ship’ effect
We recall from the above discussion that by nature of the ‘creative destruction’ phenomenon, the mature stage of the life cycle of an ‘old’ basic innovation will usually overlap with the embryonic stage of the life cycle of a ‘new’ basic innovation. Hence, the first and last lines in our scheme cannot really be distinguished in a useful way in practice. We nevertheless make the analytical distinction, keeping in mind that these situations must be analysed in conjunction. First we look at how Schumpeterian dynamics of innovation impact on Kaleckian dynamics of investment cycles. R&D plays an important role in this process. R&D enables the firm to develop a set of incremental innovations, which may be held ready to be applied when susceptibility is relatively low. The firm’s R&D expenditure is a form of intangible investment to be incorporated in the long-term business investment plan. R&D expenditure may be constant throughout the investment cycle, or may vary under the same susceptibility pressures as MOP commitments. Which of the two it is depends on how important R&D is for the firm and industry. In an industry where innovation is a regular competitive strategy, R&D expenditure would be large and would vary under the same susceptibility pressures as capital expenditure. In an industry where innovation is only occasionally implemented, R&D expenditure would be small and constant over the investment cycle. When a firm decides to increase investment at relatively low susceptibility under competitive pressures and higher costs of postponement, innovations resulting from R&D investment in the past are ready to be implemented.5 In this way endogenous innovation can be “...generated and directed by a process of investment” (Steindl, 1976, p. 133). This means that the diffusion of the new
5 The firm can also buy out smaller uncompetitive firms during the contractionary stage of the investment cycle, taking advantage of innovations developed by failed firms.

11
technological system is speeded up by the favourable circumstances in the investment cycle. Alternatively, during the early life cycle phase of a new paradigm, a large, ‘exogenous’ boost to industry investment is produced at low susceptibility points. This investment boom relates to paradigm changes in single (but large) important industry sectors that adopt new technology systems, or to innovations that affect the whole economy (e.g. steam engine innovations). Either way, the investment boom is strong and resilient over a series of future cycles in susceptibility. Thus, a high availability of incremental, endogenous innovations stimulates investment, i.e., the investment cycle expansion phase may be expected to be stronger and longer in the early life cycle stage of a basic innovation. At high susceptibility, firms are under pressure to postpone investment orders and with it shelving of endogenous innovations (R&D generated patents) and possible reduction of R&D expenditures. This alleviates pressure of growing susceptibility, by concentrating on profit returns from old MOP that have a proven track record from their production, rather than the higher but more unpredictable returns from new MOP.6 Only small increases in capacity investment to protect existing MOP emerge at high levels of susceptibility. Thus, endogenous innovation postponement is induced from high susceptibility and it then adds pressure for the slowdown and eventual contraction of investment orders. At low susceptibility firms introduce endogenous innovations, both in the form of process and product innovation, under the pressure of competition. Given that the technostructure needs to implement the long-term investment strategy with innovation incorporated therein,7 then this need creates increasing competitive pressure during the contraction of the susceptibility cycle when investment orders are declining and little new investment is going on. The costs of postponing a long-term investment strategy increases over time with the knowledge that other large firms, in the industry or ready to come into the industry, have the technology also to increase their market share and growth. These pressures, along with pressures for State-based stimulus, lead to some increase in investment embodied with endogenous innovation. The creation endogenously of innovations out of low susceptibility makes some MOP obsolete and thus not part of excess capacity calculation. Also, oligopoly firms (and industries) lobby for the assistance of governments in reducing social costs of production (through subsidies, tax concessions or protection) when these firms attempt to expand their market by innovations in order to utilise new, and decommission old, idle productive capacity (O'Connor, 1973, p. 27). Such innovation and under-writing of the related risks reduce the rate of increase in susceptibility and encourages an investment recovery. However, these actions by firms and governments are not guaranteed to occur at any particular time or with any particular force. The institutional framework of a country (and region) will have a lot to do with the strength and timing of the upturn in investment orders. The impact of high susceptibility is expected to be more pronounced during the mature stages of the life cycle of a basic innovation, when opportunities for incremental innovation are already low.
6 See Toivanen et al. (1999) for empirical support. 7 See Galbraith (1974) on the role of technostructure in planning investment strategies and specific technologies for the ongoing survival and growth of the large corporation. For a recent re-interpretation of the technostructure from a Post-Keynesian perspective, see Dunn (2000).

12
Hence, we would expect the downturn of the investment cycle to be more abrupt during such periods, and also for the downswings to be longer and more pronounced. Summarizing, at the early stage of the life cycle of a basic innovation, technological opportunities are high, and hence one may expect a stronger link between investment and innovation. Situations of low susceptibility can thus be expected to be sustained longer, and consequently the associated upswing in investment will be stronger and more prolonged. Similarly, during the mature stage of the life cycle of a basic innovation, one may expect high susceptibility to generate more rapid, stronger and longer downturns of the investment cycle. We now turn to the impact of the Kaleckian investment cycle on Schumpeterian dynamics, of the introduction of new basic innovations in the economy. As noted above, Schumpeter’s original theory suggests that the introduction of basic innovations takes place during the depression periods of the long wave. Our focus on investment, however, puts more emphasis on the early upswing, which is associated with investment and hence with periods of low susceptibility. Freeman et al. (1982) also put much emphasis on this stage, which they discuss in the context of diffusion (through investment) of the new paradigm. Hence, we would expect ‘exogenous’ innovation to occur in an industry generally at the low susceptibility point, where competitive pressure exists on entrepreneurs to introduce it. When investment activity is high and susceptibility is high, entrepreneurs are not receptive to major new developments, but rather continue squeezing profits from the old paradigm, given the already large commitments made to this old paradigm during the rise of investment from the trough. As susceptibility is falling with investment order downturn, the financial constraints of high gearing in the industry are eased as debts are paid off or receivers are appointed. At low susceptibility the industry is financially restructured and becomes conducive to new investment orders. However, at this point it is not clear if or when the lower turning point of investment orders will be based on the decreasing opportunities from the old paradigm (providing only a modest upturn) or on the uncertainty of the new paradigm. Uncertainty of future profits reduces investment orders and susceptibility further. At this point even replacement investment is postponed, sending the susceptibility cycle even lower. One would thus expect that, due to the major uncertainty associated with the embryonic stage of the new basic innovation (or paradigm), the investment upswing associated with low susceptibility would be cautious and fragile. Changes in technological systems or paradigms arise only after all the minor improvements (endogenous innovation) are squeezed out of the old systems and paradigms by “monopoly capital” entrepreneurs who want to protect existing MOP and delay the new paradigm taking over. There is also “log jam” in endogenous innovations based on the new paradigm which compounds the latter’s slow initial adoption. This occurs when established powerful entrepreneurs, with much old MOP, cannot justify the entire shake-up of industries, since not enough interrelated clusters have been formed. This has been termed by Rosenberg (1976) the sailing-ship effect, after the large amount of incremental innovations in sailing ships that emerged after the introduction of the steam ship. The circumstances for the sailing ship effect to occur are best under periods of high susceptibility, when the ‘security’ of the old paradigm will have relatively high appeal to investing firms as compared to the uncertainty of a new paradigm. Any long postponements of new innovative capital

13
investment would produce a mismatch of current investment to new available technology in the economy, creating a roadblock to the “clust-bun” effect. One remaining question concerns the degree of ‘radicalness’ of the basic innovation. In Schumpeter’s original view, basic innovations are associated with ‘gales of creative destruction’. However, the breakdown of an old technological paradigm may also be more smoother, i.e., begin with readapting the old paradigm through the adoption of new inventions that require relative minor innovations. As the institutional framework slowly adapts to the new technological system, entrepreneurs’ reactions against uncertainty of profits come from competitive pressures and growing inefficiencies of old MOP. This indeed induces (slow) adaptation (by industries) and imitation (within industries) to technological trajectories that are totally new, establishing at very low susceptibility, the new investment upturn. It is creating a new investment boom and at the same time “...re-establishing the conditions for a new phase of steady development.” (Vercelli, 1989, p. 135) A paradigm shift occurs when the new adapted technological systems pervade the whole economy. Some from the evolutionary school identify such innovation-based shifts with the beginning of new long waves in the economy's development (see Kleinknecht, 1987), others see these shifts as variations driven by more short-term economic motives embodied within business cycles (Silverberg and Verspagen, 2002). 3.3 The Hypothesis The Kaleckian and Schumpeterian cycles feed on each other, but to different extents during different time periods. When basic innovations are new and have been built-up, creating a cluster of innovations, then the Schumpeterian cycle is strong. This can be compared to when this cycle is weak, with basic innovations becoming exhausted. Such differing cycle pressures feed directly into the investment decision processes. The two versions of the Schumpeterian cycle can be ameliorated or intensified as a result of what is happening in the Kaleckian susceptibility cycle. Low susceptibility encourages technological innovation by powerful strategic competitive pressures and removal of postponement of investment pressures. High susceptibility discourages technological innovation with large roadblocks to diffusion of innovations and increased pressures to postpone investment decisions. The empirical analyses conducted in the next section aim to understand these dynamic processes for the period 1870 to 2000 in five major capitalist economies. The analyses will enable a plausible story to be told which is consistent with the hypothesis outlined. 4. The Historical Quantitative Approach on the Time Series Data Five major capitalist economies are examined in this study: USA, Germany, Japan, UK and France. Three sets of time series data for each economy are used in the empirical analysis that follows, based on the framework of analysis outlined in the previous section: 1. Pat: newly registered patents at the USA Office on the basis of the country of origin of each
patent. This data represents the innovation input into the cycles. The data are taken from the US Patent and Trademark Office.

14
2. Inv: fixed capital investment of each country. This data set represents the investment that is crucial in the operation of the vicious and virtuous circles. The data set are taken from Maddison (1995) and updated with new data from the Groningen Growth and Development Centre.
3. GDP: gross domestic product of each country. This data set represents the GDP variable that is the basis for determination of profits. The source of these data is the same as for the Investment data.
The period for which there is data varies across the five economies. In general, the data is extended as far back as statistical data collection allows. The aim is to have data sets that allow for an analysis from the late 19th Century (including the 1890s deep recession) to the present day (2000). Appendix A has three graphs for each country. • “Raw data (ln)” graph shows the actual data of all three variables in log-form, together with
their respective equations denoting trend of the data. • “Deviation from trend (ln)” graph shows in log-form the deviations from the given trend of
all three data series. • “MV5” graph shows the moving variance in continuous five-year periods based on the
detrended data for each variable. The deviation graphs show the nature of the cycles of investment, innovation and GDP (or business cycle); identifying the peaks and troughs in the cyclical processes at work and the extent of upswings and downswings in the cycles. The MV5 graphs show the extent of instability in each of the cycles, smoothing out seasonal bumps by the five-year moving variance of the data. The MV5 graph identifies instability by the extent the graph moves above zero. The higher the MV5 graph moves above zero, the greater is the extent of volatility in the respective cycle of the variable denoted. An historical quantitative approach is applied to the graphs in Appendix A. This approach identifies summary five-OECD country patterns and US patterns in the cyclical processes that relate to the dynamic model sketched in Section 3 above. These patterns are matched and compared across the five different economies to provide a plausible dynamic exposition of innovation and investment, using the important linkages set out in the Section 3 framework. Such dynamic linkages would be completely missed when examined through conventional static analysis. In terms of evolutionary industry life-cycle form, the whole period 1870 to 2000 is separated into sub-periods to examine how the changes in technological paradigms through these sub-periods affect differently investment cycles and GDP growth trends. The sub-periods examined are: • Period I: from the start of each data set to the beginning of World War One in 1914, reflecting
the rise of the USA as the predominant economic power based on railways and electrification. • Period II: covering the rise of mass production during the interwar period and the two world
wars. • Period III: from 1946 to 2000, covering the late 20th century developments, particularly the
maturation of the mass production mode and the rise of the “New” Information Economy.

15
The above data with the periods described are combined with two other sets of time series data compiled by other authors to provide a summary perspective of how the Kaleckian susceptibility cycle across the five countries in our sample inter-relates with Schumpeterian dynamics. 5. Analysis of Data 5.1 Kaleckian Dynamics We consider two sets of summary data for interpreting susceptibility to investment from a Kaleckian perspective, based on Courvisanos (1996). The analysis ignores innovation effects until the Schumpeterian dynamics are incorporated in an integrated interpretation in the forthcoming sub-section.
Figure 1. GDP (in 1990 prices) of the five countries in our sample (Germany, France, Japan, UK, USA), thin line is natural log of actual data, thick line is estimated trend (equation for trend documented on the graph) Initially we set up the perspective of the whole period 1870 to 2000 by the graph that combines the GDP figures for all the five countries in our sample to show a regression equation and its trend line. This graph is in Figure 1 and suggests a pattern of three ‘stages’ that correspond to the three sub-periods delineated above. The first period is up to 1914 in which the GDP consistently remains above the trend line. The second period we date from the peak in 1914, when the GDP begins a downswing that takes the combined five-country GDP to below the trend and keep it
y = 0.0291x - 42.046R2 = 0.9841
13.0
13.5
14.0
14.5
15.0
15.5
16.0
16.5
1880 1890 1900 1910 1920 1930 1940 1950 1960 1970 1980 1990 2000

16
there through the next two business cycles (with peaks in 1929 - just before the Great Depression - and the war related 1943-44). The third period we date from 1946, when the data is in a trough and begins an upswing that takes the combined GDP to eventually cross over above the trend line in 1964 (the first it does this since the 1914 peak – except momentarily in the peak of 1943-44). Then the GDP remains above trend for the next two business cycles (with peaks in 1974 and 1989; and troughs in 1981-82 and 1992-93). The pattern of “deviation from trend” investment data in the five individual countries is now considered within the context of these three stages of GDP. We take the USA on its own firstly, since it has such a prominence throughout the 20th Century as an economic power. Note that the first period up to 1914 shows great investment cycle volatility, reflecting large swings in susceptibility in a period when the US State plays no significant intervention role. This volatility is more clearly seen in the MV5 graph with the investment variance index remaining very high through this early period. The large investment peaks in 1880 and 1890 keep the GDP significantly above the zero index. Then follows a relatively very strong investment upswing in the post-1890s depression (from trough in 1895 to highly volatile peak period around 1910), reaching very high susceptibility by the end of Period I. Period II has strong investment downswings with weak upswings. The decreasing trend in MV5 (except for the 1930 spike) supports this subdued susceptibility-based investment cycle period. WWII distortion is evident by the only large diversion between investment and GDP data, but investment keeps rising out of the “Great Depression” investment collapse, with a notable upswing into Period III from the 1946 investment trough. This post-WWII period is one with relatively low susceptibility until the mid-1960s, followed by an investment trend downswing till the 1992-93 recession. The MV5 graph indicates the lower investment volatility that accompanies low susceptibility through the early post-WWII period. Some volatility increase post-1964, especially during the recessions, indicates rising susceptibility. Only since the last recession (1992-93) have we seen in the USA a revival of a strong upswing in investment and with it significantly higher susceptibility. The Dumenil-Levy data on US profit rates and capital utilization in Figure 2 support the above pattern of investment susceptibility. Profit rates decline in five significant time periods, which signal peaking of investment susceptibility. These are 1880-90, 1906-1914, 1923-32, 1952-58 and 1965-82. All five periods provide signs of high susceptibility and future severe declines in the investment cycle as noted above. The strong WWII spike in profit rates shows the significant impetus a major war effort by the USA has on the profitability of capitalism, which is replicated in a more subdued way during the Korean War (1951-52) and the Vietnam War (mid-1960s). The virtual exclusion of the US military in WWI is evident by some multiplier expansion in profit rates from 1914 onwards, but without the spike-effect as the military withdrew from the other US war efforts.

17
Figure 2. Profit rate and capital utilization for the US economy (source: Dumenil and Levy, 1993) The US capacity utilization data on the same graph show a similar pattern to the profit rates, but with a lag between one and two years. The lag is seen in the stimulus to investment by rising profits, which then feeds into stronger economic activity (GDP) and higher capacity utilization of given capital stock. This exemplifies low susceptibility and sets up the basis for an upswing in investment activity. The data identifies such circumstances when utilization rates are at their trough and business cycle contractions are continuing their downward slide. These periods of low susceptibility occur towards the end of recessions: notably around the late 1890s, early 1910s, mid 1930s, late 1940s, early 1960s, mid 1980s and mid 1990s. Declining profits reflect, with a lag, falling utilization rates which first come about due to expanding capital stock and then reduced economic activity. These circumstances lead to growing susceptibility, reaching peak high susceptibility in mid-downswing of utilization rates: notably 1890, 1910, 1930, 1946, 1958, 1973 and 1980. Note that these dates closely correspond with the end of the declining profits rate periods. Taken together, the two sets of data for the USA show seven peaks of high susceptibility in investment that closely relate to the beginnings of business cycle contractions. Business cycle upturns are more problematic, depending on low susceptibility and the incentive to invest primarily coming through innovations. This integration of innovation and investment is examined in the next section. However, the data points to seven periods when the US economy was receptive to some investment spurt as identified by the low susceptibility dates above.
0
0.1
0.2
0.3
0.4
0.5
0.6
1870 1880 1890 1900 1910 1920 1930 1940 1950 1960 1970 1980 1990-0.5
-0.4
-0.3
-0.2
-0.1
0
0.1
0.2
0.3
0.4
profit rate (left) capital utilization (right)
18
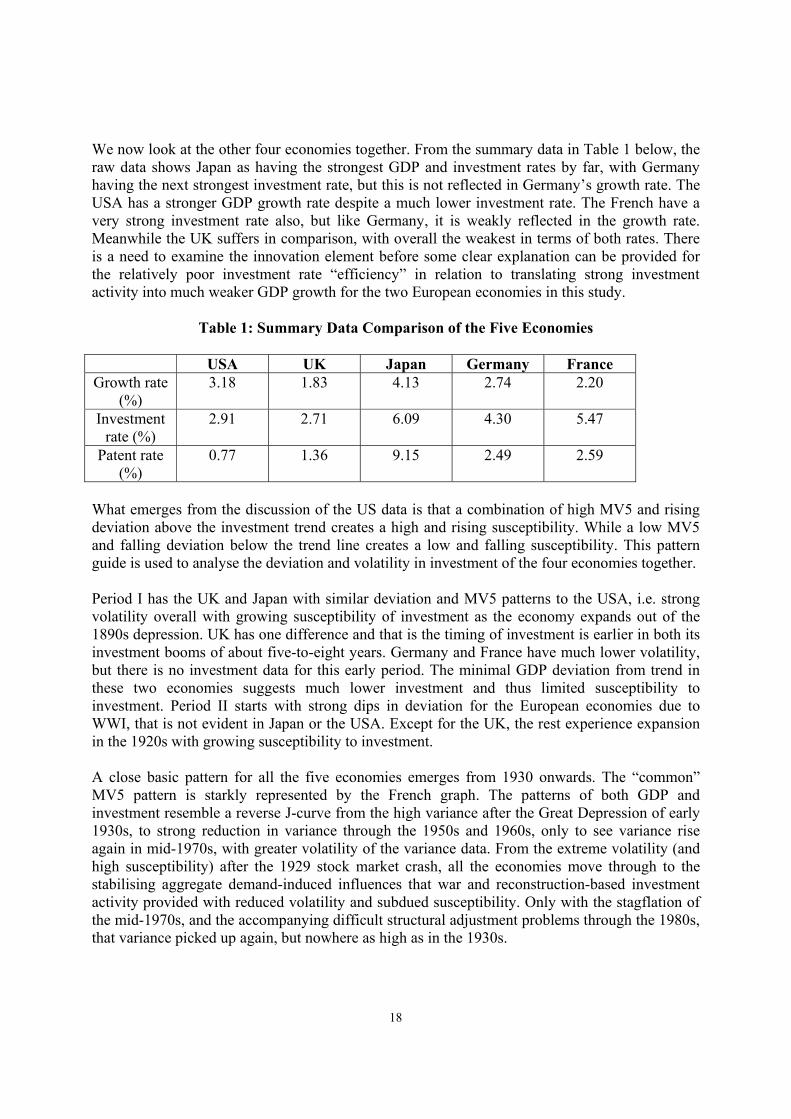
We now look at the other four economies together. From the summary data in Table 1 below, the raw data shows Japan as having the strongest GDP and investment rates by far, with Germany having the next strongest investment rate, but this is not reflected in Germany’s growth rate. The USA has a stronger GDP growth rate despite a much lower investment rate. The French have a very strong investment rate also, but like Germany, it is weakly reflected in the growth rate. Meanwhile the UK suffers in comparison, with overall the weakest in terms of both rates. There is a need to examine the innovation element before some clear explanation can be provided for the relatively poor investment rate “efficiency” in relation to translating strong investment activity into much weaker GDP growth for the two European economies in this study.
Table 1: Summary Data Comparison of the Five Economies
USA UK Japan Germany France Growth rate
(%) 3.18 1.83 4.13 2.74 2.20
Investment rate (%)
2.91 2.71 6.09 4.30 5.47
Patent rate (%)
0.77 1.36 9.15 2.49 2.59
What emerges from the discussion of the US data is that a combination of high MV5 and rising deviation above the investment trend creates a high and rising susceptibility. While a low MV5 and falling deviation below the trend line creates a low and falling susceptibility. This pattern guide is used to analyse the deviation and volatility in investment of the four economies together. Period I has the UK and Japan with similar deviation and MV5 patterns to the USA, i.e. strong volatility overall with growing susceptibility of investment as the economy expands out of the 1890s depression. UK has one difference and that is the timing of investment is earlier in both its investment booms of about five-to-eight years. Germany and France have much lower volatility, but there is no investment data for this early period. The minimal GDP deviation from trend in these two economies suggests much lower investment and thus limited susceptibility to investment. Period II starts with strong dips in deviation for the European economies due to WWI, that is not evident in Japan or the USA. Except for the UK, the rest experience expansion in the 1920s with growing susceptibility to investment. A close basic pattern for all the five economies emerges from 1930 onwards. The “common” MV5 pattern is starkly represented by the French graph. The patterns of both GDP and investment resemble a reverse J-curve from the high variance after the Great Depression of early 1930s, to strong reduction in variance through the 1950s and 1960s, only to see variance rise again in mid-1970s, with greater volatility of the variance data. From the extreme volatility (and high susceptibility) after the 1929 stock market crash, all the economies move through to the stabilising aggregate demand-induced influences that war and reconstruction-based investment activity provided with reduced volatility and subdued susceptibility. Only with the stagflation of the mid-1970s, and the accompanying difficult structural adjustment problems through the 1980s, that variance picked up again, but nowhere as high as in the 1930s.

19
The 1990s are very recent in historical overview terms, but the tails of the graphs show differences that seem to suggest some divergence from the “common” pattern. The USA is clearly showing a rising deviation in investment that is being followed with a weaker rise in the UK. The two European economies and Japan are showing a tail that is deviating downwards and falling below the trend line in both investment and GDP. Susceptibility is thus much higher in the USA and UK relative to the other three economies as we enter the 21st Century. Innovation should be able to shed light on this divergence as well as indicating the difference in investment opportunities in respect to these economies over the next few years.
Figure 3. Data on basic innovations compiled from Haustein and Neuwirth (1982) and Van Duijn (1983). The thin line indicates the actual data, the thick irregular line a 5 year moving average of these, and the tick smooth line a 5 degree polynomial fitted trend (fitted using Poisson regression) 5.2 Innovation integration with Schumpeterian dynamics Schumpeterian dynamics can be developed by comparing the time series aggregating patents awarded in the USA to inventors from the five sample countries (Figure 4 below) with the series of basic innovations from Van Duijn (1983) and Haustein and Neuwirth (1982), in Figure 3.8 The first is an indicator of incremental (endogenous) innovations that depend to a large extent on major breakthroughs in radical innovations indicated in the basic innovation series. The basic innovations graph shown below is constructed as a five year moving average (dated at the
8 More details on how these time series are combined can be found in Silverberg and Verspagen (2002). This reference also gives details on the estimation of the polynomial trend.
0
1
2
3
4
5
6
7
8
9
1820 1830 1840 1850 1860 1870 1880 1890 1900 1910 1920 1930 1940 1950 1960 1970 1980

20
‘centre’ year), and a 5-degree polynomial trend (estimated by Poisson regression). These two approximations of the trend in the data suggest a pattern of three ‘stages’. The first stage is 1840-1890, where the rate of basic innovations goes up with local peaks in 1846, 1856, 1870-2. The second stage, 1890-1930, settles at a rate that is about half of that during the peak-years of 1880-1890. The third stage, 1930-1960, is again one of high activity, with local peaks 1935, 1948 and 1958-60. After 1960, the trend for the basic innovation data decreases sharply. However, to a large extent, this must be considered as an artifact of the data collection method. What can be considered as a basic innovation becomes apparent only after a fairly long time period. Because most of the work on constructing the basic innovations time series underlying this data was done in the 1970s and early 1980s, it is therefore only logical that the time series stops somewhere in the 1960s. Combining these three stages with the three periods of Kaleckian investment activity identified in the previous sub-section and their accompanying incremental innovation pattern provides this integrated analysis.
Figure 4. Total number of patents in the five countries together including estimation of trend (estimated by OLS) The very early (pre-1890 data) support the view basic innovations are increasing, culminating in a period of relatively high activity in 1880-90. Integration with the Kaleckian perspective indicates that this embryonic innovative activity was on the basis of a low susceptibility of investment that allowed for a strong “take-off” with very few roadblocks. The cluster of innovations led to a quick diffusion of these innovations through the bunching of investment.
y = 0.0113x - 11.341 R2 = 0.7436
9.5
10.0
10.5
11.0
11.5
12.0
1880 1890 1900 1910 1920 1930 1940 1950 1960 1970 1980 1990 2000

21
After the early 1890s recession, incremental innovation activity (patents in Figure 4) is on steady increase through to the end of Period I. Radical innovation is about half of that of its peak 1880s activity. This reflects the growth stage with higher susceptibility of investment, and where investment tends to lead the diffusion innovation process. For this reason, the volatility of investment becomes more intensified leading to a peak of susceptibility with concomitant investment collapse at the end of Period I. Period II of mass production investment is supported by incremental patent activity staying above the trend level until the impact of the Great Depression. Then the subdued susceptibility-based investment cycle period also results in declining patent applications from around 1935. Patent activity continues to decline through into WWII due to crisis and secrecy, which “bottles up” incremental innovation but the war allows a major thrust in basic innovation under cover of defence needs that help to establish the new embryonic technological systems for the electronic information age. The high susceptibility at the end of WWII kept embryonic basic innovation from being rapidly diffused until the short collapse of investment ended at the end of the 1940s. Immediately after WWII basic war-inspired innovation reaches a local peak in 1948. Incremental patent innovation sees a sharp upward erratic trend from the mid 1950s to the early 1970s. This matches Kaleckian dynamics of relatively low susceptibility that increases through this whole period as investment drives this incremental innovation, with rising profit and utilisation rates. All the signs of a mature stage in industry life cycle are evident by the late 1960s as energy-driven economies come under pressure of profit squeeze and capacity constraints. The end comes with the economic downturn of the mid-1970s and with it a collapse of innovation. The strong rising patent activity after the early 1980s recession leads to strong information-based technology developments through the 1990s. Efforts to reform industries by deregulation and privatisation are accompanied by state support for business and dismantling the welfare systems of the advanced economies. These efforts create the competitive climate for incremental innovation to spur on sustained investment activity under conditions of relatively low susceptibility of investment. A clear Schumpeterian innovation pattern emerges with two distinct periods of high numbers in basic innovations, which lead investment. Generally, these periods are characterized by lower than average activity in incremental innovation. These periods are then followed by periods of low numbers of basic innovations, but relatively high periods of incremental innovation that accompany investment activity. These two patterns indicate how the “clust-bun” effect works. In the “basic” case innovation drives investment and with it major structural change over the long waves of economic development.9 In the “incremental” case innovation is driven by investment over the business cycle. Kaleckian dynamics show that this latter pattern is embellished by 9 During the period of high rates of basic innovations, the technological diversity of the innovations is quite high. During the period 1880-1890, one finds many innovations related to chemicals (e.g., veronal, synthetic alcaloids, chloroforme, man-made fibres), to electricity (incandescent lamp, electric power station, transformer, AC generator), transport (motor car, pneumatic tyre), or to basic metals (electric welding, electrolyse). In later periods (e.g., 1930-1940), many of these fields are again strongly represented: chemicals (sulfa drugs, Fisher-Tropsch procedure, catalytic cracking, colour photo), electricity (magnetophone, television, FM radio), transport (helicopter, jet engine, power steering). Thus, it seems as if the Schumpeterian clusters of innovations occur in diverse fields, rather than favouring one particular field at one point in time.

22
bunching of investment activity, matching the clustering effects that give rise to strong economic activity that is represented by rising GDP data. Finally, we examine the country differences in Table 1 patent rates in the context of the above integrated pattern. Japan is the stand out in incremental-based patent rates on the table and reflects also the highest investment and growth rates. This tells a story of a strong Kaleckian susceptibility pattern in which the Japanese entrepreneurs react to the commercialisation and diffusion of innovation in the way that relates closely to the variables of profits, capacity and debt levels that drive investment cycles. On the other hand the USA reflects an economy with strong radical basic innovation and a low patent rate. Radical innovation and the national USA innovation pattern establish the basic investment cycle that drives countries like Japan (and smaller economies that are linked to the USA like Australia and Canada). The three European economies all suffer from poor investment rate efficiency in the context of growth rates. The patent rates in Germany and France show stronger incremental innovation than USA but well behind Japan. On investigation of Appendix A graphs, the relatively lower volatility in MV5 indicate weaker susceptibility driven investment, much of the investment being more basic infrastructure from which GDP benefits. It implies a weaker entrepreneurial economy in the true Keynesian sense. The UK suggests a greater problem that combines weak entrepreneurial innovation activity with poor infrastructure investment. In the UK the deviation graph shows continuing lower deviations from the trend from the “high watermark” of the 1870s until the 1955-1970 patent-based investment growth. Since then there has been a collapse of patent activity and with it endogenous investment activity. 6. Limitations The research and analysis above has some serious limitations stemming from the technical details involved in collating and analysing data, applying such data results to the issue at hand, and in the theoretical tools currently available to derive conclusions. These three sets of limitations are briefly acknowledged in this section. Overcoming such technical problems in future research will reduce the limitations and extend the applicability of the conclusions that follow. 6.1 Collating and analysing data Any quantitative analysis has to take account of the limitations of the data series that are used. In the present case, we make use of rather ‘standard’ data on GDP and investment, as well as data on patents and basic innovations. Our data on GDP and investment are long time series and some special problems are associated to this particular phenomenon. The well-known problems of choosing weights for a deflator for both GDP and investment, as well as choosing an exchange rate to compare between countries, become more problematic the longer the time series get. The common approach is to use a benchmark study to obtain a purchasing power parity index (PPP, essentially an exchange rate) for a single year, to use this to calculate values for a common currency in that year, and to apply fixed price country-wise data to extrapolate this benchmark for- and backward in time. In order to perform this extrapolation, one may either choose a fixed weight deflator, or a chain-weighted deflator (where the weight changes on a yearly basis). The current data were based on a fixed weight approach. Hence, both

23
the benchmark PPP and the weight used for the deflator refer to a single point in time (1990), and the further away the data points are from this point in time, the less reliable the method gets. This problem can only be solved by using a chain weighted price index and applying more than one benchmark, but this is problematic because the data to do this do not exist for the older period. In addition, national accounting standards were non-existent for the pre-WWII period, and hence the data for these years are generally less reliable than the more current data. With regard to technology, it must be noted that patents are not a perfect indicator of innovation. By definition, the knowledge described in a patent must be new, i.e., imitations are to a certain extent ruled out. Of course, especially the incremental innovations that we have described will often have an important component of imitation, and hence they will not appear in the patenting statistics. Also, for the countries other than the USA, patents refer to foreign patents, and hence the sample may be biased towards firms with internationally oriented firms. Also, the US patent system has been subject to institutional changes and bureaucratic problems (see, e.g., Griliches, 1990). Finally, with regard to the nature of the data on basis innovations, a number of problems have already been discussed above in Section 5.2. 6.2 Applying the results In applying the results, the analysis relies on patent application data as a measure of the level of incremental innovation. This data is important for small and large firms, but the investment effects from patents are tenuous as many small firms fail and the innovation process itself becomes complex and convoluted before it registers through the investment process. Despite these limitations, the lagged patent data is the only innovation-based data that has a consistent set of numbers going back over a century. The use of secondary source basic innovation data allows the extent of such innovation to be analysed in concert with incremental innovation patterns of patents. This two-innovation approach provides a reality check to the investment data and its links to innovation. Investment and GDP data are much less problematic in their link to economic activity in the standard Keynesian formulation. The “clust-bun” effect identified in the results comes from a pattern-matching exercise across five OECD countries. This method provides only a plausible explanation for pattens, rather than any tight econometric fit of the data to any output of mathematical modelling. The pattern-matching exercise allows for the maximum amount of dynamic interpretations, but limited static testing of results 6.3 Theoretical limits Profit changes, excess capacity and increasing risk are elements that figure significantly in the susceptibility investment model of Courvisanos (1996), yet are taken account only in a very specific way in terms of the USA and then extrapolated to the rest of the world. This is achieved by the secondary source of innovation data from Dumenil and Levy on the USA only. The increasing risk concept as such does not get investigated in this paper in any formal sense.

24
Of more concern are the limitations of theory construction at this time in the history of economic thought. The continual obsession with the statics (and comparative statics) of innovation and investment limit any efforts to further develop the dynamic analysis of innovation and investment. This is a “mainstream” issue that others can tackle (e.g. adding the concept of innovation into the “options to invest” model of Dixit and Pindyck, 1994). From the heterodox perspective, the concern is the lack of coherence in tackling the dynamic issues in this paper. There are the important dynamic analyses of evolutionary and Austrian economics. Both provide long-term perspective, but fail to understand the macro-environment within which the tensions of the circular flow develop. On the other hand, the Post-Keynesian literature has only sporadically tried to look at these questions through strong behavioural elements in the investment decision-making process, but they generally fail to grasp the dynamic elements that the previous two schools emphasise. The new cognitive approach based on Herbert Simon (and more recently Gerald Silverberg) may provide an important future link between the “givens” of the long-term evolutionary analysis and the behavioural-cum-power relations in the Kaleckian analysis. 7. The Summary – Policy Implications and Future Research The dynamics of innovation and investment involve a threading together evolutionary life cycle of industry development through innovative processes with Kaleckian extended reproduction through volatility of the investment process. Tension between virtuous and vicious circle effects operate to create uncertainty and strategic planning that lead to patterns of industry and economy-wide development of cumulative expansion (and booms) along with periods of cumulative destruction and insecurity. The latter produce problematic efforts to innovate, which can result in renewed strong investment expansion or extended periods of small investment (mini-) cycles. The results of the historical data support the Kaleckian circle flow mechanisms and the Evolutionary stages of industry development. This generates the “clust-bun” effect that generates the clustering around basic innovations and the bunching of investment around susceptibility of investment cycles. The two effects together deliver volatile but pattern-based cyclical effects in GDP which explain the processes of boom and bust, as well as the long-wave structures that underlie the relative strength or weakness of every downswing and upswing. From a policy perspective, the analysis in this paper indicates a need for a clear policy framework in a dynamic environment. The policy framework needs to address both the strategic planning of business and the public policies of the state in providing a more stable and sustainable investment regime. This requires another research project. Sufficient in this final section is the recognition that there is specific type of policy responses that this research points towards. In private business, strategic planning must move away from simplistic static flow-charts of “how-to-do”, and instead develop a better understanding of the dynamic tensions in the cyclical effects identified. The introduction of major innovations initially depends on finance and the ability to develop a cluster of successful innovations that are capable of creating cumulative accumulation. Small firms often lack sufficient retained earnings through profits or a strong equity base. Large firms often are locked-in to sustaining old capital stock values to the detriment of innovative activity and maintaining a vicious circle of low innovation and investment.

25
Transition of large firms with the synergistic support of small innovate firms provides some route out of these tensions towards a virtuous circle effect. Even such expansion needs to be carefully monitored to avoid the cumulative susceptibility of over-investment and very sharp investment downturn that replaces virtuous with vicious circle effects. For public policy, the issue is whether the volatility in cycle effects are sustainable and in what direction. If regions, sectors or even nations exhibit strong remorseless vicious circles based on support for “fossilised” capital values (e.g. old European centres of power), then systemic failure of capitalism ensures that shifting to an innovative creative accumulation can only be done through strategic intervention (e.g. Ireland and Finland). This requires an understanding of human agency processes in the private sector, particularly in relation to uncertainty and ability to gain voluntary conformity for a “new direction” that does not merely tamper at the edges with static policy tools of depreciation allowances and more subsidies. Even booming virtuous circles are problematic given their susceptibility to investment downturns that can destroy voluntary conformity already there (e.g. Japan). Thus, systemic failure is also waiting on the wings of boom economies and industries that need state amelioration (or what Adolph Lowe called “regularisation”) of the investment cycle. This is required to ensure long-term stability and importantly continued voluntary conformity in periods when virtuous circles tend to mature into fossilised monopoly power positions that are destabilising. References Baker, R. (1976) New and improved: Inventors and inventions that have changed the modern world,
London: British Museum Publications. Baran, P. and Sweezy, P. (1966) Monopoly Capital, New York: Monthly Review Press. Collins, A. and Yao, S. (1998) “On Innovative Activity Over the Business Cycle: A Note”,
Applied Economics Letters, Volume 5, pp. 785-8. Courvisanos, J. (1996) Investment Cycles in Capitalist Economies: A Kaleckian Behavioural
Contribution, Cheltenham: Edward Elgar. Courvisanos, J. (2001) “Michał Kalecki as a Behavioural Economists: Implications for Modern
Evolutionary Economic Analysis”, School of Economics Discussion Paper 2001-08, University of Tasmania, Hobart.
Dixit, A. and Pindyck, R. (1994) Investment Under Uncertainty, Princeton: Princeton University Press.
Dodgson, M. and Rothwell, R. (eds.) (1994) The Handbook of Industrial Innovation, Cheltenham: Edward Elgar.
Dosi, G. (1982) “Technological Paradigms and Technological Trajectories”, Research Policy, Volume 2 (3), June, pp. 147-162.
Dumenil, G. and Levy, D. (1993) The Economics of the Profit Rate: Competition, Crises and Historical Tendencies in Capitalism, Aldershot: Edward Elgar.
Dunn, S.P. (2000) “Galbraith, Uncertainty and the Modern Corporation”, in Keaney, M. (ed.) Economist with a Public Purpose: Essays in Honour of John Kenneth Galbraith, London: Routledge.
Freeman, C., Clark, J. and Soete, L. (1982) Unemployment and Technological Innovation: A Study of Long Waves and Economic Development, London: Frances Pinter.

26
Freeman, C. and Perez, C. (1988) “Structural Crises of Adjustment, Business Cycles and Investment Behaviour”, in Dosi, G., Freeman, C., Nelson, R., Silverberg, G. and Soete, L. (eds.) Technical Change and Economic Theory, London: Pinter, pp. 38-66.
Freeman, C. and Soete, L. (1997) The Economics of Industrial Innovation, Third edition, London: Pinter.
Galbraith, J.K. (1974) The New Industrial State, Second revised edition, Harmondsworth: Penguin (original 1967 publication).
Geroski, P.A. and Walters, C.F. (1995) “Innovative Activity Over the Business Cycle”, Economic Journal, Volume 105, July, pp. 916-28.
Gomulka, S. (1990) The Theory of Technological Change and Economic Growth, London: Routledge.
Gomulka, S., Ostaszewski, A. and Davies, R.O. (1990) “The Innovation Rate and Kalecki’s Theory of Trend, Unemployment and the Business Cycle”, Economica, Volume 57, November, pp. 525-40.
Griliches, Z. (1990) “Patent Statistics as Economic Indicators: A Survey” Journal of Economic Literature, Volume XXVIII, pp. 1661-1707.
Haustein, H.-D. and Neuwirth, E. (1982) “Long Waves in World Industrial Production, Energy Consumption, Innovations, Inventions, and Patents and Their Identification by Spectral Analysis”, Technological Forecasting and Social Change, Volume 22, pp. 53-89.
Hossain, F. and Chung, P.J. (1999) “Long-run Implications of Neoclassical Growth Models: Empirical Evidence from Australia, New Zealand, South Korea and Taiwan”, Applied Economics, Volume 31 (9), September, pp. 1073-82.
Kaldor, N. (1961) “Capital Accumulation and Economic Growth”, in Lutz, F.A. and Hague, D.C. (eds.) The Theory of Capital, New York: St Martin’s Press, pp. 177-228.
Kaldor, N. (1966) Causes of the Slow Rate of Economic Growth in the United Kingdom, Cambridge: Cambridge University Press (reprinted in Further Essays on Economic Theory, London: Duckworth, pp. 100-38).
Kalecki, M. (1937) “The Principle of Increasing Risk”, Economica (New Series), Volume 4 (16), November, pp. 440-6.
Kalecki, M. (1954) Theory of Economic Dynamics, London: George Allen & Unwin. Kalecki, M. (1962) “Observations on the Theory of Growth”, Economic Journal, Volume 72, pp.
134-53. Kalecki, M. (1971) Selected Essays on the Dynamics of the Capitalist Economy 1933-1970,
Cambridge: Cambridge University Press. Kalecki, M. (1991) “The Problem of Effective Demand with Tugan-Baranovsky and Rosa
Luxemburg”, in Osiatyński, J (ed.) Collected Works of Michał Kalecki, Volume II: Capitalism - Economic Dynamics, Clarendon Press, Oxford, pp. 451-58 (original 1967 Polish publication in Ekonomista, Volume 2, pp. 241-9).
Kleinknecht, A. (1987) Innovation Patterns in Crisis and Prosperity: Schumpeter’s Long Cycle Reconsidered, London: Macmillan.
Kuznets, S. (1940) “Schumpeter’s Business Cycles”, American Economic Review, Volume 30 (2), pp. 257-71.
Lavoie, M. (1992) Foundations of Post-Keynesian Economic Analysis, Aldershot: Edward Elgar. Maddison, A. (1995) Monitoring the World Economy 1820-1992, Paris: OECD Development
Centre.

27
Mensch, G. (1979) Stalemate in Technology: Innovations overcome Depression, New York: Ballinger (original 1975 German publication Das Technologische Patt: Innovation Uberwinden die Depression, Frankfurt: Umschau).
O’Connor, J. (1973) The Fiscal Crisis of the State, New York: St Martin’s Press. Rosenberg, N. (1976) Perspectives on Technology, Cambridge: Cambridge University Press. Sahal, D. (1974) “Generalized Poisson and Related Models of Technological Innovation.”
Technological Forecasting and Social Change, Volume 6, pp. 403-436. Salter, W.E.G. (1960) Productivity and Technical Change, Cambridge: Cambridge University Press. Sawyer, M. (1996) “Kalecki on Trade Cycle and Economic Growth”, in King, J.E. (ed.), An
Alternative Macroeconomic Theory: The Kaleckian Model and Post-Keynesian Economics, Boston, Kluwer Academic, pp. 93- 114.
Schmookler, J. (1966) Invention and Economic Growth, Cambridge, Mass.: Harvard University Press.
Schumpeter, J.A. (1939) Business Cycles; A Theoretical, Historical and Statistical Analysis of the Capitalist Process, 2 Volumes, New York: McGraw-Hill.
Silverberg, G. and Lehnert, D. (1993) “Long Waves and Evolutionary Chaos in a Simple Schumpeterian Model of Embodied Technical Change”, Structural Change and Economic Dynamics, Volume 4, pp. 9-37.
Silverberg, G. and Verspagen, B. (2002) “Breaking the Waves: A Poisson Regression Approach to Schumpeterian Clustering of Basic Innovations.” Cambridge Journal of Economics, forthcoming.
Steindl, J. (1976) Maturity and Stagnation in American Capitalism, Second edition, New York: Monthly Review Press.
Steindl, J. (1979) “Stagnation Theory and Stagnation Policy”, Cambridge Journal of Economics, Volume 3 (1), March, pp. 1-14.
Steindl, J. (1991) “Comment attached to letter for the editor - dated 20 January 1978”, in Osiatyński, J (ed.) Collected Works of Michał Kalecki, Volume II: Capitalism - Economic Dynamics, Clarendon Press, Oxford, p. 596.
Stoneman, P. (1983) The Economic Analysis of Technological Change, Oxford: Oxford University Press.
Toivanen, O., Stoneman, P and Diederen, P. (1999) “Uncertainty, Macroeconomic Volatility and Investment in New Technology”, in Driver, C. and Temple, P. (eds.) Investment, Growth and Employment: Perspectives for Policy, London and New York: Routledge.
Van Duijn, J. J. (1983) The Long Wave in Economic Life, London: Allen & Unwin. Vercelli, A. (1989) “Uncertainty, Technological Flexibility and Long-term Fluctuations”, in Di
Matteo, M., Goodwin, R.M. and Vercelli, A. (eds.) Technological and Social Factors in Long Term Fluctuations, Berlin: Springer-Verlag, pp. 130-44.

28
Appendix A: The Five-Country Time Series Graphs - A1. USA
Raw data (ln)
y = 0.0293x - 44.875
y = 0.0319x - 48.035
y = 0.0081x - 5.2932
9.5
10.5
11.5
12.5
13.5
14.5
15.5
16.5
1860 1880 1900 1920 1940 1960 1980 20009.69.810.010.210.410.610.811.011.211.411.6
GDP (left) Inv (left) Pat (right)
deviation from trend (ln)
-1.0-0.8-0.6-0.4-0.20.00.20.40.6
1870 1890 1910 1930 1950 1970 1990
GDP Inv Pat

29
Appendix A: The Five-Country Time Series Graphs – A2. Germany Raw data (ln)
y = 0.0253x - 41.922
y = 0.0274x - 40.717
y = 0.0409x - 68.5659
10
11
12
13
14
15
16
1870 1890 1910 1930 1950 1970 1990GDP (left) Inv (left) Pat (right)
MV5 (based on detrended data)
0.0000
0.0001
0.0010
0.0100
0.1000
1.0000
1870 1890 1910 1930 1950 1970 1990
GDP Inv Pat

30
deviation from trend (ln)
-6.0-5.0-4.0-3.0-2.0-1.00.01.02.0
1870 1890 1910 1930 1950 1970 1990
GDP Inv Pat
MV5 (based on detrended data)
0.0000
0.0001
0.0010
0.0100
0.1000
1.0000
10.0000
1870 1890 1910 1930 1950 1970 1990
GDP Inv Pat

31
Appendix A: The Five-Country Time Series Graphs – A3. France
Raw data (ln)
y = 0.0261x - 44.276
y = 0.0221x - 30.537
y = 0.0534x - 92.393
9
10
11
12
13
14
15
16
1870 1890 1910 1930 1950 1970 1990GDP (left) Inv (left) Pat (right)
deviation from trend (ln)
-3.5-3.0-2.5-2.0-1.5-1.0-0.50.00.51.0
1870 1890 1910 1930 1950 1970 1990
GDP Inv Pat

32
Appendix A: The Five-Country Time Series Graphs – A4. Japan
MV5 (based on detrended data)
0.0000
0.0001
0.0010
0.0100
0.1000
1.0000
1870 1890 1910 1930 1950 1970 1990
GDP Inv Pat
Raw data (ln)
y = 0.0921x - 174.24
y = 0.0414x - 68.142
y = 0.0606x - 109.29
02468
10121416
1840 1860 1880 1900 1920 1940 1960 1980 2000GDP (left) Inv (left) Pat (right)

33
deviation from trend (ln)
-5.0
-4.0
-3.0
-2.0
-1.0
0.0
1.0
2.0
1880 1900 1920 1940 1960 1980 2000
GDP Inv Pat
MV5 (based on detrended data)
0.0000
0.0001
0.0010
0.0100
0.1000
1.0000
1880 1900 1920 1940 1960 1980 2000
GDP Inv Pat

34
Appendix A: The Five-Country Time Series Graphs – A5. United Kingdom
Raw data (ln)
y = 0.0137x - 19.364
y = 0.0184x - 23.211
y = 0.0273x - 43.262
789
10111213141516
1860 1880 1900 1920 1940 1960 1980 2000GDP (left) Inv (left) Pat (right)
deviation from trend (ln)
-1.4-1.2-1.0-0.8-0.6-0.4-0.20.00.20.40.60.8
1870 1890 1910 1930 1950 1970 1990
GDP Inv Pat

35
MV5 (based on detrended data)
0.0000
0.0001
0.0010
0.0100
0.1000
1.0000
1860 1880 1900 1920 1940 1960 1980 2000
GDP Inv Pat