innovation and productivity in formal and informal firms
TRANSCRIPT
Innovation and productivity in formal and informal firms in Ghana Article
Accepted Version
Creative Commons: Attribution-Noncommercial-No Derivative Works 4.0
Fu, X., Mohnen, P. and Zanello, G. (2018) Innovation and productivity in formal and informal firms in Ghana. Technological Forecasting & Social Change, 131. pp. 315-325.ISSN 0040-1625 doi: https://doi.org/10.1016/j.techfore.2017.08.009 Available at https://centaur.reading.ac.uk/72033/
It is advisable to refer to the publisher’s version if you intend to cite from the work. See Guidance on citing .
To link to this article DOI: http://dx.doi.org/10.1016/j.techfore.2017.08.009
Publisher: Elsevier
All outputs in CentAUR are protected by Intellectual Property Rights law, including copyright law. Copyright and IPR is retained by the creators or other copyright holders. Terms and conditions for use of this material are defined in the End User Agreement .
www.reading.ac.uk/centaur
CentAUR
Central Archive at the University of Reading

Reading’s research outputs online
1
Innovation and productivity
in formal and informal firms in Ghana
Xiaolan Fu, Pierre Mohnen, and Giacomo Zanello*
Abstract
Despite the high profile of the issue in current policy formulations in low-
income countries (LICs), there is little large firm level survey based empirical
evidence on innovativeness and firm performance, especially in informal
establishments. This paper aims to fill this gap in the literature using a revised
Crépon-Duguet-Mairesse (CDM) structural model to analyse data from a
unique innovation survey of 501 manufacturing firms in Ghana. We find that
innovation positively impacts the labour productivity of firms, technological
innovations more than managerial innovations. Formal firms do not tend to
be more productive than informal firms, but the role of innovation on
productivity tends to be greater for formal firms.
Keywords: Innovation, productivity, informality, Ghana.
2
1. Introduction
The economic growth of low-income countries (LICs) is a product of ideas, skills, capital,
and the organization of society and firms (Fagerberg et al., 2010). It has not been different in
the economic history of currently developed countries, where main industrial revolutions
were all linked to an application and spread of an innovation – steam power, electricity, and
informatics – resulting in a remarkable increase in total factor productivity, societal changes,
and ultimately improvement in the wealth and welfare of nations. The past also shows that
the real impact of technologies and advancement in knowledge occurs when they are diffused
and adopted by a large range of actors, within a country and in other countries as well. Yet,
hosting countries not only have to face financial constraints to acquire the technology, but
also to develop an absorptive capacity (knowledge and skills) able to adopt and possibly
reproduce such technologies (Cohen and Levinthal, 1989). The steam engine is a
demonstrative example: it was invented in the United Kingdom at the end of the 18th century,
but its diffusion to other countries took decades. Even if the Chinese empire came across this
technology during the First Opium War (1839-1842), its potential impact was not fully
realized at first, and then it took two decades to overcome the knowledge and skills gaps
(mainly in term of technical drawing and machine tools) for the Chinese to adopt and produce
steam engines (Wang, 2010). The first steam engine built in China was manufactured in
1869, almost hundred years after its invention in the United Kingdom. At that time, the
second industrial revolution was in its infancy in Europe, and the streets of European capitals
were soon starting to have electric lighting.
In the macroeconomic literature, it is widely recognised that innovation is a major driver of
economic growth (Grossman and Helpman, 1991). As extensively documented in Fagerberg
et al. (2010), two factors have been identified as critical factors in the endogenous economic
growth models: adoption of technologies developed elsewhere and indigenous innovative
capacity. However, the technology diffusion to, and adoption by, developing countries is
costly and conditional on factors that support the process (Keller, 2004). It relies on
substantial and well-directed technological efforts (Lall, 1992) as well as sufficient human
and financial resources and absorptive capacity (Cohen and Levinthal, 1989; Keller, 1996).
As highlighted in Fu and Gong (2011), it also requires appropriate institutions and policies to
guide incentives and facilitate the process, in addition to strong local capabilities to identify
the right technology and appropriate transfer mechanism according to local economic, social,
technical and environmental conditions. Trade (import and export) and foreign direct
investments can become important sources of growth for catching-up countries.
The macro-level evidence is supported by empirical studies that strongly suggest that the
level of technological innovation contributes significantly to economic performance,
particularly at the firm and industry level (see for example Kleinknecht and Mohnen, 2002).
Firms’ growth is seen as a learning process in which firms that are able to adopt and create
3
technologies and knowledge grow and survive, while firms that do not innovate decline and
fail (Jovanovic, 1982). This is particularly relevant in the context of LICs in which the
learning process is the major factor enabling innovation activities in firms (Bell and Pavitt,
1992; Lall, 1992). Low-income countries face severe constraints and, as argued by Lundvall
et al. (2010), technological capabilities in these countries encompass more than just research
and development (R&D). In such environments, learning-based innovations – such as
adoption or adaptation of both technological and no-technological innovations – are
significant factors for the industrial development.
The richness of the data on innovation in emerging and developed countries has allowed
researchers to implement an econometric approach, such as the widely used Crépon-Duguet-
Mairesse (CDM) structural model (Crepon et al., 1998), in which firm performance is a
function of product and/or process innovation, which in turn are explained by R&D and other
innovation expenditures. In the context of developing countries, the lack of data at
longitudinal level and the fact that for the vast majority of firms R&D activities are only a
marginal determinant in innovation activities have posed several challenges in modelling
innovation and growth. Nonetheless, in recent years an increasing number of empirical
studies have analysed the role of innovation in LIC firms, both exploring its determinants
(Goedhuys, 2007; Robson et al., 2009) and the impact it has on various firm performance
indicators (Gebreeyesus, 2009; Goedhuys et al., 2008, 2014). Most of the latter studies focus
on product and process innovations and their impact on productivity. However, as argued by
various scholars (Bloom et al., 2013; Bruhn et al., 2010; Crespi and Zuniga, 2012; Mano et
al., 2012) in the current state of development of LICs it is important to recognize the impact
of a range of innovations, including management and marketing innovations, the impact of
which could go further than an improvement in productivity.
In analysing the contribution of innovation to firm performance, it is important to recognize
that in most of the developing countries a dual-economy system exists with formally
registered firms and an informal sector. In a recent survey on informality and development,
La Porta and Shleifer (2014) provide five stylized facts of the informal economy in
developing countries. The informal sector employs a large proportion of workers and tends to
escape taxation and controls from the authorities. Moreover, it is characterized by small and
inefficient firms, which are ran by poorly educated entrepreneurs, and as a consequence its
productivity is very low. Capturing the magnitude and impact of the informal sector is
problematic because of its intrinsic nature, but it has been estimated that the weighted
average size of the shadow economy (as a percentage of GDP in the period 1999-2007) in
Sub-Saharan Africa is around 40 per cent (Schneider et al., 2011) and makes up to 80 per
cent of non-agricultural employment (Chen et al., 1999). As shown in Wunsch-Vincent and
Kraemer-Mbula (2016), the different capabilities of firms in the formal and informal sectors
are likely to shape the innovation adoption and diffusion. For example, formal establishments
may have the human and capital resources to collaborate in innovation activities with other
4
firms, research and development institutions, or, for larger firms, with foreign institutions
(Oyelaran-Oyeyinka et al., 1996). Informal firms, by contrast, are unlikely to have strong
capabilities and, therefore, may be more likely to innovate from entrepreneurs’ initiatives and
in response to specific constraints given by the context in which operate (Robson et al.,
2009).
According to received wisdom, whereas the role of innovation in firms’ growth in developed
countries is largely documented, its impact in developing countries is still only partially
understood, mainly across informal firms. Difficulties related to data availability and the
measurement of innovation have limited the empirical studies on the link between innovation
and firms’ growth in LICs (see Wunsch-Vincent and Kraemer-Mbula, 2016).
This paper aims to fill this gap in the literature analysing data from a unique innovation
survey of 501 manufacturing firms in Ghana. The survey was specifically designed to
investigate the innovation activities of firms in a granular way, capturing the conventional
and unstructured way firms of different level of formality, size, and absorptive capacity
typically innovate. The main research questions that motivate this study are “How does
innovation affect firms’ growth? And are there differences between formal and informal
firms?”. Our results show that innovation increases labour productivity, and that
technological innovations have a greater contribution than non-technological innovations.
The influence of technological innovations on productivity tends to be greater for formal
firms, but informal firms get as much out of non-technological innovations as formal firms
do. Our study contributes to the literature by providing empirical evidence on the different
roles that innovation plays in the formal and informal sectors and on the different roles that
technological and non-technological innovations play in firms’ growth in LICs. We thereby
supplement the conventional wisdom mostly based on qualitative research that argues that
poor management practices, poor standard of operations and poor quality control are the most
important constraints that result in low productivity of firms in Africa.
Because of the development level of the institutions and education system, Ghana provides a
potential fertile soil for innovation in the context of developing countries making this a
relevant case study. However, it also shares many of its structural characteristics with other
LICs and therefore the conclusions of this study are generalizable to other low-income
countries. In the past thirty years, Ghana has undertaken a series of structural reforms aimed
to strengthen the role of the private sector as a pillar of economic growth. In 2010, the
Industrial Policy was set within the context of Ghana’s long-term strategic vision of
achieving middle-income status by 2020, through the transformation of the country into an
industry-driven economy. Remarkably, the Industrial Policy acknowledged the role of
innovation and put in place policies aimed to increase the overall level of science,
technology, and research and development in the industry. However, despite policy reforms,
5
the majority of firms are still small and embedded in the informal sector, and larger firms are
constrained by finance, managerial, and technical skills.
The remainder of the paper is structured as follows. Section 2 provides the literature review
while Section 3 reports the model and the estimation strategy. This is followed in Section 4
by the description of the data at hand with a focus on the nature of innovation and the
formal/informal status of firms. Section 5 reports and discusses the results. Finally, Section 6
concludes.
2. Literature review
Until a decade ago, innovation in the private sector in LICs was the focus of only a handful of
studies every year (Zanello et al., 2016). Until then, innovation was often associated with
patents or ground-breaking discoveries. Those are the results of costly, risky and lengthy
processes that require intense knowledge and capital investment to create something “new”.
The Oslo Manual has been a standard reference for surveys of innovation in advanced
economies and, since its third edition, also in developing countries. Its definition of
innovation as “[…] the implementation of a new or significantly improved product (good or
service), or process, a new marketing method, or a new organisational method in business
practices, workplace organisation or external relations” (OECD, 2005: 46) highlights two
important features. First, innovation can take a multitude of forms (product innovations,
process innovations, marketing innovations, and managerial/organisational innovations).
Second, innovation can result from an original idea but can also emerge from the diffusion,
absorption, or imitation of new methods developed elsewhere. Because of that, an innovation
could simply be new to the firm and not necessarily new to the market and yet have an impact
on productivity and employment.
The recognized growing role of innovation in developing countries has opened a new sub-
field of research at the intersection of innovation studies and development studies. The so-
called inclusive innovation focuses on the impact of innovation on the people living in the
lowest income groups (Chataway et al., 2013). In particular, it refers to the production or
delivery of new products and services for and/or by those people that so far were largely
excluded from formal markets. At the same time, the constrained ingenuity and resilience of
the people living below the poverty line have been recognized as an incubator for local
innovation. This focus on ‘frugal innovation’ (Bhatti and Ventresca, 2012) introduces further
considerations to understand the sources and impact of innovation in LICs. In order to access
effectively new markets, companies may need to re-think the production and delivery of
goods, often re-engineering products in order to reduce the complexity and cost of
production. The innovation process could involve reverse diffusion (Govindarajan and
Ramamurti, 2011), when innovations are adopted first in LICs before spreading to advanced
6
industrial economies, jugaad innovations (Gulati, 2010), when they are born out of lack of
resources by improvisation, or user innovations, when consumers are involved in the design
of a product or service (Von Hippel, 1998).
2.1 Innovation and firms’ productivity in low-income countries
Fagerberg et al. (2010) review the literature and provide strong and ample evidence on how
worldwide countries that are more active in innovation have higher productivity and income
than the less-innovative ones. Many scholars have argued that in developed economies the
growth of firms depends on their ability to learn about their environment, linking their
strategies to the changing environment (Geroski, 1989; Klepper, 1996). This is even more
relevant in LICs, where infrastructure is often poor, markets tend to be underdeveloped, and
potential local customers have limited disposable income. In such an environment micro,
small, and medium-size firms – many of them working in the informal sector – are
particularly vulnerable because of the limited absorptive capacity and restricted access to
financial and knowledge resources. Those firms in LICs that are able to successfully
undertake innovation activities survive, and the innovating firms that are able to make the
best use of the resources available have the potential to lead the market.
In recent years, an increasing number of studies have explored in great detail the role of
innovation in LIC firms. Most of these studies have looked at the impact of product or
process innovations on various performance outcomes. A survey of SMEs combined with in-
depth case studies found a positive association between innovativeness and growth in small
manufacturing firms in Tanzania (Mahemba and Bruijn, 2003). More recently, Gebreeyesus
(2009) investigated the role of innovation in Ethiopian SMEs and found strong evidence that
innovators grow faster than non-innovators in terms of employment. Using a rich dataset of
SMEs operating in Sri Lanka, De Mel et al. (2009) find an association between innovation
and profits.
Overall, the evidence emerging from the literature suggests a positive impact of innovation
on firms’ performance measured as either profit or employment growth. However, recent
studies on the role of innovation on firms’ productivity found a much weaker impact.
Goedhuys et al. (2008, 2014) focused on the importance of various sources of productivity in
developing countries. In Tanzania, they found that firm productivity is not enhanced by
R&D, nor by product or process innovation, but business environment seems to play a more
relevant role. Those conclusions suggest that the relationship between R&D, innovation, and
productivity is weaker in developing than in developed countries. In a subsequent study in
which three sectors (food processing, textiles and garment and leather products) and five
countries (Brazil, Ecuador, South Africa, Tanzania, and Bangladesh) are considered, they
conclude that the link between knowledge and productivity is sector- rather than country-
7
specific. In the food processing sector firms that import or license machinery and equipment
are more productive, whereas no such evidence emerges in other sectors.
Especially in the context of developing countries, it is useful to differentiate between
technological and non-technological innovations (often defined as the introduction of new
organisational methods or new marketing methods). Although these are highly interconnected
(the commercialisation of product innovations often requires new marketing methods, and
new production techniques need to be supported by changes in the organisation), the factors
that drive the different types of innovation are likely to be different. A decade ago, Hausman
(2005) highlighted how much of the existing research had examined product and process
innovations and neglected non-technological innovation, such as new management practices.
Since then, management and managerial skills have received increased attention as a factor
explaining differences in firms’ performance in developing countries with evidence spanning
various geographical areas (Bloom et al., 2013; Drexler et al., 2014; Karlan and Valdivia,
2011; Mano et al., 2012). Moreover, there is some qualitative and narrative evidence of the
benefit of market innovations, mainly for firms in the informal sector (Hall et al., 2012;
Ramani et al., 2012).
2.2 Informality, innovation, and firms’ productivity
Exploring the different ways in which formal and informal firms innovate and the impact this
has on their growth is critical given the size of the informal sector in developing countries. In
addition, there is increasing evidence that the cure for informality is economic growth, as
reported in La Porta and Shleifer (2014), and that therefore innovation could play a key role
in such a transformation. Although we have a fair knowledge of the characteristics of the
informal sector, there is not a single widely-accepted definition of informal firms. As
reviewed in Benjamin and Mbaye (2014), scholars have used different criteria based on firm
size, registration status, employer social security contributions, legal form of organization,
and character (sincerity) of financial accounts. However, a consensus has emerged on the fact
that there are degrees of formality and informality along a continuum rather than mutually
distinct sectors (Trebilcock, 2005). Therefore, using a single indicator is likely to capture
only partially the formal character of the firm. Using various indicators to capture the
informal sector, La Porta and Shleifer (2008) found that it accounts for 30-40 per cent of total
economic activity in the poorest countries, and an even higher share of employment.
Limited empirical evidence is available specifically on the role of innovation and firms’
growth in the informal sector of developing countries (Agyapong et al., 2017; De Mel et al.,
2009; Gebreeyesus, 2009; Mendi and Mudida, 2017; Konté and Ndong, 2012; Wunsch-
Vincent and Kraemer-Mbula, 2016). For example, Agyapong et al. (2017) established a
positive relationship between the various types of innovation and performance in small and
8
medium enterprises in Ghana. Mendi and Mudida (2017) instead analysis data from informal
firms in Kenya and found that past informality status negatively affect technological
innovativeness. A few studies explore the determinants of innovation adoption, including
firms’ characteristics, such as size and the entrepreneur’s level of education. Firm size, which
captures the scale of operations and has been recognized as one of the defining characteristics
of informal establishments, has been identified as a barrier to innovation in various studies
(De Mel et al., 2009; Gebreeyesus, 2009; Robson et al., 2009). The entrepreneurs’ level of
education is regarded as an important, although not a sufficient, condition for innovation.
Bradley et al. (2012) advocate that capital is not a “silver bullet”, and education and human
capital are the major constraints of innovation in Kenyan small firms. The lack of resources
in the education system in many LICs makes the non-formal training the main source for
learning, together with ‘learning by doing’ (Oyelaran-Oyeyinka and Lal, 2006).
Although ingenuity has been considered as an engine of innovation activities for informal
businesses (Prahalad, 2012), most of the literature has tended to look at observable indicators
(e.g. firm size, age, education of workers and entrepreneur) as determinants of innovation. In
most cases data constraints have prevented the inclusion of soft skills – such as
entrepreneurship and management skills – which may be equally important in the adoption
and impact of innovation. An exception is the work of De Mel et al. (2009), who use a range
of indicators to provide evidence that the success of informal businesses in Sri Lanka is
determined not only by the skills but also the acumen of entrepreneurs. Such findings
reinforce the evidence that the entrepreneur’s role is more evident in small enterprises in
every strategic aspect, including innovation activities (Donckels and Fröhlich, 1991).
3. The innovation model: Econometric specification and estimation
A recent literature review highlighted how most of the innovations in LICs have an adaptive
or incremental nature, and, therefore, innovations in such settings are unlikely to leapfrog or
redefine value creation processes (Zanello et al., 2016). In fact, given the limited financial
and knowledge resources and absorptive capacity of firms in LICs R&D-based innovations
are uncommon. The vast majority of innovation activities derive from the adoption (and
adaptation) of innovations through the so-called “technological capability”, the firms’ ability
to employ existing technologies and knowledge in order to adopt, adapt, and change existing
technologies (Fransman, 1985; Lall, 1992). Therefore, in developing countries innovation is a
phenomenon that involves institutional and environmental factors as much as personal and
entrepreneurial characteristics. Firm owners’ entrepreneurial acumen is as critical as firms’
characteristics for innovation adoption. Empirical evidence on this is limited but notably De
Mel et al. (2009) control for both entrepreneurs’ and firms’ characteristics in the adoption of
innovations. To suit these conditions, we had to take into account the lack of formal R&D
9
activities1 and the role of firm owners’ entrepreneurial acumen in adopting innovations. We
therefore decided to apply a structural model that recognizes the endogeneity of innovation,
i.e. that a firm innovates based on certain characteristic of the entrepreneur and the firm, and
the role of innovation activity as a determinant of productivity.
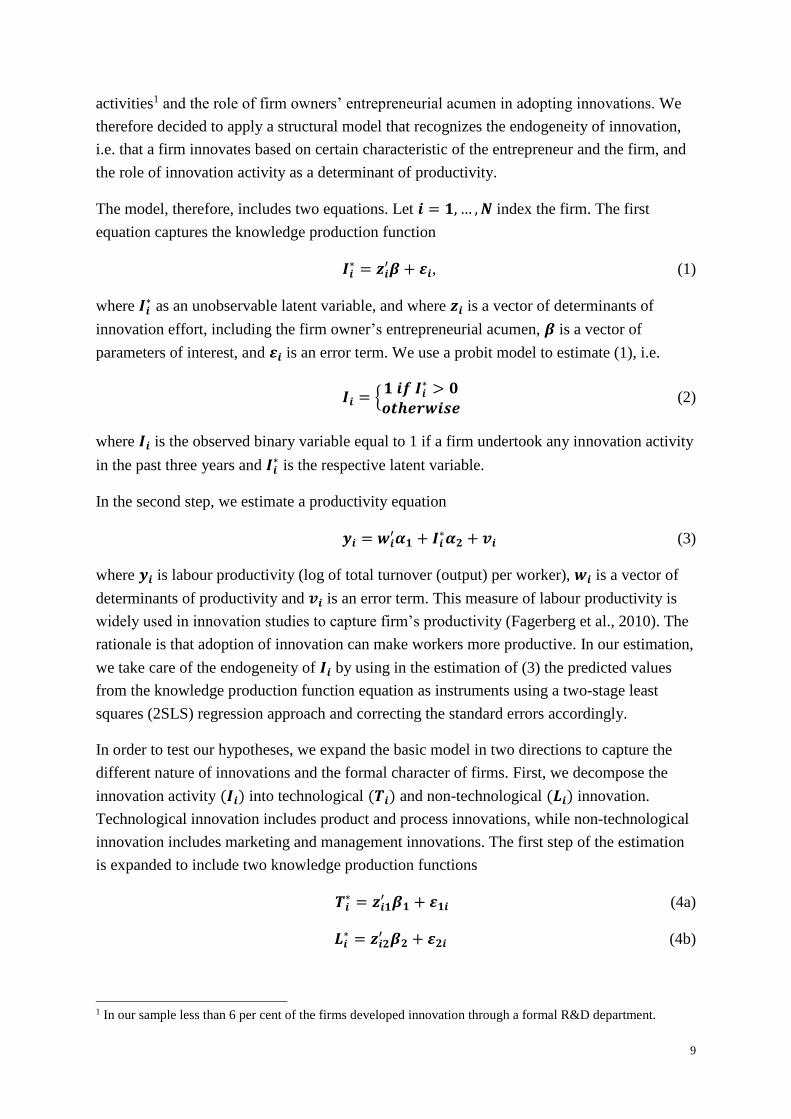
The model, therefore, includes two equations. Let 𝒊 = 𝟏, … , 𝑵 index the firm. The first
equation captures the knowledge production function
𝑰𝒊∗ = 𝒛𝒊
′𝜷 + 𝜺𝒊, (1)
where 𝑰𝒊∗ as an unobservable latent variable, and where 𝒛𝒊 is a vector of determinants of
innovation effort, including the firm owner’s entrepreneurial acumen, 𝜷 is a vector of
parameters of interest, and 𝜺𝒊 is an error term. We use a probit model to estimate (1), i.e.
𝑰𝒊 = {𝟏 𝒊𝒇 𝑰𝒊
∗ > 𝟎𝒐𝒕𝒉𝒆𝒓𝒘𝒊𝒔𝒆
(2)
where 𝑰𝒊 is the observed binary variable equal to 1 if a firm undertook any innovation activity
in the past three years and 𝑰𝒊∗ is the respective latent variable.
In the second step, we estimate a productivity equation
𝒚𝒊 = 𝒘𝒊′𝜶𝟏 + 𝑰𝒊
∗𝜶𝟐 + 𝒗𝒊 (3)
where 𝒚𝒊 is labour productivity (log of total turnover (output) per worker), 𝒘𝒊 is a vector of
determinants of productivity and 𝒗𝒊 is an error term. This measure of labour productivity is
widely used in innovation studies to capture firm’s productivity (Fagerberg et al., 2010). The
rationale is that adoption of innovation can make workers more productive. In our estimation,
we take care of the endogeneity of 𝑰𝒊 by using in the estimation of (3) the predicted values
from the knowledge production function equation as instruments using a two-stage least
squares (2SLS) regression approach and correcting the standard errors accordingly.
In order to test our hypotheses, we expand the basic model in two directions to capture the
different nature of innovations and the formal character of firms. First, we decompose the
innovation activity (𝑰𝒊) into technological (𝑻𝒊) and non-technological (𝑳𝒊) innovation.
Technological innovation includes product and process innovations, while non-technological
innovation includes marketing and management innovations. The first step of the estimation
is expanded to include two knowledge production functions
𝑻𝒊∗ = 𝒛𝒊𝟏
′ 𝜷𝟏 + 𝜺𝟏𝒊 (4a)
𝑳𝒊∗ = 𝒛𝒊𝟐
′ 𝜷𝟐 + 𝜺𝟐𝒊 (4b)
1 In our sample less than 6 per cent of the firms developed innovation through a formal R&D department.
10
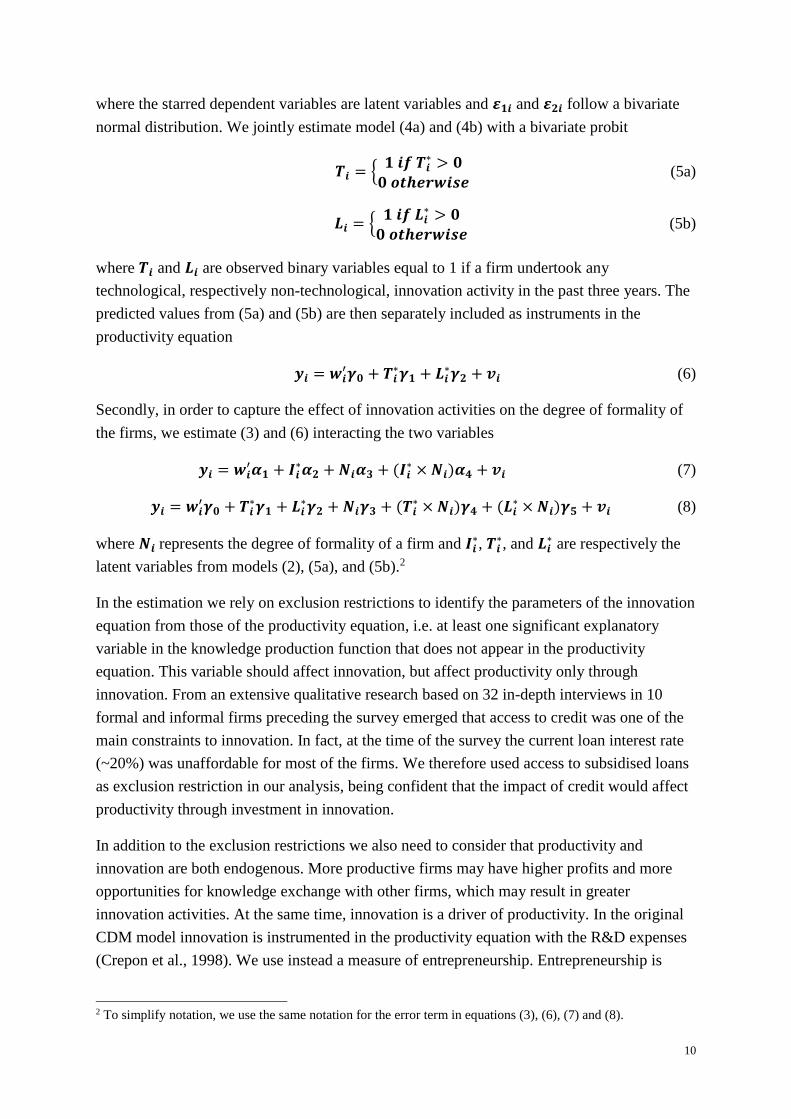
where the starred dependent variables are latent variables and 𝜺𝟏𝒊 and 𝜺𝟐𝒊 follow a bivariate
normal distribution. We jointly estimate model (4a) and (4b) with a bivariate probit
𝑻𝒊 = {𝟏 𝒊𝒇 𝑻𝒊
∗ > 𝟎𝟎 𝒐𝒕𝒉𝒆𝒓𝒘𝒊𝒔𝒆
(5a)
𝑳𝒊 = {𝟏 𝒊𝒇 𝑳𝒊
∗ > 𝟎𝟎 𝒐𝒕𝒉𝒆𝒓𝒘𝒊𝒔𝒆
(5b)
where 𝑻𝒊 and 𝑳𝒊 are observed binary variables equal to 1 if a firm undertook any
technological, respectively non-technological, innovation activity in the past three years. The
predicted values from (5a) and (5b) are then separately included as instruments in the
productivity equation
𝒚𝒊 = 𝒘𝒊′𝜸𝟎 + 𝑻𝒊
∗𝜸𝟏 + 𝑳𝒊∗𝜸𝟐 + 𝒗𝒊 (6)
Secondly, in order to capture the effect of innovation activities on the degree of formality of
the firms, we estimate (3) and (6) interacting the two variables
𝒚𝒊 = 𝒘𝒊′𝜶𝟏 + 𝑰𝒊
∗𝜶𝟐 + 𝑵𝒊𝜶𝟑 + (𝑰𝒊∗ × 𝑵𝒊)𝜶𝟒 + 𝒗𝒊 (7)
𝒚𝒊 = 𝒘𝒊′𝜸𝟎 + 𝑻𝒊
∗𝜸𝟏 + 𝑳𝒊∗𝜸𝟐 + 𝑵𝒊𝜸𝟑 + (𝑻𝒊
∗ × 𝑵𝒊)𝜸𝟒 + (𝑳𝒊∗ × 𝑵𝒊)𝜸𝟓 + 𝒗𝒊 (8)
where 𝑵𝒊 represents the degree of formality of a firm and 𝑰𝒊∗, 𝑻𝒊
∗, and 𝑳𝒊∗ are respectively the
latent variables from models (2), (5a), and (5b).2
In the estimation we rely on exclusion restrictions to identify the parameters of the innovation
equation from those of the productivity equation, i.e. at least one significant explanatory
variable in the knowledge production function that does not appear in the productivity
equation. This variable should affect innovation, but affect productivity only through
innovation. From an extensive qualitative research based on 32 in-depth interviews in 10
formal and informal firms preceding the survey emerged that access to credit was one of the
main constraints to innovation. In fact, at the time of the survey the current loan interest rate
(~20%) was unaffordable for most of the firms. We therefore used access to subsidised loans
as exclusion restriction in our analysis, being confident that the impact of credit would affect
productivity through investment in innovation.
In addition to the exclusion restrictions we also need to consider that productivity and
innovation are both endogenous. More productive firms may have higher profits and more
opportunities for knowledge exchange with other firms, which may result in greater
innovation activities. At the same time, innovation is a driver of productivity. In the original
CDM model innovation is instrumented in the productivity equation with the R&D expenses
(Crepon et al., 1998). We use instead a measure of entrepreneurship. Entrepreneurship is
2 To simplify notation, we use the same notation for the error term in equations (3), (6), (7) and (8).

11
likely to affect productivity through the implementation of innovations, both technical and
non-technical.
4. Sample and descriptive statistics
4.1 Data collection and sampling frame
For this study we conducted with the support of the Science and Technology Policy Research
Institute (STEPRI) an innovation survey of 501 manufacturing firms in Ghana. The data
include detailed information on innovation activities undertaken by the firms during the
three-year period 2010-2013. We recognised that the development and adoption of
innovations follow not a static process but one that spans a certain period of time. Although
the dataset is cross-sectional in nature, we recorded some data retrospectively (such as
turnover) both for 2010 and 2013, allowing us to have a partial view of the dynamics and
behaviour of firms during the three years under review. Considering cultural and capability
factors in the sampled business community, especially in the informal sector, a one-hour
face-to-face interview method was adopted for data collection.
Ten enumerators were recruited and trained specifically for data collection. The enumerators
were selected amongst STEPRI staff or were derived from previous experience of data
collection in other projects coordinated by STEPRI. In designing the enumerator team we
made sure enumerators were able to speak local languages. During a three-day training the
facilitators reviewed the questionnaire with the enumerators, offering a platform for the
enumerators to interact with facilitators to allow for a possible review of the questionnaire.
The enumerators were also taken through the use of the Personal Digital Assistants (PDAs).
In September 2013 a pilot survey was conducted to ensure that the survey design and
materials would capture the data necessary to meet the survey objectives. A sample of fifty
firms was chosen from the sampled firms located in the Greater Accra Region, and each
enumerator surveyed five firms, with a mix of formal and informal firms.
The data collection spanned a period of 7 weeks, from November 2013 and January 2014.
During this period, survey managers visited several locations (Greater Accra, Eastern region,
Ashanti region, and Central region) to monitor the progress of the data collection and support
the work of the enumerators. The data were downloaded from the PDAs every week and
analysed for consistency checks. In a few cases, the enumerators re-visited the firms to
double-check the reliability of the data. Most of those cases involved unreliable or data entry
mistakes on the number of employees, turnover, or fixed asset variables. Additional details on
the survey methodology can be found in Fu et al. (2014).
The data at hand include different levels of the firms’ formal character, expanding the
literature on innovation in developing countries , which concentrated on innovation in
12
formally registered firms (Ayyagari et al., 2011). Since informal firms tend not to be recorded
in official firms’ databases, we used a different sampling framework in order to avoid under-
representing the whole informal sector. We, therefore, sampled half of the sample from
sources that were likely to mainly capture informal firms and the other half from sources
containing mainly formal firms. For informal firms, we randomly sampled and surveyed 25
firms in each of the 10 clusters spread in five regions. The choice of clusters and regions was
determined so as to have a sector and geographical representation of the Ghanaian informal
economy. Clusters were engaged in food production and processing (Oil Palm processors,
Mushroom production, Shea butter production), garment and textile, handicraft producers,
automotive industry and metal working, sawmill, metal working, wood workers. Five clusters
were selected in Greater Accra, two in Ashanti region, and one in Central, Eastern, and
Northern region respectively.
The population of firms from which we drew the sample of formal firms was compiled
merging difference data sources3. The sample was then randomly selected with three levels of
stratification: industrial sector, firm size, and regional location. A third of the firms originally
sampled needed to be replaced. Most of those could not be located by the enumerators (24
per cent), others had closed down (8 per cent), and a few firms were not willing to participate
in the survey (1 percent). Some firms are located in part of cities which do not have street
names and tracking down their exact location can be a challenge. This is the case for most
small and informal businesses. During the development, firms may also change location and
name, or sometime switch to a different business. The replacement firms were randomly
selected between the firms working in the same sector and region, and with the same size as
the missing firms.
The data collected cover only manufacturing firms. Half of the firms in the sample are
equally distributed in the food processing and wearing and textile sector. Fifteen per cent are
active in the manufacture of furniture and metal products, and ten per cent work in wood and
the manufacturing of wooden products. The remaining fifteen per cent are active in a
multitude of sectors, from manufactured paper products and rubber and plastic products to the
manufacture of leather or chemical products.
4.2 Descriptive statistics
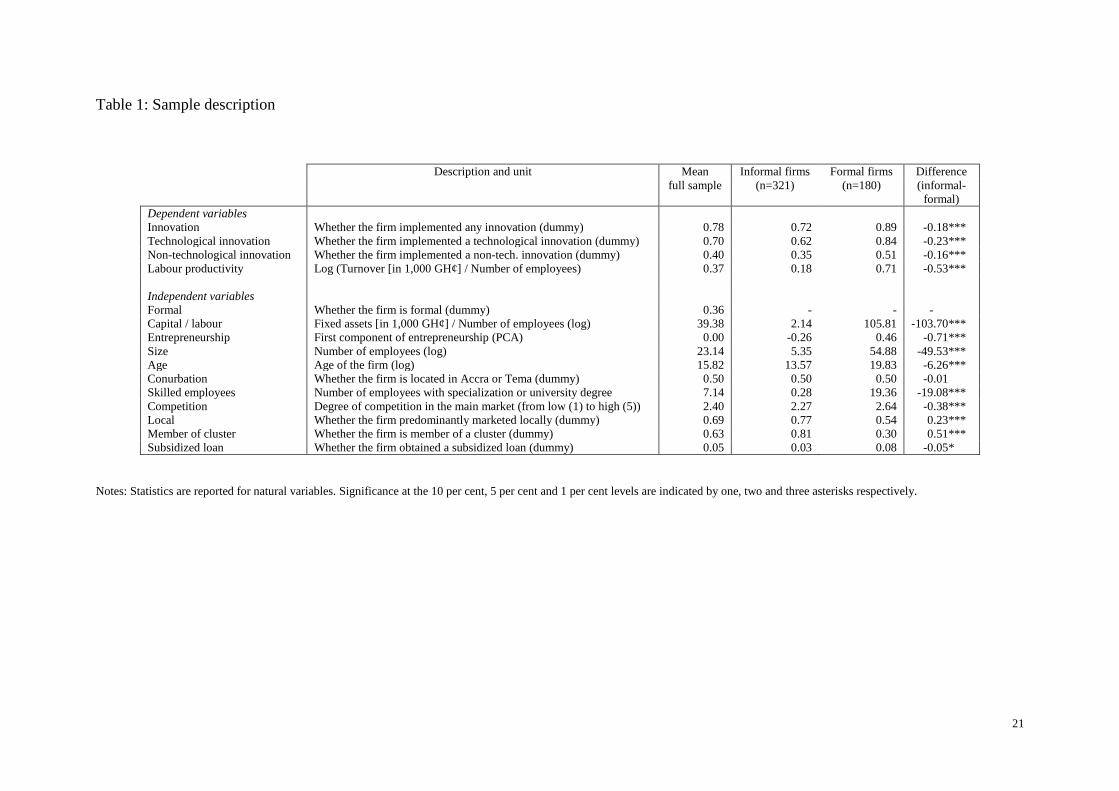
Descriptive statistics of the firms in the sample are reported in Table 1. From our sample we
see how innovation is a widespread phenomenon in the private sector in Ghana, where
between 2010 and 2013 most of the firms (78 per cent) were active in some innovation
3 Specifically we used the latest available National Industrial Census (2003) by Ghana Statistical Service, Micro,
Small and Medium Enterprises database from Ministry of Trade and Industry, Dun & Bradstreet database of
Ghanaian firms, and the list of members of the Association of Ghana Industries (AGI).
13
activity. When we break down the nature of innovations, we observe that most of the firms
(70 per cent) are involved in some technological innovation, which include process or
product innovations. This may reflect the fact that often firms in LICs work far from the
technological frontier, and improvements are relatively easy or affordable to implement.
Non-technological innovations, including management and marketing innovations, were
implemented by 40 per cent of the firms. The vast majority of innovations introduced by the
firms have an imitative and incremental nature, rather than being innovations that leapfrog or
redefine value creation processes. Innovations that were born from a technology that was
originally developed by others and licensed to the firm (with or without adaptation or
modification) or developed in a formal R&D department within the company by scientists
and engineers, amounted to respectively six and two per cent.
Firms have been active on average for almost 16 years and employed 23 employees between
2010 and 2013. However, the distribution of the number of employees is heavily right-
skewed with 73 per cent of the firms employing less than 9 workers (micro firms), 17 per
cent with 10 to 29 employees (small firms), and the remaining 10 per cent is equally
distributed between medium (30-99 employees) and large firms, with more than 100
employees. On average, firms have seven employees with a specialisation or university
degree.
Most of the firms (63 per cent) are part of a cluster and tend to predominantly work in local
markets (69 per cent). Access to subsidised loans is available for only five per cent of the
firms in the sample. Finally, half of the firms sampled are located in the capital, Accra, or in
Tema, a nearby industrial area with an active harbour on the Gulf of Guinea.
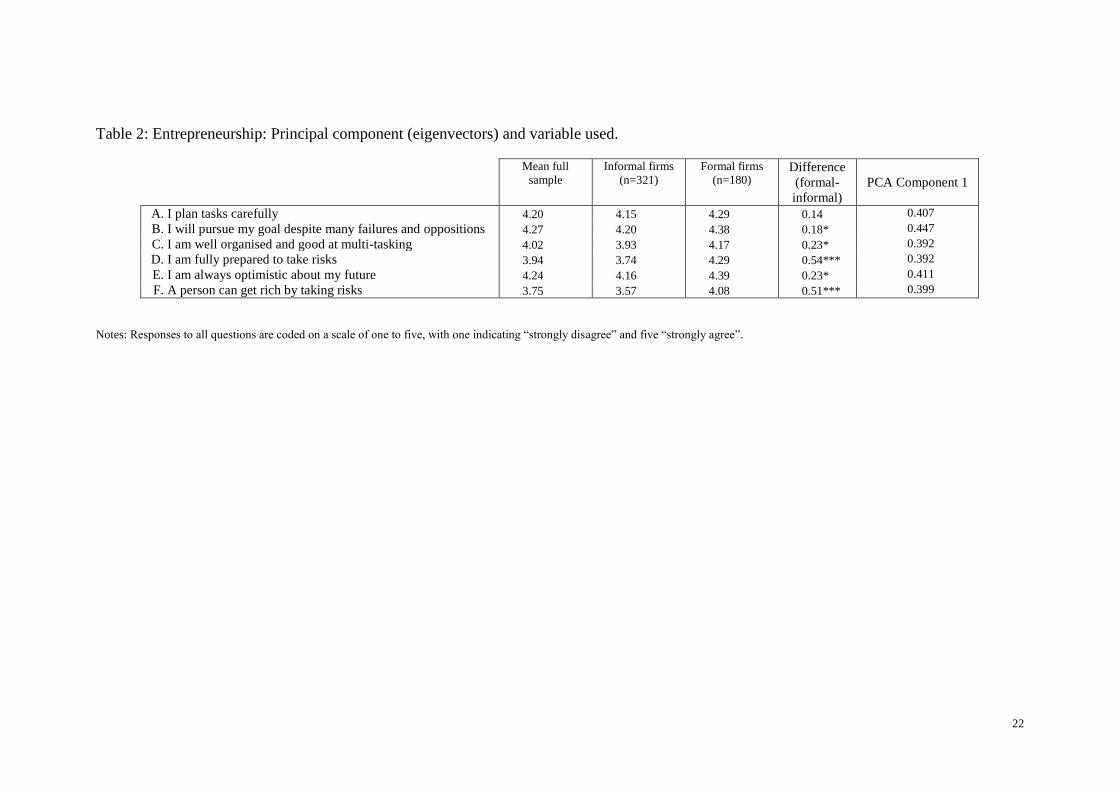
We capture entrepreneurship using a principal component analysis (PCA) on a series of
questions that aim to capture the skills and attitude of the entrepreneurs. Those are more
common in the entrepreneurial psychology literature and go beyond the entrepreneur’s level
of education. A similar set of questions were used by De Mel et al. (2009) in a study of Sri
Lankan firms. The variables included in the PCA are listed in Table 2 and include the degree
of optimism, pro-active attitude, curiosity, and tenacity. All these factors may influence the
diffusion and creation of innovation. From the PCA we identified one component (eigenvalue
= 3.43) that captures the level of entrepreneurship with individuals that are ingenuous, pro-
active, methodical, and optimistic.
4.2 The formal character of firms in the sample
14
We do recognize that there is not a standard definition of formal and informal firms
(Benjamin and Mbaye, 2012; Konté and Ndong, 2012)4. We, therefore, collected a self-
reported formal character of the firm asking the respondents “How do you define the nature
of the firm?” and providing a spectrum of options that included different degrees of formality
(informal, semi-informal, semi-formal, formal), in line with the idea that formality follows a
continuum (Trebilcock, 2005). Moreover, during the survey administration, the local
enumerators were trained to cross-check this specific information based on the visit of a
firm’s premises and the observation of its activity. For this study we merged informal and
semi-informal firms in one group (‘informal firms’) and formal with semi-formal (‘formal
firms’) in another group. In our sample most of the firms (64 per cent) are active
predominantly in the informal sector, a figure in line with other estimations of the informal
establishments in Ghana and Sub-Saharan Africa (Institute of Statistical Social and Economic
Research, 2013; Schneider et al., 2011).
Formal and informal firms differ in most dimensions. Informal firms are significantly less
innovative than formal firms, both in technological and non-technological innovation
activities. Informal firms also tend to have lower productivity and poorer entrepreneurial
skills than formal firms confirming the characterization of informal firms reported in La Porta
and Shleifer (2014). Informal firms are on average younger than formal firms (13 years old as
opposed to 19 years old) and smaller in size, with on average only five employees compared
to an average work force of 55 workers in formal firms. Despite the difference in size, the
Ghana Statistical Service estimated that 48 per cent of the population in working age (16-64
years old) is employed in informal establishments (GSS, 2008). Absorptive capacity is also
greater in formal firms, with on average 19 employees with a specialization degree compared
to less than one employee for the informal firms. Formal and informal firms also tend to be
predominantly active in different markets, with half of the formal firms active in the national
or international markets and three quarters of informal firms in the local market.
Eight out of ten informal firms tend to work as part of a cluster, opposed to half of the formal
firms. Clusters provide financial support, access to tools, bargaining power, and access to
larger markets. The relevance of clusters also hinges on the fact that by nature they provide
information that is context- and sector-specific to their members. Finally, only 14 formal
firms and nine informal firms received government subsidised loans during 2010 – 2013,
accounting for a mere four per cent of the total sample.
5. Discussion of results
4 The World Bank in its Entreprise Surveys defines informal firms as firms that are not formally registered when
they start operations. Konté and Ndong (2012) define informal firms as “all the production units with no
statistical number and/or no formal, written accounting”.
15
5.1 Innovation activities in Ghana
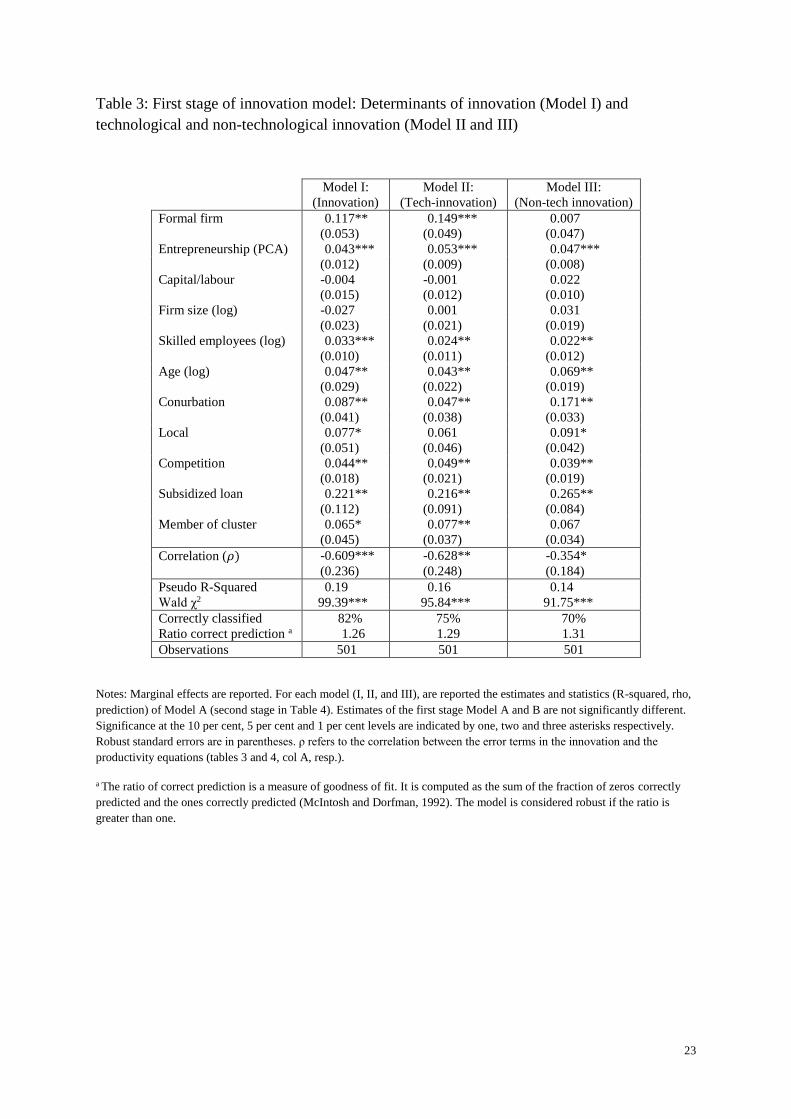
Table 3 reports the results from the first stage of the innovation model. The determinants of
innovation, technological innovation and non-technological innovation are respectively
reported in Column I, II, and III. The significance of the correlation coefficient (𝝆) in every
model suggests a significant correlation between the error terms across the two equations (the
innovation and productivity equations) and therefore the efficiency of estimating them
simultaneously.
Results show that formal firms are more likely to innovate than informal firms, yet when we
distinguish technological and non-technological innovations, we find a significant difference
only for technological innovations. This result highlights how even informal firms are equally
able to adopt management and marketing innovations, which by nature are more likely to be
affordable and determined by the entrepreneur’s capacity. In fact, entrepreneurship is a
critical factor fostering innovation activities across all the specifications in our model. This
reinforces the view that innovation adoption and creation in developing countries is still
greatly influenced by the acumen and skills of entrepreneurs, to an extent that we do not find
in developed countries, where much of the innovation is driven by R&D activities. In less
structured establishments, innovation is driven by people with characteristics that make them
overcome the constraints distinctive of LICs. Entrepreneurial skills and attitude, including
marked curiosity and inclination to personal relationships, are important factors in the
diffusion and adoption of innovations (Bruhn et al., 2010; De Mel et al., 2009).
Consistent with previous studies of firms in Ethiopia and Ghana (Gebreeyesus, 2009; Robson
et al., 2009), more mature firms are more likely to engage in innovation activities. Firms
located in the conurbation area, which comprises Accra and Tema (Greater Accra region), are
also associated with innovation activities, particularly non- technological innovations. Large
towns provide entrepreneurs the opportunities for personal interactions, and exchange of
information increases the likelihood that the entrepreneurs would be exposed to new ideas
(Robson et al., 2009). Moreover, being part of a cluster is positively associated with greater
innovation activities, particularly technological innovations. This results support previous
findings, both from Ghana (McDade and Malecki, 1997) and other LICs (Gebreeyesus and
Mohnen, 2013; Murphy, 2007).
Other results are also in line with the previous literature. A larger number of skilled
employees are associated with innovation activities, and the correlation is significant for both
technological and non-technological innovations. This supports the Bradley et al. (2012)
study of Kenyan firms in which education and human capital were the main constraints to
innovation. Competition seems to be a driver of innovation as well in the Ghanaian firms,
pushing firms that work in competitive markets to innovate in order to remain in business.
Market competition can nurture innovation capabilities, self-selecting firms that are able to
thrive (Kumar and Saqib, 1996). Finally, access to subsidised loans is correlated as well with
innovation activities. This reinforces our a priori expectation that access to credit is one of the
main constraints for innovation.
16
5.2 Informality, innovation, and productivity
Labour productivity greatly varies across the different levels of formality (Figure 1). At the
lower end, informal and formal firms have a similar distribution. However, at the upper end
of the spectrum, we only find formal firms that have the highest labour productivity in the
sample. Such a representation is in line with previous studies of large firms that highlighted
differences in productivity levels between formal and informal firms (La Porta and Shleifer,
2014). It also shows that if we exclude some highly productive formal firms, the difference
between informal and formal firms is not significant at the lower end of the distribution.
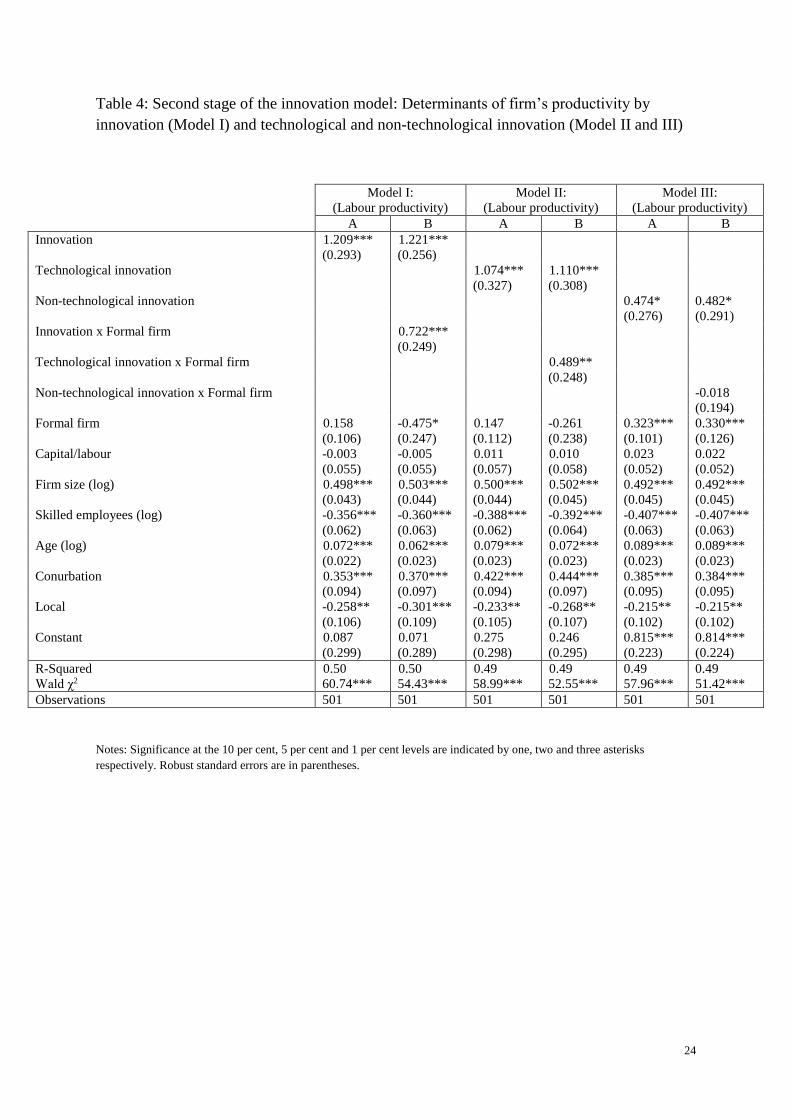
The estimates of the second stages of the innovation model are reported in Table 4. For each
model, that is total innovation and its two components (tech-innovation and non-
technological innovation) separately, we report two specifications with (B) and without (A)
an interaction term between the innovation and the formal nature of the firm. Consistent with
the mainstream literature on the role of innovation in emerging and developed countries
(Fagerberg et al., 2010) and evidence from studies in LICs (Bloom et al., 2013; Gebreeyesus,
2009), the models predict a positive relationship between innovation and firms’ productivity.
The econometric models support the conventional wisdom that more innovative firms
experience greater productivity (Model I). For example, firms increasing innovation activities
from the median to the third quartile are associated with an increase in labour productivity by
11.7 per cent. However, it also shows how technological innovations have a greater impact
on productivity than non-technology-based innovations (Models II and III). Adoption of
technological and non-technology based innovations are respectively associated to a 14 and 7
per cent increase in labour productivity (assuming an increase in innovation activities from
the median to the third quartile). In line with a growing literature on the relevance of
management and managerial skills in firms in LICs (Bartz et al., 2016; Bloom et al., 2013;
Mano et al., 2012), these findings suggest that the low efficiency of firms in Ghana is
partially due to poor management practices, from establishing standard procedures for
operations and implementing quality control to efficiently manage the inventory and human
resources.
Informality is a widespread phenomenon in LICs, and a better understanding of the role of
innovation in informal firms is critical for the support of economic activities that employ the
vast majority of people in the non-agricultural sector. Formal firms tend to benefit more from
innovation (Model I), in particular technological innovations (Model II). While informal
firms tend to be characterized by modest absorptive capacity and limited resources, which
may prevent them from adopting technological innovations, the role of non-technological
innovation on firms’ productivity is similar in formal and informal firms.
17
The finding that innovation plays a crucial role for the productivity of formal and informal
establishments may suggest that firms use innovation to survive. Market conditions, lack of
financial resources and skills, and limited support from the government may provide a
Darwinian environment in which only firms that are able to innovate, from delivering new
product or services to targeting market niches, survive.
Finally, across the various specifications we found a consistent pattern that smaller firms,
those located in the Greater Accra region, and those with a higher number of specialised
employees and active in a national and international markets, tend to be more productive.
Such results fit within the general literature providing evidence of the importance of the
location for the development of firms (Robson et al., 2009). Firms nearby the capital have
access to better infrastructure, larger pool of skilled labour market, and market opportunities.
Specialised labour force has also been found to be one of the contributing factors of firms’
labour productivity (Blundell et al., 1999).
Our results show a more relevant role of innovation on firms’ productivity than the recent
findings from the work of Goedhuys et al. (2008, 2014), who found that supportive business
environments have a greater influence on firms’ performance than innovation activities.
Three differences between their studies and ours can explain the dissimilar results. First, there
might be some difference because of the industry composition of the samples in the two
studies, although food and garments represent half of our sample. Secondly, we have
corrected for the endogeneity of innovation, something Goedhuys et al. (2008, 2014) have not
done. Given the measurement errors inherent in the technological indicators, not
instrumenting innovation may lead to an attenuation bias. But most importantly, our setting
focuses only on firms located in one country and, therefore, potential cross-country
differences in business environments are not captured, only cross-industry differences.
5.3 Policy considerations
Our results show that innovation is the most important determinant of labour productivity, for
both formal and informal firms. Technological innovation has a greater contribution to
productivity than non-technological innovation. Innovation tends to be adopted and
developed more when loans have low interest rates, when competition is higher in the
markets, when more human capital and entrepreneurship are available, and when firms are
part of a cluster. Data also show that technological innovation is more frequent in formal than
in informal firms. As to non-technological innovation, its diffusion is equally spread in
formal and informal firms.
Based on these pieces of evidence, managerial and government policies can be developed to
support and enhance the innovation activities of formal and informal firms. First, innovation
can be stimulated by government policies that aim at supporting firms financially, as financial
18
constraints show up as one of the major impediments to innovation (Kimura, 2011; Kugler,
2006). Such measures would benefit to a larger extent small and informal firms, for which the
availability of cash flow is often a constraint in their activities (Nichter and Goldmark, 2009).
Secondly, policies should be designed and implemented to provide platforms where potential
employees can acquire and develop skills and firms assimilate technological progress and
contribute to it. Finally, macro-economic policies and legislations should ensure a
competitive environment, avoiding protected monopolies. Some competition in the market
provides a conducive environment to innovate in order for firms to survive and succeed
(Aghion et al., 2005).
Innovation should be supported by coordinated multi-sector policy actions that look at firms’
needs (Borrás and Edquist, 2013). Targeted policy actions should also support non-
technological innovation, such as managerial innovation. Policies aimed at developing and
supporting clusters and networks can provide fertile spaces for knowledge spillovers and
information exchange. Moreover, policies should recognise the importance of promoting an
entrepreneurial attitude, i.e. a willingness to take risks and a determination to succeed. This
can be developed by creating safety nets, and nurturing the recognition of ‘failures’ as
learning opportunities along the path to success.
6. Conclusion
Low-income countries rely on the transfer of technologies and knowledge from more
advanced countries to increase the local wealth and welfare, reduce internal inequalities, and
ultimately accelerate the process of catching up. The current developmental state of most
LICs suggests that the diffusion to and adoption of major technologies in LICs are likely to
be faster than what we witnessed with the diffusion of major innovations, such as the steam
engine, which took hundred years to be adopted in China. Economies nowadays are
intrinsically more interconnected and lower-tech innovations have the potential to be adopted
by LICs, favoured by trade and collaborations between LICs and emerging countries. The
rationale is that the knowledge transferred to LICs is likely to be more appropriate since it
comes from countries with not too dissimilar factor endowments. The absorptive capacity of
an LIC recipient may be more prone to receiving a similar level of technology. We are
witnessing an initial process in which manufacturing industries will eventually be relocated to
places – such as African countries – where labour is cheaper than in current manufacturing
countries, where worldwide low-tech goods have been assembled and produced for decades.
Nowadays the diffusion of information and communication technologies holds the potential
to promote the diffusion of information in places that until recently were disconnected and
remote, and the increased capability with which people can move and travel is a powerful
vector to support absorptive capacity of LICs with the injection of knowledge and skills.
19
In such a scenario, our results aim to provide a better understanding of the critical role of
innovation on firms’ growth in LICs. These firms have characteristics and work in an
environment that is very different from that of many firms in emerging countries and most of
the firms in advanced economies. The vast majority of the firms in LICs are informal; they
employ a large proportion of the population but work extremely inefficiently and in a low
productivity regime. Moreover, the historical, socio-economic, and political environment of
LICs provides strong challenges to firms, which face acute obstacles, from knowledge to
market and resource constraints. We found that in such an environment innovation is a
determinant factor for firms’ productivity, with greater effect in formal firms.
Policies play a critical role in accelerating the diffusion and creation of innovation and
mitigating the obstacles LICs face. Findings from this research has important policy
implications. Firstly, it should be more strongly emphasized among policy-makers that
innovation is not the outcome of development but a means for development. Too often in
LICs, in the informal economy in particular, innovations are not recognized, and innovation
efforts are not properly supported. Therefore, new thinking and policies to recognize and
support innovation, for example by mitigating financial and labour skills constraints, are
necessary in the context of LICs for long-term growth and development. In Ghana,
recognizing the important role that knowledge and innovation must play in transforming the
economy and reducing poverty, the Government of Ghana has placed Science and
Technology (S&T) development high on its list of priorities (Amankwah-Amoah, 2016). This
is reflected in various political and policy statements, including Vision 2020, the Growth and
Poverty Reduction Strategy II, and the medium-term development plan. These policies and
strategies have emphasised that the absorption and application of much more S&T is a critical
ingredient for successful growth. As with many other economies in sub-Saharan Africa,
Ghana is still in the stage of ‘factor-driven’ growth. In the next decade, policy-makers in
Ghana must address these issues in order to move from a ‘factor-driven’ growth into an
‘innovation-driven’ one.
Secondly, this study suggests that non-technological innovations also have a significant
positive impact on labour productivity, although the size of its impact is smaller than that of
technology-based innovations. Poor management practices, poor standard of operations, and
poor quality control have been argued as important constraints for productivity growth in
Africa. Therefore, government policies should also promote the diffusion and adoption of
appropriate modern management practices, which may provide Africa with another engine of
economic growth.
Acknowledgements

20
This research was supported by the ESRC/DFID Grant ‘The Diffusion of Innovation in Low
Income Countries’ (ES/J008699/1). We would like to thank Marc Ventresca, Douglas Gollin,
and Abhijeet Singh for helpful comments and suggestions. We are also grateful for comments
from participants at the Development Studies Association 2014 Annual conference (London,
UK), Seminar at the Oxford Department of International Development, OECD Blue Sky
conference (Ghent, Belgium), and ‘Informality and Development: A Conference in Honour
of Elinor Ostrom’ Bloomington (IN, US).
21
Table 1: Sample description
Description and unit Mean
full sample
Informal firms
(n=321)
Formal firms
(n=180)
Difference
(informal-
formal)
Dependent variables
Innovation Whether the firm implemented any innovation (dummy) 0.78 0.72 0.89 -0.18***
Technological innovation Whether the firm implemented a technological innovation (dummy) 0.70 0.62 0.84 -0.23***
Non-technological innovation Whether the firm implemented a non-tech. innovation (dummy) 0.40 0.35 0.51 -0.16***
Labour productivity Log (Turnover [in 1,000 GH¢] / Number of employees) 0.37 0.18 0.71 -0.53***
Independent variables
Formal Whether the firm is formal (dummy) 0.36 - - -
Capital / labour Fixed assets [in 1,000 GH¢] / Number of employees (log) 39.38 2.14 105.81 -103.70***
Entrepreneurship First component of entrepreneurship (PCA) 0.00 -0.26 0.46 -0.71***
Size Number of employees (log) 23.14 5.35 54.88 -49.53***
Age Age of the firm (log) 15.82 13.57 19.83 -6.26***
Conurbation Whether the firm is located in Accra or Tema (dummy) 0.50 0.50 0.50 -0.01
Skilled employees Number of employees with specialization or university degree 7.14 0.28 19.36 -19.08***
Competition Degree of competition in the main market (from low (1) to high (5)) 2.40 2.27 2.64 -0.38***
Local Whether the firm predominantly marketed locally (dummy) 0.69 0.77 0.54 0.23***
Member of cluster Whether the firm is member of a cluster (dummy) 0.63 0.81 0.30 0.51***
Subsidized loan Whether the firm obtained a subsidized loan (dummy) 0.05 0.03 0.08 -0.05*
Notes: Statistics are reported for natural variables. Significance at the 10 per cent, 5 per cent and 1 per cent levels are indicated by one, two and three asterisks respectively.
22
Table 2: Entrepreneurship: Principal component (eigenvectors) and variable used.
Mean full
sample Informal firms
(n=321) Formal firms
(n=180) Difference
(formal-
informal)
PCA Component 1
A. I plan tasks carefully 4.20 4.15 4.29 0.14 0.407
B. I will pursue my goal despite many failures and oppositions 4.27 4.20 4.38 0.18* 0.447
C. I am well organised and good at multi-tasking 4.02 3.93 4.17 0.23* 0.392
D. I am fully prepared to take risks 3.94 3.74 4.29 0.54*** 0.392
E. I am always optimistic about my future 4.24 4.16 4.39 0.23* 0.411
F. A person can get rich by taking risks 3.75 3.57 4.08 0.51*** 0.399
Notes: Responses to all questions are coded on a scale of one to five, with one indicating “strongly disagree” and five “strongly agree”.
23
Table 3: First stage of innovation model: Determinants of innovation (Model I) and
technological and non-technological innovation (Model II and III)
Model I:
(Innovation)
Model II:
(Tech-innovation)
Model III:
(Non-tech innovation)
Formal firm 0.117** 0.149*** 0.007
(0.053) (0.049) (0.047)
Entrepreneurship (PCA) 0.043*** 0.053*** 0.047***
(0.012) (0.009) (0.008)
Capital/labour -0.004 -0.001 0.022
(0.015) (0.012) (0.010)
Firm size (log) -0.027 0.001 0.031
(0.023) (0.021) (0.019)
Skilled employees (log) 0.033*** 0.024** 0.022**
(0.010) (0.011) (0.012)
Age (log) 0.047** 0.043** 0.069**
(0.029) (0.022) (0.019)
Conurbation 0.087** 0.047** 0.171**
(0.041) (0.038) (0.033)
Local 0.077* 0.061 0.091*
(0.051) (0.046) (0.042)
Competition 0.044** 0.049** 0.039**
(0.018) (0.021) (0.019)
Subsidized loan 0.221** 0.216** 0.265**
(0.112) (0.091) (0.084)
Member of cluster 0.065* 0.077** 0.067
(0.045) (0.037) (0.034)
Correlation (𝜌) -0.609*** -0.628** -0.354*
(0.236) (0.248) (0.184)
Pseudo R-Squared 0.19 0.16 0.14
Wald χ2 99.39*** 95.84*** 91.75***
Correctly classified 82% 75% 70%
Ratio correct prediction a 1.26 1.29 1.31
Observations 501 501 501
Notes: Marginal effects are reported. For each model (I, II, and III), are reported the estimates and statistics (R-squared, rho,
prediction) of Model A (second stage in Table 4). Estimates of the first stage Model A and B are not significantly different.
Significance at the 10 per cent, 5 per cent and 1 per cent levels are indicated by one, two and three asterisks respectively.
Robust standard errors are in parentheses. ρ refers to the correlation between the error terms in the innovation and the
productivity equations (tables 3 and 4, col A, resp.).
a The ratio of correct prediction is a measure of goodness of fit. It is computed as the sum of the fraction of zeros correctly
predicted and the ones correctly predicted (McIntosh and Dorfman, 1992). The model is considered robust if the ratio is
greater than one.
24
Table 4: Second stage of the innovation model: Determinants of firm’s productivity by
innovation (Model I) and technological and non-technological innovation (Model II and III)
Model I:
(Labour productivity)
Model II:
(Labour productivity)
Model III:
(Labour productivity)
A B A B A B
Innovation 1.209*** 1.221***
(0.293) (0.256)
Technological innovation 1.074*** 1.110***
(0.327) (0.308)
Non-technological innovation 0.474* 0.482*
(0.276) (0.291)
Innovation x Formal firm 0.722***
(0.249)
Technological innovation x Formal firm 0.489**
(0.248)
Non-technological innovation x Formal firm -0.018
(0.194)
Formal firm 0.158 -0.475* 0.147 -0.261 0.323*** 0.330***
(0.106) (0.247) (0.112) (0.238) (0.101) (0.126)
Capital/labour -0.003 -0.005 0.011 0.010 0.023 0.022
(0.055) (0.055) (0.057) (0.058) (0.052) (0.052)
Firm size (log) 0.498*** 0.503*** 0.500*** 0.502*** 0.492*** 0.492***
(0.043) (0.044) (0.044) (0.045) (0.045) (0.045)
Skilled employees (log) -0.356*** -0.360*** -0.388*** -0.392*** -0.407*** -0.407***
(0.062) (0.063) (0.062) (0.064) (0.063) (0.063)
Age (log) 0.072*** 0.062*** 0.079*** 0.072*** 0.089*** 0.089***
(0.022) (0.023) (0.023) (0.023) (0.023) (0.023)
Conurbation 0.353*** 0.370*** 0.422*** 0.444*** 0.385*** 0.384***
(0.094) (0.097) (0.094) (0.097) (0.095) (0.095)
Local -0.258** -0.301*** -0.233** -0.268** -0.215** -0.215**
(0.106) (0.109) (0.105) (0.107) (0.102) (0.102)
Constant 0.087 0.071 0.275 0.246 0.815*** 0.814***
(0.299) (0.289) (0.298) (0.295) (0.223) (0.224)
R-Squared 0.50 0.50 0.49 0.49 0.49 0.49
Wald χ2 60.74*** 54.43*** 58.99*** 52.55*** 57.96*** 51.42***
Observations 501 501 501 501 501 501
Notes: Significance at the 10 per cent, 5 per cent and 1 per cent levels are indicated by one, two and three asterisks
respectively. Robust standard errors are in parentheses.

25
Figure 1: Distribution of labour productivity by level of formality of the firms.
26
Reference
Aghion, P., Bloom, N., Blundell, R., Griffith, R., and Howitt, P. (2005). Competition and Innovation: an Inverted-U Relationship. The Quarterly Journal of Economics 120, 701-728.
Agyapong, F. O., Agyapong, A., Poku, K., and Davis, J. L. (2017). Nexus between social capital and performance of micro and small firms in an emerging economy: The mediating role of innovation. Cogent Business & Management 4, 1309784.
Amankwah-Amoah, J. (2016). The evolution of science, technology and innovation policies: A review of the Ghanaian experience. Technological Forecasting and Social Change 110, 134-142.
Ayyagari, M., Demirguc-Kunt, A., and Maksimovic, V. (2011). Firm innovation in emerging markets: The role of finance, governance, and competition. Journal of Financial and Quantitative Analysis 46, 1545-1580.
Bartz, W., Mohnen, P., and Schweiger, H. (2016). "The role of innovation and management practices in determining firm productivity in developing economies," Working Paper 187. European Bank for Reconstruction and Development, London (UK).
Bell, M., and Pavitt, K. (1992). Accumulating technological capability in developing-countries. World Bank Economic Review, 257-281.
Benjamin, N. C., and Mbaye, A. A. (2012). The informal sector, productivity, and enforcement in West Africa: A firm-level analysis. Review of Development Economics 16, 664-680.
Benjamin, N. C., and Mbaye, A. A. (2014). "Informality, growth, and development in Africa," UNU-WIDER Working Paper 2014-52. UNU-WIDER, Helsinki (Finland).
Bhatti, Y., and Ventresca, M. (2012). The emerging market for frugal innovation: Fad, fashion, or fit? Available at SSRN: http://ssrn.com/abstract=2005983.
Bloom, N., Eifert, B., Mahajan, A., McKenzie, D., and Roberts, J. (2013). Does Management Matter? Evidence from India. Quarterly Journal of Economics 128, 1-51.
Blundell, R., Dearden, L., Meghir, C., and Sianesi, B. (1999). Human capital investment: the returns from education and training to the individual, the firm and the economy. Fiscal studies 20, 1-23.
Borrás, S., and Edquist, C. (2013). The choice of innovation policy instruments. Technological Forecasting and Social Change 80, 1513-1522.
Bradley, S. W., McMullen, J. S., Artz, K., and Simiyu, E. M. (2012). Capital is not enough: Innovation in developing economies. Journal of Management Studies 49, 684-717.
Bruhn, M., Karlan, D., and Schoar, A. (2010). What capital is missing in developing countries? American Economic Review: Papers & Proceedings 100, 629-33.
Chataway, J., Hanlin, R., and Kaplinsky, R. (2013). Inclusive innovation: An architecture for policy development. IKD Working Paper No. 65.
Chen, M., Sebstad, J., and O'Connell, L. (1999). Counting the invisible workforce: The case of homebased workers. World Development 27, 603-610.
Cohen, W. M., and Levinthal, D. A. (1989). Innovation and learning: The two faces of R&D. The Economic Journal 99, 569-596.
Crepon, B., Duguet, E., and Mairesse, J. (1998). Research, innovation and productivity: An econometric analysis at the firm level. Economics of Innovation and New Technology 7, 115-158.
Crespi, G., and Zuniga, P. (2012). Innovation and productivity: evidence from six Latin American countries. World development 40, 273-290.
De Mel, S., McKenzie, D., and Woodruff, C. (2009). "Innovative firms or innovative owners? Determinants of innovation in micro, small, and medium enterprises," World Bank Policy Research Working Paper 4934. The World Bank, Washington DC (US).
Donckels, R., and Fröhlich, E. (1991). Are family businesses really different? European experiences from STRATOS. Family Business Review 4, 149-160.
Drexler, A., Fischer, G., and Schoar, A. (2014). Keeping it simple: Financial literacy and rules of thumb. American Economic Journal: Applied Economics 6, 1-31.
27
Fagerberg, J., Srholec, M., and Verspagen, B. (2010). Innovation and economic development. In "Handbook of the Economics of Innovation" (H. H. Bronwyn and N. Rosenberg, eds.), Vol. 2, pp. 833-872. North-Holland.
Fransman, M. (1985). Conceptualizing technical change in the Third-World in the 1980s: An Interpretive Survey. Journal of Development Studies 21, 572-652.
Fu, X., and Gong, Y. (2011). Indigenous and foreign innovation efforts and drivers of technological upgrading: Evidence from China. World Development 39, 1213-1225.
Fu, X., Zanello, G., Essegbey, G. O., Hou, J., and Mohnen, P. (2014). "Innovation in low income countries: A survey report." TMCD and DEGRP, Oxford (UK).
Gebreeyesus, M. (2009). Innovation and microenterprises growth in Ethiopia. In "Entrepreneurship, innovation, and economic development" (A. Szirmai, W. A. Naudé and M. Goedhuys, eds.). Oxford University Press, Oxford (UK).
Gebreeyesus, M., and Mohnen, P. (2013). Innovation Performance and Embeddedness in Networks: Evidence from the Ethiopian Footwear Cluster. World Development 41, 302-316.
Geroski, P. A. (1989). Entry, innovation and productivity growth. The Review of Economics and Statistics, 572-578.
Goedhuys, M. (2007). Learning, product innovation, and firm heterogeneity in developing countries: Evidence from Tanzania. Industrial and Corporate Change 16, 269-292.
Goedhuys, M., Janz, N., and Mohnen, P. (2008). What drives productivity in Tanzanian manufacturing firms: technology or business environment? European Journal of Development Research 20, 199-218.
Goedhuys, M., Janz, N., and Mohnen, P. (2014). Knowledge-based productivity in "low-tech" industries: Evidence from firms in developing countries. Industrial and Corporate Change 23, 1-23.
Govindarajan, V., and Ramamurti, R. (2011). Reverse innovation, emerging markets, and global strategy. Global Strategy Journal 1, 191-205.
Grossman, G. M., and Helpman, E. (1991). "Innovation and growth in the global economy," The MIT Press, Cambridge, MA (US).
GSS (2008). "Ghana Living Standards Survey: Report of the 5th round." Ghana Statistical Service, Accra, Ghana.
Gulati, R. (2010). Management Lessons From the Edge. Academy of Management Perspectives 24, 25-27.
Hall, J., Matos, S., Sheehan, L., and Silvestre, B. (2012). Entrepreneurship and innovation at the Base of the Pyramid: A recipe for inclusive growth or social exclusion? Journal of Management Studies 49, 785-812.
Hausman, A. (2005). Innovativeness among small businesses: Theory and propositions for future research. Industrial Marketing Management 34, 773-782.
Institute of Statistical Social and Economic Research (2013). The State of Ghanaian Economy in 2012. Legon University Press, Accra, Ghana.
Jovanovic, B. (1982). Selection and the evolution of industry. Econometrica 50, 649-670. Karlan, D., and Valdivia, M. (2011). Teaching entrepreneurship: Impact of business training on
microfinance clients and institutions. Review of Economics and Statistics 93, 510-527. Keller, W. (1996). Absorptive capacity: On the creation and acquisition of technology in
development. Journal of Development Economics 49, 199-227. Keller, W. (2004). International technology diffusion. Journal of Economic Literature 42, 752-782. Kimura, Y. (2011). Knowledge diffusion and modernization of rural industrial clusters: A paper-
manufacturing village in Northern Vietnam. World Development 39, 2105-2118. Kleinknecht, A., and Mohnen, P. A. (2002). "Innovation and firm performance: Econometric
explorations of survey data," Palgrave, Basingstoke (UK). Klepper, S. (1996). Entry, exit, growth, and innovation over the product life cycle. American
Economic Review 86, 562-583.
28
Konté, A., and Ndong, M. (2012). "The informal ICT sector and innovation processes in Senegal," UNU-MERIT Working Paper. UNU-MERIT, Maastricht (The Netherlands)
Kugler, M. (2006). Spillovers from foreign direct investment: Within or between industries? Journal of Development Economics 80, 444-477.
Kumar, N., and Saqib, M. (1996). Firm size, opportunities for adaptation and in-house R&D activity in developing countries: The case of Indian manufacturing. Research Policy 25, 713-722.
La Porta, R., and Shleifer, A. (2008). "The unofficial economy and economic development," Brookings Papers on Economic Activity 39. The Brookings Institution, Washington DC, USA.
La Porta, R., and Shleifer, A. (2014). Informality and development. Journal of Economic Perspectives 28, 109-26.
Lall, S. (1992). Technological capabilities and industrialization. World Development 20, 165-186. Lundvall, B.-Å., Joseph, K. J., Chaminade, C., and Vang, J. (2010). "Handbook of Innovation Systems
and Developing Countries: Building Domestic Capabilities in a Global Setting," Edward Elgar Publishing, Cheltenham, UK.
Mahemba, C. M., and Bruijn, E. J. (2003). Innovation activities by small and medium-sized manufacturing enterprises in Tanzania. Creativity and Innovation Management 12, 162-173.
Mano, Y., Iddrisu, A., Yoshino, Y., and Sonobe, T. (2012). How can micro and small enterprises in Sub-Saharan Africa become more productive? The impacts of experimental basic managerial training. World Development 40, 458-468.
McDade, B. E., and Malecki, E. J. (1997). Entrepreneurial networking: Industrial estates in Ghana. Tijdschrift Voor Economische En Sociale Geografie 88, 262-272.
McIntosh, C. S., and Dorfman, J. H. (1992). Qualitative forecast evaluation: A comparison of two performance measures. American Journal of Agricultural Economics 74, 209-214.
Mendi, P., and Mudida, R. (2017). The effect on innovation of beginning informal: Empirical evidence from Kenya. Technological Forecasting and Social Change. In press.
Murphy, J. T. (2007). The challenge of upgrading in African industries: Socio-spatial factors and the urban environment in Mwanza, Tanzania. World Development 35, 1754-1778.
Nichter, S., and Goldmark, L. (2009). Small Firm Growth in Developing Countries. World Development 37, 1453-1464.
OECD (2005). "Oslo Manual: Guidelines for collecting and interpreting innovation data," 3rd/Ed. OECD Publishing, Paris.
Oyelaran-Oyeyinka, B., Laditan, G. O. A., and Esubiyi, A. O. (1996). Industrial innovation in Sub-Saharan Africa: The manufacturing sector in Nigeria. Research Policy 25, 1081-1096.
Oyelaran-Oyeyinka, B., and Lal, K. (2006). Learning new technologies by small and medium enterprises in developing countries. Technovation 26, 220-231.
Prahalad, C. K. (2012). Bottom of the Pyramid as a source of breakthrough innovations. Journal of Product Innovation Management 29, 6-12.
Ramani, S. V., Sadre Ghazi, S., and Duysters, G. (2012). On the diffusion of toilets as bottom of the pyramid innovation: Lessons from sanitation entrepreneurs. Technological Forecasting and Social Change 79, 676-687.
Robson, P. J. A., Haugh, H. M., and Obeng, B. A. (2009). Entrepreneurship and innovation in Ghana: Enterprising Africa. Small Business Economics 32, 331-350.
Schneider, F., Buehn, A., and Montenegro, C. E. (2011). Shadow economies all over the world: New estimates for 162 countries from 1999 to 2007. International Economic Journal 24, 443-461.
Trebilcock, A. (2005). "Decent work and the informal economy," UNU-WIDER Working Paper 2005-04. UNU-WIDER, Helsinki (Finland).
Von Hippel, E. (1998). "The sources of innovation," Oxford University Press, Oxford (UK). Wang, H. C. (2010). Discovering steam power in China, 1840s-1860s. Technology and Culture 51, 31-
54.

29
Wunsch-Vincent, S., and Kraemer-Mbula, E. (2016). "The Informal Economy in Developing Nations: Hidden Engine of Innovation? New economic insights and policies," Cambridge University Press, Cambridge (UK).
Zanello, G., Fu, X., Mohnen, P., and Ventresca, M. (2016). The creation and diffusion of innovation in developing countries: A systematic literature review. Journal of Economic Surveys 30, 884-912.