innovation in emerging energy technologies: a case study
TRANSCRIPT
Innovation in Emerging Energy Technologies:
A case study analysis to inform the path forward for algal biofuels
A Plan B Paper
In Partial Fulfillment of the
Master of Science in Science, Technology, and Environmental Policy
Degree Requirements
The Hubert H. Humphrey School of Public Affairs
The University of Minnesota
Rachel A. Haase
May 6, 2012
_____________________________________
Professor Jennifer Kuzma
Paper Advisor
__________
Date

i
Abstract
Algal biofuel is an emerging energy source that has the potential to improve upon the
environmental benefits realized by conventional biofuels and contribute to the biofuels mandate
set by the Renewable Fuel Standard. While there has been much research into producing fuel
from algae, a commercial operation has not yet been built. This paper examines theoretical
models of innovation and two case studies of innovation in energy technologies in the United
States, first generation biodiesel and solar photovoltaics (PV), using a technological innovation
system (TIS) framework to provide relevant lessons and inform the path forward for
commercializing algal biofuel. The case study analysis identified five event types as being the
most influential to the innovation process: changing expectations, technology development,
demonstration projects, policy targets, and government subsidies. There have been some
demonstration projects for algal biofuel, and it does fall under the mandates laid out by the
Renewable Fuel Standard (a policy target) but currently does not receive production subsidies. If
societal expectations and national priorities regarding fuel and energy sources are aligned with
the potential benefits of algal biofuels, providing subsidies for algal biofuel production could
significantly contribute to advancing its commercialization process. The main finding from the
case study analysis is that government interventions had a high level of influence in the
innovation processes of first generation biodiesel and solar PV and will likely also be key factors
in the commercialization of algal biofuel. The feasibility of these interventions is an area for
future study.

ii
Table of Contents
Abstract ............................................................................................................................................ i
List of Figures ................................................................................................................................ iii
List of Tables ................................................................................................................................. iii
1. Introduction ............................................................................................................................. 1
2. Background .............................................................................................................................. 3
2.1 Algal Biofuel .................................................................................................................... 3
2.1.1 Methods of Production .............................................................................................. 4
2.1.2 Resource Use Characteristics .................................................................................... 6
2.1.3 Economic Costs of Production.................................................................................. 8
2.1.4 Scale-Up Potential .................................................................................................. 12
2.2 Current Policy Framework ............................................................................................. 16
3. Methodology .......................................................................................................................... 17
4. Analysis ................................................................................................................................. 18
4.1 Theoretical Models of Innovation .................................................................................. 19
4.1.1 Path Dependence ..................................................................................................... 19
4.1.2 Induced Innovation ................................................................................................. 21
4.2 Technological Innovation Systems ................................................................................ 23
4.3 Biodiesel Case Study ...................................................................................................... 29
4.4 Solar PV Case Study ...................................................................................................... 40
5. Discussion and Conclusions .................................................................................................. 55
5.1 Limitations ..................................................................................................................... 55
5.2 Case Study Comparisons and Findings .......................................................................... 56
5.3 Relevancy for Algal Biofuel .......................................................................................... 61
References ..................................................................................................................................... 65

iii
List of Figures
Figure 1 Open pond design (Sheehan et al., 1998) ......................................................................... 5
Figure 2 Photobioreactor design (Chisti, 2007) .............................................................................. 6
Figure 3 Competitiveness of microalgal biomass depends on its lipid content and the price of
petroleum (Shen et al., 2009) ........................................................................................................ 10
Figure 4 Rough scoping assessment of preferred site locations for outdoor algae production (US
DOE, 2010) ................................................................................................................................... 13
Figure 5 Regional resource assessment for scaling up algae production (Pate et al., 2011) ........ 14
Figure 6 Path dependence arises in systems with positive feedback (Sterman, 2000) ................. 20
Figure 7 Motors of change in TISs (Hekkert et al., 2007) ............................................................ 26
Figure 8 Adapted motors of change .............................................................................................. 28
Figure 9 Motors of Change for First Generation Biodiesel in the US .......................................... 38
Figure 10 Photovoltaic cell configurations (US DOE EERE, 2011c) .......................................... 40
Figure 11 Diffusion model of PV market applications (Dracker & De Laquil, 1996) ................. 47
Figure 12 State financial incentives for solar PV (DSIRE, 2012) ................................................ 49
Figure 13 US PV shipments and prices 2001-2009 (US EIA, 2011b).......................................... 50
Figure 14 Motors of change for solar PV in the US ..................................................................... 53
Figure 15 Influential TIS functions for first generation biodiesel and solar PV in the US .......... 59
Figure 16 TIS functions that have occurred for algal biofuels ..................................................... 63
List of Tables
Table 1 Operational algae fuels pilot projects (from Concentric Energies & Resource Group,
2010) ............................................................................................................................................... 4
Table 2 Prospective markets and substitute products for algal meal, omega-3, and glycerin in
USA (Subhadra & Edwards, 2011) ............................................................................................... 12
Table 3 Technological innovation system functions (Suurs & Hekkert, 2009) ............................ 24
Table 4 Event types as indicators of innovation system functions (Suurs & Hekkert, 2009) ...... 27
Table 5 Annual US biodiesel production (US EIA, 2012b) ......................................................... 35
Table 6 TIS functions in US biodiesel innovation ........................................................................ 35
Table 7 Examples of PV applications by size (IEA, 2006) .......................................................... 47
Table 8 TIS functions in US solar PV innovation ........................................................................ 50
Table 9 Comparison of most influential TIS functions in case studies ........................................ 57

1
1. Introduction
Addressing climate change and making the transition to a clean energy economy are
topics with significant global importance and have fueled much debate regarding the appropriate
approach. Transforming our energy portfolio from one dependent on fossil fuels to one
comprised of renewable energy sources has been called the greatest challenge of the 21st century
(Serrano et al., 2010). In the United States, there is no federal policy with the stated goal of
addressing climate change; however, there are alternative energy incentives including a biofuel
mandate to help transition away from using fossil fuels as liquid transportation fuels. Biofuels
have been pursued in part because of high energy prices, concerns regarding energy imports and
petroleum supplies, and greater recognition of the environmental consequences of fossil fuels
(Hill et al., 2006).
The United States biofuels market boomed after the passage of the 2005 Energy Policy
Act (Weiss & Bonvillian, 2009) which instated the first Renewable Fuel Standard (RFS) (Energy
Policy Act of 2005). While there is strong support for conventional biofuels like corn grain
ethanol and soy biodiesel from groups such as the agricultural lobby, there has also been growing
recognition of the downsides of such fuels (Weiss & Bonvillian, 2009). Negative consequences
of these fuels include land use changes, indirect land use effects, competition with food markets,
loss of biodiversity, and questionable energy gains and greenhouse gas reductions (Tilman et al.,
2009). One way to reduce or avoid some of these effects is to use different biofuel feedstocks
such as crop residues, municipal and industrial wastes, or perennial plants grown on degraded
lands no longer in agricultural use (Tilman et al., 2009). The RFS was structured to encourage
the development and use of alternative feedstocks by including volumetric mandates for

2
cellulosic biofuel, biomass-based diesel, and other advanced biofuels (US DOE EERE, 2011b).
One feedstock that has the potential to contribute to meeting this mandate is algae. Algal fuels
have not yet been produced at commercial scale, but there have been some large-scale
demonstrations and more projects are underway (ABO, 2012a). Yet, based on a model by Shen
et al. (2009), production prices of algal biomass are about ten times higher than the acceptable
price of the biomass, which is partially dependent on the cost of a barrel of oil. For oil prices
around $90/barrel the acceptable price of algal biomass is approximately $300/metric ton, but
current production costs are closer to $3,000/metric ton (Shen et al., 2009; Chisti, 2007).
The goal of this paper is to inform the path forward for commercializing algal biofuels by
drawing on innovation theories and historical experiences with other biofuel feedstocks and
renewable energy technologies. The paper will begin with background information on algal
biofuels including resource implications, costs, and the current policy framework. Then two
theoretical models of innovation and two case studies of innovation in energy technology, first
generation biodiesel and solar photovoltaics (PV), will be examined. These case studies were
chosen because 1) biodiesel is one likely product that can be produced from algae, and 2) solar
PV farms represent the solar energy use and the non-agricultural land use components of
growing algae. Key factors in the innovation processes of these two technologies will be
identified and analyzed using a technological innovation system framework. Finally, the
findings of the case study analysis will be used to inform the commercialization process of algal
biofuels.

3
2. Background
2.1 Algal Biofuel
Multiple products can be derived from algae such as algal meal for animal feed, omega-3
fatty acids for nutraceuticals and animal feed, and glycerin for pharmaceuticals and industrial
bulk chemicals (Subhadra & Edwards, 2011), but the one that has drawn the most attention and
is thought to have the largest potential market is biofuel, particularly biodiesel (ABO, 2012a).
Research into algae and its use for biofuels in the United States goes back over thirty years to the
US Department of Energy’s Aquatic Species Program which was funded from 1978 to 1996 to
develop renewable transportation fuels from algae (Sheehan et al., 1998). This program was
eliminated due to budget cuts, but research has continued, likely aided in recent years by the
passage of the Renewable Fuel Standard in 2005 which mandated the production of advanced
biofuels. This legislation has had a significant role in shaping the current policy environment
around biofuels and will be discussed in more detail in section 2.2 Current Policy Framework
(US DOE EERE, 2011b).
Algal biofuel has not yet reached commercial production, but some companies are
projecting that it will only be a few more years before that occurs (ABO, 2012a). To date, there
have been a few large-scale demonstration projects, such the production of over eight tons of
algal biomass at Cellana’s Kona Demonstration Facility in Hawaii for testing in biofuels and
other uses and the manufacture of thousands of gallons of algal biofuel via fermentation for the
US Navy (ABO, 2012a). A DOE-sponsored report reviewing the US biofuels industry from
2008-2009 stated that there are over fifty active algal biofuel companies but none are near
significant production (Concentric Energies & Resource Group, 2010). During this time period,
276,000 gallons of algal fuel per year were being produced at eight operational pilot facilities in

4
Florida, New Mexico, California, and Colorado (Table 1) (Concentric Energies & Resource
Group, 2010). As a point of comparison, in the first ten months of 2011 approximately 655
million gallons of biodiesel and 49 billion gallons of distillate fuel oil (diesel fuel and fuel oils)
were produced in the US (US EIA, 2012b). In 2011, Sapphire Energy broke ground on a 300
acre project in New Mexico that is scheduled to begin operating in 2012; at full capacity, the
plant is expected to produce one million gallons per year of algal biofuels. In addition, multiple
pilot plants are scheduled to go online in locations including Florida, Hawaii, and Iowa during
2012. Overall investments, both public and private, into algal biofuel production have exceeded
two billion dollars (ABO, 2012a).
Table 1 Operational algae fuels pilot projects (from Concentric Energies & Resource Group, 2010)
Company Fuel* Capacity (gal/yr)
PetroAlgae RDIF (Coking) 120,000
Sapphire Energy RDIF (Hydroprocessing) 10,000
Solazyme RDIF (Hydroprocessing) 100,000
Aurora Biofuels Algae Biodiesel 10,000
ENN Algae Biodiesel 10,000
LiveFuels Algae Biodiesel 10,000
Seambiotic Algae Biodiesel 10,000
Solix Algae Biodiesel 6,000
total 276,000
2.1.1 Methods of Production
Algae can be cultivated by a variety of methods which can be categorized as either
photoautotrophic or heterotrophic. Photoautotrophic methods utilize light to create new biomass
and can be in an open or closed system. Heterotrophic methods utilize a carbon source (sugars)
to generate growth, but as this competes with food and feed markets photoautotrophic methods
are typically preferred (US DOE, 2010). Open ponds are one option for photoautotrophic
* RDIF stands for renewable drop-in fuel.

5
cultivation. These shallow ponds are designed like a raceway where algae, water, and nutrients
circulate around a track, propelled by paddlewheels that provide both flow and mixing. The
shallow depth and constant circulation keep the algae cells suspended and maximize exposure to
sunlight. The open design allows for evaporative cooling to maintain a viable temperature for
the algae but also exposes the pond to contamination by native species and daily and seasonal
fluctuations in temperature and humidity (US DOE, 2010).
Figure 1 Open pond design (Sheehan et al., 1998)
The other option for photoautotrophic cultivation is utilizing a photobioreactor (PBR).
These are enclosed reactors that allow in light, either natural or artificial, while keeping out
contaminants. Evaporative cooling is not possible in a closed system so additional cooling is
required along with a mixing mechanism that serves that same function as the paddlewheel in the
open pond. To maintain adequate light levels, regular cleaning of the reactor is necessary. PBRs
are better able to maintain stable, long term monocultures, but if waste streams are utilized for
nutrients this ability is diminished. PBRs are also more difficult to scale up than open ponds as

6
mixing and gas exchange of carbon dioxide and oxygen become more challenging at large
volumes (US DOE, 2010).
Figure 2 Photobioreactor design (Chisti, 2007)
2.1.2 Resource Use Characteristics
Algae have attracted considerable interest as a biofuel feedstock due to a variety of
promising attributes. The characteristics that set it apart from conventional feedstocks include
high per acre productivity; being a non-food based feedstock; the ability to use otherwise not
productive land; the ability to use a variety of water resources including fresh, brackish, saline,
and wastewater; the production of both biofuels and valuable co-products; and potential
recycling of CO2 and other nutrient waste streams (US DOE, 2010). Because algal biofuels have
not yet been produced at commercial scale there is considerable uncertainty regarding potential
benefits and costs and their magnitudes, but there have been many studies attempting to provide
estimates, as will be discussed throughout this section.
There are three types of algae that can be used as a biofuel feedstock: microalgae,
macroalgae (seaweed), and cyanobacteria (which are bacteria, not algae, but were formerly
known as blue-green algae). Microalgae (hereon referred to simply as algae) are most
commonly used and are the feedstock that will be discussed in this paper. Oil yields from certain
strains of algae are projected to be 60 times higher than soybeans, 15 times higher than jatropha,
and 5 times higher than oil palm per acre of land per year, lending itself well to biodiesel

7
production (US DOE, 2010). In terms of land use, the amount of land necessary for cultivating
algae will vary regionally, but the consensus is that algae is less land intensive than other biofuel
feedstocks. Clarens et al. (2010) found that algae production uses land 3.3 times more efficiently
than corn (if all biomass was used in biofuel production), 4.3 times more efficiently than
switchgrass, and 5 times more efficiently than canola. For the corn estimate, if only the kernel
was harvested, roughly twice the amount of land would be needed to grow the same amount of
biomass (Clarens et al., 2010). Perhaps a more useful comparison is with soybeans, currently the
primary biodiesel feedstock in the US. Algae cultivation could use as much as 100-300 times
less land area per unit yield than conventional soybean production (Williams et al., 2009). This
large reduction in needed land area can be attributed to the higher lipid content of algae with
estimated yields of 1,000-6,500 gal/acre/yr as compared to soybeans which produce on average
48 gal/acre/yr and are grown largely for their meal (US DOE, 2010).
Looking at water use, algae production is expected to require less freshwater than
conventional soybean production since algal cultivation can utilize saline and waste waters, but
freshwater is still necessary to replace water lost to evaporation (Williams et al., 2009). Over the
whole production process the measure of energy return on water invested (EROWI) for algal
biodiesel ranges from 0.05-1.0 and 0.5-1.1 MJ/L for open and closed systems, respectively.
Most traditional biofuels such as corn ethanol and soy diesel have EROWIs of 0.1 – 0.2 MJ/L
(Subhadra & Edwards, 2011).
Growing algae provides an opportunity for nutrient recycling via the utilization of waste
streams such as flue gas and wastewater. Using municipal wastewater effluent as a source of
nutrients has been found to have both environmental and economic benefits. One analysis found
that coupling algae production with conventional activated sludge effluent reduced the energy

8
required for algal fuel production from 300 GJ to 24 GJ by avoiding the use of chemical
fertilizers (Sturm & Lamer, 2011). This avoidance of synthetic fertilizers has also had benefits
beyond reduced energy use, such as avoided acidification, eutrophication, and damage to human
health (Soratana & Landis, 2011). Using carbon dioxide from waste streams is another method
for recycling nutrients. Sources would likely be stationary sources such as cement plants,
fermentation plants, and flue gas from fossil fuel-fired power plants (Pate et al., 2011). While
this would have the dual benefit of boosting algal growth and decreasing CO2 emissions,
acquiring the amount of CO2 needed would be challenging (Pate et al., 2011; Chisti, 2007).
2.1.3 Economic Costs of Production
The economic costs of producing algae for biofuels are fairly uncertain since a
commercial scale plant does not yet exist (ABO, 2012a). A primary factor in the cost uncertainty
is that open ponds and closed PBRs have significantly different capital and operating costs.
Open ponds have several advantages over PBRs, including easy scalability, lower construction
and maintenance costs, the ability to integrate wastewater treatment, and low energy inputs.
Open ponds also have their challenges, such as high risk of species contamination, lower
productivity, higher harvesting costs, and using large amounts of water to make up for surface
evaporation (Shen et al., 2009). PBRs tend to be more efficient than open ponds but have a
much higher cost. Volume-based construction costs are 10-25 times higher for PBRs. With
associated harvesting costs, an estimated low-end capital investment of $180 million would be
required, seven times the amount needed for an open pond system. The advantages of this more
expensive system include reduced risk of species contamination, more control over growing
conditions, and higher biomass yields (Shen et al., 2009). Both growth systems are being

9
researched and each has its advantages, but which one will win out, if one does, has not yet been
determined.
There are a number of complicating assumptions other than which growth process to
model in determining the costs of algae production, including rate of productivity, oil content of
the algal cells, if recycled resource streams are used, costs of inputs, and whether conversion to
biodiesel is included, among many others. Variations in these assumptions have led to cost
estimates that span nearly two orders of magnitude from $0.92-42.60/gallon of biofuel produced
(Sun et al., 2011). A recent study by Sun et al. (2011) set out to address the disparate cost
estimates by harmonizing the assumptions of twelve selected studies and adjusting the estimates
based on a common framework that was developed. Once the results were normalized, the range
of the estimates was reduced significantly to $10.86-13.32/gallon of algal oil produced.
The cost of the algal oil before it is converted to biodiesel can be roughly compared with
crude oil and soybean oil. The energy content per barrel of crude petroleum, soy, and algal oil is
similar with energy densities of 41.9 MJ/kg, 39.6 MJ/kg, and 37.6 MJ/kg, respectively (Supple,
2007; Altin et al., 2001; Weyer et al., 2010). For algal oil to be economically viable, multiple
studies have predicted that the cost of crude oil will need to be greater than $100-110 per barrel
(Chisti & Yan, 2011; Pienkos & Darzins, 2009). However, based on the Sun et al. study, even
the low estimates for the cost of algal oil at $10.86/gal would mean that a barrel would cost
$452.12. This is more than four times more expensive than soybean oil with projected
production costs for 2011 of $1.94-2.35/gal, or $81.48-98.70/bbl (Radich, 2004). In addition to
the high cost of the raw algal oil, the refining and conversion process is thought to add about
$1/gal (Gallagher, 2011).

10
Shen et al. (2009) created an economic model (see Figure 3) to compare the value of
crude oil with the value of algal biomass ($/ton). The model assumes that the algal lipids are
used for biodiesel production and the leftover biomass is converted into biogas via anaerobic
digestion. It uses the energy outputs of crude petroleum (Epetroleum), algal biodiesel (Ebiodiesel), and
the combustion of its byproducts (Ebiogas), as well as the estimated volume of the biogas (q), the
price per barrel of petroleum (X), the yield of biodiesel from algal oil (y), and the lipid content of
algae (w) to calculate an acceptable price for algal biomass (Z) (Shen et al., 2009). For example,
the model finds that for crude oil prices of $90/bbl, which is somewhat close to current prices
(US EIA, 2012a), and a 60% lipid content, algal biomass can be competitive if produced at about
$320/metric ton. For a more mid-range lipid yield of 30%, the acceptable price of the biomass
was closer to $220/metric ton. These calculated acceptable prices from the model are far from
the current production cost of algal biomass, however, which is around $3,000/metric ton (Chisti,
2007).
Figure 3 Competitiveness of microalgal biomass depends on its lipid content and the price of
petroleum (Shen et al., 2009)

11
Although the cost of producing algae is currently not economically competitive with
crude oil or other biodiesel feedstocks, the production of co-products could help improve the
economic outlook by providing additional sources of revenue. Potential co-products include
hydrocarbons, alcohols, biogas, nutraceuticals (dietary supplements), animal feed, fertilizers,
industrial enzymes, bioplastics, and surfactants (US DOE, 2010). Some of these co-products
have large potential worth as value-added products. A common assumption for algal oil content
is in the range of 30-50% which leaves 50-70% of the algal cell as biomass. This biomass
contains valuable proteins which can be used for animal feed and are currently priced around
$800-2,500 per ton (Amaro et al., 2011). Carbohydrates also make up a large fraction of the
residual biomass. These carbohydrates can be converted into simple sugars and fermented into
ethanol in a process similar to a dry grind for corn ethanol. For every 24 kg (1,000 MJ) of algal
biodiesel that are produced, 28.1 kg of carbohydrates and cellulosic co-products are also
produced (Sander & Murthy, 2010). Other potential high value co-products include omega-3
fatty acids and glycerin. Table 2 below summarizes prospective markets for a few products that
can be derived from algae (Subhadra & Edwards, 2011). Although using algae as a biofuel
feedstock has a number of potential benefits including their high growth potential, non-
interference with food crops, utilization of waste streams, etc., some market analysts believe
successful commercialization of algal biofuel will depend more on the development of such
high-value co-products (Singh & Gu, 2010).

12
Table 2 Prospective markets and substitute products for algal meal, omega-3, and glycerin in USA
(Subhadra & Edwards, 2011)
2.1.4 Scale-Up Potential
Beyond the technical and economic limitations of growing algae for biofuel, another
critical consideration is where to site algae production. If only technical limitations are
considered, growth systems can be located anywhere in the United States, but economic
feasibility is determined by the availability of adequate sunlight and a suitable climate. While
still important for PBRs, these considerations are less restrictive since artificial light and heat
could be used in a closed system although it would increase costs. The critical issue is the length
of the economically viable growing season for the particular strain of algae being used. For an
open pond that means the length of time between the last killing frost in the spring and the first
killing frost in the fall. For PBRs, the growing season is limited by the energy and costs required
to maintain an adequate internal temperature throughout the seasons (US DOE, 2010). Other
siting issues include the availability of water, its salinity, and the proximity of waste streams for
both water and carbon dioxide if the potential benefits of recycled inputs are to be capitalized on.
The following maps in Figure 4 show areas of the United States that have the appropriate climate

13
for open ponds and then within that area the locations near both waste water and carbon dioxide
sources (US DOE, 2010).
Figure 4 Rough scoping assessment of preferred site locations for outdoor algae production (US
DOE, 2010)
To assess the actual potential of large-scale algae production, Pate et al. (2011)
performed an analysis to determine resource demand implications of a few algal biofuel scale-up
scenarios. The authors assessed the demand for land, water, nutrients (nitrogen and phosphorus),
and carbon dioxide that is projected to be required for algal oil production target levels of 10
billion gallons per year (BGY), 20 BGY, 50 BGY, and 100 BGY for four different geographical
regions of the United States. The production levels between 10-50 BGY represent the volume of
bio-oil feedstock required to meet 15-80% of total diesel fuel demand in the United States. The
100 BGY scenario would provide sufficient feedstock to more than meet the total combined
demand from US diesel and aviation fuel. The four regions analyzed in this study were
identified as the Southwest, Midwest, Southeast, and Nineteen Lower-Tier State Regions (see
Figure 5) (Pate et al., 2011).

14
Figure 5 Regional resource assessment for scaling up algae production (Pate et al., 2011)
In terms of land use, the study found that the areas identified as the Southwest and the
Nineteen Lower-Tier State Regions were more able to accommodate the demands for algae
cultivation than the Midwest and Southeast Regions. Looking at water requirements, the
findings suggest that sustainable use of freshwater in open systems will likely be problematic for
production levels beyond 10 BGY, and even that amount may be unattainable in the Midwest
and Southeast Regions. Also at the lowest algal oil production level of 10 BGY, assuming a
50% lipid content for the algae cells, the nitrogen demand would represent 44% of the total US
consumption from ammonia and 20% of the total US consumption of phosphorus from
phosphate rock in 2006. As the lipid content decreases, the proportion of US consumption of

15
nutrients required for algal growth increases. Although a purported benefit of using algae as a
biofuel feedstock is that it does not interfere with food production since it can be grown on non-
arable land, the authors expect that this type of competition for fertilizer with other agricultural
uses would have an indirect and unintentional impact on food prices (Pate et al., 2011). This is
where the contribution of utilizing wastewater high in nutrients could be crucial to the successful
commercialization of algae.
The final input Pate et al. (2011) assessed was carbon dioxide. As mentioned above if
flue gas is to be used it would likely come from stationary sources, and while this would both
boost algal growth and make the resulting fuel carbon neutral, it will be challenging to acquire
the amount of carbon dioxide needed. Pate et al. found that the required quantities of carbon
dioxide approached or exceeded the total daylight hour emissions from all stationary sources in
each region assessed except the Nineteen Lower-Tier State Region at the 10 BGY production
level. Even that scenario, however, would require nearly half of the daylight emissions in the
region which is not projected to be feasible or affordable. The authors assumed that only the
daylight hour emissions could be utilized for biomass growth since they were considering open
ponds which require sunlight for algal growth (Pate et al., 2011). The study concludes by saying
that it seems that carbon dioxide and nutrient requirements (both nitrogen and phosphorus) will
likely be the major constraints for photosynthetic algal biofuel scale-up in the United States as
aggregate production of the feedstock reaches the 10 BGY level. They believe that
commercialization of algal biofuels could make a significant contribution to the US fuel supply if
used as part of a broader national renewable portfolio standard (Pate et al., 2011).

16
2.2 Current Policy Framework
There are currently multiple federal biofuel policies in place, but there are none that
specifically incentivize algal fuels. The two primary advanced biofuels incentives are the
Renewable Fuel Standard (RFS) and the Cellulosic Biofuel Producer Tax Credit.
The RFS was initially introduced in the 2005 Energy Policy Act, but it was reformulated
into the more aggressive version it is in today by the Energy Independence and Security Act of
2007 (40 CFR 80 Subpart M). It requires that on an annual average basis the transportation fuel
sold in the United States contains at least the applicable volume of renewable fuel set for that
year. The RFS began in 2006 and by 2022 36 billion gallons per year total of renewable fuels
are required to be sold. There are four categories of renewable fuel: conventional renewable
fuels (e.g. corn grain ethanol), cellulosic biofuels, biomass-based diesel, and other advanced
biofuels. Except for conventional renewable fuels, which are capped at 15 billion gallons per
year in 2015, the volume mandates for the fuels ramp up over time so that by 2022 the US is
required to use 16 billion gallons per year of cellulosic biofuel, 1 billion gallons per year of
biomass-based diesel, and 4 billion gallons per year of other advanced biofuels (US DOE EERE,
2011b). Algal fuel could be included in the category of biomass-based diesel or other advanced
biofuels.
The Cellulosic Biofuel Producer Tax Credit, created in the Food, Conservation, and
Energy Act of 2008, is designed to provide incentives for advanced biofuels, but only those
made from cellulose (Renewable Fuels Association, 2011). Under this tax credit, cellulosic
biofuel producers may be eligible for a tax incentive up to $1.01 per gallon of cellulosic biofuel
that is sold or used. If the cellulosic biofuel also qualifies for alcohol fuel tax credits, the amount
is reduced to $0.46 per gallon if the biofuel is ethanol and $0.41 per gallon if it is not ethanol.

17
Under the current law, only cellulosic biofuel produced after 2008 and before 2013 is eligible
(US DOE EERE, 2011a). This tax credit would not apply to algal biodiesel since algae is not
considered a qualified feedstock.
Tax credit policies mainly focus on achieving cost competitiveness with conventional
fuels once a fuel is in production. There have been multiple attempts to pass legislation that
would offer such incentives to algal fuels, but none have been passed. The Algae-based
Renewable Fuel Promotion Act has been introduced in Congress three times, in 2009, 2010, and
2011 (S.1250, H.R.4168, and S.748, respectively). The bill would have modified the definition
of cellulosic biofuel for the purposes of the Cellulosic Biofuel Producer Tax Credit and Special
Depreciation Allowance for Cellulosic Biofuel Plant Property to mean any liquid fuel which is
derived solely by, or from, any lignocellulosic or hemicellulosic matter that is available on a
renewable or recurring basis and any cultivated algae, cyanobacteria, or lemna. In 2010 the
introduced legislation did pass the House but no action was taken in the Senate. In both 2009
and 2011, the last and only action taken was referral to the Senate Committee on Finance.
3. Methodology
Algal biofuel is being actively researched and developed, but “the industry remains in a
stage of technological development focused on reducing costs” (Concentric Energies & Resource
Group, 2010). This paper utilizes case study analysis to inform the discussion surrounding algal
biofuels by learning from history to determine what might drive it forward. First, theoretical
models of innovation, path dependence, induced innovation, and technological innovation
systems, will be discussed. Next, the innovation pathways for first generation biodiesel (from
soybeans) and solar photovoltaic cells (PV) in the United States will be examined in the context

18
of these pathways and systems as cases where innovation has occurred and the energy sources
are being used. These case studies were chosen for the following reasons:
1. Biodiesel is a likely end-product of algae so to capture the liquid fuel component
of algal products, first generation biodiesel will be examined.
2. Algae growth requires solar energy and land so to capture the harvesting of solar
energy and non-agricultural land use components of producing energy, solar PV
will be analyzed.
The factors that are found to be the key drivers in moving these technologies along the pathway
to commercialization will be identified using the technological innovation system (TIS)
framework, and these factors will then be examined in the context of innovation for algal biofuel
to inform future development.
Literature was primarily collected through Google Scholar searches. For the background
on algal biofuel, search terms such as “algal biofuels,” “algae for biofuel production,” and “next-
generation biofuels” were used. Sources for the models of innovation were acquired through
recommended textbooks and using search terms such as “technology innovation,” “energy
innovation,” “innovation pathways,” and “innovation systems.” This search resulted in the
identification of the technological innovation system (TIS) literature that frames the case study
analysis. Literature for the case studies was found using search terms such as “biodiesel
innovation,” “biodiesel history,” “biodiesel commercialization,” “solar PV innovation,” “solar
PV history,” and “solar PV commercialization.”
4. Analysis
The analysis will take shape in multiple steps. First, theoretical models of innovation will
be described. Second, the TIS theory that will be used to frame the case study analysis will be

19
introduced and its application discussed. Then the biodiesel and solar PV case studies will be
examined. As the innovation processes for these technologies are outlined, innovation system
functions will be identified and conclusions will be drawn regarding the significance of the
different functions in each case. Using the information gained from the case study analysis, the
final step will be applying the functions identified as being important drivers in energy
technology innovation to algal biofuel.
4.1 Theoretical Models of Innovation
The following two theoretical models capture the economic and technical aspects of
development. These models were chosen because they are two major theories of innovation.
One limitation of this analysis is that it is outside the scope of the paper to consider more
theoretical models. Social and political aspects of innovation are also considered in the case
studies.
4.1.1 Path Dependence
One theoretical model of innovation is path dependence, defined by Sterman (2000) as “a
pattern of behavior in which small, random events early in the history of a system determine the
ultimate end state, even when all end states are equally likely at the beginning. Path dependence
arises in systems whose dynamics are dominated by positive feedback processes.” These
positive feedbacks can cause certain patterns or structures in the system to be self-reinforcing
such that an industry characterized by increasing returns, chance events within firms in the
industry, or spillover from unrelated political, technical, or social events early on can give one
technology an advantage and drive the adoption of a technology with inferior long-run potential
(Ruttan, 2001; Sterman, 2000). Once a dominant design or standard has been adopted the costs
of switching can be prohibitive, leading to technological lock-in. Other factors that can

20
contribute to this lock-in are availability of complementary goods and compatibility with the
prevailing system (Sterman, 2000). See Figure 6 for an illustration of a path dependent system.
Figure 6 Path dependence arises in systems with positive feedback (Sterman, 2000)
This figure illustrates a feedback system as if it were a bowl containing a ball. The figure on the
left depicts a system with a negative feedback which is a balancing loop: in a bowl setting right-
side up the ball can be pushed in any direction, but it will eventually return to its starting point.
This is not the case with the system on the right, however, which has all positive feedbacks and
is a reinforcing loop. If the bowl is turned upside down and the ball placed on top, disturbing the
ball would cause it to roll off. The direction that the ball is initially pushed determines its end
point; in other words, the system is path dependent. This path dependence can be seen in energy
when looking at reliance on fossil fuels. Our current energy choices have been shaped by
historical developments of economies of scale, technical compatibility, and industrial networks,

21
among other factors, that have reinforced the use of fossil fuels and locked-in the energy source
(Ahman & Nilsson, 2008).
Technological lock-in due to path dependence can persist for some time, but it is not
necessarily permanent. Arthur (1994) discusses how negative feedbacks that work to stabilize
the economy do not always exist. Positive feedbacks due to increasing returns to scale can make
for many possible equilibrium points with no one point being the “best.” Once a particular path
is selected by random economic events, that path may become locked in regardless of the
advantages of alternative paths (Arthur, 1994). If economies of scale decrease and profits
decline, however, still growing demand might focus scientific and technical effort on breaking
the barriers that locked the technology into an inferior or obsolete trajectory (Ruttan, 2001).
According to Ruttan (2001), this effort should be supported by a central authority (e.g. the
federal government) to ensure that sufficient resources are devoted to alternative technologies to
help prevent lock-in or break out of it should it occur. Involvement by a central authority might
not necessarily be required to overcome lock-in, however. Actions by industry members can
also cause the course to change, as described by the theory of induced innovation.
4.1.2 Induced Innovation
Induced innovation is a theoretical model of innovation that emphasizes the impact of
changes in the economic environment on the rate and direction of technical change (Ruttan,
2001). There are three different perspectives from which the economic changes and the resulting
effect on innovation can be viewed. One is the demand-pull perspective which highlights the
relative importance of growing market demand on the supply of knowledge. Another
perspective is macroeconomic or growth theory. This approach attempts to explain the tradeoff
between labor and capital in enhancing technological change when faced with rising wages. The

22
third perspective is microeconomic and focuses on changes in the relative prices of factors of
production; these changes are seen to spur innovation and invention by minimizing the use of the
factor that has become relatively more expensive (Ruttan, 2001).
Weiss & Bonvillian (2009) succinctly summarize Ruttan’s induced innovation model:
In brief, this theory holds that the technology in use in any economic sector – and, given
enough time, the direction of development and research – responds to changes in the
market, for example to price signals by minimizing the use of expensive inputs and
maximizing the use of inexpensive ones. By extension, the model would predict that
technology and technological innovation would also respond to the policy environment,
for example by improving worker and product safety and decreasing pollution as policies
in these areas are tightened.
This theory is based on the idea that new products use existing technologies to meet new market
demands rather than building on basic research such that incremental gains are achieved rather
than radical changes in technology. As the market for the new product develops, competitors
enter and producers are forced to improve the product and lower the cost. These improvements
might eventually be limited by the current understandings of science and technology and require
further investment in research. The model is concerned not just with the evolution of individual
technologies but also with the aggregate characteristics of the technologies in use within a given
branch of an economy (Weiss & Bonvillian, 2009).
Weiss & Bonvillian (2009) applied the induced innovation model specifically to energy
technology and stated that if the price or policy environment clearly moves toward more
expensive energy, like in the 1970s, technology will respond throughout the economy. How fast
the response is depends in large part on the size and rate of return of the necessary investments.
The authors then categorized the varying degrees of response. The first category is quick, simple
changes in behavior such as driving less and performing basic retrofits. Second is investments in
capital equipment for technologies that can be quickly brought to market or are established in

23
niche markets, such as wind turbines. Third is adaptation through technologies that require
significant investment and development before full-scale implementation and deployment is
possible. The fourth and most drastic category of response is long-term investments by both the
public and private sectors in research, development, and demonstration of new technologies
(Weiss & Bonvillian, 2009).
4.2 Technological Innovation Systems
One way to analyze innovation processes is using an innovation system framework.
According to Bergek et al. (2008), a system is defined as a group of components serving a
common purpose or working towards a common objective or overall function. An innovation
system then is the actors, networks, and institutions that contribute to the overall function of
developing, diffusing, and utilizing new products and processes. In such a system, there can be
multiple interacting and competing forces but all affect the research, development, and
deployment process. If the new product or process is a technology, the concept of the innovation
system can be specified such that a technological innovation system (TIS) is defined as the
“socio-technical system focused on the development, diffusion, and use of a particular
technology (in terms of knowledge, product, or both). TISs do not only contain components
exclusively dedicated to the technology in focus, but all components that influence the
innovation process for that technology” (Bergek et al., 2008). The underlying idea behind this
approach is that the “determinants of technological change are not (only) to be found in
individual firms or in R&D networks, but also in a broader social structure in which the firm as
well as R&D networks are embedded” (Suurs & Hekkert, 2009).

24
Hekkert et al. (2007) proposed seven functions of TISs, where a function is an activity
that contributes to the goal of the innovation system (Table 3). The first is Entrepreneurial
Activity. Entrepreneurs can be new entrants to the market seeking business opportunities or
incumbent firms wanting
to take advantage of new
developments. Their role
is to turn the potential of
new knowledge, networks,
and markets into concrete
actions. The risks taken
and experiments
performed create
knowledge about how the
technology functions in
different settings and how
consumers, government,
competitors, and suppliers
react to the technology.
The second
function is Knowledge
Development and includes
“learning by doing” and
“learning by searching.”
Table 3 Technological innovation system functions (Suurs &
Hekkert, 2009)

25
Learning by doing involves performance improvements due to production experience or capacity
expansion, whereas learning by searching is more a result of R&D activities (Berglund &
Soderholm, 2006). Indicators of such learning include R&D projects, patents, investments in
R&D, and increases in technological performance.
Third is Knowledge Diffusion through networks or, in other words, the exchange of
information. This exchange is particularly important in a context where R&D is interacting with
government and the market so that policy decisions are consistent with current technical
knowledge and R&D priorities are reflective of current norms and values.
The fourth function in a TIS is Guidance of the Search which refers to the activities
within the system that positively affect the clarity of the specific wants among the users of the
technology. This guidance is typically an interactive and continual process between government
and market forces as well as between technology producers and users. This function is
particularly important in a world of limited resources to help focus future investments.
Fifth is Market Formation. In order to help new technologies compete with embedded
ones, the creation of protected spaces or niche markets is important to allow actors in the system
to learn about the new technology and develop expectations.
Sixth is Resource Mobilization, including both financial and human capital. Sufficient
resources need to be allocated to make knowledge production possible.
The seventh and final function is Support from Advocacy Coalitions. Embedded
technologies have vested interests so advocacy groups have to get the new technology on the
governmental agenda and lobby for resources. By doing so, a sense of legitimacy for the new
technological trajectory is created (Hekkert et al., 2007).

26
These functions can interact in a variety of ways, but Hekkert et al. (2007) identified
three likely “motors of change” depicted in Figure 7. One trigger that can start a virtuous cycle
of innovation is Guidance of the Search, particularly government goals that are set after
identifying a social problem, such as environmental damage, in an attempt to correct or limit the
problem. Once the goals are set, new resources might be made available which can lead to
Knowledge Development and increasing expectations about technological options (see Motor C).
Another trigger can be lobbying by entrepreneurs (Support from Advocacy Coalitions) in an
effort to make economic conditions more favorable for technology development. Lobbying
focused on increased R&D resources might lead to higher expectations (Motor B) whereas
lobbying for Market Formation (Motor A) can help level the playing field, boosting
Entrepreneurial Activity, Knowledge Formation, experimentation, and potentially even more
lobbying (Hekkert et al., 2007).
Figure 7 Motors of change in TISs (Hekkert et al., 2007)
In this analysis, the TIS framework will be used to analyze two case studies of energy
technology innovation, first generation biodiesel and solar PV cells. These case studies are

27
relevant to algal biofuel because 1) biodiesel is one likely product that can be produced from
algae, and 2) solar PV farms represent the solar energy use and the non-agricultural land use
components of growing algae. The functions that played a primary role in the processes of
innovation for these technologies will be identified and compared to determine which have most
significantly influenced these technologies, and these findings will then be applied to the case of
algal biofuel. To help identify the functions of a TIS, Suurs & Hekkert (2009) provided types of
events that serve as indicators for the various functions as shown in Table 4.
Table 4 Event types as indicators of innovation system functions (Suurs & Hekkert, 2009)
Events can have characteristics that make them seem as though they could indicate
multiple system functions, and the differences between some of the event types can be subtle.
For example, if a market is created by government through a fleet requirement that would be
considered Market Formation. If a market is created by industry, such as the use of solar PV
cells in calculators, that is considered to be Entrepreneurial Activity. If there is a government
policy that sets target production levels, such as the Renewable Fuel Standard, it is Guidance of

28
the Search. If a policy provides tax incentives, on the other hand, it is Resource Mobilization.
Explanations will be provided throughout the case studies for potentially ambiguous events.
The more influential system functions for each case study will be depicted using the
motors of change diagram from Hekkert et al. (2007). In order to do so, the diagram needed to
be adapted to fit the language of this analysis (see Figure 8). The original diagram (Figure 7)
uses slightly different wording to identify the system functions so the diagram was changed to
use the system functions as defined in Table 3. Two substantive changes were also made. One
was combining “Expectations” with “Guidance of the Search” as expectations are one of the
event types used to identify the Guidance of the Search function (see Table 4). The other was
adding Knowledge Diffusion in what seemed to be a logical place as it was not included in the
original figure. The adapted TIS is used to analyze the biodiesel and solar case studies below.
Figure 8 Adapted motors of change
29
4.3 Biodiesel Case Study
Biodiesel is one of many potential end-products that can be derived from algae, but it is
the one considered to have the largest potential market share (ABO, 2012a). For this reason, the
first case study will examine the innovation process of first generation biodiesel. First
generation biodiesel is produced using vegetable oils, such as soybean, rapeseed, and palm,
which are commodities that are also used for food (Naik et al., 2010; Knothe, 2005). Using such
vegetable oil feedstocks can also result in the co-production of high protein animal feeds (IEA,
2008). In the United States, soybean oil is the primary feedstock (Schmidt, 2007). The term
“biodiesel” did not appear in technical literature until 1988, but its history began almost a
century before (Knothe, 2005). Vegetable oil was first used to power a diesel engine in 1900 at
the World’s Fair in Paris; however, petroleum became the dominant source of transportation fuel
due to its low cost, availability, and high energy density, leading to the development of
petroleum diesel as the primary fuel for diesel engines (Songstad et al., 2009; Pousa, et al.,
2007). Neat vegetable oils (vegetable oils unmixed with anything else) were not used again to
fuel diesel engines until World War II, and even then they were used mostly in emergency
situations. Around this time vegetable oils were also getting attention due to the fact that they
could provide countries, particularly those with tropical colonies, with a certain degree of energy
self-sufficiency. This interest largely stagnated as the war ended and petroleum diesel again
became a readily available, low cost fuel source (Knothe, 2005). New enthusiasm for renewable
fuel sources, including biodiesel, was sparked by the international petroleum crises in the 1970s,
such as the OPEC oil embargo, as well as increasing concerns about the depletion of non-
renewable resources and environmental issues (Pousa et al., 2007). This history applies
internationally, but the paths forward for biodiesel differ among countries.

30
The case study analysis will start at this point in the story and look specifically at the
United States. The TIS functions as identified by the event types listed in Table 4 will be stated
in parentheses at relevant junctures followed by a qualitative assessment of the importance of
each function as it came into play during the innovation process. The occurrence of each factor
in the narrative is summed and the running total displayed. The frequency of occurrence should
not be equated to importance but rather serve as a way to track the TIS functions. This analysis
is based on the story of innovation for first generation biodiesel as told by a select number of
sources and as such is limited to the events reported there.
After World War II as population grew and industry along with it, pollution issues came
onto the public radar and the American public formed a set of expectations regarding the quality
of their surroundings (Guidance of the Search 1). After the oil crises of the 1970s there was an
increased desire for independence from imported energy sources (Guidance of the Search 2), and
the US Department of Agriculture and other researchers began investigating vegetable oils for
use as fuel (Knowledge Development 1). The consensus at the time was that vegetable oils were
too viscous to be used in modern diesel engines. Transesterification of the oil was found to make
it suitable as a drop-in fuel, but it was not economical compared with petroleum diesel so
research efforts declined. Also during the second half of the twentieth century, improvements in
agricultural efficiency led to lower food prices for consumers but did not improve the incomes of
farmers. Turning crops into value-added products would be a way for farmers to supplement
their income and also create manufacturing jobs, mostly in rural areas. This was important at a
time when the loss of manufacturing jobs overseas was a growing concern (Guidance of the
Search 3). The combination of concerns regarding environmental damage, job losses, and

31
dependence on foreign oil formed the background in which biodiesel came to have a significant
role as a fuel source (Howell & Jobe, 2005).
The early 1990s saw the first Gulf War, rising energy prices, and a surplus of soybean oil.
Biodiesel was already being produced in industrial quantities in Europe using rapeseed oil, and
the US agricultural community saw an opportunity to turn their surplus into an energy
commodity as well (Entrepreneurial Activity 1) (Schmidt, 2007). This was also a time when
Congress was earnestly looking for alternatives to imported fuels and coincided with the passage
of federal policies throughout the decade that both directly and indirectly encouraged the use of
biodiesel (Howell & Jobe, 2005). First was the Clean Air Act Amendments of 1990 which
mandated the use of alternative or “clean” fuels in regulated truck and bus fleets (Market
Formation 1). (Because the market created with these fleet regulations was established by
government, it falls within Market Formation.) The 1992 Energy Policy Act (EPAct) then set
the goal of supplying 10% of the nation’s energy with alternative fuels by 2000 and 30% by
2010 (Guidance of the Search 4). (This falls within Guidance of the Search because it is a policy
target that sets a general energy goal and is not focused on a particular use such as in regulated
fleets which would make it Market Formation.) At the time, alternative energy supplied less
than 1% of the nation’s energy (Knothe, 2005; Howell & Jobe, 2005). 1992 was also the year
that the National Soydiesel Development Board, now known as the National Biodiesel Board
(NBB), was formed by eleven state soybean commodity groups who were funding biodiesel
research and development programs (Support from Advocacy Coalitions 1). The NBB is a
national trade association that focuses primarily on addressing the technical and regulatory issues
that accompany commercializing a new fuel, and its formation, along with the passage of the

32
1992 EPAct, marked the beginnings of the commercial biodiesel industry in the United States
(Howell & Jobe, 2005).
The NBB played a significant role in building alliances among actors (Knowledge
Diffusion 1) and getting biodiesel ready for commercialization. Its early efforts included
developing ASTM (American Society for Testing and Materials) standards, conducting
emissions testing, maintaining the legal status of the fuel via registration with the EPA, and
completing the Tier 1 and Tier 2 Clean Air Act Amendments health effects testing (Knowledge
Development 2, Support from Advocacy Coalitions 2). NBB and private industry have also
invested over $50 million in biodiesel research, development, and promotion (Support from
Advocacy Coalitions 3, Knowledge Development 3). (Because this money is partially coming
from the NBB, it is considered Support from Advocacy Coalitions. It also falls under
Knowledge Development rather than Entrepreneurial Activity because it is referring to general
investments in R&D rather than projects that specifically have a commercial aim.) During the
early to mid 1990s field demonstrations were successfully conducted (Entrepreneurial Activities
2), heightening interest from government and academia and stimulating further investments and
significant increases in production volumes throughout the decade (Howell & Jobe, 2005).
One obstacle to the goals set forth in the EPAct was that the fuels initially under
consideration for use by the Department of Energy, compressed natural gas, liquefied natural
gas, methanol, and 85% ethanol (E85), would require engines different from the gasoline or
diesel engines in use at the time. Charged with implementing the legislation, DOE required state
and federal government fleets and alternative fuel companies, mostly utilities, to purchase light-
duty vehicles that were compatible with such alternative fuels (AFVs). There was no
corresponding requirement to purchase the alternative fuels, however. Flex fuel vehicles also

33
run on conventional fuels, and as those were more readily available there was little increase in
demand for alternative fuels. The NBB and the American Soybean Association lobbied
Congress to amend the EPAct (Support from Advocacy Coalitions 4), and in 1998 the legislation
was modified to allow the use of alternative fuels that were compatible with conventional
engines in heavy-duty vehicles, such as biodiesel, to count towards the light-duty AFV purchase
requirements (Market Formation 2) (Howell & Jobe, 2005). Another piece of legislation that
year, the Energy Conservation Reauthorization Act of 1998 (ECRA), also provided an incentive
for utilizing biodiesel to meet the EPAct requirements. It allowed the use of 450 gallons of B100
(100% biodiesel) in the form of blends of B20 (20% biodiesel, 80% petroleum diesel) or higher
to count as one AFV purchase; fleets could use this option to meet up to 50% of their
requirement. B20 was still more expensive than petroleum diesel, but it proved to be the most
cost effective compliance option for many fleets, leading to increases in use of the fuel (Market
Formation 3) (Howell & Jobe, 2005). (Because both the 1998 EPAct Amendment and the 1998
ECRA created specific uses for biodiesel to meet government purchase requirements, they fall
under Market Formation.)
In 2000, President Clinton added to the impetus to use biodiesel with Executive Order
13149, Greening the Government Through Federal Fleet and Transportation Efficiency. This
executive order directed all federal agencies to reduce annual petroleum consumption by 20%
compared to 1999 levels by 2005 (Guidance of the Search 5) (National Archives, 2000).
(Because this Executive Order is a broad policy target that could be achieved through various
means and does not specifically call for the use of biofuels, it falls under Guidance of the Search
rather than Market Formation.) The combination of this energy displacement requirement with
the ECRA biodiesel option to meet EPAct requirements added to the appeal of using B20 as it

34
would help achieve both for federally controlled vehicles. It also gave federal vehicles not
covered by the EPAct, such as military vehicles, a reason to use B20 (Howell & Jobe, 2005).
EPA emissions requirements have also led to an increase in the use of biodiesel.
Emissions of hydrocarbons, carbon monoxide, and particulate matter (PM) are regulated, and
biodiesel and biodiesel blends emit less of these pollutants than petroleum diesel. EPA also
promulgated rules specific to diesel engine exhaust emissions. Starting in 2007, the allowable
levels of NOx and PM emissions for on-road diesel vehicles were 90% lower than in 2005.
Sulfur in fuel can interfere with the engine technologies that would decrease those emissions so
starting in 2006 EPA required that all on-road diesel fuel contain less than 15 ppm sulfur
(Howell & Jobe, 2005). Between 2007 and 2014 the low sulfur requirement is being extended to
include non-road, locomotive, and marine engines as well (US EPA, 2011). These regulations
affect biodiesel use because biodiesel from most sources, including soybean oil, contains
virtually no sulfur. Removing sulfur from petroleum diesel, on the other hand, also removes
lubricant compounds from the fuel which are necessary for proper functioning of the engine and
would require replacement with an additive. Biodiesel is one additive that can restore the
necessary lubrication (Market Formation 4) (Howell & Jobe, 2005). (These emissions standards
fall under Market Formation because biodiesel can be used to comply with the regulations,
creating new markets for the fuel.)
Yet another federal policy that significantly increased the incentives for biodiesel was the
2005 Energy Policy Act (Schmidt, 2007). This EPAct provided a variety of tax credits for
biofuels, both ethanol and biodiesel (Resource Mobilization 1). The biodiesel incentives
included a tax credit for alternative refueling property which expired in 2009, a tax credit of
$1.00 per gallon of agri-biodiesel used (biodiesel derived solely from virgin oils), $0.50 per

35
gallon of waste-grease biodiesel used, and $0.10 per gallon to small agri-biodiesel producers
(those that produce less than 60 million gallons of biodiesel annually) up to 15 million gallons,
all of which expired in 2008 (US DOE EERE, 2011b). To give a sense of how much the US
biodiesel industry has grown, see Table 5 for annual production data from the US EIA.
Table 5 Annual US biodiesel production (US EIA, 2012b)
Year Annual Production
(MMgal)
2001 9
2002 10
2003 14
2004 28
2005 91
2006 250
2007 490
2008 678
2009 506
2010 309
2011 655*
* The data for 2011 only includes production from the first ten months of the year.
Private sector efforts, current events, and federal policies have all played a role in the
commercialization of biodiesel in the United States through a system of interacting factors. The
application of the TIS framework to this pathway is summarized in Table 6.
Table 6 TIS functions in US biodiesel innovation
System Function Events
Entrepreneurial Activity Opportunity identification by agricultural community for excess
soybean oil
Field demonstrations
Knowledge Development
Research into producing fuel from vegetable oil
Emissions and health testing sponsored by NBB
R&D sponsored by NBB and industry
Knowledge Diffusion NBB activities and coalitions
Guidance of the Search
Public environmental quality concerns
Desire for independence from imported energy
Job loss concerns

36
1992 EPAct alternative fuel use targets
EO 13149 petroleum use reduction target
Market Formation
1990 Clean Air Act Amendments regulated fleet alternative fuel
use requirements
1998 EPAct Amendments allowed biodiesel use to count towards
1992 EPAct AFV purchase requirements
1998 ECRA allowed biodiesel use to count towards 1992 EPAct
AFV purchase requirements
EPA emissions and low sulfur fuel requirements
Resource Mobilization 2005 EPAct biodiesel subsidies
Support from Advocacy
Coalitions
Formation of the NBB
NBB coordination of testing and maintenance of biodiesel’s legal
status
NBB funding for research, development, and promotion
NBB and American Soybean Association lobbying efforts to amend
the EPAct
Guidance of the Search was a prevalent system function in the innovation process for first
generation biodiesel in the US, primarily through changes in societal expectations and federal
policy targets. With this function playing a central role in the innovation process, it bears some
resemblance to Motor C in Figure 7. Market Formation was also spurred by those federal
policies by mandating the use of alternative fuels in regulated truck and bus fleets, allowing the
use of biodiesel to count towards alternative fuel vehicle purchase requirements to comply with
the 1992 EPAct, and regulating vehicle emissions (see Table 6), crucial factors in the
deployment of biodiesel. Another influential factor was Resource Mobilization. The subsidies
in the 2005 EPAct spurred a large increase in biodiesel production as seen in Table 5. These
three major functions, Guidance of the Search, Market Formation, and Resource Mobilization,
all overlap with government policies.
Support from Advocacy Coalitions (the NBB) and Entrepreneurial Activity by the
agricultural community seeing an opportunity from surplus soybean oil seem to be the two TIS
functions that got the ball rolling down the pathway to commercialization. Without those two
system functions coming into play together relatively near the beginning of the process, not

37
considering the first tests with vegetable oils in the early 1900s, the social desires for better
environmental quality and independence from foreign oil potentially could have led to efforts
going towards some other alternative fuel source, such as compressed natural gas.
The findings from this case study analysis are depicted in the adapted motors of change
diagram from Hekkert et al. (2007). In Figure 9, the filled in ovals mark the three functions,
Guidance of the Search, Market Formation, and Resource Mobilization, that represent events that
have been identified in the literature as being the most influential in the innovation process for
first generation biodiesel in the United States. Two other system functions, Entrepreneurial
Activity and Support from Advocacy Coalitions, also played a significant role but to a lesser
degree, and are indicated by the thick blue outlines. These two functions are representative of
events early in the innovation process that helped get biodiesel off the ground, but then events in
the categories of Guidance of the Search, Market Formation, and Resource Mobilization came to
be more influential. The boxes connected to the filled in ovals summarize the types of events
that occurred for each.

38
Figure 9 Motors of Change for First Generation Biodiesel in the US
One of the primary limitations of this analysis is that the literature might not represent the
complete story of what occurred in the innovation process for first generation biodiesel so it is
possible that some events were left out, were not accurately portrayed, or were over- or
underemphasized. Although some TIS functions did stand out as being more influential than
others, all elements seemed to be important in the system of innovation.
Relating this back to the theoretical models of innovation, induced innovation and path
dependence, both models seem to have held true to a certain degree. The induced innovation
perspective of economic factors leading to a change in technology is applicable when looking at
the focus on soybean oil due to the surplus the US was experiencing. Beyond that, however, the
idea from the path dependence model that involvement by a central authority is needed to move
beyond the currently “locked-in” technology (petroleum diesel) seemed to be foremost. This

39
does tie in with idea from Weiss & Bonvillian (2009) that an extension of induced innovation
theory is that innovation responds to the policy environment, which was clearly seen in this case
study. The predominance of soybean oil as a biodiesel feedstock could also be seen as the start
of another path dependent system. Those perturbations early on in the formation of the system
that made soybeans the feedstock of choice could also be causing a certain degree of lock-in that
other potential biodiesel feedstocks will have to overcome.
Although innovation in biodiesel is still occurring, first generation biodiesel in the United
States could already be considered a success. As a percentage of total distillate fuel oils (diesel
fuels and fuel oils) produced in the US, the amount of biodiesel produced annually has increased
significantly over the past decade. In 2001 biodiesel made up 0.02% of the distillate fuel oil
market with 9 million gallons of biodiesel being produced compared to 38 billion gallons of total
distillate fuel oil (US EIA, 2007). In the first ten months of 2011 biodiesel accounted for 1.34%
of the distillate fuel oil market, an increase of almost two orders of magnitude as production
volumes increased to 655 million gallons and 49 billion gallons for biodiesel and distillate fuel
oil, respectively (US EIA, 2012c). Another measure of success is that biodiesel is now
independent of subsidies as the incentives included in the 2005 EPAct expired in 2008 and 2009.
A third measure is greenhouse gas emission reductions gained over petroleum diesel. Soy
biodiesel emits 59% of the lifecycle greenhouse gas emissions of petroleum diesel, assuming the
feedstock is produced from land already in production (Hill et al., 2006). As a point of
comparison, corn grain ethanol realizes a smaller reduction, emitting 88% of lifecycle
greenhouse gases from conventional gasoline (Hill et al., 2006).

40
4.4 Solar PV Case Study
To incorporate the non-agricultural land use component of algae production into the
analysis, this section examines the innovation process of solar photovoltaic (PV) cells for use on
solar farms. The following provides a basic description of the technology. An individual PV
cell is small and usually produces 1-2 W of power. To boost production, the cells are connected
together into larger units called modules which can in turn be connected together to form arrays
(see Figure 10). The modular nature of PV cells means that systems can be built to meet varying
electric power requirements. PV systems also include structures that orient the cells toward the
sun, an inverter to convert the direct current produced by the modules to alternating current, and
sometimes batteries (US DOE EERE, 2011c). A solar farm, then, is a collection of these
interconnected modules or arrays that generates electricity for distribution on the electric power
grid (Brady, 2011).
Figure 10 Photovoltaic cell configurations (US DOE EERE, 2011c)
The amount of land that would be required if solar PV were to become a major source of
electric power is a topic of debate. The concern is that devoting land to power generation could
displace agriculture and contribute to increases in food prices (Weiss & Bonvillian, 2009).
Arable land need not be used for solar farms, however, as the one of the most relevant siting
factors is the incident solar energy, meaning that desert land can be utilized. Also, the
availability of zero-impact “land” on rooftops would make the actual land-use requirements of

41
wide-scale PV deployment modest when compared with other land uses in the US (Denholm &
Margolis, 2008). One estimate for solar PV farms operating at efficiencies of 12-14% is that
approximately 2% of US land area would be required to supply all of the country’s electricity
needs. In 2006 the US DOE estimated that PV cells were operating around 11-13% efficiency
and as of 2009 were pushing 15%. To put this estimated land use requirement into context, 40%
of US land area is currently allocated to food production (Weiss & Bonvillian, 2009). Another
estimate frames the land use requirement in terms of area needed to meet the full electricity
demand of an average US citizen using only solar PV generation. This study found that 100-200
m2 would be needed, depending on the configuration of the PV system (e.g. horizontal versus a
one-axis tracking array). To provide a point of comparison with biofuels, land used to grow corn
for ethanol exceeds 200 m2 per person in the US (Denholm & Margolis, 2008). Ultimately, the
land requirements for PV power generation are driven by a combination of the available solar
resources and the system configuration (Denholm & Margolis, 2008).
Despite such concerns over land use, globally solar PV has become one of the renewable
energy technologies of choice, behind only wind power (Weiss & Bonvillian, 2009). To see how
this technology gained its relatively prominent place, a look at its history is instructive. As was
done in the biodiesel case study, the TIS functions will be identified based on the event types
given in Table 4 and stated in parentheses at relevant junctures followed by a qualitative
assessment of the importance of each function as it came into play during the innovation process.
The occurrence of each factor in the narrative is summed and the running total displayed. The
frequency of occurrence should not be equated to importance but rather serve as a way to track
the TIS functions. This analysis is based on the story of innovation for solar PV technology as
told by a select number of sources and as such is limited to the events reported there.

42
The French physicist Edmond Becquerel first discovered the photoelectric effect in which
light energy is converted into an electric current in 1839 (US DOE EERE, 2011c). The first
practical PV device was not developed until 1954, however, when researchers at Bell Telephone
Laboratories achieved conversion efficiencies of 5-8%, a significant improvement over the 1%
efficiency that had previously been achieved, moving PV cells from a laboratory interest to a
device with real potential to provide electric power (Knowledge Development 1). Bell’s purpose
in researching solar PV cells was to develop a power supply for their remote telephone signal
transmissions (Entrepreneurial Activity 1), but they actually first used the technology to power
early telecommunication satellites, launching the first in 1962 (Entrepreneurial Activity 2)
(Kazmerski, 2006; US DOE, 2012). In 1959 Hoffman Electronics created a PV cell with an
efficiency of 10% that was made commercially available (Entrepreneurial Activity 3, Knowledge
Development 2). The next major development was in 1970 when Western Electric patented an
anti-reflective coating for solar cells (Entrepreneurial Activity 4, Knowledge Development 3)
(US DOE, 2012). Starting in the mid-1970s, PV devices were increasingly used for remote
commercial power applications such as highway call boxes and railroad crossing signals
(Entrepreneurial Activity 5) (Dracker & De Laquil, 1996).
Much of the early development of solar technology was supported by government. The
National Science Foundation and the Energy Research and Development Administration, which
later became part of DOE, led government R&D efforts (Knowledge Development 4). Private
industry efforts were also significant, but in the 1970s and early 1980s a large percentage of total
funding was from the federal government and focused on demonstration projects to prove
technical feasibility (Entrepreneurial Activity 6, Resource Mobilization 1) (Dracker & De
Laquil, 1996). (Because funding came from government this falls under Resource Mobilization,

43
but because the demonstration projects are carried out by industry and have a commercial aim it
is also Entrepreneurial Activity.) Academic institutions were also contributing to research
efforts with the University of Delaware opening the first laboratory dedicated to solar R&D in
1972, focusing particularly on thin-film PV cells (Knowledge Development 5). That same year,
solar PV cells became the primary power source for approximately 1,000 US and Russian
spacecraft (Market Formation 1) (US DOE, 2012).
The late 1970s and early 1980s saw continued developments in the formation of
government bodies relevant to energy technology research and in PV technology itself. In 1977
in the aftermath of the OPEC oil embargo, the Department of Energy (DOE) and the National
Renewable Energy Laboratory were established. Shortly after, DOE promoted solar PV research
in multiple national laboratories (Guidance of the Search 1, Knowledge Development 6).
(Because the research conducted in national labs is guided by DOE priorities, and these priorities
are set in part by politics and societal desires and expectations, this falls under Guidance of the
Search as well as Knowledge Development). In 1978, a large irrigation project in Nebraska
installed over 100,000 PV cells to power the irrigation pumps (Entrepreneurial Activity 7).
Another major technical development occurred in 1980 when ARCO Solar became the first
company to produce more than one megawatt of PV modules in a year (Entrepreneurial Activity
8) (US DOE, 2012). Private sector investment in solar PV technology during this time was
largely driven by high oil prices and predictions of even higher prices in the future (Guidance of
the Search 2) (Dracker & De Laquil, 1996). Some new investors, particularly European
companies, were also motivated by the environmental benefits of the technology (Guidance of
the Search 3) along with the potential for a growing market in rural electrification projects in
developing countries (Entrepreneurial Activity 9) (Dracker & De Laquil, 1996). (Because rural

44
electrification projects would be using the technology in a new capacity, it is considered a
portfolio expansion and therefore Entrepreneurial Activity.)
Starting in the mid 1980s, government involvement in solar R&D began to decline. One
reason for this was that DOE experienced significant cuts in its research budget during the
Reagan administration. Another contributing factor was the sharp drop in oil prices and
increasing availability of inexpensive natural gas which decreased the pressure to develop
renewable energy technologies (Dracker & De Laquil, 1996). The George H.W. Bush
administration brought a change in approach to solar R&D with an emphasis on public-private
partnerships and cost-share initiatives, instituting programs such as Photovoltaics for Utility
Scale Application, a DOE-industry collaboration (Resource Mobilization 2, Knowledge
Diffusion 1) (Dracker & De Laquil, 1996). Evidence of the success of such programs included
Pacific Gas & Electric’s 1993 installation of a 500 kW PV system to boost reliability at one of its
substations (US DOE, 2012).
Another government effort in the early 1990s was the development of a task force by
Nevada Senator Richard Bryan and the DOE Assistant Secretary to determine how a special
economic zone (SEZ) for the development of cost-effective solar power could be implemented in
southern Nevada. The task force consisted of representatives from the Nevada governor’s office,
state organizations, labor unions, financial institutions, and the solar industry (Knowledge
Diffusion 2). They set a goal of installing 1,000 MW of solar power systems by 2002 and in
1995 created a non-profit entity, the Corporation for Solar Technology and Renewable
Resources, to implement the objectives of the task force (Guidance of the Search 4) (Dracker &
De Laquil, 1996). The Department of Defense was also involved in PV development through its

45
Photovoltaics Review Committee that was tasked with introducing cost-effective PV systems to
military applications (Market Formation 2) (Dracker & De Laquil, 1996).
Collaborative efforts also arose out of the private sector between utilities and PV
companies. The Utility PV Group (UPVG) was formed in 1992 and submitted a proposal to
DOE to install 50 MW of PV systems. UPVG also worked to bring together developers of PV
applications with potential buyers (Support from Advocacy Coalitions 1). At the state level, a
parallel organization was formed called PVs for Utilities (Support from Advocacy Coalitions 2)
(Dracker & De Laquil, 1996). Both groups focused their efforts on encouraging electric utilities
to invest in large PV systems and generally increasing knowledge about PV efficiencies, costs,
and technical logistics (Knowledge Diffusion 3) (Kaplan, 1999). Some utilities have also
implemented solar programs of their own such as offering incentives for customers willing to be
early adopters of rooftop PV systems and creating off-grid tariff systems to expand PV
installations (Resource Mobilization 3) (Dracker & De Laquil, 1996).
The mid 1990s brought another increase in government initiatives to promote solar
power. In 1996 the National Center for Photovoltaics was created to better integrate research
efforts occurring at national laboratories (Knowledge Diffusion 4). In 1997 President Clinton
announced the Million Solar Roofs Initiative with the dual aim of slowing greenhouse gas
emissions and boosting the US solar industry by installing solar power systems on one million
rooftops by 2010. This program built coalitions of private sector firms, electric utilities, builder-
developers, nonprofit organizations, and government entities to facilitate the installation of
rooftop solar systems and awarded grants to these partnerships to aid their efforts (Guidance of
the Search 5, Knowledge Diffusion 5, Resource Mobilization 4) (US DOE, 2012). (Because this
program was designed to create partnerships that would facilitate the installation of rooftop solar

46
rather than creating a new market for solar PV, it falls under Guidance of the Search and not
Market Formation.)
The modular nature of PV technology has also aided its development. The ability of
solar PV to meet wide ranges of energy requirements has allowed it to fill several specialized
market niches in small off-grid applications such as calculators and watches (Entrepreneurial
Activity 10). (Because these markets were established by industry, this falls under
Entrepreneurial Activity.) These markets themselves are also fairly small, but they have served
as building blocks in the growth of the manufacturing, marketing, and service aspects of PV
technology. The economies of scale achieved and improved efficiencies gained helped facilitate
larger applications, as depicted in Figure 11. From the experience gained in these small niche
markets, solar PV was able to expand to larger off-grid applications in remote communities and
distributed grid connections. The final steps are contributing to peak power loads and bulk
power production (Dracker & De Laquil, 1996). This diffusion process illustrates the
importance of niche markets and portfolio expansions, both of which are components of the TIS
framework. Table 7 provides examples of PV applications at varying power levels (IEA, 2006).
In 2000, a milestone was achieved when the company First Solar opened the world’s largest PV
manufacturing plant. This plant could produce 100 MW of PV modules annually, a large
increase over typical manufacturing capacity at the time (Entrepreneurial Activity 11) (US DOE,
2012).
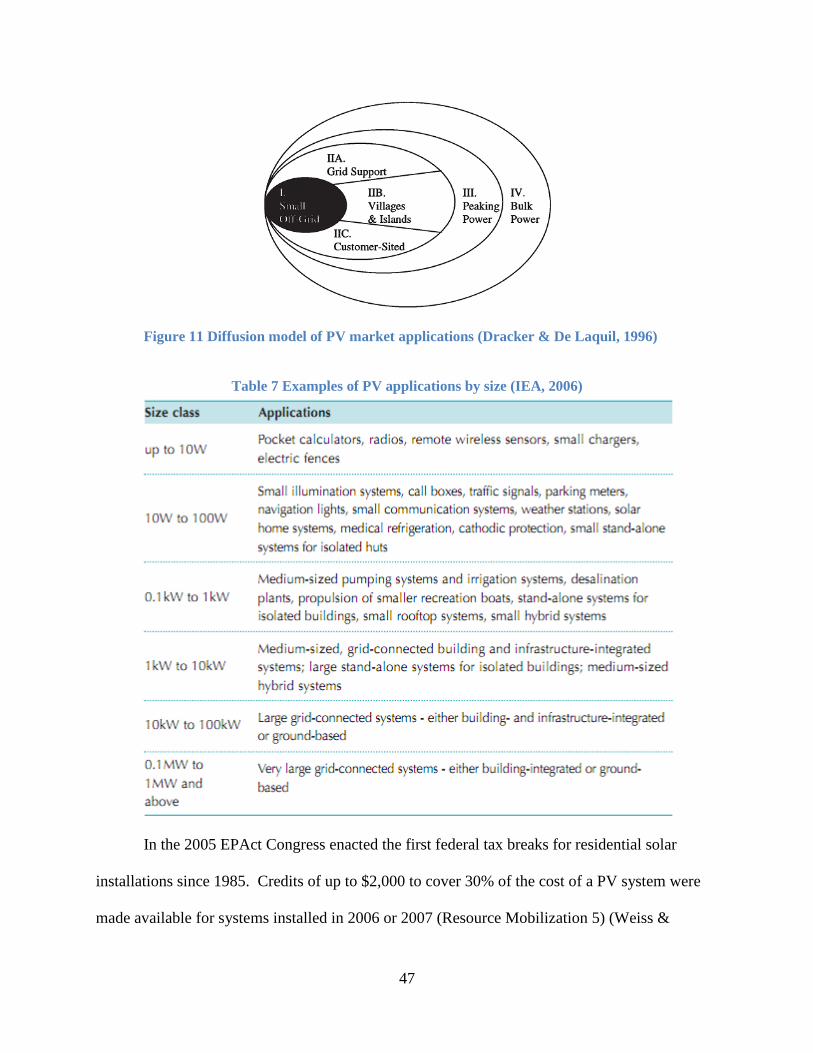
47
Figure 11 Diffusion model of PV market applications (Dracker & De Laquil, 1996)
Table 7 Examples of PV applications by size (IEA, 2006)
In the 2005 EPAct Congress enacted the first federal tax breaks for residential solar
installations since 1985. Credits of up to $2,000 to cover 30% of the cost of a PV system were
made available for systems installed in 2006 or 2007 (Resource Mobilization 5) (Weiss &
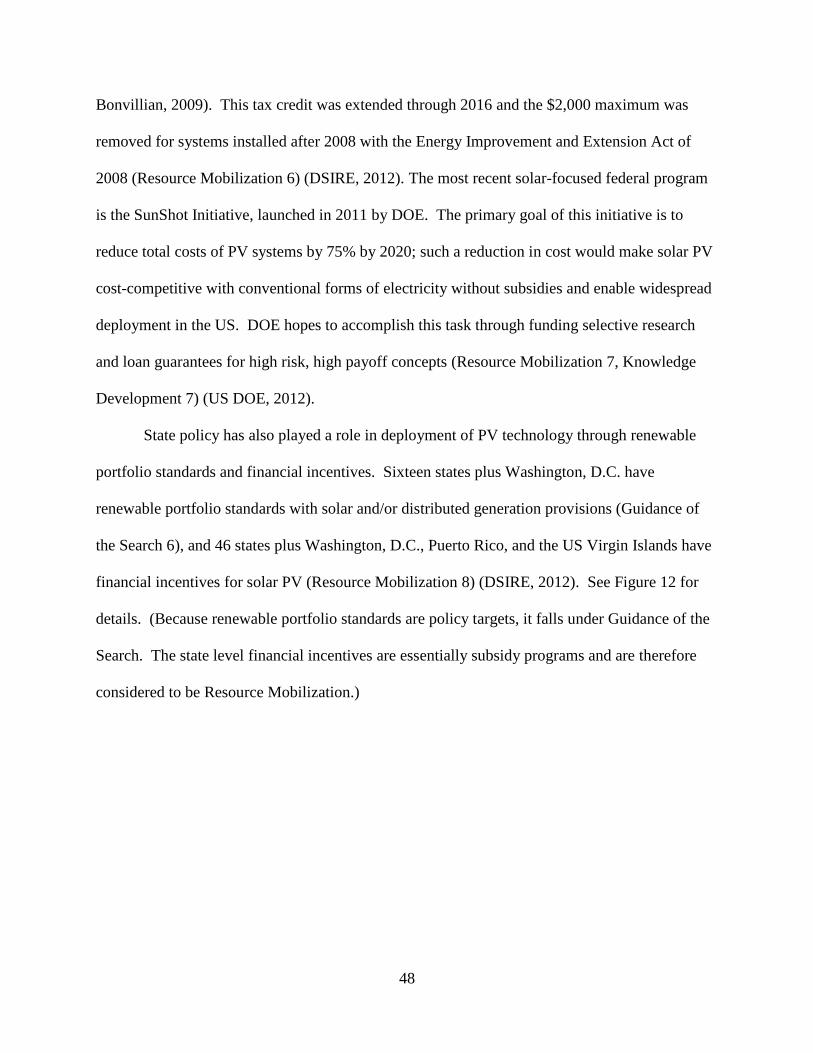
48
Bonvillian, 2009). This tax credit was extended through 2016 and the $2,000 maximum was
removed for systems installed after 2008 with the Energy Improvement and Extension Act of
2008 (Resource Mobilization 6) (DSIRE, 2012). The most recent solar-focused federal program
is the SunShot Initiative, launched in 2011 by DOE. The primary goal of this initiative is to
reduce total costs of PV systems by 75% by 2020; such a reduction in cost would make solar PV
cost-competitive with conventional forms of electricity without subsidies and enable widespread
deployment in the US. DOE hopes to accomplish this task through funding selective research
and loan guarantees for high risk, high payoff concepts (Resource Mobilization 7, Knowledge
Development 7) (US DOE, 2012).
State policy has also played a role in deployment of PV technology through renewable
portfolio standards and financial incentives. Sixteen states plus Washington, D.C. have
renewable portfolio standards with solar and/or distributed generation provisions (Guidance of
the Search 6), and 46 states plus Washington, D.C., Puerto Rico, and the US Virgin Islands have
financial incentives for solar PV (Resource Mobilization 8) (DSIRE, 2012). See Figure 12 for
details. (Because renewable portfolio standards are policy targets, it falls under Guidance of the
Search. The state level financial incentives are essentially subsidy programs and are therefore
considered to be Resource Mobilization.)

49
Figure 12 State financial incentives for solar PV (DSIRE, 2012)
As of 2010, solar power accounted for approximately 1% of the United States’ renewable
energy supply and 0.1% of the total electricity generation capacity. These percentages have
remained relatively constant since 2006 due to overall increases in energy consumption although
solar generation has grown at an average annual rate of 12%. In absolute terms, in 2006 only
two states, California and Arizona, had central station solar generation with a total capacity of
411 MW. In 2010, fifteen states had central station solar generation with a capacity of 888 MW
(US EIA, 2011a). Between 2008 and 2009 US PV industry shipments increased nearly 30%
while the average price per PV cell decreased 34% from $1.94 to $1.27 per peak watt and the
average price per PV module decreased 20% from $3.49 to $2.79 per peak watt (see Figure 13)
(US EIA, 2011b). The US EIA projects that solar generation will continue to grow, obtaining a
nearly 7-fold increase by 2035 due to near-term reductions in system costs with the majority of
that growth occurring in end-use PV (e.g. rooftop solar) (US EIA, 2012d).

50
Figure 13 US PV shipments and prices 2001-2009 (US EIA, 2011b)
Innovation in the US solar PV industry can be attributed to the interplay of a variety of
factors in both the public and private spheres. The application of the TIS framework to identify
these factors is summarized in Table 8.
Table 8 TIS functions in US solar PV innovation
System Function Event
Entrepreneurial Activity
Bell Telephone Lab developed the first practical PV cell intended to
power remote telephone signal transmissions
Bell Telephone Lab used solar PV cells on telecommunications
satellites
Hoffman Electronics’ made PV cells with 10% efficiency commercially
available
Western Electric patented anti-reflective coating
Remote commercial power applications for solar PV
Demonstration projects
Irrigation project in Nebraska
Production of 1 MW of PV modules by ARCO
Rural electrification projects in developing countries
Small off-grid applications for solar PV (watches, calculators)

51
First Solar opened the world’s largest PV manufacturing plant
Knowledge Development
Bell Telephone Lab achieved increased conversion efficiencies of 5-8%
Hoffman Electronics increased the achieved efficiency to 10%
Western Electric developed an anti-reflective coating
NSF & ERDA R&D
University of Delaware opened a lab dedicated to solar R&D
R&D in national labs funded by DOE
SunShot Initiative research
Knowledge Diffusion
Public-private partnerships formed during the first Bush administration
Nevada solar SEZ task force
Utility PV Group & PV for Utilities collaborations
National Center for Photovoltaics created to integrate research
efforts at national labs
Million Solar Roofs Initiative coalitions
Guidance of the Search
DOE research priorities
Expectations of high oil prices
Expectations regarding environmental benefits of solar PV
Nevada solar SEZ task force goals
Million Solar Roofs Initiative
State RPSs
Market Formation Use on US & Russian spacecraft
US Dept. of Defense military applications
Resource Mobilization
Government funding for demonstration projects
Cost-share initiatives during the first Bush administration
Utility incentive programs
Million Solar Roof Initiative grants
2005 EPAct tax credits for solar PV installations
2008 tax credit extension
SunShot Initiative research funding
State financial incentives
Support from Advocacy
Coalitions
Utility PV Group installation projects and alliances
PV for Utilities lobbying utilities to install solar PV
Looking at the importance of each function in the story constructed from the literature,
there are four that seem to be most prevalent in the innovation process: Entrepreneurial Activity,
Knowledge Development, Guidance of the Search, and Resource Mobilization. Some of the
events indicative of these functions overlapped into more than one category, however (e.g.
Hoffman Electronics development and sale of a PV cell with 10% efficiency is both
Entrepreneurial Activity and Knowledge Development), emphasizing the difficulty with relying
only on the count of events indicating a particular TIS function in determining importance to the

52
innovation process. If the chronology of these events is considered, the beginning of the
innovation process was shaped the most by private sector actions (Entrepreneurial Activity) then
aided by government funding and research at national laboratories. When it comes to
widespread deployment, public policy, including both state incentives and federal programs,
seems to be the larger driver. Comparing this with the common motors of change in a TIS as
laid out by Hekkert et al. (2007) and shown in Figure 7, the innovation process for solar PV most
resembles Motor B: entrepreneurial activities created a sense of legitimacy for the technology
which led to resource allocation from both public and private entities, more knowledge creation,
and expectations of how the technology can be used to benefit society.
Figure 14 illustrates the findings of this case study through the adapted motors of change
diagram. As with the previous case study, the filled in ovals represent the TIS system functions
that were most influential and the connected boxes summarize the types of events that occurred
during the innovation process. Entrepreneurial Activity has been a significant driver throughout,
initiating the search for commercial uses and continuing to develop widespread applications.
Resource Mobilization through government R&D funding and financial incentives, public-
private partnerships, and utility incentive programs has been crucial to the research,
development, and deployment aspects. These resources help fund the events that constitute
Knowledge Development and allow for technological advances and product development. All of
this was influenced by events in Guidance of the Search, ranging from current events changing
societal desires and expectations regarding energy sources to state and federal policy targets.
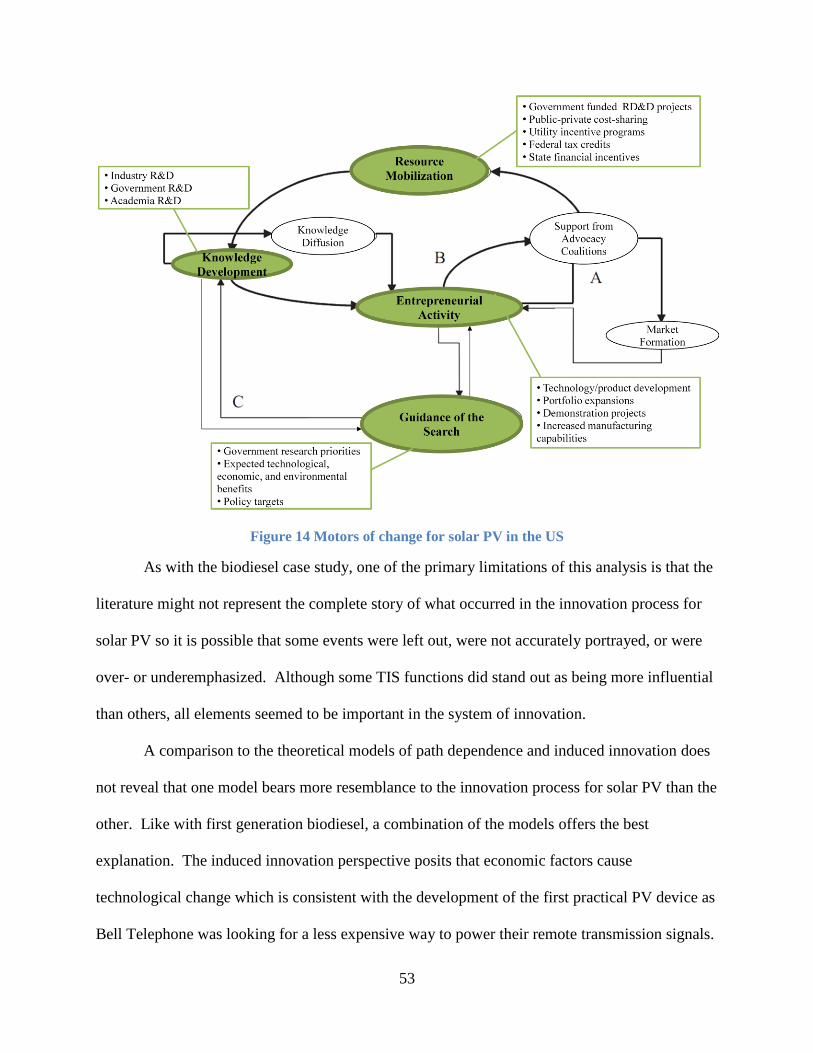
53
Figure 14 Motors of change for solar PV in the US
As with the biodiesel case study, one of the primary limitations of this analysis is that the
literature might not represent the complete story of what occurred in the innovation process for
solar PV so it is possible that some events were left out, were not accurately portrayed, or were
over- or underemphasized. Although some TIS functions did stand out as being more influential
than others, all elements seemed to be important in the system of innovation.
A comparison to the theoretical models of path dependence and induced innovation does
not reveal that one model bears more resemblance to the innovation process for solar PV than the
other. Like with first generation biodiesel, a combination of the models offers the best
explanation. The induced innovation perspective posits that economic factors cause
technological change which is consistent with the development of the first practical PV device as
Bell Telephone was looking for a less expensive way to power their remote transmission signals.

54
In the first decade or two after Bell’s development, private sector research was primarily the
driving force behind R&D to fill industry needs for remote power applications. After the oil
crises of the 1970s, however, government interventions played a larger role through R&D
funding, policy targets, and subsidies. The recent growth in PV systems such as rooftop solar
can be largely attributed to state and federal government subsidies and financial incentives (US
EIA, 2011b). Induced innovation precepts seemed to be more dominant early on, but the theory
of path dependence is more consistent with the story of innovation as the process moved forward
as government interventions had a major role. Technological changes that resulted from the
policy environment can be explained by both induced innovation and path dependence because
the policies affected both prices and R&D efforts. This pattern is similar to the innovation
process of first generation biodiesel.
To evaluate the success of solar PV to date, three metrics are used: level of adoption,
independence from subsidies, and greenhouse gas emissions. Solar power currently supplies
about 0.1% of US electricity consumption and 1% of renewable energy consumption. (In
comparison, biodiesel makes up approximately 1.3% of the distillate fuel oil market.) While this
is a small portion, the industry has been experiencing large annual growth and cost reductions in
recent years (US EIA, 2011a; US EIA, 2011b). Next, in terms of subsidies PV system
installations currently qualify for tax credits and will continue to until 2016. The SunShot
Initiative was also recently launched by the US Department of Energy to provide funding for
solar R&D with the goal of achieving cost-competitiveness with conventional electricity
generation for PV systems without subsidies by 2020. Lastly, the greenhouse gas comparison
between solar PV and coal generation is favorable to solar PV. Life-cycle emissions from solar
PV systems are in the range of 43-73 g CO2eq/kWh generated with the vast majority coming

55
from production of the module itself and system components other than the PV cells (e.g. the
inverter) (Weisser, 2007). Emissions from PV electricity generation are negligible since no fuel
combustion is involved (US EPA, 2007). Electricity generated from coal, however, has life-
cycle emissions ranging from 950-1,250 g CO2eq/kWh (Weisser, 2007). Solar PV has a definite
advantage over coal in terms of emissions and its level of adoption at 1% of the renewable
energy supply is comparable with biodiesel’s contribution to the distillate fuel oil market, but
solar PV still receives multiple subsidies. Whether or not a larger market share can be achieved
and growth can continue without subsidies remains to be seen.
5. Discussion and Conclusions
5.1 Limitations
There a few primary limitations to this analysis. The first is the applicability of the case
studies. The energy technologies chosen for analysis were done so in an attempt to capture
important aspects of using algae as an energy source, but there are other factors that differentiate
the technologies and may hinder the comparison. For example, solar PV is used to generate
electricity not liquid transportation fuels. A second limitation is that the case study analysis was
based on the limited information found in the literature; the stories may not be complete, and
important factors in the innovation process may have been unknowingly omitted. Third, there
were negative forces occurring in the case studies, such as decreasing oil prices detracting from
alternative energy research, that were not taken into consideration under the TIS framework. A
limitation of the framework is that it focuses on events that contribute positively to the research,
development, and deployment of technologies. It can be used to identify gaps in innovation
processes, but in this analysis the purpose was to find what worked well so that approach was not

56
taken. An analysis of the gaps in the innovation processes is an area for future study. Fourth,
there is some ambiguity in assigning events to the different TIS functions. Identification of the
functions was based on the descriptions provided by Suurs & Hekkert (2009) in Table 4, but
there is still room for different interpretations and understandings of events. Fifth, the analysis
was focused on the United States only so spillovers and other effects from innovation
internationally are beyond the scope of this paper. Lastly, since only two case studies were
analyzed the findings, while informative, are not robust enough to be generalizable.
5.2 Case Study Comparisons and Findings
The case study analysis provided insight into two specific examples of innovation in
energy technologies. The case studies can be compared in terms of the success of the technology
and the TIS functions that were most influential in the innovation processes. In terms of success,
the technologies were examined using three metrics: level of adoption, independence from
subsidies, and greenhouse gas emissions. First generation biodiesel was considered to be
successful on all three counts with significant increases in market share, the expiration of
relevant subsidies, and a decrease in emissions over petroleum diesel. Solar PV was found to be
somewhat less successful. This technology is the smallest renewable power source in the US
even while the industry experiences significant annual growth rates; however, as a percentage of
renewable electricity solar it is on par with biodiesel’s market share of the distillate fuel oil
market. In terms of subsidies, there are multiple tax credits and financial incentives offered for
PV installation at both the state and federal level. Solar PV is definitely a success when it comes
to greenhouse gas emission reductions as compared to coal generated electricity. It has a small
but growing market share and a current reliance on subsidies which does not make solar PV

57
unsuccessful, but it does indicate that there is still progress to be made in achieving cost
competitiveness with other energy sources.
Based on the stories found in the literature of these innovation processes, a subset of the
TIS functions were identified as being more influential. For first generation biodiesel Guidance
of the Search, Market Formation, and Resource Mobilization seemed to be the biggest drivers
throughout, but Entrepreneurial Activity and Support from Advocacy Coalitions were influential
factors in the beginning. For solar PV Entrepreneurial Activity, Knowledge Development,
Guidance of the Search, and Resource Mobilization seemed to be the most influential (Table 9).
The ones that were common to both are Entrepreneurial Activity, Guidance of the Search, and
Resource Mobilization. When completely boiled down, the short stories of the case studies
match: industry saw an opportunity for a new commercial product (Entrepreneurial Activity)
and changing national priorities (Guidance of the Search) bolstered public interest in the new
product which government then supported through policy targets and subsidies (Guidance of the
Search and Resource Mobilization).
Table 9 Comparison of most influential TIS functions in case studies
TIS Function Biodiesel Case Study Solar PV Case Study
Entrepreneurial Activity X X
Knowledge Development X
Knowledge Diffusion
Guidance of the Search X X
Market Formation X
Resource Mobilization X X
Support from Advocacy
Coalitions X
Although some TIS functions were not identified as being among the most influential, it
does not mean they lack importance. For instance, knowledge development and diffusion are

58
necessary components of innovation for any technology, but in the story of first generation
biodiesel it was not a lack in these areas that posed the major roadblocks. The challenges
seemed to be more centered on achieving cost competitiveness with petroleum diesel which
made more critical the policy targets (Guidance of the Search) and niche markets (Market
Formation) that encouraged the use of biodiesel and the subsidies (Resource Mobilization) that
reduced production costs and helped even out the price of biodiesel as compared to petroleum
diesel.
In the case of solar PV, the major obstacles differed slightly. Achieving cost
competitiveness with other forms of electricity was and still is one of the primary hurdles, which
is why Resource Mobilization through government RD&D funding and state and federal
financial incentives was identified as a key driver. The policy targets (Guidance of the Search)
that have been put in place, such as state renewable portfolio standards and the Million Solar
Roofs Initiative, have helped increase the level of deployment of solar PV, further reducing
costs. The innovation process for solar PV differs from that of first generation biodiesel because
Entrepreneurial Activity and Knowledge Development, which are very closely linked, were more
necessary to create a product with commercial potential. Biodiesel was already being
commercially produced in Europe using other feedstocks when efforts to produce soy biodiesel
really began in the United States, but with solar PV there was a greater need for basic research
and development to make a product that had the potential for widespread deployment. Another
difference is that Market Formation played a relatively minor role for solar PV as the only niche
markets created by government were for spacecraft and military applications.
Figure 15 is a revisualization and combination of the motors of change diagrams for first
generation biodiesel and solar PV. It is meant to highlight the influence of the TIS functions on
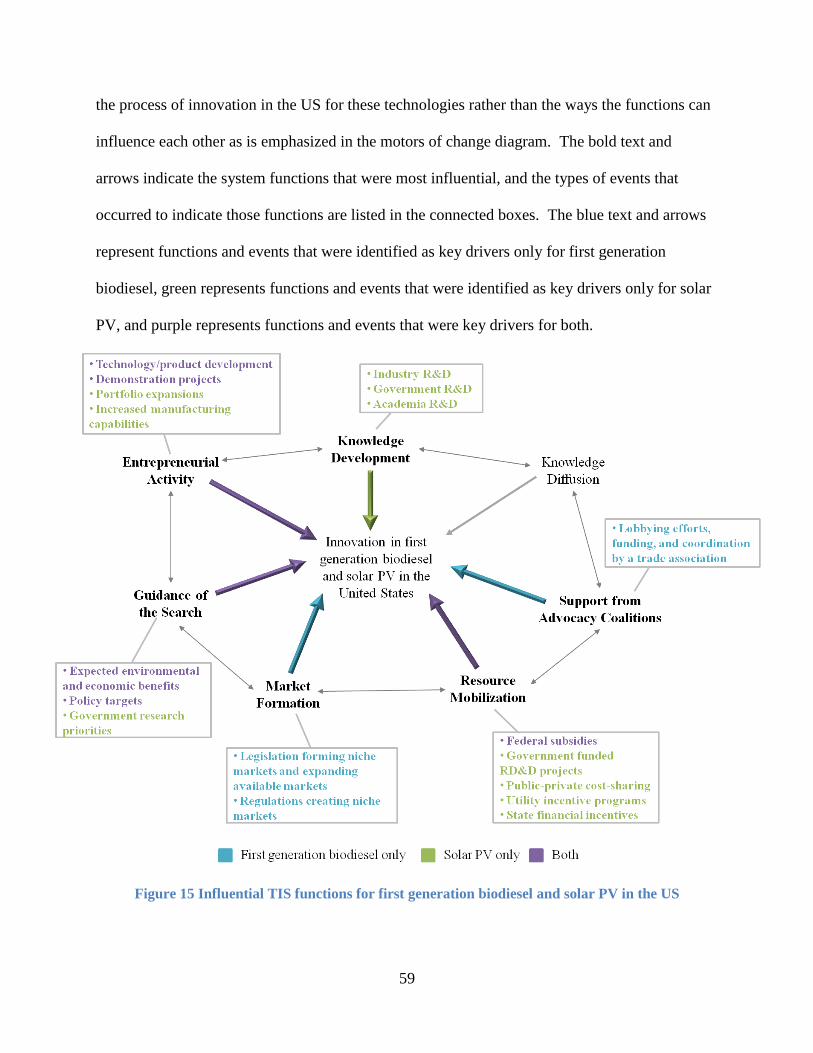
59
the process of innovation in the US for these technologies rather than the ways the functions can
influence each other as is emphasized in the motors of change diagram. The bold text and
arrows indicate the system functions that were most influential, and the types of events that
occurred to indicate those functions are listed in the connected boxes. The blue text and arrows
represent functions and events that were identified as key drivers only for first generation
biodiesel, green represents functions and events that were identified as key drivers only for solar
PV, and purple represents functions and events that were key drivers for both.
Figure 15 Influential TIS functions for first generation biodiesel and solar PV in the US

60
Comparing the most influential system functions and event types in the two case studies
reveals that Entrepreneurial Activity, Guidance of the Search, and Resource Mobilization were
the functions that seemed to have the most significant impacts on the research, development, and
deployment processes for both first generation biodiesel and solar PV. Entrepreneurial Activity
was indicated in both case studies by the development of a new product/technology followed by
demonstration projects of the new product. Within Guidance of the Search, the events that
occurred in both innovation processes were changing expectations on the part of both society at
large and private industry regarding technological options and associated environmental and
economic pros and cons and policy targets setting goals for levels of deployment. For Resource
Mobilization, it was federal subsidies that played a significant role for both technologies. What
the findings from these two case studies suggest is that when national priorities align with the
promises of a new energy technology, government interventions, such as policy targets and
subsidies, are some of the key drivers in the innovation processes for emerging energy
technologies, reinforcing the tenets both of the path dependence theory of innovation that
involvement by a central authority helps overcome lock-in as well as the extension of induced
innovation theory discussed by Weiss & Bonvillian (2009) that innovation responds to the policy
environment. Both theories are relevant, but the main point of the case studies is that technical
change seems to be strongly influenced by government interventions. This does not mean that
other types of events do not contribute in significant ways to this process; the case studies
showed that all of the TIS functions are important in some capacity and both started with
Entrepreneurial Activity. Ultimately, innovation occurs due to a confluence of people, events,
and other factors and cannot be attributed to a single thing. These findings do suggest, however,
that some types of events have more bearing on the process than others.

61
5.3 Relevancy for Algal Biofuel
To see how the findings of the case study analysis apply to algal biofuels, the brief story
of algal biofuel’s innovation process is summarized (see also the introduction and background).
In the early 1950s production of methane gas from algae was proposed, but the idea did not gain
much traction until after the 1970s energy crises (ABO, 2012a). In 1978, the US Department of
Energy began the Aquatic Species Program which was funded through 1996 with the goal of
developing renewable transportation fuels from algae (Sheehan et al., 1998). More recently,
drivers of biofuels research have included increasing demand for transportation fuels and
concerns about energy security and climate change (ABO, 2012a). There has also been a
growing recognition of the downsides of conventional biofuel as discussed in the introduction
(Weiss & Bonvillian, 2009). In response to these various concerns, the Renewable Fuel
Standard (RFS) was enacted by the federal government in 2005 and revised in 2007 to encourage
the production and use of advanced biofuels and cap the production of conventional renewable
fuels. The advanced biofuels category includes cellulosic, biomass-based diesel, and other
advanced biofuels. According to the definitions given in the 2007 Energy Independence and
Security Act, algal biofuels could count as either biomass-based diesel or other advanced
biofuel.*
Although algal fuels are included in the RFS fuel categories, they lack specific incentives
currently provided for other emerging biofuel feedstocks such as cellulose. As discussed in the
background section, cellulosic biofuel is eligible for a producer tax credit and depreciation
* Advanced biofuel is defined as a renewable fuel, other than ethanol derived from corn starch, that has lifecycle
greenhouse gas emissions that are at least 50% less than baseline lifecycle greenhouse gas emissions. Biomass-
based diesel is defined as a renewable fuel that is biodiesel as defined in the 1992 Energy Policy Act and has
lifecycle greenhouse gas emissions that are at least 50% less than baseline lifecycle greenhouse gas emissions.
Baseline lifecycle greenhouse gas emissions are defined as the average lifecycle greenhouse gas emissions for
gasoline or diesel sold or distributed as transportation fuel in 2005.

62
allowance for plant property. Only qualified feedstocks, defined as any lignocellulosic or
hemicellulosic matter that is available on a renewable or recurring basis, can receive this credit.
There have been multiple attempts at legislation to expand this definition and extend the benefits
to include any cultivated algae, cyanobacteria, or lemna, but none of these attempts have been
successful. Efforts such as these have been aided by the Algal Biomass Organization (ABO)
which was founded in 2008 with the mission of “promoting the development of viable
commercial markets for renewable and sustainable commodities derived from algae” (ABO,
2012b).
The brief history just presented and as discussed in the introduction and background can
be used to apply the TIS framework to algal biofuels (see Figure 16). This history suggests that
five of the seven TIS functions have occurred or are occurring in some capacity; the two that
have not are Market Formation and Resource Mobilization. Entrepreneurial Activity has taken
place as algal fuels and the technology to produce them have been developed and a small number
of demonstration projects have occurred. There have been R&D efforts on the part of industry,
academia, and government contributing to Knowledge Development. ABO, the trade
organization, has an annual conference, works to provide networking and collaboration
opportunities (ABO, 2012b), and lobbies for policies to support algal fuel development,
indicating that Knowledge Diffusion and Support from Advocacy Coalitions are occurring.
Finally, some of the same sentiments and national priorities that provided Guidance of the
Search for solar PV and first generation biodiesel are also in affect for algal biofuel, such as the
desire for domestic energy production and the potential environmental benefits of the energy
source. As a policy target, the RFS also qualifies as Guidance of the Search.

63
Figure 16 TIS functions that have occurred for algal biofuels
The algal biofuel TIS can then be compared to the findings of the case study analysis.
The event types identified as being the most influential in the two case studies were product
development, demonstration projects, policy targets, and subsidies given supportive public
sentiment and expectations. Only one of these event types has not yet occurred for algal
biofuels: establishing a subsidy program. Based on the lessons learned from first generation
biodiesel and solar PV in the US, supplementing the RFS and other system functions with
subsidies for algal fuels could contribute significantly to moving algal biofuel farther along in the
commercialization process.
There are also other lessons that can be derived from the case studies. One is that all
components of a TIS are important and contribute to the innovation process. This means that
although some events might have a greater influence, no function should be neglected as it is a
system where all the factors are interconnected and interacting. Other system functions that were
found to be influential in only one of the case studies include Knowledge Development, Market
Formation, and Support from Advocacy Coalitions. This means that six of the seven functions

64
were identified as being key drivers; the only system function that was not was Knowledge
Diffusion. To reiterate, this does not mean that it is not an important component of an
innovation system, just that it was not one of the primary factors as identified through the
literature in overcoming barriers to commercialization in the cases of first generation biodiesel
and solar PV.
Another lesson is that negative forces are also important in an innovation system. In both
case studies, the price of oil and other substitute goods directly affected the amount of funding
that was going into alternative energy R&D. The same will undoubtedly be true for algal
biofuels. If crude oil prices substantially decrease or other advanced biofuel feedstocks become
economically competitive before algae, the incentive for investing in algal fuels will be lessened.
As stated throughout the analysis, innovation results from a combination of market forces and
government interventions, not just one or the other. Policy makers need to be aware of emerging
technologies and design policies that encourage development without “locking in” one
technology.
In the end, innovation is a complex process that occurs due to a confluence of people,
events, policies, and other factors and cannot be attributed to a single thing. Efforts should be
put into developing all of the functions in a TIS. However, this analysis does suggest that certain
aspects of a TIS have more sway than others for an energy technology so some emphasis on
Entrepreneurial Activity, Guidance of the Search, and Resource Mobilization might be
worthwhile in the efforts to commercialize algal biofuels.

65
References
Ahman, Max and Lars Nilsson. (2008). "Path dependency and the future of advanced vehicles
and biofuels." Utilities Policy 16.2: 80-89.
Algal Biomass Organization (ABO). (2012a). AllAboutAlgae.com. 12 February 2012
<http://allaboutalgae.com/>.
Algal Biomass Organization (ABO). (2012b). Algal Biomass Organization. 21 March 2012
<http://www.algalbiomass.org/>.
Altin, Recep, et al. (2001). "The potential of using vegetable oil fuels as fuel for diesel engines."
Energy Conversion and Management 42: 529-538.
Amaro, Helena M., et al. (2011). "Advances and perspectives in using microalgae to produce
biodiesel." Applied Energy 88, no. 10: 3402-3410.
Arthur, W. Brian. (1994). Increasing Returns and Path Dependence in the Economy. Ann Arbor:
The University of Michigan Press.
Bergek, Anna, et al. (2008). "Analyzing the functional dynamics of technological innovation
systems: A scheme of analysis." Research Policy 37: 407-429.
Berglund, Christer and Patrik Soderholm. (2006). "Modeling technical change in energy system
analysis: analyzing the introduction of learning-by-doing in bottom-up energy models." Energy
Policy 34: 1344-1356.
“Bill Text: 111th
Congress (2009-2010) H.R.4168.EH.” The Library of Congress: Thomas.
<http://thomas.loc.gov/cgi-bin/query/D?c111:3:./temp/~c111qOZ0Rb::>
“Bill Text: 111th
Congress (2009-2010) S.1250.IS.” The Library of Congress: Thomas.
<http://thomas.loc.gov/cgi-bin/query/D?c111:1:./temp/~c111DAywlU::>
“Bill Text: 112th
Congress (2011-2012) S.748.IS.” The Library of Congress: Thomas.
<http://thomas.loc.gov/cgi-bin/query/D?c112:1:./temp/~c112BRxrTh::>
Brady, Angela. (2011). "Information About Solar Panel Farms." National Geographic. 28
February 2012 <http://greenliving.nationalgeographic.com/information-solar-panel-farms-
2605.html>.
Chisti, Yusuf. (2007). "Biodiesel from microalgae." Biotechnology Advances 25: 294-306.
Chisti, Yusuf, and Jinyue Yan. (2011). "Energy from algae: Current status and future trends."
Applied Energy 88.10: 3277-3279.
Clarens, Andres F., et al. (2010). "Environmental Life Cycle Comparison of Algae to Other
Bioenergy Feedstocks." Environmental Science & Technology 44.5: 1813-1819.

66
Concentric Energies & Resource Group, Inc. (2010). "2008-2009 Review: US Biofuels Industry:
Mind the Gap." US DOE Office of Biomass Program.
Denholm, Paul and Robert M. Margolis. (2008). "Impacts of Array Configuration on Land-Use
Requirements for Large-Scale Photovoltaic Deployment in the United States." NREL.
Conference Paper.
Dracker, Raymond and Pascal De Laquil III. (1996). "Progress Commercializing Solar-Electric
Power Systems." Annual Review of Energy and the Environment 21: 371-402.
DSIRE. (2012). DSIRE Solar. 29 February 2012 <www.dsireusa.org/solar/>.
Energy Policy Act of 2005. Pub. L. 109-58. 119 Stat. 594. 8 August 2005.
Gallagher, Brian. (2011). “The economics of producing biodiesel from algae.” Renewable
Energy 36: 158-162.
Hekkert, M.P., et al. (2007). "Functions of innovation systems: A new approach for analysing
technological change." Technological Forecasting & Social Change 74: 413-432.
Hill, Jason, et al. (2006). "Environmental, economic, and energetic costs and benefits of
biodiesel and ethanol biofuels." Proceedings of the National Academy of Sciences (2006):
11206-11210.
Howell, Steve and Joe Jobe. (2005). "Current Status of Biodiesel in the United States." The
Biodiesel Handbook. Ed. Gerhard Knothe, Jon Van Gerpen and Jürgen Krahl. Urbana: AOCS
Press. 183-193.
IEA. (2008). “From 1st- to 2
nd-Generation Biofuel Technologies: An overview of current industry
and RD&D activities.” OECD/IEA.
IEA. (2006). "Renewable Energy: R&D Priorities." OECD/IEA.
Kaplan, Abram W. (1999). "From passive to active about solar electricity: innovation decision
process and photovoltaic interest generation." Technovation 19: 467-481.
Kazmerski, Lawrence L. (2006). "Solar photovoltaics R&D at the tipping point: A 2005
technology overview." Journal of Electron Spectroscopy and Related Phenomena 150: 105-135.
Knothe, Gerhard. (2005). "The History of Vegetable Oil-Based Diesel Fuels." The Biodiesel
Handbook. Ed. Gerhard Knothe, Jon Van Gerpen and Jürgen Krahl. Urbana: AOCS Press. 4-16.
Naik, S.N., et al. (2010). "Production of first and second generation biofuels: A comprehensive
review." Renewable and Sustainable Energy Reviews 14: 578-597.
National Archives. (2000). Executive Orders Disposition Tables: William J. Clinton - 2000. 26
April 2000. 16 February 2012 <http://www.archives.gov/federal-register/executive-
orders/2000.html>.
Pate, Ron, Geoff Klise, and Ben Wu. (2011). "Resource demand implications for US algae
biofuels production scale-up." Applied Energy 88: 3377-3388.

67
Pienkos, Philip T., and Al Darzins. (2009). "The promise and challenges of microalgal-derived
biofuels." Biofuels, Bioproducts, & Biorefining 3: 431-440.
Pousa, Gabriella, et al. (2007). "History and policy of biodiesel in Brazil." Energy Policy 35:
5393-5398.
Radich, Anthony. (2011). “Biodiesel Performance, Cost, and Use.” US EIA. 8 June 2004. 21
Nov 2011. < http://www.eia.gov/oiaf/analysispaper/biodiesel/>
Renewable Fuels Association. (2011). “Cellulosic Ethanol.” Renewable Fuels Association. 28
Nov 2011. <http://www.ethanolrfa.org/pages/cellulosic-ethanol>
Ruttan, Vernon W. (2001). Technology, Growth, and Development: An Induced Innovation
Perspective. New York: Oxford University Press.
Sander, Kyle, and Ganti S. Murthy. (2010). "Life cycle analysis of algae biodiesel." The
International Journal of Life Cycle Assessment 15: 704-714.
Schmidt, Charles W. (2007). "Biodiesel: Cultivating Alternative Fuels." Environmental Health
Perspectives 115.2: A86-A91.
Serrano, E., et al. (2010). "Nanotechnology for Energy Production." Nanotechnology for the
Energy Challenge. Ed. J. Garcia-Martinez. Weinheim: Wiley-VCH Verlag GmbH & Co. KGaA.
Sheehan, John, et al. (1998). A Look Back at the US DOE’s Aquatic Species Program: Biodiesel
from Algae. Washington, DC: US DOE.
Shen, Y., et al. (2009). “Microalgae Mass Production Methods.” American Society of
Agricultural and Biological Engineers 52.4: 1275-1287.
Singh, Jasvinder, and Sai Gu. (2010). "Commercialization potential of microalgae for biofuels
production." Renewable and Sustainable Energy Reviews 14: 2596-2610.
Songstad, David, et al. (2009). "Historical Perspectives of Biofuels: Learning from the Past to
Rediscover the Future." In Vitro Cell.Dev.Biol.—Plant 45: 189-192.
Soratana, Kullapa, and Amy E. Landis. (2011). "Evaluating industrial symbiosis and algae
cultivation from a life cycle perspective." Bioresource Technology 102: 6892-6901.
Sterman, John D. (2000). Business Dynamics: Systems Thinking and Modeling for a Complex
World. Boston: McGraw-Hill.
Subhadra, Bobban G., and Mark Edwards. (2011). "Coproduct market analysis and water
footprint of simulated commercial algal biorefineries." Applied Energy 88: 3515-3523.
Sun, Amy, et al. (2011). "Comparative cost analysis of algal oil production for biofuels." Energy
36: 5169-5179.
Supple, Derek. (2007). "Units & Converstion Fact Sheet." MIT Energy Club. 23 February 2012
<http://www.mitenergyclub.org/assets/2008/11/15/Units_ConvFactors.MIT_EnergyClub_Factsh
eet.v8.pdf>.

68
Suurs, Roald A.A. and Marko P. Hekkert. (2009). "Competition between first and second
generation technologies: Lessons from the formation of a biofuels innovation system in the
Netherlands." Energy 34: 669-679.
Sturm, Belinda S.M., and Stacey L. Lamer. (2011). "An energy evaluation of coupling nutrient
removal from wastewater with algal biomass production." Applied Energy 88: 3499-3506.
Tilman, David et al. (2009). "Beneficial Biofuels: The Food, Energy, and Environment
Trilemma." Science 325: 270-271.
US DOE. (2010). National Algal Biofuels Technology Roadmap. US DOE EERE Biomass
Program, 2010.
US DOE. (2012). "SunShot Initiative." 28 February 2012. US Department of Energy. 29
February 2012 <http://www1.eere.energy.gov/solar/sunshot/index.html>.
US DOE EERE. (2011a). “Cellulosic Biofuel Producer Tax Credit.” US DOE EERE Alternative
Fuels & Advanced Vehicles Data Center. 15 June 2011. 28 Nov 2011. < http://www.afdc.
energy.gov/afdc/laws/law/US/413>
US DOE EERE. (2011b). Federal Biomass Policy. 14 September 2011. 14 November 2011
<http://www1.eere.energy.gov/biomass/federal_biomass.html>
US DOE EERE. (2011c). "Photovoltaics." 12 August 2011. US DOE Energy Efficiency &
Renewable Energy. 28 February 2012
<http://www.eere.energy.gov/basics/renewable_energy/photovoltaics.html>.
US EIA. (2007). "Biofuels in the US Transportation Sector." February 2007. US Energy
Information Administration. 28 February 2012
<http://www.eia.gov/oiaf/analysispaper/biomass.html>.
US EIA. (2011a). "Renewable Energy Consumption and Electricity Preliminary Statistics 2010."
28 June 2011. US Energy Information Administration. 2 March 2012
<http://www.eia.gov/renewable/annual/preliminary/>.
US EIA. (2011b). "Solar shipments up, prices down." 10 March 2011. US Energy Information
Administration. 2 March 2012 <http://www.eia.gov/todayinenergy/detail.cfm?id=450>.
US EIA. (2012a). “Cushing, OK Crude Oil Future Contract 1 (Dollars per Barrel).” US Energy
Information Administration. 25 January 2012. 29 January 2012
<http://www.eia.gov/dnav/pet/hist/LeafHandler.ashx?n=PET&s=RCLC1&f=D>
US EIA. (2012b). "January 2012 Monthly Energy Review: Biodiesel Overview." 27 January
2012. US Energy Information Administration. 12 February 2012
<http://www.eia.gov/totalenergy/data/monthly/pdf/sec10_8.pdf>.
US EIA. (2012c). "US Product Supplied of Distillate Fuel Oil." 20 January 2012. US Energy
Information Administration. 28 February 2012
<http://www.eia.gov/dnav/pet/hist/LeafHandler.ashx?n=PET&s=MDIUPUS1&f=M>.
69
US EIA. (2012d). "EIA projects U.S. non-hydro renewable power generation increases, led by
wind and biomass." 28 February 2012. US Energy Information Administration. 2 March 2012
<http://www.eia.gov/todayinenergy/detail.cfm?id=5170>.
US EPA. (2007). "Clean Energy: Air Emissions." 28 December 2007. US Environmental
Protection Agency. 2 March 2012 <http://www.epa.gov/cleanenergy/energy-and-you/affect/air-
emissions.html>.
US EPA. (2011). Fuel & Fuel Additives: Diesel Fuel. 21 November 2011. 16 February 2012
<http://www.epa.gov/otaq/fuels/dieselfuels/index.htm>.
Weiss, Charles and William B. Bonvillian. (2009). Structuring an Energy Technology
Revolution. Cambridge: The MIT Press.
Weisser, Daniel. (2007). "A guide to life-cycle greenhouse gas (GHG) emissions from electric
supply technologies." Energy 32: 1543-1559.
Weyer, Kristina M., et al. (2010). "Theoretical Maximum Algal Oil Production." Bioenergy
Research 3: 204-213.
Williams, Pamela R.D., et al. (2009). "Environmental and Sustainability Factors Associated With
Next Generation Biofuels in the US: What Do We Really Know?" Environmental Science &
Technology 43.13: 4763-4775.