innovation of energy tech- nologies the role of...
TRANSCRIPT

DG Taxation and Customs Union
INNOVATION OF ENERGY TECH-NOLOGIES: THE ROLE OF TAXES FINAL REPORT | 26 NOVEMBER 2010

Innovation of energy technologies: the role of taxes
2
COLOPHON
Author: Project manager Mr. Sigurd Næss Schmidt and Dr. Eske Stig Hansen, Mr. Jonatan Tops, Mr. Holger Nikolaj Jensen, Dr. Svend Torp Jespersen.
Client: European Commission DG TAXUD Date: 26 November 2010 ISBN: Contact: SANKT ANNÆ PLADS 13, 2nd FLOOR | DK-1250 COPENHAGEN
PHONE: +45 2333 1810 | FAX: +45 7027 0741 WWW.COPENHAGENECONOMICS.COM

Innovation of energy technologies: the role of taxes
3
Preface .................................................................................................................. 5
Chapter 1 Key findings .............................................................................................. 6 1.1. taxation of greenhouse gases and energy key driver for innovation ......................... 6 1.2. R&D policies as a supplement to taxation ............................................................. 8 1.3. Taxation needed to reap benefits of R&D policies ............................................... 10
Chapter 2 Energy taxation as a driver of innovation in energy technologies ........... 11 2.1. Reactions to environmental tax and price increases .............................................. 12
Can we estimate direct tax impacts? ........................................................................... 12 Medium to long run elasticities can be substantial ..................................................... 15
2.2. Energy prices and taxes effect on penetration of low carbon technologies ............. 19 Renewable energy sources for electricity ..................................................................... 19 Adoption of energy efficient household appliances ..................................................... 20 Fuel efficient cars ....................................................................................................... 21
2.3. Higher Taxes lead to green technology innovations ............................................. 24 Powerful effect on R&D spending and green technology diffusion ............................ 24 Technology and innovation decisions have a global scope .......................................... 26
2.4. New empirical results on innovation impacts ....................................................... 27 Energy technologies ................................................................................................... 28 Patents, taxes and energy prices .................................................................................. 30 Graphical inspection of patent data and relationship between innovation and prices .. 35
Chapter 3 Clarifying the role of taxation vis-a-vis direct innovation policies .......... 43 3.1. Different roles for different instruments ............................................................... 43
The double externality problem ................................................................................. 44 The long term credibility problem ............................................................................. 47 R&D crowding out ................................................................................................... 48 Command-and-control systems and innovation ......................................................... 49
3.2. The interaction between taxation and R&D support ........................................... 49 Support for green technologies, their deployment and rebound effects ....................... 50 Timing of R&D support and taxation ....................................................................... 51
3.3. Time horizon and stringency of policy targets ...................................................... 54 Time horizon ............................................................................................................ 54 Stringency of policy targets ........................................................................................ 56
3.4. The efficient policy mix of carbon pricing and R&D support .............................. 57
Appendix A: Empirical analysis of patent data .............................................................. 70 A.1 Methodological framework ...................................................................................... 70 A.2 Results ..................................................................................................................... 72
TABLE OF CONTENTS

Innovation of energy technologies: the role of taxes
4
Patenting in Lighting Technology ............................................................................. 72 Patenting in LED Technology ................................................................................... 74 Patenting in Boiler Technology ................................................................................. 76 Patenting in Biomass Technology in Buildings .......................................................... 77 Patenting in Ventilation Technology ......................................................................... 78 Patenting in Fuel Efficiency for Motor Vehicles ......................................................... 80 Patenting in Pulp and Paper Manufacturing .............................................................. 80
Appendix B: Description of CERIM ............................................................................. 82
Appendix C: Description of IPC codes ......................................................................... 85
Microsoft Office Excel 97-2003 Worksh ........................................................................................................ 85

Innovation of energy technologies: the role of taxes
5
The EU and its member countries have recently at the March 2010 European Council meet-ing reiterated their commitment to ambitious long term goals to deal with climate change and energy security. To this end, the EU is ultimately committed to take a decision whether to move to a 30% reduction by 2020 compared to 1990 levels as a first step to achieve the ultimate target of staying below a 2°C increase in global temperatures compared to pre-industrial levels. This will in practice require substantial reduction in energy related CO2 emissions and de-ployment and development of low carbon energy technologies. In this context, the study fo-cuses on the importance of taxation of carbon and energy as a spur for innovation in such technologies, containing two main elements:
A policy based literature review of specific and direct links between energy taxes and innovation and in that context reporting the results of a major new economet-ric study using micro and macro data.
A policy based literature review of the merits of taxation relative to innovation and
R&D policies in attaining long term climate goals.
PREFACE

Innovation of energy technologies: the role of taxes
6
1.1. TAXATION OF GREENHOUSE GASES AND ENERGY KEY DRIVER FOR INNOVA-TION
The advantage of using taxation to spur innovation in energy technologies is just a mirror image of the advantage of using taxation to abate emissions in general. By taxing directly the quantity – for example emission of CO2 – the same incentive across all fields of innovation will be made available in order to save energy and/or reduce CO2 emissions. Hence remov-ing the need for policy makers to “guess”, based typically on incomplete information, where innovation activities should be focused. The effects on innovation are of an “induced” nature containing three steps. First, appropri-ate tax regimes can make it more expensive for private and industrial consumer to use (fossil) energy sources. Second, this in turn increases the demand for technical solutions that either save energy or use low fossil content energy sources and thereby improving the economic vi-ability of such technologies. Thirdly, this (re)directs the innovation efforts of enterprises in that direction; this is what we term “induced” innovation. These effects are not just of a theoretical nature, but are demonstrated in many applications of energy use over many decades. Our review of the literature suggest that the long term ef-fects of capturing all the three effects imply that an increase in energy prices or taxes of 1 per cent often leads to a fall in energy use of 1 per cent of more (c.f. chapter 2.1 for details). In this study, we review the empirical literature on induced innovation effects, and we con-duct own empirical investigations of the relationship. We will highlight the three most important conclusions from the new empirical research in this study seen from a policy perspective (c.f. chapter 2.4 for details). First, substantial increases in energy taxation can drive forward very substantial increases in innovation. Looking at seven different technology classes, we find (statistically significant) positive impacts on patenting activities from energy taxation for five technologies. The two other technologies related to lighting have too small effects to be well determined statisti-cally. Our results suggest that a one percentage point increase in the tax share of total user costs induces a 0.3-2.4 percentage increase in patenting, c.f. Table 1.1. This is indeed quite substantial. Table 1.1: Price and tax effects for different technologies Technologies Lighting LED Biomass in
buildings
Heat boilers Ventilation Motor
vehicles
Paper and
pulp
Price effect 0 0 0.28 0 0 0 0.47
Tax effect 0 0 0.28 2.33 2.37 2.19 0.47
Note: Long run estimated elasticities significant at 5 % confidence level. Due to the estimation strategy, taxes will always ‘inherit’ the price effect, but will be flexible to deviate if statistically significant.
Source: Copenhagen Economics
Chapter 1 KEY FINDINGS

Innovation of energy technologies: the role of taxes
7
Second (and closely related to the first conclusion), the tax induced innovation is signifi-cantly higher than the price induced innovation. This highlights the role of taxation as a credible long term instrument sending the right investment signals to innovators. As such, this conclusion is well supported by the literature, see chapter 3.1-3.2. However, we have reasons to believe that part of the difference between taxes and prices in our empirical results may be attributed to methodological issues. Third, the speed and size of innovation effects from energy/carbon taxes depend on a num-ber of well defined characteristics of the products and processes affected by the tax which are discussed in more detail in the report, c.f. chapter 2.2-2.3. In particular:
Energy use is typically just one (cost) component of a broader service produced by different types of capital equipment: gasoline is inserted into a car to produce a transport service; electricity is inserted into a light bulb to allow it to light up rooms etc. The higher the cost share presented by energy costs of deployment of the energy consuming product, the bigger the relative effect on user costs from energy taxes. In short, a 20 per cent increase in energy prices will lead to larger in-creases in the costs of using a car than a computer. This implies that the choice of a computer will be less driven by its energy consumption than the choice of a car would be. In turn this implies that energy cost driven innovation will be focused – naturally – in areas where energy account for a large share of the costs.
The speed of effect: the time from increase in taxes to effective introduction of new technology depends very much on the production and innovation cycle in the particular industry. The lead time from a higher tax rate to a patent is 4-5 years on average and then it needs to be converted into real products that will be deployed in the market over time. We can expect quick effects with simple, though highly energy consuming, products like hair dryers (not investigated here); slower effects with cars; and longer term effects on, e.g., heavy industrial equip-ment used in paper and pulp production. See chapter 2.4 and 3.3 for more on speed and time lags.
In addition to providing support for these findings, our literature review provides the follow-ing two main conclusions useful in assessing the size and adequacy of price/taxation induced innovation: The first conclusion is that global or at least regional tax rates should have broader and stronger effects on innovation than isolated tax rates in a few countries. The basic reasoning is that innovation strategies will be driven by simple market size concerns: the larger the market affected by a tax on energy, the larger the incentives for firms to spend their scarce innovation resources on responding to such taxes. As a counterpart to this, the innovation gains that small countries can achieve by imposing unilaterally higher tax rates on their own consumers and industries will be limited by two types of “leakage”. First, firms may consider relocation rather than investments in abatement technology. Second, firms producing poten-

Innovation of energy technologies: the role of taxes
8
tial abatement technology may hold back on such investments because the local markets ac-count only for a fraction of their global sales. See chapter 2.3 for more details. The second and very important conclusion relates to specific policy design and is partly de-rived from the conclusions above:
Some patience is needed in reaping the benefits of tax driven innovation with the speed depending on the length of product and innovation cycles. These lead times are important to keep in mind when setting instruments for obtaining medium ver-sus long term climate targets.
However, even if contributions to year 2020 targets from taxation induced innova-tion may be limited due to lead times, taxation will still be an extremely important instrument as the immediate effects on primary consumption and shifts towards energy efficient equipment will be the main engine through which these targets can be achieved.
In addition, for innovation with long expected time lags, it is essential to establish a long term credibility of maintained high level of tax rates to fix incentives for in-vestment.. This is also discussed below.
1.2. R&D POLICIES AS A SUPPLEMENT TO TAXATION While taxation can be a very effective driver of innovation in energy technologies, there are two basic arguments suggesting that energy/carbon taxation needs to be complemented with public research grants and other technology policies supporting long term innovation. The first is the so-called double externality problem. Carbon pricing is imposed because the costs for the society of emissions exceed the costs of private or industrial consumer that emit it. Hence, in line with standard environmental policy principles, by imposing a carbon price, we at one and the same time make the polluter pay and reduce emissions. However, at the same time, we have a classical externality problem in the production of knowledge: the bene-fits to the society from particular basic science may well exceed the private benefits from producing it (see also chapter 3.1). The second argument is the long term nature of innovation efforts and, linked to this, the credibility problem policy makers are facing. Private firms will only invest in research now to reap future benefits if they believe that the policy framework in place when innovation ef-forts are turned into products and processes will reward them for their efforts. However, pol-icy makers will also know that once firms have spent billions of Euros on R&D, they will seek to bring the new products to the market, provided that the marginal revenues of doing so exceed marginal costs of production. So policy makers may promise high taxes on carbon forever but drop them once firms have made the irreversible R&D investments.

Innovation of energy technologies: the role of taxes
9
This conclusion though raises the question: How much can the costs of attaining climate change and energy policy objectives be reduced by supplementing taxation of emissions with direct public support? We will argue that it depends on two main issues. The first issue is classical within the field of R&D economics. Public research grants require public funding with resulting distortions from higher tax rates. (A typical estimate is that 1 Euro spent on R&D requires benefits equal to 1.20 Euro or more to compensate for distor-tions.). Furthermore, increased innovation driven by public funding in one field of eco-nomic activity tends to squeeze out other innovation activity including privately funded R&D. However, according to several contributions from the economic literature, R&D support is usually considered to bring forth more economic benefits than what it costs to tax-payers, at least in the dynamic context. This provides a clear trade-off. The benefits to be reaped by producing positive spill-overs from energy technologies need to exceed the costs of lost innovation elsewhere as well as dis-tortions from higher tax rates to fund R&D subsidies. By contrast, revenues from energy taxes can be recycled so as to neutralise their adverse effect on the labour market. The second issue is more directly related to the level of ambitions that the EU has commit-ted itself to, and the time frame for attaining these. To be very clear, the benefits that the EU can expect from new public research grants initiatives between 2010 and 2020 in meeting 2020 objectives should be relatively limited. As discussed above, the time lag from spending on R&D to results being deployed in new products and processes is often measured in dec-ades. Moreover, reducing CO2 and other greenhouse gases by 20 per cent – 30 per cent in the context of a wider global agreement – can largely and effectively be met by deploying ex-isting energy efficient technologies helped by carbon pricing. Moreover, substantial im-provements of these technologies will become economically viable for producers with rela-tively modest increases in carbon pricing. Moving beyond 2020 objectives, the picture becomes different. Reducing CO2 emissions with 50 to 80 per cent from 1990 levels while seeing continued growth will imply either massive reductions in energy intensity or the introduction of new low carbon technologies in a scale not seen before. The cost to consumers of such a drastic change in living pattern would be very large, hence increasing vastly the value of technologies that could provide low carbon energy. These findings are confirmed in a number of recent studies. However, the increasing weight of R&D support to attain long term goals in climate and energy policies does not imply that taxation becomes less relevant over time. Indeed, a num-ber of studies have shown that carbon prices will have to rise further beyond 2020 even with very ambitious R&D policies.

Innovation of energy technologies: the role of taxes
10
1.3. TAXATION NEEDED TO REAP BENEFITS OF R&D POLICIES Well targeted R&D policies focused on solving research externalities still need to be backed up by continued strong carbon pricing by way of taxes and/or cap-and-trade systems. There are three basic arguments. First, public R&D support to increase the energy efficiency of fossil fuel technologies – combustion engines etc – will lead to more energy efficient cars on the roads, but also to lower costs of driving. Recent research from Germany suggests that up to 60 per cent of the energy savings from more energy efficient cars are transformed into consumers driving longer distances and or buying cars with more performance, a pattern often called the re-bound effect. Secondly, for end-of-pipe technologies such as coal based Carbon Capture and Storage power plants, the benefits are exclusively CO2-savings, while the output – electricity – is ex-actly the same as for traditional fossil based power plants. So these plants will never be de-ployed unless they receive a premium when selling electricity: despite up-front subsidies to-tal costs per unit sold will exceed traditional power plants. It is the role of carbon pricing to deliver this premium. Thirdly, R&D policies supporting renewable energy may well lead to a reduction in demand for fossil fuel, but that will at the same time lead to a reduction of crude oil, coal and gas prices on a global scale, triggering higher second round demand for such fossil fuels. The only real response possible is higher carbon taxes at a global level including in the EU.

Innovation of energy technologies: the role of taxes
11
From an economic perspective, taxes are a cost-efficient instrument in climate change miti-gation. Taxes (as well as emission trading schemes) create clear economic incentives to re-duce pollution, whilst being easy to implement. Alternatives, such as technology standards, typically only create medium term effects, unless continuously updated. A key problem with standards is to ensure that they align abatement costs across sectors along the lines of taxa-tion systems.1 However, the full abatement effects from energy taxation will most often first be seen dec-ades after the introduction. Basically, this stems from the three step nature of the reactions of consumers and producers to change in economic incentives. To be more specific about the difference between the three effects, we need to make clear that energy demand is a derived demand, derived from the demand for the output of some processes, e.g., a car engine pro-viding transportation, c.f. Figure 2.1. The short run effect of a tax (price) increase on energy inputs is that we reduce the amount of transportation. The medium run effect is that we buy smaller and less energy consuming cars, while the long run effect is that we invent hydrogen cars. Note the interdependence amongst the effects. If consumers are not hurt by the tax in-crease in the short run in form of reduced transportation, they are not likely to change their behaviour in the medium run either, and so there is no market for new inventions. Figure 2.1: Three channels for reduction in energy consumption/CO2 emissions over time
short run
medium run
long run
EU p
ollu
tion
redu
ctio
n 20
20(K
yoto
: 20
% b
elow
199
0 le
vel)
reduce activities creating pollution (e.g. less transportation)
conduct activities in less polluting way using known technologies (e.g. smaller and more fuel efficient cars)
conduct activities in less polluting way using new technologies (e.g. hydrogen cars)
Note: The choice of the Kyoto reduction target only serves as an example Source: Copenhagen Economics 1Popp et al (2009)
Chapter 2 ENERGY TAXATION AS A DRIVER OF INNOVATION IN
ENERGY TECHNOLOGIES

Innovation of energy technologies: the role of taxes
12
In this study we focus on this third element, the longer term effect on innovation. But it is very important to understand that this innovation is an induced or derived effect from con-sumers’ and producers’ short, medium and long run reactions to price changes. If consumers do not react to prices by consuming less energy and/or change the composition of energy-consuming capital, then innovators will not put research funds into innovation.2 We will structure this chapter according to these three channels. First, in section 2.1, we briefly review evidence of how private and industrial consumers over time have reacted to changes in energy prices, including changes originating from taxes. Second, in section 2.2, we review more directly how penetration of low carbon technologies has been impacted by energy and tax prices. Thirdly in section 2.3, we measure how innovation activities as meas-ured by different indicators typically with medium to long term lags have responded to such consumer behaviour. Finally, in section 2.4, we present new econometric evidence of the ef-fect of energy prices and taxes in four areas of energy use, reviewing seven different tech-nologies.
2.1. REACTIONS TO ENVIRONMENTAL TAX AND PRICE INCREASES Taxes provide incentives for consumers and firms to reduce energy consumption with the existing holdings of electric appliances, cars, production machinery etc. However, as long as the capital stock is held fixed, the only possibility is to reduce the level of pollution creating activities. In the medium to long run, consumers and industries will also change the compo-sition of the capital stock towards environmentally friendly technologies thereby creating further reductions in pollution.
Can we estimate direct tax impacts? Direct and robust estimates of long term effects of taxes on energy consumption and devel-opment of new technologies are difficult to obtain as energy taxes historically have been rela-tively sparsely used. This is evident from Table 2.1 where we see that energy taxes typically only amount to a few percent of GDP in the USA, Japan and EU countries. Energy taxes are mainly focused on gasoline, with low taxation of inputs for heating (represented by oil).
2 Acemoglu et al (2009).

Innovation of energy technologies: the role of taxes
13
Table 2.1: The importance of energy taxes in EU, US and Japan, 2007
Electricity tax, euro /
GJ. Gasoline tax, euro / GJ Diesel oil tax, euro / GJ
Revenue from energy
taxes as share of GDP
EU, high (67 percentile) 26 26 21 3,5
EU, middle (33-67 percentile) 9 23 17 2,5
EU, low (33 percentile) 5 20 15 1,6
USA 0 3 3 0,8
Japan 2 17 7 1,7
Note: Energy taxes share of GDP includes all environmental taxes. These numbers are for 2007. The tax on elec-
tricity, gasoline and diesel consist of all taxes paid by the end-user, excluding VAT. Source: IEA Data services and OECD, http://www2.oecd.org/ecoinst/queries/TaxInfo.htm Despite the significant change in policy focus around the world between 1994 and 2007, environmental taxes do not seem to have become more important during this time period, c.f. Figure 2.2. Obviously, the tax revenue to GDP ratio is also influenced by more than the level of environmental taxes. For example, a high GDP growth and a diminishing public sec-tor could imply that the ratio would fall. However, in the period we consider, neither of these explanations seems to be of major importance. Figure 2.2: Environmental tax revenues, share of GDP, 1994-2007
Source: IEA Data Services
0
1
2
3
4
1994 1995 1996 1997 1998 1999 2000 2001 2002 2003 2004 2005 2006 2007
Pct.
EU High, average (DK, NL, PT, FI, CZ)EU Middle, average (SE, HU, LU, IE, AT, UK, DE, FR, SK)EU Low, average (BE, EL, IT, ES, PL)Japan United States

Innovation of energy technologies: the role of taxes
14
Hence, when seen from the macro level over the last three decades, energy taxes have had only a limited impact on the level and variation of end user prices relevant for decisions by private and industrial consumers in most EU Member States. However, some exceptions ex-ist, e.g., a few household end-user products such as gasoline and fuel oil, c.f. Figure 2.3. Figure 2.3: Energy taxes across products (excl. VAT), share of total end use prices in EU
Note: Simple average Source: IEA Data services Given the limited overall importance of environmental taxes, empirical work on the effects of taxation have to look at the historical effects from changes in energy prices as well as changes in tax rates3. A priori, we would expect demand reactions to be similar for a tax rais-ing the product price by 1 percent and a cost increase also raising the price by 1 percent. In-deed, the literature provides a large range of studies determining the behavioural response from general price changes including changes in tax rates.4 As an introduction to this literature, we need to underline the role played by demand elastic-ities, i.e., the percentage change in consumption by a percentage change in final price. In the next subsection, we will present ranges of elasticity estimates. If consumers do not respond to price increases in the short or medium run, i.e., we face zero price elasticity, then there is lit-tle role to be played by taxes in climate change mitigation. The behavioural change is neces-
3 See Killian (2007) for a good survey on impacts from energy price fluctuations. 4 Popp (2002) discusses this point for the direct price-patent relationship and concludes that price and tax move-ments will have similar impact. Flood et al (2010) uses a more elaborate political economy approach to examine dif-ferences in price and tax impacts on gasoline demand. They conclude that from a demand side perspective, which is relevant here, the impacts are equal. However, there seems to be a political response to tax levels from price fluctua-tions to some extent dampening the fluctuations.
0%
10%
20%
30%
40%
50%
60%
70%
80%
1985
1986
1987
1988
1989
1990
1991
1992
1993
1994
1995
1996
1997
1998
1999
2000
2001
2002
2003
2004
2005
2006
2007
2008
2009
Gasoline, tax share of total end-use price
Fuel oil, tax share of total end use price
Electricity, tax share of total end use price

Innovation of energy technologies: the role of taxes
15
sary not only for the direct impact on pollution, but also on the economic incentives for conducting expensive R&D in green technologies. There are obvious methodological problems in getting price elasticities right. First, the de-mand for fossil fuel inputs is not only determined by price, but also by income. Richer na-tions use more fuels, and as the world economy grows, energy demand increases. Thus, esti-mating elasticities requires an adequate control for income effects. Second, equilibrium ef-fects must be taken into account. Observed data must be seen as both demand and supply responses, and disentangling demand from supply effects requires some methodological basis or identifying assumptions. Third, in the interpretation of elasticities it is important to dis-tinguish between pure consumption reduction and simple fuel substitution. For example, an elasticity of 1 may consist of 0.5 pure reductions in energy consumption and 0.5 substitu-tions to alternative energy sources. Obviously, when energy taxation hits the pollution di-rectly as in the case of carbon taxes, then substitution towards zero-carbon energy sources must be included as a potential beneficial response to taxes. But in the case of a specific fuel tax, say on oil, substitution towards natural gas is less beneficial. At this point, we should clarify that in this study, we are essentially looking at both substitution and pure reduction. Innovation can take place within low-carbon technologies and within energy-efficiency. Baring in mind these uncertainties, it seems relatively clear that long term effects from taxa-tion can be substantial. In the next paragraph we will show such demand responses in more detail.
Medium to long run elasticities can be substantial Looking across a very wide range of studies on the price elasticity of energy demand, there is a wide consensus that long term effects are two to three times higher than short term ones and are substantial, typically exceeding unity. This literature actually started as early as 1951 and despite the refinements in methodologies and broader availability of data, consistently with this contribution estimates are still found in the ballpark of 0 to -0.5 in the short run and -0.5 to -2 in the long run, c.f. Figure 2.4. The figure captures 67 studies with more 273 different elasticity estimates. Moreover, the figure demonstrates that measured as bands of estimates there is not that much difference between sectors and energy products. The only exception is residential demand which seems to have somewhat lower long run elasticity. However, it seems to be a reasonable assertion that long run estimates are typically not too far from -1.

Innovation of energy technologies: the role of taxes
16
Figure 2.4: Short and long run elasticity estimates across sectors and products
Note: The elasticities represented are based on a large number of empirical studies which are reviewed in the studies mentioned below as sources.
Source: Bohi and Zimmerman (1984), Bernstein and Griffin (2005), Dahl (1993), Newell and Pizer (2008), and Wade (2003).
-3
-2
-1
0
Commercial short run
Commercial long run
Industrial short run
Industrial long run
Residential short run
Residential long run
-3
-2
-1
0
Electricity short run
Electricity long run
Fuel oil short run
Fuel oil long run Natual gas short run
Natural gas long run

Innovation of energy technologies: the role of taxes
17
Table 2.2: Elasticity estimate averages across energy types and sectors Energy type Short run Medium run Long run
Coal 0.08 - 0.30
Electricity 0.23 0.49 1.15
Gasoline 0.22 - 0.65
Natural gas 0.28 1.15 1.72
Oil 0.15 0.66 1.73
Aggregate energy 0.23 0.40 0.63
Households 0.225 0.549 1.24
Commercial 0.256 0.26 1.57
Industrial 0.239 0.762 1.34 Sourc: Same sources as in figure 2.4 On the other hand, one may ask for the source of variation in these estimates. A few recent studies, in form of meta-analyses, have tried to assess this.5 The conclusions are as follows (further explanations follow):
The empirical methodology may influence the results significantly Elasticities change over time and with price levels Countries with similar economic structure may have quite different elasticities
Concerning the influence from the empirical methodology, meta-analyses show that some 40-50 percent of the variation may be attributed to methodological differences, implying that the remaining 50-60 percent must be attributed to real (economic) differences between samples.6 The most important difference arises from the data itself: Cross-country vs. time series esti-mations. Time series data have the advantage that the underlying economic entity with its basic structures is not changing between data points. Cross country data have the advantage that larger variations are typically present.7 When it comes to changes over time, a meta-analysis explicitly shows that electricity elastic-ities increased by 0.7 in absolute terms (that is, from, say, -1.0 to -1.7) immediately after the first oil price hike around 1973.8 Similar magnitudes are found for gasoline demand elastic-ities. We give three interpretations to this result.
5 See Espey and Espey (2004), Brons et. al. (2006), and Brons et al (2008). 6 See Espey and Espey (2004), Brons (2005), and Brons et et al (2008). 7 This touches a classic discussion in much applied analysis during the last decades. For an example directly discuss-ing the difference between data types and estimates, see Gardes et al (1996). 8 See Espey and Espey (2004).

Innovation of energy technologies: the role of taxes
18
The first interpretation concerns the ability of statistical methods in general to capture elas-ticities when there is little price variation; estimates simply become too low because the methods cannot distinguish the small variations from noise.9 From a very general point of view, econometrics is all about separating data signals from data noise, but this task becomes more and more difficult as the level of noise increases. When we give this interpretation of statistical difficulties, it will imply that the true elasticity values are about 0.7 lower in abso-lute terms than typical estimates (higher in numerical terms). The second interpretation concerns a change in attitudes and thereby in behaviour. The oil price hike brought another focus on energy savings and therefore consumers changed their behaviour. This interpretation is also backed up by a study from the US demonstrating that consumers reacted more strongly to energy prices when energy standards became obligatory thus allowing consumers to pick the products that were most energy efficient. 10 A third interpretation simply takes the result at face value and concludes that iso-elastic de-mand curves do not describe behaviour very well. Instead, elasticities are increasing in price levels.11 This is consistent with the assertion that elasticities are higher when energy costs are relatively high compared to output (GDP). Finally, we seem to find evidence that differences are substantial across countries. Some of this may be explained by economic and political structures,12 some of it by differences in technical structures. A good example where market design matters is the case of electricity re-tail prices. Historically, these have been determined ex post (in order to keep zero profits of regulated firms) in many countries. This completely eliminates any short/medium run re-sponses in demand. Moreover, some of the country differences can also be attributed to the level of attention / attitudes. Taken as a whole, the above discussion suggests that elasticities increase with price levels and with the general level of attention towards energy scarcity / environmental issues. Further-more, we can see that the rate structure can increase the long run elasticity by app. -0.5 for electricity when marginal (short run) rates vary with consumption. From a policy perspective the literature therefore provides three simple lessons:
(i) Energy tax policies work well when consumers are informed about products and alert about consequences.
9 It is standard knowledge in the econometric profession that low variation causes less precise estimates, c.f. Greene (2003). Moreover, low signal-to-noise ratios generally lead to downward biases of estimates, and low variation may cause simultaneity biases (relevant in non-system estimation of elasticities) to increase. 10 Gillingham et al (2006) 11 Bernstein and Griffin (2005), Espey and Espey (2004). 12 For example, France is known for a weak coupling between end user electricity prices, and wholesale market prices.

Innovation of energy technologies: the role of taxes
19
(ii) Energy tax policies work well when consumers are given the opportunity to re-act in the short run.
(iii) Stronger effect when overall energy costs are high. The first point suggests the use of information standards and campaigns,13 while the second suggests that policy makers should strive for transparent pricing systems. However, some-times politicians attempt to counteract price fluctuations by levying taxes and subsidies.14 In other words, the economic and informational context must be put in place.15 The third les-son is related to a specific market aspect, but it may suggest that taxation as an instrument has the advantage of increasing effectiveness as the level increases. However, the main finding here is that medium and long run elasticities seem to be eco-nomically significant. This strongly suggests that consumers and industries are willing to substitute towards green technologies, and this conclusion is extremely important for taxes to play a role in the deployment and development of low carbon technologies.
2.2. ENERGY PRICES AND TAXES EFFECT ON PENETRATION OF LOW CARBON TECHNOLOGIES
In this section we move the focus from pure consumption reductions by consumers and in-dustries to more fundamental changes in the way we use energy. Most of these effects con-cern medium run adjustments in capital holdings, and we will focus on three areas:
Renewable energy sources for electricity Energy efficient household appliances. Fuel efficient cars
Renewable energy sources for electricity A moderate carbon price will be sufficient to make profitable a substantial amount of non-fossil energy systems in the power system. Figure 2.5 shows the estimated global production costs of electricity for different renewable technologies compared to coal. It shows that with a carbon price of 30 euro / tonne, a range of renewable technologies come close to being competitive. That is, they have the same production costs as coal when including the 30 euro / tonne price. However, the figure also shows that without a carbon price, coal is gener-ally cheaper than most of the other existing technologies. While most of these technologies are today supported by direct subsidies, most estimates suggest that tightened climate poli-cies resulting in higher prices of ETS allowances would be sufficient to make substantially further amounts of renewable energy economically viable, c.f. Figure 2.5.
13 Campaigns serve to improve attention to environmental costs and to provide guidance to possible energy cutting. From a classical economics perspective, such campaigns are of little value since they provide no hard (financial) in-centives. Modern economic theory, however, acknowledges the 14 See Flood et al (2010). 15 See also Suslov (2008) for a general result on this point.

Innovation of energy technologies: the role of taxes
20
Figure 2.5: Projected cost ranges for power production across technologies, 2020-2030
Source: IEA, World Energy Outlook 2009 and CE calculations
Adoption of energy efficient household appliances The high average electricity price over the past years (2000-2004) seems to have led to con-sumption choices with a higher penetration of energy efficient appliances in the period of in-terest (2005).16 Hence in countries with high electricity taxes such as Denmark, The Nether-lands and Sweden, the share of highly efficient household appliances – those marked in en-ergy class A and A+ - is much more widespread.17 A more in-depth study for US showed that over a time span of 30 years, rising energy prices have led to innovation in energy con-suming household appliances, and that more energy efficient models were offered for sale (and actually sold). Here, it is also emphasised that additional information about energy use, directs consumer behaviour towards more energy efficient appliances.18 One should take this example to note the general point that the link between taxation and energy efficiency is in-directly through prices. Some countries may have high prices without having significant taxes and vice versa. However, the tax always adds to the price and therefore helps moving the adoption towards energy efficient appliances.
16 Conducting a simple regression between penetration and average electricity price results in a coefficient of 1.59 (i.e., a 1 $-cent/KWh increase leads to a 1.59 percent increase in penetration of energy efficient appliances) with a corresponding t-value of 2.16 being significant at the 5 percent level. 17 Bertoldi and Atanasiu(2007) 18 Newell et al (1999)
0 100 200 300 400
Coal with 30 euro …
Coal
Nuclear power
Large Hydro
Biomass for …
Onshore wind
Offshore wind
Biomass
Small hydro
CCS
Geothermal
Solar photovoltaic
Euro pr. MWh.

Innovation of energy technologies: the role of taxes
21
Figure 2.6: Penetration of energy efficient household appliances
Note: Electricity price including tax. We define energy efficient appliances as refrigerators, freezers, washing ma-chines, dishwashers and ovens rated A or better. The penetration rate shown in the graph is an average weighted with total sales.
Source: Copenhagen Economics based on Bertoldi, P. & Atanasiu, B., (2007) and IEA Energy price and tax data-base.
Fuel efficient cars The effects of energy prices and energy taxes on the fuel efficiency of cars deployed are evi-denced in a number of studies including our own simple graphical representation below in Figure 2.7. The difference in end user gasoline prices between countries seems to affect dif-ferences in average fuel efficiency. Higher gasoline prices provide incentives to improve the fuel efficiency of cars.19 The variations away from the trend line can, to a large extent, be ex-plained by historical and demographic differences. Considering the two largest EU Member States, Germany and France, it should be no surprise to find Germany above and France be-low the line. Germans have a tradition for larger and therefore less energy efficient cars, while the French typically tend to drive smaller cars. In Sweden, the low energy efficiency probably stems from the longer distances inducing higher driving comfort. Such conclusions are also reached in more elaborate modelling attempts.20 Other empirical analyses show that the fuel efficiency response to gasoline price are alike in different regions, whereas the final energy demand is influenced by different price elasticities when it comes to numbers of cars owned and demand for transportation.21
19 A simple linear regression with fuel efficiency as the dependent variable and gasoline price as regressor yields a t-value of -3.7 which is significant at the 1 percent level. This corresponds to a 2.5 liters/100 km increase in fuel effi-ciency if gasoline prices rose by 1 $/Ltr. 20 Eftec (2008). 21 Brons et al. (2006)
autbel
cze
dnk
deu
grc
espfra
irl
ita
lux
hun
nld
pol
prt
svkfin
gbr
rou
0.000
0.050
0.100
0.150
0.200
0.250
0% 10% 20% 30% 40% 50% 60% 70% 80% 90%
Penetration of energy efficient appliances 2005
Average electricity price (US$/KWh) 2000-2004

Innovation of energy technologies: the role of taxes
22
Figure 2.7: Gasoline price levels and fuel-efficiency; Average new gasoline LDV fuel effi-ciency and end-use gasoline prices, 200422
Source: IEA, Energy Technology Perspectives 2008 p. 436 and World Development Indicators, Table 3.12 We also attempt to show evidence that changes in gasoline prices over time within countries affect fuel efficiency. Below is shown the development of end-user price on gasoline for Germany, France, the UK, and the US compared to the development of fuel-efficiency on new gasoline LDV’s in the corresponding countries. The data only allows us to cover the pe-riod from 1980 onward. For the UK there is a sharp rise in fuel efficiency up to 1985, where it stabilizes in a period with falling and low gasoline prices. As the gasoline prices start rising again from 1991 onward, there is a following increase in the fuel efficiency, starting with some years lag. The delay can be explained by consumers waiting to see if a new higher gasoline price is just temporary: a more energy efficient, but perhaps also more costly and less attractive car in terms of performance, will only be chosen if the price change turns out to be of a more permanent character which may take some years to establish.
22 The above figure lists the fuel price for gasoline in the respective country vs. the average fuel efficiency for new gasoline driven cars in the respective countries. For Australia and Japan the average fuel efficiency is based on both diesel and gasoline cats, due to lack of data on the split between gasoline and diesel cars in the two countries.
United States
Australia
Canada
SwedenGermany
NetherlandsUnited Kingdom
Japan
FranceItaly
R² = 0.6688
0
0.2
0.4
0.6
0.8
1
1.2
1.4
1.6
1.8
5 6 7 8 9 10 11
Price ($/Ltr)
Litres pr. 100 km

Innovation of energy technologies: the role of taxes
23
Figure 2.8 UK gasoline prices and fuel efficiency for new gasoline LDV’s The UK Germany
France The US
Source: IEA data services for gasoline prices and IEA data from MoMo-model, upon written request A similar picture is seen below for France, though consumer behaviour tends to react a bit faster. For Germany the effect from gasoline prices on fuel efficiency is more moderate. This can be the result of the above mentioned fact that the Germans tend to drive larger and less energy-efficient cars possibly resulting from preferences for comfort and car size. US data is available for a longer period, and we see rising fuel efficiency up until 1985, as a lagged response to the second oil crisis. The new regime of falling oil prices are transmitted into a period with zero growth in fuel efficiency, then to recently beginning to rise as a re-sponse to the growing gasoline prices since 1999. A variety of literature studies examines the changes in gasoline prices over time and the effect on consumer choices. In a recent study for the US market, the market share of the 25 per cent most fuel efficient cars is estimated to rise by 20 percent in response to a 1 USD rise in gasoline prices.23 Moreover, the share of larger SUV’s is also estimated to be affected by the gasoline prices in the sense that the average fuel efficiency of new sold cars rises with ca. 0,2 – 0,4 km. / litres with a 1 USD rise in gasoline price.24 A study from the UK Department of Transport finds a fuel-price elasticity to the new car fuel efficiency of 0.2 %.25
23 Busse et al.(2009) 24 Klier(2008) 25 Eftec(2008)
60
65
70
75
80
85
90
95
100
105
110
1980
1982
1984
1986
1988
1990
1992
1994
1996
1998
200
0
200
2
200
4
200
6
Gasoline price, 2000 = 100
Fuel efficiency, (km. / liter) 2000 = 100
60
70
80
90
100
110
120
130
140
1980
1982
1984
1986
1988
1990
1992
1994
1996
1998
200
0
200
2
200
4
200
6
Gasoline price, 2000 = 100
Fuel efficiency, (km. / liter) 2000 = 100
60
65
70
75
80
85
90
95
100
105
110
1980
1982
1984
1986
1988
1990
1992
1994
1996
1998
200
0
200
2
200
4
200
6
Gasoline price, 2000 = 100
Fuel efficiency, (km. / liter) 2000 = 100
020406080
100120140160180200
1976
1978
1980
1982
1984
1986
1988
1990
1992
1994
1996
1998
200
0
200
2
200
4
200
6
200
8
USA, gasoline prices, 2000 = 100
Fuel efficiency, (km. / liter) 2000 = 100

Innovation of energy technologies: the role of taxes
24
2.3. HIGHER TAXES LEAD TO GREEN TECHNOLOGY INNOVATIONS Having established that price and tax increases can be highly effective in reducing energy demand and pushing demand in the direction of energy efficient variants, we are ready to discuss the long run implications for innovation in such technologies. As pointed out above, the presence of these behavioural changes is a prerequisite for the existence of a market for green innovations. In fact, the more expensive we make fossil fuel inputs, energy consump-tion, emissions and other forms of pollution, and the larger behavioural responses (demand and substitution elasticities), the greater incentives we find for investing in R&D. In other words, higher energy prices change the relative returns from longer term investment options to the benefit of energy and GHG displacing technologies.
Powerful effect on R&D spending and green technology diffusion Studies on the effect of policy or prices on innovation draw their motivation from the notion of induced innovation (or directed innovation), which recognises that R&D is a profit-motivated investment activity and that the direction of innovation likely responds positively in the direction of increased prices.26 Empirical studies on the effect of policy and prices on environmental innovation both support the conjectures of the induced innovation hypothe-sis and provide evidence of the magnitude of these. One branch of such empirical studies uses simulation models to assess the magnitude of in-duced innovation.27 A recent study carried out by the OECD28 finds that current and future expected carbon prices appear to have powerful effects on R&D spending and clean tech-nology diffusion. The study assumes a global carbon price reflecting the CO2 emission tra-jectories necessary to keep temperature increases below 2˚ Celsius. Under this scenario new technologies will contribute with ca. 50 percent decarbonisation where current rates are ca. 35 percent. These calculations are based on a detailed description of the energy sector (bot-tom-up) and the carbon markets combined with a general description of the global economy (top-down, CGE). A second branch applies econometric techniques to historical data and in this way attempts to assess the linkage between pollution prices (either in terms of energy input, consumption or emission prices) and targeted R&D performance.29 This is the approach we take in the empirical section below. The typical measure of R&D performance is the number (or num-ber of citations) of patents within a technology class, and the vast majority of studies either concern the US or Europe within the last 30-40 years. Early studies used pollution abate-
26 Hicks 1932, Binswanger and Ruttan 1978, Acemoglu 2002 27 E.g. Popp (2006), Acemoglu et al (2009), Fisher and Newel (2008). 28 OECD (2009), ”The role of R&D and technology diffusion in climate change mitigation: new perspectives using the WITCH model,” Working Papers No. 664. 29 E.g., Popp (2002), Brunnermeier and Cohen (2003), Hamamoto (2006), Johnstone et al (2009).

Innovation of energy technologies: the role of taxes
25
ment control expenditures (PACE) to proxy for environmental regulatory stringency since environmental taxes have typically been lower than such costs.30 In fact, recent studies have shown robust effects from energy prices on patenting on energy technologies.31 An important methodological advance in achieving this result concerns the use of disaggregated patent counts as it allows targeting the empirical analysis directly on relevant energy related patents.32 The general result from analyses exploiting disaggregated patent data is that induced innovation materialises quite clearly in patenting activities. This holds for several measures of environmental policies: PACE33, regulation34, and energy prices (taxes)35. For example, an increase in compliance expenditures of 1 percent typically lead to increases in R&D expenditure of 0.2 percent across countries and industries. This holds for any kind of instrument applied: be it taxes, allowances, or command-and-control. The esti-mate on energy prices is also economically and statistically significant. A one percentage in-crease in energy prices implies an approx. 0.4 percentage increase in energy technology pat-enting. The estimations also suggest that non-market policies are less effective; technology standards (command-and-control) create fewer patents with less environmental impact.36 The literature has acknowledged the presence of time lags in induced innovation.37 There are several reasons for time lags. First, firms must wait for clear price signals before they allocate resources to R&D – and in the case of energy prices, we typically see significant short run volatility blurring the price signal. Second, institutional (within-firm) barriers may cause slow adjustment. Along the same lines, research personnel may need some time to adapt to a changed focus. Third, patents are created on the basis of an innovation process which in it-self takes some time. The empirical literature typically comes up with a half-life of induced innovation in the ballpark 3-5 years, i.e., half of the induced innovations have occurred 3-5 years after the price/tax increase.38 Fourth, patents need to be converted into deployment of new technologies before having real effects on energy consumption. A deeper reading of this literature provides some further insights into the nature and neces-sary preconditions of innovation impacts. There is unfortunately very little to be said directly on how environmental taxes differ in impact from overall prices and/or other instruments. It is noteworthy that time and geography seem to influence the level of the impact, but in our context it is particularly interesting to look at policy conditions that favour innovation im-pacts. We find an overview of this in Table 2.3.
30 For example Jaffe and Palmer (1997) and Brunnermeier and Cohen (2003). 31 Popp (2006), Johnstone et al (2009). 32 Lanjouw and Mody (1996), Popp (2006) 33 Lanjouw and Mody (1996). 34 Popp (2006). 35 Newell et al (1999), Popp (2002), Johnstone et al (2009) (a). 36 Johnstone et al (2009). 37 See, e.g., Peeters and Surry (2000). 38 Johnstone et al (2009) (a), Popp (2010).

Innovation of energy technologies: the role of taxes
26
Table 2.3: Factors influencing the innovation impacts Factor influencing impact Effect Source Policies and instruments Domestic policies + Popp (2006) Information to consumers (labelling) + Newell et al (1999) Geography/economic development Developed countries + Lanjouw and Moody (1996) Developing countries - Lanjouw and Moody (1996) Time Recent years + Brunnemeier and Cohen (2003) Source: Copenhagen Economics The table demonstrates how a specific factor, say predictability and stability of policies, in-fluences the level of induced innovation. A “+” implies that the factor increases the innova-tion impact from prices and/or policies. Thus, the table conveys that predictable and stable policies induce more innovation than more ad-hoc policy solutions. Note that we have already touched upon the issue of labelling and consumer information when discussing elasticities above. In that (much broader) literature it was a standard finding that labelling and information increased responsiveness. In the case of induced innovation, according to the source references in the table above, domestic policies (a policy category used by Popp mainly including information campaigns) and labelling yield the same result. As the innovation impacts should work ‘through’ elasticities, it is comforting that we can point to some of the same factors. The table also demonstrates some differences over countries and time. The basic message from this part is that the more advanced level of development of the economies (looking along both the time and cross country dimension) leads to more responsive patenting – probably because general production of innovation is more important and more rent-seeking. This observation, however, is not very relevant from a policy perspective.
Technology and innovation decisions have a global scope In the above discussion of demand responses and innovation impacts, we have been rather vague in our definition of the relevant market. In the following paragraphs, we attempt to clarify the role of global markets – both concerning the medium run decisions on technology choice and long run decisions on induced innovation. The decision to change technology by profit seeking firms is based on a cost benefit analysis. As shown above, green technologies are typically more expensive up-front, but excel in their lower running costs. However, there may be other possibilities than changing technology. Firms may simply change location when environmental policies become too rigid in a spe-cific country. In the worst case, an environmental policy can trigger an outsourcing of energy intensive processes to regions with low or no taxes, but deploying highly inefficient tech-nologies. Thus, global emissions will increase and the policy will be counterproductive.39
39 There is a long literature on so called carbon leakage. Some of the most interesting references are Babiker (2005), Szabo et al(2006), Demailly and Quirion (2006), and Barker et al (2007).

Innovation of energy technologies: the role of taxes
27
Leakage will not arise mainly as a competition advantage of countries not participating in the emission reductions, but as an input price effect. Lower world demand for fossil fuels will lower prices and increase fossil-fuel consumption in these countries. Consumer markets and industry processes closest to the end market are less vulnerable. The same goes for prod-ucts that are costly to transport.40 There is a mirror image to leakage in production for ‘leakage’ in innovation. The point is that for geographically narrow defined taxes there is little incentive to engage in development projects that would lead to new technologies cutting these taxes back. Important innovations always have a market perspective that is broader than narrow national markets in order to repay the research investments. Formally, innovation has at least two global dimensions.41 First, innovation exploits global opportunities as just outlined. Second, geographically diversified innovation reduces invest-ment risks. Both dimensions clearly suggest that local taxes will only have limited impact on innovation. A study finds that EU27 is geographically insufficient to avoid carbon leakage for environ-mentally uncompromising tax policies.42 Thus, from a European Union point of view, it seems natural to mitigate carbon leakage by, at least, including all Member States under the allowance trading schemes and unifying current national energy tax schemes. The study clearly suggests that policy makers should opt for widest possible coverage – even if the out-come of the agreements may seem second-best compared to what is attainable. This is not to say that European taxes are inefficient, but simply that they are much more efficient if they are backed up on the international scene too. That implies as well that global carbon pricing has stronger effect on EU innovation than EU carbon pricing alone.
2.4. NEW EMPIRICAL RESULTS ON INNOVATION IMPACTS This section is devoted to the empirical analysis using European patent data to investigate the relation between price signals and induced innovation. The overall conclusion is that en-ergy price increases do induce more innovation. However, before turning to this result, we will first describe the technologies considered and describe their relevance as energy consum-ers. After a review of the main results from the empirical model, we will use graphical tools to illustrate some important points related to the results and applied methodology.
40 OECD (2008). 41 Hitt et al (1994). 42 OECD (2008), see also Bosetti et al (2009b).

Innovation of energy technologies: the role of taxes
28
Energy technologies A number of technologies exist which in some way relate to energy consumption. Here, we choose to look at seven specific technologies:43
Biomass for heating in buildings Boilers Ventilation in buildings Lighting Light emitting diodes (LED) Motor vehicle fuel efficiency Paper and pulp production
These are all characterised by a close link between energy consumption and the final output, e.g., oil consumed by a boiler to produce heated rooms. However, these technologies also possess characteristics distinguishing them from one another. We expect the different technologies to take different paths in their response to changes in energy prices. Cars, biomass in buildings, boilers and ventilation in buildings are characte-rized by high investment prices for the end-user. The percentage reductions in energy use may not be large, but the effect on household budgets could be significant as the cost of energy in these products is substantial. Lighting and LED technologies represent a small in-vestment for the end user, but with very large, percentage-wise, reductions in energy use. The energy cost of these products is typically small in terms of household budgets. Finally, the paper and pulp industry represents a class of its own, where innovations in energy effi-ciency lower the cost of producing a product that for the end user is unchanged.
43 The exact definition with respect to extraction from the EPO database is described in appendix C.

Innovation of energy technologies: the role of taxes
29
Figure 2.9: Energy budget (cost) shares for different processes
Note: For lighting, heating, ventilation, and motor vehicles, we present the budget share of total household energy costs. For paper and pulp we present the budget share of total production costs.
Source: Copenhagen Economics based on IEA, Eurostat, and specific studies The above differences in the technologies’ properties will imply that the innovation response to changes in energy prices will differ among the products. For biomass, boilers, ventilation and motor vehicles the penetration rate of the energy effi-cient technologies will be driven by longer term changes in energy prices, as these products
0
10
20
30
40
50
60
Lighting (Lighting and LED) Heating and ventilation Motor vehicles
Share of household energy
consumption
0
10
20
30
40
50
60
Paper and pulp
Energy costs share of total
production costs

Innovation of energy technologies: the role of taxes
30
have a lifespan of 5+ years44, and that their cost structure suggests that consumer choice of technology will be made upon time of replacement. Even though the effect may take time, changes in energy prices should have a high effect on consumer choices, as these products have a high energy cost as share of the household budget, so energy costs play a relatively high role compared to the agents other preferences for the products. The opposite holds for lightning and LED, partly because they exhibit shorter life spans, partly due to the fact that energy costs of these products play a minor part in the household’s budget. To a large extent, consumer taste/preferences will be determining for lighting source decisions. The paper and pulp industry’s choice of technology is a long term decision, where choices of production methods represent large costs and 10+ year lifespan. As paper and pulp producers should aim for profit maximization, their investment in energy efficient technologies will be solely driven of their own long term projection of energy prices and the cost of the actual in-vestment. This suggests that the adaption of energy efficient technology in the paper and pulp industry to a high degree will be driven by energy prices, but with a significant time lag.
Patents, taxes and energy prices In this section, we present the results from our econometric investigations on the link be-tween energy prices, taxes, and patents. Here we focus on the general messages, while a more thorough, methodological treatment is given in Appendix A. Looking across the results from different technologies, we find quite clear patterns, c.f. Table 2.4. The table demonstrates the sign and statistical significance of estimated coefficients across different estimations. Thus, a “+” refers to moderate evidence of a positive relation, whereas the double “++” implies highly significant estimates of a positive relation in most of the estimations.45 Similarly, “-“ and “- -“ will denote negative relations, while a “0” indicates a lack of statistical significance. For example, for ventilation technologies we see that public R&D together with (long run) taxes imply a highly significant positive impact on patenting activity.
44 Eurostat 45 There is no mathematical rule for the sign/significance assignment in the table. We start by classifying the regres-sions as to whether they produce meaningful results or not. Only thereafter, we compare the evidence across the remaining specifications.

Innovation of energy technologies: the role of taxes
31
Table 2.4: Sign and statistical significance of estimates Technology Public
R&D Legislation Patent
trend Price (long run)
Tax (long run)
Lighting + ++ ++ 0 +
LED + 0 0 0 0
Biomass 0 NA 0 ++ ++
Boilers 0 NA - 0 ++
Ventilation ++ 0 0 0 ++
Motor vehicles + NA 0 0 ++
Paper and pulp NA NA + ++ ++
Note: Signs represent the statistical size of impact across models. Roughly, a single sign represents cases with a coef-ficient being weakly significant in a few model estimations, whereas a double sign requires higher signifi-cance and agreement across estimations.
Source: Copenhagen Economics We complement this table with estimates from the estimation we prefer the most for each technology, c.f. Table 2.5. However, due to econometric issues, we are reluctant to put too much emphasis on a single specification and instead prefer to look at general patterns across estimations. One should therefore also be very careful when comparing the two tables. There are two specific caveats. One specific caveat is that the tax estimates comes on top of their implicit price impacts. Thus, if the price effect is significant, then the tax is also significant by default, but may have an additional effect which is tested by the specific tax coefficient. Thus, in Table 2.4 we can characterise, say, the long run tax impact as highly positive (“++”) despite the additional tax effect being slightly negative as long as the total long run price estimate is positive and sig-nificant. The other caveat concerns the difference between short and long run effects. A short run ef-fect is estimated directly as a parameter in the econometric specification, while the long run effect must be calculated based on the dynamic structure of the specification. For example, if the model is given by
then the short run effect is given by β, i.e., the immediate impact from last year’s tax in-crease, while the long run effect will be calculated as β/(1-α), i.e., the accumulated effect over a number of years (approximated by the infinite horizon).

Innovation of energy technologies: the role of taxes
32
Table 2.5: Selected coefficient estimates Technology Public
R&D Legislation Patent
trend Price short run
Price long run
Tax short run
Tax long run
Lighting -0.163 0.251*** 0.425** -0.163 -0.579 1.526* 0.496
LED 0.062 -0.041 NA 0.493 -0.636 -0.174 0.416
Biomass -0.020 NA 0.555 0.719*** 0.283** -1.168 1.074
Boilers 0.000 NA -0.348 -0.140 0.227 0.951*** 2.332***
Ventilation 0.130*** 0.111 -0.336 -0.314 -0.531 0.718 2.369***
Motor vehicles 0.046 NA NA 0.392 0.081 1.110 2.192**
Paper and pulp NA NA 0.165 0.188 0.467*** -0.851 -0.288
Note: * implies significance at the 10 pct level, ** at the 5 pct level, and *** at the 1 pct level Source: Copenhagen Economics From the above tables there seems to be three main messages. First, environmental taxes have much stronger and more lasting effects on patenting than short run price movements. This is evident from comparing the last two columns of Table 2.4. We attribute the credibil-ity and transparency of taxes compared to the volatility of energy prices to this difference.46 Second, public ‘institutions’ (such as public R&D and legislation) surrounding the private innovation environments do contribute positively to patenting. This is evident from looking at the first two columns. Third, technologies such as lighting and LED with small energy budget shares do not seem to experience much price/tax induced innovation. This is the message from the first two rows of the table. The first observation concerning the role of taxes for innovation leads to the question of the economic importance, i.e., to the size of the coefficient estimates. We illustrate the sizes of short and long run impacts in Figure 2.11. For the majority of industries, we observe a much higher impact from taxes than from prices. Long run elasticities are in the range 2-2.5, c.f. Figure 2.10, which is approximately five times larger than the estimated price impacts, see Figure 2.11 below. In both cases, one should not forget that we have focussed on significant – and thereby typically the largest - es-timates, but still we believe that there is strong evidence of very significant impacts.
46 In our data set, the tax variable is approximately 40-60 percent less volatile measured by (comparable) standard errors.

Innovation of energy technologies: the role of taxes
33
Figure 2.10: Innovation impacts from environmental taxes, significant estimates
Note: The significance criteria are consistent with the sign criteria in the previous table. Source: Copenhagen Economics There are two sectors where the prices (including taxes) turn out to be significant drivers of innovation; biomass in buildings and the paper and pulp industry. In both cases, the elastic-ity estimates of around 0.4 are very much in line with the results from the rest of the litera-ture (in the previous section we also reported 0.4 as the average estimate). Again, this implies that a 1 percent increase in energy prices leads to a 0.4 percent increase in patents. The esti-mates on biomass in buildings are characterised by a high short run impact and a more mod-erate long run impact (the latter being more in line with the literature.) However, the stan-dard error attached to the short run estimate is much higher, so the more plausible ranking of low short run and high long run is still within reasonable confidence intervals. It seems natural that the effect in the paper and pulp industry comes directly from prices as environ-mental taxes on industrial processes historically have been zero or very close to zero.
0
0.5
1
1.5
2
2.5
Lighting LED Biomass Boilers Ventilation Motor vehicles
Paper and pulp
Short run tax Long run tax

Innovation of energy technologies: the role of taxes
34
Figure 2.11: Innovation impacts from energy prices, significant estimates
Note: The significance criteria are consistent with the sign criteria in the previous table. Source: Copenhagen Economics The fact that innovation responds considerably more to taxes than to prices may have several explanations. The first explanation concerns the stability and credibility of taxes (we will also return to this point later when we discuss policy mix in chapter 4). Tax rates are imple-mented with long horizons and are seldom reset to lower levels. Thus, they send an unambi-guous signal to innovators that prices will remain at higher levels. In contrast, price changes may be caused by short run expectations, economic upturns etc. which does not provide long term incentives for R&D investments. Other types of explanations concern the econometric methodology and statistical behaviour, i.e. they imply that estimations contain some bias. The econometric methodology works un-der functional form approximations, c.f. the discussion in the appendix. These approxima-tions may cause some bias – especially for fuels where taxes form a relatively large part of end user costs, e.g., gasoline for motor vehicles. Moreover, the fact that tax rates change rather infrequently and typically in a unidirectional way suggests an easier identification of long run impacts for the class of estimators. Energy price movements are frequent and not unidi-rectional thereby giving rise to much short term noise easily influencing the econometric es-timates. Note that this latter explanation implies that price elasticities are estimated with a negative bias (they are too low compared to true effects), rather than tax estimates being too high. Looking at the above results from a slightly different perspective, we have three different classes of estimates/technologies. For lighting and LED technologies, we do not find evi-dence of the induced innovation hypothesis; neither from prices nor from taxes. In a second class, we find typical consumer good technologies (boilers, ventilation, and motor vehicles) where price signals play a minor role compared to tax counterparts. Estimates are both eco-nomically and statistically significant. Finally, biomass in buildings together with paper and
0
0.2
0.4
0.6
0.8
1
1.2
Lighting LED Biomass Boilers Ventilation Motor vehicles
Paper and pulp
Short run price Long run price

Innovation of energy technologies: the role of taxes
35
pulp technologies follow the induced innovation hypothesis directly from prices although at somewhat lower response estimates. A priori, we would assume that the biomass in buildings belonged to the second class (together with the related technologies boilers and ventilation), but this was not confirmed by the estimations. A second output of the estimations relates the time lags in the induced innovation hypothe-sis, c.f. the discussion above. Typical estimates of half lives were 3-5 years, where a half life is the time it takes from the price/tax signal to half of the induced patents to be filed. Thus, the first half of patents appears within 3-5 years, while the other half takes longer to materialise. Overall, we confirm this range despite most technologies falling in the lower end of this range, c.f. Figure 2.12.47 Common for both our estimates and those found in the literature is a large uncertainty attached to the estimates. The primary cause for this uncertainty is related to the methodological approach where the parameters capturing the dynamics of patenting almost completely govern the half life estimate. Despite the considerable uncertainty, we still believe that the estimate seems economically reasonable and intuitive. Figure 2.12: Half life estimates
Note: Half times are based on lag structure and estimated dynamic multipliers. Source: Copenhagen Economics
Graphical inspection of patent data and relationship between innovation and prices In this section we take a less sophisticated look at the data. Specifically, we use graphical techniques to investigate patents and energy prices and taxes. Due to the amount of data (30 years, 30 countries, 13 energy products, and 7 technologies) we focus on a few (more or less randomly) selected examples.
47 We have included half life estimates for lighting and LED even though the induced innovation hypothesis was not confirmed. Technically, half lives can be retrieved for statistically insignificant price/tax estimates without any problem.
0 1 2 3 4 5
Lighting
LED
Biomass
Boilers
Ventilation
Motor vehicles
Paper and pulp
years

Innovation of energy technologies: the role of taxes
36
The specific purpose of this section is to provide the reader with a flavour of the underlying relations between prices and patents and to introduce some of the econometric issues in the empirical analysis. Anticipating the conclusions from the latter issue, i.e., what a good em-pirical model will need to capture, we can state the main elements as follows:
Dynamic effects of patents. We show that a change in patenting activity created dynamic reactions several years after the initial change.
Common trends unrelated to energy prices. A significant portion of the trend throughout time seems to relate to changes in industry structure, developments of global markets, etc.
Country differences. Specifically, the model needs to account for the fact that large countries produce more patents than small countries.
Fuel / energy source. Several technologies can draw on different energy sources and we need the right match between patents and energy price.
Taxes are (sometimes) relevant as a separate component. We identified some cases where taxes constitute a large proportion of the end user price.
In the paragraphs below, we will demonstrate why we derived these conclusions. We will not go into further technical details of the applied methodology here, and we refer the interested reader to Appendix A. Patents We choose to let the number of patents within a certain technology class be a measure of in-novation. It is undisputed that a substantial part of private R&D is made with the purpose of issuing patents and subsequently earning economic rents on these patents. As such, the measure should be a valid indicator of private R&D output. In the literature, patents are clearly also the favoured measure of innovation, cf. our discussion above on innovation im-pacts. Yet, the literature also points to drawbacks and limitations of this measure. In the fol-lowing, we sum up the most important criticisms:
Patents are specific to some physical aspect of the world, not to working or organ-isational processes. In this way, we do not capture many relevant progresses in, say, the organisation of industrial production processes.
Patents may differ quite a lot in their quality/relevance. A good patent can contain more ‘innovation’ than hundreds of inferior patents.48
Important innovations may never be patented. Rather, the inventor may want to keep his invention secret or exploit the commercial value without a protecting pat-ent for various reasons.49
48 Popp (2006). 49 Levin et al (1987).

Innovation of energy technologies: the role of taxes
37
Leaving aside these concerns, we can take a look at patent characteristics. Within energy-related technology groups, patenting is most substantial for buildings and energy generation, c.f. Figure 2.13. We also observe that carbon storage together with paper making technolo-gies seem to trend in slightly different ways than the other technology classes. Note that we do not consider any technologies within carbon storage in the econometric work. Figure 2.13: Number of patents across technology classes, OECD countries
Note: The vertical axis measures the total number of patents Source: Copenhagen Economics based on EPO To obtain an impression of the development at country level, we illustrate the level of pat-enting across selected countries in Figure 2.14. We see that countries have quite different levels of patenting, e.g., Japan is a clear outlier due to formal reasons in the patenting system. However, also European countries show differences which are not merely related to the size of the economies. For example, Finland and Sweden produce marginally more patents than larger countries such as Italy and Spain. Thus, the suggested panel data approach controlling for country fixed effects seems reasonable.
0
5,000
10,000
15,000
20,000
25,000
30,000
35,000
1978
1980
1982
1984
1986
1988
1990
1992
1994
1996
1998
2000
2002
2004
2006
Buildings
Energy Generation
Paper Making
Transport

Innovation of energy technologies: the role of taxes
38
Figure 2.14: Patents across countries
Note: The vertical axis measures the total number of patents Source: Copenhagen Economics based on EPO An interesting characteristic about patents concerns their dynamic behaviour. There are good economic reasons why patenting in one year is closely related to patenting in the previ-ous year. First, company level choices of investing in R&D are hardly ever a year by year dis-crete choice. Instead, money flows to R&D departments often have longer horizons which create dependence between years not only on the input side, but also on the output side. Second, patents will often feed into new patents within the same class. When researchers come up with important technical advances, these will spread out to all related fields in the next years. In Figure 2.15 we demonstrate the dynamic patterns. The figure shows the patenting activity for six EU Member States year by year as the relative activity compared to the country’s av-erage activity over the entire 30 years. (That is, a value of 10 percent in a given year tells us that patenting was 10 percent above the country’s average patenting level.) In this way, series that seldom cross the 0-line display significant dynamics; a high level in one period carries over to the next period and similarly for low levels.50 The figure clearly demonstrates that there are rather few intersections over time. Furthermore, the figure demonstrates a signifi-cant increase in volatility around 2002. One possible explanation is the political attention devoted to energy efficiency and bans of light bulbs over this period starting with Directive 2002/91/EC. This may have triggered some patenting; both patents that were simply wait-ing for the right moment to apply and patents following up on specific legal requirements. To the extent that on-the-shelf patents were issued, this would explain much of the volatility increase.
50 In a 30 years series completely without dynamics, we would in average see almost 15 crossings.
0
10,000
20,000
30,000
40,000
50,000
60,000
70,000
80,000
90,000
100,000
JP CN DE
US FR GB
RU FI CA AT
AU SE NL IT ES CH PL BE DK CZ HU
NO GR PT
457,664

Innovation of energy technologies: the role of taxes
39
Figure 2.15: Patenting dynamics for six EU MS, 1978-2007, lighting technologies
Note: The figure shows the number of patents relative to the country average over time. Source: Copenhagen Economics based on EPO Patents, energy prices and taxes The purpose of the econometric study is to test the impact from energy prices (and taxes) on patenting activity within various technology classes. In this section, we take a short look at this relation. In Figure 2.16 we see the development in transportation patents for four se-lected countries (all being motor vehicle producers) together with oil prices. We see that pat-ents often, though not always, covariate with prices. In particular, it is interesting to observe the differences in behaviour around the second oil crisis (1979-1980). For all four countries we see a clear upward trend in oil prices, with the high price remaining a few years into the 1980s. When it comes to patenting, however, German car producers hardly show any response to the new situation, whereas Japanese car manufacturers seem to respond quite fast. (UK and France do moderately increase patents for a short period.) The most straightforward interpretation of this difference relates to the different market segments. To put it bluntly, German cars were aiming at customers looking for comfort and robustness, while Japanese cars were sold to customers focusing on the price-quality dimension. Hence, Japanese car producers had to respond to higher gasoline prices to offer a cost-efficient product. Obviously, there may be several other factors explain-ing this difference, e.g., differences in expectations towards national policies.
‐150%
‐100%
‐50%
0%
50%
100%
150%
200%
250%
300%
1978
1980
1982
1984
1986
1988
1990
1992
1994
1996
1998
2000
2002
2004
2006
AT BE ES FR GB IT

Innovation of energy technologies: the role of taxes
40
Figure 2.16: Refined oil end user prices and patenting in motor vehicles, four large car-producers
Note: The left vertical axis displays dollar prices of oil. The right vertical axis displays the number of patents. Source: Copenhagen Economics based on EPO and IEA data. The car example can also demonstrate two other important points complicating the analysis between prices and innovation. The first point concerns the composition of patents. Even in the German case without much overall response to the second oil price crisis, there could still be a significant change in the number of patents directly related to fuel cost savings at the cost of other patents. We simply do not know.51 The second point is related to the choice of fuel price. In the figures above, we plot patenting activity against the price of oil , but cars consume gasoline or automotive diesel, not crude oil. And in the case of gasoline, the stan-dard type has changed from leaded to unleaded over the period of interest. The choice of the relevant fuel becomes particularly relevant when taxes start playing a more pronounced role. Turning to another example, we can look at the paper and pulp industry where the energy costs are incurred during the production of the goods, not during deployment. Figure 2.17 provides a simple cross-plot of patents and the relevant industry electricity price. Obviously, such a simple representation must not be taken as evidence for a strong positive relation be-tween prices and innovation. Yet, it does provide a first impression of the basic correlation to be more precisely determined in the econometric analysis. Moreover, Figure 2.17 demonstrates some of the challenges in working with a panel consist-ing of both a country and a time dimension. The figure “identifies” two paths in patenting: One path which clearly responds to underlying prices and another which is completely im-
51 Or to put it more precisely: it would require a case-by-case examination of all patents together with some scoring technique.
0
100
200
300
400
500
600
0100200300400500600700800900
1978
1980
1982
1984
1986
1988
1990
1992
1994
1996
1998
2000
2002
2004
2006
Num
ber o
f paten
ts
US‐$ in 200
5 PP
P
Germany
oil price transportation patents
01020304050607080
0100200300400500600700800900
1978
1980
1982
1984
1986
1988
1990
1992
1994
1996
1998
2000
2002
2004
2006
Num
ber o
f paten
ts
US‐$ in 200
5 PP
P
France
oil price transportation patents
0
10
20
30
40
50
60
0100200300400500600700800900
1978
1980
1982
1984
1986
1988
1990
1992
1994
1996
1998
2000
2002
2004
2006
Num
ber o
f paten
ts
US‐$ in 200
5 PP
P
UK
oil price transportation patents
0
200
400
600
800
1000
1200
1400
0
200
400
600
800
1000
1978
1980
1982
1984
1986
1988
1990
1992
1994
1996
1998
2000
2002
2004
2006
Num
ber o
f paten
ts
US‐$ in 200
5 PP
P
Japan
oil price transportation patents

Innovation of energy technologies: the role of taxes
41
mune to price changes. A good econometric model will need to control for these two paths (much is already done by introducing country fixed effects thereby measuring characteristics such is size and industry starting point.) Figure 2.17: Electricity prices and patenting in the paper and pulp industry
Note: The figure is based on yearly data points for all countries in the sample. Source: Copenhagen Economics based on EPO and IEA statistics Finally, in specifically assessing the relationship between innovation and taxes, one must first ask for the historical importance of taxes. As shown in Figure 2.18, taxes have played a mi-nor role for most energy products, except gasoline and automotive diesel. In other cases, it is questionable how much taxes can contribute to the trends in patenting. However, the figure hides the fact that the data may contain significant cross-country and time series variation even when the average level is low. Furthermore, as explained elsewhere in this report, there are good reasons why tax changes may create larger innovation effects than similar price changes (due to non-tax changes.) In fact, part of the estimation strategy is to estimate both in levels and in differences in order to address this issue.
0
200
400
600
800
1000
1200
1400
0 0.05 0.1 0.15 0.2 0.25
Num
ber o
f paten
ts per year
Electricity price, industry, PPP US‐$ per KWh

Innovation of energy technologies: the role of taxes
42
Figure 2.18: Tax shares for different fuels, OECD averages 1978-2007
Note: The tax share is calculated as the $ amount of taxes relative to the final end user price (in $). Averages are simple, not weighted.
Source: Copenhagen Economics based on IEA
0%
10%
20%
30%
40%
50%
60%
70%
80%
90%
100%Tax share of end
user price, average
197
8‐20
07
Household
Industry

Innovation of energy technologies: the role of taxes
43
The previous chapter substantiated that energy and CO2 taxes are likely to have considerable effects on the innovation of energy technologies; nevertheless more direct public support for climate friendly technologies is also needed. This chapter is divided into four sections. The first section 3.1 describes the individual tasks to be fulfilled by taxation on the one hand and R&D support on the other, i.e., what is the division of labour? The second section 3.2 then takes a closer look at the interaction between the two instruments. That is, we address the question: to what extent in particular are the benefits of energy related public RD support depending on the tax environment? The third section 3.3 reviews how the mix between tax and R&D depends on the stringency and time horizon of policy ambitions. Finally, the fourth section 3.4 reviews some empirical studies on optimal policy mix between energy taxes and RD policies in delivering on global climate policy objectives. Throughout the chapter we will repeatedly draw on results from a simple simulation model, the CERIM (Copenhagen Economics Renewables Innovation Model) in order to illustrate important points. An introduction to the CERIM is given in Box 3.1 below, while a formal model description can be found in Appendix B.
3.1. DIFFERENT ROLES FOR DIFFERENT INSTRUMENTS In this section we address the different roles economic theory attaches to environmental taxation and R&D support. We will focus on the following four issues:
The dual externality problem The long term credibility problem R&D support and crowding out The effect on innovation played by non market-based mechanisms
Chapter 3 CLARIFYING THE ROLE OF TAXATION VIS-A-VIS DIRECT
INNOVATION POLICIES

Innovation of energy technologies: the role of taxes
44
Box 3.1. Introduction to the CERIM Copenhagen Economics Renewables Innovation Model is based on the formulation in Fisher and Newell (2008). The focus is on the US electricity sector, and the model divides production in four technologies: nu-clear, coal, natural gas, and renewables. Since the establishment of nuclear plants is more closely linked to political processes than market signals (and since it is non-emitting), we assume an exogenous path for this technology. The model contains two periods each containing several years. The first period starts from the current situation (parameter estimates from around 2008) and covers n1 years while the second period starts immediately after (and contains n2 years.) The renewable sector has the potential for technological advance depending on how much resources are al-located to R&D in the first period. The benefits, in terms of lower renewable production costs, are reaped in the second period. The policy maker has two instruments at his disposal: a carbon emission tax and an R&D subsidy. In this way, he can influence the production and emission path of the electricity sector by setting taxes and subsidies in both the current and in the future period. The model is based on firm profit maximisation and consumer utility maximisation. The outputs of the models are multiple: carbon emissions, renewable shares, welfare, etc.
Source: Copenhagen Economics
The double externality problem Up to this point, we have only addressed the problem of missing prices for pollution. As should be clear by now, environmental taxes will – at least partially – be able to solve this problem. But when it comes to innovations of green technologies there is an additional problem. A new innovation may create positive spillovers to other firms and the rest of the economy since innovations can be improved, standardized and create the basis for new technology classes. But these positive effects, which may exceed the direct profit creating effects to the company by several factors, are not fully appropriated by the company financing the re-search. Thus, the investments in company R&D are not sufficient when compared to the societal gains they create. In other words, we again see a missing price (payment in this case) for the effects created by an economic activity, R&D52. Below, in Figure 3.1, we illustrate the double externality problem graphically. In the left panel, we see the environmental externality as a difference between social and private mar-ginal cost curves (SMC and PMC respectively) – social marginal costs include the cost of climate change and other pollution damages and are therefore higher. A good environmental tax would add to private marginal costs so that these become exactly aligned with the social counterpart. That is, the tax should equal the vertical distance between the two cost curves; this distance is denoted by ‘A’ leading also to a reduction in emissions.
52 “All private sector innovation suffers from market failures. These are even more acute in the case of climate change, as environmental market failures compound the problem. Thus, policy plays a key role in shaping both the direction and magnitude of climate-friendly technological change”, Popp (2010).
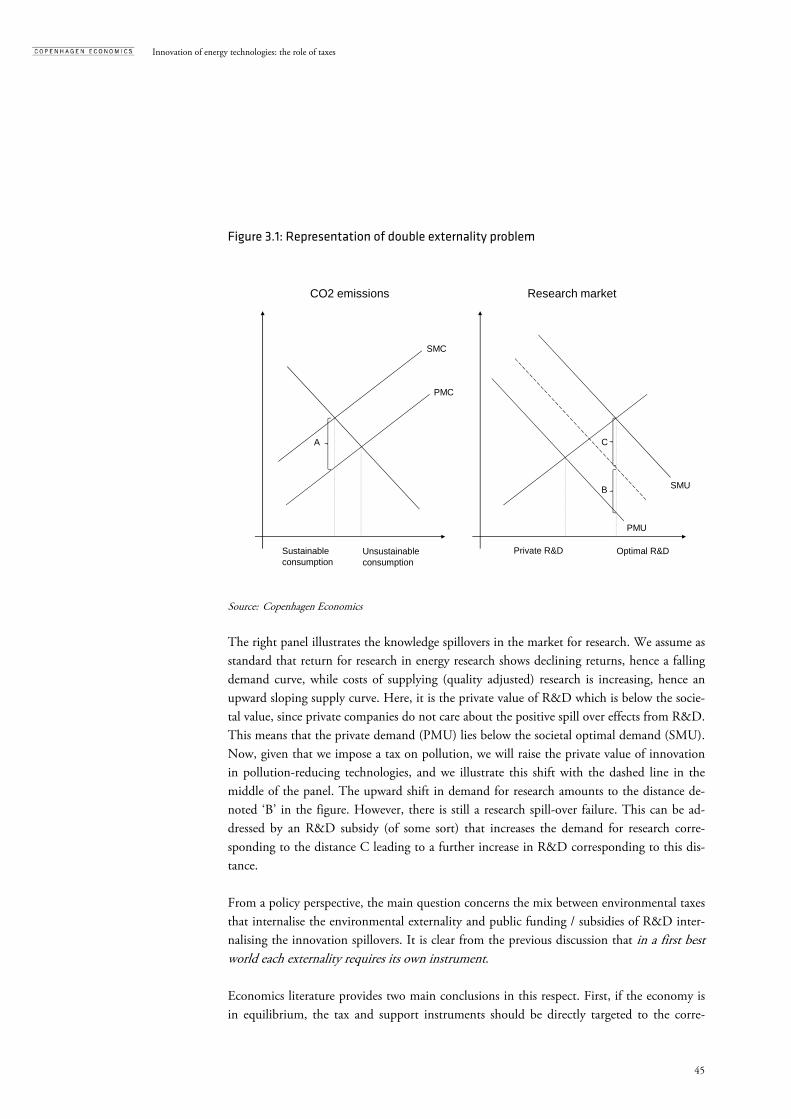
Innovation of energy technologies: the role of taxes
45
Figure 3.1: Representation of double externality problem
CO2 emissions Research market
Sustainable consumption
SMC
PMC
Unsustainableconsumption
SMU
PMU
Private R&D Optimal R&D
A
B
C
Source: Copenhagen Economics The right panel illustrates the knowledge spillovers in the market for research. We assume as standard that return for research in energy research shows declining returns, hence a falling demand curve, while costs of supplying (quality adjusted) research is increasing, hence an upward sloping supply curve. Here, it is the private value of R&D which is below the socie-tal value, since private companies do not care about the positive spill over effects from R&D. This means that the private demand (PMU) lies below the societal optimal demand (SMU). Now, given that we impose a tax on pollution, we will raise the private value of innovation in pollution-reducing technologies, and we illustrate this shift with the dashed line in the middle of the panel. The upward shift in demand for research amounts to the distance de-noted ‘B’ in the figure. However, there is still a research spill-over failure. This can be ad-dressed by an R&D subsidy (of some sort) that increases the demand for research corre-sponding to the distance C leading to a further increase in R&D corresponding to this dis-tance. From a policy perspective, the main question concerns the mix between environmental taxes that internalise the environmental externality and public funding / subsidies of R&D inter-nalising the innovation spillovers. It is clear from the previous discussion that in a first best world each externality requires its own instrument. Economics literature provides two main conclusions in this respect. First, if the economy is in equilibrium, the tax and support instruments should be directly targeted to the corre-

Innovation of energy technologies: the role of taxes
46
sponding externality, c.f. the discussion above. Second, if the knowledge stock on environ-mentally friendly technologies is too low (i.e. there is disequilibrium), then both instruments could be used more aggressively than simply by addressing the equilibrium externalities. Ad-aptation of new policies that dramatically changes relative prices in the economy – i.e. price of carbon – is a clear example of how the stock of knowledge capital in a sector can change from being in equilibrium in view of the old policy stance and become far too low relative to future needs with new policy stance. Below, we discuss each of these arguments in turn. Starting with the argument focussing on equilibrium externality effects, we find that policies to address knowledge spillovers are more effective if they address all knowledge spillovers, rather than focusing exclusively on R&D pertaining to alternative energy.53 Similarly, the lit-erature suggests that environmental taxes should directly target what they are meant for – the externality.54 Not surprisingly, technology subsidies alone have a smaller environmental im-pact than policies that directly address the environmental externality. Yet, one can play with the idea of setting a high energy tax to attain both objectives.55 If the tax is sufficiently high, one could induce the level of innovations in green technologies that are optimal from a societal point of view. This corresponds to setting a high tax that shifts the dashed line in the right panel of Figure 3.1 sufficiently to reach the line for societal op-timal demand. However, the tax will necessarily be distorting. First, it will over-internalise the environmental externality and therefore distort consumption choices. Second, it will in-duce innovations in green technologies only, and will therefore not solve the general knowl-edge spill-over externality that exists for all types of R&D. In fact, the studies playing with this idea come to the conclusion that it is in-optimal from an environmental point of view.56 Turning to the case where we assume a current disequilibrium in the knowledge stock or similar, the previous conclusion will be challenged. For example, we can imagine that the green technologies R&D stock has been neglected for decades (say due to missing price sig-nals) such that the additional societal value of R&D in these technologies largely exceeds that of other technologies.57 In such cases, we need a push in green technology innovations. It is therefore argued that environmental taxes may play a role in achieving this.
53 Schneider and Goulder (1997). 54 Popp et al (2009). 55 Popp (2006), Hart (2008). A secondary argument relates to the use of revenues from taxes on energy and carbon. Potentially, the labour distortions resulting from energy taxes may be lower than income taxes. Hence a switch from energy taxes to income taxes may improve labour market functioning. However, this argument is tricky: energy taxes may have less of an impact on labour market because energy demand is less income elastic than other con-sumer goods and hence have a lower impact on marginal tax rates than for example VAT. But that is reflected by definition in a redistribution of net income from low to high income families. In effect any policy that accepts such a redistribution can be used to finance lower marginal tax rates. For this and other reason, the very extensive Mirrlees review (2010) undertaken by the Institute of Fiscal Studies,UK, was very sceptical about using labour mar-ket arguments for raising energy or other environmental taxes. 56 Hart (2008), Popp (2006), Greaker and Pade (2008). 57 See Acemoglu et al (2009) for an example of this argument.

Innovation of energy technologies: the role of taxes
47
A similar argument is based on rising societal cost of emissions (i.e., temperature increases become more and more expensive to deal with.)58 In this case, the spillovers from emissions-savings knowledge will again be more valuable than spillovers from other innovations, justi-fying a temporary increase in the optimal emissions tax as well as R&D support to account for differences in the social benefits of spillovers across technologies.59 Another type of exception – still arising from economic disequilibria – is if patent policy is weak. Then additional environmental taxes are justified as a second-best policy for address-ing the knowledge market spill-over.60 Still, we emphasise that the solution is second-best, especially as we would distort innovations towards green technologies (now assuming that this is not necessary.) Thus, our reading of the literature on solving the double externality problem suggests that both an environmental tax and R&D support is the only way of adequately addressing the problem.
The long term credibility problem R&D is a risky investment that, when yielding new profit opportunities for private compa-nies, will pay off in a distant future. Cost-benefit analyses of various research projects must therefore include the risk that pollution prices are not predictable far in the future.61 Since many research projects in green technologies can move from the green to the red zone for small variations in, say, emission prices, it is extremely important that long term tax policies are well-defined, credible, and demonstrate a high degree of continuity over time. The literature has recognised that it is the expectations of future policies that motivate R&D, and that emission caps put in place before innovations resulting from R&D can be deployed have no effect as incentives.62 Indeed, the literature emphasises the ‘announcement effect’ of future carbon limits.63 In the case of emissions prices, studies point to the large uncertainty attached to future commitments and allocation of allowances.64 The literature suggests that high volatility in prices of CO2 considerably reduce willingness to make early investments in low carbon power generation and carbon and capture storage (CCS) technologies.65 Such volatility sig-nificantly increases investment risk and cost of capital which makes it profitable to postpone investments. So CO2 price volatility may hamper the investments that climate policy is at-tempting to encourage. Uncertainty in climate policy contributes to volatile CO2 prices and
58 See, e.g., Fankhauser (1993). 59 Hart (2008). 60 Greaker and Pade (2008). 61 Baker and Adu-Bonnah (2008). 62 Yang et al (2008). 63 Montgomery (1972), Montgomery and Smith(2007). 64 DEFRA (2008). 65 Blyth et al (2007), Celebi and Graves (2009), Weber and Swider (2004).

Innovation of energy technologies: the role of taxes
48
therefore long-term policy certainty is vital to minimise investment risks in low carbon tech-nologies. The example of carbon prices, therefore, fits quite well with the notion of dynamic inconsis-tency.66 Carbon prices will need to be high to create additional R&D investment possibili-ties, but even if the policy makers announce future emission levels that create such an incen-tive, the government will prefer reneging on this level once the technology is developed. To sum up, when policy makers opt for more aggressive environmental taxes, it is of utter importance that these policies are credible and communicated in a convincing way. Any le-gal manoeuvre that will bind future policy makers to stringent carbon taxing will be good for current R&D investments.
R&D crowding out Crowding out of R&D is an issue when we attempt to emphasise innovations of green tech-nology, irrespective of our instruments. It is therefore related to the discussion of using taxes to equilibrate imbalances in the current state of the economy. Thus, if we assume a current disequilibrium in research efforts of energy technologies, the entire discussion of crowding out becomes much less important: one unit of more research in energy technology has a higher value to a society than 1 unit of research in other fields of research. In the relevant case of targeting R&D support in an economy with no knowledge stock imbalances, the ba-sic message from this subsection is that R&D externalities from all technology branches should be equilibrated. We should note two things from the beginning of this discussion. First, we note that R&D crowding out is unavoidable in reaching the goal of more research in green technologies – human and physical resources must be drawn from somewhere in the economy. Yet, in the typical understanding of the word, crowding out specifically refers to a reduction of research (spending, employment, patents, or similar) in another technology branch to substitute the increased research in green technologies. Second, we note that both higher taxes as well as larger targeted R&D subsidies lead to crowding out. However, while the two instruments are formally equivalent, there exists an important dif-ference in the labour market distortions created by each instrument. Where taxes will help collect revenue that can be recycled to neutralise any adverse effect on labour supply, R&D subsidies will have the opposite effect since gathering of tax revenue is a prerequisite for funding expenditure. So gains from spillovers must exceed tax induced distortions from RD funding.
66 Montgomery and Smith (2007).

Innovation of energy technologies: the role of taxes
49
In addition, our reading of the empirical literature on induced innovation tells us that crowding out seems to exist. 67 Impacts on aggregate R&D expenditures and patenting are much smaller than for specific, smaller technology classes. Thus, there seems to be smaller, if any, effects on total innovation stock, so the effects obtained at disaggregated level must stem from reallocation of R&D efforts.68
Command-and-control systems and innovation In this section we address the sufficiency of market based systems. That is, we ask if envi-ronmental taxes and R&D subsidies need to be complemented by command-and-control policies to boost innovation. We have already touched upon the question in section 2.1 above stating that campaigns together with information and technology standards seem to create larger consumer responses (thereby creating more innovation.) Evidence on the efficacy of command-and-control mechanisms is mixed as regards effect on innovation. Some studies point to the basic problem that there is no incentive to innovate beyond the current technology standard.69 Also, command-and-control is typically designed to punish underperformers, while over-performers – those being ahead of the standard – are not rewarded. Other studies, which look directly at patents related to a specific technology standard, find quite impressive innovation effects.70 Thus, command-and-control may under certain circumstances be efficient in reaching medium run climate targets while they do not seem to provide long run solutions. Critics of pure market-based systems also see a role for command-and-control mechanisms in introducing close-to-market technologies that would see long lead times due to uncertainties.71 Summing up, market-based mechanisms are likely to solve most of the double externality problem as long as the technologies of interest are not too costly and risky. Publicly funded research must step in to assure that the entire research portfolio is sufficiently diversified to reach the climate targets.
3.2. THE INTERACTION BETWEEN TAXATION AND R&D SUPPORT Given that taxation and R&D have different roles in promoting environmental friendly in-novation, we must consider how they interact under certain circumstances. We focus the discussion on the following two issues:
Innovation and rebound effects The proper timing of support and taxation
67 Popp (2004), Gerlagh (2008). 68 Hamamoto (2006), Brunnermeier and Cohen (2003). 69 Popp (2010), Magat (1978), Milliman and Prince (1989). 70 Popp (2006) 71 Montgomery and Smith (2007).

Innovation of energy technologies: the role of taxes
50
The discussion below examines these two points.
Support for green technologies, their deployment and rebound effects Any policy boosting technological advance in a particular area will drive consumer demand in this direction. If we support technologies that lower the costs of using energy, then con-sumers will respond by increasing the level of the energy consuming activity, c.f. the above discussion on energy price elasticity. This is the so called rebound effect. A study measuring the rebound effect from fuel efficiency innovations finds that 60 percent of the improve-ments is lost again due to the rebound effect.72 This estimate seems to represent similar stud-ies quite well, c.f. Table 3.1. Table 3.1 Overview of studies of rebound effects Author/Date Region Efficiency improvements Estimated rebound effect Semboja, 1994 Kenya Improvements in both production
and consumption sectors >100% in both cases
Dufournaud et al, 1994 Sudan 100-200% improvement in effi-ciency of in heating stoves
47-77%
Vikstrom, 2003 Sweden 15% in production sectors and 12% in energy sectors
50-60%
Washida, 2004
Japan
1% all sectors
53% in base case
Grepperud & Rasmussen, 2004 Norway Doubling of historical growth rate of electricity productivity for four sec-tors, and doubling of growth rate of oil efficiency for two sectors
Small for oil but >100% in some cases for electricity
Glomsrod &Taoyuan, 2005 China Deregulation of coal cleaning indus-try, lowering price and increasing supply of clean coal
>100%
Hanley et al, 2005 Scotland 5% for producers (including energy supply)
>100%
Allan et al, 2006 UK 5% for producers (including energy supply)
37% in base case
Frondel et al, 2007 Germany Historical fuel efficiency improve-ments in the transport sector
57-67%
Source: Copenhagen Economics based on Allan et al. (2007) In this respect, it is important to make a distinction between “dirty” and “clean” technolo-gies.73 If we promote zero carbon technologies, rebound is not so problematic (apart from energy efficiency goals), while support for, e.g., clean coal or new diesel engine design is more problematic. When we promote the latter type of innovations, then we need at the same time to ensure that economic incentives intended to save CO2 are set sufficiently high. We need to see this as a complementary policy design where taxes are raised and R&D pro-jects with high spill-over effects are supported at the same time. Moreover, with end-of-pipe technology focusing on removing/reducing the polluting quan-tity, while leaving the basic service unchanged, taxation/carbon pricing is required for any deployment to take place. Within the area of energy, Carbon Capture and Storage (CCS) technologies are a clear example. They will add substantially to the costs of producing energy
72 Frondel et al (2007). 73 Aghion et al (2004).

Innovation of energy technologies: the role of taxes
51
while producing the same good, namely electricity. Thus even huge amounts of subsidies for development of CCS will come to nothing if CO2 is not priced. To put this concisely: re-search may take place, but there is no diffusion into the economy due to lacking incentives. At the other end of the spectrum, support for innovation in energy efficiency, lowering the costs of energy efficient products will have inherent value to consumers, thus leading to more deployment of these products even in the absence of carbon pricing. This brings us back to the discussion of the rebound effects stated above. Thus, support of innovation in both “dirty” and end-of-pipe technologies clearly requires taxation/carbon pricing to put a price on emissions.
Timing of R&D support and taxation In this subsection, we look at issues related to timing of tax rates and R&D subsidies. The basic insight goes as follows: assuming that R&D subsidies today can induce technologies that lower abatement costs in the future, then it will be societal optimal to have a rising tax profile.74 To understand this argumentation, we must first recall that CO2 pollution is basi-cally a stock, we can add to over time, for example over the two time periods: “today” and “tomorrow”. When additional CO2 cannot exceed a certain level after tomorrow, then the question arises of how to divide emissions between now and tomorrow. And it is obviously better to abate more, when abatement costs are lowest. Thus, a rising tax profile will ac-commodate an intelligent division between abatement today and tomorrow given that inno-vation actually lowers tomorrow’s abatement costs. This insight can easily be demonstrated by simulations with CERIM. The model can show the necessary carbon taxes to achieve a certain emission target, say a 10 percent reduction over a 20 year period. Maximising social welfare (in the US electricity industry) will suggest a rising tax profile over the model’s two base periods as shown in 3.2. The figure shows the tax related consumer welfare losses for a base year on both periods of the model.75 Moreover, the figure does so for both a constant tax scheme (top) and the optimal rising tax scheme (bottom). Take the case of the constant tax scheme. Without the tax, the electricity market price would have been 81.8 $/MWh, while the after-tax price (including equilibrium effects) becomes 87.3 $/MWh. This corresponds to a welfare loss (Harberger triangle) of $ 173 mill. In a second period year, this will be only 128 $/MWh thanks to the progress in renewables. If there are equally as many years in both periods (and no discounting), we can calculate the welfare loss as the simple sum of welfare losses amounting to 301 mil $. In contrast, imple-menting the optimal rising tax scheme (bottom of figure) yields a welfare loss of just $ 220 mill.
74 Fisher et al (1999). 75 Technically, we need to refer to welfare losses since we do not explicitly evaluate the pollution costs. The basic idea is that we give up something in the product market (a welfare loss) to achieve something else in the pollution market (a welfare gain due to cleaner air and less climate change). When we fix the gain to a 10 percent reduction, we can focus entirely on minimizing the welfare losses.

Innovation of energy technologies: the role of taxes
52
Figure 3.2: Welfare loss for constant and rising tax rates when achieving a 10 percent reduction in CO2 emissions, CERIM simulations
Note: The tax profile is calculated as the endogenous carbon price in a version of the CERIM with fixed total emis-sions corresponding to a 20 percent reduction and maximised welfare.
Source: Copenhagen Economics However, the reverse profile is called for when learning costs are substantial.76 In that case, it is better to start abating today, since time is of the essence. Hence, there is a central differ-ence in appropriate policies depending on the nature of technological progress. Classical in-novations require a rising tax profile, while learning-by-doing implies a decreasing profile. It therefore becomes a central question to estimate the size of learning effects. The tradi-tional “learning literature provides estimates in the range 5 to 20 percent a year.77 In Figure 3.2 we demonstrate the difference in break-even allowance prices for a hypothetical technol-ogy close to the market, when learning effects are 5 and 20 percent pro annum respectively. Clearly, there is a substantial difference between the two extreme cases, since technologies can double their efficiency within just a few years in the case of 20 percent, while the same improvement takes around 15 years in the other case. Overall, our reading of the literature suggests that learning rates should be in the lower end of the scale. Once, it is recognised that actual technological progress for any given product is affected by both past investments in R&D and past deployment (“learning”), estimates of learning tends to be at the low end often with gains from R&D being dominant. Further-more, “learning” is not for free: increased innovation in any particular technology tends to
76 Popp et al (2009). 77 McDonald and Schrattenholzer (2000)
Period 1 Period 2
Constant tax
Rising tax
87.3 $/MWh
81.8 $/MWh
81.9 $/MWh
77.1 $/MWh
173 mio. $ 128 mio. $
85.4 $/MWh
81.8 $/MWh
60 mio. $
82.4 $/MWh
77.1 $/MWh
160 mio. $

Innovation of energy technologies: the role of taxes
53
crowd out partially other advances of technology in the section on that subject. In short, a lot of caution is required when putting forward learning costs as an argument for early de-ployment. In Box 3.2 we provide a further discussion of learning effects and estimates thereof. Figure 3.2: Development of break-even prices for different learning effects
Note: The figure shows the development in the lowest possible allowance price that would facilitate introduction of
a certain technology experiencing learning effects. Source: Copenhagen Economics
0
20
40
60
80
100
120
1 2 3 4 5 6 7 8 9 10 11 12 13 14 15 16 17 18 19 20 21 22 23 24 25 26 27 28 29 30
Years from t0
Price
5 % learning effect
20 % learning effect

Innovation of energy technologies: the role of taxes
54
Box 3.2: Learning effect estimates
Source: Popp et al (2009)
3.3. TIME HORIZON AND STRINGENCY OF POLICY TARGETS In this paragraph we discuss how time horizon and stringency of policy targets influence the mixing of instruments. The basic insight here is that in the case of ambitious policies in a near future, we definitely need both taxation and R&D support. Less ambitious targets in a more distant future would mean that gradual improvements are sufficient and taxation itself will do a reasonably good job.
Time horizon A good way of shaping the discussion is to step back for a moment and consider Figure 3.3. The figure shows a standard innovation cycle from the initiation of R&D to final products that are sufficiently economical to penetrate the relevant market. The figure starts with the idea stage, leading approximately up to the patenting point, where researchers develop con-ceptual descriptions of new green technologies. We recall from the previous section that
Typically, studies on new energy technologies find faster learning for younger technologies, with esti-mates clustering around 15-20% for alternative energy sources such as wind and solar energy (McDonald and Schrattenholzer 2000).
Table 3.2: Learning rates Study Technology Diffusion Innovation
Criqui et al (2000) Wind 16 % 7 %
Jamasab (2007) Wind 13 % 26 %
Söderholm and Klassens (2007) Wind 3 % 13 %
Klassens et al (2005) Wind 13 %
Criqui et al (2000) PV 20 % 10 %
Jamasab (2007) Solar 2 % 5 %
Jamasab (2007) Nuclear 37 % 24 %
Jamasab (2007) CCGT 1 % 18 %
Source: Copenhagen Economics based on studies from the list One significant caveat with estimated learning rates is that they typically focus on correlations between energy technology usage and costs, rather than causation. Recent papers by Klaassens et al. (2005), Söderholm and Sundqvist (2007), and Söderholm and Klaassens (2007) attempt to disentangle the sepa-rate contributions of R&D and experience by estimating “two-factor” learning curves for environmental technologies. These two-factor curves model cost reductions as a function of both cumulative capacity (learning-by-doing) and R&D (learning-by-searching, or LBS). To be comparable with the notion of cumu-lative capacity, in these models R&D is typically aggregated into a stock of R&D capital. Thus, endogeneity is a concern, as we would expect both investments in capacity to be a function of past R&D expenditures and R&D expenditures to be influenced by capacity, which helps determine demand for R&D. Söderholm and Sundqvist address this endogeneity in their paper and find LBD rates around 5 percent, and LBS rates around 15 percent, suggesting that R&D, rather than learning-by-doing, contributes more to cost reduc-tions. However, these results are very sensitive to the model specification, illustrating the difficulty of sorting through the various channels through which costs may fall over time. To further address the problems associated with estimating and interpreting learning curves, Nemet (2006) uses simulation techniques to decompose cost reductions for PV cells into seven categories. Plant size (e.g. returns to scale), efficiency improvements, and lower silicon costs explain the majority of cost reductions. Notably, most of the major improvements in efficiency come from universities, where tradi-tional learning by doing through production experience would not be a factor. Learning from experience (e.g. through increased yield of PV cells) plays a much smaller role, accounting for just 10 percent of the cost decreases in Nemet’s sample.

Innovation of energy technologies: the role of taxes
55
price effects have around two to five year’s half-life on patents, implying that this phase in it-self is considerable when considering the induced innovation hypothesis. The next phase concerns prototype development. After this stage, the technologies are largely classified by their cost-effectiveness compared to current market technologies. Some innovations may climb up the ladder rather quickly while others require longer development times, e.g., due to complementarities with other technologies. Figure 3.3: Policy instruments during the innovation cycle
Mar
ketd
eplo
ymen
t
Idea stage
Prototype & demonstration stage
technologies(e. g. 2nd Generation
biofuels
High cost-gaptechnologies
(e.g. PV)
Low cost-gaptechnologies
(e.g. windonshore)
Maturetehcnologies(e.g. hydro)
Continuity, RD&D, create marketattractiveness
Stability, low-riskincentives
Technology-neutralcompetition
Stimulate market pull
Imposed market risk, guarenteed but declining
minimum return
Development Niche markerts Mass market Time
Source: Copenhagen Economics based on IEA (2008) There are four policy issues emerging from the figure. First, there is the question of the cy-cle’s time length – what is realistically attained within a 10, 20 or 50 year timeframe? As just mentioned, the literature (including our own investigations) estimates that half of induced patents are accepted within ca. 2-5 years after the price or tax change. The other half takes longer. And since patents are just the first stage on a long journey towards final products, we must accept that we often work with very long time leads. Unfortunately, the empirical literature is not very helpful in determining normal time frames for the remaining stages of the innovation cycle. The obvious interest of policy makers is the accumulated time frame from tax intervention to market penetration of green technologies, so we may draw on some historical examples. This is the content of Table 3.3. The table shows the time from conception, typically measured by the patent application, to market maturity (production) for five selected green technologies. We draw on some quite old and some newer examples. In most cases, we find innovation cycles of +20 years, while only Warren Johnson’s room thermostat had a very short lead time from patent in 1883 to large-scale production in 1885.

Innovation of energy technologies: the role of taxes
56
Table 3.3: Examples of innovation lead times Technology Short description Conception Market matur-
ity Motor vehicle technologies Energy Saving Module Ensure that compressors work at maximum ef-
ficiency 1983 Post 2000
EFI Electronic fuel injection 1952 1982 End-of-pipe technologies Carbon capture and storage Post-combustion CO2 is captured and stored
geologically 1977 Estimated 2008
Room heating technologies CO2 heat pump system Used for heating 1995 not yet
Mineral wool Used for thermal insulation 1840 1871 Room thermostat Regulate temperature of room or system 1883 1885 Source: Copenhagen Economics When lead times are significant, there are obvious implications for policy ambitions at dif-ferent time horizons. We simply cannot expect R&D subsidies to contribute much to the agreed 2020 Kyoto targets (as seen from today.) However, in reaching much more substan-tial reductions in 2050, it is much more reasonable to assume that innovation will play a role as discussed below.
Stringency of policy targets The higher the policy ambition, the higher is the level of optimal private and public spend-ing on climate related technologies. It should be clear from the previous discussions that low policy ambitions, e.g., low emission reduction targets, will imply relatively low value of R&D for the abaters: options based on existing technologies are cheaper. Instead, setting a high level of ambitions will imply a relatively high value of R&D, since current technologies are insufficient. A basic question is then how much more is optimal. For example will going from a 20 per cent cut in emissions to 40 per cent emissions in the same time period, require more or less than a doubling of optimal RD support levels? The size of the optimal increase is driven by factors pulling in different directions. On the one hand, the larger the ambitions, the larger the distortions to consumer welfare by using only existing technologies for abatement. This goes back to simple welfare economics as il-lustrated in figure 3.2 above: the additional loss to society of accepting in period 1 a more ambitious target is 113(=173-60) which is substantially larger than accepting the lower level of ambition which equals 60 despite a less than proportional increase in the emission cut. So the potential value to society of R&D that can replace existing technology is an increasing function of the levels of ambitions. This suggests that doubling the level of ambitions re-quire more than a doubling of R&D expenditures. On the other hand, the marginal return on a net basis of yet more R&D efforts going into the energy sector is falling as the quality of each new additional research project. Moreover,

Innovation of energy technologies: the role of taxes
57
the costs of producing quality-adjusted research is going up for example as the marginal costs of loosing innovation and production elsewhere in the economy as more resources are pulled into energy research are rising. The magnitude also plays a role for the way subsidies to R&D should be assigned. Simplify-ing quite a bit, we can state that subsidies to industrial R&D primarily obtain improvements in known technologies, and therefore primarily serve to shorten innovation cycles.78 In con-trast, subsidies to public fundamental research will serve to start entirely new inventions. So aiming for ambitious targets of 50-80 percent reduction suggests a larger fraction of R&D subsidies to public fundamental research. Consider, for instance, the case of solar energy. Despite research efforts that began during the energy crises of the 1970s, solar energy is still only cost competitive in niche markets, such as remote off-grid locations. This leaves a potential role for government-sponsored R&D to fill in the gaps, particularly in the case of climate change, where a diversified energy portfolio will be necessary to meet currently proposed emission reduction targets. So the bottom line is: the more stringent the targets the larger the role of R&D support to support innovation focusing more on technology leaps as opposed to marginal improve-ments of existing technologies where carbon pricing should do the main job.
3.4. THE EFFICIENT POLICY MIX OF CARBON PRICING AND R&D SUPPORT In this final section of the chapter, we will attempt to summarise the policy findings from above. Based on our previous results, we conclude that R&D support is particularly impor-tant if:
knowledge spill- over externalities are high, crowding out is limited, high imbalance between desired and actual research stock for exampling resulting
from adaptation of very ambitious long term climate and energy policies, public costs of funding are low, results from policy induced innovation come quick enough to help compliance
with policy objective.
Similarly, taxes are particularly important if:
pollution externalities are high, long term price signals are missing, end-of-pipe technologies are cost-efficient solutions to abatement,
78 Popp (2010)

Innovation of energy technologies: the role of taxes
58
strong rebound effects are present (higher demand for fossil fuels induced by tech-nology progress).
According to the above discussion, the two main ingredients in defining the efficient policy mix are the respective externalities from knowledge and from pollution which need to be de-fined in a long term perspective. The literature seems to suggest that pollution externalities are larger than knowledge externalities79. Indeed, while all such calculations are very sensitive to parameter assumptions as well as the policy goals to be reached, a number of recent em-pirical studies confirm the primacy of taxation and equivalent instruments in reaching long term climate and energy policy goals while also underlining the very useful role that direct RD support policies can deliver.80
• A OECD study suggests that carbon pricing consistent with ambitious 2050 global goals could induce a “four-fold” increase in energy R&D expenditure while public R&D policies could most productively be focused on “major” technological break-throughs” rather than marginal innovations81. It also concludes that even a 30-fold increase in energy related R&D would be insufficient to stabilise emissions which is linked to some of the issues discussed in this study such as rebound effects.
• An EU study suggests that, in addition to much higher carbon prices, substantial, frontloaded R&D support is needed to adjust to ambitious long term climate goals82. Other subsidy mechanisms are also investigated, but the combination of tightening emissions-caps (rising carbon prices) and up-front R&D support for green technologies yields the most favourable economic outcome. The study also concludes, similar to our previous findings, that R&D support must not favour green technologies in the long run and therefore suggests a phasing out of R&D support for green technologies by spreading it to all sectors of the economy. The results are based on a forward-looking, general equilibrium model of the European economy where R&D and innovation is specifically modelled.
• A study focusing on US compliance with climate policy objectives finds that car-bon taxes alone achieves 95 per cent of the welfare gains compared to the first-best case of both an optimally-designed carbon tax (one equating the marginal benefits of carbon reductions with the marginal costs of such reductions) and optimally de-signed R&D subsidies. By contrast, working with an optimal R&D subsidy alone attains just 11% of the welfare gains.
• A study on climate policies directed at the US electricity sector finds that the rank-ing of potential policy instruments is roughly as follows: (1) emissions price/tax, (2) emissions performance standard, (3) fossil power tax, (4) renewables share require-ment, (5) renewables subsidy, and (6) R&D subsidy. Nonetheless, an optimal port-
79 Popp (2006), Fisher (2008). 80 Popp (2010). 81 Bosetti et al(2009) 82 ECFIN(2010)

Innovation of energy technologies: the role of taxes
59
folio of policies – including emissions pricing and R&D – achieves emission reduc-tions at significantly lower costs than any single policy.

Innovation of energy technologies: the role of taxes
60
Acemoglu, 2002, “Directed technical change.” Rev. Econ. Stud. 69, 781-809
Acemoglu, Aghiom, Bursztyn, and Hermous, 2009, “The Environment and Directed Technological Change,” NBER Working Paper, No. 15451
Aghion et. al., 2004 “Competition and Innovation: An Inverted-U Relationship”, The Quarterly Journal of Economics, Vol. 120, No. 2, Pages 701-728
Aghion et. al., 2009, “No green growth without innovation”, Bruegel policy brief, issue 7 Aldy and Pizer, 2008, “Issues in Designing U.S. Climate Change Policy”, Discussion Pa-
per, RFF DP 08-20 Aldy et. al., 2009, “Designing Climate Mitigation Policy”, Discussion Paper, RFF DP 08-
16
Babiker, 2005, “Climate change policy, market structure, and carbon leakage”, Journal of International Economics 65, 421– 445
Barker et. al., 2007, “Carbon leakage from unilateral Environmental Tax Reforms in Europe, 1995–2005”, Cambridge Econometrics, Covent Garden, Cambridge, CB1 2HS, UK
Baker and Adu-Bonnah, 2008, “Investment in risky R&D programs in the face of climate uncertainty”, Energy Economics, 30, 465-486
Baker, Clarke and Shittu, 2008, “Technical change and the marginal cost of abatement”, Energy Economics, 30, 2799-2816
Bernstein and Griffin, 2005, “Regional Differences in the Price- Elasticity of Demand For energy”, RAND Technical Reports
Bertoldi and Atanasiu, 2007, “Electricity Consumption and Efficiency Trends in the Enlarged European Union”, Institute for Environment and Sustainability, EUR 22753 EN
Binswanger and Ruttan, 1978, “Induced Innovation: Technology Institutions and Devel-opment.” Johns Hopkins University Press, Baltimore, MD.
Blyth et. al., 2007, “Investment risks under uncertain climate change policy”, Energy Pol-icy 35, 5766–5773
Bohi and Zimmerman, 1984, “An update on econometric studies of energy demand behav-
REFERENCES

Innovation of energy technologies: the role of taxes
61
ior”, Ann. Rev. Energy, 9, 105-154
Bond, 2002, “Dynamic panel data models: a guide to micro data methods and practice”, Institute for Fiscal Studies, 7 Ridgmount Street, WC1E 7AE London, UK
Borenstein and Shepard, 1996, “Dynamic pricing in retail gasoline markets”, RAND Jour-nal of Economics, vol. 27, no. 3
Bosetti et. al., 2009, “The role of R&D and technology diffusion in climate change mitiga-tion: New perspectives using the WITCH model”, Economics department working papers, no. 664
Bosetti et al., 2009b, “Climate Policy after 2012,” CESifo Economic Studies, Vol. 55, No. 2, pp. 235-254.
Bramoullé and Olson, 2005, “Allocation of pollution abatement under learning by doing”, Journal of Public Economics, 89, 1935-1960
Brenton, 1997, “Estimates of the demand for energy using cross-country consumption data”, Applied Economics 29, 851-859
Brons et. al., 2006, “A Meta-analysis of the Price Elasticity of Gasoline Demand. A System of Equations Approach”, Tinbergen Institute Discussion Paper, 106/3
Brons et. al., 2008, “A meta-analysis of the price elasticity of gasoline demand. A SUR ap-proach”, Volume 30, Issue 5, September 2008, Pages 2105-2122
Brunnermeier and Cohen, 2003, “Determinants of environmental innovation in US manu-facturing industries”, J Environ Econom Manage 45, 278-293
Bruno, 2005, “Approximating the bias of the LSDV estimator for dynamic unbalanced panel data models”, Economics Letters 87, 361-366
Burniaux et. al., 2008, “The economics of climate change mitigation: Policies and options for the future”, Economics department working paper, no. 658
Busse et. al., 2009, “The Differential Effect of Usage Cost on New and Used Durable Goods Markets: Evidence from the Automobile Industry” manuscript, Northwest-ern University and NBER.
Celebi, M. and Frank Graves (2009), Volatile CO2 prices discourage CCS investments, mimeo.

Innovation of energy technologies: the role of taxes
62
Castelnuovo, Galeotti, Gambarelli and Vergalli, 2005, “Learning-by-Doing vs. Learning by Researching in a model of climate change policy analysis”, Ecological Economics, 54, 261-276
Dahl, 1993, “A survey of energy demand elasticities in support of the development of the NEMS”, MPRA Paper No. 13962
David, Hall, and Toole, 2000, “Is Public R&D a Complement of Substitute for Private R&D? A Review of the Econometric Evidence," Research Policy, 29, 497-529.
DEFRA, Department for Environment, Food and Rural Affairs, 2008, “An analysis of the technical feasibility and potential cost of a personal carbon trading scheme”, www.defra.gov.uk
Demailly and Quirion, 2006, “Leakage from climate policies and border tax adjustment: lessons from a geographic model of the cement industry”, Working Papers halshs-00009337 version 1, HAL
EFTEC, Economics for the Environment Consultancy Ltd., 2008, “Demand for Cars and their Attributes”, report prepared for the Department of Transport, UK, London, January.
EC, European Commission, 2008, “Proposal for a Directive of the European Parliament and of the Council amending" Directive 2003/87/EC so as to improve and extend the EU greenhouse gas emission allowance trading system, COM(2008), Brussels, 23.1.2008.
ECFIN, 2010, “What is the growth potential of green innovation? An assessment of EU climate policy options,” Economic Papers, No. 413.
Espey, 1998, “Gasoline demand revisited: an international meta-analysis of elasticities”, Energy Econimics, 20, 273-295
Espey and Espey, 2004, “Turning on the Lights: A Meta-Analysis of Residential Electricity Demand Elasticities”, Journal of Agricultural and Applied Economics , 36,1, 65-81
Fankhauser, 1993, “Evaluating the social costs of greenhouse gas emissions”, CSERGE Working Paper GEC 94-01
Fischer, 2008, “Emissions Pricing, spillovers, and public investment in environmentally friendly technologies”, Energy Economics, 30, 487-502
Fischer, 2009, “The Role of Technology Policies in Climate Mitigation”, RFF, Issue Brief

Innovation of energy technologies: the role of taxes
63
no. 08-09
Fischer and Newell, 2008, “Enviromental and technology policies for climate mitigation”, Journal of Environmental Economics and Management, 55, 142-162
Fischer, Parry, and Pizer, 1999 “Instrument choice for environmental protection when technological innovation is endogenous”, Discussion Paper, Resources for the Fu-ture, Washington, DC.
Fischer, Parry and Pizer, 2003, “Instrument choice for environmental protection when technological innovation is endogenous”, Journal of Environmental Economics and Management, 45, 523-545
Flood et. al., 2010, “Are demand elasticities affected by politically determined tax levels? Simultaneous estimates of gasoline demand and price”, Applied Economics Letters, Volume 17, pages 325 – 328.
Frondel, Horbach, and Rennings, 2007, “End-of-pipe or cleaner production? An empirical comparison of environmental innovation decisions across OECD countries”. Busi-ness Strategy and the Environment 16, 571-584.
Gardes et. al., 1996, “Cross-section versus time-series income elasticities”, Economics Let-ters 51, 169-175.
Gerlagh, 2008, “A climate-change policy induced shift from innovations in carbon-energy production to carbon-energy savings”, Energy Econ. 30, 425-48
Gillingham, Newell and Palmer, 2006, “Energy Efficiency Policies: A Retrospective Ex-amination”, Annual Reviews
Gillingham, Newell and Palmer, 2009, “Energy efficiency economics and policy”, NBER working paper series, 15031
Gillingham, Newell and Pizer, 2008, “Modeling Endogenous technological change for cli-mate policy analysis”, Energy Economics, 30, 2734-2753
Goel, 1994, “Quasi-experimental taxation elasticities of US gasoline demand”, Energy Economics, 16 (2), 133-137
Goolsbee, 1998, “Does Government R&D Policy Mainly Benefit Scientists and Engi-neers?" American Economic Review, 88(2), 298-302.
Goulder and Schneider, 1999, “Induced technological change and the attractiveness og

Innovation of energy technologies: the role of taxes
64
CO2 abatement policies”, Resource and energy Economics, 21, 211-253
Greaker and Pade, 2008, “Optimal CO2 abatement and technological change: Should emission taxes start high in order to spur R&D?” Discussion Papers No. 548, Statis-tics Norway, Research Department.
Greene, 2003, “Econometric Analysis”, fifth edition, Prentice Hall Upper Saddle River, New Jersey 07458
Hamamoto, 2006, “Environmental regulation and the productivity of Japanese manufac-turing industries.” Resource Energy Econ. 28, 299-312
Hart, 2008, “The timing of taxes on CO2 emissions when technological change is endoge-nous”. Journal of Environmental Economics and Management 55(2), 194-212.
Hascic et. al., 2008, “Environmental Policy Stringency and Technological Innovation: Evi-dence from Patent Counts”, June 15
Hicks, 1932, “The Theory of Wages Macmillan”, London
Hitt et. al., 1994, “A mid-range theory of the interactive effects of international and prod-uct diversification on innovation and performance”, Journal of Management, Vol-ume 20, Issue 2, 297-326
House of Lords, 2005, “The Economics of Climate Change”, Select Committee on Eco-nomic Affairs
International Energy Agency, 2009, “Ensuring Green Growth in a Time og economic Cri-sis”, OECD/IEA, G8 Siracusa 22-23-24 Aprile
Jaffe and Palmer, 1997, “Environmental regulation and innovation: a panel data study” Rev Econ Stat 79(4), 610–619
Johnstone et. al., 2008, “Renewable energy Policies and technological innovation: Evidence based on patent counts”, NBER working paper series, 13760
Johnstone et. al., 2009 (a), “Renewable energy Policies and technological innovation: Evi-dence based on patent counts”, Springer, Environ Resource Econ
Johnstone et. al., 2009 (b), “Invention and Transfer of Climate Change Mitigation Tech-nologies on a Global Scale: A Study Drawing on Patent Data”, Fondazione Eni En-rico Mattei, Nota Di Lavoro, 82

Innovation of energy technologies: the role of taxes
65
Kaldellis and Gavras, 2000, “The economic viability of commercial wind plants in Greece, A complete sensitivity analysis”, Energy Policy, 28, 509-517
Kilian, 2007, “The Economic Effects of Energy Price Shocks”, University of Michigan and CEPR
Kiviet, 1995, “On bias, inconsistency, and efficiency of various estimators in dynamic panel data models”, Journal of Econometrics 68, 53-78
Klaassen et. al., 2005, “The impact of R&D on innovation for wind energy in Denmark, Germany and United Kingdom”, Ecological Economics, 54, 227-240
Klier, 2008, “The price of gasoline and the demand for fuel efficiency: Evidence from monthly new vehicles sales data”, Federal Reserve Bank of Chicago.
Knigge and Görlach, 2005, “Effects of Germany’s Ecological Tax Reforms on the Envi-ronment, Employment and Technological Innovation”, Ecologic, Institute for In-ternational and European Environmental Policy
Koetse et. al., 2008, “Capital-energy substitution and shifts in factor demand: A meta-analysis”, Energy Economics, 30, 2236-2251
Kydes, 1997, “Sensitivity of Energy Intensity in U.S. Energy Markets to Technological Change and Adoption”, Office of Integrated Analysis and Forecasting, U.S. De-partment of Energy
Kydland and Prescott, 1977, “Rules Rather than Discretion: The Inconsistency of Optimal Plans”, The Journal of Political Economy, 1977, vol. 85, no. 3
Labandeira et. al., “Effects of green tax reforms in Spain. A new analytical approach inte-grating micro and macro-economic models”
Lanjouw and Mody, 1996, “Innovation and the international diffusion of environmentally responsive technology”, Res Policy 25, 549–571
Lanoie et. al., 2007, “Environmental Policy, Innovation and Performance: new Insights on the Porter Hypothesis”, CIRANO
Levin, Klevorick, Nelson, and Winter, 1987, “Appropriating the returns from industrial re-search and development”, Brookings Papers on Economic Activity, 3, 783–820.
Liu, 2004, “Estimating Energy Demand, Elasticities for OECD Countries, A Dynamic Panel Data Approach”, Statistics Norway, Research Department, Discussion Papers

Innovation of energy technologies: the role of taxes
66
no. 373
Magat, 1978, “Pollution control and technological advance: A dynamic model of the firm.” J. Environ. Econ. Manage. 5, 1-25
Martin, 2009, “The Impacts of the Climate Change Levy on Business: Evidence from Mi-crodata”, Centre for Climate Change Economics and Policy, Working Paper No. 7, Grantham Research Institute for climate Change and the Environment, Working paper No. 6
Martiskainen, 2007, “Affecting consumer behavior on energy demand”, Sussex Energy Group, SPRU - Science and Technology Policy Research, University of Sussex
McDonald and Schrattenholzer, 2000, “Learning rates for energy technologies.” Energy Pol. 29, 255-61
Milliman and Prince, 1989, “Firm incentives to promote technological change in pollution control.” J. Environ. Econ. Manage. 17, 247-65
Mirrless Review(2010), Reforming the tax system for the 21th century”, Institute for Fiscal Studies, Oxford University Press
Montgomery, 1972, “Markets in Licenses and Efficient Pollution Control Programs.” Journal of Economic Theory 5, 395–418.
Montgomery and Smith, 2005, “Price, Quantity, and Technology Strategies for Climate Change Policy”, CRA International
Montgomery and Smith, 2007, “Price, quantity and technology strategies for climate change policy”. In: Human-Induced Climate Change: An Interdisciplinary Assess-ment. Cambridge University Press, Cambridge.
National Science Board, 2006, “Science and Engineering Indicators 2006”, National Sci-ence Foundation, vol. 1
National Science Board, 2006, “Science and Engineering Indicators 2006”, National Sci-ence Foundation, vol. 2
Nemet, 2006, “Beyond the learning curve: factors influencing cost reductions in photovol-taics”, Energy Policy, 34, 3218-3232
Newell, 2009, “International Climate Technology Strategies”, Duke University, National

Innovation of energy technologies: the role of taxes
67
Bureau of Economic Research
Newell et. al., 1999, “The induced innovation hypothesis and energy-saving technological change”, The Quarterly Journal of economics, vol. 114, no. 3
Newell and Pizer, 2008, “Carbon mitigation costs for the commercial building sector: Dis-crete-continuous choice analysis og multifuel energy demand”, Resource end En-ergy Economics, 30, 527-539
Newell and Rogers, “The Market-Based Lead Phasedown”, edited by Freeman and Kolstad, 2007, “Moving to markets in environmental regulation, lessons from twenty years of experience”, Oxford University Press, 173-195
Noailly et. al., 2008, “The impact of environmental policy on energy-efficient innovations in buildings: The case of the Netherlands”, CPB Netherlands Bureau for Economic Policy Analysis
Nordhaus, 2002, “Modeling Induced Innovation in Climate Change Policy”, Resources for the Future Press, chapter 9
OECD, 2009, “Working Party on National Environmental Policies, Indicators of Innova-tion and Transfer in Environmentally Sound Technologies: Methodological Issues”, ENV/EPOC/WPNEP1/FINAL
OECD, 2008, “Compendium of Patent Statistics”, OECD Peeters and Surry, 2000, “Incorporating Price-Induced in a Symmetric Generalised
McFadden Cost Function with several outputs”, Journal of Productivity Analysis 14, 53-70
Pizer and Popp, 2008, “Endogenizing technological change: Matching empirical evidence to modeling needs”, Energy Economics, 30, 2754-2770
Popp, 1999, “Induced Innovation and Energy Prices”, The University of Kansas
Popp, 2002, “Induced Innovation and Energy Prices”, Amer. Ec. Rev. 92 (1), 160-180
Popp, 2004, “ENTICE: endogenous technological change in the DICE model of global warming”, Journal of Environmental Economics and Management, 48, 742-768
Popp, 2006, “R6D subsidies and climate policy: Is there a “free lunch”?”, Climatic Change, 77, 311-341

Innovation of energy technologies: the role of taxes
68
Popp, 2010, “Innovation and Climate Policy”, NBER Working Paper Series, 15673
Popp and Newell, 2009, “Where does energy R&D come from? Examining Crowding Out from Environmentally-Friendly R&D.” NBER Working Paper, 15423
Popp et. al., 2009, “Energy, the environment, and technological change”, NBER Working Paper Series, 14832
Reichman, 2008, “Intellectual Property and Alternatives: Strategies for Green Innovation”, Chatham House, Energy, Environment and Development Working Paper: 08/03
Reinaud, 2008, “Climate Policy and Carbon Leakage, Impacts of the European Emissions Trading Scheme on Aluminium”, IEA Information Paper
Reinthaler and Wolff, 2004, “The Effectiveness of Subsidies Revisited: Accounting for Wage and Employment Effects in Business R&D”, ZEI Working Paper, B 21
Requate, 2005, “Timing and Commitment of Environmental Policy, Adoption of New Technology, and Repercussions on R&D”, Environmental and Resource Econom-ics, 31, 175-199
Rivers and Jaccard, 2006, “Choice of environmental policy in the presence of learning by doing”, Energy Economics, 28, 223-242
Roy et. al., 2006, “Substitution and price elasticity estimates using inter-country pooled data in a translog cost model”, Lawrence Berkeley National Laboratory, LBNL-55306
Schneider and Goulder, 1997, “Achieving low-cost emissions targets”, Nature, vol. 389
Smulders and Corrado Di Maria, 2007, “Endogenous Technological Change and the Cost of Environmental Policy”, February 7
Smulders and Nooij, 2003, “The impact of energy conservation on technology and eco-nomic growth”, Resource and Energy Economics, 25, 59-79
Stern, 2007, “The Economics of Climate Change: The Stern Review.” Cambridge: Cam-bridge University Press.
Stern, 2009, “Interfuel Substitution: A Meta-Analysis”, MPRA, paper no. 15792
Suslov, 2008, “Explaining Factors Affecting Energy Demand Elasticity: Does the Quality

Innovation of energy technologies: the role of taxes
69
of Institutions Matter?”, Faculty of Economics, Novosibirsk State University
Szabo et. al., 2006, “CO2 emission trading within the European Union and Annex B countries: the cement industry case”, Energy Policy, Volume 34, Issue 1, January, 72-87
Vollebergh and Kemfert, 2005, “The role of technological change for a sustainable devel-opment”, Ecological Economics, 54, 133-147
Wade, 2003, “Price Responsiveness in the AEO2003 NEMS Residential and Commercial Buildings Sector Models”, Energy Information Administration/Price Responsive-ness in the NEMS Buildings Sector Models
Weber, C. and D. J. Swider (2004), Power Plant Investments Under Fuel and Carbon Price Uncertainty
Wolff and Reinthaler, 2008, “The effectiveness of subsidies revisited: Accounting for wage and employment effects in business R&D”, Research Policy 37, 1403–1412
Yang et. al., 2008, “Evaluating the power investment options with uncertainty in climate policy”, Economics 30, 1933–1950.
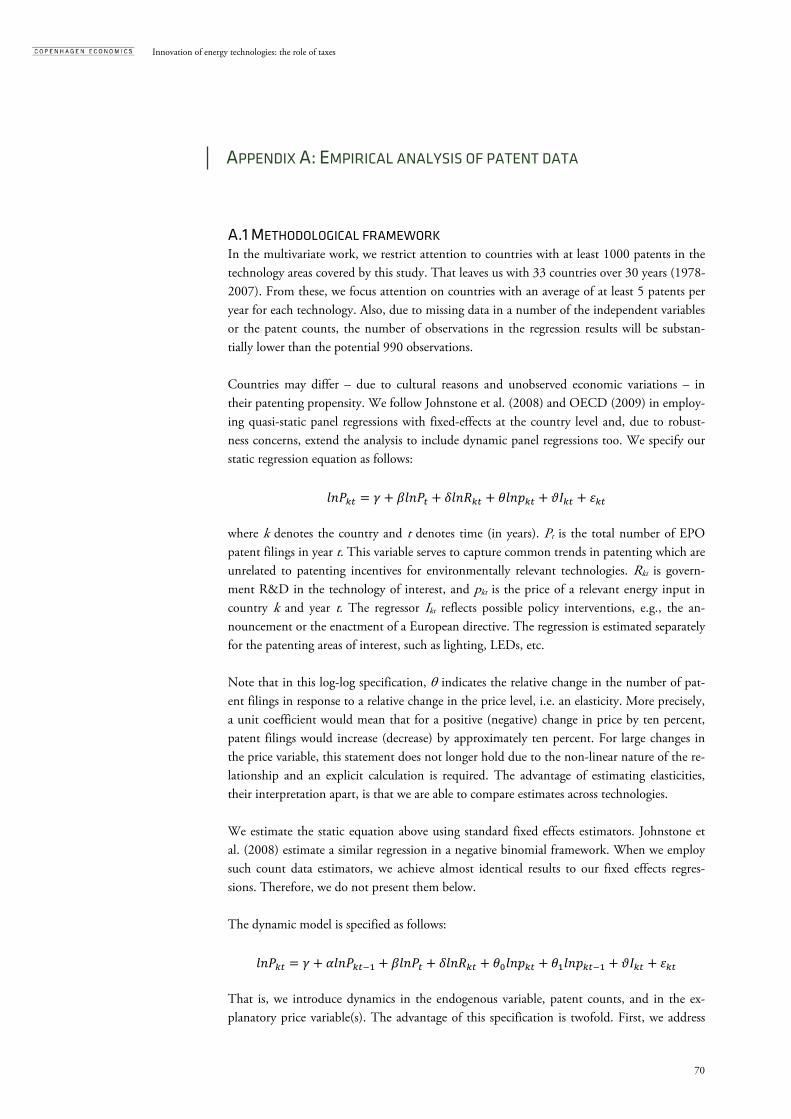
Innovation of energy technologies: the role of taxes
70
A.1 METHODOLOGICAL FRAMEWORK In the multivariate work, we restrict attention to countries with at least 1000 patents in the technology areas covered by this study. That leaves us with 33 countries over 30 years (1978-2007). From these, we focus attention on countries with an average of at least 5 patents per year for each technology. Also, due to missing data in a number of the independent variables or the patent counts, the number of observations in the regression results will be substan-tially lower than the potential 990 observations. Countries may differ – due to cultural reasons and unobserved economic variations – in their patenting propensity. We follow Johnstone et al. (2008) and OECD (2009) in employ-ing quasi-static panel regressions with fixed-effects at the country level and, due to robust-ness concerns, extend the analysis to include dynamic panel regressions too. We specify our static regression equation as follows:
where k denotes the country and t denotes time (in years). Pt is the total number of EPO patent filings in year t. This variable serves to capture common trends in patenting which are unrelated to patenting incentives for environmentally relevant technologies. Rkt is govern-ment R&D in the technology of interest, and pkt is the price of a relevant energy input in country k and year t. The regressor Ikt reflects possible policy interventions, e.g., the an-nouncement or the enactment of a European directive. The regression is estimated separately for the patenting areas of interest, such as lighting, LEDs, etc. Note that in this log-log specification, θ indicates the relative change in the number of pat-ent filings in response to a relative change in the price level, i.e. an elasticity. More precisely, a unit coefficient would mean that for a positive (negative) change in price by ten percent, patent filings would increase (decrease) by approximately ten percent. For large changes in the price variable, this statement does not longer hold due to the non-linear nature of the re-lationship and an explicit calculation is required. The advantage of estimating elasticities, their interpretation apart, is that we are able to compare estimates across technologies. We estimate the static equation above using standard fixed effects estimators. Johnstone et al. (2008) estimate a similar regression in a negative binomial framework. When we employ such count data estimators, we achieve almost identical results to our fixed effects regres-sions. Therefore, we do not present them below. The dynamic model is specified as follows:
That is, we introduce dynamics in the endogenous variable, patent counts, and in the ex-planatory price variable(s). The advantage of this specification is twofold. First, we address
APPENDIX A: EMPIRICAL ANALYSIS OF PATENT DATA

Innovation of energy technologies: the role of taxes
71
an econometric issue concerning potential inconsistency of the static estimator when the data is actually dynamic in nature.83 There are valid reasons why patenting may happen in ‘waves’: ideas foster ideas and R&D expenditure is typically assigned over longer time spans. Second, the formulation allows us to test hypotheses about the way prices and taxes influ-ence patenting. If we simplify notation by joining all other explanatory variables in the con-stant term, then we can rewrite the model as:
∆ 1 1 ∆
This is the error correction representation of the model. The term in square brackets repre-sents the long run relation between patents and prices, while the remaining terms describe short run adjustments. In this way we can test hypotheses of differences in short vs. long term impacts from price changes to patenting. The dynamic panel regression is estimated by deploying two estimators. First, we use the bias-corrected LSDV estimator suggested by Kiviet (1995). The advantage of this estimator is that it works significantly well for small-N samples, c.f. Bruno (2005). Standard errors are found by bootstrapping. Second, we esti-mate using the standard Arellano-Bond estimator – the classic dynamic panel data estimator. After estimation we test the significance of both the short run effects, i.e., the t-values for , and the long run effects using Chi-square test for the long run coefficients in the square brackets. Note that we a priori value the static and the dynamic model equally. They are simply ro-bustness controls of each other. However, if the estimate of the lagged dependent variable is statistically significant and large, we favour the dynamic estimates, whereas small estimates suggest that the more parsimonious static model is preferable. Finally, we also attempt to include taxes in the analysis. Our data on prices and taxes have the following additivity characteristic:
Now, including taxes in the above regression would therefore cause multicollinearity prob-lems. However, given the logarithmic transformation, we would violate the additivity char-acteristic by using instead. Thus, we need a different approach. Assuming that taxes may have a different impact on innovation than prices, we can postulate the following rela-tion:
83 See Bond (2002).

Innovation of energy technologies: the role of taxes
72
where ct captures all other variables (including the residual) and φ measures the additional effect from taxes. Note that φ = 0 means that taxes have the same impact as prices. In logs, this is approximated by log βlnp + βln(1+ φtax/p) . The second term can be approximated by φtax/p. This would call for using lnp (where price is inclusive of taxes) and the share vari-able tax/p (the share of taxes in prices). This resolves the collinearity problem between prices and taxes – at least to some degree – and maintains a generalized form of additivity. The co-efficient of the share variable then has the usual interpretation of an excess effect (positive coefficients indicate that taxes work more strongly than prices, vice versa for negative ef-fects). Short and long run effects can now be calculated in the same way as shown for prices above.
A.2 RESULTS Below we present results from the econometric estimations for each technology apart. How-ever, the tables presenting regression output will have a similar structure across technologies:
1. Column (1) contains the coefficient estimates from the static model in its standard form. We include both residential and industry prices if relevant.
2. Column (2) contains the coefficient estimates from the static model including only the most relevant sector prices.
3. Column (3) contains the coefficient estimates from the dynamic model with price lags (leading to the error correction model). We include only the most relevant price series (residential or industry). This column is based on the Kiviet estimator.
4. Column (4) contains the estimates from the Arellano-Bond estimator for the same model as in column (3).
All models include the tax share variable as based on the previous discussion. Furthermore, the below tables will refer to lags. These are lags as explained in the discussion of dynamic models, i.e., the inclusion of last year’s value of a specific variable instead of the current value. Thus, the specifications (1) and (2) are static, while (3) and (4) are dynamic.
Patenting in Lighting Technology Lighting is a significant cause of energy consumption, yet it constitutes aa rather moderate share of consumer budgets. In order to explore the impact of energy prices on patenting in lighting technologies, we employ the country panel data and regress the logarithm of coun-try-level patent counts on energy prices and taxes (both residential and industrial), public R&D in the underlying technologies, and dummy variables indicating both the announce-ment and the enactment of the Directive on the Energy Performance of Buildings (2002/91/EC).

Innovation of energy technologies: the role of taxes
73
Determinants of Patenting in Lighting Technology (1) (2) (3) (4) Ln price electricity (residential) -0.397 (0.275) Tax share (residential) 1.010 (0.867) Ln price electricity (industrial) -0.418*** -0.225 -0.253 -0.163 (0.158) (0.227) (0.246) (0.188) Tax share (industrial) 1.603*** 1.053 1.672 1.526* (0.615) (0.721) (1.313) (0.916) Ln EPO patents 0.621*** 0.638*** 0.251 0.425** (0.206) (0.213) (0.188) (0.183) ln public R&D (industrial) 0.0718* 0.0758* 0.00823 0.0304 (0.0424) (0.0425) (0.0454) (0.0545) ln public R&D (residential) 0.0404 0.0355 0.0210 -0.00508 (0.0438) (0.0440) (0.0476) (0.0460) EU Directive 2002/91 ann. 0.284*** 0.319*** 0.234** 0.251*** (0.100) (0.103) (0.0947) (0.0909) Lag tax share (industrial) -1.088 -1.032 (1.735) (1.009) Lag ln price electricity (industrial) -0.224 -0.327 (0.220) (0.235)
Lag ln patents lighting
0.314*** (0.0549)
0.124**(0.0571)
Constant 1.800*** 1.554*** -0.0129 (0.471) (0.522) (0.0171) Observations 233 233 224 207 Standard errors in parentheses *** p<0.01, ** p<0.05, * p<0.1

Innovation of energy technologies: the role of taxes
74
Patenting in LED Technology Light emitting diodes constitute a major technical breakthrough and have established a promising lighting technology in their own right. We test here if patenting in this technolo-gical segment is determined by the same forces as lighting technology in general. The vari-ables correspond to those used for lighting technologies.

Innovation of energy technologies: the role of taxes
75
Determinants of Patenting in LED Technology (1) (2) (3) (4) Ln price electricity (residential) -0.248 -0.528 0.493 0.499 (0.461) (0.591) (0.940) (0.489) Ln price electricity (industrial) 0.0357 (0.455) Tax share (residential) -0.509 -2.797 -0.174 0.372 (1.225) (1.763) (1.681) (1.928) Tax share (industrial) 1.592 (1.476) ln public R&D (industrial) 0.00997 -0.00563 0.0475 0.0541 (0.0797) (0.0786) (0.0964) (0.111) ln public R&D (residential) 0.161** 0.156* 0.0626 0.0439 (0.0802) (0.0792) (0.0733) (0.0780) EU Directive 2002/91 ann. 0.282 0.325* -0.0407 -0.0556 (0.180) (0.184) (0.171) (0.166) EU Directive 2002/91 intr. -0.128 -0.401 -0.0527 -0.0116 (0.220) (0.256) (0.167) (0.193) Lag tax share (residential) 0.357 -2.099 (2.144) (1.611) Lag ln price electricity (residential) -0.773 -1.061** (0.998) (0.540) Lag ln patents LED 0.560*** 0.453*** (0.0601) (0.120) Constant -0.907 -1.012 (0.801) (0.930) Observations 199 194 193 181 Standard errors in parentheses *** p<0.01, ** p<0.05, * p<0.1

Innovation of energy technologies: the role of taxes
76
Patenting in Boiler Technology The relevant price variable for driving incentives in the area of boiler technology could either be the price for natural gas (or other gas fuels) as well as the price for light fuel oil. However, the results for light fuel oil have slightly better economic interpretation and we choose to present these here. Light fuel oil costs simply appear to have a bigger effect than natural gas. The public R&D variable is not significant in these regressions.

Innovation of energy technologies: the role of taxes
77
Determinants of Patenting in Boiler Technology (1) (2) (3) (4) ln price light fuel oil (residential) 0.0999 0.0999 -0.140 -0.0788 (0.0948) (0.0948) (0.104) (0.125) tax share (residential) 0.951* 1.421*** 1.303*** 1.303*** (0.522) (0.274) (0.340) (0.340) ln EPO patents -0.235 -0.235 -0.348 -0.392** (0.198) (0.198) (0.212) (0.165) ln public R&D (residential) -0.0130 -0.0130 0.000391 -0.0338 (0.0362) (0.0362) (0.0291) (0.0325) lag ln price light fuel oil (residential) 0.223 0.0907 (0.140) (0.135) lag tax share (residential) -0.0997 0.0582 (0.634) (0.542) lag ln patents boilers 0.635*** 0.246*** (0.0557) (0.0643) lag ln price light fuel oil (residential) 0.223 0.0907 (0.140) (0.135) Constant 1.606** 1.606** (0.637) (0.637) Observations 276 276 266 251 Standard errors in parentheses *** p<0.01, ** p<0.05, * p<0.1
Patenting in Biomass Technology in Buildings We take again the prices for light fuel oil and for natural gas as the potentially relevant en-ergy costs which determine incentives for investments and patenting in biomass technology. Again, the price for light fuel oil yields the most intuitive results, so only these are included.

Innovation of energy technologies: the role of taxes
78
Determinants of Patenting in Biomass (1) (2) (3) (4) ln price light fuel oil (residential) 0.318** 0.318** 0.709*** 0.719*** (0.135) (0.135) (0.237) (0.246) tax share (residential) -1.957*** -1.957*** -1.172 -1.168 (0.569) (0.569) (0.783) (0.800) ln EPO patents 0.114 0.114 0.554** 0.555 ln public R&D (residential) -0.0351 -0.0351 -0.0208 -0.0202 (0.0580) (0.0580) (0.0597) (0.0658) lag ln patents biomass 0.358*** 0.313*** (0.0680) (0.0757) lag ln price light fuel oil (residential) -0.498** -0.491*** (0.201) (0.146) lag tax share (residential) -0.422 -0.514 (0.925) (0.354) Constant 1.121 1.121 0 (0.916) (0.916) (0) Observations 188 188 182 175 Standard errors in parentheses *** p<0.01, ** p<0.05, * p<0.1
Patenting in Ventilation Technology Relevant prices for patenting in ventilation technologies are again for electricity (residential and industrial). For this technology group, the variables capturing the timing of the directive 2002/91 are slightly significant together with one of the country-specific R&D variables.

Innovation of energy technologies: the role of taxes
79
Determinants of Patenting in Ventilation Technology (1) (2) (3) (4) ln price electricity (industrial) -0.387* -0.431 -0.314 -0.291 (0.197) (0.272) (0.230) (0.394) tax share (industrial) 1.777** 1.849** 0.718 0.699 (0.798) (0.889) (1.024) (0.699) ln EPO trend -0.296 -0.305 -0.336 -0.356 (0.285) (0.289) (0.371) (0.270) ln public R&D (industrial) -0.0159 -0.0134 -0.0171 -0.0179 (0.0497) (0.0507) (0.0627) (0.0331) ln public R&D (residential) 0.142*** 0.144*** 0.130*** 0.132* (0.0479) (0.0490) (0.0476) (0.0701) EU Directive 2002/91 ann. 0.134 0.126 0.111 0.113* (0.121) (0.125) (0.104) (0.0685) EU Directive 2002/91 impl. -0.274 -0.273 -0.285 -0.279 (0.179) (0.181) (0.214) (0.213) lag ln patents ventilation 0.0927 0.0503 (0.0753) (0.0636) lag tax share (industrial) 1.431 1.550 (1.210) (1.608) lag ln price electricity (industrial) -0.168 -0.215 (0.223) (0.533) Constant 0.245 0.217 0.0246 (0.641) (0.716) (0.0227) Observations 190 190 184 175 Standard errors in parentheses *** p<0.01, ** p<0.05, * p<0.1
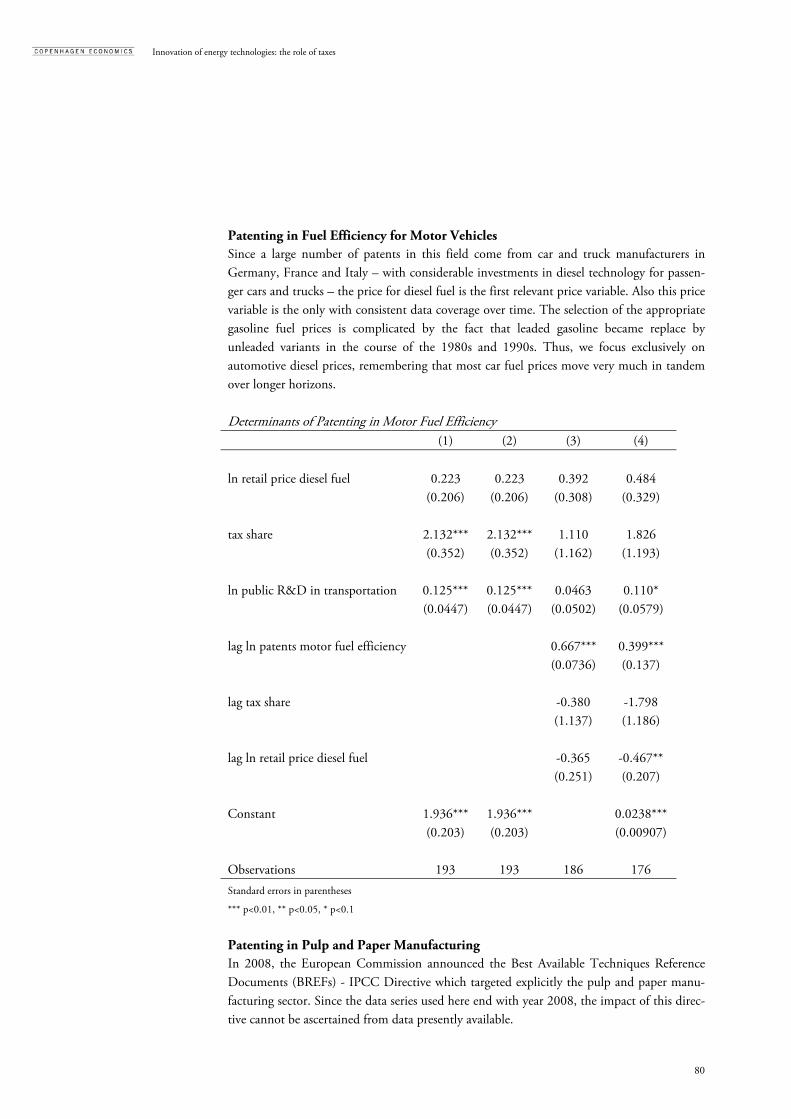
Innovation of energy technologies: the role of taxes
80
Patenting in Fuel Efficiency for Motor Vehicles Since a large number of patents in this field come from car and truck manufacturers in Germany, France and Italy – with considerable investments in diesel technology for passen-ger cars and trucks – the price for diesel fuel is the first relevant price variable. Also this price variable is the only with consistent data coverage over time. The selection of the appropriate gasoline fuel prices is complicated by the fact that leaded gasoline became replace by unleaded variants in the course of the 1980s and 1990s. Thus, we focus exclusively on automotive diesel prices, remembering that most car fuel prices move very much in tandem over longer horizons. Determinants of Patenting in Motor Fuel Efficiency (1) (2) (3) (4) ln retail price diesel fuel 0.223 0.223 0.392 0.484 (0.206) (0.206) (0.308) (0.329) tax share 2.132*** 2.132*** 1.110 1.826 (0.352) (0.352) (1.162) (1.193) ln public R&D in transportation 0.125*** 0.125*** 0.0463 0.110* (0.0447) (0.0447) (0.0502) (0.0579) lag ln patents motor fuel efficiency 0.667*** 0.399*** (0.0736) (0.137) lag tax share -0.380 -1.798 (1.137) (1.186) lag ln retail price diesel fuel -0.365 -0.467** (0.251) (0.207) Constant 1.936*** 1.936*** 0.0238*** (0.203) (0.203) (0.00907) Observations 193 193 186 176 Standard errors in parentheses *** p<0.01, ** p<0.05, * p<0.1
Patenting in Pulp and Paper Manufacturing In 2008, the European Commission announced the Best Available Techniques Reference Documents (BREFs) - IPCC Directive which targeted explicitly the pulp and paper manu-facturing sector. Since the data series used here end with year 2008, the impact of this direc-tive cannot be ascertained from data presently available.

Innovation of energy technologies: the role of taxes
81
Determinants of Patenting in Pulp and Paper Manufacturing (1) (2) (3) (4) ln price electricity (industrial) 0.352*** 0.352*** 0.188 0.184 (0.133) (0.133) (0.239) (0.285) tax share (industrial) -0.547 -0.547 -0.851 -1.181** (0.485) (0.485) (0.846) (0.590) ln EPO patents 0.320** 0.320** 0.165 0.220* (0.158) (0.158) (0.164) (0.118) lag ln patents paper and pulp 0.475*** 0.0842 (0.0466) (0.0856) lag tax share 0.700 0.306 (0.911) (0.612) lag ln price electricity (industrial) 0.0573 0.155 (0.197) (0.114) Constant 4.264*** 4.264*** 0.0143 (0.342) (0.342) (0.0103) Observations 298 298 285 273 Standard errors in parentheses *** p<0.01, ** p<0.05, *p<0.1

Innovation of energy technologies: the role of taxes
82
The model is closely linked to the model developed in Fisher and Newell (2008). In fact, the CERIM is a simplification of their model in order to focus exclusively on relevant policy op-tions. A more thorough model description can be found in the original paper. The CERIM includes two subsectors, one emitting (fossil fuels) and one non-emitting (re-newables), and both are assumed to be perfectly competitive and supplying an identical product, electricity. Fossil-fuelled production includes a CO2-intensive technology (coal) that operates primarily as a base load and a lower-emitting technology (gas turbines) that dominates at the margin. To the extent that renewable energy is competitive, it displaces marginal fossil-fuelled generation. We therefore treat nuclear- and hydro-based generation as fixed in response to the range of policies we model, a reasonable assumption based on other detailed models (see the Numerical application). The model has two stages, each represent-ing a specific number of years. Electricity generation, consumption, and emissions occur in both stages, while investment in knowledge takes place in the first stage and, through tech-nological change, lowers the cost of renewables generation in the second. An important as-sumption is that firms take not only current prices as given, but also take prices in the sec-ond stage as given, having perfect foresight about those prices. To allow for consideration of the length of time it takes for innovation to occur, and for the lifetime of the new technologies, let the first and second stages be made up of n1 and n2 years, respectively. For simplicity, we assume that no discounting occurs within the first stage; this assures that behaviour within that stage is constant. However, let δ represent the discount factor between stages. It is possible to allow for discounting within the second, longer stage by altering n2 to reflect such a discounting; in that case n2 can be thought of as ‘‘effective’’ years. The emitting sector of the generation industry, denoted with superscript F, relies on two fos-sil fuels for production: coal, x, and natural gas, y. Total output from the emitting sector is
in year t. Total emissions from this sector equal
as each fuel has a fixed CO2 intensity. Marginal production costs coal-fired generation is given by
/2 and similarly for natural gas. The opportunities for CO2 abatement in electricity rely largely on fuel switching; although coal gasification or generation efficiency improvements are op-tions, they tend to explain little of the predicted reductions in climate policy models. One
APPENDIX B: DESCRIPTION OF CERIM

Innovation of energy technologies: the role of taxes
83
policy affects the fossil-fuelled sector directly: an emissions price/tax denoted by τt . This gives rise to an intertemporal profit function for the emitting firms:
We assume profit maximisation. Another sector of the industry generates without emissions by using renewable resources (wind, for example). Annual output from the renewables sector is qt. The costs of production, G Kt,qt , are assumed to be increasing and convex in output, and declining and convex in its own knowledge stock, Kt, in the following way:
, 2
Note that we have simplified considerably by assuming there is technological change in the relatively immature renewable energy technologies, but none in the relatively mature fossil-fueled technologies. While it is not strictly true that fossil-fueled technologies will experience no further advance, incorporation of positive but relatively slower innovation in fossil fuels would complicate the analysis without adding much additional insight. The knowledge stock is a function of cumulative knowledge from R&D, Ht, and of cumulative experience through learning by doing, Qt. Cumulative R&D-based knowledge increases in proportion to annual R&D knowledge generated in each stage, ht, so
Cumulative experience increases with total output during the first stage in a completely simi-lar manner
Research expenditures, R ht , are increasing and convex in the amount of new R&D knowl-edge generated in any one year, with
The strictly positive marginal costs imply that real resources—specialized scarce inputs, em-ployees, and equipment—must be expended to gain any new knowledge. As a partial equi-librium model, we do not explicitly explore issues of crowding out in the general economy, but those opportunity costs may be reflected in the R&D cost function.

Innovation of energy technologies: the role of taxes
84
The second policy instrument in the model is a subsidy targeted at R&D in renewable. The subsidy, σ, is implemented as the government offsetting a share research expenditures. Now, we can write up the intertemporal profit function for the renewables sector:
1 , 1 2 , The model is closed by the standard demand equals supply condition:
Where demand is assumed iso-elastic. All parameter values can be found in Fisher and New-ell (2008).

Innovation of energy technologies: the role of taxes
85
Microsoft Office Excel 97-2003 Worksh
APPENDIX C: DESCRIPTION OF IPC CODES