innovation & tracer study itb implementation setia budi.pdf · there is no human resource...
TRANSCRIPT

Tracer Study ITBLulusan 2012
INNOVATION &
IMPLEMENTATIONTRACER STUDY ITB (2012-2015)

BACKGROUND
- Organizing and implementing of Tracer Study to be successful must have two requirements: institutional and sustainable.
- Even several universities in Indonesia has an institutional n regular system on Tracer Study implementation, it is not enough if there is no attempt to continuous improvements in every step/stage in the implementation: infrastructure, facilities, system, methodology, communication, publication, etc.
- Unfortunately, so many university/higher education in Indonesia has no an institution/unit to conduct a tracer study at university level regularly. (e.g. based on project, base on requirement of accreditation etc).
- Indonesia has more than 4000 higher education institution (universities, Polytechnic, Institute, Academy, etc). Generally Tracer study is (only) to fulfill the administration/accreditation process, so that way Tracer Study is conducted at Study Program level. (ITB is also like this until 2010).

Tracer Study in Indonesia (Problem in General)

- If the tracer study is conducted in University at Study Program level:
1). There is no human resource dedicated to operate TS, untrained human resource
2) not regularly held,
3) unsystematic,
4) lack/weak in methodology, sampling
5) using different core questioner (sometime completely different), not comparable to other study program in university,
6) low in budget
7) important and urgent need to fulfill the administration (Accreditation Process).
The main problem will be: bad quality in data/analysis, very low in the response rate, does not represent the profile of Alumni, etc.

- ITB has this experience until 2010, TS is conducted at Study program level, to fulfill the requirement of accreditation process both national (BAN) and international (ABET Accreditation Board for Engineering and Technology, KAAB, etc).
- From 2010-2011, ITB conducted TS at university level (by ITB Career Center) but only for 3-4 study programs: weak in methodology, self develop questionnaire, questionnaire deliver in email attachment, less then 50% response rate.
- Starting from 2012 until now, Tracer Study is conducted by ITB Career Center, under Office of Student Affairs: systematically, regularly and cover all of study program in ITB.
- ITB Tracer Study adopted the core questionnaire from UNITRACE and INDOTRACE, improving the methodology, online questionnaire, and always have an increase response rate each year, 2012 (49%), 2013 (72%), 2014 (80%) and 2015 (92%). How? Why? What?

Tracer Study ITB Response Rate
0%
10%
20%
30%
40%
50%
60%
70%
80%
90%
100%
2012 (EntryCohort 2004)
2012 (EntryCohort 2005)
2013 (EntryCohort 2006)
2014 (EntryCohort 2007)
2015 (EntryCohort 2008)
34%49%
72% 80%92%
66%51%
28% 20%8%
complete not complete

Aims - This paper aims at exploring and discussing on methodology, focus on innovation and implementation of ITB Tracer Study
- This paper also discusses: why we do these innovations, and how improvement in every stage of implementation with the main objective to increase the response rate.
(the paper/presentation exclude discussing on result of analysis, and report- please visit the website http://karir.itb.ac.id/tracerstudy)
(the full paper also can be downloaded in the website).

ITB Tracer Study
Concept of Innovation
Structural & Cultural Approach
Formal & Informal Approach

Basic Idea
Structural and Cultural Approach
- Tracer Study is not conducted referred to International/National Tracer Study’s Guideline only, but also strongly pay attention and take advantage of the prevailing culture and tradition (Indonesia, and ITB/ITB alumni especially).
Formal and Informal Approach
- Tracer Study is conducted not only in conformance with generally accepted standard of Tracer Study but also using relationship: kinship, brotherhood, friendship, and intimacy.

Institution
• ITB/ITB Career Center/ITB Tracer Study Division
Surveyor
• Individu/person in charge/representative in each study program
Target of Responden
• Alumni of all study program
Formal & Structural
Formal & Structural
Informal & Cultural
Networking

Tracer Study ITB Implementation
Entry of Cohort
Roles of Surveyor
Self-developed IT
Reward System
PublicationsHuman
Resources

Organization Structure
Main Coordinator / ResearcherHead of ITB Career Center
Adminitration of ITB Career Center
Assistant Researcher
Finance
IT Team Technical and Secretariat Team Logistic Team
Surveyor Team
Person in ChargeHead of Student Organizations
ProtectorVice Rector for Academic and Student Affairs
Vice Rector of Communications, Partnerships and Alumni
Additional Researcher
Assistant ResearcherAssistant Researcher

Minimizing the Data Leak in Every Stage/Step
Total amount ofgraduates of a cohort
Graduates in the survey
Available addresses
Validate addresses
Actual participants (= response)
The most important thing: How to minimize the gap in every stage/step - it mostly decrease in
number from total graduate of a cohort

Data Responden Tracer Study ITB 2015
Total alumni in 1 entry of cohort (2825person)
Total alumni include in Tracer Study (2821person)
Alumni has email address (2815 person)
Alumni has validated email address (2757 person)
Total alumni complete fill out questionnaire (2612 person)
on going no email address email bouncing Pass away No information
36 6 58 4 109

Entry of Cohort Implementing Cultural and Informal approach- Based on Study Program
- Entry of Cohort has strong networking
- Connect to internet
- Using Media Social (WA Groups, BBM Group, Facebook Group)
- Mostly using Gatget and/or Mobile Coonection/Device to connect to each other
- Relationship: kinship, brotherhood, friendship, and intimacy.
Including Surveyor (chosen from one of study program the alumni from the entry of cohort).

Internet User in Indonesia

Top Media Social Used by Indonesian

Exit Survey
1-2 years 4-5 years
University
source: schomburgNational Tracer Study Guideline: 1-3 years after graduation (Book from Belmawa, DIKTI, Minister of Education)

ITB Case
1st year class at ITB
2006
April Graduates
July Graduates
October Graduates
1st year graduates 3rd year graduates
April Graduate
s
July Graduates
October Graduates
4th year graduate(extention/ particular
student/almost zero)
Conduct TRACER STUDY
20112010 2012 2013

1st year class at ITB
2007
April Graduate
s
July Graduate
s
October Graduates
1st year graduates
3rd year graduates
April Graduate
s
July Graduates
October Graduate
s
4th year graduate(extention/ particular
student/almost zero)
Conduct TRACER STUDY
20122011 2013 2014

1st year class at ITB
2008
April Graduate
s
July Graduate
s
October Graduates
1st year graduates
3rd year graduates
April Graduate
s
July Graduates
October Graduate
s
4th year graduate(extention/ particular
student/almost zero)
Conduct TRACER STUDY
20132012 2014 2015

Entry of Cohort Initial Idea
Surveyor/Head Class Alumni
ITB/Institution

Total Responden AlumniEntry of Cohort 2006
190272%
74628%
Mengisi
Tidak Mengisi
Total Alumni 2006 : 2648

Total Responden AlumniEntry of Cohort 2007
226880%
56020% Mengisi Tidak Mengisi
Total Alumni 2007 : 2828

Total Responden Alumni ITBEntry of Cohort 2008
261293%
2097%
Gross Response Rate
Not Response
Total Alumni 2008 : 2821

Total Responden Alumni ITBCohort 2012
216180%
53220%
Nett Response Rate
Not Response
Total Cohort 2012: 2693

Roles of Surveyor
Roles of Surveyor
Complete and update database (email and HP number)
Give explanation about Tracer Study to their classmates
Ask and motivated their classmates to fill in questionnaire
Coordinate regularly with Tracer Study ITB Secretariat

Surveyor Ilustration
Surveyor/Head Class
Alumni/Classmates

Surveyor Meeting (2 times)

Self-developed IT System-Have many human resources (especially students or fresh graduates)
-Much easier in developing, improving, updating, and handing the problems during implementation
-Without to rely to 3rd parties
-Using self-developed server and database
-More flexible to change every things in user friendly
-Compatible with every browser, including mobile browser (mostly android and iOS)
-Every year updating the system


Reward System- Token of appreciation in form of gadget/mobile phone (reward was drawn)
- Reward was drawn because it was limited in quantity (only five items)
- It is much better than giving reward (e.g souvenirs/small item) for every respondents
- Transparancy in drawn system
- Delivered to chosen respondents directly by delivery service with documentation

Reward Documentation

Publications- To spread out information and result about Tracer Study in ITB to target of respondent, academic community, surveyor, etc.
- Form of publications: book of report, video, photos of activity, info on website. Rapid publication is very important to inform the result of every year (before starting the next Tracer Study).
- Public especially academic community and the respondents also can read the result as fast as possible (in the same year). It is about building the trust for the public. We send information to the respondents by email.
- Website is very important to spread out information for surveyor to communicate with especially target respondent.
- Book are also printed and spread out for lecturer (1500 lecturers in ITB).


Human Resources- Fulltime staff
- Dedicated human resources
- Trained researcher and assistant researcher

Tracer Study ITB Secretariat

Conclusion- To conducting Tracer Study in good quality data and high response rate needs improvement and innovation for every step implementation
- For methodology we should consider the cultural and tradition aspects of the environment place where Tracer Study held
- Using entry of cohort approach definitely can increase the response rate in Indonesia (especially in ITB)
- Entry of cohort was able to provide two analysis, based on cohort and based on entry of cohort
- Structural & cultural and formal & informal approach can become alternative in implementation of Tracer Study in Indonesia to increase response rate

Appendix

Table of Data Analysis between Cohort and Entry of Cohort
No Data InformationResult
2012 2006 2007 2008
1 Total responden Complete 80% 72% 80% 92%
2 Job status
Work 68% 70% 66% 66%
Work and self-employed 5% 6% 5% 5%
Not working/continuing study 21% 19% 22% 22%
Entrepreneur 6% 5% 7% 7%
3 Suitability of lecture with work Suitable 72% 75% 70% 74%
4 Time looking for workBefore graduate 3,99 4,38 4,3 4,22
After graduate 2,65 2,27 2,4 2,78
5 Time needed for getting a jobBefore graduate 3,65 2,93 3,27 3,62
After graduate 4,38 3,85 4,21 4,37
6 Category of company
Local 17% 17% 17% 18%
National 41% 47% 39% 43%
Multinational 42% 36% 44% 39%
7 Category of business
B = Mining B (23%) B (22%) B (21%) B (20%)
M = Profesional services M (12%) M (13%) M (12%) M (12%)
C = Processing industry C (10%) C (10%) C (12 %) C (11%)
J = Information J (9%) K (10%) F (9%) F (10%)
F = Construction F (9%) F (9%) J (8%) J (10%)
8 Company work type
Government (NGO) 22% 25% 20% 23%
Non-profit organizations 2% 1% 2% 2%
Private company 66% 65% 67% 65%
Own company 9% 9% 11% 10%
9 Position
Director 1% 2% 2% 2%
Owner 6% 5% 7% 7%
Manager 5% 6% 6% 6%
Staff 86% 86% 83% 84%
Apprentice 2% 1% 2% 2%
10 Average income
Work 9,2 millions 12,4 millions 8,8 millions 9,1 millions
Work and self-employed 8,7 millions 7,4 millions 6,6 millions 8,6 millions
Entrepreneur 6,9 millions 8,3 millions 8,3 millions 7,7 millions

Total responden
Current job
Suitability of lecture with work
Foreign language ability and contribution
Time waiting getting a job
Category of company
Category of business
Company work type
Position
Average income
Data Analysis Chart between Cohort and Entry of Cohort

Current Job(Cohort 2012)
68%
5%
21%
6%bekerja (1463)
bekerja dan wiraswasta (104)
tdk bekerja/melanjutkan studi(462)
wirausaha (132)

Current Job(Entry of Cohort 2008)
66%
5%
22%
7%
bekerja (1714) bekerja dan wiraswasta (126)
tdk bekerja/melanjutkan studi (593) wirausaha (179)

Current Job(Entry of Cohort 2007)
66%
5%
22%
7% bekerja (1496)
bekerja dan wiraswasta (109)
tdk bekerja/melanjutkan studi(504)
wirausaha (160)

Current Job(Entry of Cohort 2006)
19%
6%
5%69%
Tidak Bekerja/MelanjutkanStudi (368)
Wirausaha (112)
Bekerja dan Wiraswasta(100)
Bekerja (1320)

Suitability of lecture with work
KesesuaianKuliah (1635)
74%
26%
Sesuai Tidak Sesuai
Kesesuaian Kuliah(1415)
72%
28%
Sesuai Tidak Sesuai
KesesuaianKuliah (1495)
70%
30%
Sesuai Tidak Sesuai
Kesesuaiankuliah (1320)
75%
25%
Sesuai Tidak Sesuai
2012 2008 2007 2006

Foreign Language Ability VS University Contribution (2012)
N = 2161
0 0.5 1 1.5 2 2.5 33.5 4
Tingkat kemampuan bahasa asing alumni
Tingkat kontribusi perguruan tinggi dalam bahasaasing
3.53
2.67

Foreign Language Ability VS University Contribution (2008)
0 0.5 1 1.5 2 2.5 3 3.5 4
Tingkat kemampuan bahasa asing alumni
Tingkat kontribusi perguruan tinggi dalam bahasaasing
3.57
2.70
N = 2612

Time Looking for a Job (2012)
Total Mean (month)
Before graduate 597 3,99
After graduate 625 2,65
0.00
0.50
1.00
1.50
2.00
2.50
3.00
3.50
4.00
Sebelum lulus(597)
Setelah lulus (625)
3.99
2.65

Time Looking for a Job (2008)
Total Mean (month)
Before graduate 688 4.22
After graduate 738 2.78
0.00
0.50
1.00
1.50
2.00
2.50
3.00
3.50
4.00
4.50
Sebelum lulus(688)
Setelah lulus (738)
4.22
2.78

Time Looking for a Job (2007)
Total Mean (month)
Before graduate 675 4.30
After graduate 685 2.40
Sebelum lulus(675)
Setelah lulus (685)
4.30
2.40

Time Looking for a Job (2006)
Total Mean (month)
Before graduate 538 4.38
After graduate 566 2.27
0.00
0.50
1.00
1.50
2.00
2.50
3.00
3.50
4.00
4.50
Sebelum lulus (538)
Setelah lulus (566)
4.38
2.27

Time Needed Getting a Job (2012)
Total Mean (month)
Before graduate 378 3.65
After graduate 1240 4.38
0
0.5
1
1.5
2
2.5
3
3.5
4
4.5
Sebelum lulus(378)
Setelah lulus(1240)
3.65
4.38

Time Needed Getting a Job (2008)
Total Mean (month)
Before graduate 433 3.62
After graduate 1436 4.37
0
0.5
1
1.5
2
2.5
3
3.5
4
4.5
Sebelum lulus(433) Setelah lulus
(1436)
3.62
4.37

Time Needed Getting a Job (2007)
Total Mean (month)
Before graduate 436 3.27
After graduate 1326 4.21
Sebelum lulus(436)
Setelah lulus(1326)
3.27
4.21

Time Needed Getting a Job (2006)
Total Mean (month)
Before graduate 372 2.93
After graduate 1159 3.85
0.00
0.50
1.00
1.50
2.00
2.50
3.00
3.50
4.00
Sebelum lulus
Setelah lulus
2.93
3.85

Category of Company (2012)17%
41%
42%
lokal (242) nasional (575) multinasional (598)

Category of Company (2008)18%
43%
39%
lokal (287) nasional (709) multinasional (639)

Category of Company (2007)
17%
39%
44%
lokal (254)
nasional (585)
multinasional(657)

Category of Company (2006)
17%
47%
36%
Lokal (227) Nasional (615) Multinasional (478)

A: Pertanian, perikanan, dan kehutanan
B: Pertambangan dan penggalian
C: Industri pengolahan
D: Pengadaaan listrik, gas, uap/air panas,
dan udara dingin
E: Pengadaan air, pengelolaaan sampah
dan daur ulang, pembuangan dan
pembersihan limbah dan sampah
F: Konstruksi dan pembangunan
G: Perdagangan besar dan eceran,
reparasi dan perawatan mobil dan sepeda
motor
H: Transportasi dan pergudangan
I: Penyediaan akomodasi dan penyediaan
makanan dan minuman
J: Informasi dan komunikasi
K: Jasa keuangan dan asuransi
L: Real estate, developer, dan properti
M: Jasa profesional, ilmiah, dan teknis
N: Jasa persewaan dan sewa guna usaha
tanpa hak opsi, ketenagakerjaan, agen
perjalanan dan penunjang usaha lainnya
O: Administrasi pemerintahan, pertahanan,
dan jaminan wajib sosial
P: Jasa pendidikan
Q: Jasa kesehatan dan kegiatan sosial
R: Kesenian, hiburan dan rekreasi
S: Kegiatan jasa lainnya
T: Jasa perorangan yang melayani rumah
tangga, kegiatan yang menghasilkan
barang dan jasa oleh rumah tangga
U: Kegiatan badan internasional dan
kegiatan badan internasional ekstra lainnya
Category of Business (2012)
B, 23.3%
C, 10.5%
F, 9.3%
H, 3.0%
J, 9.4%K, 6.4%
M, 12.4%
S, 3.4%
A B C D E F G H I J K
L M N O P Q R S T U

A: Pertanian, perikanan, dan kehutanan
B: Pertambangan dan penggalian
C: Industri pengolahan
D: Pengadaaan listrik, gas, uap/air panas,
dan udara dingin
E: Pengadaan air, pengelolaaan sampah
dan daur ulang, pembuangan dan
pembersihan limbah dan sampah
F: Konstruksi dan pembangunan
G: Perdagangan besar dan eceran,
reparasi dan perawatan mobil dan sepeda
motor
H: Transportasi dan pergudangan
I: Penyediaan akomodasi dan penyediaan
makanan dan minuman
J: Informasi dan komunikasi
K: Jasa keuangan dan asuransi
L: Real estate, developer, dan properti
M: Jasa profesional, ilmiah, dan teknis
N: Jasa persewaan dan sewa guna usaha
tanpa hak opsi, ketenagakerjaan, agen
perjalanan dan penunjang usaha lainnya
O: Administrasi pemerintahan, pertahanan,
dan jaminan wajib sosial
P: Jasa pendidikan
Q: Jasa kesehatan dan kegiatan sosial
R: Kesenian, hiburan dan rekreasi
S: Kegiatan jasa lainnya
T: Jasa perorangan yang melayani rumah
tangga, kegiatan yang menghasilkan
barang dan jasa oleh rumah tangga
U: Kegiatan badan internasional dan
kegiatan badan internasional ekstra lainnya
B, 20%
C, 11%
D, 3%
F, 10%
G, 3%H, 3%
J, 10%
K, 7%
M, 12%
O, 3%
R, 3% S, 4%
A B C D E F G H I J K
L M N O P Q R S T U

A: Pertanian, perikanan, dan kehutanan
B: Pertambangan dan penggalian
C: Industri pengolahan
D: Pengadaaan listrik, gas, uap/air panas,
dan udara dingin
E: Pengadaan air, pengelolaaan sampah
dan daur ulang, pembuangan dan
pembersihan limbah dan sampah
F: Konstruksi dan pembangunan
G: Perdagangan besar dan eceran,
reparasi dan perawatan mobil dan sepeda
motor
H: Transportasi dan pergudangan
I: Penyediaan akomodasi dan penyediaan
makanan dan minuman
J: Informasi dan komunikasi
K: Jasa keuangan dan asuransi
L: Real estate, developer, dan properti
M: Jasa profesional, ilmiah, dan teknis
N: Jasa persewaan dan sewa guna usaha
tanpa hak opsi, ketenagakerjaan, agen
perjalanan dan penunjang usaha lainnya
O: Administrasi pemerintahan, pertahanan,
dan jaminan wajib sosial
P: Jasa pendidikan
Q: Jasa kesehatan dan kegiatan sosial
R: Kesenian, hiburan dan rekreasi
S: Kegiatan jasa lainnya
T: Jasa perorangan yang melayani rumah
tangga, kegiatan yang menghasilkan
barang dan jasa oleh rumah tangga
U: Kegiatan badan internasional dan
kegiatan badan internasional ekstra lainnya
B, 20.92%
C, 11.73%
F, 9.13%
J, 7.94%
K, 7.77%
M, 12.24%
Category of Business (2007)
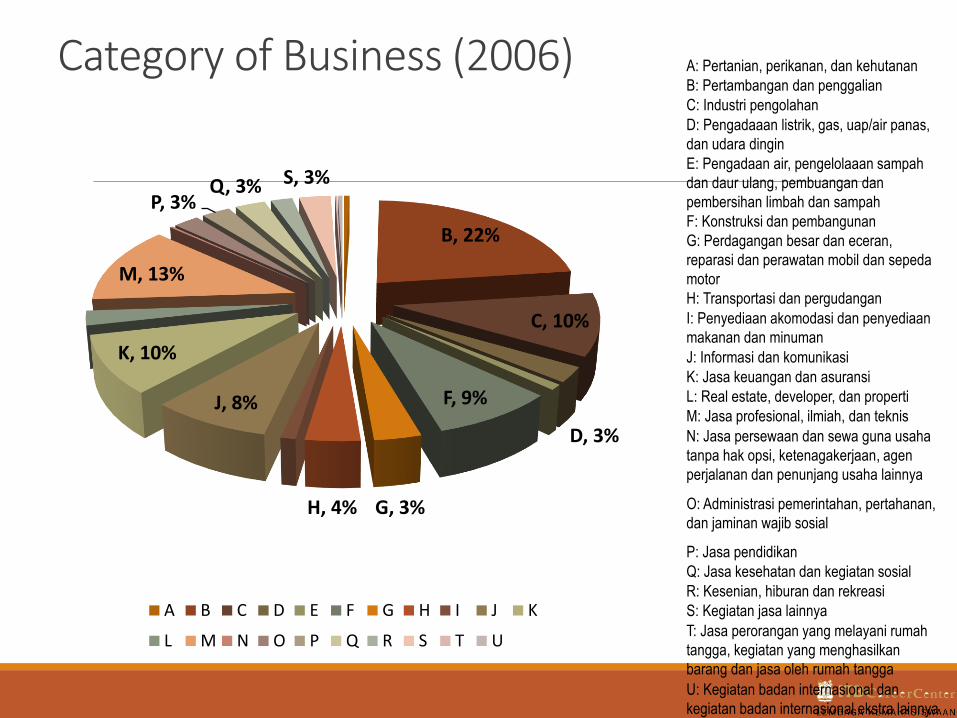
B, 22%
C, 10%
D, 3%
F, 9%
G, 3%H, 4%
J, 8%
K, 10%
M, 13%
P, 3%Q, 3% S, 3%
A B C D E F G H I J K
L M N O P Q R S T U
Category of Business (2006) A: Pertanian, perikanan, dan kehutanan
B: Pertambangan dan penggalian
C: Industri pengolahan
D: Pengadaaan listrik, gas, uap/air panas,
dan udara dingin
E: Pengadaan air, pengelolaaan sampah
dan daur ulang, pembuangan dan
pembersihan limbah dan sampah
F: Konstruksi dan pembangunan
G: Perdagangan besar dan eceran,
reparasi dan perawatan mobil dan sepeda
motor
H: Transportasi dan pergudangan
I: Penyediaan akomodasi dan penyediaan
makanan dan minuman
J: Informasi dan komunikasi
K: Jasa keuangan dan asuransi
L: Real estate, developer, dan properti
M: Jasa profesional, ilmiah, dan teknis
N: Jasa persewaan dan sewa guna usaha
tanpa hak opsi, ketenagakerjaan, agen
perjalanan dan penunjang usaha lainnya
O: Administrasi pemerintahan, pertahanan,
dan jaminan wajib sosial
P: Jasa pendidikan
Q: Jasa kesehatan dan kegiatan sosial
R: Kesenian, hiburan dan rekreasi
S: Kegiatan jasa lainnya
T: Jasa perorangan yang melayani rumah
tangga, kegiatan yang menghasilkan
barang dan jasa oleh rumah tangga
U: Kegiatan badan internasional dan
kegiatan badan internasional ekstra lainnya

Company Work Type (2012)
N = 1697
22%
2%
66%
9%instansi pemerintah(termasuk BUMN)
organisasi non-profit/lembaga swadayamasyarakat
perusahaan swasta
wiraswasta/perusahaansendiri
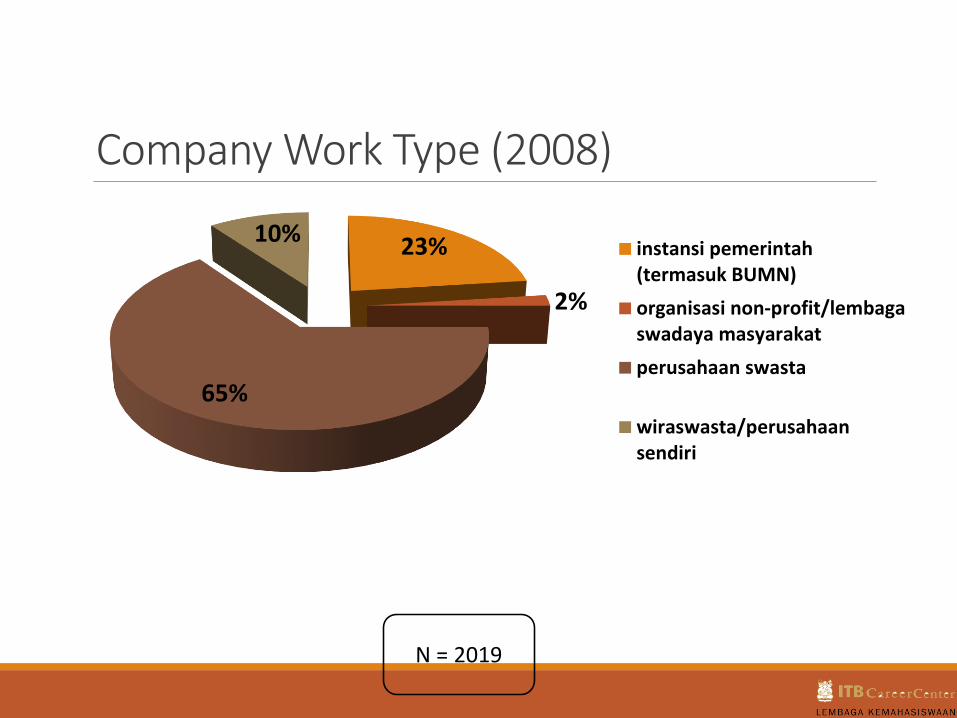
Company Work Type (2008)
N = 2019
23%
2%
65%
10%instansi pemerintah(termasuk BUMN)
organisasi non-profit/lembagaswadaya masyarakat
perusahaan swasta
wiraswasta/perusahaansendiri

Company Work Type (2007)
N = 1764
20.46%1.70%
66.78%
11.05%instansi pemerintah (termasukBUMN)
organisasi non-profit/lembagaswadaya masyarakat
perusahaan swasta
wiraswasta/perusahaansendiri

Company Work Type (2006)
N = 1528
25.26%
1.05%
64.99%
8.70%
instansi pemerintah(termasuk BUMN)
organisasi non-profit/lembagaswadaya masyarakat
perusahaan swasta
wiraswasta/perusahaansendiri

Position (2012)
N = 70
1% 2%
5%6%
86%
Direktur (25) Magang (27) Manajer (89) Pemilik (105) Staf (1453)

Position (2008)
N = 70
2% 2%
6%7%
84%
Direktur (33) Magang (33) Manajer (130) Pemilik (136) Staf (1687)

Position (2007)
N = 1764
1.87%1.98% 6.58%
6.80%
82.77%
Direktur (33)
Magang (35)
Manajer (116)
Pemilik (120)
Staf (1460)

Average Income (2012)
Rp0
Rp1,000,000
Rp2,000,000
Rp3,000,000
Rp4,000,000
Rp5,000,000
Rp6,000,000
Rp7,000,000
Rp8,000,000
Rp9,000,000
Rp10,000,000
bekerja (1448) bekerja dan wiraswasta(104)
wirausaha (127)
Rp9,163,440Rp8,648,717
Rp6,918,898

Average Income (2008)
Rp6,500,000
Rp7,000,000
Rp7,500,000
Rp8,000,000
Rp8,500,000
Rp9,000,000
Rp9,500,000
bekerja (1694) bekerja dan wiraswasta(125)
wirausaha (173)
Rp9,060,249
Rp8,571,600
Rp7,659,249

Average Income (2007)
bekerja (1474) bekerja dan wiraswasta(107)
wirausaha (150)
Rp8,771,630
Rp6,616,696
Rp8,301,287

Average Income (2006)
Rp0
Rp2,000,000
Rp4,000,000
Rp6,000,000
Rp8,000,000
Rp10,000,000
Rp12,000,000
Rp14,000,000
Wirausaha (108) Bekerja dan Wiraswasta(100)
Bekerja (1306)
Rp12,348,148
Rp7,362,000Rp8,288,067

Head of ITB Career Center
Dr. Eng. Bambang Setia Budi, ST, MT
Gedung Kuliah Umum Timur Lantai Dasar
Jl. Ganesha 10 Bandung 40132
Telp: 022-2509162
HP: 081394664472
Fax: 022-2509177
Email: [email protected]
Assistant Researcher
Angga Dinan A, S.Si, MT
Gedung Campus Center Barat Bawah Ruang 18
Jl. Ganesha 10 Bandung 40132
Telp: 022-2530714
HP: 081573191973
Email: [email protected]
Contact
If there any question or need more information you can contact the above contacts

Budi, Bambang Setia. 2014. Tracer Study: Urgency, Problem, and How to Increase Response Rate. Presented in Training for Tracer Study Team of UNPAD at WISMA UNPAD CIMANDIRI on Monday, 3 November 2014. Bandung.
Sailah, Illah. 2011. Perlunya Tracer Study untuk Pendidikan Tinggi. Jakarta (Direktur Pembelajaran & Kemahasiswaan Ditjen Dikti ).
Schomburg, Harald. 2003. Handout for Graduate Tracer Studies. International Centre for Higher Education Research (INCHER-Kassel) University Kassel. Germany.
Schomburg, Harald. 2010. Concept and Methodology of Tracer Studies – International Experiences. Presentation at Workshop in Sinaia 2-4 June 2010. International Centre for Higher Education Research (INCHER-Kassel) University Kassel. Germany.
Schomburg, Harald. 2011. Methodology and Methods of Tracer Studies. International Centre for Higher Education Research (INCHER-Kassel) University Kassel. Germany.
Reference

Thank You