innovative approach for capacity increase at the … · innovative approach for capacity increase...
TRANSCRIPT
Innovative Approach for Capacity Increase at the North Olmsted WWTPJune 29, 2017
Anthony Farina, PEHazen and Sawyer
Brian BlumCity of North Olmsted
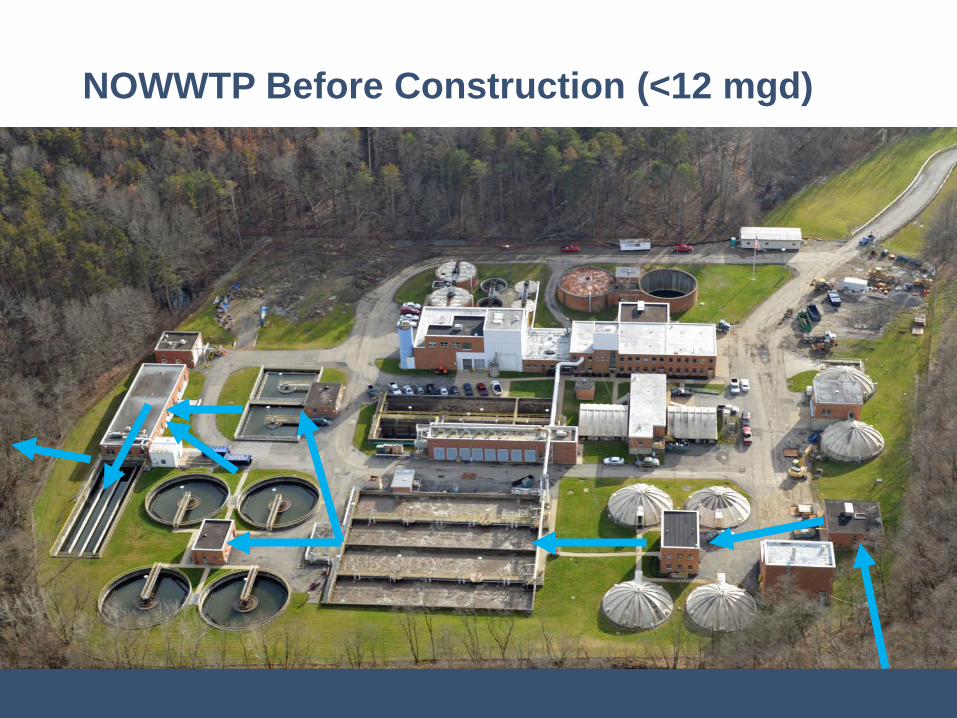
NOWWTP Before Construction (<12 mgd)
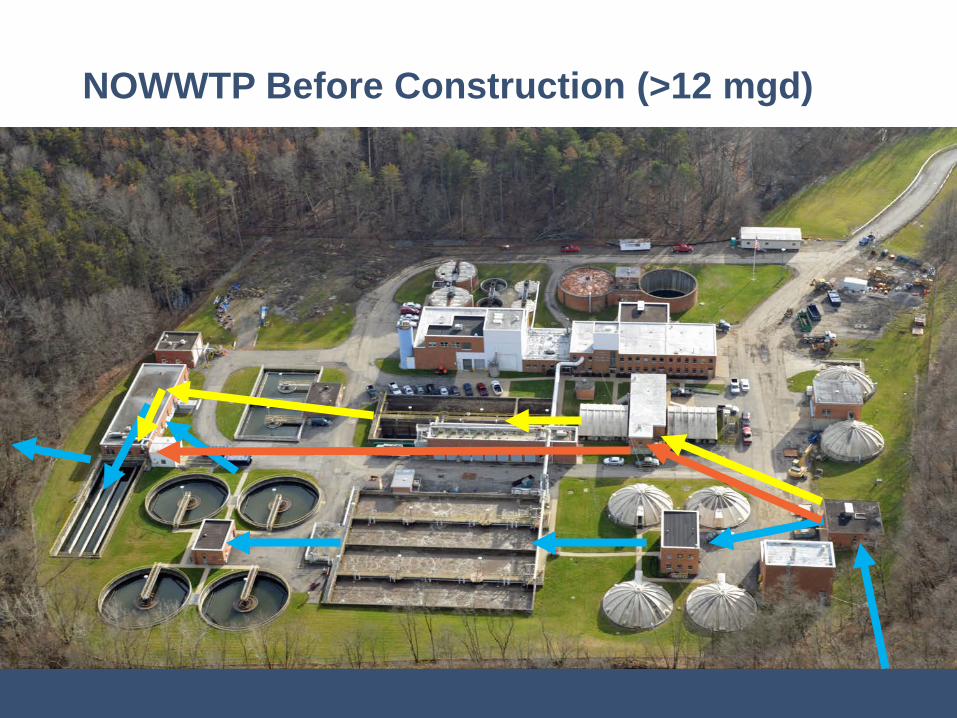
NOWWTP Before Construction (>12 mgd)
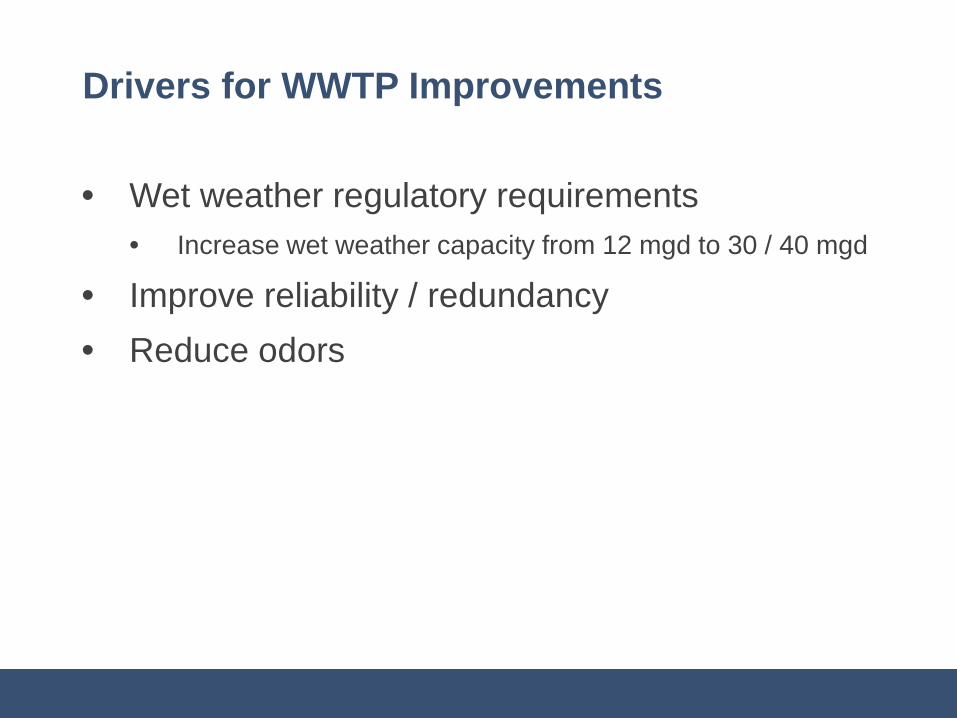
Drivers for WWTP Improvements
• Wet weather regulatory requirements• Increase wet weather capacity from 12 mgd to 30 / 40 mgd
• Improve reliability / redundancy• Reduce odors
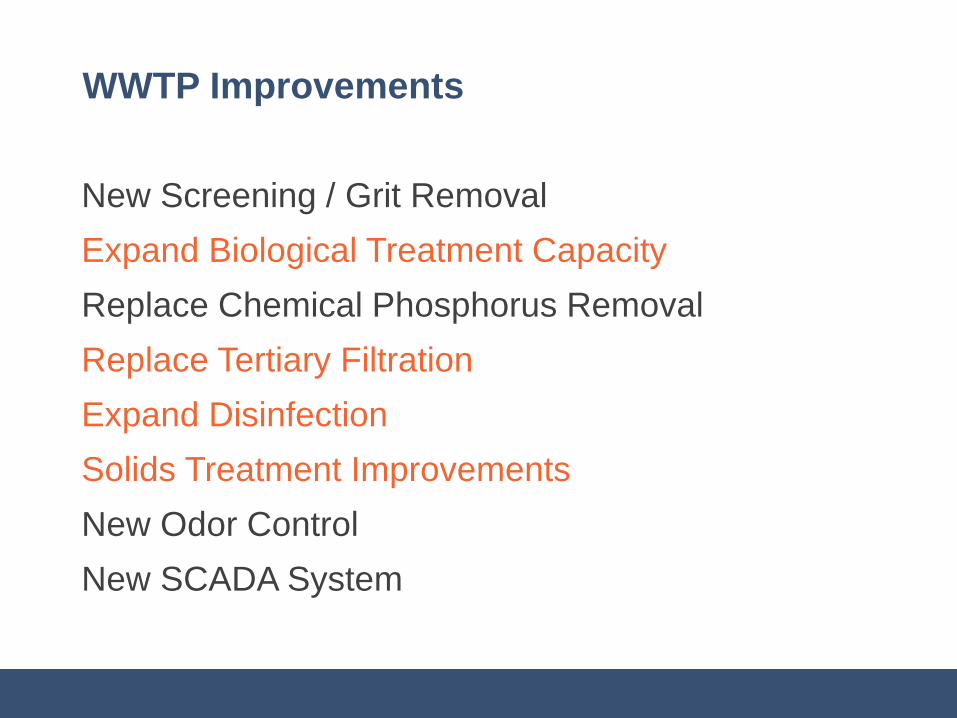
WWTP Improvements
New Screening / Grit RemovalExpand Biological Treatment CapacityReplace Chemical Phosphorus RemovalReplace Tertiary FiltrationExpand DisinfectionSolids Treatment ImprovementsNew Odor ControlNew SCADA System
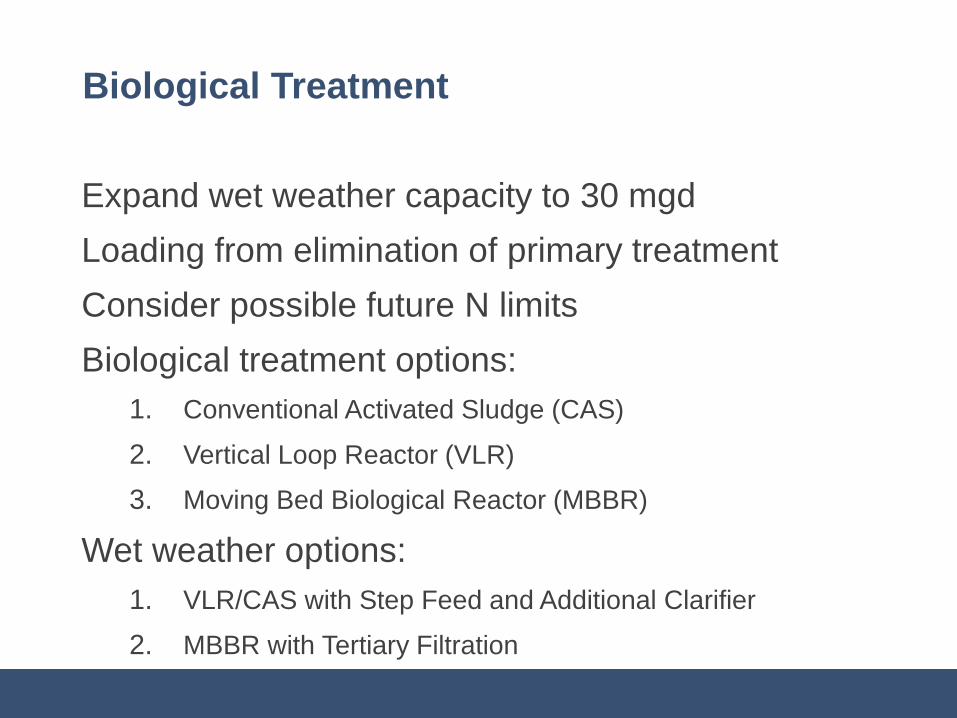
Biological Treatment
Expand wet weather capacity to 30 mgdLoading from elimination of primary treatmentConsider possible future N limitsBiological treatment options:
1. Conventional Activated Sludge (CAS)2. Vertical Loop Reactor (VLR)3. Moving Bed Biological Reactor (MBBR)
Wet weather options:1. VLR/CAS with Step Feed and Additional Clarifier2. MBBR with Tertiary Filtration
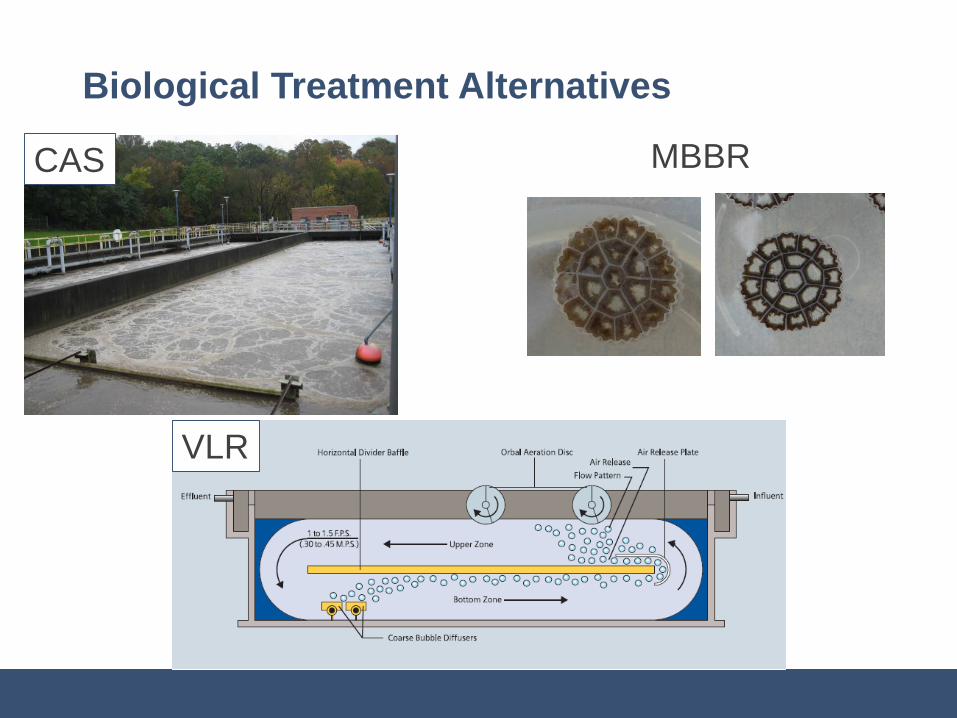
Biological Treatment Alternatives
CAS MBBR
VLR
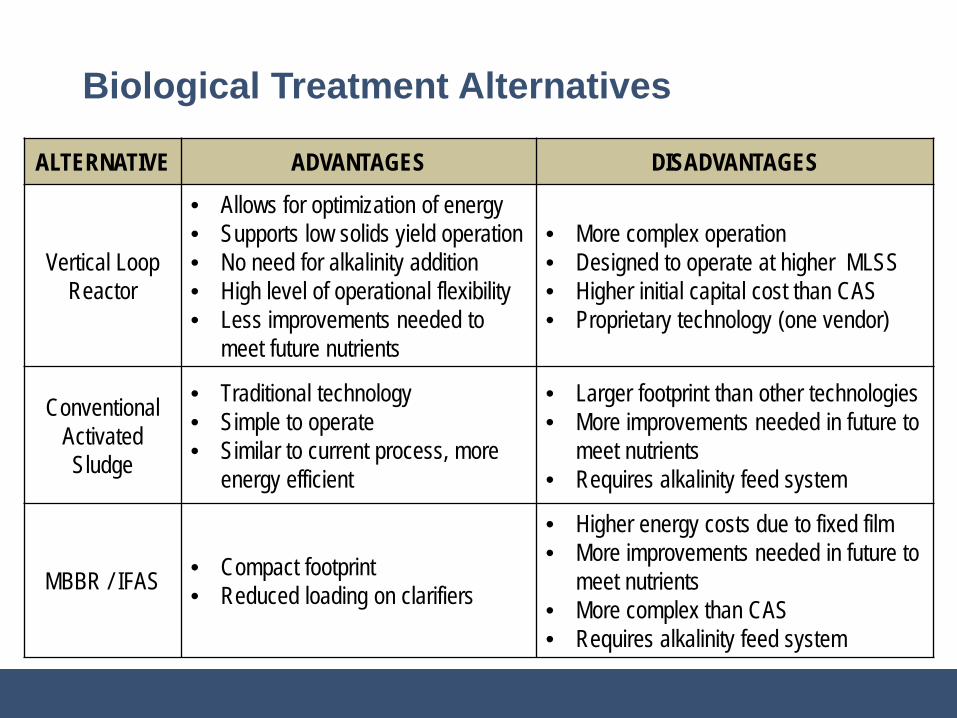
Biological Treatment Alternatives
ALTERNATIVE ADVANTAGES DISADVANTAGES
Vertical Loop Reactor
• Allows for optimization of energy• Supports low solids yield operation• No need for alkalinity addition • High level of operational flexibility• Less improvements needed to
meet future nutrients
• More complex operation• Designed to operate at higher MLSS• Higher initial capital cost than CAS• Proprietary technology (one vendor)
Conventional Activated Sludge
• Traditional technology• Simple to operate• Similar to current process, more
energy efficient
• Larger footprint than other technologies• More improvements needed in future to
meet nutrients• Requires alkalinity feed system
MBBR / IFAS • Compact footprint• Reduced loading on clarifiers
• Higher energy costs due to fixed film• More improvements needed in future to
meet nutrients• More complex than CAS• Requires alkalinity feed system
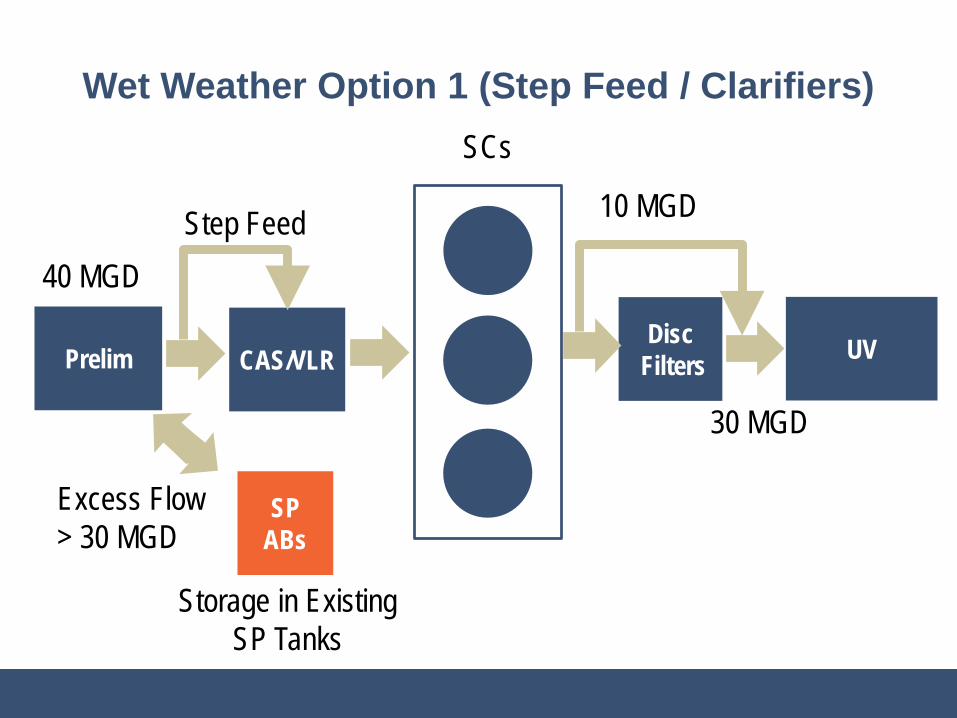
Wet Weather Option 1 (Step Feed / Clarifiers)
Prelim CAS/VLRDisc
Filters UV
40 MGD
SCs
10 MGD
SP ABs
Storage in Existing SP Tanks
Step Feed
30 MGD
Excess Flow > 30 MGD
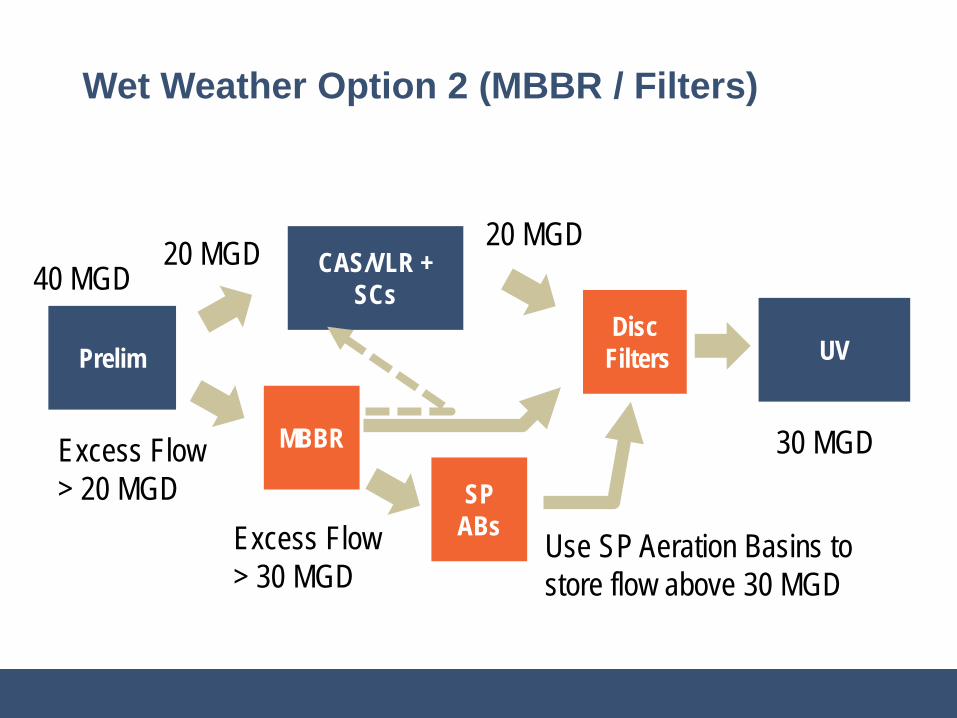
Wet Weather Option 2 (MBBR / Filters)
Prelim
CAS/VLR + SCs
DiscFilters UV
MBBR
20 MGD
30 MGDExcess Flow > 20 MGD
20 MGD
SP ABs Use SP Aeration Basins to
store flow above 30 MGDExcess Flow > 30 MGD
40 MGD
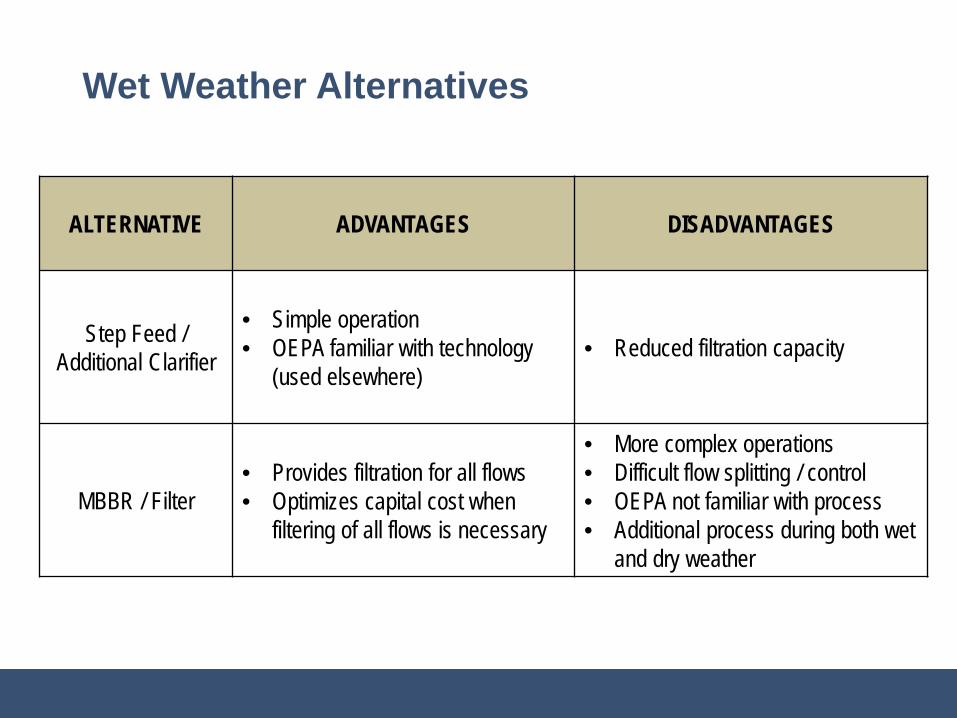
Wet Weather Alternatives
ALTERNATIVE ADVANTAGES DISADVANTAGES
Step Feed / Additional Clarifier
• Simple operation• OEPA familiar with technology
(used elsewhere)• Reduced filtration capacity
MBBR / Filter• Provides filtration for all flows• Optimizes capital cost when
filtering of all flows is necessary
• More complex operations• Difficult flow splitting / control• OEPA not familiar with process• Additional process during both wet
and dry weather
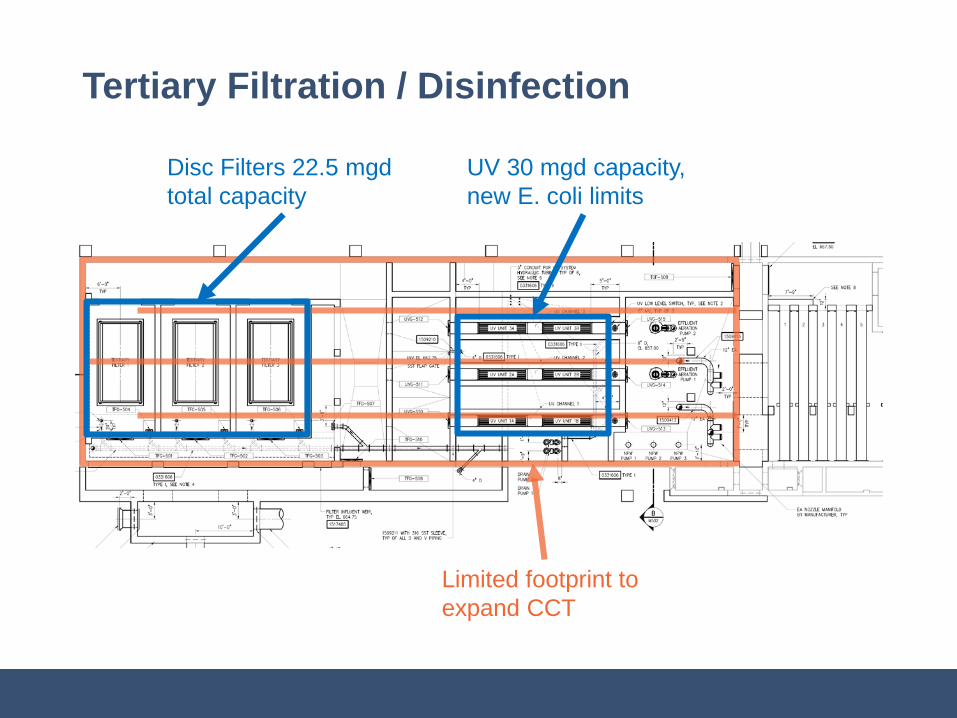
Tertiary Filtration / Disinfection
Disc Filters 22.5 mgdtotal capacity
UV 30 mgd capacity, new E. coli limits
Limited footprint to expand CCT
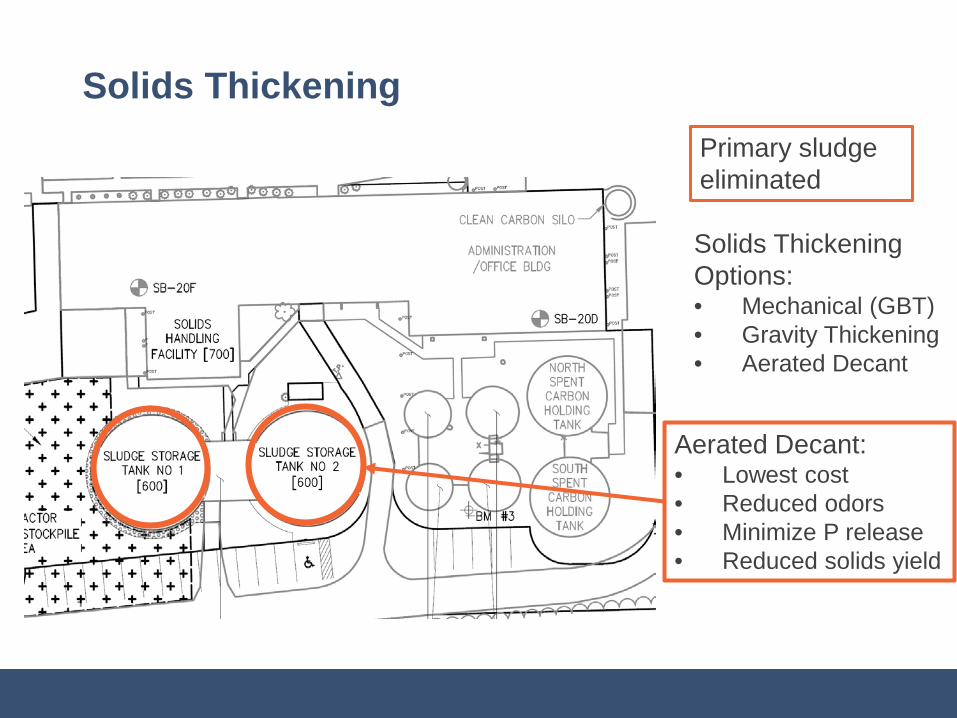
Solids ThickeningPrimary sludge eliminated
Solids Thickening Options:• Mechanical (GBT)• Gravity Thickening• Aerated Decant
Aerated Decant:• Lowest cost• Reduced odors• Minimize P release• Reduced solids yield
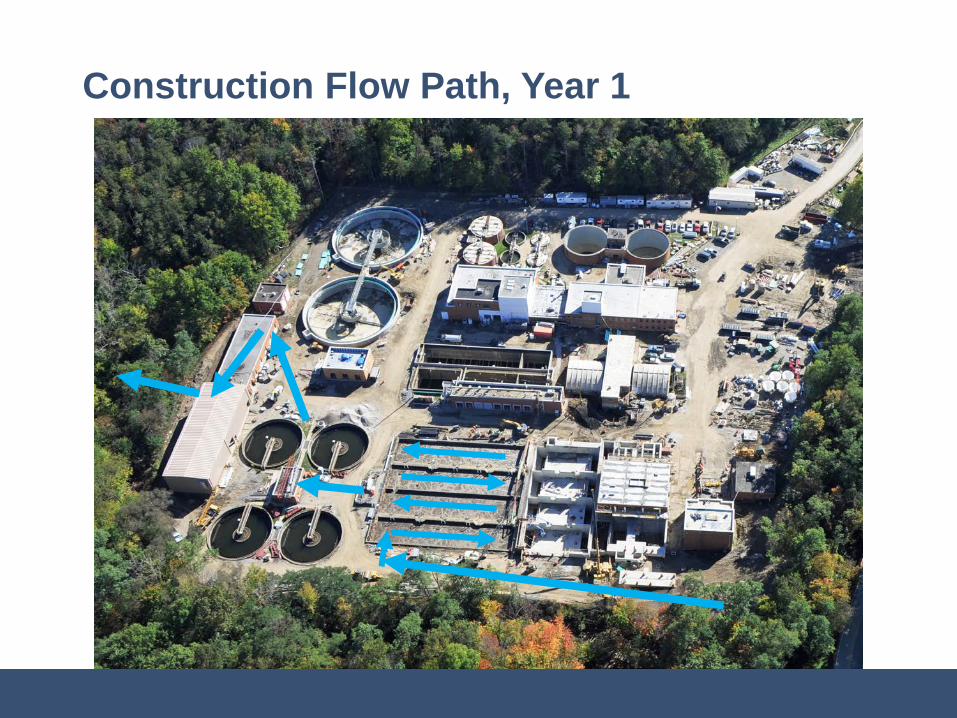
Construction Flow Path, Year 1
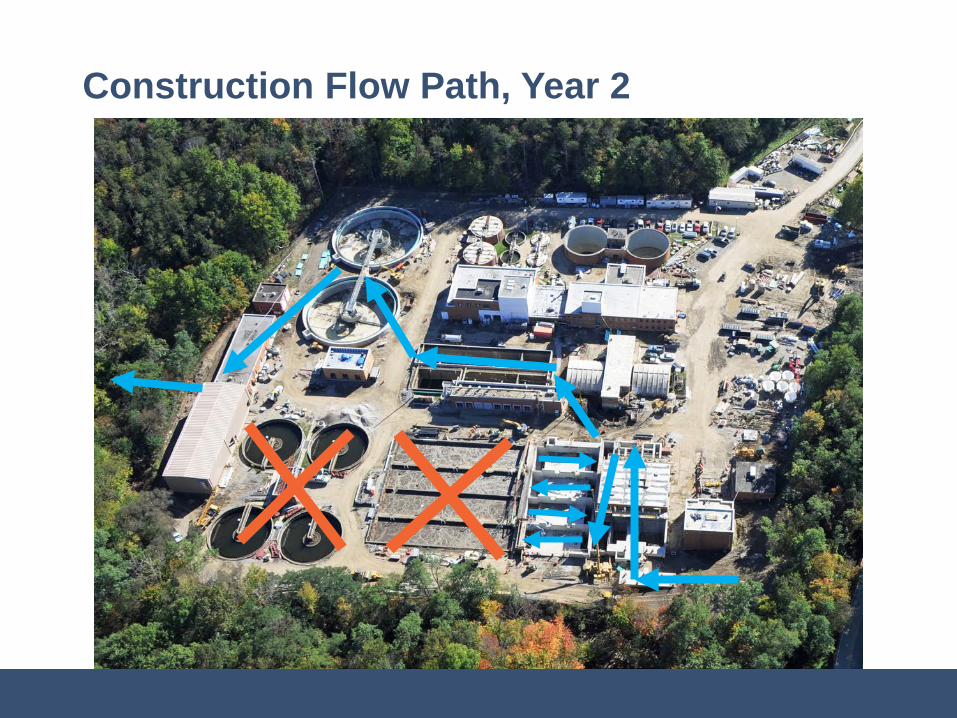
Construction Flow Path, Year 2
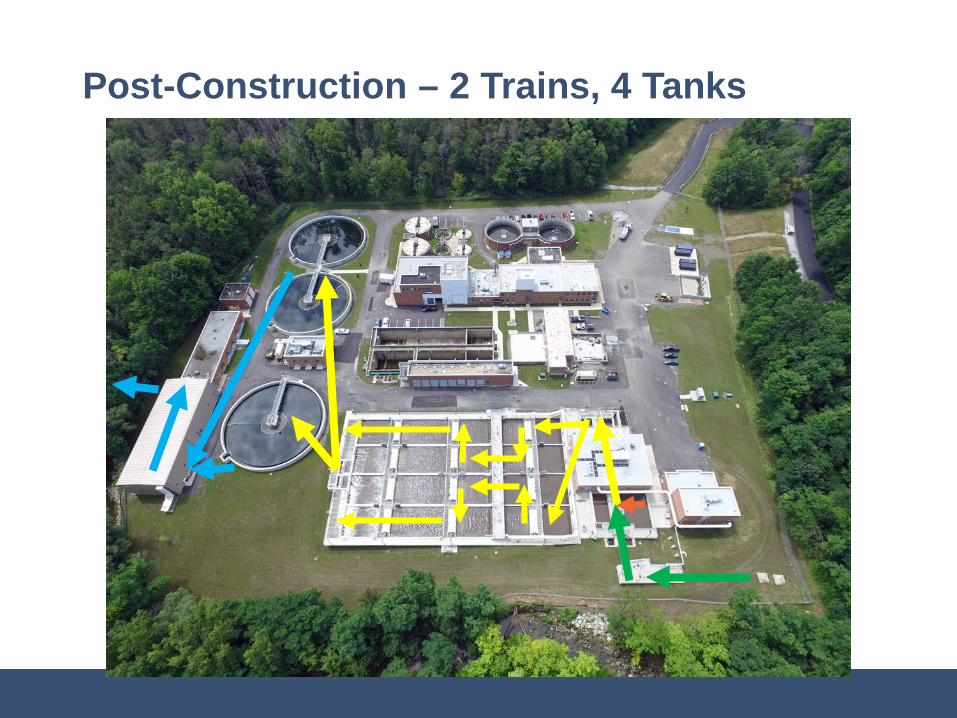
Post-Construction – 2 Trains, 4 Tanks
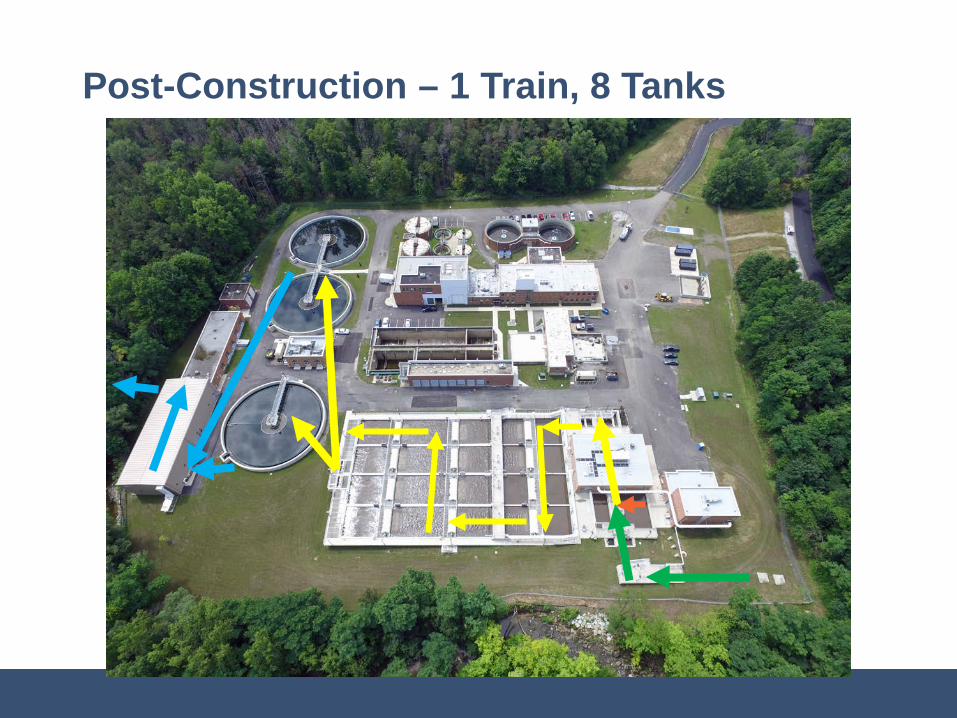
Post-Construction – 1 Train, 8 Tanks
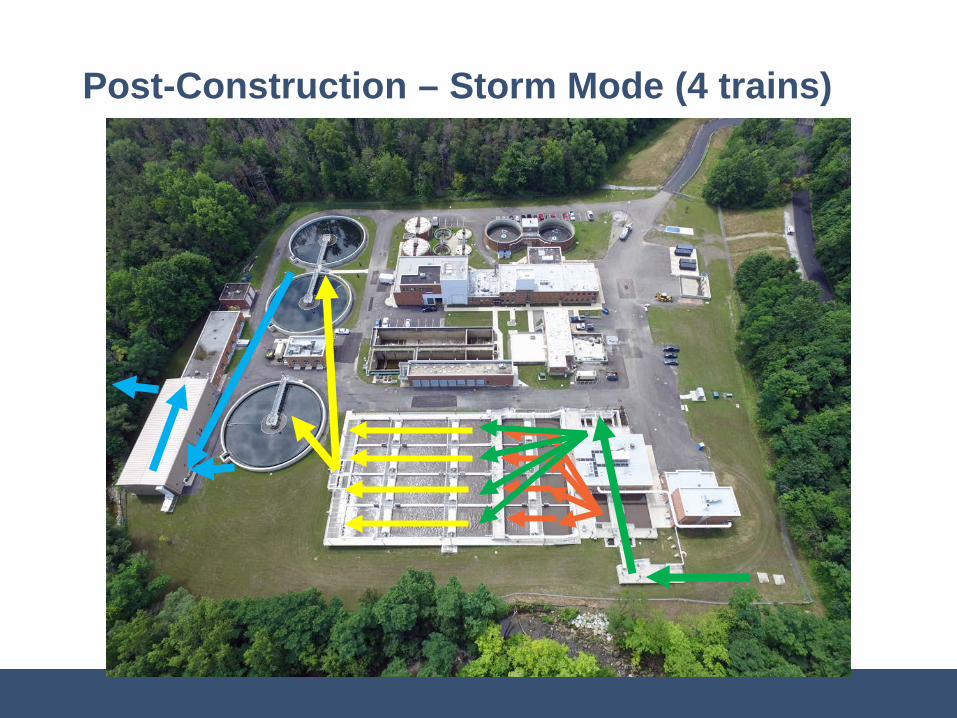
Post-Construction – Storm Mode (4 trains)
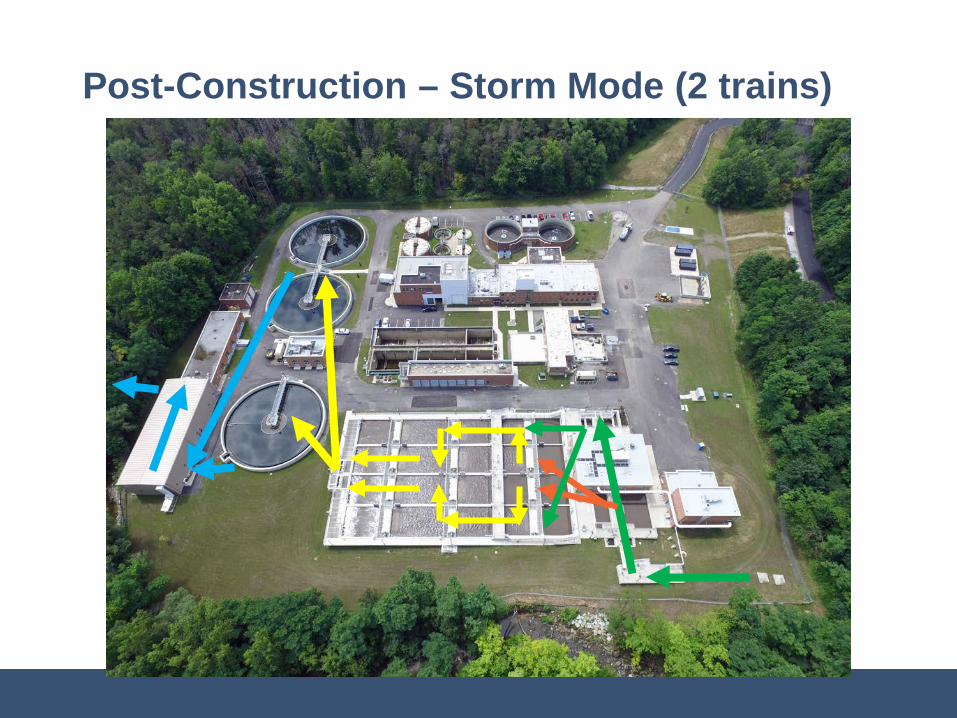
Post-Construction – Storm Mode (2 trains)
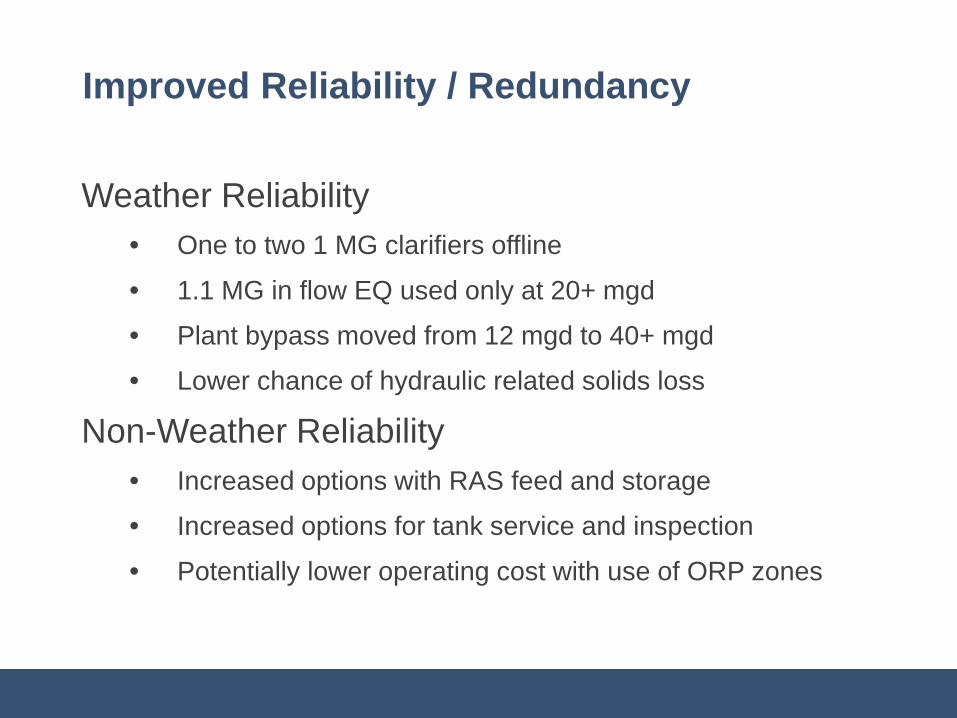
Improved Reliability / Redundancy
Weather Reliability• One to two 1 MG clarifiers offline• 1.1 MG in flow EQ used only at 20+ mgd• Plant bypass moved from 12 mgd to 40+ mgd• Lower chance of hydraulic related solids loss
Non-Weather Reliability • Increased options with RAS feed and storage• Increased options for tank service and inspection• Potentially lower operating cost with use of ORP zones
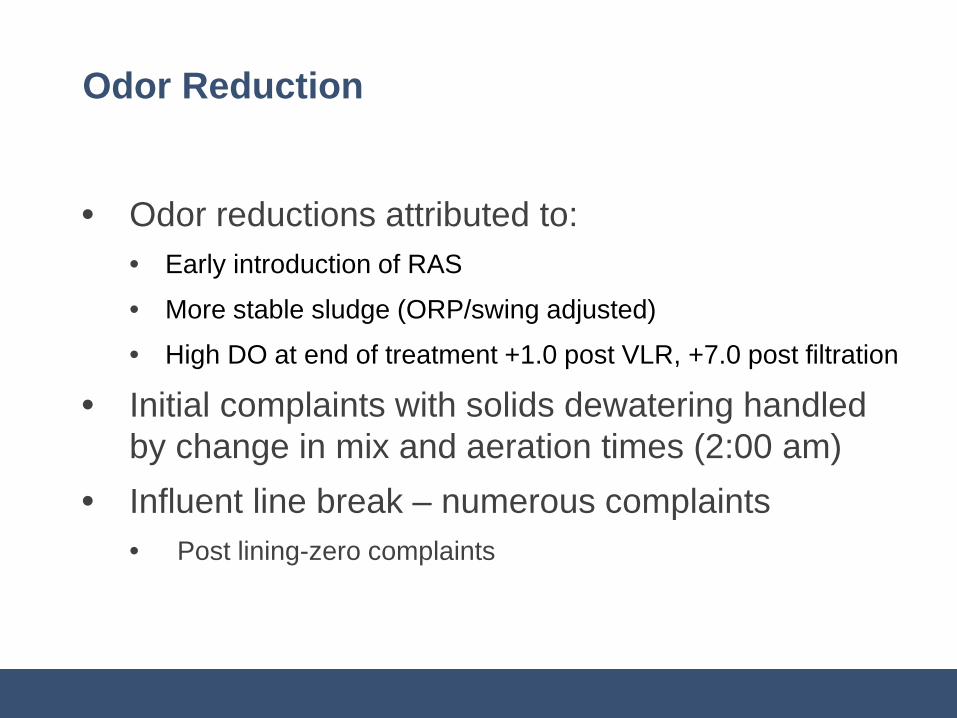
Odor Reduction
• Odor reductions attributed to:• Early introduction of RAS • More stable sludge (ORP/swing adjusted)• High DO at end of treatment +1.0 post VLR, +7.0 post filtration
• Initial complaints with solids dewatering handled by change in mix and aeration times (2:00 am)
• Influent line break – numerous complaints• Post lining-zero complaints
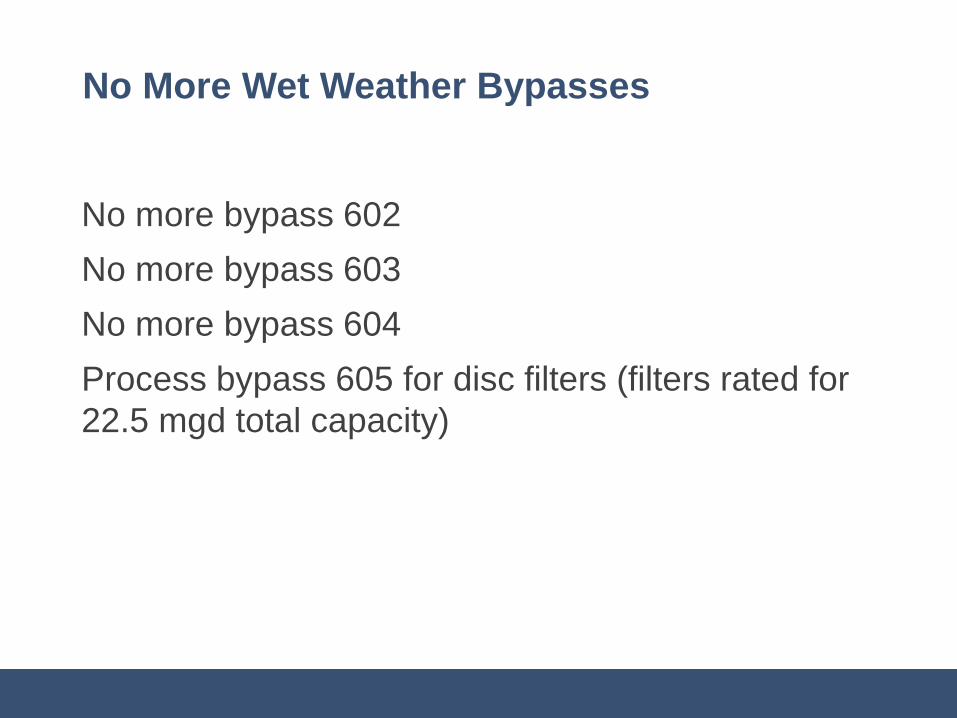
No More Wet Weather Bypasses
No more bypass 602No more bypass 603No more bypass 604Process bypass 605 for disc filters (filters rated for 22.5 mgd total capacity)
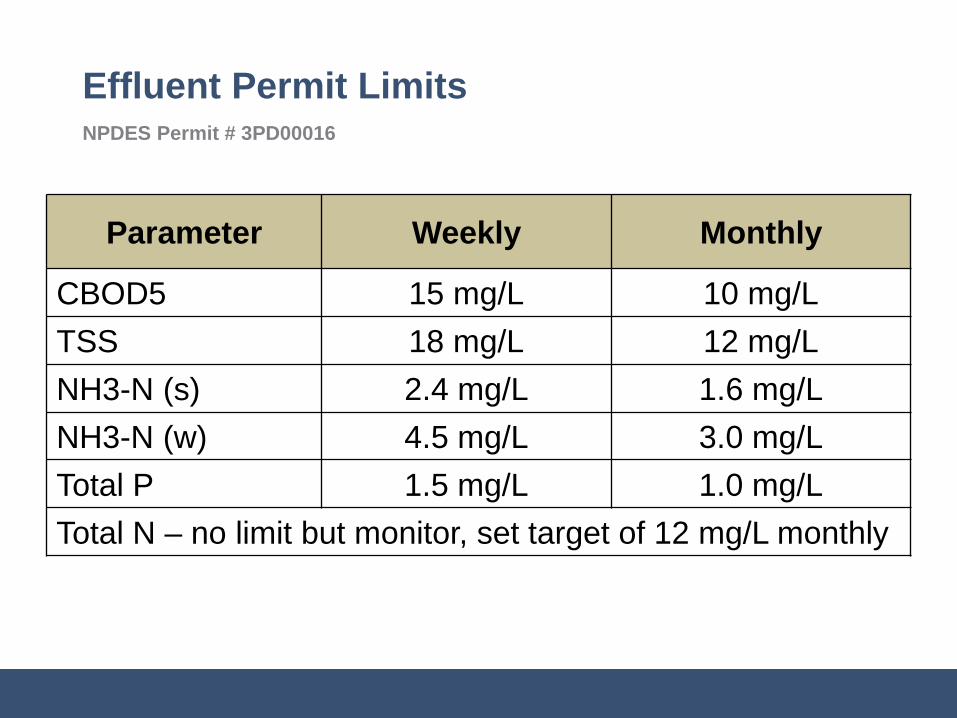
Effluent Permit LimitsNPDES Permit # 3PD00016
Parameter Weekly Monthly
CBOD5 15 mg/L 10 mg/LTSS 18 mg/L 12 mg/LNH3-N (s) 2.4 mg/L 1.6 mg/LNH3-N (w) 4.5 mg/L 3.0 mg/LTotal P 1.5 mg/L 1.0 mg/LTotal N – no limit but monitor, set target of 12 mg/L monthly
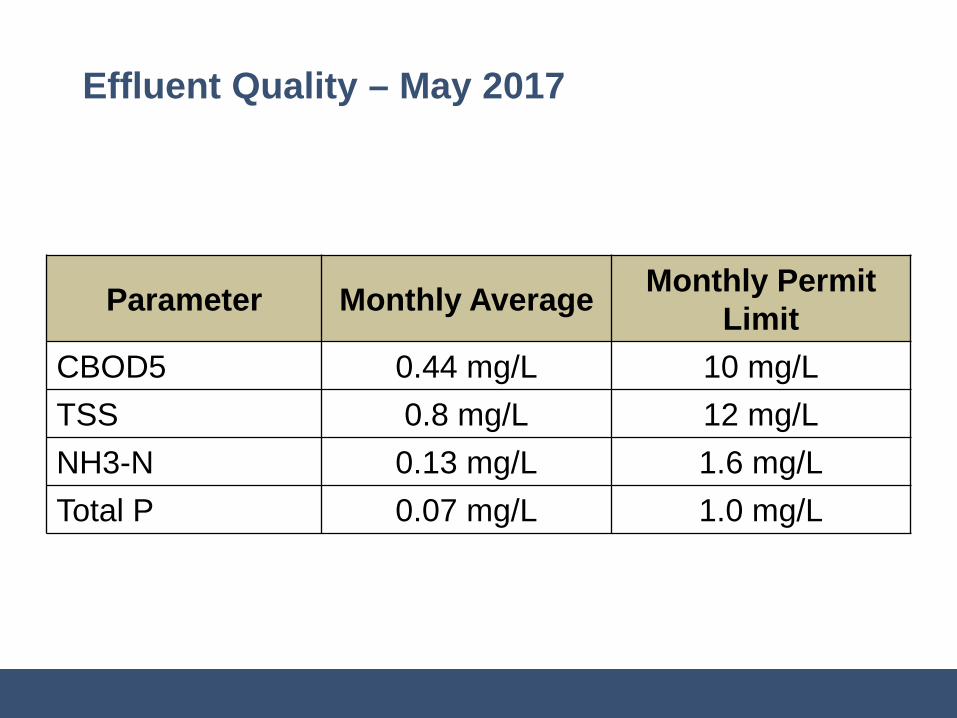
Effluent Quality – May 2017
Parameter Monthly Average Monthly Permit Limit
CBOD5 0.44 mg/L 10 mg/LTSS 0.8 mg/L 12 mg/LNH3-N 0.13 mg/L 1.6 mg/LTotal P 0.07 mg/L 1.0 mg/L
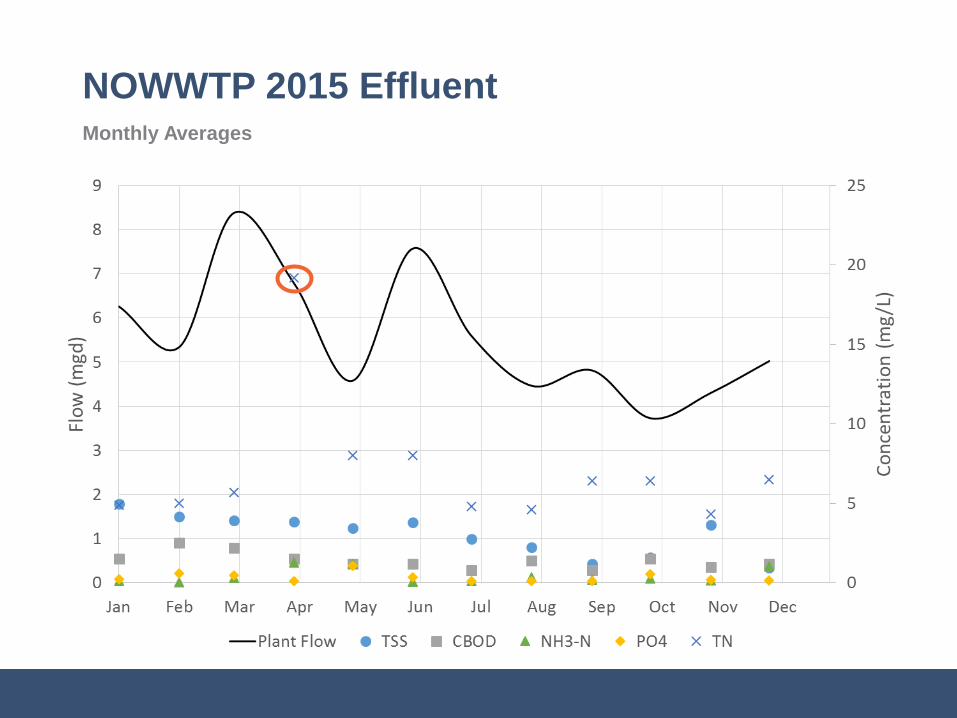
NOWWTP 2015 EffluentMonthly Averages

NOWWTP 2016 EffluentMonthly Averages