innovative short-term wind generation prediction...
TRANSCRIPT

Innovative Short-Term Wind
Generation Prediction Techniques
Michael NegnevitskyCameron Potter
School of Engineering


Presentation Overview♦ Introduction: Global Wind Power Market
♦ Wind Power in Tasmania
♦ Wind power challenges
♦ Wind Forecasting Techniques
♦ Adaptive Neuro-Fuzzy Inference System (ANFIS)
♦ Choosing Prediction Parameters
• Wind Forecasting
• Power Output Forecasting
♦ Data Generation
♦ Conclusion

Global Wind Power Market
♦ Wind power is the fastest growing electricitygeneration technology in the world.
♦ The global wind energy sector experiencedanother record year in 2005. The year saw theinstallation of 11,769 MW, which represents a43.4% increase in annual additions to theglobal market, up from 8,207 MW in theprevious year.
♦ The total value of new generating equipmentinstalled was $14 billion.

♦The total installed wind power capacity nowstands at 59,322 MW worldwide, an increaseof 25% compared to 2004.
♦The countries with the highest total installedcapacity are Germany (18,428 MW), Spain(10,027 MW), the USA (9,149 MW), India(4,430 MW) and Denmark (3,122).
Global Wind Power Market

♦ Wind power has been growing at around 30%every year since the early 90s.
Global Wind Power Market
74709659
1369218041
24340
31167
39295
47616
59322
0
10000
20000
30000
40000
50000
60000
Glo
bal I
nsta
lled
Win
d C
apac
ity [M
W]
1997 1998 1999 2000 2001 2002 2003 2004 2005

♦Europe is still leading the market with over40,500 MW of installed capacity at the endof 2005, representing 69% of the globaltotal.
Global Wind Power Market

♦However, Australia Pacific is the largestarea of growth.
Percentage Increase in Windpower Capacity
0
20
40
60
80
100
120
140
160
Africa Americas Asia AustraliaPacific
Europe
Per
cent
age
Incr
ease
in W
indp
ower
Global Wind Power Market

Wind Power in Tasmania

♦ Tasmania is one of the world’s richest regions forwind power development.
♦ Tasmania has the largest number of planned windfarm installations.
♦ Although Tasmania only has a total to a capacityof 67 MW at present, developments underway willtake the total to 143 MW and a further 674 MW ofwind farm installations are being investigated .
♦ When compared with Tasmania’s average demandof about 1200 MW, this is large.
Wind Power in Tasmania

Tasmanian Wind Power Potential
Tasmanian Wind Recordings
-43.7
-42.7
-41.7
-40.7
-39.7
143.8 144.8 145.8 146.8 147.8Longitude East
Latit
ude
Sou
th
Average less than 2 m/s
Average between 2 and 3 m/s
Average between 3 and 4 m/s
Average between 4 and 5 m/s
Average between 5 and 6 m/s
Average between 6 and 7 m/s
Average between 7 and 8 m/s
Average between 8 and 9 m/s
Average over 9 m/s

Wind power challenges
♦A varying supply of generation causesproblems with fault ride through capability,security, reliability and power quality.
♦Since wind is intermittent, power generatedfrom wind is also intermittent.
♦Large penetration windfarming is arelatively new occurrence. This poses newchallenges.

♦There is a tendency to cluster windfarms totake advantage of the best wind sites.
♦This results in heavy strain on transmissionnetworks that are not always reinforced.
♦Thus, operation near the transmission limitwill not be unusual.
Wind power challenges

Wind power challenges

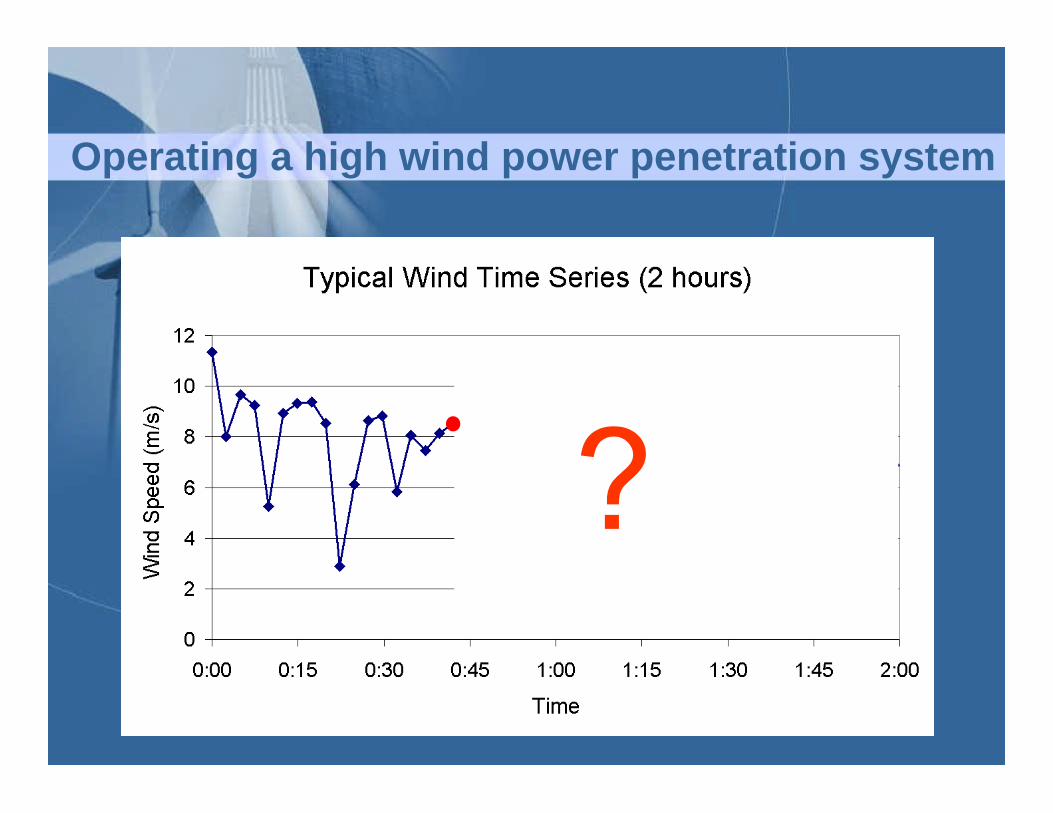
Operating a high wind power penetration system
Generally, a power system is consideredto have four time horizons• Long-term
• Medium-term
• Short-term
• Real time

♦However, wind operates differently to fossilfuel systems (and hydro for that matter).
♦The time scale definitions are too long aswind changes frequently (more on this later).
♦The load (power generation) categories arealso unusual for wind power.
Operating a high wind power penetration system

• Peak Load
• Middle Load
• Base Load
Usually system load has three sub-categories
Operating a high wind power penetration system

♦However, a base load is (by definition)constant, windpower is not.
♦Another method considers windpowergeneration as negative demand, also anunusual approach...
♦Since windfarm output cannot be increasedto cover demand, it can be thought of as abase load.
Operating a high wind power penetration system

♦Both cases are just models, but bothclearly demonstrate the need for accurateshort-term prediction.
Operating a high wind power penetration system
(a)
0
200
400
600
800
1000
1200
1400
Time [24 hour clock]
Dem
and
[MW
]
Peak LoadMiddle LoadRemaining Base Load RequiredSynthesised Windpower
(b)
0
200
400
600
800
1000
1200
1400
Time [24 hour clock]
Dem
and
[MW
]
Old Peak LoadPeak Load Minus Supplied WindpowerMiddle LoadBase Load

♦Since windpower is expensive to store, it isdifficult to schedule in the traditional sense.
♦Furthermore, using huge quantities ofspinning reserve is not efficient systemoperation.
♦Thus, wind power is best utilised byadopting dynamic operating protocols thatrequire accurate predictions, however…
Operating a high wind power penetration system
Operating a high wind power penetration system

Operating a high wind power penetration system

Contemporary Forecasting Techniques
• 2-3 minute forecasts to handle wind gusts
• 15-30 minute forecasts for dispatch
• longer forecasts for planning.
♦Efficient wind power operation needsaccurate predictions on multiple horizons:

♦Traditionally, wind forecasts were onlydeveloped for longer periods as the veryshort-term predictions were of little use.
♦The wind forecasting systems for wind weredesigned without wind farming as anobjective.
♦Numerical Weather Prediction (NWP)models are very advanced and provideexcellent results over longer periods, but notfor the shorter periods.
Contemporary Forecasting Techniques

Limitations of Numerical Weather Prediction
♦Predictions from an NWP model have fourlimiting factors:• data variability
• digital elevation model (DEM) resolution
• grid spacing
• computation time
♦Together these limit the usefulness of NWPsfor short-term wind power forecasting.

Persistence Models
♦To complement the NWPs, a system called“persistence” was used for shorter-termforecasting periods.
♦Persistence operates on the assumptionthat the wind will not change from time t to(t + 1).
( ) ( )1+== txtxx epersistenc

Statistical Methods
♦ In wind prediction, statistical methods aregenerally aimed at producing short-termpredictions.
♦They use the difference between thepredicted and actual wind speeds in theimmediate past to re-tune the modelparameters.

Neural Network Based Methods
♦The neural network based approaches uselarge time series data sets to learn therelationship between the input data andoutput wind speeds.
♦The accuracy of both statistical and neuralnetwork based methods degrade rapidlywith increasing prediction lead time.

Hybrid Systems
• Careful thought about the way thesystem will be combined is important.
• Lotfi Zadeh (the creator of fuzzy settheory) is reputed to have said abouthybrid systems...
• Attempt to combine the best aspectsof the techniques used.

However…
German police, French mechanics, Britishcuisine, Italian banking and Swiss lovewould be a bad one.”
“The perfect hybrid would have Britishpolice, German mechanics, Frenchcuisine, Swiss banking and Italian love.
Hybrid Systems

♦Fuzzy systems and neural networks arenatural complementary tools in buildingintelligent systems.
♦While neural networks are low-levelcomputational structures that perform wellwhen dealing with raw data, fuzzy logicdeals with reasoning on a higher level.
♦However, fuzzy systems lack the ability tolearn and cannot adjust themselves.
Adaptive Neuro-Fuzzy Inference System

♦The merger of a neural network with a fuzzysystem into one integrated system thereforeoffers a promising approach to building veryshort-term wind prediction models.
♦A neuro-fuzzy system is, in fact, a neuralnetwork that is functionally equivalent to afuzzy inference model. For example anAdaptive Neuro-Fuzzy Inference System(ANFIS) proposed by Roger Jang is a six-layer feed-forward neural network.
Adaptive Neuro-Fuzzy Inference System

Adaptive Neural Fuzzy Inference System
N1
∑y
N3
N2
N4
1
x2
x1
Layer 2 Layer 5Layer 3 Layer 4 Layer 6Layer 1
A1
A2
B1
B2
x1 x2
1∏
2∏
3∏
4∏
2
3
4

• The major problem facing this methodis the need for large quantities ofdata.
• It can be training-time intensive,although once trained, the operationis extremely fast.
Issues with ANFIS:
Adaptive Neuro-Fuzzy Inference System

Developing the ANFIS
♦To develop an ANFIS, certain parametersmust be chosen:• Number of training inputs
• Number of Membership Functions (MFs)
• Number of epochs (usually small)
• The training data set and the test data set
• Mathematical function for MFs

Developing the ANFIS
♦The training set must be sufficiently varied totrain the system adequately.
♦The test set must be sufficiently varied to testthe system adequately.
♦The data set must be split into two categories:• Training
• Testing

Choosing Prediction Parameters
♦When developing a prediction system forwind power purposes one of the mostimportant decisions is to choose whichparameter(s) will be forecast.
♦We should decide whether to predict
• wind speed alone; or
• wind speed and direction; or
• wind vectors.

Choosing Prediction Parameters
♦Furthermore, we might consider forecastingpower output directly rather than the windspeed and then converting it to power output.
♦Further still, we may try to predict theaggregate power output or the aggregatewind input for the entire wind farm (or maybeeven several wind farms).
Choosing the parameter to predict is nottrivial…

Wind Forecasting
♦ Predicting wind speed alone is a logical basisto start considering wind forecasting for thepurpose of wind farming. A turbine’s poweroutput is governed by wind speed according tothe following equation:
)(*)(*)(*)(21 3
wbp vACP ρ=
where Cp is performance coefficient; ? is airdry density; Ab is swept area of blade; and vw iswind speed.

♦ This means that to get most efficiency out ofthe turbine, it should be turned to face theoncoming wind.
Wind Forecasting
• It follows that we need to forecast both windspeed and direction.
• Wind vectors is a more useful approach.
• The forecasts of the wind vectors lost a littleaccuracy when compared to wind speed, butwere much more accurate than trying to forecastwind speed and direction independently.

Power Output Forecasting
♦ A turbine’s power output is governed by windspeed:
)(*)(*)(*)(21 3
wbp vACP ρ=
where Cp is performance coefficient; ? is airdry density; Ab is swept area of blade; and vw iswind speed.
But Cp is not constant and accordingly, ratingcurves are usually used.

Power output rating curve for a wind turbine
0
400
800
1200
1600
0 5 10 15 20 25
Windspeed [m/s]
Po
wer
Ou
tpu
t [k
W]

Power Output Forecasting
♦ Prediction of wind rather than power output isnot tied to a specific machine design, operationor wind farm layout:
• if the generator unit were replaced the predictionsbased upon power would be invalid.
• if the operators wanted to operate the wind farmsin unusual manners such as using wind power togenerate ancillary services, or even achievingbetter maximum power point tracking, powerforecast systems would become out-dated.

Power Output Forecasting
♦ Another problem with forecasting powerinstead of wind is that it is much more difficultto get a good data set:
• the turbine may not be facing directly into thewind,
• the blades may be tilted such that they are notcatching the full force of the wind, or
• it may simply be decommissioned formaintenance (which will produce data similar to alow wind speed period).

Aggregate Forecasting
♦ An example could be to consider trying topredict the power use from ten houses andpredicting the power use from 1000 houses.The 1000 houses will be generally easier topredict.
♦ The same concept is true for wind forecasting.
♦ Forecasting over a larger space allows someerror cancellation.

Aggregate Forecasting
♦ But you must still ensure that the databeing used to develop your system is trulyrepresentative of the system.
• Our research has indicated that the data setcan be reduced by as much as an order ofmagnitude when trying to aggregate a circuitof up to ten wind turbines.
• It is a serious problem and in a field whereenough data is difficult to obtain, any data setreduction can cause problems.

Data Generation
♦ In fact, some data sets were insufficient to beable to properly train and test a model.
♦This was overcome through developing adata generation technique that couldreproduce the correlations in a time seriesdata set.
♦When investigating data at wind sites, itbecame apparent that a large hurdle wouldbe the reliability of the data.

Data Generation
♦However, the standard method of using aprobabilistic model assumes that allvariables are very weakly correlated.
♦This is not true for wind generation. Thus, amore sophisticated approach must bedeveloped.
♦Generating data for training a system inpower engineering is not a new innovation.

Data Generation
♦ Our research has shown that difference predictionis superior to actual data set prediction.
Normalised Histograms - Tasmania, Australia East/West Wind Vector - Spring, 2004
0
0.2
0.4
0.6
0.8
1
-10 -5 0 5 10 15 20 25Wind Vector [m/s]
Nor
mal
ised
Pro
babi
lity Non-Difference Data
Differenced Data

Data Generation
♦ It was found that at the lower wind speeds,the data was less variable than at the higherwind speeds.
♦The set of histograms allowed the modelingof increasing deviation with increasing windspeeds.
♦This was also tested for wind power output(after filtering to ensure that the data wasuseful) .

Data Generation
No Change

Aggregated histograms over the entire wind farm

Conclusions
♦Different prediction parameters such as windspeed, wind direction, wind vectors, andpower output have been discussed.
♦Finally, data generation for very short-termwind prediction has been proposed.
♦Areas for applications of numerical weatherprediction models, persistence models,statistical and neural based methods, andalso an adaptive neuro-fuzzy inferencesystem have been considered.

Acknowledgments
The authors would like to acknowledge thehelp we have received during this project.
• Mico Skoklevski, Peter Clark and RogerAllen from the Generation Control team atHydro Tasmania.
• Also Kieran Jacka (also Hydro Tasmania)for his aid in the wind forecasting system.

Thursday, 22 June, 9:00 AM – 12:00 PM, Room 512b
“Very Short-Term Wind forecasting forTasmanian Power Generation”
C. Potter and M. Negnevitsky