innovativeness analysis of scholarly publications by age ... › content › pdf › 10.1007 ›...
TRANSCRIPT
Innovativeness Analysis of ScholarlyPublications by Age Prediction Using
Ordinal Regression
Pavel Savov1(B), Adam Jatowt2, and Radoslaw Nielek1
1 Polish-Japanese Academy of Information Technology,ul. Koszykowa 86, 02-008 Warszawa, Poland
{pavel.savov,nielek}@pja.edu.pl2 Kyoto University, Yoshida-honmachi, Sakyo-ku, Kyoto 606-8501, Japan
Abstract. In this paper we refine our method of measuring the inno-vativeness of scientific papers. Given a diachronic corpus of papers froma particular field of study, published over a period of a number of years,we extract latent topics and train an ordinal regression model to predictpublication years based on topic distributions. Using the prediction errorwe calculate a real-number based innovation score, which may be used tocomplement citation analysis in identifying potential breakthrough pub-lications. The innovation score we had proposed previously could not becompared for papers published in different years. The main contributionwe make in this work is adjusting the innovation score to account forthe publication year, making the scores of papers published in differentyears directly comparable. We have also improved the prediction accu-racy by replacing multiclass classification with ordinal regression andLatent Dirichlet Allocation models with Correlated Topic Models. Thisalso allows for better understanding of the evolution of research topics.We demonstrate our method on two corpora: 3,577 papers published atthe International World Wide Web Conference (WWW) between theyears 1994 and 2019, and 835 articles published in the Journal of Artifi-cial Societies and Social Simulation (JASSS) from 1998 to 2019.
Keywords: Scientometrics · Topic models · Ordinal regression
1 Introduction
Citation analysis has been the main method of measuring innovation and iden-tifying important and/or pioneering scientific papers. It is assumed that papershaving high citation counts have made a significant impact on their fields of studyand are considered innovative. This approach, however, has a number of short-comings: Works by well-known authors and/or ones published at well-establishedpublication venues tend to receive more attention and citations than others (therich-get-richer effect) [35]. According to Merton [19], who first described thisc© Springer Nature Switzerland AG 2020V. V. Krzhizhanovskaya et al. (Eds.): ICCS 2020, LNCS 12138, pp. 646–660, 2020.https://doi.org/10.1007/978-3-030-50417-5_48
Innovativeness Analysis of Scholarly Publications 647
phenomenon in 1968, publications by more eminent researchers will receive dis-proportionately more recognition than similar works by less-well known authors.This is known as the Matthew Effect, named after the biblical Gospel of Matthew.Serenko and Dumay [30] observed that old citation classics keep getting citedbecause they appear among the top results in Google Scholar, and are automati-cally assumed as credible. Some authors also assume that reviewers expect to seethose classics referenced in the submitted paper regardless of their relevance tothe work being submitted. There is also the problem of self-citations: Increasedcitation count does not reflect the work’s impact on its field of study.
We addressed these shortcomings in our previous work [27] by proposinga machine learning-based method of measuring the innovativeness of scien-tific papers. Our current method involves training a Correlated Topic Model(CTM) [3] on a diachronic corpus of papers published at conference series or indifferent journal editions over as many years as possible, training a model forpredicting publication years using topic distributions as feature vectors, and cal-culating a real number innovation score for each paper based on the predictionerror.
We consider a paper innovative if it covers topics that will be popular inthe future but have not been researched in the past. Therefore, the more recentthe publication year predicted by our model compared to the actual year ofpublication, the greater the paper’s score. We showed in [27] that our innovationscores are positively correlated with citation counts, but there are also highlyscored papers having few citations. These papers may be worth looking into aspotential “hidden gems” – covering topics researched in the future but relativelyunnoticed. Interestingly, we have not found any highly cited papers with lowinnovation scores.
2 Related Work
The development of research areas and the evolution of topics in academic con-ferences and journals over time have been investigated by numerous researchers.For example, Meyer et al. [20] study the Journal of Artificial Societies and SocialSimulation (JASSS) by means of citation and co-citation analysis. They identifythe most influential works and authors and show the multidisciplinary natureof the field. Saft and Nissen [25] also analyze JASSS, but they use a text min-ing approach linking documents into thematic clusters in a manner inspired byco-citation analysis. Wallace et al. [34] study trends in the ACM Conference onComputer Supported Cooperative Work (CSCW). They took over 1,200 paperspublished between the years 1990 and 2015, and they analyzed data such aspublication year, type of empirical research, type of empirical evaluations used,and the systems/technologies involved. [21] analyze trends in the writing stylein papers from the ACM SIGCHI Conference on Human Factors in ComputingSystems (CHI) published over a 36-year period.
Recent research on identifying potential breakthrough publications includesworks such as Schneider and Costas [28,29]. Their approach is based on analyzing

648 P. Savov et al.
citation networks, focusing on highly-cited papers. Ponomarev et al. [22] predictcitation count based on citation velocity, whereas Wolcott et al. [36] use randomforest models on a number of features, e.g. author count, reference count, H-index etc. as well as citation velocity. These approaches, in contrast to ours, takeinto account non-textual features. They also define breakthrough publications aseither highly-cited influential papers resulting in a change in research direction,or “articles that result from transformative research” [36].
A different approach to identifying novelty was proposed by Chan et al. [5].They developed a system for finding analogies between research papers, basedon the premise that “scientific discoveries are often driven by finding analogies indistant domains”. One of the examples given is the simulated annealing optimiza-tion algorithm inspired by the annealing process commonly used in metallurgy.Identifying interdisciplinary ideas as a driver for innovation was also studiedby Thorleuchter and Van den Poel [33]. Several works have employed machinelearning-based approaches to predict citation counts and the long-term scientificimpact (LTSI) of research papers, e.g., [37] or [31].
Examples of topic-based approaches include Hall et al. [11]. They trainedan LDA model on the ACL Anthology, and showed trends over time like topicsincreasing and declining in popularity. Unlike our approach, they hand-pickedtopics from the generated model and manually seeded 10 more topics to improvefield coverage. More recently Chen et al. [7] studied the evolution of topics inthe field of information retrieval (IR). They trained a 5-topic LDA model on acorpus of around 20,000 papers from Web of Science. Sun and Yin [32] used a 50-topic LDA model trained on a corpus of over 17,000 abstracts of research paperson transportation published over a 25-year period to identify research trendsby studying the variation of topic distributions over time. Another interestingexample is the paper by Hu et al. [12] where Google’s Word2Vec model is usedto enhance topic keywords with more complete semantic information, and topicevolution is analyzed using spatial correlation measures in a semantic spacemodeled as an urban geographic space.
Research on document dating (timestamping) is related to our work, too.Typical approaches to document dating are based on changes in word usage andon language change over time, and they use features derived from temporal lan-guage models [9,14], diachronic word frequencies [8,26], or occurrences of namedentities. Examples of research articles based on heuristic methods include: [10],[15] or [16]. Jatowt and Campos [13] have implemented the visual, interactivesystem based on n-gram frequency analysis. In our work we rely on predictingpublication dates to determine paper innovativeness. Ordinal regression modelstrained on topic vectors could be regarded as a variation of temporal languagemodels and reflect vocabulary change over time. Aside from providing means fortimestamping, they also allow for studying how new ideas emerge, gain and losepopularity.
Innovativeness Analysis of Scholarly Publications 649
3 Datasets
The corpora we study in this paper contain 3,577 papers published at the Inter-national World Wide Web Conference (WWW) between the years 1994 and 2019,and 835 articles published in the Journal of Artificial Societies and Social Sim-ulation (JASSS)1 from 1998 to 2019. We have studied papers from the WWWConference before [27], which is the reason why we decided to use this corpusagain, after updating it with papers published after our first analysis, i.e. ones inthe years 2018 and 2019. We chose JASSS as the other corpus to analyze in orderto demonstrate our method on another major publication venue in a related butseparate field, published over a period of several years. It is publicly available inHTML, which makes it straightforward to extract text from the documents.
In an effort to extract only relevant content, we performed the followingpreprocessing steps on all texts before converting them to Bag-of-Words vectors:
1. Discarding page headers and footers, References, Bibliography and Acknowl-edgments sections as “noise” irrelevant to the main paper topic(s)
2. Conversion to lower case3. Removal of stopwords and punctuation as well as numbers, including ones
spelled out, e.g. “one”, “two”, “first” etc.4. Part-of-Speech tagging using the Penn Treebank POS tagger (NLTK) [2] –
This step is a prerequisite for the WordNet Lemmatizer, we do not use thePOS tags in further processing
5. Lemmatization using the WordNet Lemmatizer in NLTK.
4 Method
4.1 Topic Model
In our previous work [27] we trained Latent Dirichlet Allocation (LDA) [4] topicmodels. In this paper, however, we have decided to move towards CorrelatedTopic Models (CTM) [3] and only built LDA models as a baseline. Unlike LDA,which assumes topic independence, CTM allows for correlation between topics.We have found this to be better suited for modeling topics evolving over time,including splitting or branching. We used the reference C implementation foundat http://www.cs.columbia.edu/∼blei/ctm-c/.
In order to choose the number of topics k, we have built a k-topic modelfor each k in a range we consider broad enough to include the optimum num-ber of topics. In the case of LDA this range was 〈10, 60〉. We then chose themodels with the highest CV topic coherence. As shown by Roder et al. [24],this measure approximates human topic interpretability the best. Furthermore,according to Chang et al. [6], topic model selection based on traditional likeli-hood or perplexity-based approaches results in models that are worse in terms ofhuman understandability. The numbers of topics we chose for our LDA models
1 http://jasss.soc.surrey.ac.uk/.
650 P. Savov et al.
were 44 for the WWW corpus and 50 for JASSS. Because CTM supports moretopics for a given corpus [3] and allows for a more granular topic model, weexplored different ranges of k than in the case of LDA: 〈30, 100〉 for WWW and〈40, 120〉 for JASSS. As before, we chose the models with the highest CV .
4.2 Publication Year Prediction
Because publication years are ordinal values rather than categorical ones, insteadof One-vs-One or One-vs-Rest multiclass classifiers, which we had used previ-ously, we have implemented ordinal regression (a.k.a. ordinal classification) basedon the framework proposed by Li and Lin [17], as used by Martin et al. [18] forphotograph dating. An N -class ordinal classifier consists of N − 1 before-afterbinary classifiers, i.e. for each pair of consecutive years a classifier is trained,which assigns documents to one of two classes: “year y or before” and “yeary + 1 or after”. Given the class membership probabilities predicted by theseclassifiers, the overall classifier confidence that paper p was published in theyear Y is then determined, as in [18], by Eq. 1:
conf(p, Y ) =Y∏
y=Ymin
P (Yp ≤ y) ·Ymax∏
y=Y+1
(1 − P (Yp ≤ y)) (1)
where Ymin and Ymax are the first and last year in the corpus, and Yp is thepublication year of the paper p.
We used topic probability distributions as k-dimensional feature vectors,where k is the number of topics. Due to the small size of the JASSS corpus,we trained a separate model to evaluate each document (Leave-one-out cross-validation), whereas in the case of the WWW corpus we have settled for 10-foldcross-validation. We have implemented ordinal regression using linear SupportVector Machine (SVM) classifiers.
4.3 Paper Innovation Score
Following [27], we define our innovation score based on the results from theprevious step - classifier confidence - as the weighted mean publication yearprediction error with classifier confidence scores as weights:
SP (p) =
∑y conf(p, y) · (y − Yp)∑
y conf(p, y)(2)
where Yp is the year paper p was published in and conf(p, y) is the classifierconfidence for paper p and year y. Unlike the score defined in [27], the denomi-nator in Eq. 2 does not equal 1, since the scores conf(p, y) defined in Eq. 1 arenot class membership probabilities.
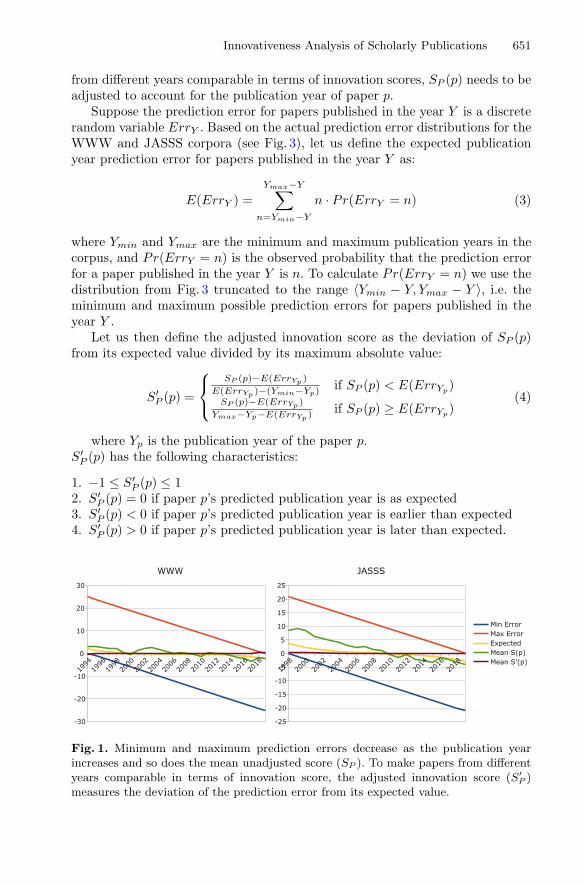
As illustrated in Fig. 1, the higher the publication year of paper p, the lowerthe minimum and maximum possible values of SP (p). In order to make papers
Innovativeness Analysis of Scholarly Publications 651
from different years comparable in terms of innovation scores, SP (p) needs to beadjusted to account for the publication year of paper p.
Suppose the prediction error for papers published in the year Y is a discreterandom variable ErrY . Based on the actual prediction error distributions for theWWW and JASSS corpora (see Fig. 3), let us define the expected publicationyear prediction error for papers published in the year Y as:
E(ErrY ) =Ymax−Y∑
n=Ymin−Y
n · Pr(ErrY = n) (3)
where Ymin and Ymax are the minimum and maximum publication years in thecorpus, and Pr(ErrY = n) is the observed probability that the prediction errorfor a paper published in the year Y is n. To calculate Pr(ErrY = n) we use thedistribution from Fig. 3 truncated to the range 〈Ymin − Y, Ymax − Y 〉, i.e. theminimum and maximum possible prediction errors for papers published in theyear Y .
Let us then define the adjusted innovation score as the deviation of SP (p)from its expected value divided by its maximum absolute value:
S′P (p) =
⎧⎨
⎩
SP (p)−E(ErrYp )
E(ErrYp )−(Ymin−Yp)if SP (p) < E(ErrYp
)SP (p)−E(ErrYp )
Ymax−Yp−E(ErrYp )if SP (p) ≥ E(ErrYp
)(4)
where Yp is the publication year of the paper p.S′P (p) has the following characteristics:
1. −1 ≤ S′P (p) ≤ 1
2. S′P (p) = 0 if paper p’s predicted publication year is as expected
3. S′P (p) < 0 if paper p’s predicted publication year is earlier than expected
4. S′P (p) > 0 if paper p’s predicted publication year is later than expected.
Fig. 1. Minimum and maximum prediction errors decrease as the publication yearincreases and so does the mean unadjusted score (SP ). To make papers from differentyears comparable in terms of innovation score, the adjusted innovation score (S′
P )measures the deviation of the prediction error from its expected value.
652 P. Savov et al.
5 Results
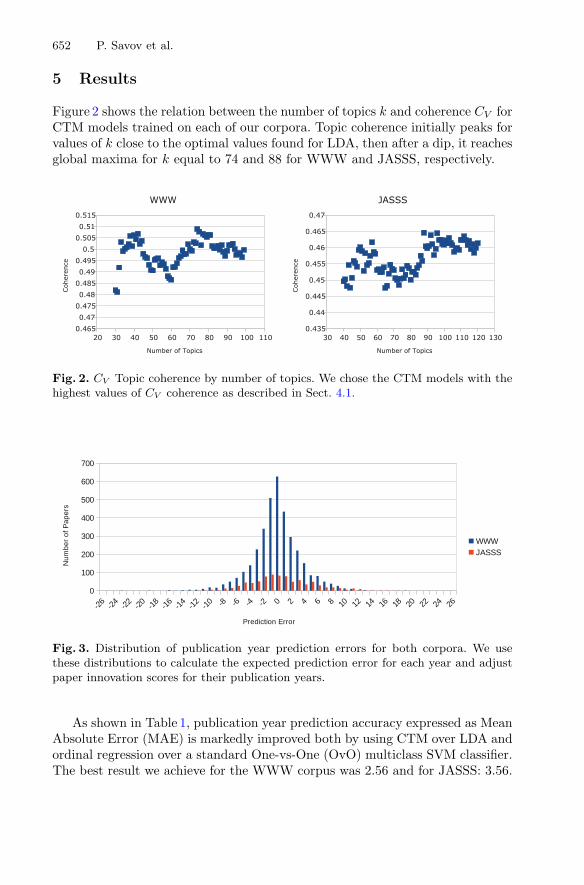
Figure 2 shows the relation between the number of topics k and coherence CV forCTM models trained on each of our corpora. Topic coherence initially peaks forvalues of k close to the optimal values found for LDA, then after a dip, it reachesglobal maxima for k equal to 74 and 88 for WWW and JASSS, respectively.
Fig. 2. CV Topic coherence by number of topics. We chose the CTM models with thehighest values of CV coherence as described in Sect. 4.1.
Fig. 3. Distribution of publication year prediction errors for both corpora. We usethese distributions to calculate the expected prediction error for each year and adjustpaper innovation scores for their publication years.
As shown in Table 1, publication year prediction accuracy expressed as MeanAbsolute Error (MAE) is markedly improved both by using CTM over LDA andordinal regression over a standard One-vs-One (OvO) multiclass SVM classifier.The best result we achieve for the WWW corpus was 2.56 and for JASSS: 3.56.
Innovativeness Analysis of Scholarly Publications 653
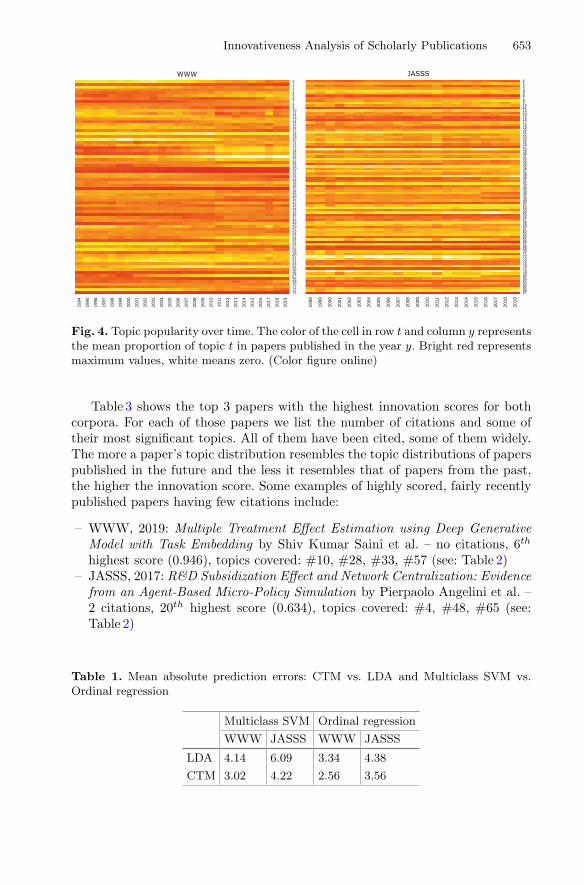
Fig. 4. Topic popularity over time. The color of the cell in row t and column y representsthe mean proportion of topic t in papers published in the year y. Bright red representsmaximum values, white means zero. (Color figure online)
Table 3 shows the top 3 papers with the highest innovation scores for bothcorpora. For each of those papers we list the number of citations and some oftheir most significant topics. All of them have been cited, some of them widely.The more a paper’s topic distribution resembles the topic distributions of paperspublished in the future and the less it resembles that of papers from the past,the higher the innovation score. Some examples of highly scored, fairly recentlypublished papers having few citations include:
– WWW, 2019: Multiple Treatment Effect Estimation using Deep GenerativeModel with Task Embedding by Shiv Kumar Saini et al. – no citations, 6th
highest score (0.946), topics covered: #10, #28, #33, #57 (see: Table 2)– JASSS, 2017: R&D Subsidization Effect and Network Centralization: Evidence
from an Agent-Based Micro-Policy Simulation by Pierpaolo Angelini et al. –2 citations, 20th highest score (0.634), topics covered: #4, #48, #65 (see:Table 2)
Table 1. Mean absolute prediction errors: CTM vs. LDA and Multiclass SVM vs.Ordinal regression
Multiclass SVM Ordinal regression
WWW JASSS WWW JASSS
LDA 4.14 6.09 3.34 4.38
CTM 3.02 4.22 2.56 3.56
654 P. Savov et al.
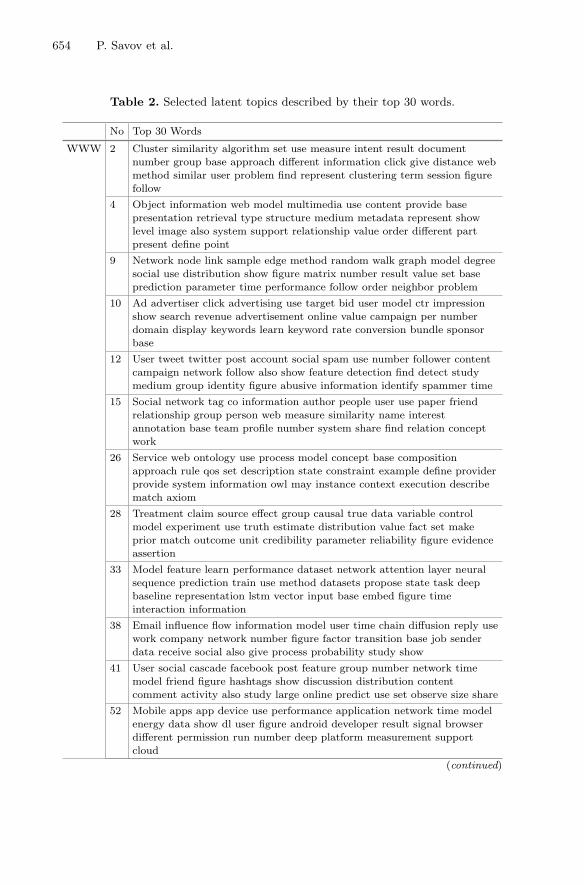
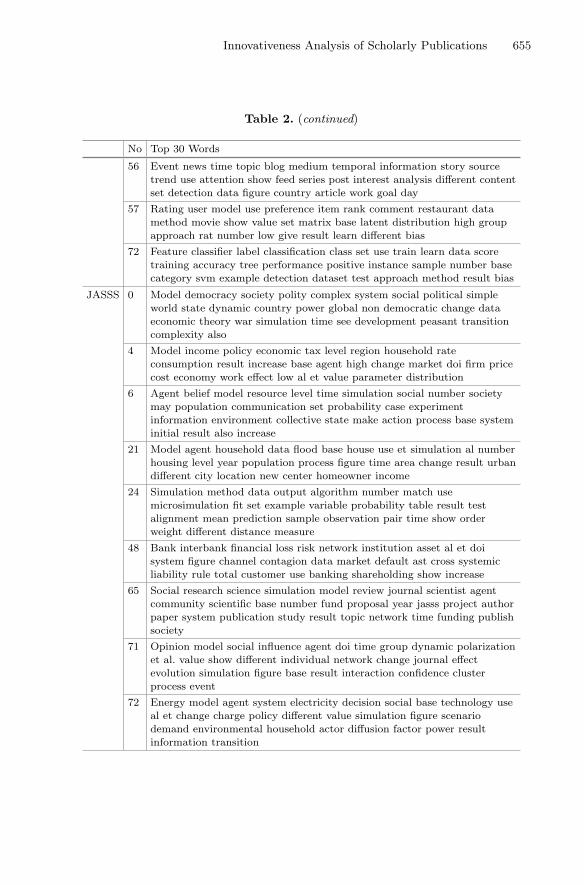
Table 2. Selected latent topics described by their top 30 words.
No Top 30 Words
WWW 2 Cluster similarity algorithm set use measure intent result documentnumber group base approach different information click give distance webmethod similar user problem find represent clustering term session figurefollow
4 Object information web model multimedia use content provide basepresentation retrieval type structure medium metadata represent showlevel image also system support relationship value order different partpresent define point
9 Network node link sample edge method random walk graph model degreesocial use distribution show figure matrix number result value set baseprediction parameter time performance follow order neighbor problem
10 Ad advertiser click advertising use target bid user model ctr impressionshow search revenue advertisement online value campaign per numberdomain display keywords learn keyword rate conversion bundle sponsorbase
12 User tweet twitter post account social spam use number follower contentcampaign network follow also show feature detection find detect studymedium group identity figure abusive information identify spammer time
15 Social network tag co information author people user use paper friendrelationship group person web measure similarity name interestannotation base team profile number system share find relation conceptwork
26 Service web ontology use process model concept base compositionapproach rule qos set description state constraint example define providerprovide system information owl may instance context execution describematch axiom
28 Treatment claim source effect group causal true data variable controlmodel experiment use truth estimate distribution value fact set makeprior match outcome unit credibility parameter reliability figure evidenceassertion
33 Model feature learn performance dataset network attention layer neuralsequence prediction train use method datasets propose state task deepbaseline representation lstm vector input base embed figure timeinteraction information
38 Email influence flow information model user time chain diffusion reply usework company network number figure factor transition base job senderdata receive social also give process probability study show
41 User social cascade facebook post feature group number network timemodel friend figure hashtags show discussion distribution contentcomment activity also study large online predict use set observe size share
52 Mobile apps app device use performance application network time modelenergy data show dl user figure android developer result signal browserdifferent permission run number deep platform measurement supportcloud
(continued)
Innovativeness Analysis of Scholarly Publications 655
Table 2. (continued)
No Top 30 Words
56 Event news time topic blog medium temporal information story source
trend use attention show feed series post interest analysis different content
set detection data figure country article work goal day
57 Rating user model use preference item rank comment restaurant data
method movie show value set matrix base latent distribution high group
approach rat number low give result learn different bias
72 Feature classifier label classification class set use train learn data score
training accuracy tree performance positive instance sample number base
category svm example detection dataset test approach method result bias
JASSS 0 Model democracy society polity complex system social political simple
world state dynamic country power global non democratic change data
economic theory war simulation time see development peasant transition
complexity also
4 Model income policy economic tax level region household rate
consumption result increase base agent high change market doi firm price
cost economy work effect low al et value parameter distribution
6 Agent belief model resource level time simulation social number societymay population communication set probability case experimentinformation environment collective state make action process base systeminitial result also increase
21 Model agent household data flood base house use et simulation al numberhousing level year population process figure time area change result urbandifferent city location new center homeowner income
24 Simulation method data output algorithm number match usemicrosimulation fit set example variable probability table result testalignment mean prediction sample observation pair time show orderweight different distance measure
48 Bank interbank financial loss risk network institution asset al et doisystem figure channel contagion data market default ast cross systemicliability rule total customer use banking shareholding show increase
65 Social research science simulation model review journal scientist agentcommunity scientific base number fund proposal year jasss project authorpaper system publication study result topic network time funding publishsociety
71 Opinion model social influence agent doi time group dynamic polarizationet al. value show different individual network change journal effectevolution simulation figure base result interaction confidence clusterprocess event
72 Energy model agent system electricity decision social base technology useal et change charge policy different value simulation figure scenariodemand environmental household actor diffusion factor power resultinformation transition
656 P. Savov et al.
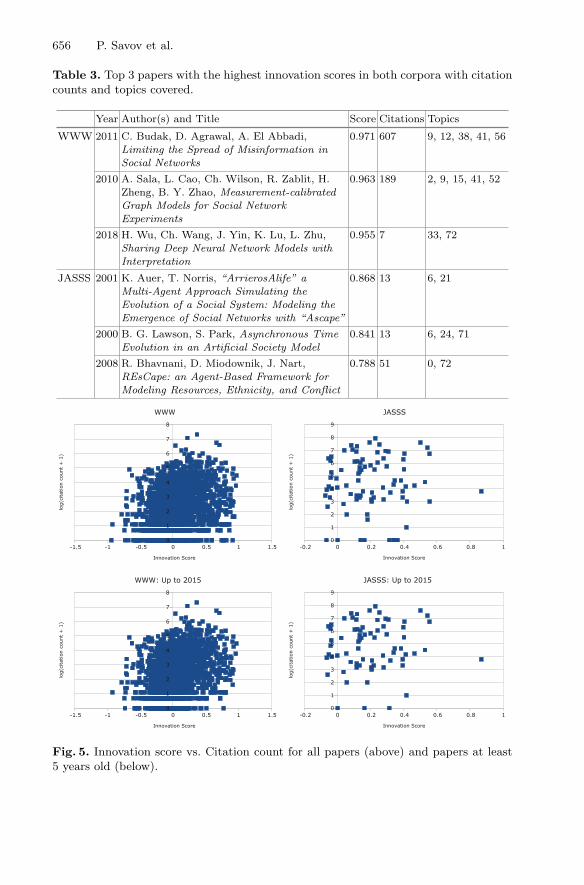
Table 3. Top 3 papers with the highest innovation scores in both corpora with citationcounts and topics covered.
Year Author(s) and Title Score Citations Topics
WWW 2011 C. Budak, D. Agrawal, A. El Abbadi,Limiting the Spread of Misinformation inSocial Networks
0.971 607 9, 12, 38, 41, 56
2010 A. Sala, L. Cao, Ch. Wilson, R. Zablit, H.Zheng, B. Y. Zhao, Measurement-calibratedGraph Models for Social NetworkExperiments
0.963 189 2, 9, 15, 41, 52
2018 H. Wu, Ch. Wang, J. Yin, K. Lu, L. Zhu,Sharing Deep Neural Network Models withInterpretation
0.955 7 33, 72
JASSS 2001 K. Auer, T. Norris, “ArrierosAlife” aMulti-Agent Approach Simulating theEvolution of a Social System: Modeling theEmergence of Social Networks with “Ascape”
0.868 13 6, 21
2000 B. G. Lawson, S. Park, Asynchronous TimeEvolution in an Artificial Society Model
0.841 13 6, 24, 71
2008 R. Bhavnani, D. Miodownik, J. Nart,REsCape: an Agent-Based Framework forModeling Resources, Ethnicity, and Conflict
0.788 51 0, 72
Fig. 5. Innovation score vs. Citation count for all papers (above) and papers at least5 years old (below).

Innovativeness Analysis of Scholarly Publications 657
Figure 5 illustrates the correlation between Innovation Scores and citationcounts. Because the number of citations is expected to grow exponentially [23],we have used log2(citation count+1) instead of raw citation counts. The value ofthis expression is zero if the number of citations is zero and grows monotonicallyas the number of citations increases. The citation data for the WWW corpuscome from ACM’s Digital Library2, however publications from the JASSS jour-nal are not available in the ACM DL. We were also unable to scrape completecitation data from Google Scholar. We have therefore manually collected cita-tion counts for 5 randomly selected papers from each year. We have calculatedSpearman’s ρ correlation coefficients between the innovation scores and citationcounts. The results are: 0.28 with a p-value of 1.21 · 10−41 for the WWW cor-pus and 0.32 with a p-value of 1.91 · 10−6 for JASSS. The innovation scoresare, therefore, weakly correlated to the citation counts. The correlation coeffi-cients are slightly higher for papers at least 5 years old: 0.3 for WWW and 0.37for JASSS. This may be explained by the fact that newer papers have not yetaccumulated many citations regardless of their innovativeness.
6 Conclusion and Future Work
We have shown a simple yet significant improvement to our novel method ofmeasuring the innovativeness of scientific papers in bodies of research spanningmultiple years. Scaling the innovation score proposed in our previous researchhas enabled us to directly compare the scores of papers published at differentyears. We have also improved the prediction accuracy by employing ordinalregression models instead of regular multiclass classifiers and Correlated TopicModels instead of LDA. It may be argued that this makes our method morereliable, as deviations of the predicted publication year from the actual one aremore likely to be caused by the paper actually covering topics popular in thefuture rather than just being usual prediction error. Moreover, CTM allowed tobetter model and understand the evolution of research topics over time.
In the future we plan to explore non-linear ways to scale the innovationscores, taking into account the observed error distribution (Fig. 3) to give moreweight to larger deviations from the expected value. We also plan to use wordembeddings or extracted scientific claims [1] as well as other means of effectivelyrepresenting paper contents and conveyed ideas besides topic models as featuresto our methods.
References
1. Achakulvisut, T., Bhagavatula, C., Acuna, D., Kording, K.: Claim extraction inbiomedical publications using deep discourse model and transfer learning. arXivpreprint arXiv:1907.00962 (2019)
2. Bird, S., Klein, E., Loper, E.: Natural Language Processing with Python: AnalyzingText with the Natural Language Toolkit. O’Reilly Media, Inc. (2009)
2 http://dl.acm.org/.
658 P. Savov et al.
3. Blei, D., Lafferty, J.: Correlated topic models. In: Advances in Neural InformationProcessing Systems, vol. 18, p. 147 (2006)
4. Blei, D.M., Ng, A.Y., Jordan, M.I.: Latent dirichlet allocation. J. Mach. Learn.Res. 3(4–5), 993–1022 (2003)
5. Chan, J., Chang, J.C., Hope, T., Shahaf, D., Kittur, A.: Solvent: a mixed initiativesystem for finding analogies between research papers. Proc. ACM Hum.-Comput.Interact. 2(CSCW), 31:1–31:21 (2018). https://doi.org/10.1145/3274300
6. Chang, J., Gerrish, S., Wang, C., Boyd-graber, J.L., Blei, D.M.: Reading tea leaves:how humans interpret topic models. In: Bengio, Y., Schuurmans, D., Lafferty, J.D.,Williams, C.K.I., Culotta, A. (eds.) Advances in Neural Information ProcessingSystems, vol. 22, pp. 288–296. Curran Associates, Inc. (2009). http://papers.nips.cc/paper/3700-reading-tea-leaves-how-humans-interpret-topic-models.pdf
7. Chen, B., Tsutsui, S., Ding, Y., Ma, F.: Understanding the topic evolution in ascientific domain: an exploratory study for the field of information retrieval. J. Inf.11(4), 1175–1189 (2017)
8. Ciobanu, A.M., Dinu, A., Dinu, L., Niculae, V., Sulea, O.M.: Temporal classi-fication for historical romanian texts. In: Proceedings of the 7th Workshop onLanguage Technology for Cultural Heritage, Social Sciences, and Humanities, pp.102–106. Association for Computational Linguistics, Sofia (2013)
9. De Jong, F., Rode, H., Hiemstra, D.: Temporal language models for the disclosureof historical text. In: Humanities. Computers and Cultural Heritage: Proceedings ofthe XVIth International Conference of the Association for History and Computing(AHC 2005), pp. 161–168. Koninklijke Nederlandse Academie van Wetenschappen,Amsterdam (2005)
10. Garcia-Fernandez, A., Ligozat, A.-L., Dinarelli, M., Bernhard, D.: When wasit written? Automatically determining publication dates. In: Grossi, R., Sebas-tiani, F., Silvestri, F. (eds.) SPIRE 2011. LNCS, vol. 7024, pp. 221–236. Springer,Heidelberg (2011). https://doi.org/10.1007/978-3-642-24583-1 22
11. Hall, D., Jurafsky, D., Manning, C.D.: Studying the history of ideas using topicmodels. In: Proceedings of the Conference on Empirical Methods in Natural Lan-guage Processing, EMNLP 2008, pp. 363–371. Association for Computational Lin-guistics, Stroudsburg (2008). http://dl.acm.org/citation.cfm?id=1613715.1613763
12. Hu, K., et al.: Understanding the topic evolution of scientific literatures like anevolving city: using google word2vec model and spatial autocorrelation analysis.Inf. Proces. Manag. 56(4), 1185–1203 (2019)
13. Jatowt, A., Campos, R.: Interactive system for reasoning about document age.In: Proceedings of the 2017 ACM on Conference on Information and KnowledgeManagement, CIKM 2017, pp. 2471–2474. ACM, New York (2017). https://doi.org/10.1145/3132847.3133166
14. Kanhabua, N., Nørvag, K.: Using temporal language models for document dat-ing. In: Buntine, W., Grobelnik, M., Mladenic, D., Shawe-Taylor, J. (eds.) ECMLPKDD 2009. LNCS (LNAI), vol. 5782, pp. 738–741. Springer, Heidelberg (2009).https://doi.org/10.1007/978-3-642-04174-7 53
15. Kotsakos, D., Lappas, T., Kotzias, D., Gunopulos, D., Kanhabua, N., Nørvag, K.:A burstiness-aware approach for document dating. In: Proceedings of the 37thInternational ACM SIGIR Conference on Research & Development in InformationRetrieval, SIGIR 20114, pp. 1003–1006. ACM, New York (2014). https://doi.org/10.1145/2600428.2609495
Innovativeness Analysis of Scholarly Publications 659
16. Kumar, A., Lease, M., Baldridge, J.: Supervised language modeling for temporalresolution of texts. In: Proceedings of the 20th ACM International Conference onInformation and Knowledge Management, CIKM 2011, pp. 2069–2072. ACM, NewYork (2011). https://doi.org/10.1145/2063576.2063892
17. Li, L., Lin, H.T.: Ordinal regression by extended binary classification. In: Advancesin Neural Information Processing Systems, pp. 865–872 (2007)
18. Martin, P., Doucet, A., Jurie, F.: Dating color images with ordinal classification.In: Proceedings of International Conference on Multimedia Retrieval, pp. 447–450(2014)
19. Merton, R.K.: The matthew effect in science: the reward and communication sys-tems of science are considered. Science 159(3810), 56–63 (1968)
20. Meyer, M., Lorscheid, I., Troitzsch, K.G.: The development of social simulation asreflected in the first ten years of JASSS: a citation and co-citation analysis. J. Artif.Soc. Soc. Simul. 12(4), 12 (2009). http://jasss.soc.surrey.ac.uk/12/4/12.html
21. Pohl, H., Mottelson, A.: How we guide, write, and cite at CHI (2019)22. Ponomarev, I.V., Williams, D.E., Hackett, C.J., Schnell, J.D., Haak, L.L.: Predict-
ing highly cited papers: a method for early detection of candidate breakthroughs.Technol. Forecast. Soc. Chang. 81, 49–55 (2014)
23. Price, D.D.S.: A general theory of bibliometric and other cumulative advantageprocesses. J. Am. Soc. Inf. Sci. 27(5), 292–306 (1976)
24. Roder, M., Both, A., Hinneburg, A.: Exploring the space of topic coherence mea-sures. In: Proceedings of the Eighth ACM International Conference on Web Searchand Data Mining, WSDM 2015, pp. 399–408. ACM, New York (2015). https://doi.org/10.1145/2684822.2685324
25. Saft, D., Nissen, V.: Analysing full text content by means of a flexible co-citationanalysis inspired text mining method - exploring 15 years of JASSS articles. Int.J. Bus. Intell. Data Min. 9(1), 52–73 (2014)
26. Salaberri, H., Salaberri, I., Arregi, O., Zapirain, B.: IXAGroupEHUDiac: a multipleapproach system towards the diachronic evaluation of texts. In: Proceedings of the9th International Workshop on Semantic Evaluation (SemEval 2015), pp. 840–845.Association for Computational Linguistics, Denver (2015)
27. Savov, P., Jatowt, A., Nielek, R.: Identifying breakthrough scientific papers. Inf.Proces. Manag. 57(2), 102168 (2020)
28. Schneider, J.W., Costas, R.: Identifying potential ‘breakthrough’ research articlesusing refined citation analyses: three explorative approaches. STI 2014, Leiden,p. 551 (2014)
29. Schneider, J.W., Costas, R.: Identifying potential “breakthrough” publicationsusing refined citation analyses: three related explorative approaches. J. Assoc. Inf.Sci. Technol. 68(3), 709–723 (2017)
30. Serenko, A., Dumay, J.: Citation classics published in knowledge management jour-nals. Part ii: studying research trends and discovering the google scholar effect. J.Knowl. Manag. 19(6), 1335–1355 (2015)
31. Singh, M., Jaiswal, A., Shree, P., Pal, A., Mukherjee, A., Goyal, P.: Understandingthe impact of early citers on long-term scientific impact. In: 2017 ACM/IEEE JointConference on Digital Libraries (JCDL), pp. 1–10. IEEE (2017)
32. Sun, L., Yin, Y.: Discovering themes and trends in transportation research usingtopic modeling. Transp. Res. Part C Emerg. Technol. 77, 49–66 (2017)
33. Thorleuchter, D., Van den Poel, D.: Identification of interdisciplinary ideas. Inf.Proces. Manag. 52(6), 1074–1085 (2016). https://doi.org/10.1016/j.ipm.2016.04.010

660 P. Savov et al.
34. Wallace, J.R., Oji, S., Anslow, C.: Technologies, methods, and values: changesin empirical research at CSCW 1990–2015. Proc. ACM Hum. Comput. Interact.1(CSCW), 106:1–106:18 (2017). https://doi.org/10.1145/3134741
35. White, H.D.: Citation analysis and discourse analysis revisited. Appl. Linguist.25(1), 89–116 (2004)
36. Wolcott, H.N., et al.: Modeling time-dependent and-independent indicators to facil-itate identification of breakthrough research papers. Scientometrics 107(2), 807–817 (2016)
37. Yan, R., Huang, C., Tang, J., Zhang, Y., Li, X.: To better stand on the shoulderof giants. In: Proceedings of the 12th ACM/IEEE-CS Joint Conference on DigitalLibraries, JCDL 2012, pp. 51–60. ACM, New York (2012). https://doi.org/10.1145/2232817.2232831