inpatient hospitalizations and average length of stay ... · inpatient hospitalizations and average...
TRANSCRIPT
November 30, 2005
Inpatient Hospitalizations and Average Length of Stay Trends in Canada, 2003–2004 and 2004–2005
Taking a snapshot of the mix of patients being hospitalized in Canada
Introduction This Analysis in Brief presents inpatient hospitalization statistics from acute care facilities in Canada for the most recent fiscal year of available data, 2003–2004 for Canada and 2004–2005 for Canada, excluding Quebec. It describes provincial and territorial differences in annual number of hospitalizations, average length of stay and age standardized hospitalization rates. Trends in inpatient hospitalizations in Canada and across provinces/territories since 1995–1996 are highlighted. A special analysis of patient groups is also featured.
Data Sources The national Hospital Morbidity Database and the Discharge Abstract Database capture administrative, clinical and demographic information on acute care inpatient events from Canadian hospitals. These statistics reflect the number of hospitalizations (or discharges); it is somewhat higher than the number of individuals hospitalized, since individuals with multiple hospitalizations during a single year would be counted more than once in the totals. Hospital visits not resulting in an inpatient admission, such as day surgery, diagnostic testing, consultations and emergency visits, are excluded. Data are based on the fiscal year of discharge. For example, the 2004–2005 hospitalization statistics are based on discharges occurring between April 1, 2004, and March 31, 2005.
Methodology The population of analysis in the present report consists of inpatient discharges (release or death) from an acute care facility in Canada for fiscal years 1995–1996, 2003–2004 and 2004–2005. Data from Quebec for fiscal year 2004–2005 were not available at the writing of this report. The terms “hospitalization” and “discharge” are used interchangeably in this document. Refer to Appendix 1 for a list of definitions used in this report.
All tables and figures exclude stillborn and cadaveric donor records.
2
Methodological details on Tables 1, 2, 3 and 4:
• Numbers for the Northwest Territories for fiscal year 1995–1996 include data from what is now Nunavut.
• Babies born in the reporting facility are excluded. Babies born outside of the reporting facility and subsequently admitted to the reporting facility are included.
With the exception of Table 2, the geography represents the province or territory where the patient was treated—that is, where the facility is located. For Table 2, the geography represents the province or territory where the patient resided at the time of discharge. The hospitalization rates in Table 2 are adjusted for age. Age-standardization is a statistical technique used to remove the effect of the age distribution of two or more populations (for example, Ontario and Alberta) when comparing rates across different populations or the same population over time. The 1991 Canadian population is used to standardize rates.
For Figures 1 to 8, patients are grouped based on the specialty of the provider most responsible for their care while in hospital or the main patient service by which they were treated. The Newborns patient group is comprised of babies born in the reporting facility. Acute inpatient care beds in Canadian hospitals are frequently allocated using these patient groups. Refer to Appendix 2 for more details on patient groups.
Data Limitations The methodology for calculating the age-standardized hospitalization rate has been revised from previous years, rendering comparability with previously published figures from the Hospital Morbidity Database problematic. During CIHI’s data quality assessment of this data, 1,391 abstracts were identified to be missing from the 2004–2005 acute inpatient population used in this report. This impacts a total of six provinces and territories and constitutes approximately 0.06% of the total number of abstracts (~2.2 million) submitted in fiscal year 2004–2005. Finally, as noted above, 2004–2005 Quebec data were not available at the time the present document was written.
Acute Inpatient Hospitalizations Canadian (excluding Quebec) acute care hospitals handled approximately 2.2 million inpatient hospitalizations in 2004–2005, a decline of 13.1% since 1995–1996.
The number of acute care hospitalizations declined steadily from 1995–1996 and 2002–2003, and began to increase in 2003–2004, with 16,400 additional hospitalizations, representing a 0.6% increase. This trend continued between 2003–2004 and 2004–2005, with 17,500 additional hospitalizations, an increase of 0.8%.
Most provinces reported a decrease in the number of inpatient hospitalizations between 1995–1996 and 2004–2005, with the largest percent decrease reported by Newfoundland and Labrador (24.2%), followed by Nova Scotia (22.7%), New Brunswick (21.2%) and Saskatchewan (20.5%). Increases in the number of hospitalizations occurred in Alberta (2.2%) and the Yukon Territory (1.0%) during the same period.
3
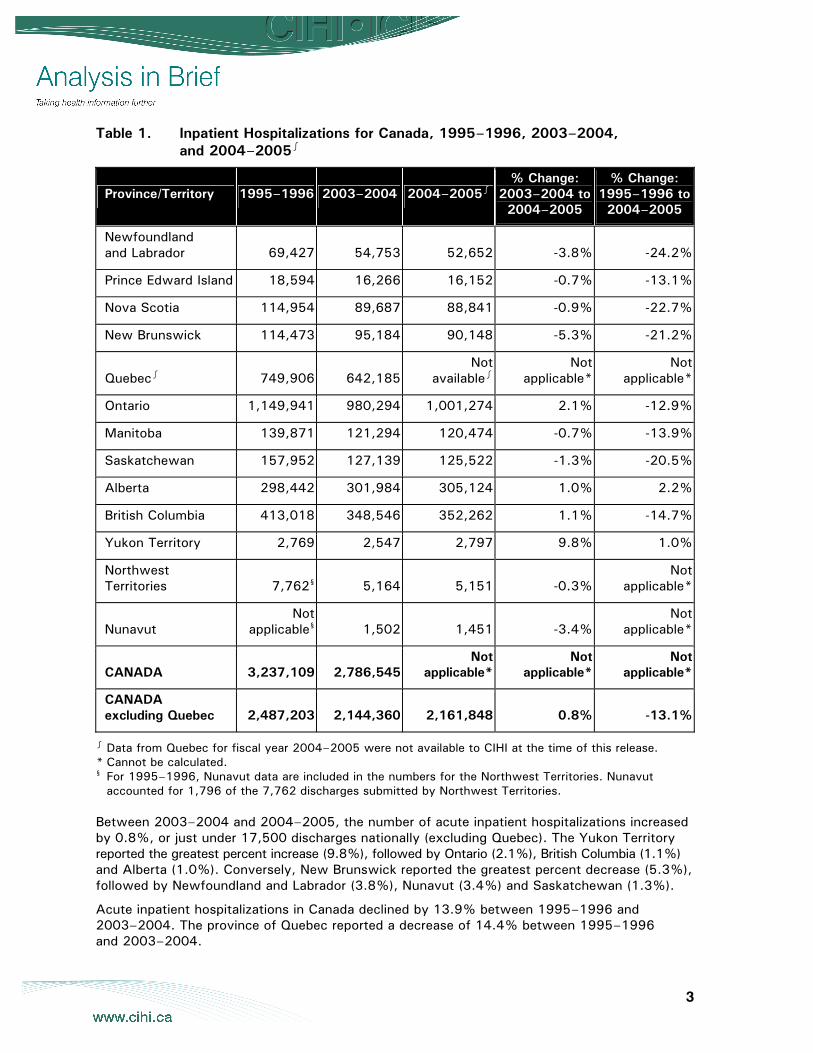
Table 1. Inpatient Hospitalizations for Canada, 1995–1996, 2003–2004, and 2004–2005∫
Province/Territory 1995–1996 2003–2004 2004–2005∫% Change:
2003–2004 to 2004–2005
% Change: 1995–1996 to 2004–2005
Newfoundland and Labrador 69,427 54,753 52,652 -3.8% -24.2%
Prince Edward Island 18,594 16,266 16,152 -0.7% -13.1%
Nova Scotia 114,954 89,687 88,841 -0.9% -22.7%
New Brunswick 114,473 95,184 90,148 -5.3% -21.2%
Quebec∫ 749,906 642,185Not
available∫Not
applicable* Not
applicable*
Ontario 1,149,941 980,294 1,001,274 2.1% -12.9%
Manitoba 139,871 121,294 120,474 -0.7% -13.9%
Saskatchewan 157,952 127,139 125,522 -1.3% -20.5%
Alberta 298,442 301,984 305,124 1.0% 2.2%
British Columbia 413,018 348,546 352,262 1.1% -14.7%
Yukon Territory 2,769 2,547 2,797 9.8% 1.0%
Northwest Territories 7,762§ 5,164 5,151 -0.3%
Not applicable*
Nunavut Not
applicable§ 1,502 1,451 -3.4% Not
applicable*
CANADA 3,237,109 2,786,545Not
applicable*Not
applicable* Not
applicable*
CANADA excluding Quebec 2,487,203 2,144,360 2,161,848 0.8% -13.1%
∫ Data from Quebec for fiscal year 2004–2005 were not available to CIHI at the time of this release. * Cannot be calculated. § For 1995–1996, Nunavut data are included in the numbers for the Northwest Territories. Nunavut
accounted for 1,796 of the 7,762 discharges submitted by Northwest Territories.
Between 2003–2004 and 2004–2005, the number of acute inpatient hospitalizations increased by 0.8%, or just under 17,500 discharges nationally (excluding Quebec). The Yukon Territory reported the greatest percent increase (9.8%), followed by Ontario (2.1%), British Columbia (1.1%) and Alberta (1.0%). Conversely, New Brunswick reported the greatest percent decrease (5.3%), followed by Newfoundland and Labrador (3.8%), Nunavut (3.4%) and Saskatchewan (1.3%).
Acute inpatient hospitalizations in Canada declined by 13.9% between 1995–1996 and 2003–2004. The province of Quebec reported a decrease of 14.4% between 1995–1996 and 2003–2004.
4
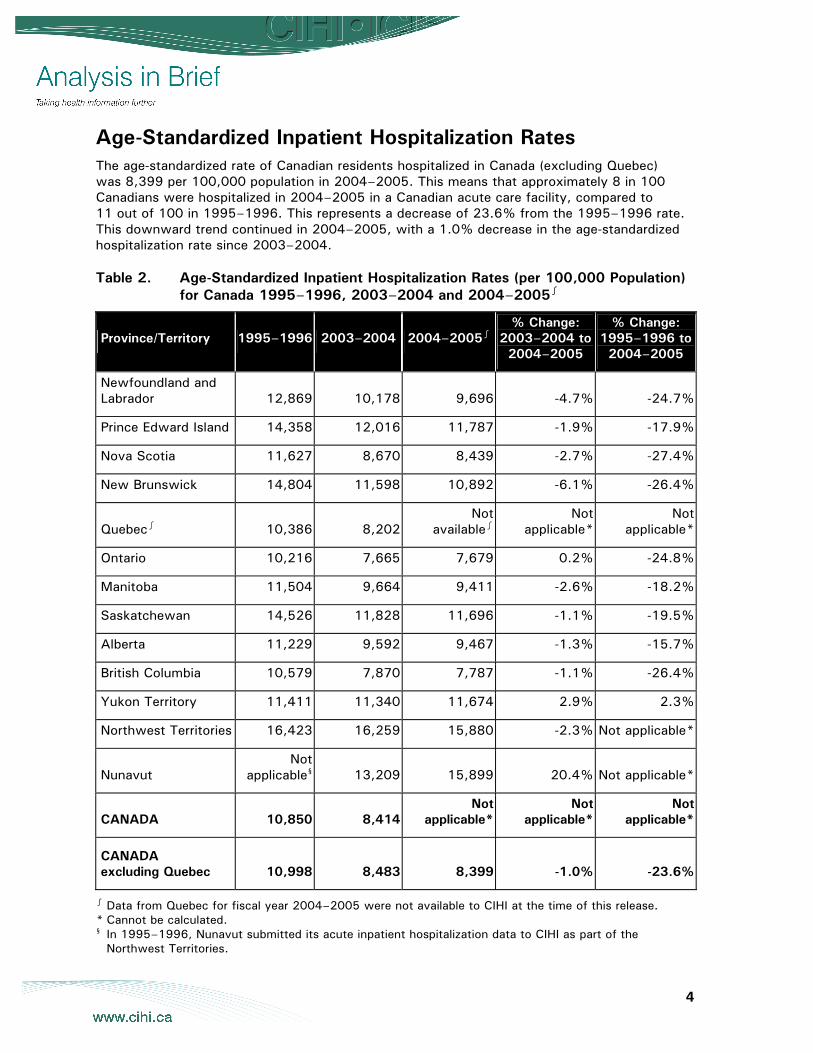
Age-Standardized Inpatient Hospitalization Rates The age-standardized rate of Canadian residents hospitalized in Canada (excluding Quebec) was 8,399 per 100,000 population in 2004–2005. This means that approximately 8 in 100 Canadians were hospitalized in 2004–2005 in a Canadian acute care facility, compared to 11 out of 100 in 1995–1996. This represents a decrease of 23.6% from the 1995–1996 rate. This downward trend continued in 2004–2005, with a 1.0% decrease in the age-standardized hospitalization rate since 2003–2004.
Table 2. Age-Standardized Inpatient Hospitalization Rates (per 100,000 Population) for Canada 1995–1996, 2003–2004 and 2004–2005∫
Province/Territory 1995–1996 2003–2004 2004–2005∫% Change:
2003–2004 to 2004–2005
% Change: 1995–1996 to 2004–2005
Newfoundland and Labrador 12,869 10,178 9,696 -4.7% -24.7%
Prince Edward Island 14,358 12,016 11,787 -1.9% -17.9%
Nova Scotia 11,627 8,670 8,439 -2.7% -27.4%
New Brunswick 14,804 11,598 10,892 -6.1% -26.4%
Quebec∫ 10,386 8,202Not
available∫Not
applicable* Not
applicable*
Ontario 10,216 7,665 7,679 0.2% -24.8%
Manitoba 11,504 9,664 9,411 -2.6% -18.2%
Saskatchewan 14,526 11,828 11,696 -1.1% -19.5%
Alberta 11,229 9,592 9,467 -1.3% -15.7%
British Columbia 10,579 7,870 7,787 -1.1% -26.4%
Yukon Territory 11,411 11,340 11,674 2.9% 2.3%
Northwest Territories 16,423 16,259 15,880 -2.3% Not applicable*
Nunavut Not
applicable§ 13,209 15,899 20.4% Not applicable*
CANADA 10,850 8,414Not
applicable*Not
applicable* Not
applicable*
CANADA excluding Quebec
10,998 8,483 8,399
-1.0% -23.6%
∫ Data from Quebec for fiscal year 2004–2005 were not available to CIHI at the time of this release. * Cannot be calculated. § In 1995–1996, Nunavut submitted its acute inpatient hospitalization data to CIHI as part of the
Northwest Territories.
5
New Brunswick reported the greatest decrease (6.1%) in the age-standardized hospitalization rate between 2003–2004 and 2004–2005, followed by Newfoundland and Labrador (4.7%) and Nova Scotia (2.7%). Nunavut reported the greatest percent increase (20.4%) followed by the Yukon Territory (2.9%) and Ontario (0.2%) over the same one-year period.
The Canadian (excluding Quebec) age-standardized hospitalization rate decreased by 1.0% between 2003–2004 and 2004–2005. This is in contrast to the slight increase in the actual number of hospitalizations over the same period. This indicates that after adjusting for population growth and the age distribution of the Canadian population in 2003–2004 relative to 2004–2005, inpatient hospitalizations in Canada have actually decreased.
Most provinces and territories reported a decrease in age-standardized hospitalization rate between 1995–1996 and 2004–2005, with the largest percent decrease reported by Nova Scotia (27.4%), followed by New Brunswick (26.4%), British Columbia (26.4%), Ontario (24.8%) and Newfoundland and Labrador (24.7%). A slight increase in the age-standardized hospitalization rate was reported by the Yukon Territory (2.3%); this was the only jurisdiction to have an increase over the 1995–1996 rate.
Quebec reported a decrease of 21.0% in the age-standardized hospitalization rate between 1995–1996 and 2003–2004.
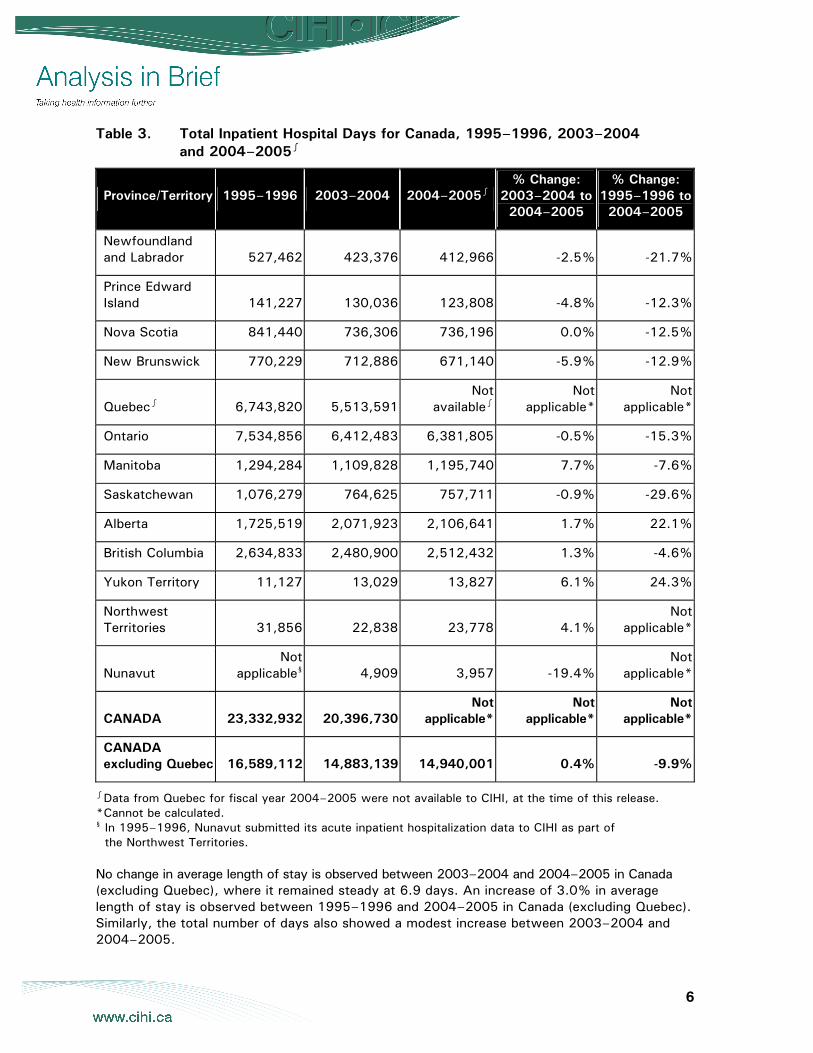
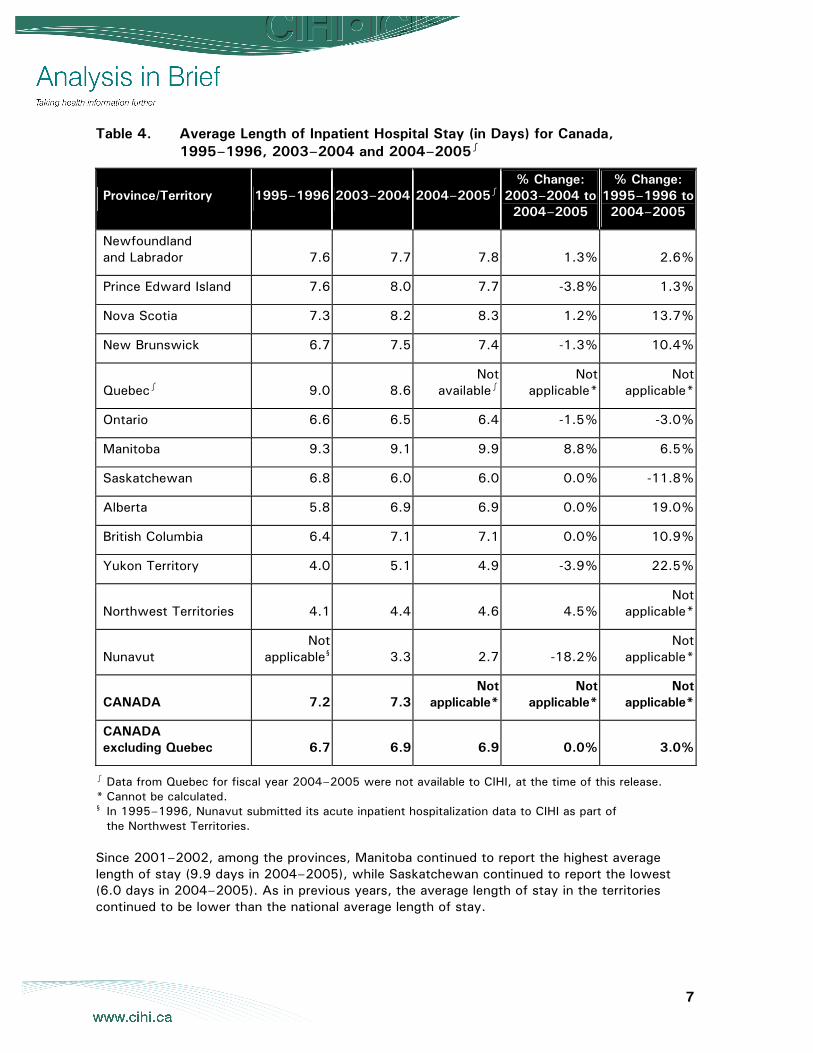
Total Hospital Days and Average Length of Stay for Acute Inpatients in Canada The number of days inpatients spent in acute care hospitals in Canada (excluding Quebec) decreased from 16.6 million in 1995–1996 to 14.9 million in 2004–2005, representing a 9.9% decrease in the last nine years (Table 3). In contrast, the national (excluding Quebec) average length of stay increased from 6.7 days in 1995–1996 to 6.9 days in 2004–2005, representing a 3.0% increase (Table 4).
Nunavut reported the greatest percent decrease (19.4%) in total hospital days between 2003–2004 and 2004–2005, followed by New Brunswick (5.9%) and Prince Edward Island (4.8%). In contrast, Manitoba reported the greatest increase (7.7%) in total hospital days between 2003–2004 and 2004–2005, followed by the Yukon Territory (6.1%), the Northwest Territories (4.1%) and Alberta (1.7%).
Between 1995–1996 and 2004–2005, most provinces and territories experienced a decrease in the total number of hospital days, with the largest percent decrease reported by Saskatchewan (29.6%), followed by Newfoundland and Labrador (21.7%) and Ontario (15.3%). An increase was reported by the Yukon Territory (24.3%) and Alberta (22.1%) during the same time period.
Quebec reported a decrease of 18.2% in the number of inpatient days between 1995–1996 and 2003–2004.
The total number of days spent in a Canadian acute care facility has been steadily declining since 1995–1996. The national average length of stay decreased from 7.2 days in 1995–1996 to 7.0 days in 1998–1999 and began to increase in 1999–2000 by 0.1 days annually, reaching 7.4 days in 2002–2003. This trend reversed in 2003–2004, when the average length of inpatient stay decreased to 7.3 days.
6
Table 3. Total Inpatient Hospital Days for Canada, 1995–1996, 2003–2004 and 2004–2005∫
Province/Territory 1995–1996 2003–2004 2004–2005∫% Change:
2003–2004 to 2004–2005
% Change: 1995–1996 to 2004–2005
Newfoundland and Labrador 527,462 423,376 412,966 -2.5% -21.7%
Prince Edward Island 141,227 130,036 123,808 -4.8% -12.3%
Nova Scotia 841,440 736,306 736,196 0.0% -12.5%
New Brunswick 770,229 712,886 671,140 -5.9% -12.9%
Quebec∫ 6,743,820 5,513,591Not
available∫Not
applicable* Not
applicable*
Ontario 7,534,856 6,412,483 6,381,805 -0.5% -15.3%
Manitoba 1,294,284 1,109,828 1,195,740 7.7% -7.6%
Saskatchewan 1,076,279 764,625 757,711 -0.9% -29.6%
Alberta 1,725,519 2,071,923 2,106,641 1.7% 22.1%
British Columbia 2,634,833 2,480,900 2,512,432 1.3% -4.6%
Yukon Territory 11,127 13,029 13,827 6.1% 24.3%
Northwest Territories 31,856 22,838 23,778 4.1%
Not applicable*
Nunavut Not
applicable§ 4,909 3,957 -19.4% Not
applicable*
CANADA 23,332,932 20,396,730Not
applicable*Not
applicable* Not
applicable*
CANADA excluding Quebec 16,589,112 14,883,139 14,940,001 0.4% -9.9%
∫ Data from Quebec for fiscal year 2004–2005 were not available to CIHI, at the time of this release. * Cannot be calculated. § In 1995–1996, Nunavut submitted its acute inpatient hospitalization data to CIHI as part of
the Northwest Territories.
No change in average length of stay is observed between 2003–2004 and 2004–2005 in Canada (excluding Quebec), where it remained steady at 6.9 days. An increase of 3.0% in average length of stay is observed between 1995–1996 and 2004–2005 in Canada (excluding Quebec). Similarly, the total number of days also showed a modest increase between 2003–2004 and 2004–2005.
7
Table 4. Average Length of Inpatient Hospital Stay (in Days) for Canada, 1995–1996, 2003–2004 and 2004–2005∫
Province/Territory 1995–1996 2003–2004 2004–2005∫% Change:
2003–2004 to 2004–2005
% Change: 1995–1996 to 2004–2005
Newfoundland and Labrador 7.6 7.7 7.8 1.3% 2.6%
Prince Edward Island 7.6 8.0 7.7 -3.8% 1.3%
Nova Scotia 7.3 8.2 8.3 1.2% 13.7%
New Brunswick 6.7 7.5 7.4 -1.3% 10.4%
Quebec∫ 9.0 8.6Not
available∫Not
applicable* Not
applicable*
Ontario 6.6 6.5 6.4 -1.5% -3.0%
Manitoba 9.3 9.1 9.9 8.8% 6.5%
Saskatchewan 6.8 6.0 6.0 0.0% -11.8%
Alberta 5.8 6.9 6.9 0.0% 19.0%
British Columbia 6.4 7.1 7.1 0.0% 10.9%
Yukon Territory 4.0 5.1 4.9 -3.9% 22.5%
Northwest Territories 4.1 4.4 4.6 4.5% Not
applicable*
Nunavut Not
applicable§ 3.3 2.7 -18.2% Not
applicable*
CANADA 7.2 7.3Not
applicable*Not
applicable* Not
applicable*
CANADA excluding Quebec 6.7 6.9 6.9 0.0% 3.0%
∫ Data from Quebec for fiscal year 2004–2005 were not available to CIHI, at the time of this release. * Cannot be calculated. § In 1995–1996, Nunavut submitted its acute inpatient hospitalization data to CIHI as part of
the Northwest Territories.
Since 2001–2002, among the provinces, Manitoba continued to report the highest average length of stay (9.9 days in 2004–2005), while Saskatchewan continued to report the lowest (6.0 days in 2004–2005). As in previous years, the average length of stay in the territories continued to be lower than the national average length of stay.
8
Between 1995–1996 and 2004–2005, most provinces and territories reported an increase in the average length of stay. This is in contrast to the total number of hospital days and total number of hospitalizations, both of which decreased in most provinces and territories during the same time period. The observation that the number of Canadians hospitalized is decreasing, while the average number of days they spend in hospital is increasing, indicates that the type of patients hospitalized is changing, suggesting a sicker patient population than in previous years. The observation that more Canadians are seen in day surgery hospital settings compared to inpatient hospital settings supports this hypothesis. (For more information, please refer to the October 29, 2004, media release entitled Inpatient Hospitalizations Continue to Decline, Same-Day Surgery Visits on the Rise, Reports CIHI.)
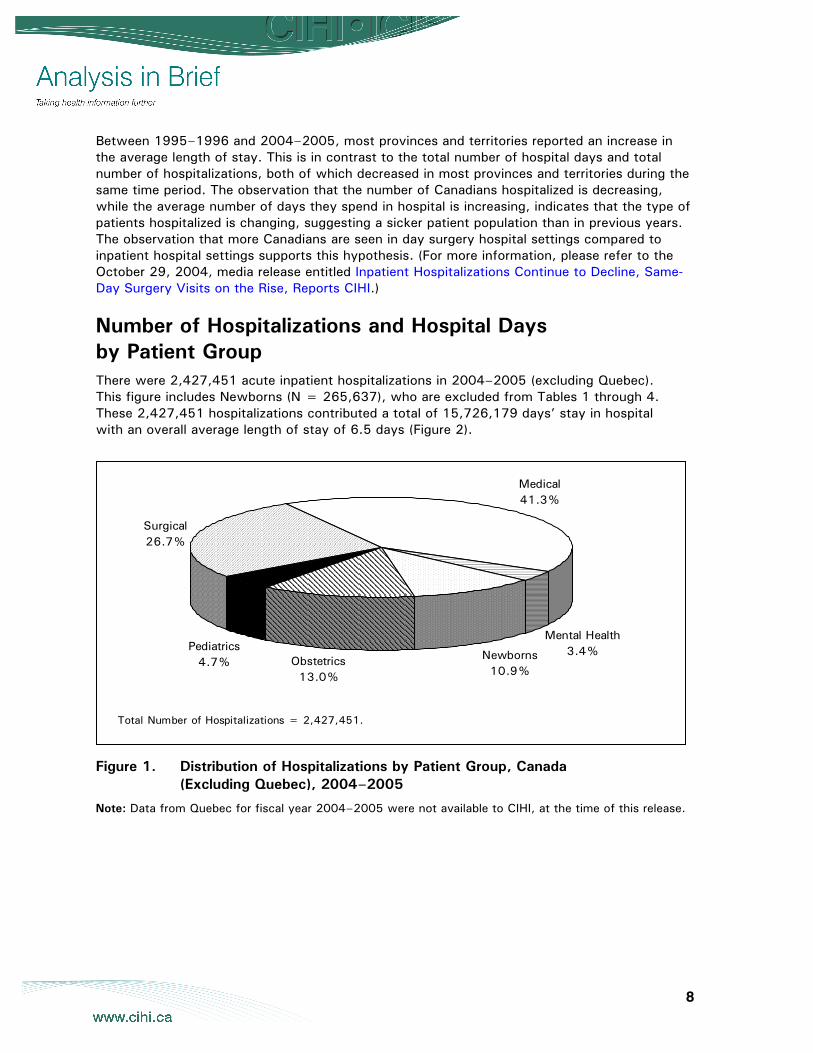
Number of Hospitalizations and Hospital Days by Patient Group There were 2,427,451 acute inpatient hospitalizations in 2004–2005 (excluding Quebec). This figure includes Newborns (N = 265,637), who are excluded from Tables 1 through 4. These 2,427,451 hospitalizations contributed a total of 15,726,179 days’ stay in hospital with an overall average length of stay of 6.5 days (Figure 2).
Figure 1. Distribution of Hospitalizations by Patient Group, Canada (Excluding Quebec), 2004–2005
Note: Data from Quebec for fiscal year 2004–2005 were not available to CIHI, at the time of this release.
Medical41.3%
Mental Health3.4%Newborns
10.9%Obstetrics
13.0%
Pediatrics4.7%
Surgical26.7%
Total Number of Hospitalizations = 2,427,451.
9
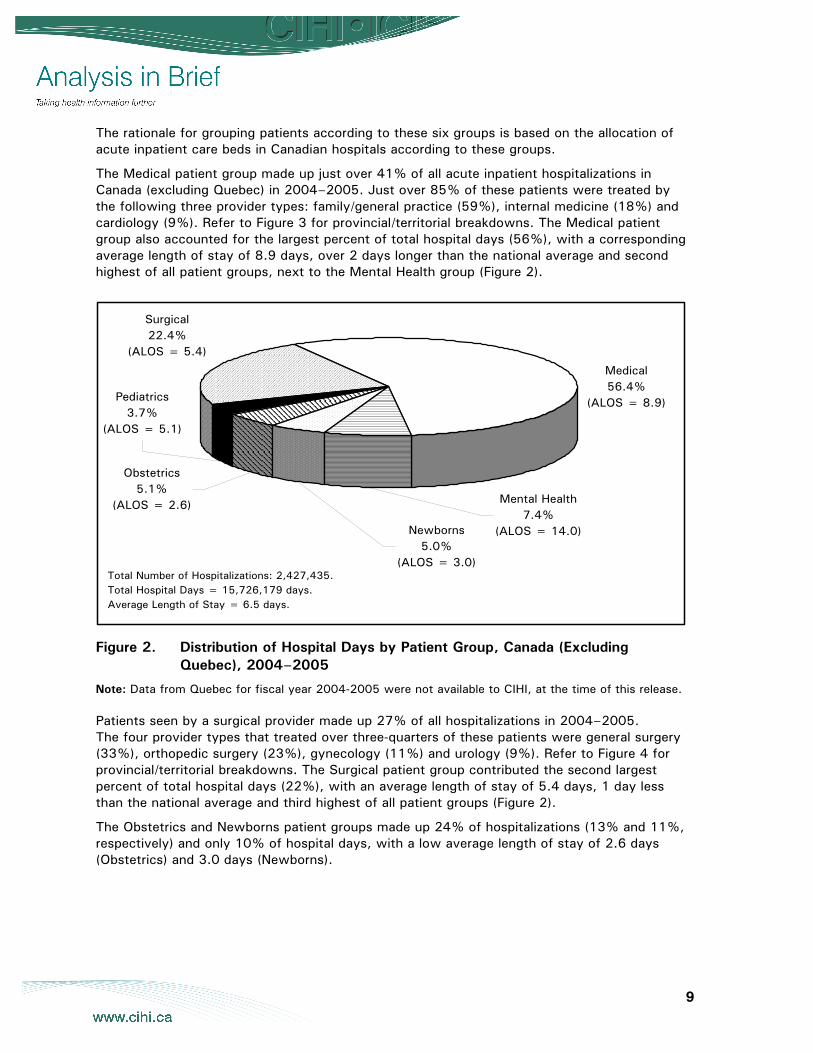
The rationale for grouping patients according to these six groups is based on the allocation of acute inpatient care beds in Canadian hospitals according to these groups.
The Medical patient group made up just over 41% of all acute inpatient hospitalizations in Canada (excluding Quebec) in 2004–2005. Just over 85% of these patients were treated by the following three provider types: family/general practice (59%), internal medicine (18%) and cardiology (9%). Refer to Figure 3 for provincial/territorial breakdowns. The Medical patient group also accounted for the largest percent of total hospital days (56%), with a corresponding average length of stay of 8.9 days, over 2 days longer than the national average and second highest of all patient groups, next to the Mental Health group (Figure 2).
Figure 2. Distribution of Hospital Days by Patient Group, Canada (Excluding Quebec), 2004–2005
Note: Data from Quebec for fiscal year 2004-2005 were not available to CIHI, at the time of this release.
Patients seen by a surgical provider made up 27% of all hospitalizations in 2004–2005. The four provider types that treated over three-quarters of these patients were general surgery (33%), orthopedic surgery (23%), gynecology (11%) and urology (9%). Refer to Figure 4 for provincial/territorial breakdowns. The Surgical patient group contributed the second largest percent of total hospital days (22%), with an average length of stay of 5.4 days, 1 day less than the national average and third highest of all patient groups (Figure 2).
The Obstetrics and Newborns patient groups made up 24% of hospitalizations (13% and 11%, respectively) and only 10% of hospital days, with a low average length of stay of 2.6 days (Obstetrics) and 3.0 days (Newborns).
Surgical22.4%
(ALOS = 5.4)
Pediatrics3.7%
(ALOS = 5.1)
Obstetrics5.1%
(ALOS = 2.6)
Newborns5.0%
(ALOS = 3.0)
Mental Health7.4%
(ALOS = 14.0)
Medical56.4%
(ALOS = 8.9)
Total Number of Hospitalizations: 2,427,435.Total Hospital Days = 15,726,179 days.Average Length of Stay = 6.5 days.
10
The Pediatrics patient group accounted for less than 5% of total hospitalizations and about 4% of total hospital days, with an average length of stay of 5.1 days (Figure 2). Within the Pediatrics population, 83% of patients fell into the Medical sub-group, accounting for 83% of the total hospital days in the Pediatrics population, with an average length of stay of 5.1 days. Just over 15% of the Pediatrics population fell into the Surgical sub-group, accounting for 12% of the total hospital days, with an average length of stay of 4.0 days. The remaining 2% of Pediatric patients fell into the Mental Health sub-group, accounting for 6% of the total hospital days, with an average length of stay of 16.4 days, over three times longer than the 5.1 days average length of stay for the Pediatrics population as a whole.
While the Mental Health patient group made up the smallest percent of all hospitalizations, at just over 3%, it had the third highest contribution to total number of days (7.4%), and had the highest average length of stay of all patient groups, at 14.0 days, more than double the national average length of stay.
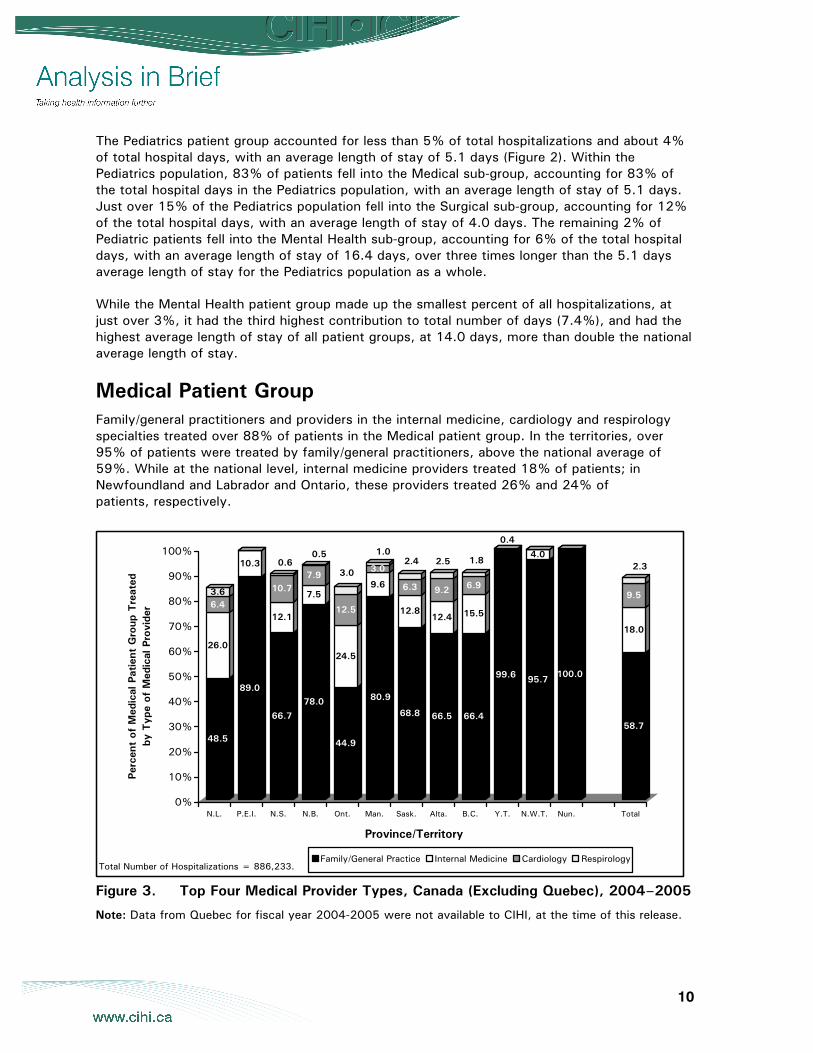
Medical Patient Group Family/general practitioners and providers in the internal medicine, cardiology and respirology specialties treated over 88% of patients in the Medical patient group. In the territories, over 95% of patients were treated by family/general practitioners, above the national average of 59%. While at the national level, internal medicine providers treated 18% of patients; in Newfoundland and Labrador and Ontario, these providers treated 26% and 24% of patients, respectively.
Figure 3. Top Four Medical Provider Types, Canada (Excluding Quebec), 2004–2005
Note: Data from Quebec for fiscal year 2004-2005 were not available to CIHI, at the time of this release.
48.5
26.0
6.43.6
89.0
10.3
66.7
12.1
10.7
0.6
78.0
7.5
7.9
0.5
44.9
24.5
12.5
3.0
80.9
9.6
3.0
1.0
68.8
12.8
6.3
2.4
66.5
12.4
9.2
2.5
66.4
15.5
6.9
1.8
99.6
0.4
95.7
4.0
100.0
58.7
18.0
9.5
2.3
0%
10%
20%
30%
40%
50%
60%
70%
80%
90%
100%
Perc
ent
of M
edic
al P
atie
nt G
roup
Tre
ated
by
Typ
e of
Med
ical
Pro
vide
r
N.L. P.E.I. N.S. N.B. Ont. Man. Sask. Alta. B.C. Y.T. N.W.T. Nun. Total
Province/Territory
Family/General Practice Internal Medicine Cardiology RespirologyTotal Number of Hospitalizations = 886,233.
11
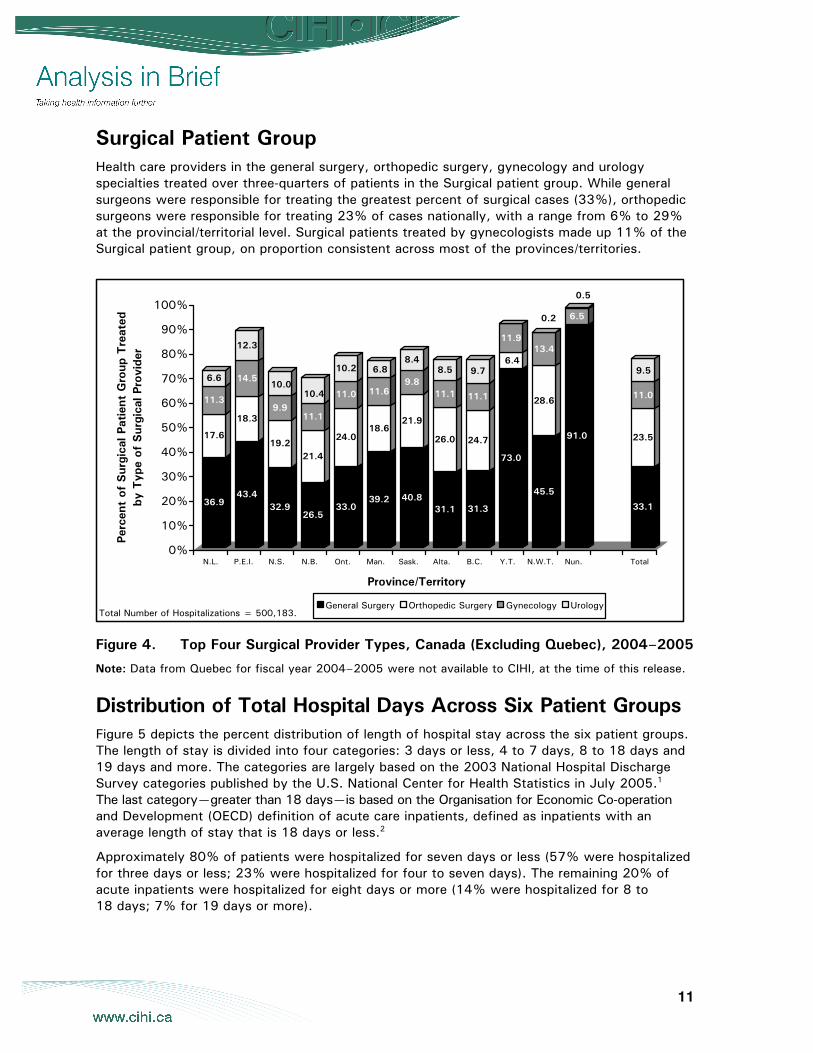
Surgical Patient Group Health care providers in the general surgery, orthopedic surgery, gynecology and urology specialties treated over three-quarters of patients in the Surgical patient group. While general surgeons were responsible for treating the greatest percent of surgical cases (33%), orthopedic surgeons were responsible for treating 23% of cases nationally, with a range from 6% to 29% at the provincial/territorial level. Surgical patients treated by gynecologists made up 11% of the Surgical patient group, on proportion consistent across most of the provinces/territories.
Figure 4. Top Four Surgical Provider Types, Canada (Excluding Quebec), 2004–2005
Note: Data from Quebec for fiscal year 2004–2005 were not available to CIHI, at the time of this release.
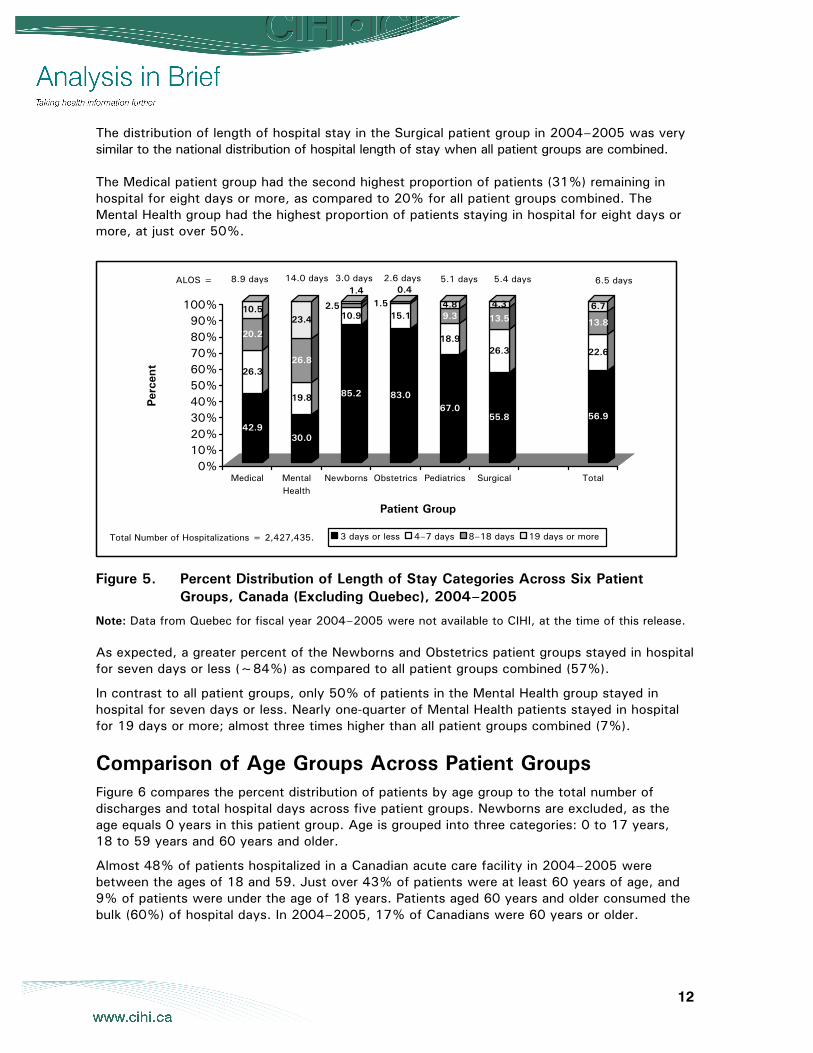
Distribution of Total Hospital Days Across Six Patient Groups Figure 5 depicts the percent distribution of length of hospital stay across the six patient groups. The length of stay is divided into four categories: 3 days or less, 4 to 7 days, 8 to 18 days and 19 days and more. The categories are largely based on the 2003 National Hospital Discharge Survey categories published by the U.S. National Center for Health Statistics in July 2005.1 The last category—greater than 18 days—is based on the Organisation for Economic Co-operation and Development (OECD) definition of acute care inpatients, defined as inpatients with an average length of stay that is 18 days or less.2
Approximately 80% of patients were hospitalized for seven days or less (57% were hospitalized for three days or less; 23% were hospitalized for four to seven days). The remaining 20% of acute inpatients were hospitalized for eight days or more (14% were hospitalized for 8 to 18 days; 7% for 19 days or more).
36.9
17.6
11.3
6.6
43.4
18.3
14.5
12.3
32.9
19.2
9.9
10.0
26.5
21.4
11.1
10.4
33.0
24.0
11.0
10.2
39.2
18.6
11.6
6.8
40.8
21.9
9.8
8.4
31.1
26.0
11.1
8.5
31.3
24.7
11.1
9.7
73.0
6.4
11.9
45.5
28.6
13.4
0.2
91.0
6.5
0.5
33.1
23.5
11.0
9.5
0%
10%
20%
30%
40%
50%
60%
70%
80%
90%
100%
Perc
ent
of S
urgi
cal P
atie
nt G
roup
Tre
ated
by
Typ
e of
Sur
gica
l Pro
vide
r
N.L. P.E.I. N.S. N.B. Ont. Man. Sask. Alta. B.C. Y.T. N.W.T. Nun. Total
Province/Territory
General Surgery Orthopedic Surgery Gynecology UrologyTotal Number of Hospitalizations = 500,183.
12
The distribution of length of hospital stay in the Surgical patient group in 2004–2005 was very similar to the national distribution of hospital length of stay when all patient groups are combined. The Medical patient group had the second highest proportion of patients (31%) remaining in hospital for eight days or more, as compared to 20% for all patient groups combined. The Mental Health group had the highest proportion of patients staying in hospital for eight days or more, at just over 50%.
Figure 5. Percent Distribution of Length of Stay Categories Across Six Patient Groups, Canada (Excluding Quebec), 2004–2005
Note: Data from Quebec for fiscal year 2004–2005 were not available to CIHI, at the time of this release.
As expected, a greater percent of the Newborns and Obstetrics patient groups stayed in hospital for seven days or less (~84%) as compared to all patient groups combined (57%).
In contrast to all patient groups, only 50% of patients in the Mental Health group stayed in hospital for seven days or less. Nearly one-quarter of Mental Health patients stayed in hospital for 19 days or more; almost three times higher than all patient groups combined (7%).
Comparison of Age Groups Across Patient Groups Figure 6 compares the percent distribution of patients by age group to the total number of discharges and total hospital days across five patient groups. Newborns are excluded, as the age equals 0 years in this patient group. Age is grouped into three categories: 0 to 17 years, 18 to 59 years and 60 years and older.
Almost 48% of patients hospitalized in a Canadian acute care facility in 2004–2005 were between the ages of 18 and 59. Just over 43% of patients were at least 60 years of age, and 9% of patients were under the age of 18 years. Patients aged 60 years and older consumed the bulk (60%) of hospital days. In 2004–2005, 17% of Canadians were 60 years or older.
42.9
26.3
20.2
10.5
30.0
19.8
26.8
23.4
85.2
10.92.5
1.4
83.0
15.11.5
0.4
67.0
18.9
9.34.8
55.8
26.3
13.5
4.3
56.9
22.6
13.8
6.7
0%10%20%30%40%50%60%70%80%90%
100%
Perc
ent
Medical MentalHealth
Newborns Obstetrics Pediatrics Surgical Total
Patient Group
3 days or less 4–7 days 8–18 days 19 days or more
ALOS = 8.9 days 14.0 days 3.0 days 2.6 days 5.1 days 5.4 days 6.5 days
Total Number of Hospitalizations = 2,427,435.
13
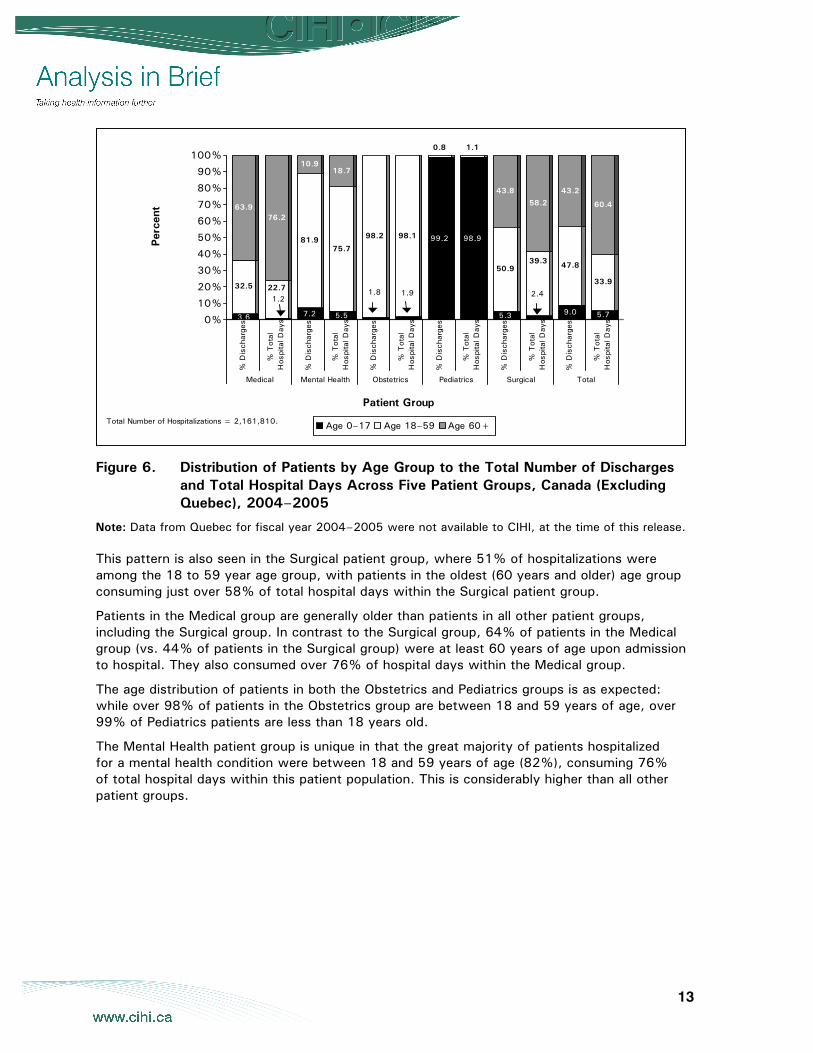
Figure 6. Distribution of Patients by Age Group to the Total Number of Discharges and Total Hospital Days Across Five Patient Groups, Canada (Excluding Quebec), 2004–2005
Note: Data from Quebec for fiscal year 2004–2005 were not available to CIHI, at the time of this release.
This pattern is also seen in the Surgical patient group, where 51% of hospitalizations were among the 18 to 59 year age group, with patients in the oldest (60 years and older) age group consuming just over 58% of total hospital days within the Surgical patient group.
Patients in the Medical group are generally older than patients in all other patient groups, including the Surgical group. In contrast to the Surgical group, 64% of patients in the Medical group (vs. 44% of patients in the Surgical group) were at least 60 years of age upon admission to hospital. They also consumed over 76% of hospital days within the Medical group.
The age distribution of patients in both the Obstetrics and Pediatrics groups is as expected: while over 98% of patients in the Obstetrics group are between 18 and 59 years of age, over 99% of Pediatrics patients are less than 18 years old.
The Mental Health patient group is unique in that the great majority of patients hospitalized for a mental health condition were between 18 and 59 years of age (82%), consuming 76% of total hospital days within this patient population. This is considerably higher than all other patient groups.
3.6
32.5
63.9
1.222.7
76.2
7.2
81.9
10.9
5.5
75.7
18.7
1.8
98.2
1.9
98.1 99.2
0.8
98.9
1.1
5.3
50.9
43.8
2.4
39.3
58.2
9.0
47.8
43.2
5.7
33.9
60.4
0%
10%
20%
30%
40%
50%
60%
70%
80%
90%
100%Per
cent
% D
isch
arge
s
% T
otal
H
ospi
tal D
ays
% D
isch
arge
s
% T
otal
H
ospi
tal D
ays
% D
isch
arge
s
% T
otal
H
ospi
tal D
ays
% D
isch
arge
s
% T
otal
H
ospi
tal D
ays
% D
isch
arge
s
% T
otal
H
ospi
tal D
ays
% D
isch
arge
s
% T
otal
H
ospi
tal D
ays
Medical Mental Health Obstetrics Pediatrics Surgical Total
Age 0–17 Age 18–59 Age 60+Total Number of Hospitalizations = 2,161,810.
Patient Group
14
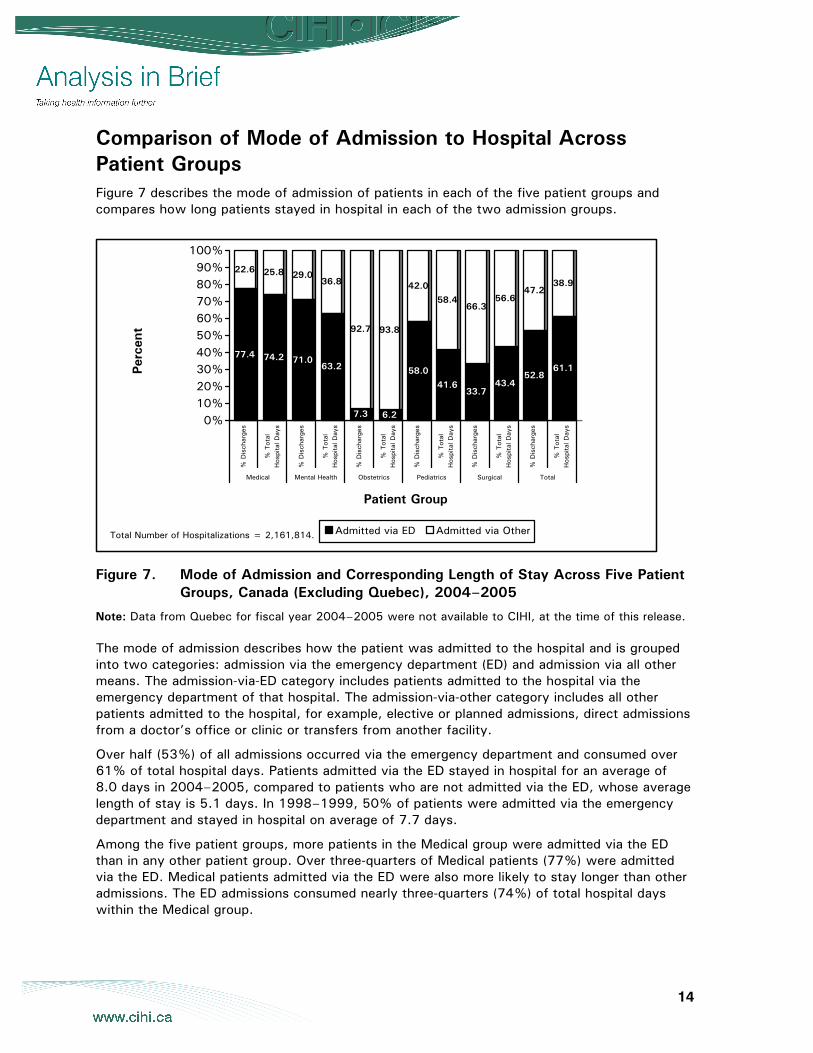
Comparison of Mode of Admission to Hospital Across Patient Groups Figure 7 describes the mode of admission of patients in each of the five patient groups and compares how long patients stayed in hospital in each of the two admission groups.
Figure 7. Mode of Admission and Corresponding Length of Stay Across Five Patient Groups, Canada (Excluding Quebec), 2004–2005
Note: Data from Quebec for fiscal year 2004–2005 were not available to CIHI, at the time of this release.
The mode of admission describes how the patient was admitted to the hospital and is grouped into two categories: admission via the emergency department (ED) and admission via all other means. The admission-via-ED category includes patients admitted to the hospital via the emergency department of that hospital. The admission-via-other category includes all other patients admitted to the hospital, for example, elective or planned admissions, direct admissions from a doctor’s office or clinic or transfers from another facility.
Over half (53%) of all admissions occurred via the emergency department and consumed over 61% of total hospital days. Patients admitted via the ED stayed in hospital for an average of 8.0 days in 2004–2005, compared to patients who are not admitted via the ED, whose average length of stay is 5.1 days. In 1998–1999, 50% of patients were admitted via the emergency department and stayed in hospital on average of 7.7 days.
Among the five patient groups, more patients in the Medical group were admitted via the ED than in any other patient group. Over three-quarters of Medical patients (77%) were admitted via the ED. Medical patients admitted via the ED were also more likely to stay longer than other admissions. The ED admissions consumed nearly three-quarters (74%) of total hospital days within the Medical group.
77.4
22.6
74.2
25.8
71.0
29.0
63.2
36.8
7.3
92.7
6.2
93.8
58.0
42.0
41.6
58.4
33.7
66.3
43.4
56.6
52.8
47.2
61.1
38.9
0%10%20%30%40%50%60%70%80%90%
100%%
Dis
char
ges
% T
otal
Hos
pita
l Day
s
% D
isch
arge
s
% T
otal
Hos
pita
l Day
s
% D
isch
arge
s
% T
otal
Hos
pita
l Day
s
% D
isch
arge
s
% T
otal
Hos
pita
l Day
s
% D
isch
arge
s
% T
otal
Hos
pita
l Day
s
% D
isch
arge
s
% T
otal
Hos
pita
l Day
s
Medical Mental Health Obstetrics Pediatrics Surgical Total
Patient Group
Admitted via ED Admitted via OtherTotal Number of Hospitalizations = 2,161,814.
Perc
ent
15
Patients in the Mental Health group follow the same pattern as patients in the Medical group: the majority of patients (71%) in the Mental Health group were also admitted via the ED. The ED admissions consumed just over 63% of total hospital days within the Mental Health population.
Although more patients in the Pediatrics group were admitted via the ED (58%) than via other means (42%), patients not admitted via the ED consumed the bulk of hospital days (58%) in the Pediatrics group, which is in contrast to the overall patient population as well as the Medical and Mental Health patient populations.
The majority (66%) of patients in the Surgical group were admitted to hospital via means other than the emergency department. This is in contrast to all other patient groups, with the exception of the Obstetrics patient population. Not surprisingly, the great majority (93%) of obstetric patients were not admitted to the hospital via the emergency department.
Comparison of the Use of Special Care Units by Patient Groups Special care units (SCU) are inpatient units specifically designed, staffed and equipped for the continuous observation and treatment of critically ill patients. These include medical, surgical, trauma, burn, cardiac, neonatal, neurosurgery and pediatric, among other intensive care units, as well as step-down units. Refer to Appendix 1 for a complete list of SCU used in this analysis.
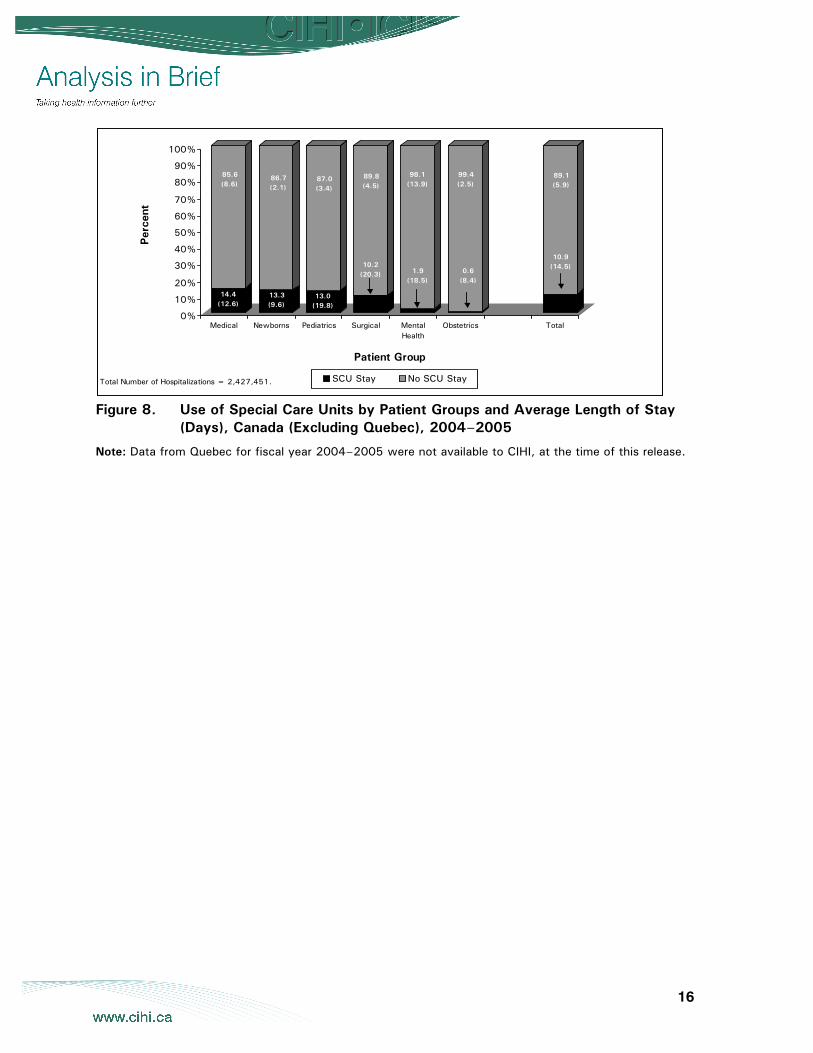
Figure 8 describes the percent of patients within each of the five patient groups who stayed in an SCU during their hospital stay to those who did not, and compares the average length of stay of patients in each of the two SCU categories.
Overall, 11% of patients discharged from an acute care facility in Canada (excluding Quebec) in 2004–2005 spent time in an SCU during their hospitalization. The average length of stay of patients who spent time in an SCU (14.5 days) during their hospital stay was more than twice as long as that of patients who did not spend time in an SCU (5.9 days).
Among the six patient groups, patients in the Medical group had the highest utilization of SCU services, with 14% of patients having spent time in some type of SCU during their hospitalization, with an average length of stay of 12.6 days, compared to 8.6 days for those Medical patients not admitted to an SCU.
Newborns are the second patient group most likely to be admitted to an SCU. In 2004–2005, 13% of newborns spent time in an SCU and stayed an average of 9.6 days in hospital compared to 2.1 days for newborns not having been admitted to an SCU during their hospitalization.
The pediatric population is the last patient group that had a higher proportion of patients admitted to an SCU (13%) than the national average (11%). Pediatric patients admitted to an SCU are also the most likely to stay longer in hospital (19.8 days) than their counterparts who did not spend time in an SCU (3.4 days) as compared to all other patient groups.
Just over 10% of patients in the Surgical group spent time in an SCU during their hospital stay. Among all patient groups who were admitted to an SCU, surgical patients with an SCU stay had the longest average length of stay in hospital at 20.3 days. Among SCU surgical patients, those treated by providers in neurosurgery specialty stayed the longest in hospital at 25.0 days.
The proportion of patients in the Mental Health and Obstetrics groups admitted to an SCU during their hospitalization was considerably lower than the national average, at 2% and 0.6%, respectively.
16
Figure 8. Use of Special Care Units by Patient Groups and Average Length of Stay (Days), Canada (Excluding Quebec), 2004–2005
Note: Data from Quebec for fiscal year 2004–2005 were not available to CIHI, at the time of this release.
14.4(12.6)
85.6(8.6)
13.3(9.6)
86.7(2.1)
13.0(19.8)
87.0(3.4)
10.2(20.3)
89.8(4.5)
1.9(18.5)
98.1(13.9)
0.6(8.4)
99.4(2.5)
10.9(14.5)
89.1(5.9)
0%
10%
20%
30%
40%
50%
60%
70%
80%
90%
100%Per
cent
Medical Newborns Pediatrics Surgical MentalHealth
Obstetrics Total
Patient Group
SCU Stay No SCU StayTotal Number of Hospitalizations = 2,427,451.

17
References 1. C. J. DeFrances, M. J. Hall and M. N. Podgornik, 2003 National Hospital Discharge Survey:
Advance Data From Vital and Health Statistics no. 359 (Hyattsville, MD: National Center for Health Statistics, 2005).
2. Organisation for Economic Co-operation and Development, Acute Care Beds (Health Data 2005) (OECD, 2005), [online], from <http://www.irdes.fr/ecosante/OCDE/220020.html>.

19
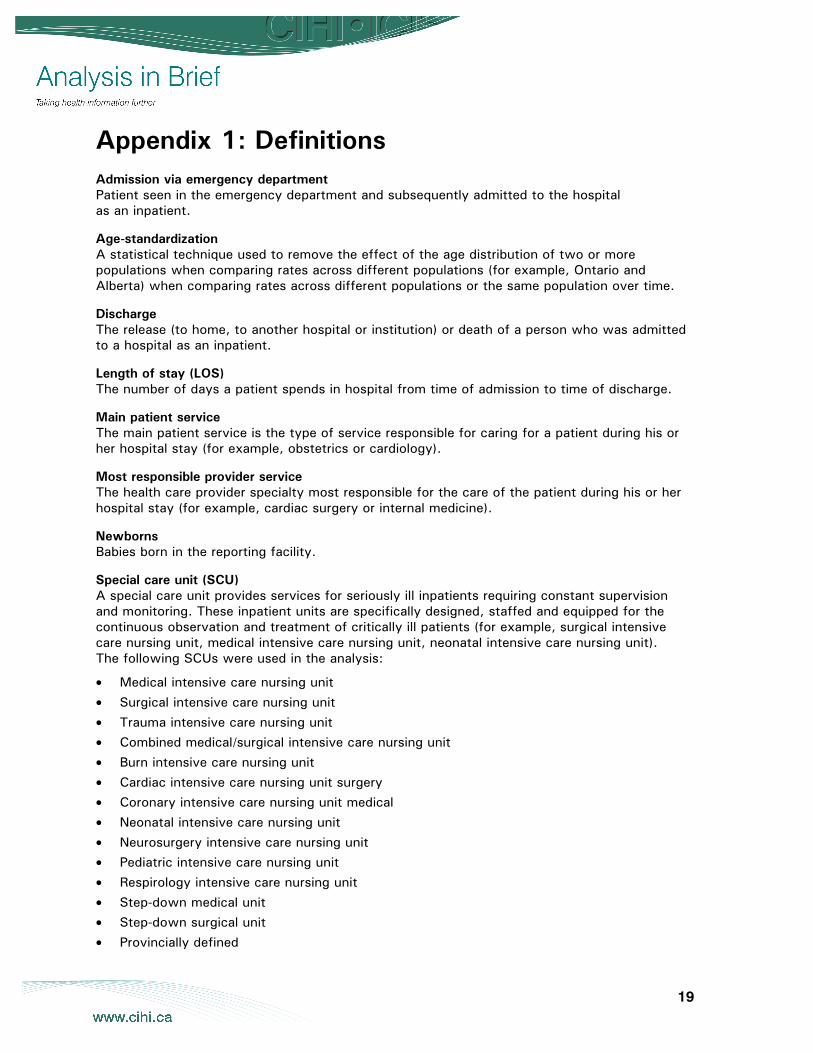
Appendix 1: Definitions Admission via emergency department Patient seen in the emergency department and subsequently admitted to the hospital as an inpatient. Age-standardization A statistical technique used to remove the effect of the age distribution of two or more populations when comparing rates across different populations (for example, Ontario and Alberta) when comparing rates across different populations or the same population over time. Discharge The release (to home, to another hospital or institution) or death of a person who was admitted to a hospital as an inpatient. Length of stay (LOS) The number of days a patient spends in hospital from time of admission to time of discharge. Main patient service The main patient service is the type of service responsible for caring for a patient during his or her hospital stay (for example, obstetrics or cardiology). Most responsible provider service The health care provider specialty most responsible for the care of the patient during his or her hospital stay (for example, cardiac surgery or internal medicine). Newborns Babies born in the reporting facility. Special care unit (SCU) A special care unit provides services for seriously ill inpatients requiring constant supervision and monitoring. These inpatient units are specifically designed, staffed and equipped for the continuous observation and treatment of critically ill patients (for example, surgical intensive care nursing unit, medical intensive care nursing unit, neonatal intensive care nursing unit). The following SCUs were used in the analysis:
• Medical intensive care nursing unit • Surgical intensive care nursing unit • Trauma intensive care nursing unit • Combined medical/surgical intensive care nursing unit • Burn intensive care nursing unit • Cardiac intensive care nursing unit surgery • Coronary intensive care nursing unit medical • Neonatal intensive care nursing unit • Neurosurgery intensive care nursing unit • Pediatric intensive care nursing unit • Respirology intensive care nursing unit • Step-down medical unit • Step-down surgical unit • Provincially defined

21
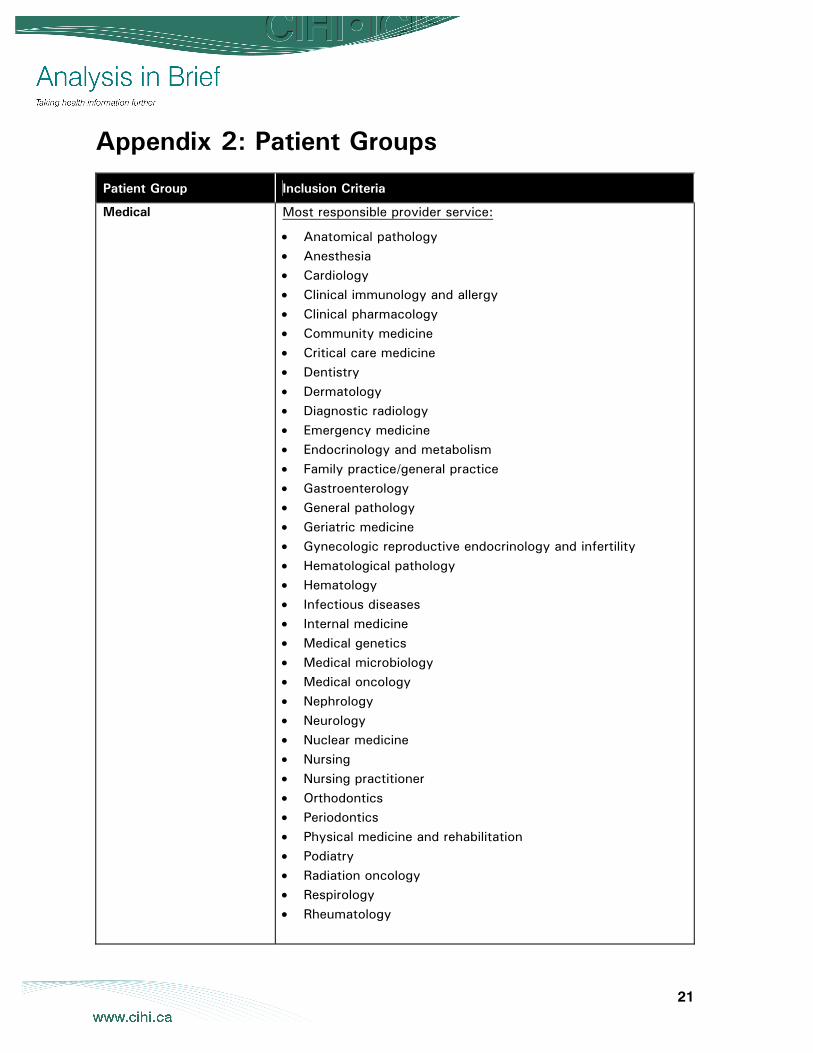
Appendix 2: Patient Groups
Patient Group Inclusion Criteria
Medical
Most responsible provider service:
• Anatomical pathology • Anesthesia • Cardiology • Clinical immunology and allergy • Clinical pharmacology • Community medicine • Critical care medicine • Dentistry • Dermatology • Diagnostic radiology • Emergency medicine • Endocrinology and metabolism • Family practice/general practice • Gastroenterology • General pathology • Geriatric medicine • Gynecologic reproductive endocrinology and infertility • Hematological pathology • Hematology • Infectious diseases • Internal medicine • Medical genetics • Medical microbiology • Medical oncology • Nephrology • Neurology • Nuclear medicine • Nursing • Nursing practitioner • Orthodontics • Periodontics • Physical medicine and rehabilitation • Podiatry • Radiation oncology • Respirology • Rheumatology
22
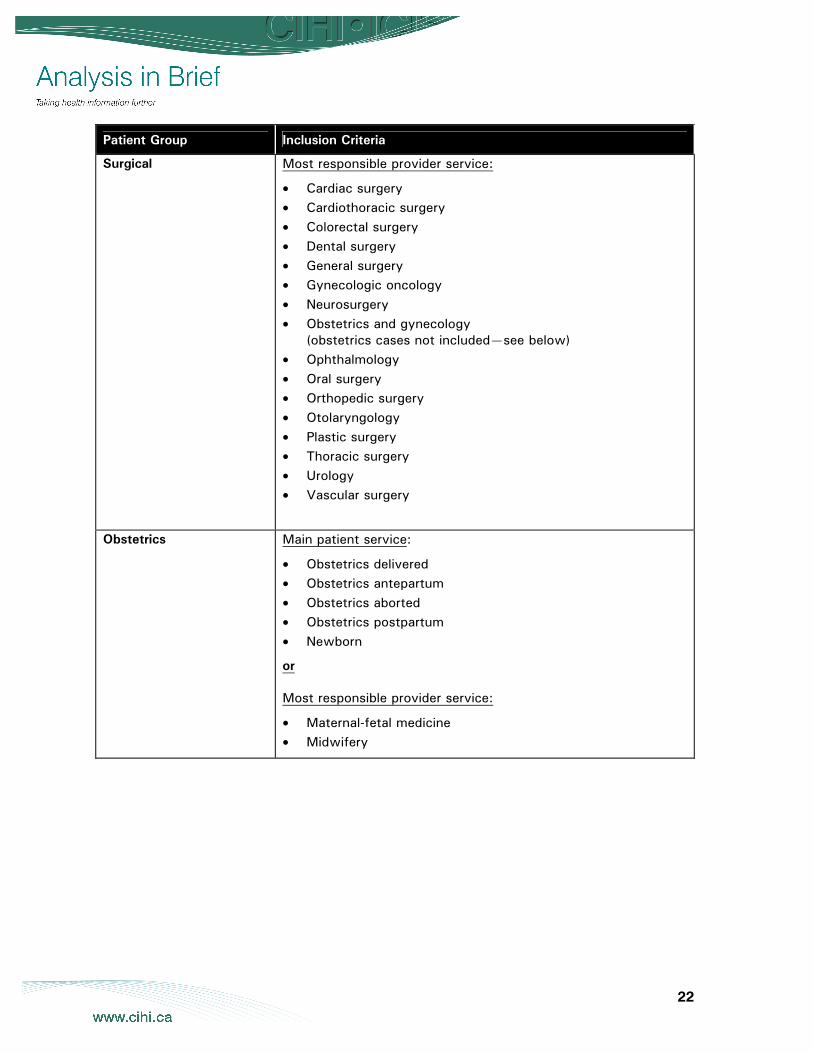
Patient Group Inclusion Criteria
Surgical Most responsible provider service:
• Cardiac surgery • Cardiothoracic surgery • Colorectal surgery • Dental surgery • General surgery • Gynecologic oncology • Neurosurgery • Obstetrics and gynecology
(obstetrics cases not included—see below) • Ophthalmology • Oral surgery • Orthopedic surgery • Otolaryngology • Plastic surgery • Thoracic surgery • Urology • Vascular surgery
Obstetrics Main patient service:
• Obstetrics delivered • Obstetrics antepartum • Obstetrics aborted • Obstetrics postpartum • Newborn
or
Most responsible provider service:
• Maternal-fetal medicine • Midwifery
23
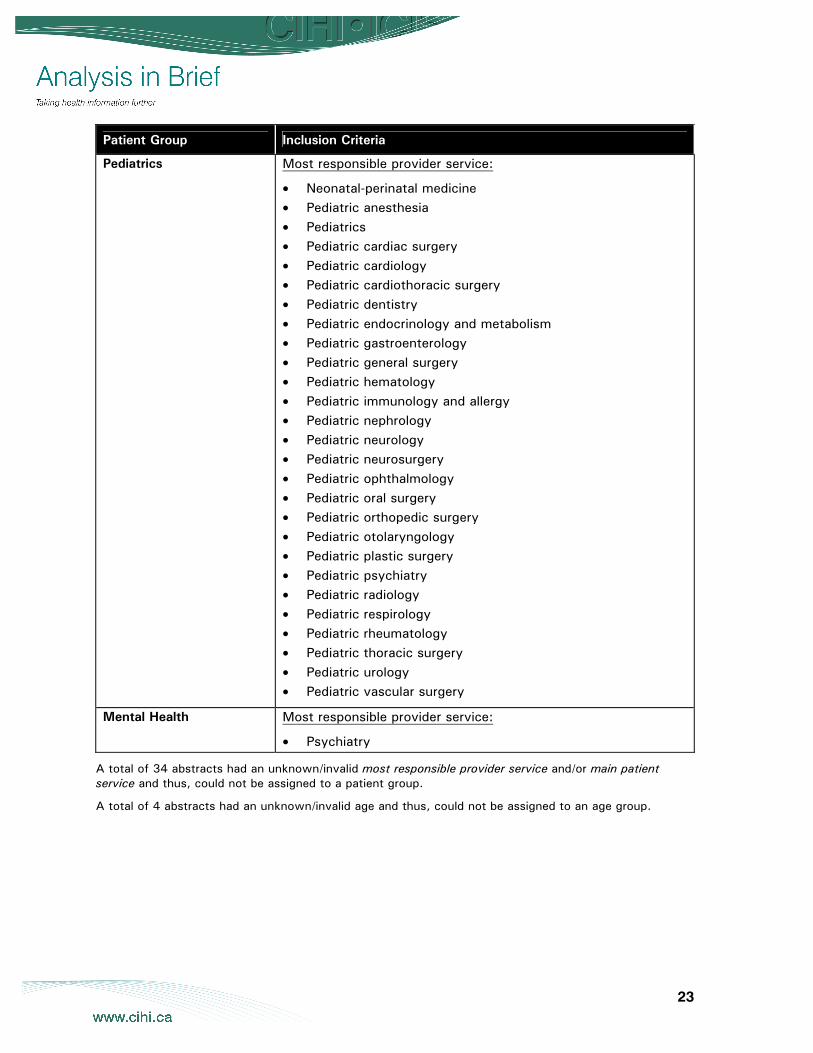
Patient Group Inclusion Criteria
Pediatrics Most responsible provider service:
• Neonatal-perinatal medicine • Pediatric anesthesia • Pediatrics • Pediatric cardiac surgery • Pediatric cardiology • Pediatric cardiothoracic surgery • Pediatric dentistry • Pediatric endocrinology and metabolism • Pediatric gastroenterology • Pediatric general surgery • Pediatric hematology • Pediatric immunology and allergy • Pediatric nephrology • Pediatric neurology • Pediatric neurosurgery • Pediatric ophthalmology • Pediatric oral surgery • Pediatric orthopedic surgery • Pediatric otolaryngology • Pediatric plastic surgery • Pediatric psychiatry • Pediatric radiology • Pediatric respirology • Pediatric rheumatology • Pediatric thoracic surgery • Pediatric urology • Pediatric vascular surgery
Mental Health Most responsible provider service:
• Psychiatry
A total of 34 abstracts had an unknown/invalid most responsible provider service and/or main patient service and thus, could not be assigned to a patient group.
A total of 4 abstracts had an unknown/invalid age and thus, could not be assigned to an age group.