inpex corporation november 14, 2016 corporation november 14, 2016 1 subsidiaries and affiliates ......
TRANSCRIPT

Financial results for the six months ended September 30, 2016Appendix
INPEX CORPORATION
November 14, 2016
1
Subsidiaries and Affiliates
64 consolidated subsidiaries
20 equity method affiliates
Major subsidiaries Country/region Ownership Stage Accounting term
Japan Oil Development Co., Ltd. UAE 100% ProductionMarch (provisional
settlement of account)
JODCO Onshore Limited UAE 51 % Production December
INPEX Natuna, Ltd. Indonesia 100% Production March
INPEX Sahul, Ltd.Timor Sea Joint Petroleum Development Area
100% Production December
INPEX Ichthys Pty Ltd Australia 100% DevelopmentMarch (provisional
settlement of account)
INPEX Southwest Caspian Sea, Ltd. Azerbaijan 51% ProductionMarch (provisional
settlement of account)
INPEX North Caspian Sea, Ltd. Kazakhstan 45% ProductionMarch (provisional
settlement of account)
INPEX Oil & Gas Australia Pty Ltd Australia 100% Development December
INPEX Gas British Columbia Ltd. Canada 45.09%Production/Evaluation
December
Major affiliates Country/region Ownership Stage Accounting term
MI Berau B.V. Indonesia 44% Production December
Angola Block 14 B.V. Angola 49.99% Production December
INPEX Offshore North Campos, Ltd.
Brazil 37.5% Production December
Ichthys LNG Pty Ltd Australia 62.245% DevelopmentMarch (provisional
settlement of account)

2
Segment Information
Note: 1. Adjustments of segment income of ¥(4,375) million include elimination of inter‐segment transactions of ¥6 million and corporate expenses of ¥(4,381) million. Corporate expenses are mainly amortization of goodwill that are not allocated to a reportable segment and general administrative expenses.
2. Segment income is reconciled with operating income on the consolidated Statements of Income.
For the six months ended September 30, 2016 (April 1, 2016 through September 30, 2016)
Reportable segments
Adjustments*1
Consolidated*2Japan
Asia &Oceania
Eurasia(Europe &
NIS)
Middle East & Africa
Americas Total
Sales to third parties 42,603 102,775 30,680 209,037 4,561 389,657 - 389,657
Segment income (loss)6,020 17,574 5,474 118,740 (5,360) 142,448 (4,375) 138,072
(Millions of yen)
3
LPG Sales
Sales volume (thousand bbl) 1,168 1,096 (71) (6.1%)
Average unit price of overseas production ($/bbl)
39.14 31.22 (7.92) (20.2%)
Average unit price of domestic production (¥/kg) 71.93 50.24 (21.69) (30.2%)
Average exchange rate (¥/$) 121.39 105.8115.58 yen
appreciation12.8% yen
appreciation
Apr.‐Sep. ‘15 Apr.‐Sep. ’16 Change %Change
Net sales (Billions of yen) 5.5 3.6 (1.9) (34.7%)
Sales volume by region
(thousand bbl)Apr. ‐ Sep. ‘15 Apr.‐Sep. ’16 Change %Change
Japan3
(0.2thousand ton)
2
(0.2 thousand ton)
(0)
(‐0.0thousand ton)(16.9%)
Asia & Oceania 1,165 1,094 (71) (6.1%)
Eurasia (Europe & NIS) ‐ ‐ ‐ ‐
Middle East & Africa ‐ ‐ ‐ ‐
Americas ‐ ‐ ‐ ‐
Total 1,168 1,096 (71) (6.1%)

4
EBIDAX
(Millions of yen) Apr.‐Sep. ‘15 Apr.‐Sep. ‘16 Change Note
Net income attributable to owners of parent 45,485 15,727 (29,758) P/L
Net income (loss) attributable to non‐controlling interests (6,165) 8,986 15,151 P/L
Depreciation equivalent amount 65,331 83,918 18,586
Depreciation and amortization 35,109 43,289 8,179 C/F Depreciation under concession agreements and G&A
Amortization of goodwill 3,380 3,380 ‐ C/F
Recovery of recoverable accounts under production sharing (capital expenditures)
26,842 37,249 10,407 C/F Depreciation under PS contracts
Exploration cost equivalent amount 23,765 3,494 (20,270)
Exploration expenses 4,093 2,462 (1,631) P/L Exploration expense under concession agreements
Provision for allowance for recoverable accounts under production sharing
18,022 1,032 (16,989) P/L Exploration expense under PS contracts
Provision for exploration projects 1,650 ‐ (1,650) P/L Exploration expense under PS contracts
Material non‐cash items 8,012 6,160 (1,852)
Income taxes‐deferred 6,745 (10,755) (17,501) P/L
Foreign exchange loss (gain) 1,267 16,915 15,648 C/F
Net interest expense after tax (1,495) (1,962) (467) P/L After‐tax interest expense minus interest income
EBIDAX 134,933 116,325 (18,608)
5
Analysis of Recoverable Accountsunder Production Sharing
(Millions of yen) Apr.‐Sep. ‘15 Apr.‐Sep. ‘16
Balance at beginning of the period 703,291 727,771
Add: Exploration costs 22,325 5,529
Development costs 63,867 28,111
Operating expenses 35,954 24,794
Other 6,686 2,045
Less: Cost recovery (CAPEX) 26,842 37,249
Cost recovery (non‐CAPEX) 56,246 36,280
Other 1,219 ‐
Balance at end of the period 747,817 714,722
Less allowance for recoverable accounts under
production sharing at end of the period139,491 133,374
6
Net Income Sensitivities
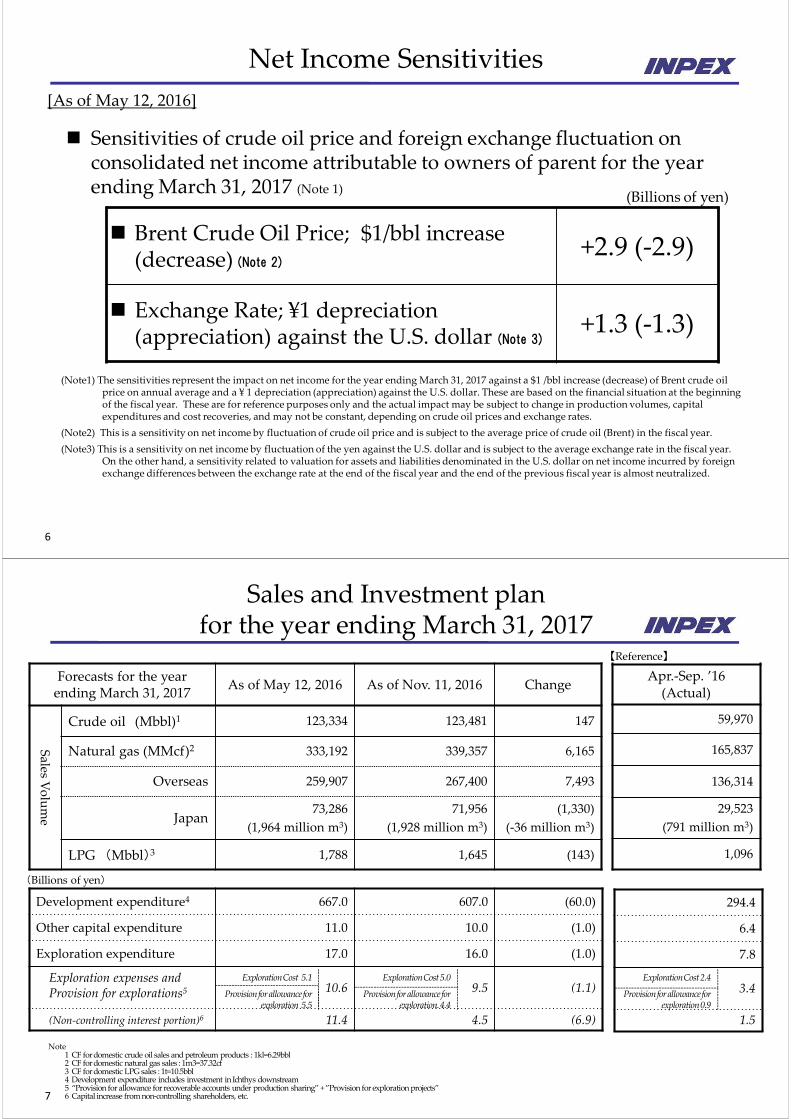
(Note1) The sensitivities represent the impact on net income for the year ending March 31, 2017 against a $1 /bbl increase (decrease) of Brent crude oil price on annual average and a ¥ 1 depreciation (appreciation) against the U.S. dollar. These are based on the financial situation at the beginning of the fiscal year. These are for reference purposes only and the actual impact may be subject to change in production volumes, capital expenditures and cost recoveries, and may not be constant, depending on crude oil prices and exchange rates.
(Note2) This is a sensitivity on net income by fluctuation of crude oil price and is subject to the average price of crude oil (Brent) in the fiscal year.
(Note3) This is a sensitivity on net income by fluctuation of the yen against the U.S. dollar and is subject to the average exchange rate in the fiscal year. On the other hand, a sensitivity related to valuation for assets and liabilities denominated in the U.S. dollar on net income incurred by foreign exchange differences between the exchange rate at the end of the fiscal year and the end of the previous fiscal year is almost neutralized.
Sensitivities of crude oil price and foreign exchange fluctuation on consolidated net income attributable to owners of parent for the year ending March 31, 2017 (Note 1)
(Billions of yen)
Brent Crude Oil Price; $1/bbl increase (decrease) (Note 2)
+2.9 (‐2.9)
Exchange Rate; ¥1 depreciation (appreciation) against the U.S. dollar (Note 3)
+1.3 (‐1.3)
[As of May 12, 2016]
7
Sales and Investment plan for the year ending March 31, 2017
Note1 CF for domestic crude oil sales and petroleum products : 1kl=6.29bbl2 CF for domestic natural gas sales : 1m3=37.32cf3 CF for domestic LPG sales : 1t=10.5bbl4 Development expenditure includes investment in Ichthys downstream5 “Provision for allowance for recoverable accounts under production sharing” + ”Provision for exploration projects”6 Capital increase from non‐controlling shareholders, etc.
【Reference】
(Billions of yen)
Forecasts for the year ending March 31, 2017
As of May 12, 2016 As of Nov. 11, 2016 Change
Sales V
olume
Crude oil (Mbbl)1 123,334 123,481 147
Natural gas (MMcf)2 333,192 339,357 6,165
Overseas 259,907 267,400 7,493
Japan73,286
(1,964 million m3)
71,956
(1,928 million m3)
(1,330)
(‐36 million m3)
LPG (Mbbl)3 1,788 1,645 (143)
Apr.‐Sep. ’16(Actual)
59,970
165,837
136,314
29,523
(791 million m3)
1,096
Development expenditure4 667.0 607.0 (60.0)
Other capital expenditure 11.0 10.0 (1.0)
Exploration expenditure 17.0 16.0 (1.0)
Exploration expenses and Provision for explorations5 10.6 9.5 (1.1)
(Non‐controlling interest portion)6 11.4 4.5 (6.9)
294.4
6.4
7.8
3.4
1.5
Exploration Cost 5.1
Provision for allowance for exploration 5.5
Exploration Cost 5.0
Provision for allowance for exploration. 4.4
Exploration Cost 2.4
Provision for allowance for exploration 0.9

8
Net Production* (Apr. 2016 – Sep. 2016)
Oil/Condensate/LPG
Natural Gas
Total
1%11%
8%
77%
2%
Japan
Asia/Oceania
Eurasia
Middle East/Africa
Americas
13%
75%
12%
Japan
Asia/Oceania
Eurasia
Middle East/Africa
Americas
5%
33%
5%
52%
5%
Japan
Asia/Oceania
Eurasia
Middle East/Africa
Americas
524MBOE/day
349Mbbl/day
935MMcf/day
(175MBOE/day)
270
8339
29
170270
697
123115
28 26
29
* The production volume of crude oil and natural gas under the production sharing contracts entered into by INPEX Group corresponds to the net economic take of our group.
Project Summary
10
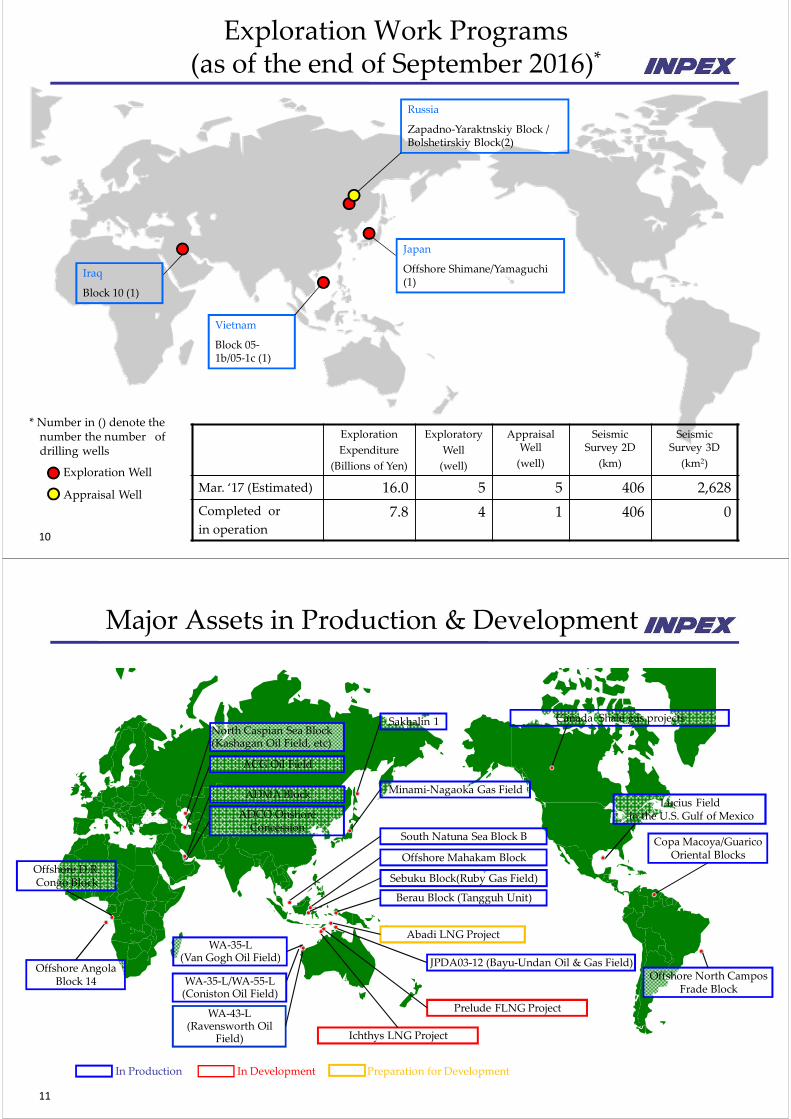
Japan
Offshore Shimane/Yamaguchi (1)
Iraq
Block 10 (1)
* Number in () denote the number the number of drilling wells
Exploration Well
Appraisal Well
Vietnam
Block 05‐1b/05‐1c (1)
Russia
Zapadno‐Yaraktnskiy Block / Bolshetirskiy Block(2)
Exploration
Expenditure
(Billions of Yen)
Exploratory
Well
(well)
Appraisal Well
(well)
Seismic Survey 2D
(km)
Seismic Survey 3D
(km2)
Mar. ‘17 (Estimated) 16.0 5 5 406 2,628
Completed or
in operation
7.8 4 1 406 0
Exploration Work Programs(as of the end of September 2016)*
11
Major Assets in Production & Development
In DevelopmentIn Production Preparation for Development
North Caspian Sea Block(Kashagan Oil Field, etc)
Offshore North Campos Frade Block
Ichthys LNG Project
Abadi LNG Project
Berau Block (Tangguh Unit)
Sakhalin 1
ACG Oil Field
South Natuna Sea Block B
JPDA03‐12 (Bayu‐Undan Oil & Gas Field)
Offshore Mahakam Block
ADMA Block Minami‐Nagaoka Gas Field
Copa Macoya/GuaricoOriental Blocks
WA‐35‐L(Van Gogh Oil Field)
WA‐43‐L(Ravensworth Oil
Field)
Sebuku Block(Ruby Gas Field)
Canada Shale gas projects
WA‐35‐L/WA‐55‐L(Coniston Oil Field)
Prelude FLNG Project
Lucius Fieldin the U.S. Gulf of Mexico
Offshore Angola Block 14
Offshore D.R.Congo Block
ADCO Onshore Concession
12
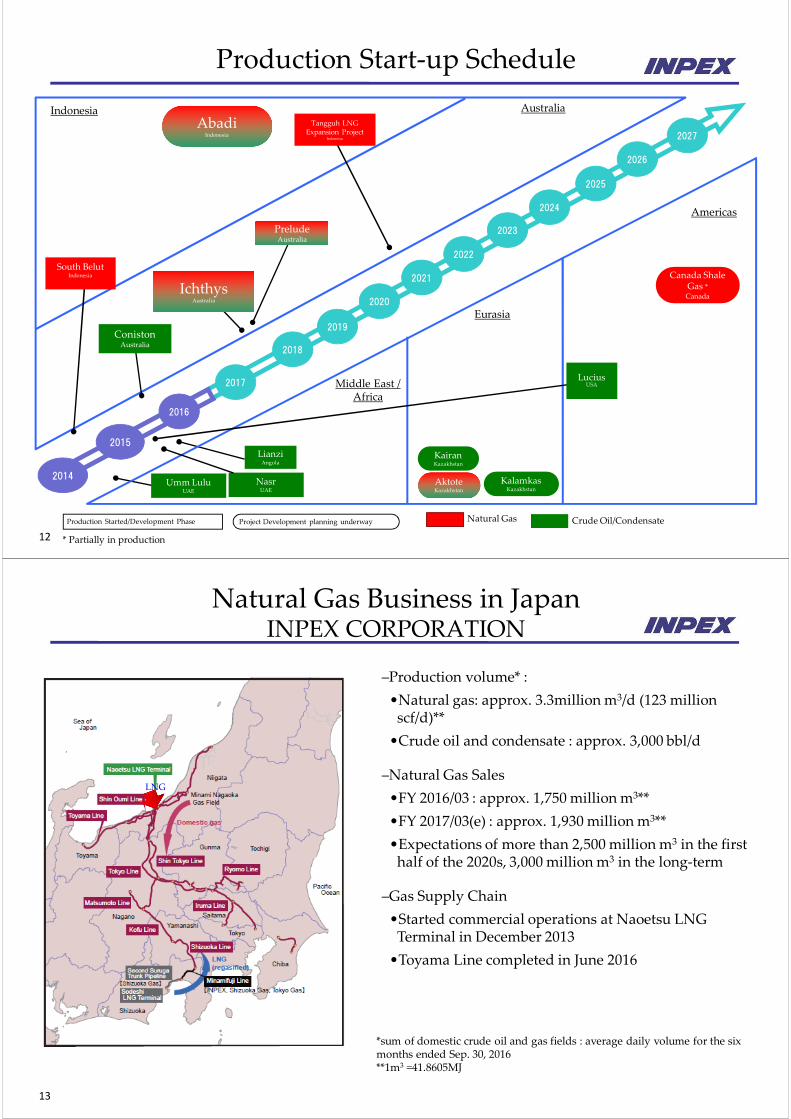
Production Start‐up Schedule
Australia
Americas
Eurasia
Indonesia
2017
2018
2019
2020
2021
2022
2023
2024
2015
2014
LianziAngola
Umm LuluUAE
NasrUAE
2016
Canada Shale Gas *Canada
KalamkasKazakhstan
KairanKazakhstan
AktoteKazakhstan
2025
AbadiIndonesia
2026
2027
Middle East / Africa
Crude Oil/Condensate
* Partially in production
Project Development planning underwayProduction Started/Development Phase Natural Gas
ConistonAustralia
PreludeAustralia
South BelutIndonesia
Tangguh LNG Expansion Project
Indonesia
IchthysAustralia
LuciusUSA
13
Natural Gas Business in JapanINPEX CORPORATION
LNG
*sum of domestic crude oil and gas fields : average daily volume for the six months ended Sep. 30, 2016**1m3 =41.8605MJ
–Production volume* :
•Natural gas: approx. 3.3million m3/d (123 million scf/d)**
•Crude oil and condensate : approx. 3,000 bbl/d
–Natural Gas Sales
•FY 2016/03 : approx. 1,750 million m3**
•FY 2017/03(e) : approx. 1,930 million m3**
•Expectations of more than 2,500 million m3 in the first half of the 2020s, 3,000 million m3 in the long‐term
–Gas Supply Chain
•Started commercial operations at Naoetsu LNG Terminal in December 2013
•Toyama Line completed in June 2016
14
‐
20
40
60
80
100
120
140
06/9 07/9 08/9 09/9 10/9 11/9 12/9 13/9 14/9 15/9 16/9
Price [Yen
/41.8605MJ]
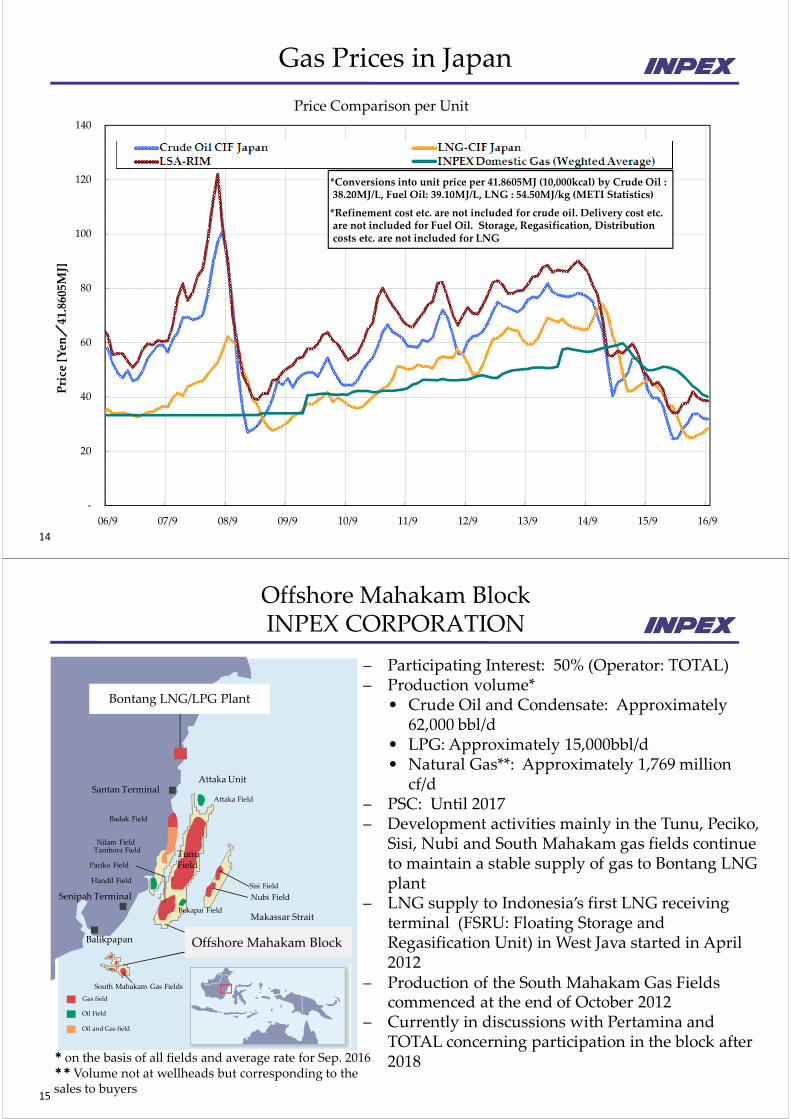
Gas Prices in Japan
*Conversions into unit price per 41.8605MJ (10,000kcal) by Crude Oil : 38.20MJ/L, Fuel Oil: 39.10MJ/L, LNG : 54.50MJ/kg (METI Statistics)
*Refinement cost etc. are not included for crude oil. Delivery cost etc. are not included for Fuel Oil. Storage, Regasification, Distribution costs etc. are not included for LNG
Price Comparison per Unit
15
Offshore Mahakam BlockINPEX CORPORATION
* on the basis of all fields and average rate for Sep. 2016
Gas field
Oil Field
Oil and Gas field
Santan Terminal
Sisi Field
Nubi FieldSenipah Terminal
Handil Field
Badak Field
Nilam Field
Paciko Field
Balikpapan
Attaka Field
AttakaUnit
Bontang LNG/LPG PlantBontang LNG/LPG Plant
Tambora Field
Offshore Mahakam BlockOffshore Mahakam Block
TunuField
Makassar StraitBekapai Field
South Mahakam Gas Fields
– Participating Interest: 50% (Operator: TOTAL)– Production volume*
• Crude Oil and Condensate: Approximately 62,000 bbl/d
• LPG: Approximately 15,000bbl/d• Natural Gas**: Approximately 1,769 million
cf/d– PSC: Until 2017– Development activities mainly in the Tunu, Peciko,
Sisi, Nubi and South Mahakam gas fields continue to maintain a stable supply of gas to Bontang LNG plant
– LNG supply to Indonesia’s first LNG receiving terminal (FSRU: Floating Storage and Regasification Unit) in West Java started in April 2012
– Production of the South Mahakam Gas Fieldscommenced at the end of October 2012
– Currently in discussions with Pertamina and TOTAL concerning participation in the block after 2018
**Volume not at wellheads but corresponding to the sales to buyers
16
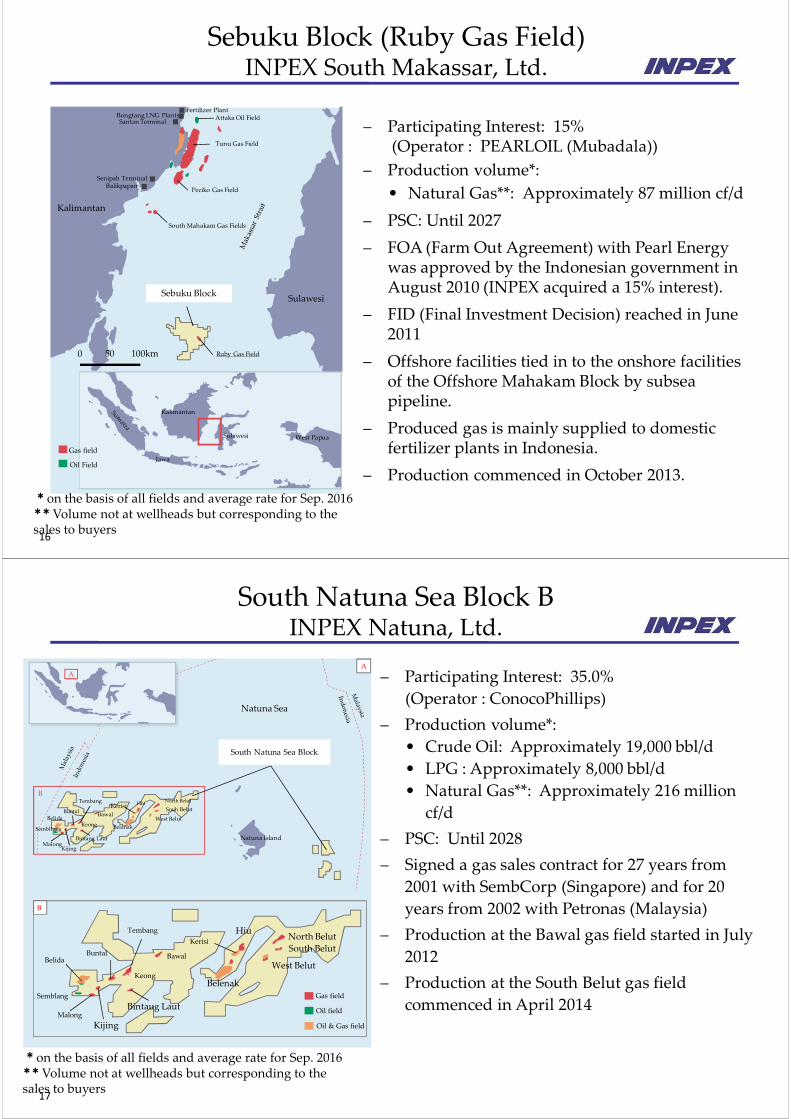
– Participating Interest: 15%(Operator : PEARLOIL (Mubadala))
– Production volume*:
• Natural Gas**: Approximately 87 million cf/d
– PSC: Until 2027
– FOA (Farm Out Agreement) with Pearl Energy was approved by the Indonesian government in August 2010 (INPEX acquired a 15% interest).
– FID (Final Investment Decision) reached in June 2011
– Offshore facilities tied in to the onshore facilities of the Offshore Mahakam Block by subsea pipeline.
– Produced gas is mainly supplied to domestic fertilizer plants in Indonesia.
– Production commenced in October 2013.
Kalimantan
Jawa
Sulawesi West Papua
Attaka Oil Field
Tunu Gas Field
South Mahakam Gas Fields
Bongtang LNG PlantsSantan Terminal
Senipah Terminal
Kalimantan
BalikpapanPeciko Gas Field
Fertilizer Plant
Ruby Gas Field0 100km50
Gas field
Oil Field
Sebuku BlockSebuku BlockSulawesi
* on the basis of all fields and average rate for Sep. 2016**Volume not at wellheads but corresponding to the sales to buyers
Sebuku Block (Ruby Gas Field)INPEX South Makassar, Ltd.
17
A
B
A
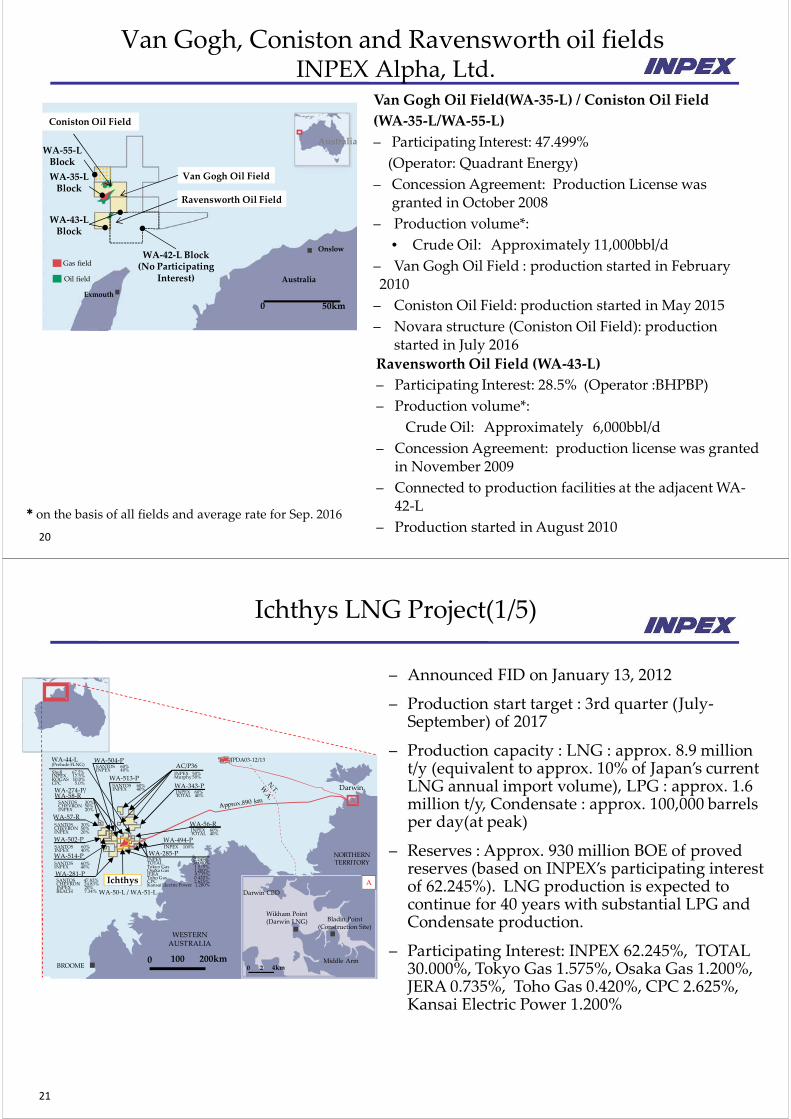
South Natuna Sea Block BINPEX Natuna, Ltd.
MalongKijing
Bintang Laut
Buntal
Tembang
Keong
Bawal
Kerisi
Belanak
Natuna Island
South Natuna Sea BlockSouth Natuna Sea Block
B
KijingMalong
Semblang
BelidaBuntal
Tembang
Keong
Bintaug Laut
Bawal
Kerisi
Gas field
Oil field
Oil & Gas field
Natuna Sea
HluNorth Belut
Souh Belut
West BelutBelida
Sembllang
Belenak
HiuNorth Belut
South Belut
West Belut
– Participating Interest: 35.0%
(Operator : ConocoPhillips)
– Production volume*:
• Crude Oil: Approximately 19,000 bbl/d
• LPG : Approximately 8,000 bbl/d
• Natural Gas**: Approximately 216 million
cf/d
– PSC: Until 2028
– Signed a gas sales contract for 27 years from
2001 with SembCorp (Singapore) and for 20
years from 2002 with Petronas (Malaysia)
– Production at the Bawal gas field started in July
2012
– Production at the South Belut gas field
commenced in April 2014
* on the basis of all fields and average rate for Sep. 2016**Volume not at wellheads but corresponding to the sales to buyers

18
Berau Block (Tangguh LNG Project)MI Berau B.V. / MI Berau Japan Ltd.
– MI Berau B.V./MI Berau Japan Ltd.* : Joint venture with Mitsubishi Corporation (INPEX 44%, Mitsubishi 56%) *MI Berau Japan
owns approximately 16.5% share of KG Berau Petroleum Ltd.
– Participating Interest in the Berau PSC:
• MI Berau : 16.3% Tangguh Unit
• KG Berau Petroleum : 8.56% TangguhUnit
• Operator : BP
– Production volume*:
• Condensate: Approximately 6,000 bbl/d
• Natural Gas**: Approximately 993 million cf/d
– PSC: Until 2035
– LNG production capacity: 7.6 million tons per year
– LNG sales started in July 2009
– In July 2016, announced FID for expansion project ( to add a LNG process train with 3.8 million tons per year of LNG production capacity)
Berau BlockBerau Block
Gas field
West Papua Province(Indonesia)
Kaimana
* on the basis of all fields and average rate for Sep. 2016**Volume not at wellheads but corresponding to the sales to buyers
19
– Participating Interest: 11.378120%(Operator: ConocoPhillips)
– Production volume*:
• Condensate: Approximately 23,000 bbl/d
• LPG: Approximately 15,000 bbl/d
• Natural Gas**: Approximately 319 million cf/d
– PSC: Until 2022
– Sales of condensate and LPG started in February 2004
– Entered into LNG Sales Contract with TEPCO (currently JERA) and Tokyo Gas in August 2005 (3 million t/y for 17 years from 2006)
– LNG sales started in February 2006
* on the basis of all fields and average rate for Sep. 2016**Volume not at wellheads but corresponding to the sales to buyers
JPDA03‐12 /JPDA03‐13 Block (Bayu‐Undan Gas Condensate Field)INPEX Sahul, Ltd.
Darwin
Bayu‐UndanGas/Condensate Field
Bayu‐UndanGas/Condensate Field
JPDA03‐12 Block
Australia
Indonesia
50 km
Kitan Oil Field
Gas field
Oil field
JPDA03‐13 Block
20
Van Gogh Oil Field(WA‐35‐L) / Coniston Oil Field
(WA‐35‐L/WA‐55‐L)
– Participating Interest: 47.499%
(Operator: Quadrant Energy)
– Concession Agreement: Production License was granted in October 2008
– Production volume*:
• Crude Oil: Approximately 11,000bbl/d
– Van Gogh Oil Field : production started in February 2010
– Coniston Oil Field: production started in May 2015
– Novara structure (Coniston Oil Field): production started in July 2016
Ravensworth Oil Field (WA‐43‐L)
– Participating Interest: 28.5% (Operator :BHPBP)
– Production volume*:
Crude Oil: Approximately 6,000bbl/d
– Concession Agreement: production license was granted in November 2009
– Connected to production facilities at the adjacent WA‐42‐L
– Production started in August 2010* on the basis of all fields and average rate for Sep. 2016
0 50km
Australia
Onslow
Exmouth
WA‐35‐L Block
Van Gogh Oil Field
Ravensworth Oil Field
WA‐43‐L Block
Australia
Gas field
Oil field
Coniston Oil Field
WA‐55‐L Block
WA‐42‐L Block(No Participating
Interest)
Van Gogh, Coniston and Ravensworth oil fields INPEX Alpha, Ltd.
21
Ichthys LNG Project(1/5)
– Announced FID on January 13, 2012
– Production start target : 3rd quarter (July‐September) of 2017
– Production capacity : LNG : approx. 8.9 million t/y (equivalent to approx. 10% of Japan’s current LNG annual import volume), LPG : approx. 1.6 million t/y, Condensate : approx. 100,000 barrels per day(at peak)
– Reserves : Approx. 930 million BOE of proved reserves (based on INPEX’s participating interest of 62.245%). LNG production is expected to continue for 40 years with substantial LPG and Condensate production.
– Participating Interest: INPEX 62.245%, TOTAL 30.000%, Tokyo Gas 1.575%, Osaka Gas 1.200%, JERA 0.735%, Toho Gas 0.420%, CPC 2.625%, Kansai Electric Power 1.200%
ダーウィン
ブライディン・ポイント(建設予定地)
A
A
北部準州
ダーウィン
ダーウィン市街
ウィッカム・ポイント(Darwin LNG) ブライディン・ポイント
(建設予定地)
西オーストラリア州
JPDA03‐13
ブルームミドルアーム半島200km100
4km20
ガス田
A
A
NORTHERNTERRITORY
Darwin
Darwin CBD
Wikham Point(Darwin LNG) Bladin Point
(Construction Site)
JPDA03‐12/13
Middle Arm200km1004km20
WESTERNAUSTRALIA
0BROOME
WA‐343‐P
WA‐57‐R
WA‐281‐P
WA‐56‐R
WA‐44‐L(Prelude FLNG) AC/P36
WA‐502‐P
WA‐504‐P
WA‐514‐P
WA‐513‐P
WA‐494‐P
WA‐285‐P
INPEX 60%TOTAL 40%
INPEX 60%TOTAL 40%
SANTOS 30%CHEVRON 50%INPEX 20%
SANTOS 30%CHEVRON 50%INPEX 20%
SANTOS 47.83%CHEVRON 24.83%INPEX 20%BEACH 7.34% WA‐50‐L / WA‐51‐L
Shell 67.5%INPEX 17.5% KOGAS 10.0%CPC 5.0%
INPEX 50%Murphy 50%
SANTOS 60%INPEX 40%
SANTOS 60%INPEX 40%
SANTOS 60%INPEX 40%
INPEX 62.245%TOTAL 30.000%Tokyo Gas 1.575%, Osaka Gas 1.200%, JERA 0.735%, Toho Gas 0.420%, CPC 2.625%, Kansai Electric Power 1.200%
INPEX 100%
SANTOS 60%INPEX 40%
IchthysIchthys
WA‐274‐P/WA‐58‐R
22
Ichthys LNG Project(2/5)
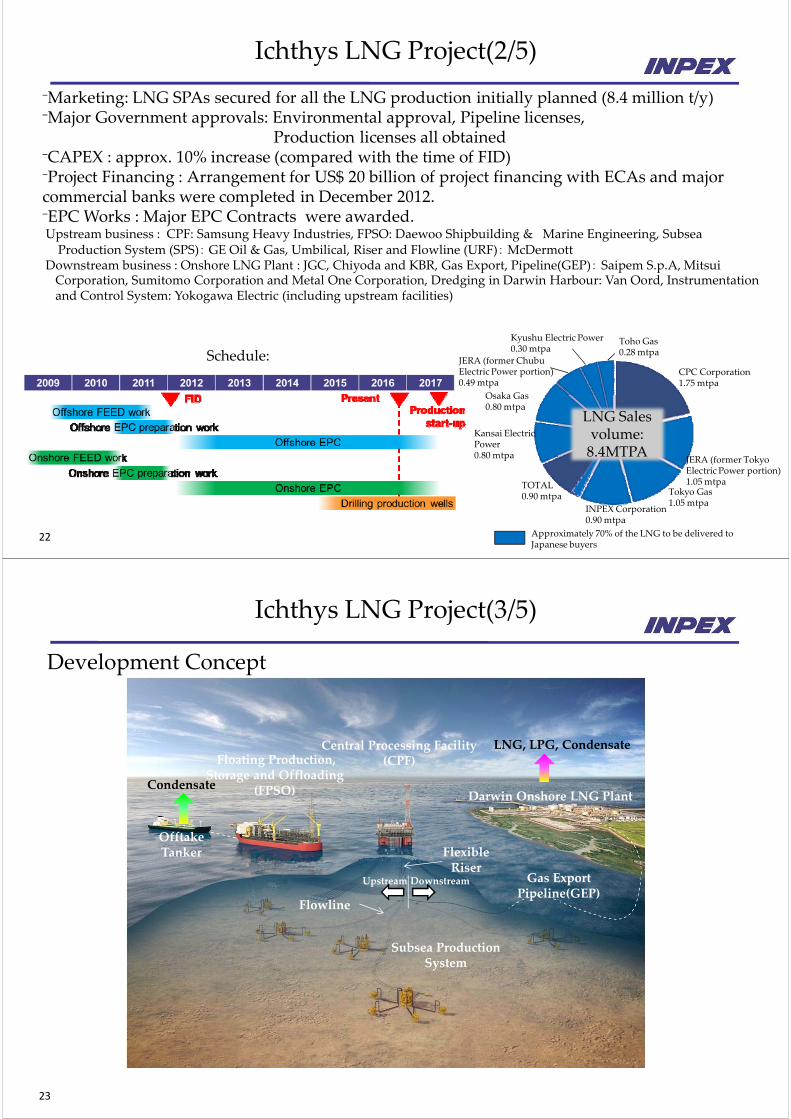
⁻Marketing: LNG SPAs secured for all the LNG production initially planned (8.4 million t/y) ⁻Major Government approvals: Environmental approval, Pipeline licenses,
Production licenses all obtained⁻CAPEX : approx. 10% increase (compared with the time of FID)⁻Project Financing : Arrangement for US$ 20 billion of project financing with ECAs and major commercial banks were completed in December 2012.⁻EPC Works : Major EPC Contracts were awarded. Upstream business : CPF: Samsung Heavy Industries, FPSO: Daewoo Shipbuilding & Marine Engineering, Subsea Production System (SPS): GE Oil & Gas, Umbilical, Riser and Flowline (URF): McDermott
Downstream business : Onshore LNG Plant : JGC, Chiyoda and KBR, Gas Export, Pipeline(GEP): Saipem S.p.A, Mitsui Corporation, Sumitomo Corporation and Metal One Corporation, Dredging in Darwin Harbour: Van Oord, Instrumentationand Control System: Yokogawa Electric (including upstream facilities)
CPC Corporation 1.75 mtpa
JERA (former Tokyo Electric Power portion)1.05 mtpa
Tokyo Gas 1.05 mtpa
INPEX Corporation0.90 mtpa
TOTAL0.90 mtpa
Kansai Electric Power0.80 mtpa
Osaka Gas 0.80 mtpa
JERA (former Chubu Electric Power portion)0.49 mtpa
Kyushu Electric Power0.30 mtpa
Toho Gas0.28 mtpaSchedule:
Approximately 70% of the LNG to be delivered to Japanese buyers
LNG Sales volume:8.4MTPA
23
Ichthys LNG Project(3/5)
Central Processing Facility(CPF)Floating Production,
Storage and Offloading(FPSO)
Flexible Riser
Darwin Onshore LNG PlantCondensate
Gas Export Pipeline(GEP)
LNG, LPG, Condensate
OfftakeTanker
Flowline
Subsea Production System
Downstream Upstream
Development Concept
24
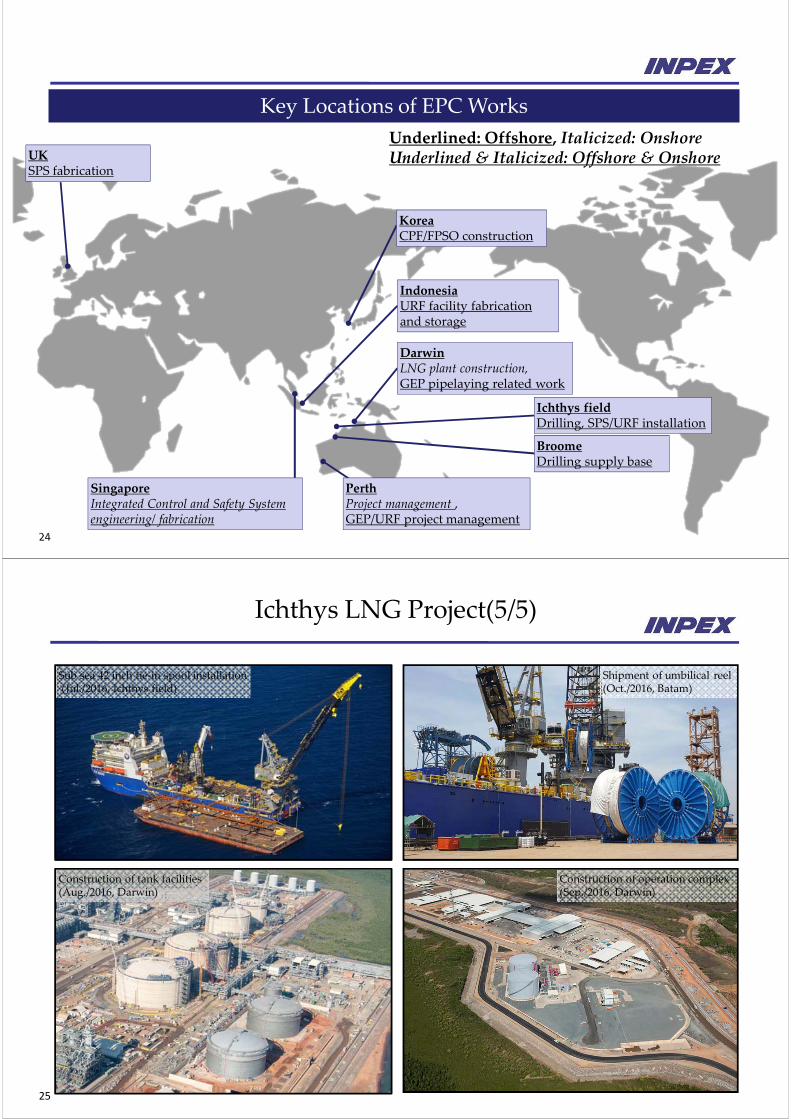
PerthProject management , GEP/URF project management
UKSPS fabrication
Key Locations of EPC Works
Underlined: Offshore, Italicized: OnshoreUnderlined & Italicized: Offshore & Onshore
IndonesiaURF facility fabrication and storage
KoreaCPF/FPSO construction
SingaporeIntegrated Control and Safety System engineering/ fabrication
DarwinLNG plant construction, GEP pipelaying related work
BroomeDrilling supply base
Ichthys fieldDrilling, SPS/URF installation
25
Ichthys LNG Project(5/5)
Sub sea 42 inch tie‐in spool installation (Jul./2016, Ichthys field)
Construction of tank facilities(Aug./2016, Darwin)
Shipment of umbilical reel (Oct./2016, Batam)
Construction of operation complex(Sep./2016, Darwin)
26
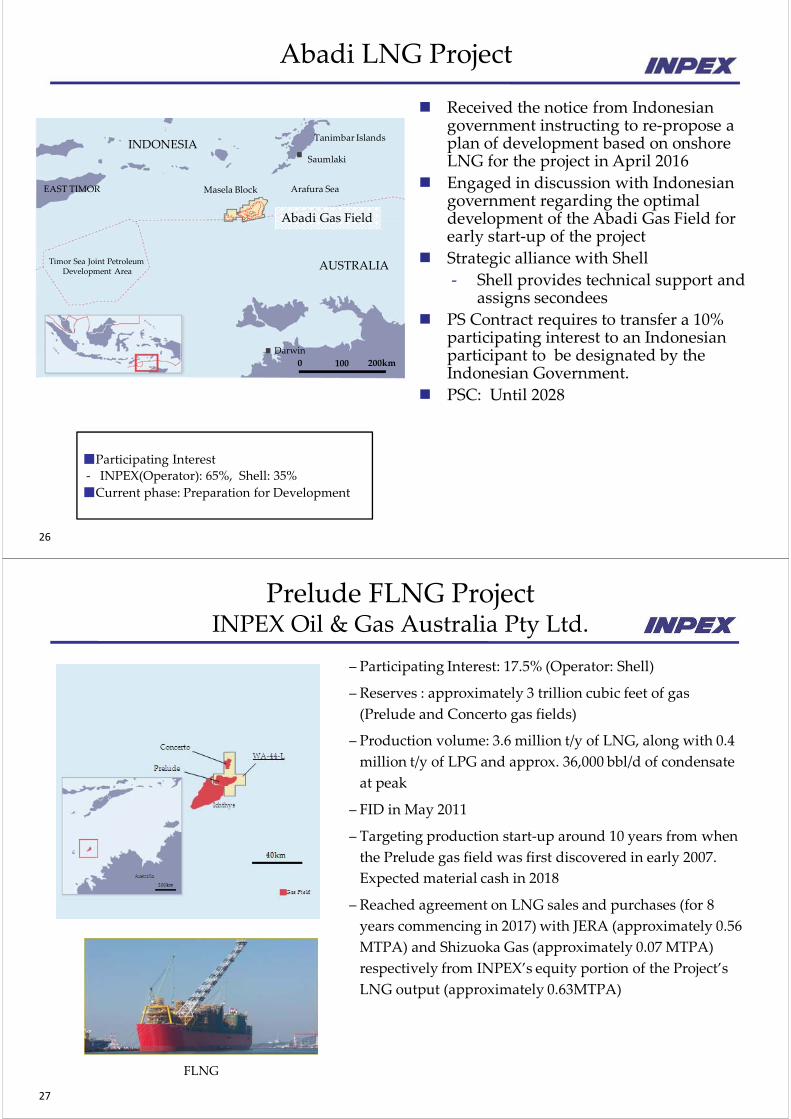
Abadi LNG Project
0 200km100
EAST TIMOR Masela Block
Saumlaki
Tanimbar Islands
Abadi Gas Field
Arafura Sea
AUSTRALIATimor Sea Joint PetroleumDevelopment Area
Darwin
INDONESIA
Received the notice from Indonesian government instructing to re‐propose a plan of development based on onshore LNG for the project in April 2016
Engaged in discussion with Indonesian government regarding the optimal development of the Abadi Gas Field for early start‐up of the project
Strategic alliance with Shell
‐ Shell provides technical support and assigns secondees
PS Contract requires to transfer a 10% participating interest to an Indonesian participant to be designated by the Indonesian Government.
PSC: Until 2028
■Participating Interest
‐ INPEX(Operator): 65%, Shell: 35%
■Current phase: Preparation for Development
27
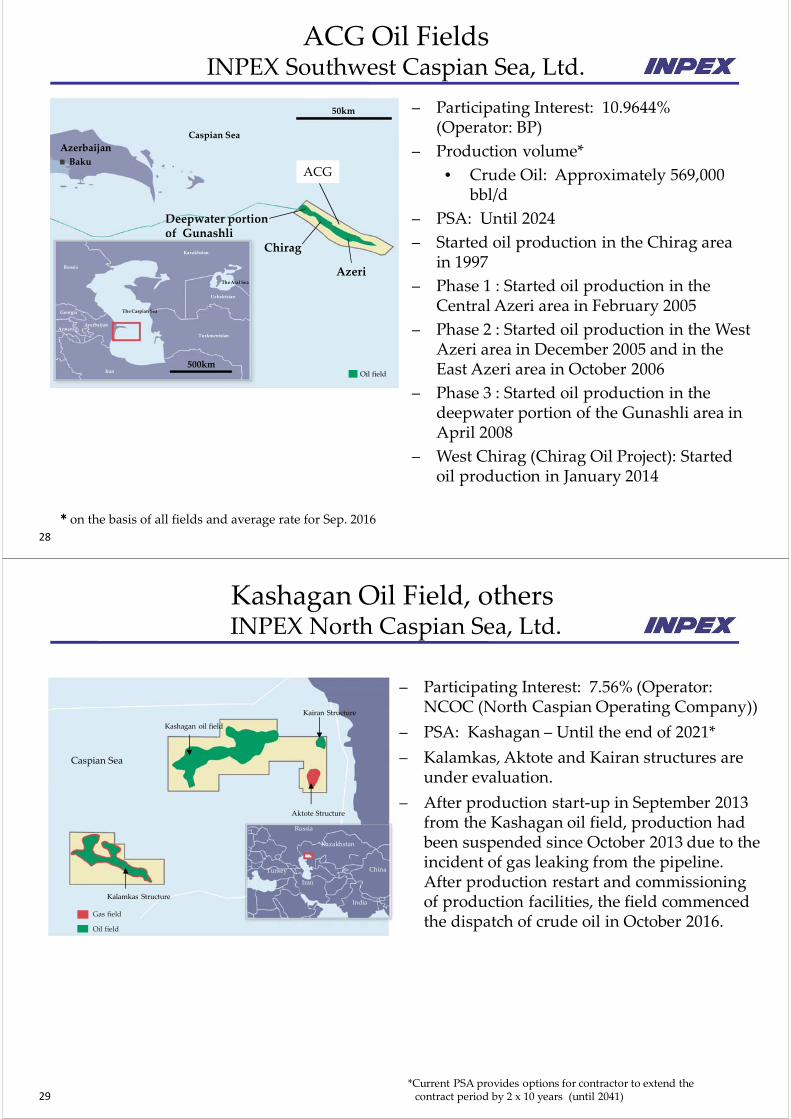
– Participating Interest: 17.5% (Operator: Shell)
– Reserves : approximately 3 trillion cubic feet of gas
(Prelude and Concerto gas fields)
– Production volume: 3.6 million t/y of LNG, along with 0.4
million t/y of LPG and approx. 36,000 bbl/d of condensate
at peak
– FID in May 2011
– Targeting production start‐up around 10 years from when
the Prelude gas field was first discovered in early 2007.
Expected material cash in 2018
– Reached agreement on LNG sales and purchases (for 8
years commencing in 2017) with JERA (approximately 0.56
MTPA) and Shizuoka Gas (approximately 0.07 MTPA)
respectively from INPEX’s equity portion of the Project’s
LNG output (approximately 0.63MTPA)
FLNG
Prelude FLNG ProjectINPEX Oil & Gas Australia Pty Ltd.
28
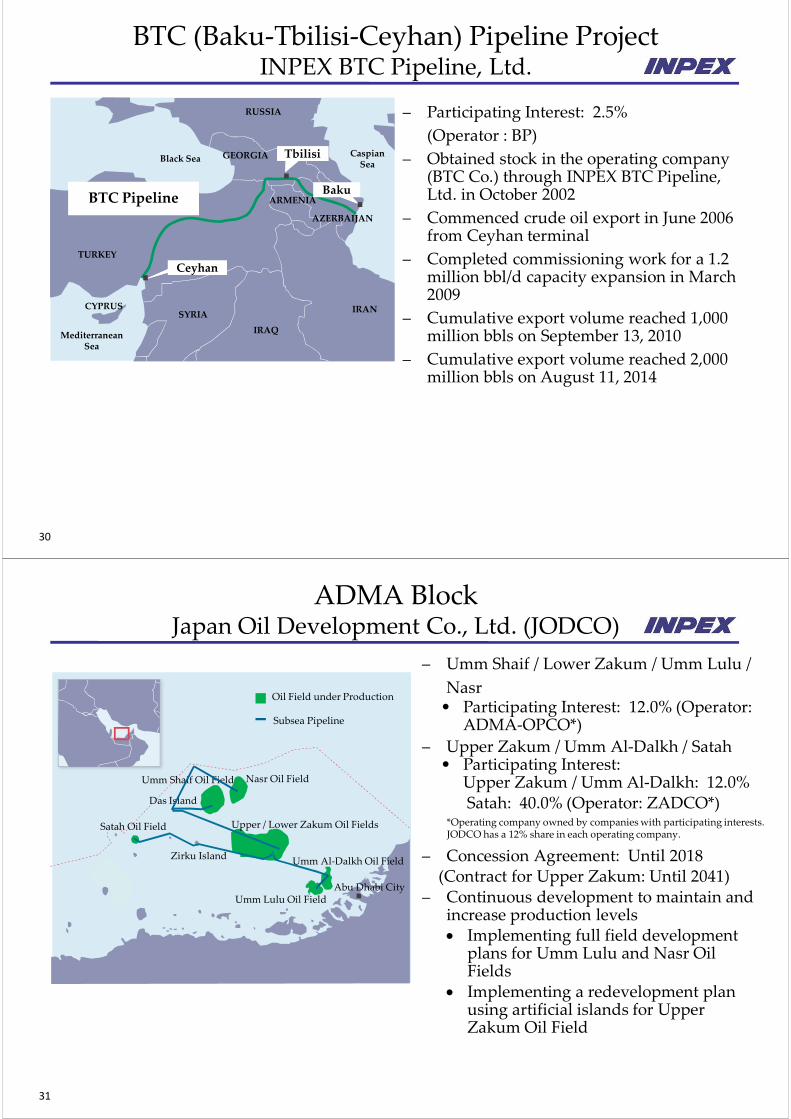
ACG Oil FieldsINPEX Southwest Caspian Sea, Ltd.
– Participating Interest: 10.9644% (Operator: BP)
– Production volume*
• Crude Oil: Approximately 569,000 bbl/d
– PSA: Until 2024
– Started oil production in the Chirag area in 1997
– Phase 1 : Started oil production in the Central Azeri area in February 2005
– Phase 2 : Started oil production in the West Azeri area in December 2005 and in the East Azeri area in October 2006
– Phase 3 : Started oil production in the deepwater portion of the Gunashli area in April 2008
– West Chirag (Chirag Oil Project): Started oil production in January 2014
ACGACG
50km
500kmOil field
Azerbaijan
Baku
Caspian Sea
Deepwater portionof Gunashli
Chirag
Azeri
Kazakhstan
The Aral Sea
Uzbekistan
Russia
Turkmenistan
ArmeniaAzerbaijan
Georgia
Iran
The Caspian Sea
* on the basis of all fields and average rate for Sep. 2016
29
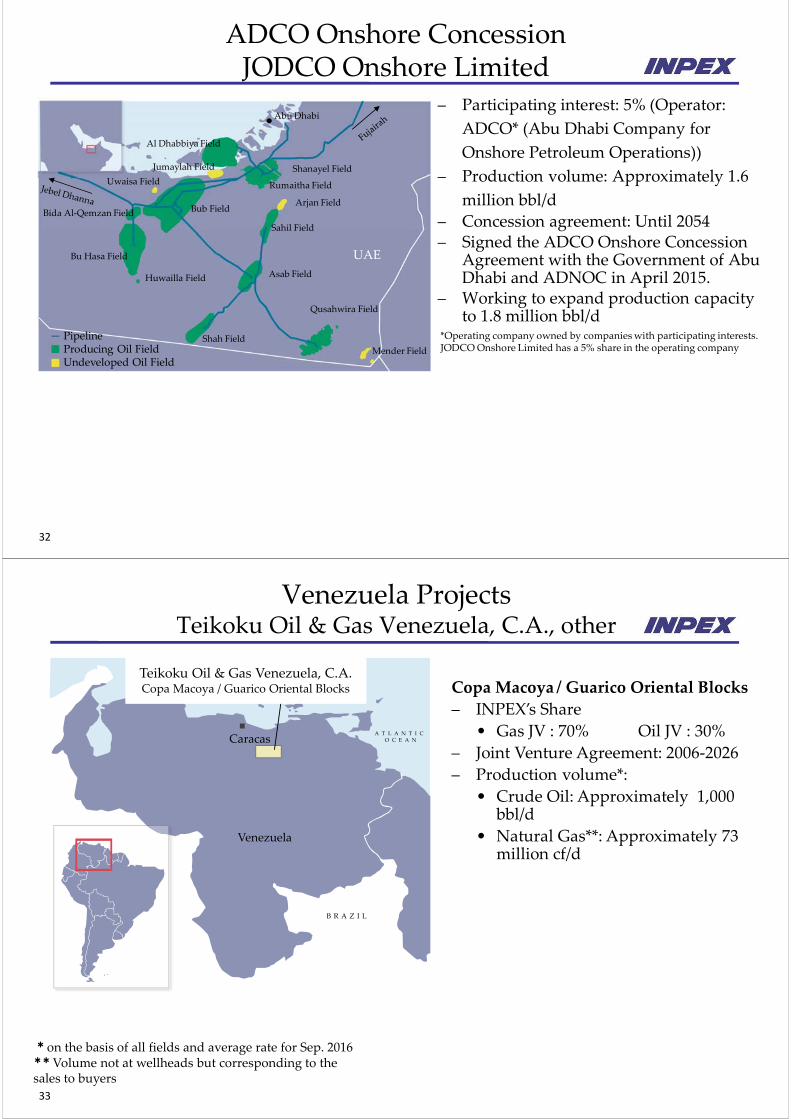
Kashagan Oil Field, othersINPEX North Caspian Sea, Ltd.
*Current PSA provides options for contractor to extend the contract period by 2 x 10 years (until 2041)
Kalamkas Structure
Caspian Sea
Kashagan oil field
Kairan Structure
Aktote Structure
Russia
Kazakhstan
ChinaTurkey
Iran
India
Gas field
Oil field
– Participating Interest: 7.56% (Operator: NCOC (North Caspian Operating Company))
– PSA: Kashagan – Until the end of 2021*
– Kalamkas, Aktote and Kairan structures are under evaluation.
– After production start‐up in September 2013 from the Kashagan oil field, production had been suspended since October 2013 due to the incident of gas leaking from the pipeline. After production restart and commissioning of production facilities, the field commenced the dispatch of crude oil in October 2016.
30
BTC (Baku‐Tbilisi‐Ceyhan) Pipeline ProjectINPEX BTC Pipeline, Ltd.
BTC PipelineBTC Pipeline
TbilisiTbilisiGEORGIA
TURKEY
SYRIA
IRAQ
IRAN
CeyhanCeyhan
CYPRUS
BakuBaku
Black Sea
RUSSIA
Caspian Sea
Mediterranean Sea
AZERBAIJAN
ARMENIA
– Participating Interest: 2.5%
(Operator : BP)
– Obtained stock in the operating company (BTC Co.) through INPEX BTC Pipeline, Ltd. in October 2002
– Commenced crude oil export in June 2006 from Ceyhan terminal
– Completed commissioning work for a 1.2 million bbl/d capacity expansion in March 2009
– Cumulative export volume reached 1,000million bbls on September 13, 2010
– Cumulative export volume reached 2,000 million bbls on August 11, 2014
31
ADMA BlockJapan Oil Development Co., Ltd. (JODCO)
– Umm Shaif / Lower Zakum / Umm Lulu /
Nasr• Participating Interest: 12.0% (Operator:
ADMA‐OPCO*)
– Upper Zakum / Umm Al‐Dalkh / Satah• Participating Interest:
Upper Zakum / Umm Al‐Dalkh: 12.0%Satah: 40.0% (Operator: ZADCO*)
– Concession Agreement: Until 2018(Contract for Upper Zakum: Until 2041)
– Continuous development to maintain and increase production levels Implementing full field development
plans for Umm Lulu and Nasr Oil Fields
Implementing a redevelopment plan using artificial islands for Upper Zakum Oil Field
*Operating company owned by companies with participating interests. JODCO has a 12% share in each operating company.
Oil Field under Production
Subsea Pipeline
Satah Oil Field
Zirku Island
Upper / Lower Zakum Oil Fields
Umm Al‐Dalkh Oil Field
Nasr Oil Field
Abu Dhabi City
Umm Shaif Oil Field
Das Island
Umm Lulu Oil Field
32
ADCO Onshore ConcessionJODCO Onshore Limited
– Participating interest: 5% (Operator:
ADCO* (Abu Dhabi Company for
Onshore Petroleum Operations))
– Production volume: Approximately 1.6
million bbl/d
– Concession agreement: Until 2054– Signed the ADCO Onshore Concession
Agreement with the Government of Abu Dhabi and ADNOC in April 2015.
– Working to expand production capacity to 1.8 million bbl/d
*Operating company owned by companies with participating interests. JODCO Onshore Limited has a 5% share in the operating company
PipelineProducing Oil FieldUndeveloped Oil Field
Mender Field
Qusahwira Field
Shah Field
Asab FieldHuwailla Field
Bu Hasa Field
Bida Al‐Qemzan Field Bub Field
Sahil Field
Arjan Field
Shanayel Field
Rumaitha Field
Jumaylah Field
Uwaisa Field
Al Dhabbiya Field
Abu Dhabi
UAE
33
Venezuela ProjectsTeikoku Oil & Gas Venezuela, C.A., other
Copa Macoya / Guarico Oriental Blocks
– INPEX’s Share
• Gas JV : 70% Oil JV : 30%
– Joint Venture Agreement: 2006‐2026
– Production volume*:
• Crude Oil: Approximately 1,000 bbl/d
• Natural Gas**: Approximately 73 million cf/d
Caracas
Venezuela
Teikoku Oil & Gas Venezuela, C.A.Copa Macoya / Guarico Oriental BlocksTeikoku Oil & Gas Venezuela, C.A.Copa Macoya / Guarico Oriental Blocks
B R A Z I L
A T L A N T I C O C E A N
* on the basis of all fields and average rate for Sep. 2016**Volume not at wellheads but corresponding to the sales to buyers

34
Brazil ProjectsFrade Japão Petróleo Limitada (FJPL) other
Atlantic Ocean
BM‐ES‐23BM‐ES‐23
0 100km
Frade BlockFrade BlockBrazil
Brazil
Campos
Macaé
Rio de Janeiro
Vitória
Oil and Gas field
Frade Japão Petróleo Limitada (FJPL)
– FJPL’s Participating Interest*: 18.3%
(Operator : Chevron)*FJPL is an equity method affiliate of INPEX.
(INPEX owns a 37.5% share of FJPL through a subsidiary)
– Production volume**:
• Crude Oil: Approximately 22,000 bbl/d
• Natural Gas***: Approximately
2 million scf/d
– Concession Agreement: Until 2025
BM‐ES‐23
– Participating Interest: 15%
– Under Exploration (Appraisal)
** on the basis of all fields and average rate for Sep. 2016
*** Volume not at wellheads but corresponding to the sales to buyers
35
Canada Shale Gas ProjectINPEX Gas British Columbia Ltd.
Central Azeri Platform
Hydraulic fracturing site
‐ Participating Interest: 40%*(Operator : Nexen)
* INPEX Gas British Columbia Ltd. (Equity ratio: INPEX 45.09%, JOGMEC 44.89%, Canadian Subsidiary of JGC Corporation 10.02%).
‐ Production Volume**:
Natural Gas***: Approximately 79 million
scf/d
‐ Concession Agreement Calgary
Vancouver
Victoria
Prince RupertEdmonton
British ColumbiaAlberta
Shale Gas Assets
200km
Canada
** on the basis of all fields and average daily volume for the six months ended June 30, 2016
*** Volume not at wellheads but corresponding to the sales to buyers
36
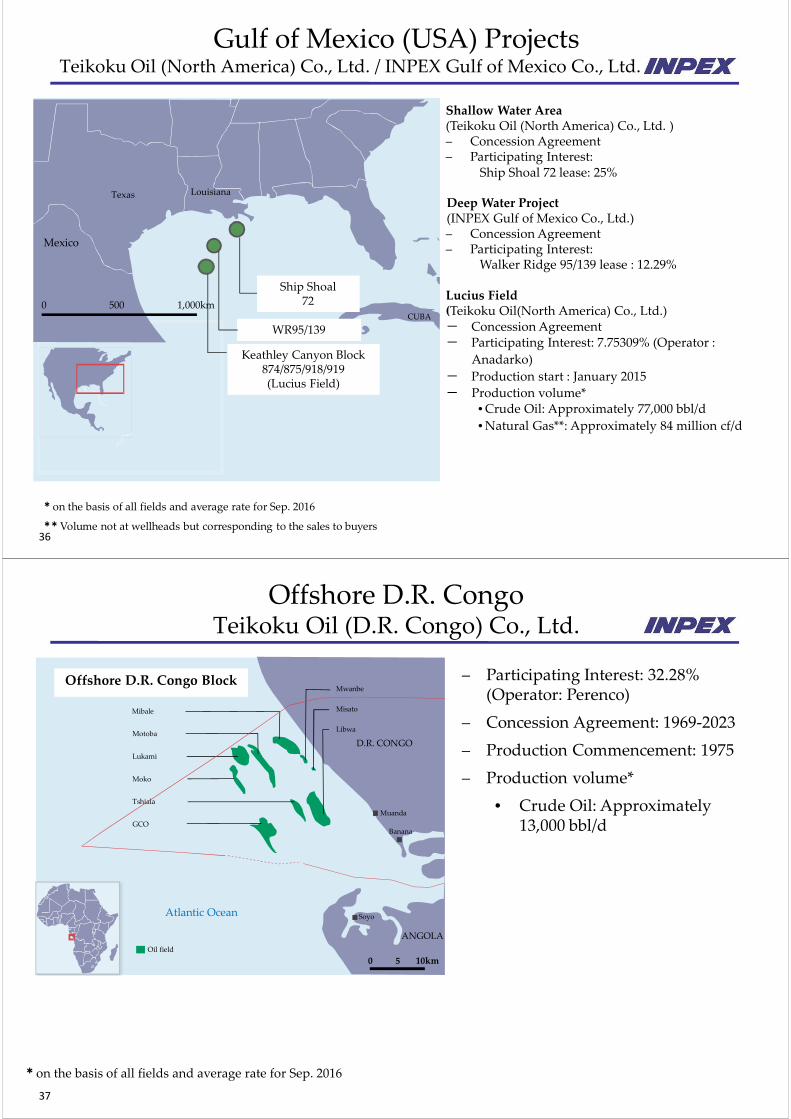
Gulf of Mexico (USA) ProjectsTeikoku Oil (North America) Co., Ltd. / INPEX Gulf of Mexico Co., Ltd.
Ship Shoal72
Ship Shoal72
WR95/139 WR95/139 CUBA
0 500 1,000km
Texas
Mexico
Louisiana
Keathley Canyon Block874/875/918/919(Lucius Field)
Keathley Canyon Block874/875/918/919(Lucius Field)
Shallow Water Area(Teikoku Oil (North America) Co., Ltd. )– Concession Agreement– Participating Interest:
Ship Shoal 72 lease: 25%
Deep Water Project (INPEX Gulf of Mexico Co., Ltd.)– Concession Agreement– Participating Interest:
Walker Ridge 95/139 lease : 12.29%
Lucius Field(Teikoku Oil(North America) Co., Ltd.)- Concession Agreement- Participating Interest: 7.75309% (Operator :
Anadarko)
- Production start : January 2015
- Production volume*•Crude Oil: Approximately 77,000 bbl/d
•Natural Gas**: Approximately 84 million cf/d
* on the basis of all fields and average rate for Sep. 2016
**Volume not at wellheads but corresponding to the sales to buyers
37
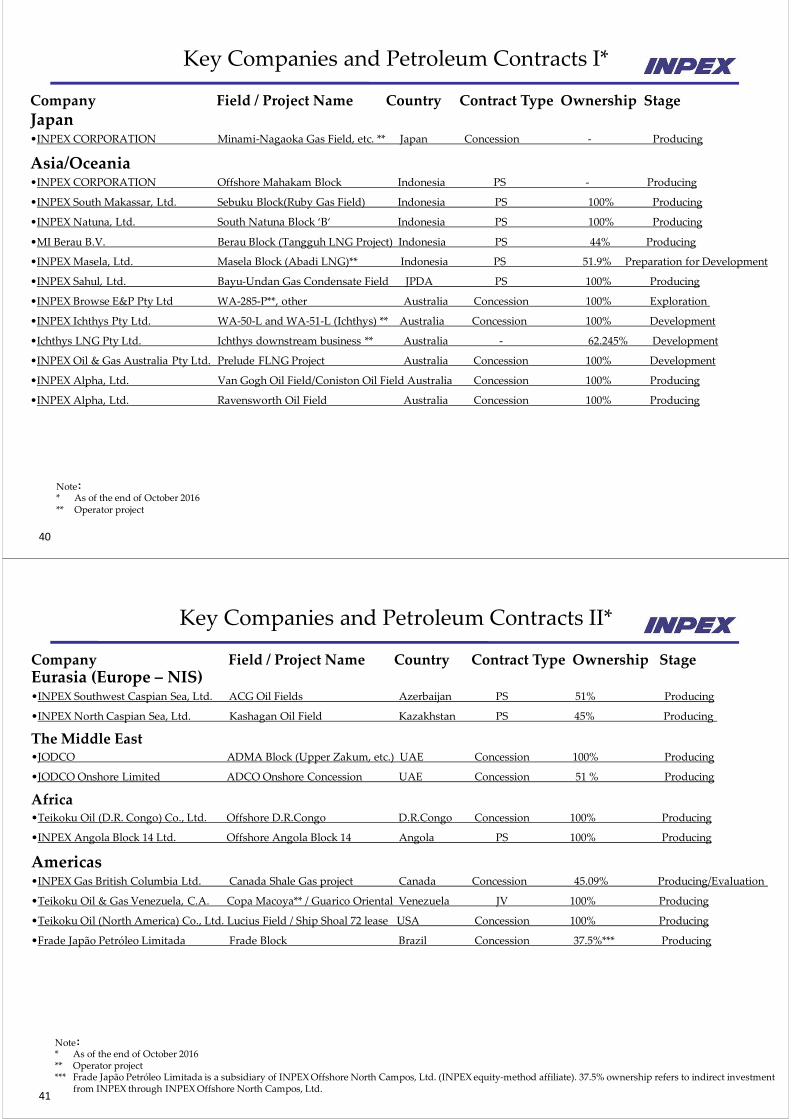
Offshore D.R. CongoTeikoku Oil (D.R. Congo) Co., Ltd.
* on the basis of all fields and average rate for Sep. 2016
D.R. CONGO
Muanda
Banana
Soyo
ANGOLA
Atlantic Ocean
Motoba
Lukami
Moko
GCO
Mwanbe
Misato
Libwa
Mibale
Tshiala
Offshore D.R. Congo BlockOffshore D.R. Congo Block
Oil field
0 10km5
– Participating Interest: 32.28%(Operator: Perenco)
– Concession Agreement: 1969‐2023
– Production Commencement: 1975
– Production volume*
• Crude Oil: Approximately 13,000 bbl/d

38
Offshore Angola Block 14
Rep. of Congo
Atlantic Ocean
100km
D.R. Congo
Republic of Angola
Offshore Angola Block 14INPEX Angola Block 14 Ltd.
– Participating Interest: 9.99%(Operator: Chevron)
– Production volume*
• Crude Oil: Approximately 106,000 bbl/d
– PSC: Until 2035
* on the basis of all fields and average rate for Sep. 2016
39
Sakhalin ISakhalin Oil and Gas Development Co., Ltd.
– Sakhalin Oil and Gas Development Co., Ltd. (SODECO):INPEX owns a share of approximately 6.08% in SODECO
– SODECO’s Participating Interest: 30.0%
– Production volume*:
• Crude Oil and condensate: Approximately 198,000 bbl/d
• Natural Gas: Approximately 660 million cf/d
– Operator: ExxonMobil
– PSA: In December 2001 the project proceeded to the 20‐year development phase
– Commenced production from Chayvo Structure in October 2005; commenced crude oil export in October 2006
– Commenced production from Odoptu Structure in September 2010
– The Berkut platform at the Arkutun‐Dagi field successfully installed in June 2014
– Commenced production from Arkutun‐Dagi Structure in January 2015
– Currently supplying natural gas to Russian domestic market
0 10km5
ChayvoStructure
Arkutun‐DagiStructure
OdoptuStructure
Val
Sakhalin Island
Gas field
Oil Field
*on the basis of all fields and average rate for Sep. 2016
40
Japan•INPEX CORPORATION Minami‐Nagaoka Gas Field, etc. ** Japan Concession ‐ Producing
Asia/Oceania•INPEX CORPORATION Offshore Mahakam Block Indonesia PS ‐ Producing
•INPEX South Makassar, Ltd. Sebuku Block(Ruby Gas Field) Indonesia PS 100% Producing
•INPEX Natuna, Ltd. South Natuna Block ‘B‘ Indonesia PS 100% Producing
•MI Berau B.V. Berau Block (Tangguh LNG Project) Indonesia PS 44% Producing
•INPEX Masela, Ltd. Masela Block (Abadi LNG)** Indonesia PS 51.9% Preparation for Development
•INPEX Sahul, Ltd. Bayu‐Undan Gas Condensate Field JPDA PS 100% Producing
•INPEX Browse E&P Pty Ltd WA‐285‐P**, other Australia Concession 100% Exploration
•INPEX Ichthys Pty Ltd. WA‐50‐L and WA‐51‐L (Ichthys) ** Australia Concession 100% Development
•Ichthys LNG Pty Ltd. Ichthys downstream business ** Australia ‐ 62.245% Development
•INPEX Oil & Gas Australia Pty Ltd. Prelude FLNG Project Australia Concession 100% Development
•INPEX Alpha, Ltd. Van Gogh Oil Field/Coniston Oil Field Australia Concession 100% Producing
•INPEX Alpha, Ltd. Ravensworth Oil Field Australia Concession 100% Producing
Key Companies and Petroleum Contracts I*
Company Field / Project Name Country Contract Type Ownership Stage
Note:* As of the end of October 2016** Operator project
41
Eurasia (Europe – NIS)•INPEX Southwest Caspian Sea, Ltd. ACG Oil Fields Azerbaijan PS 51% Producing
•INPEX North Caspian Sea, Ltd. Kashagan Oil Field Kazakhstan PS 45% Producing
The Middle East•JODCO ADMA Block (Upper Zakum, etc.) UAE Concession 100% Producing
•JODCO Onshore Limited ADCO Onshore Concession UAE Concession 51 % Producing
Africa•Teikoku Oil (D.R. Congo) Co., Ltd. Offshore D.R.Congo D.R.Congo Concession 100% Producing
•INPEX Angola Block 14 Ltd. Offshore Angola Block 14 Angola PS 100% Producing
Americas•INPEX Gas British Columbia Ltd. Canada Shale Gas project Canada Concession 45.09% Producing/Evaluation
•Teikoku Oil & Gas Venezuela, C.A. Copa Macoya** / Guarico Oriental Venezuela JV 100% Producing
•Teikoku Oil (North America) Co., Ltd. Lucius Field / Ship Shoal 72 lease USA Concession 100% Producing
•Frade Japão Petróleo Limitada Frade Block Brazil Concession 37.5%*** Producing
Note:* As of the end of October 2016** Operator project*** Frade Japão Petróleo Limitada is a subsidiary of INPEX Offshore North Campos, Ltd. (INPEX equity‐method affiliate). 37.5% ownership refers to indirect investment
from INPEX through INPEX Offshore North Campos, Ltd.
Company Field / Project Name Country Contract Type Ownership Stage
Key Companies and Petroleum Contracts II*
Others
43
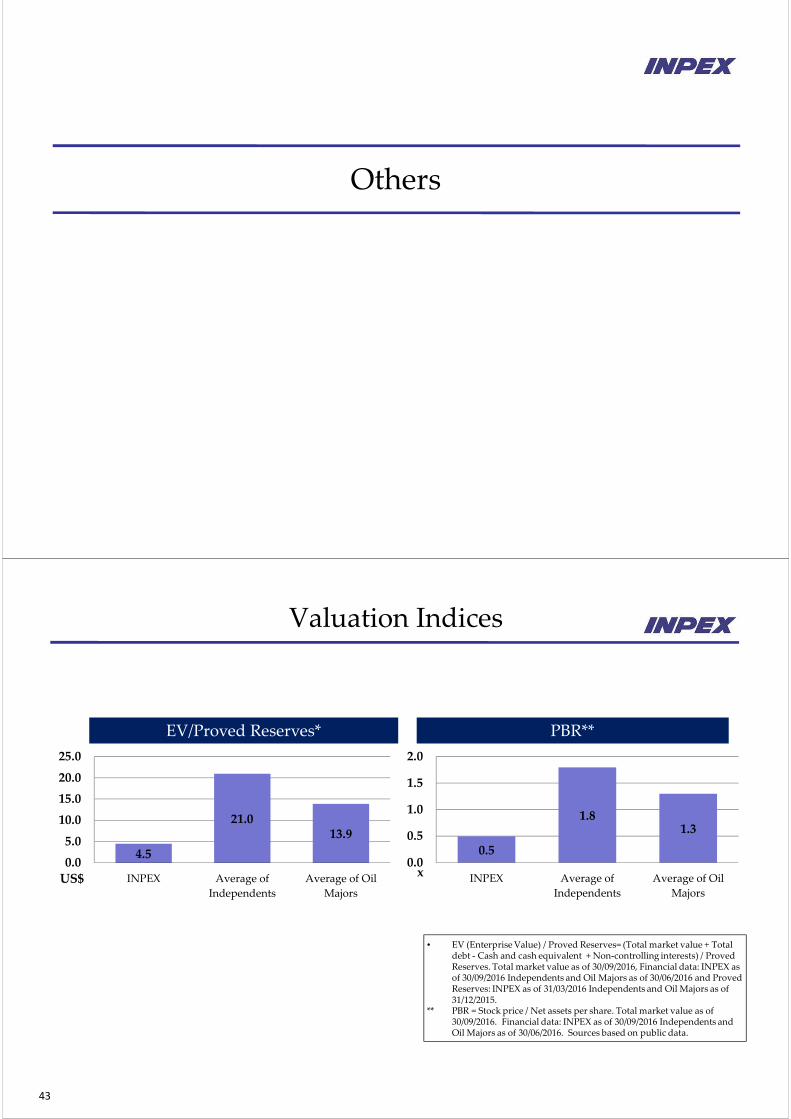
Valuation Indices
• EV (Enterprise Value) / Proved Reserves= (Total market value + Totaldebt ‐ Cash and cash equivalent + Non‐controlling interests) / Proved Reserves. Total market value as of 30/09/2016, Financial data: INPEX as of 30/09/2016 Independents and Oil Majors as of 30/06/2016 and Proved Reserves: INPEX as of 31/03/2016 Independents and Oil Majors as of 31/12/2015.
** PBR = Stock price / Net assets per share. Total market value as of 30/09/2016. Financial data: INPEX as of 30/09/2016 Independents and Oil Majors as of 30/06/2016. Sources based on public data.
EV/Proved Reserves* PBR**
4.5
21.013.9
0.0
5.0
10.0
15.0
20.0
25.0
INPEX Average of
Independents
Average of Oil
Majors
US$
0.5
1.81.3
0.0
0.5
1.0
1.5
2.0
INPEX Average of
Independents
Average of Oil
Majors
x
44
1. Continuous Enhancement of E&P Activities→Achieve a net production volume of 1 million boed by the early 2020s
2. Strengthening Gas Supply Chain→Achieve a domestic gas supply volume of 2.5 billion m3/year in the early 2020s
3. Reinforcement of Renewable Energy Initiatives→Promote efforts to commercialize renewable energies and reinforce R&D activities for the next generation
Three Growth Targets and Key Initiatives until start‐up of Ichthys LNG Project
1. Securing / Developing Human Resources and Building Efficient Organizational Structure
2. Investment for Growth and Return for Shareholders3. Responsible Management as a Global Company
Medium‐ to Long‐Term Vision*
Three Management Policies and Our Vision
* Announcement in May 2012
45
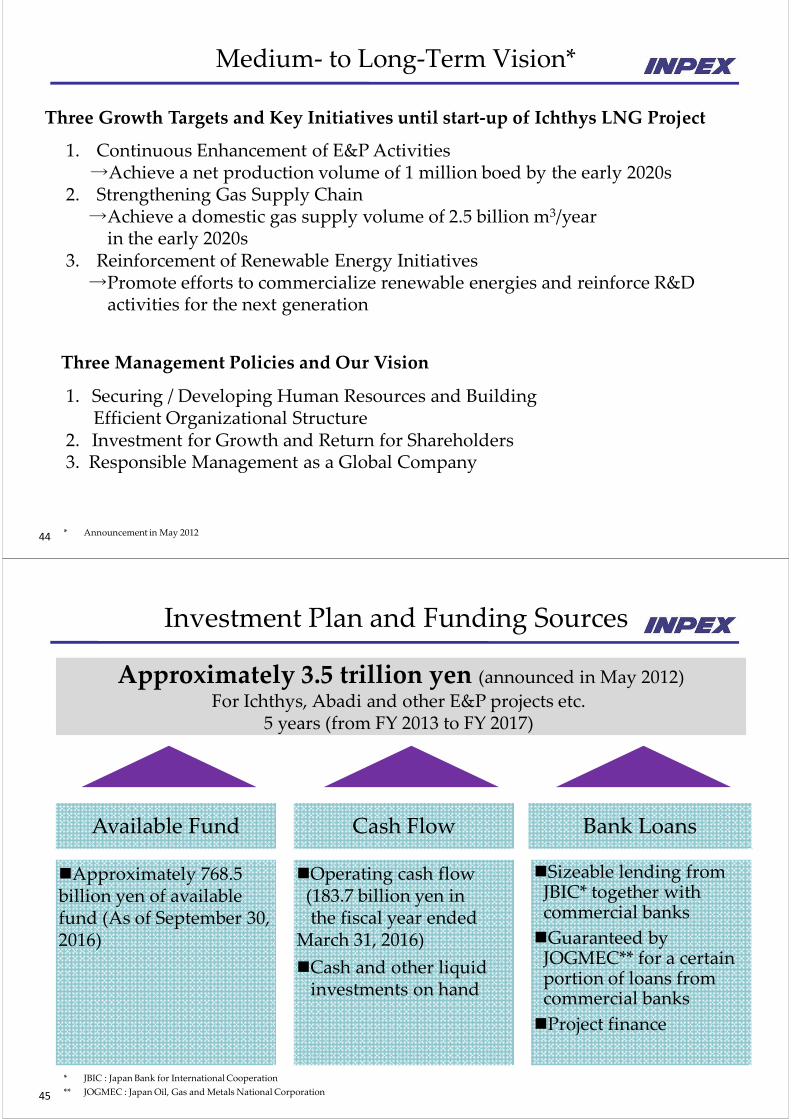
Investment Plan and Funding Sources
Approximately 768.5 billion yen of available fund (As of September 30, 2016)
Cash Flow Bank LoansAvailable Fund
Sizeable lending from JBIC* together withcommercial banks
Guaranteed byJOGMEC** for a certain portion of loans from commercial banks
Project finance
Operating cash flow (183.7 billion yen in the fiscal year ended
March 31, 2016)
Cash and other liquid investments on hand
Approximately 3.5 trillion yen (announced in May 2012)
For Ichthys, Abadi and other E&P projects etc. 5 years (from FY 2013 to FY 2017)
* JBIC : Japan Bank for International Cooperation
** JOGMEC : Japan Oil, Gas and Metals National Corporation
46
Finance Strategies
Advantage of low‐cost funding
Maintain funding capability to ensure necessary investments, which are for major projects such as Ichthys and Abadi
Maintain strong balance sheet to enable continuous investments in potential projects in the future
Long‐term target financial leverage
Equity Ratio : 50% or higher
Net Debt / Total Capital Employed Ratio: 20% or less
Maintain strong balance sheet to achieve financial stability
and secure further debt capacity
Leverage relationships with governmental financial
institutions, such as JBIC and JOGMEC, to fund development
costs
47
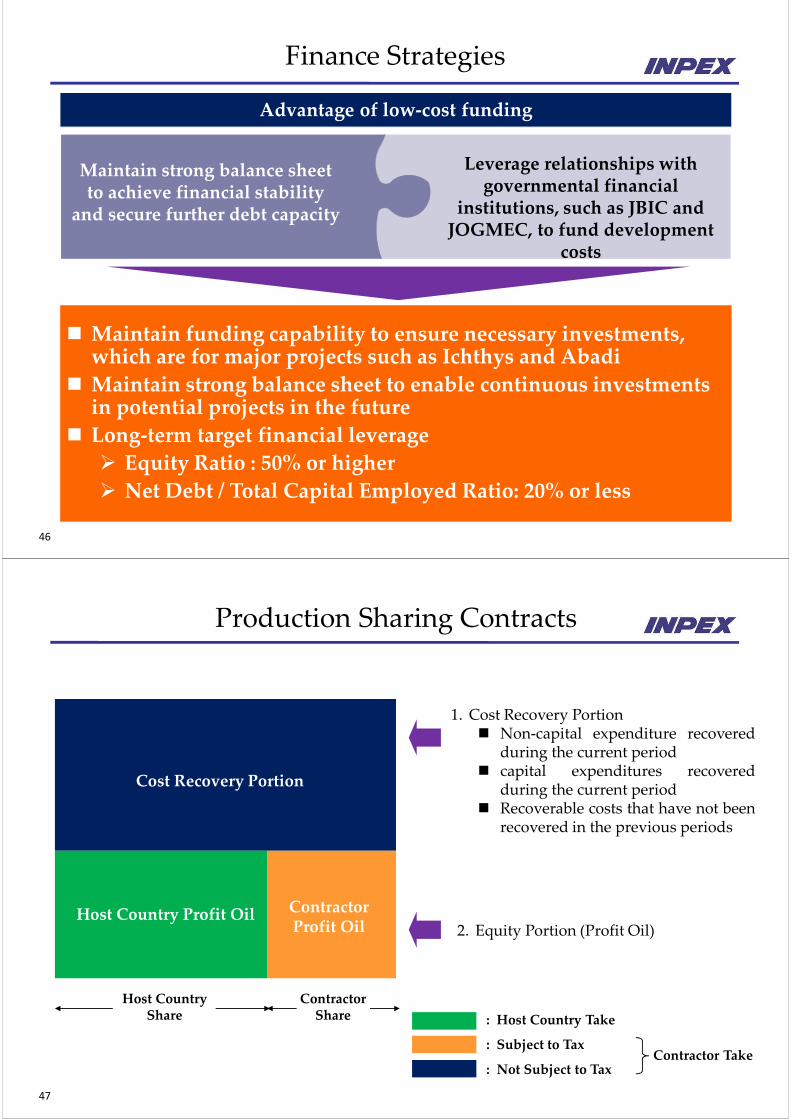
Production Sharing Contracts
: Host Country Take
: Subject to Tax
: Not Subject to Tax
2. Equity Portion (Profit Oil)
Contractor Take
Host CountryShare
ContractorShare
Cost Recovery Portion
Host Country Profit Oil Contractor Profit Oil
1. Cost Recovery Portion Non‐capital expenditure recovered
during the current period capital expenditures recovered
during the current period Recoverable costs that have not been
recovered in the previous periods
48
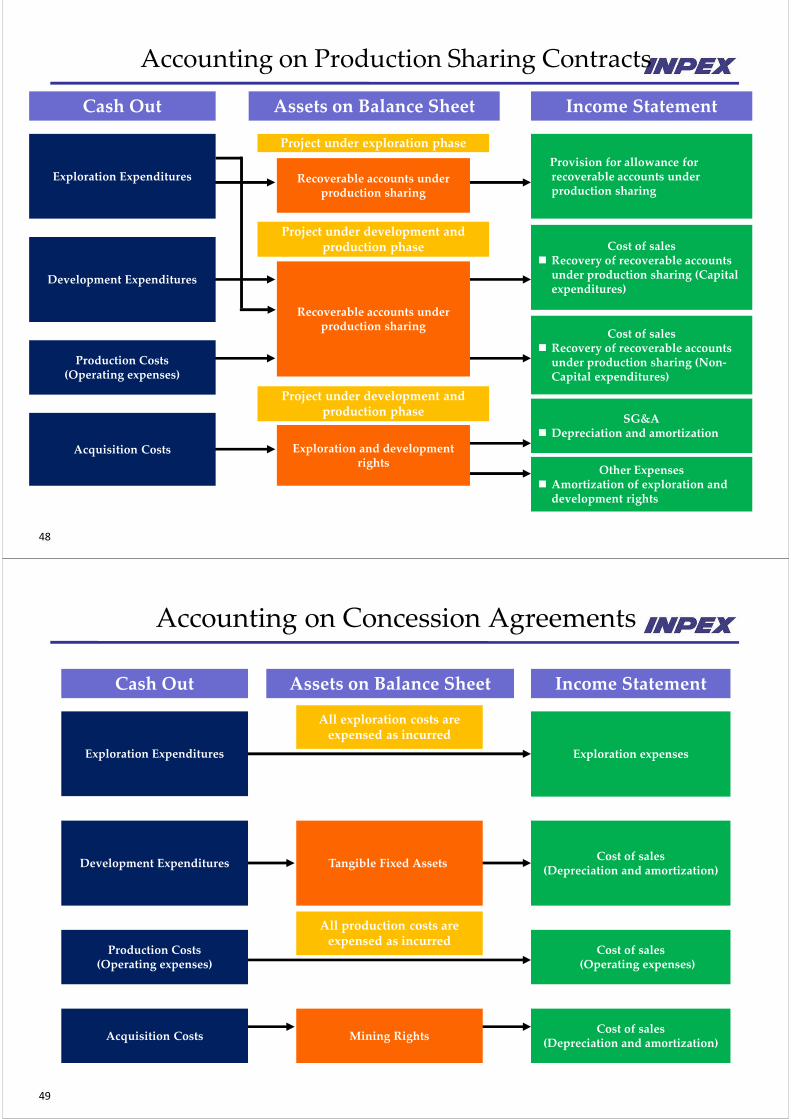
Accounting on Production Sharing Contracts
Cash Out Assets on Balance Sheet Income Statement
SG&A Depreciation and amortization
Cost of sales Recovery of recoverable accounts under production sharing (Capital expenditures)
Project under exploration phase
Provision for allowance for recoverable accounts under production sharing
Project under development and production phase
Project under development and production phase
Other Expenses Amortization of exploration and development rights
Recoverable accounts under production sharing
Recoverable accounts under production sharing
Exploration and development rights
Acquisition Costs
Production Costs(Operating expenses)
Development Expenditures
Exploration Expenditures
Cost of sales Recovery of recoverable accounts under production sharing (Non‐Capital expenditures)
49
Accounting on Concession Agreements
Cash Out
Production Costs(Operating expenses)
Exploration Expenditures
Tangible Fixed Assets
Income Statement
Exploration expenses
Cost of sales(Depreciation and amortization)
Cost of sales(Operating expenses)
Cost of sales(Depreciation and amortization)
All exploration costs are expensed as incurred
Assets on Balance Sheet
All production costs are expensed as incurred
Acquisition Costs
Development Expenditures
Mining Rights
50
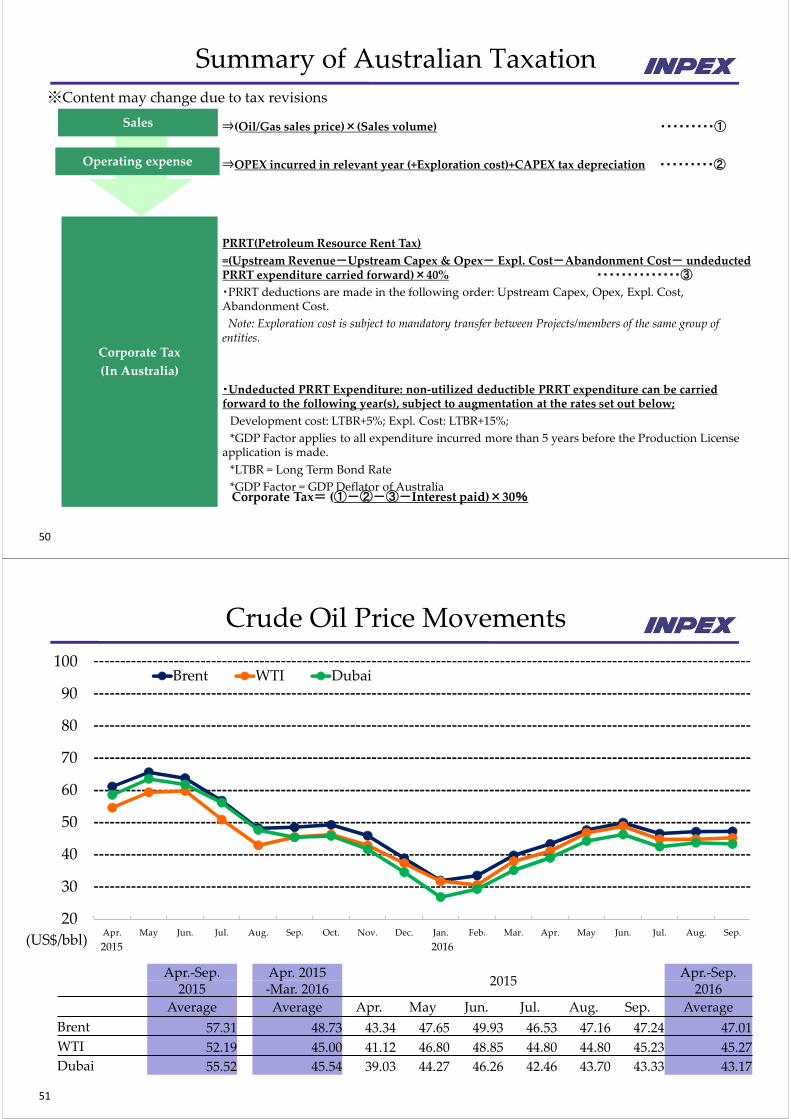
PRRT(Petroleum Resource Rent Tax)
=(Upstream Revenue-Upstream Capex & Opex- Expl. Cost-Abandonment Cost- undeductedPRRT expenditure carried forward)×40% ・・・・・・・・・・・・・・③
・PRRT deductions are made in the following order: Upstream Capex, Opex, Expl. Cost, Abandonment Cost.
Note: Exploration cost is subject to mandatory transfer between Projects/members of the same group of entities.
・Undeducted PRRT Expenditure: non‐utilized deductible PRRT expenditure can be carried forward to the following year(s), subject to augmentation at the rates set out below;
Development cost: LTBR+5%; Expl. Cost: LTBR+15%;
*GDP Factor applies to all expenditure incurred more than 5 years before the Production License application is made.
*LTBR = Long Term Bond Rate
*GDP Factor = GDP Deflator of Australia
Summary of Australian Taxation
⇒(Oil/Gas sales price)×(Sales volume) ・・・・・・・・・①
⇒OPEX incurred in relevant year (+Exploration cost)+CAPEX tax depreciation ・・・・・・・・・②
Corporate Tax= (①-②-③-Interest paid)×30%
Sales
Operating expense
Corporate Tax
(In Australia)
※Content may change due to tax revisions
51
Crude Oil Price Movements
20
30
40
50
60
70
80
90
100
Apr. May Jun. Jul. Aug. Sep. Oct. Nov. Dec. Jan. Feb. Mar. Apr. May Jun. Jul. Aug. Sep.
Brent WTI Dubai
(US$/bbl)2015 2016
Apr.‐Sep. Apr. 20152015
Apr.‐Sep.2015 ‐Mar. 2016 2016
Average Average Apr. May Jun. Jul. Aug. Sep. Average
Brent 57.31 48.73 43.34 47.65 49.93 46.53 47.16 47.24 47.01
WTI 52.19 45.00 41.12 46.80 48.85 44.80 44.80 45.23 45.27
Dubai 55.52 45.54 39.03 44.27 46.26 42.46 43.70 43.33 43.17