ins regulatory insurance services, inc. regulatory ... · pdf filehiladelphia, pa 19147 : d....
TRANSCRIPT
INS Regulatory Insurance Services, Inc. Regulatory Consultants
New Market Rodney BuildingSuite 206 2nd Floor 419 S. 2nd Street 841 Silver Lake Blvd. Philadelphia, PA 19147 Dover, DE 19904 Phone: (215) 625-2927 Phone: (302) 678-2444 Fax: (215) 625-8323 Fax: (302) 678-4822
The Honorable Howard Mills Superintendent New York Insurance Department 25 Beaver Street New York, New York 10004 February 3, 2006 Dear Superintendent,
The following summarizes the scope, procedures and results of our work undertaken in
connection with the joint investigation by the New York State Insurance Department and the New
York State Attorney General into certain activities of American International Group, Inc.
The report thereon is respectfully submitted.
Respectfully submitted,
Anthony C. Cardone, CPA, CFE INS Regulatory Insurance Services, Inc.

1
Table of Contents
I. IMPROPER BOOKING OF AUDIT PREMIUMS ON RETROSPECTIVELY RATED POLICIES.....................2
A. Estimation of the Correct Allocation of Premiums among Lines of Business and States......................................3 B. Estimation of Workers’ Compensation Premium Tax and RML Assessment Impact by State..............................4
II. IMPROPER BOOKING BY AIG OF DIRECT PREMIUMS FROM ITS WORKERS’ COMPENSATION LINE OF BUSINESS AS ASSUMED REINSURANCE PREMIUMS.........................................................................4
Summary .........................................................................................................................................................................6 Exhibit 1 AIG Adjustable Accounts Report for Division 50 and 55 by category............................................................7 Exhibit 2 Compound Annual Interest Rate Factors and Methodology..........................................................................10 Exhibit 3 Summary Premium and RML Impact with Interest Calculation by State ......................................................13
WC A: AIG Workers’ Compensation Premium Tax Impact by State ......................................................................16 WC B: AIG Workers’ Compensation Residual Market Assessment Impact by State ..............................................18
2
SCOPE OF RETENTION
INS Regulatory Insurance Services, Inc. (“INS-RIS” or the “consultants”) was retained by the
New York State Insurance Department (“NYSID”) to consult on its examination and joint
investigation with the Attorney General of the State of New York (“Attorney General”) of practices at
American International Group, Inc. (“AIG”) related to AIG’s workers’ compensation line of business
and the allegations in the Civil Complaint filed by the Attorney General and NYSID on May 26,
2005.
The review by INS-RIS focused on two areas:
1. Improper booking by AIG of Audit Premium and Refund Premium for retrospectively rated workers’ compensation policies; and
2. Improper booking by AIG of direct premiums from its workers’ compensation line of business as assumed reinsurance premiums.
In the course of its review, INS-RIS verified assumptions used by AIG in the recalculation of
improperly booked workers’ compensation premiums for all fifty states and the District of Columbia
(collectively “States”). INS-RIS also examined premium bookings by specific divisions of AIG from
1985 through 2005 for policies issued from 1985 through 1997. AIG provided premium tax rates and
residual market load rates. INS-RIS did not verify the accuracy of the rates. Guaranty fund
assessments and unfiled rating plans were not under the scope of retention.
I. IMPROPER BOOKING OF AUDIT PREMIUMS ON RETROSPECTIVELY RATED POLICIES:
In the case of certain policies, AIG improperly booked workers’ compensation premiums as
general liability premiums from at least 1985 through 1996. A number of current and former
employees were interviewed regarding the improper bookings. Generally, two main reasons were

3
cited by the employees for the improper bookings.
First, during the relevant period, AIG issued contracts that included coverage for three lines of
business - commercial auto, general liability and workers’ compensation. Due to the estimation
process used by AIG for the workers’ compensation portion of the contract, premium was improperly
allocated among the three lines of business or not booked to the proper line. Subsequent premium
adjustments were not booked to the proper lines due to the initial improper bookings.
Second, during the relevant period, AIG’s premium adjustments were severely backlogged
and often not done at all. When finally done, care was not taken to ensure proper booking to the
correct line of business.
A. Estimation of the Correct Allocation of Premiums among Lines of Business and States
AIG did not have data of sufficient detail to determine exactly how much premium was
booked to the wrong line of business or to allocate the premiums booked among the States. Thus, it
was determined that the most accurate method of estimating the correct allocation of premiums
among the three lines of business and the States was to base the allocations on loss data from the
relevant period. The loss data appeared to be stated accurately.
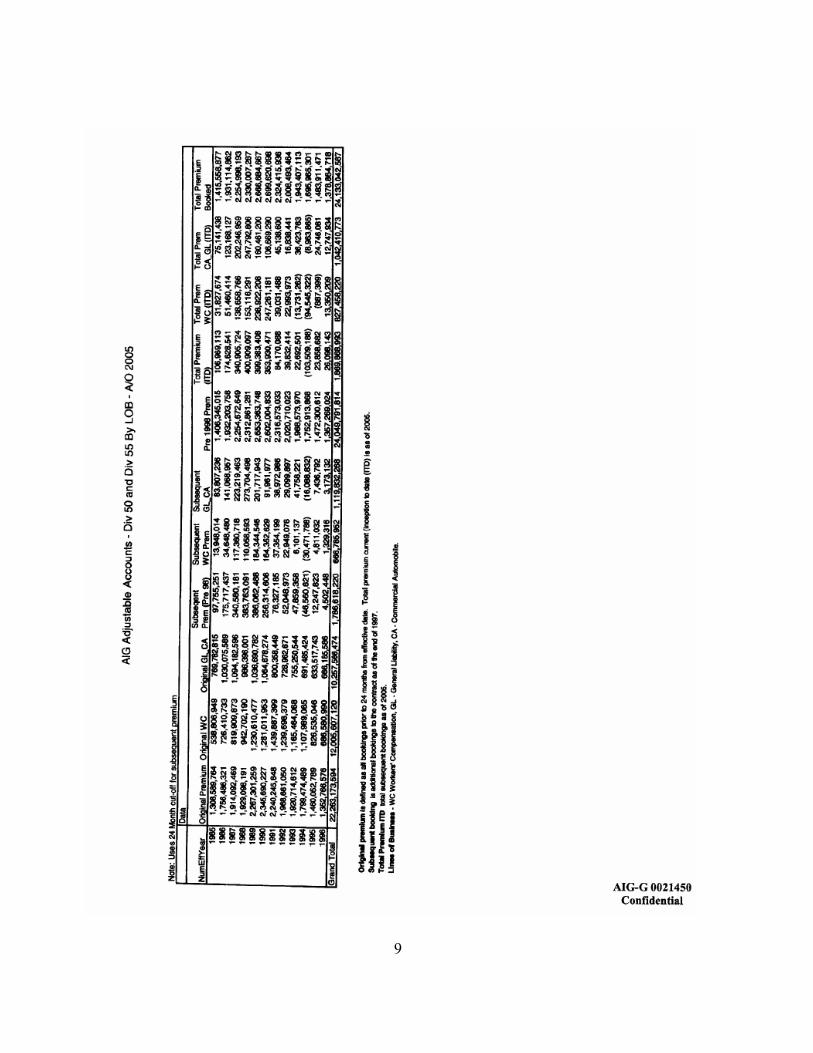
At the consultants’ request, based on corresponding loss data, AIG prepared a summary
report estimating the amount of premium that should have been allocated as workers’ compensation
during the relevant period. A summary of this estimation is appended to this Report as Exhibit 1.
The consultants tested the data and AIG’s assumptions and methods used to reallocate the premiums
and determined them to be reasonable.

4
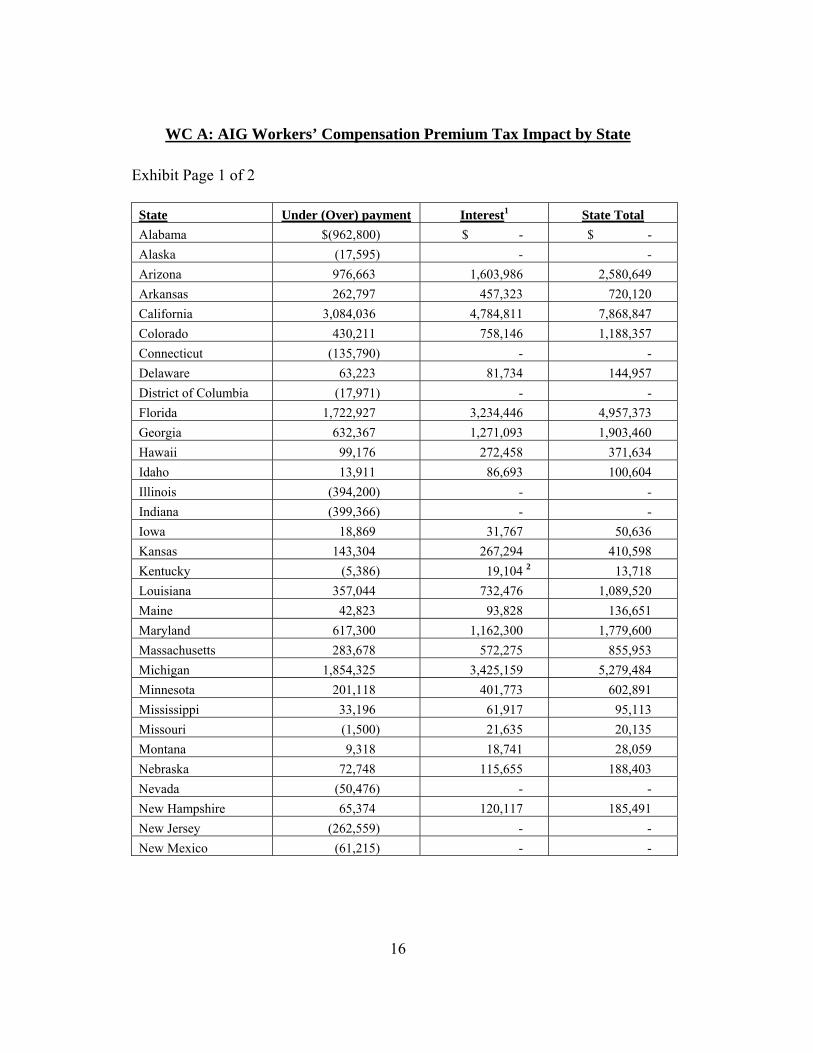
B. Estimation of Workers’ Compensation Premium Tax and RML Assessment Impact by State
Once premiums were reallocated among the three lines of business, the impact on premium
taxes and RML assessments for the States could be estimated. Rates used by AIG and the consultants
were based on 1996 data and current rates will vary. Negative impact balances were caused by
differences in rates for the different lines of business and reallocation of premiums among States.
Credit was given for overpayments of premium taxes or RML assessments by AIG to the
States, with consideration given to the timing of such overpayments. Interest was applied at the
average of the 30-year Treasury Note, 10-Year Treasury Note and Prime rates. The interest
calculation method applied to liabilities based on the effective date of the contract plus eighteen
months, compounded annually. A more detailed explanation of the rates used is appended to this
Report as Exhibit 2.
A summary of estimated premium tax and RML assessment impact by State with interest is
appended to this Report as Exhibit 3.
The estimated workers’ compensation premium tax impact was $15,290,766 or $42,368,541
with interest. The estimated workers’ compensation RML assessment impact was $101,576,180 or
$301,216,237 with interest.
II. IMPROPER BOOKING BY AIG OF DIRECT PREMIUMS FROM ITS WORKERS’ COMPENSATION LINE OF BUSINESS AS ASSUMED REINSURANCE PREMIUMS
INS-RIS reviewed the issue of whether AIG booked direct workers’ compensation premiums
as assumed reinsurance premiums for the purpose of avoiding workers’ compensation premium taxes
and RML assessments. AIG was asked to provide:

5
1. Supporting documentation for the assumed premiums reported by the Domestic Brokerage Group (“DBG”) pooled companies in their filed annual statements as of December 31, 1990; and
2. Journal entries for the period 1989 and 1990.
The consultants reviewed journal entries from 1989 and 1990 related to assumed reinsurance
and sampled entries utilizing professional judgment or that were material. AIG was asked to provide
support for these entries. AIG indicated that such records were beyond their record retention policy.
AIG indicated that it was unable to substantiate the assumed premiums for 1990 for a specific
division due to a “top side” entry of approximately $50 million.
As of the date of this Report, due to lack of supporting documentation from AIG, the
consultants were not able to conclude whether or not direct workers’ compensation premiums were
booked as assumed reinsurance premiums to avoid premium taxes and RML assessments. Therefore,
no estimated underpayment of premium taxes or RML assessments is included in this Report for
direct premiums incorrectly reported as assumed.

6
Summary The results of the misallocation of workers’ compensation premiums, with the resulting tax impacts by state can be found on Exhibit 3. Premium tax impacts were determined as follows: Tax * $ 15,236,724 Interest 27,131,817 Total $42,368,541
RML assessments were determined as follows: RML * $101,565,539 Interest 199,650,695 Total $301,216,234
*States with a total negative balance due were not included in total, as outlined in Exhibit 3.

7
Exhibit 1 AIG Adjustable Accounts Report for Division 50 and 55 by category

8
9

10
Exhibit 2 Compound Annual Interest Rate Factors and Methodology

11
[A] , [D] [B]
[C]
([A]/[D]+[B]+[C])/3 C O M P O U N D A N N U A L I N T E R E S T R A T E F A C T O R S
Year 30-year T-Note
10-Year T-Note Prime Rate Average 1985 1986 1987 1988 1989 1990 1991 1992 1993 1994 1995 1996 1997 1998 1999 2000 2001 2002 2003 2004 2005
1985
10.79%
10.62% 9.93% 10.45%0.1045
0.1920 0.2921 0.4090 0.5396 0.6790 0.8159 0.9426 1.0621 1.2107 1.3748
1.5444
1.7259
1.9003
2.0890
2.3073
2.4993
2.6709
2.8311
3.0054
3.2073
1986
7.78% 7.67% 8.33% 7.93%0.0793 0.1699 0.2757 0.3939 0.5202 0.6441 0.7588 0.8671 1.0016 1.1502
1.3037
1.4681
1.6259
1.7968
1.9944
2.1683
2.3237
2.4687
2.6265
2.8093
1987
8.59% 8.39% 8.21% 8.40%
0.0840 0.1820 0.2916 0.4085 0.5234 0.6297 0.7299 0.8546 0.9923 1.1345
1.2868
1.4331
1.5914
1.7745
1.9356
2.0796
2.2139
2.3602
2.5296
1988
8.96% 8.85% 9.32% 9.04% 0.0904
0.1915 0.2994 0.4054 0.5034 0.5959 0.7109 0.8380 0.9692
1.1097
1.2446
1.3907
1.5596
1.7082
1.8410
1.9650
2.0999
2.2562
1989
8.45% 8.49% 10.87% 9.27% 0.0927
0.1917 0.2888 0.3787 0.4636 0.5690 0.6855 0.8059
0.9347
1.0585
1.1924
1.3473
1.4836
1.6054
1.7191
1.8428
1.9861
1990
8.61% 8.55% 10.01% 9.06% 0.0906
0.1795 0.2618 0.3394 0.4359 0.5425 0.6527
0.7706
0.8838
1.0064
1.1482
1.2729
1.3844
1.4884
1.6016
1.7328
1991
8.14% 7.86% 8.46% 8.15% 0.0815
0.1570 0.2282 0.3167 0.4144 0.5154
0.6235
0.7274
0.8398
0.9698
1.0842
1.1864
1.2818
1.3856
1.5058
1992
7.67% 7.01% 6.25% 6.98% 0.0698
0.1356 0.2174 0.3078 0.4012
0.5011
0.5972
0.7011
0.8213
0.9270
1.0215
1.1097
1.2057
1.3169
1993
6.59% 5.87% 6.00% 6.15%
0.0615
0.1380 0.2225 0.3098
0.4032
0.4930
0.5901
0.7025
0.8014
0.8897
0.9721
1.0619
1.1658
1994
7.37% 7.09% 7.15% 7.20%
0.0720 0.1516 0.2339
0.3219
0.4065
0.4980
0.6038
0.6969
0.7802
0.8578
0.9424
1.0403
1995
6.88% 6.57% 8.83% 7.43%
0.0743
0.1510
0.2331
0.3119
0.3973
0.4961
0.5829
0.6605
0.7330
0.8118
0.9032
1996
6.71% 6.44% 8.27% 7.14% 0.071
4 0.1478
0.2212
0.3007
0.3926
0.4735
0.5457
0.6132
0.6866
0.7716
1997
6.61% 6.35% 8.44% 7.13% 0.071
3 0.1399
0.2140
0.2998
0.3753
0.4427
0.5057
0.5742
0.6536
1998
5.58% 5.26% 8.35% 6.40% 0.064
0 0.1332
0.2133
0.2837
0.3467
0.4054
0.4694
0.5435
1999
5.87% 5.65% 8.00% 6.51% 0.065
1 0.1403
0.2065
0.2657
0.3209
0.3810
0.4507
2000
5.94% 6.03% 9.23% 7.07% 0.070
7 0.1328
0.1884
0.2402
0.2967
0.3620
2001
5.49% 5.02% 6.91% 5.81% 0.058
1 0.1099
0.1584
0.2111
0.2721
2002
5.43% 4.61% 4.67% 4.90% 0.049
0 0.0948
0.1446
0.2023
2003 [E] 4.96% 4.01% 4.12% 4.36% 0.043
6 0.0911
0.1461
2004 [E] 5.04% 4.27% 4.34% 4.55%0.0455
0.0982
2005 [E],[F] 4.65%
4.30% 6.17%
5.04% 0.050
4

The interest calculation rate methodology is as follows:
Exhibit reference
1985 thru 2004 2005 / other notes
A 30-year Treasury Note source: http://www.federalreserve.gov/releases/h15/data/Annual_Dec_/discontinued_TCMNOM_Y30.txt
The 30-year Treasury Note constant maturity series was discontinued as of 2/18/02.
B 10-year Treasury Note source: http://www.federalreserve.gov/releases/h15/data/Annual_Dec_/H15_TCMNOM_Y10.txt
Source: http://www.federalreserve.gov/releases/h15/data/Monthly/H15_TCMNOM_Y10.txt (monthly for first 11 months of 2005), used Nov. 2005 rate of 4.54% for Dec. 2005
C The Prime Rate source: http://www.federalreserve.gov/releases/h15/data/Annual_Dec_/H15_PRIME_NA.txt
source: http://www.federalreserve.gov/releases/h15/data/Monthly/H15_PRIME_NA.txt (monthly for first 11 months of 2005), used Nov. 2005 rate of 7.0% for Dec. 2005
D 20-year Treasury Note source: http://www.federalreserve.gov/releases/h15/data/Annual_Dec_/H15_TCMNOM_Y20.txt for 2003-2004
source: http://www.federalreserve.gov/releases/h15/data/Monthly/H15_TCMNOM_Y20.txt (monthly for the first 11 months of 2005), used Nov. 2005 rate of 4.83% for Dec. 2005
E Issuance of 30-year Treasury Notes discontinued as of 2/18/02, therefore, used the 20-year Treasury Note for 2003-2005 as the yield curves do not differ much from 20-year to 30-year maturities
F Year not complete so Federal Reserve has not issued the annual data yet. Therefore, used the actual data for the first 11 months and used the Nov. 2005 rates for Dec. 2005
Assumptions (1) Premium Tax/RML Impact is spread evenly throughout the year and interest begins being
computed eighteen months after the first average effective date. For example, for 1985, eighteen months after the first average effective date of 6/30/85 equates to beginning interest compound date of 1/1/87. So, for 1985 data, we would use 100% of the 1987 interest rate.
(2) Assumes a settlement date of 1/1/06.
12

Exhibit 3 Summary Premium and RML Impact with Interest Calculation by State
13

14
Premium Tax Impact RML Impact
Positive & Remove Positive & Remove Grand Negative Interest Subtotal Negatives Total Negative Interest Subtotal Negatives Total Total [A] [B] [A]+[B]=[C] [D] [C]+[D=[1] [F] [G] [F]+[G]=[H] [I] [H]+[I]=[2] [1]+[2] Alabama ($962,800) $731 ($962,069) $962,069 $0 $4,001,141 $7,375,728 $11,376,869 $0 $11,376,869 $11,376,869Alaska ($17,595) $3,247 ($14,348) $14,348 $0 $86,828 $136,648 $223,476 $0 $223,476 $223,476Arizona $976,663 $1,603,986 $2,580,649 $0 $2,580,649 $387,245 $810,904 $1,198,149 $0 $1,198,149 $3,778,798Arkansas $262,797 $457,323 $720,120 $0 $720,120 $70,642 $103,275 $173,917 $0 $173,917 $894,037California $3,084,036 $4,784,811 $7,868,847 $0 $7,868,847 $427,511 $866,356 $1,293,867 $0 $1,293,867 $9,162,714Colorado $430,211 $758,146 $1,188,357 $0 $1,188,357 $4,912 $21,703 $26,615 $0 $26,615 $1,214,972Connecticut ($135,790) $9,557 ($126,233) $126,233 $0 $925,405 $1,833,038 $2,758,443 $0 $2,758,443 $2,758,443Delaware $63,223 $81,734 $144,957 $0 $144,957 $112,621 $200,426 $313,047 $0 $313,047 $458,004District of Columbia ($17,971) $1,154 ($16,817) $16,817 $0 $39,313 $79,683 $118,996 $0 $118,996 $118,996Florida $1,722,927 $3,234,446 $4,957,373 $0 $4,957,373 $17,772,164 $35,067,156 $52,839,320 $0 $52,839,320 $57,796,693Georgia $632,367 $1,271,093 $1,903,460 $0 $1,903,460 $1,641,480 $3,192,461 $4,833,941 $0 $4,833,941 $6,737,401Hawaii $99,176 $272,458 $371,634 $0 $371,634 $126,836 $354,919 $481,755 $0 $481,755 $853,389Idaho $13,911 $86,693 $100,604 $0 $100,604 $45,319 $99,698 $145,017 $0 $145,017 $245,621Illinois ($394,200) $1,186 ($393,014) $393,014 $0 $632,228 $1,255,314 $1,887,542 $0 $1,887,542 $1,887,542Indiana ($399,366) $782 ($398,584) $398,584 $0 $268,868 $508,904 $777,772 $0 $777,772 $777,772Iowa $18,869 $31,767 $50,636 $0 $50,636 $136,591 $261,937 $398,528 $0 $398,528 $449,164Kansas $143,304 $267,294 $410,598 $0 $410,598 $1,006,145 $1,883,683 $2,889,828 $0 $2,889,828 $3,300,426Kentucky ($5,386) $19,104 $13,718 $0 $13,718 $1,651,591 $3,050,282 $4,701,873 $0 $4,701,873 $4,715,591Louisiana $357,044 $732,476 $1,089,520 $0 $1,089,520 $10,623,535 $23,210,037 $33,833,572 $0 $33,833,572 $34,923,093Maine $42,823 $93,828 $136,651 $0 $136,651 $2,642,572 $5,829,104 $8,471,676 $0 $8,471,676 $8,608,327Maryland $617,300 $1,162,300 $1,779,600 $0 $1,779,600 $175,903 $354,474 $530,377 $0 $530,377 $2,309,978Massachusetts $283,678 $572,275 $855,953 $0 $855,953 $10,841,027 $22,749,474 $33,590,501 $0 $33,590,501 $34,446,454Michigan $1,854,325 $3,425,159 $5,279,484 $0 $5,279,484 $824,755 $1,796,118 $2,620,873 $0 $2,620,873 $7,900,358Minnesota $201,118 $401,773 $602,891 $0 $602,891 $228,707 $410,218 $638,925 $0 $638,925 $1,241,816Mississippi $33,196 $61,917 $95,113 $0 $95,113 $577,545 $1,164,253 $1,741,798 $0 $1,741,798 $1,836,911Missouri ($1,500) $21,635 $20,135 $0 $20,135 $754,892 $1,463,353 $2,218,245 $0 $2,218,245 $2,238,380Montana $9,318 $18,741 $28,059 $0 $28,059 $180 $614 $794 $0 $794 $28,853Nebraska $72,748 $115,655 $188,403 $0 $188,403 $234,816 $420,273 $655,089 $0 $655,089 $843,492Nevada ($50,476) $4,729 ($45,747) $45,747 $0 $29,332 $66,812 $96,144 $0 $96,144 $96,144New Hampshire $65,374 $120,117 $185,491 $0 $185,491 $600,781 $1,138,476 $1,739,257 $0 $1,739,257 $1,924,748New Jersey ($262,559) $31,115 ($231,444) $231,444 $0 $4,201,737 $7,809,105 $12,010,842 $0 $12,010,842 $12,010,842

Grand
15
Premium Tax Impact RML Impact
Positive & Remove Positive & Remove Negative Interest Subtotal Negatives Total Negative Interest Subtotal Negatives Total Total
[A] [B] [A]+[B]=[C] [D] [C]+[D=[1] [F] [G] [F]+[G]=[H] [I] [H]+[I]=[2] [1]+[2] New Mexico ($61,215) $432 ($60,783) $60,783 $0 $295,156 $705,331 $1,000,487 $0 $1,000,487 $1,000,487New York $20,219 $67,582 $87,801 $0 $87,801 ($225,250) $4,926 ($220,324) $220,324 $0 $87,801North Carolina $119,537 $336,764 $456,301 $0 $456,301 $1,502,567 $2,687,353 $4,189,920 $0 $4,189,920 $4,646,221North Dakota ($5,541) $0 ($5,541) $5,541 $0 $535 $1,013 $1,548 $0 $1,548 $1,548Ohio ($730,792) $0 ($730,792) $730,792 $0 ($66,801) $1,760 ($65,041) $65,041 $0 $0Oklahoma $379,230 $535,686 $914,916 $0 $914,916 $13,699 $24,008 $37,707 $0 $37,707 $952,622Oregon $100,050 $261,851 $361,901 $0 $361,901 $98,575 $184,569 $283,144 $0 $283,144 $645,045Pennsylvania $700,445 $1,113,168 $1,813,613 $0 $1,813,613 $532,452 $1,056,135 $1,588,587 $0 $1,588,587 $3,402,200Rhode Island $1,013,556 $1,950,194 $2,963,750 $0 $2,963,750 $33,718,852 $63,992,772 $97,711,624 $0 $97,711,624 $100,675,374 South Carolina $47,750 $96,067 $143,817 $0 $143,817 $241,465 $485,009 $726,474 $0 $726,474 $870,291South Dakota ($63,019) $206 ($62,813) $62,813 $0 $21,159 $48,000 $69,159 $0 $69,159 $69,159Tennessee ($58,574) $0 ($58,574) $58,574 $0 $2,114,618 $3,589,079 $5,703,697 $0 $5,703,697 $5,703,697Texas $1,399,131 $2,135,832 $3,534,963 $0 $3,534,963 ($393,790) $0 ($393,790) $393,790 $0 $3,534,963US ($5,520,088) $0 ($5,520,088) $5,520,088 $0 $467,709 $656,462 $1,124,171 $0 $1,124,171 $1,124,171Utah $327,625 $628,903 $956,528 $0 $956,528 $13,917 $33,769 $47,686 $0 $47,686 $1,004,214Vermont $188,176 $332,375 $520,551 $0 $520,551 $1,453,174 $2,599,420 $4,052,594 $0 $4,052,594 $4,573,145Virginia ($877,159) $0 ($877,159) $877,159 $0 ($1,719,903) $3,955 ($1,715,948) $1,715,948 $0 $0Washington ($18,573) $904 ($17,669) $17,669 $0 $18,125 $45,429 $63,554 $0 $63,554 $63,554West Virginia $12,191 $14,335 $26,526 $0 $26,526 $9,991 $13,924 $23,915 $0 $23,915 $50,441Wisconsin $5,334 $10,287 $15,621 $0 $15,621 ($4,095) $0 ($4,095) $4,095 $0 $15,621Wyoming ($15,773) $0 ($15,773) $15,773 $0 $1,564 $3,355 $4,919 $0 $4,919 $4,919 Total $5,699,275 $27,131,817 $32,831,092 $9,537,447 $42,368,541 $99,166,341 $199,650,695 $298,817,036 $2,399,198 $301,216,234 $343,584,775
16
WC A: AIG Workers’ Compensation Premium Tax Impact by State
Exhibit Page 1 of 2
State Under (Over) payment Interest1 State TotalAlabama $(962,800) $ - $ - Alaska (17,595) - - Arizona 976,663 1,603,986 2,580,649 Arkansas 262,797 457,323 720,120 California 3,084,036 4,784,811 7,868,847 Colorado 430,211 758,146 1,188,357 Connecticut (135,790) - - Delaware 63,223 81,734 144,957 District of Columbia (17,971) - - Florida 1,722,927 3,234,446 4,957,373 Georgia 632,367 1,271,093 1,903,460 Hawaii 99,176 272,458 371,634 Idaho 13,911 86,693 100,604 Illinois (394,200) - - Indiana (399,366) - - Iowa 18,869 31,767 50,636 Kansas 143,304 267,294 410,598 Kentucky (5,386) 19,104 2 13,718 Louisiana 357,044 732,476 1,089,520 Maine 42,823 93,828 136,651 Maryland 617,300 1,162,300 1,779,600 Massachusetts 283,678 572,275 855,953 Michigan 1,854,325 3,425,159 5,279,484 Minnesota 201,118 401,773 602,891 Mississippi 33,196 61,917 95,113 Missouri (1,500) 21,635 20,135 Montana 9,318 18,741 28,059 Nebraska 72,748 115,655 188,403 Nevada (50,476) - - New Hampshire 65,374 120,117 185,491 New Jersey (262,559) - - New Mexico (61,215) - -

17
Exhibit Page 2 of 2
State Under (Over) payment Interest1 State TotalNew York 20,219 67,582 87,801 North Carolina 119,537 336,764 456,301 North Dakota (5,541) - - Ohio (730,792) - - Oklahoma 379,230 535,686 914,916 Oregon 100,050 261,851 361,901 Pennsylvania 700,445 1,113,168 1,813,613 Rhode Island 1,013,556 1,950,194 2,963,750 South Carolina 47,750 96,067 143,817 South Dakota (63,019) - - Tennessee (58,574) - - Texas 1,399,131 2,135,832 3,534,963 US (5,520,088) - - Utah 327,625 628,903 956,528 Vermont 188,176 332,375 520,551 Virginia (877,159) - - Washington (18,573) - - West Virginia 12,191 14,335 26,526 Wisconsin 5,334 10,287 15,621 Wyoming (15,773) - - TOTAL: $ 42,368,541
1 Interest applied at the average of the historical 30-Year Treasury Note, 10-Year Treasury Note
and Prime rates; interest begins 18 months after the first-year mid-point and was compounded.
2 Overall, AIG overpaid premium taxes in this State for the relevant period. However, interest on earlier underpayments is greater than the overpayment.

18
WC B: AIG Workers’ Compensation Residual Market Assessment Impact by State
Exhibit Page 1 of 2
State Under (Over) payment Interest1 State Total Alabama $4,001,141 $ 7,375,728 $ 11,376,869 Alaska 86,828 136,648 223,476 Arizona 387,245 810,904 1,198,149 Arkansas 70,642 103,275 173,917 California 427,511 866,356 1,293,867 Colorado 4,912 21,703 26,615 Connecticut 925,405 1,833,038 2,758,443 Delaware 112,621 200,426 313,047 District of Columbia 39,313 79,683 118,996 Florida 17,772,164 35,067,156 52,839,320 Georgia 1,641,480 3,192,461 4,833,941 Hawaii 126,836 354,919 481,755 Idaho 45,319 99,698 145,017 Illinois 632,228 1,255,314 1,887,542 Indiana 268,868 508,904 777,772 Iowa 136,591 261,937 398,528 Kansas 1,006,145 1,883,683 2,889,828 Kentucky 1,651,591 3,050,282 4,701,873 Louisiana 10,623,535 23,210,037 33,833,572 Maine 2,642,572 5,829,104 8,471,676 Maryland 175,903 354,474 530,377 Massachusetts 10,841,027 22,749,474 33,590,501 Michigan 824,755 1,796,118 2,620,873 Minnesota 228,707 410,218 638,925 Mississippi 577,545 1,164,253 1,741,798 Missouri 754,892 1,463,353 2,218,245 Montana 180 614 794 Nebraska 234,816 420,273 655,089 Nevada 29,332 66,812 96,144 New Hampshire 600,781 1,138,476 1,739,257 New Jersey 4,201,737 7,809,105 12,010,842 New Mexico 295,156 705,331 1,000,487 New York (225,250) - - North Carolina 1,502,567 2,687,353 4,189,920 North Dakota 535 1,013 1,548

19
Exhibit Page 2 of 2
State Under (Over) payment Interest1 State Total Ohio (66,801) - - Oklahoma 13,699 24,008 37,707 Oregon 98,575 184,569 283,144 Pennsylvania 532,452 1,056,135 1,588,587 Rhode Island 33,718,852 63,992,772 97,711,624 South Carolina 241,465 485,009 726,474 South Dakota 21,159 48,000 69,159 Tennessee 2,114,618 3,589,079 5,703,697 Texas (393,790) - - US 467,709 656,462 1,124,171 Utah 13,917 33,769 47,686 Vermont 1,453,174 2,599,420 4,052,594 Virginia (1,719,903) - - Washington 18,125 45,429 63,554 West Virginia 9,991 13,924 23,915 Wisconsin (4,095) - - Wyoming 1,564 3,355 4,919 TOTAL: $ 301,216,234
1 Interest applied at the average of the historical 30-Year Treasury Note, 10-Year Treasury Note and Prime rates; interest begins 18 months after the first-year mid-point and was compounded.