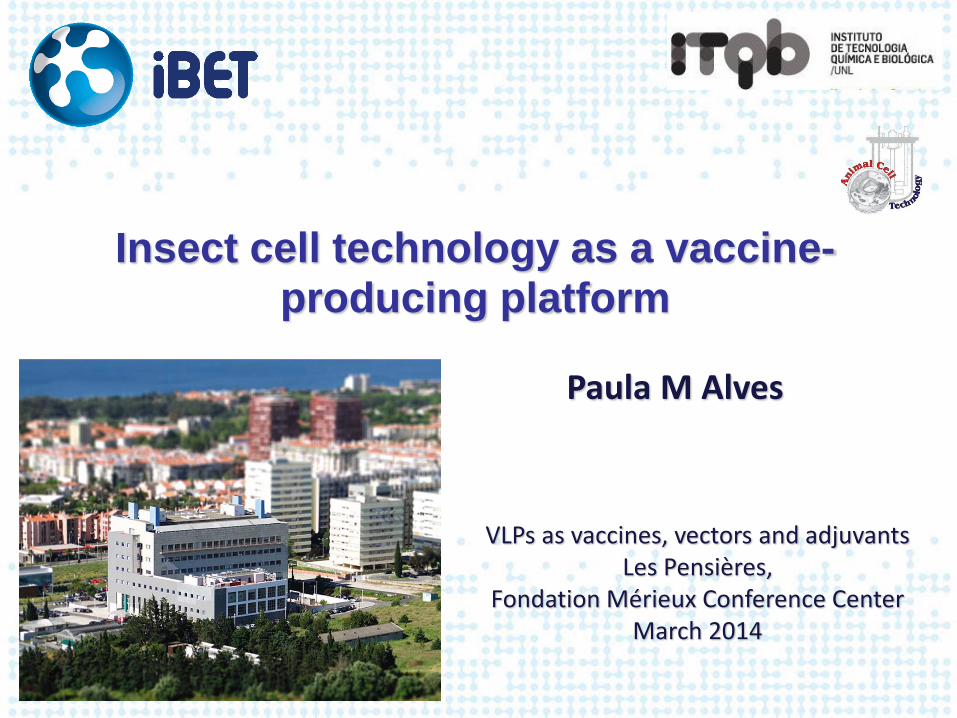
insect cell technology as a vaccine- producing platform · paula m alves insect cell technology as...
TRANSCRIPT
Paula M Alves
Insect cell technology as a vaccine-producing platform
VLPs as vaccines, vectors and adjuvants Les Pensières,
Fondation Mérieux Conference Center March 2014
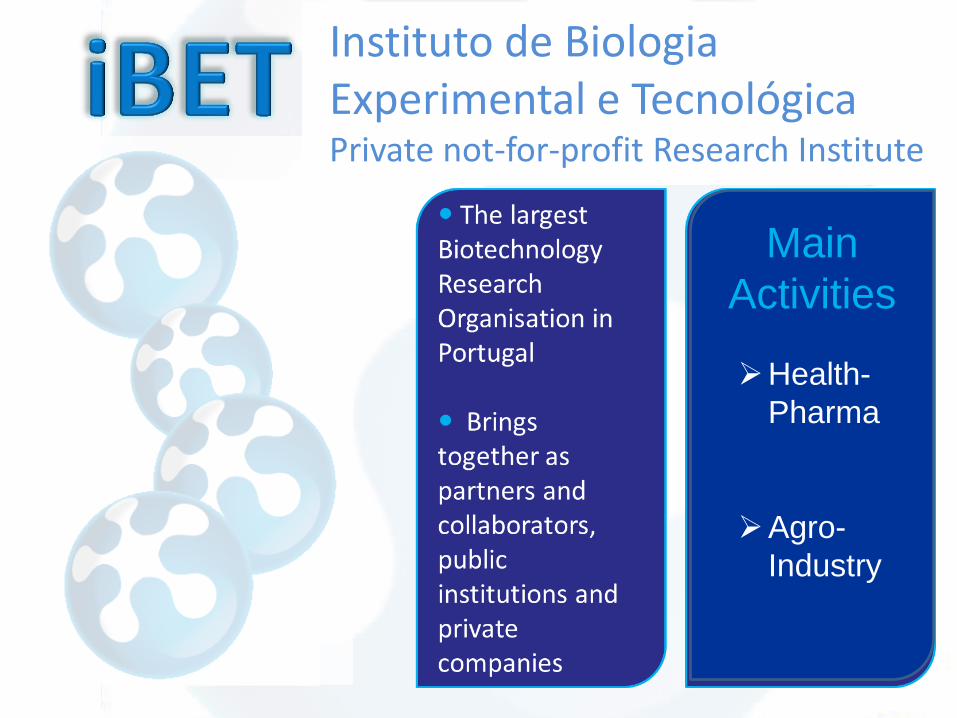
Instituto de Biologia Experimental e Tecnológica Private not-for-profit Research Institute
Main
Activities
Health-
Pharma
Agro-
Industry
Almeirim, 29 Janeiro 2013
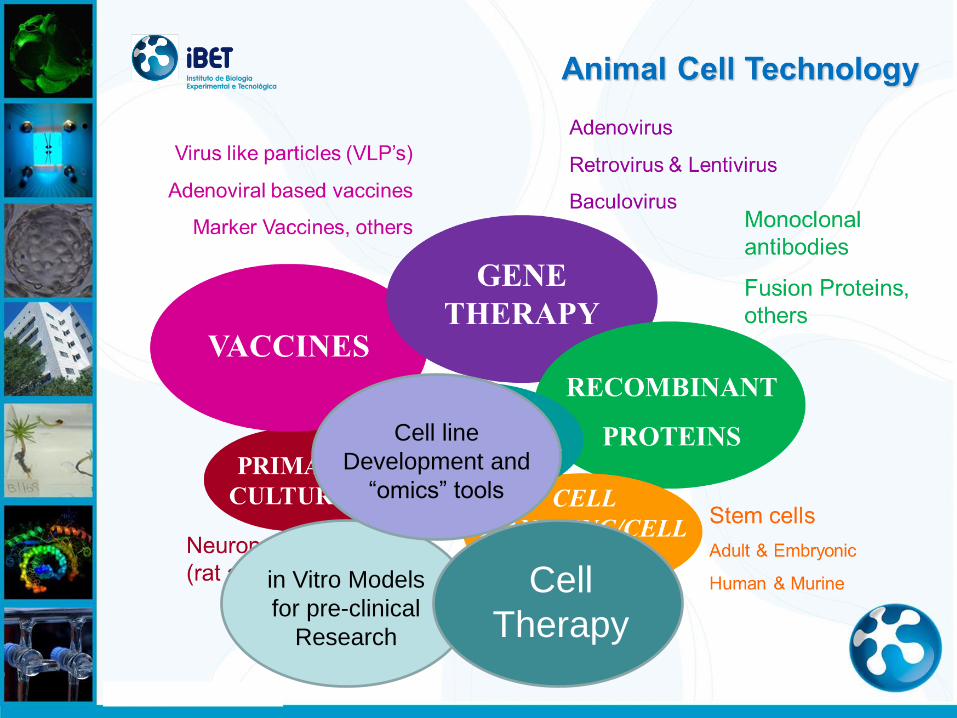
in Vitro Models
for pre-clinical
Research
Cell line
Development and
“omics” tools
Cell
Therapy
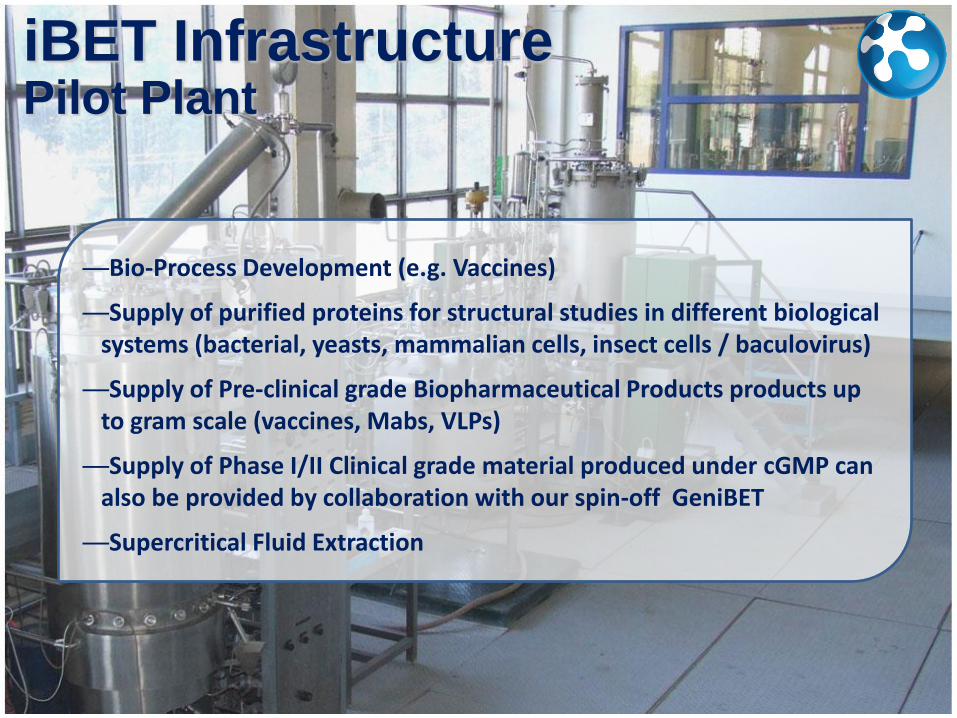
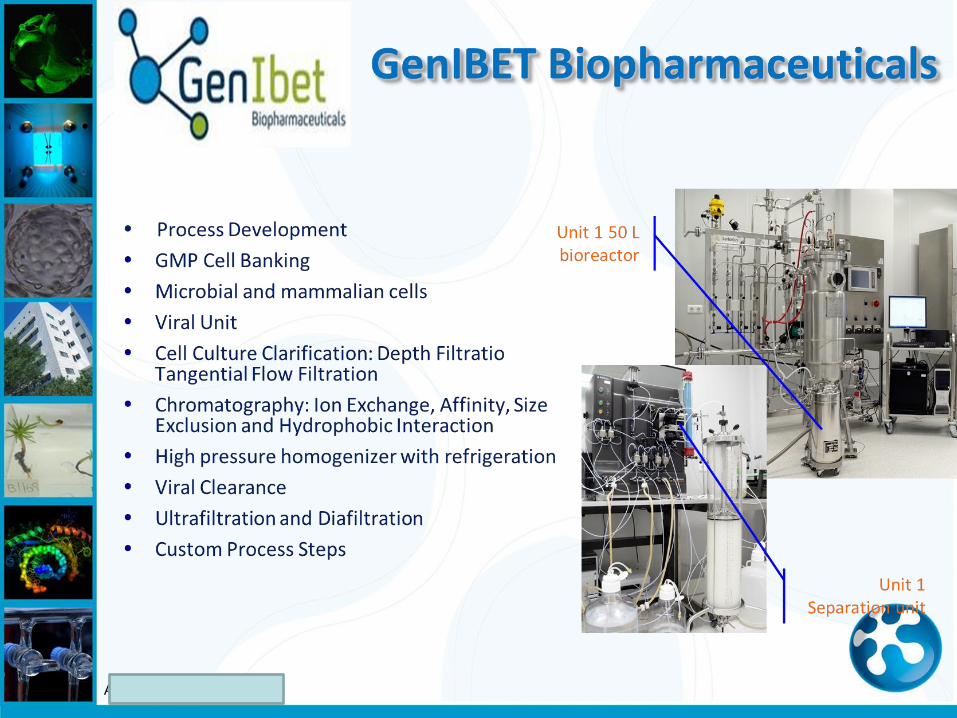
Pilot Plant iBET Infrastructure
—Bio-Process Development (e.g. Vaccines)
—Supply of purified proteins for structural studies in different biological systems (bacterial, yeasts, mammalian cells, insect cells / baculovirus)
—Supply of Pre-clinical grade Biopharmaceutical Products products up to gram scale (vaccines, Mabs, VLPs)
—Supply of Phase I/II Clinical grade material produced under cGMP can also be provided by collaboration with our spin-off GeniBET
—Supercritical Fluid Extraction
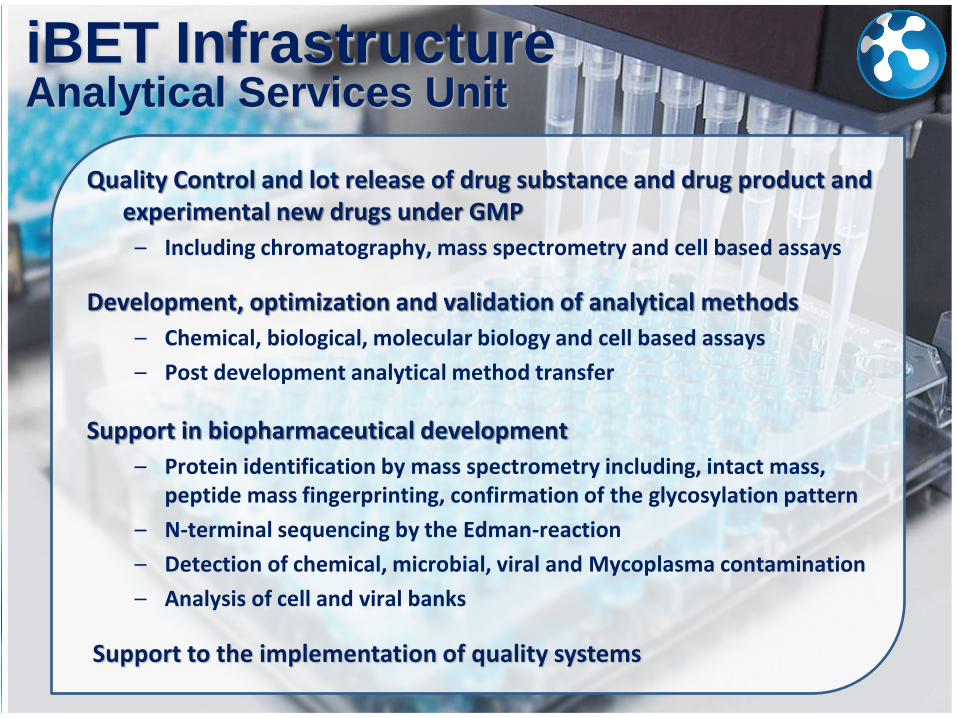
Analytical Services Unit iBET Infrastructure
Support to the implementation of quality systems
Quality Control and lot release of drug substance and drug product and experimental new drugs under GMP
– Including chromatography, mass spectrometry and cell based assays
Development, optimization and validation of analytical methods
– Chemical, biological, molecular biology and cell based assays
– Post development analytical method transfer
Support in biopharmaceutical development
– Protein identification by mass spectrometry including, intact mass, peptide mass fingerprinting, confirmation of the glycosylation pattern
– N-terminal sequencing by the Edman-reaction
– Detection of chemical, microbial, viral and Mycoplasma contamination
– Analysis of cell and viral banks
Almeirim, 29 Janeiro 2013
www.genibet.com
A cGMP Bridge to Personalized Medicine
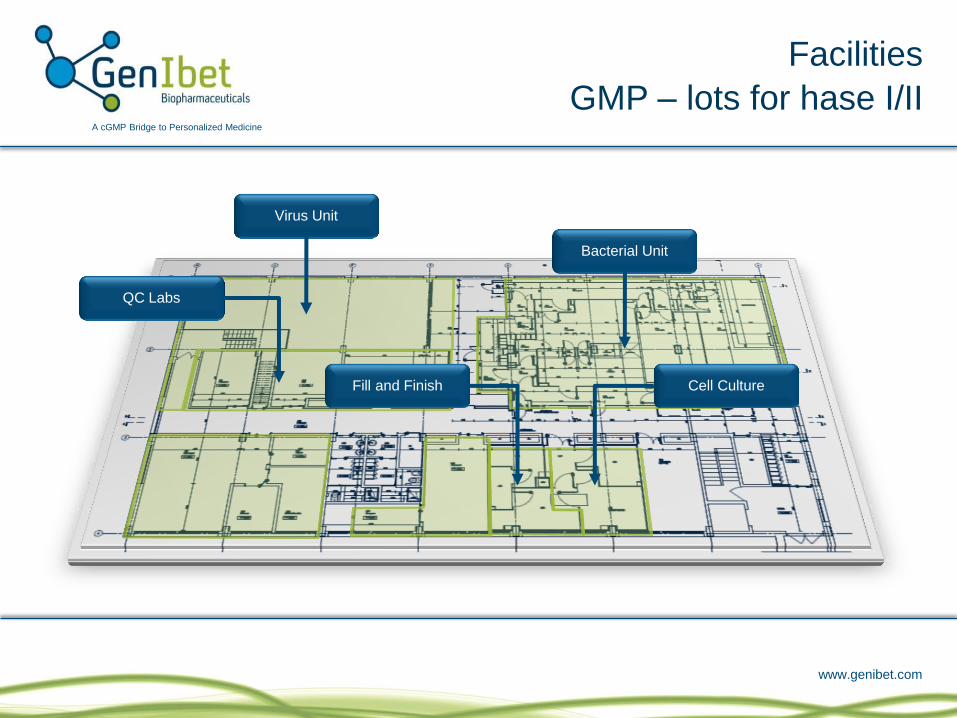
Facilities
GMP – lots for hase I/II
Virus Unit
QC Labs
Cell Culture Fill and Finish
Bacterial Unit
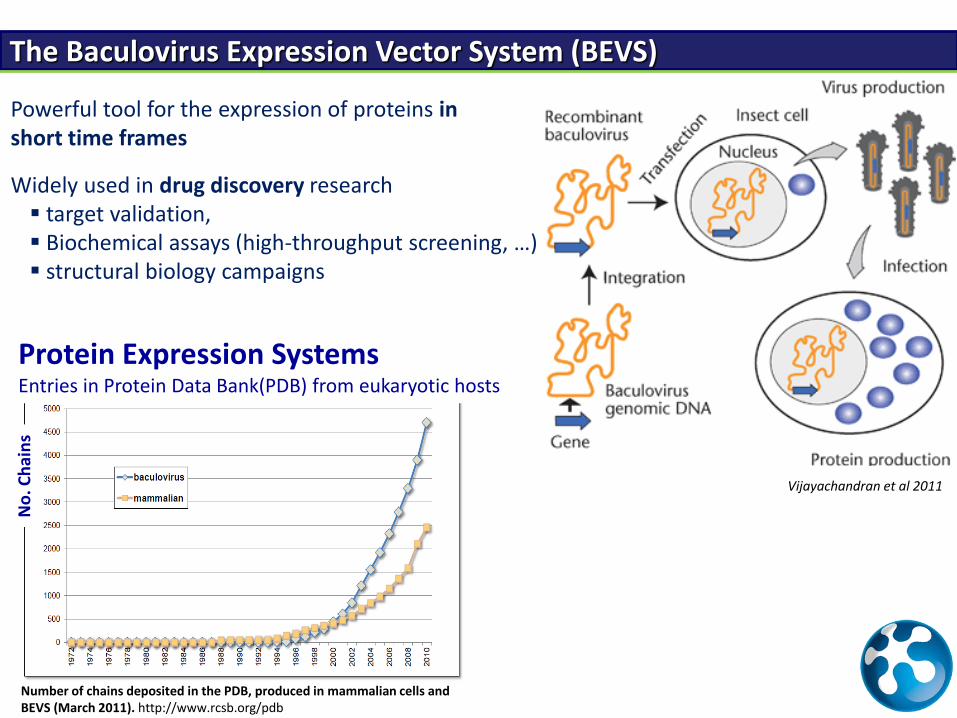
Number of chains deposited in the PDB, produced in mammalian cells and BEVS (March 2011). http://www.rcsb.org/pdb
Protein Expression Systems Entries in Protein Data Bank(PDB) from eukaryotic hosts
No
. Ch
ain
s
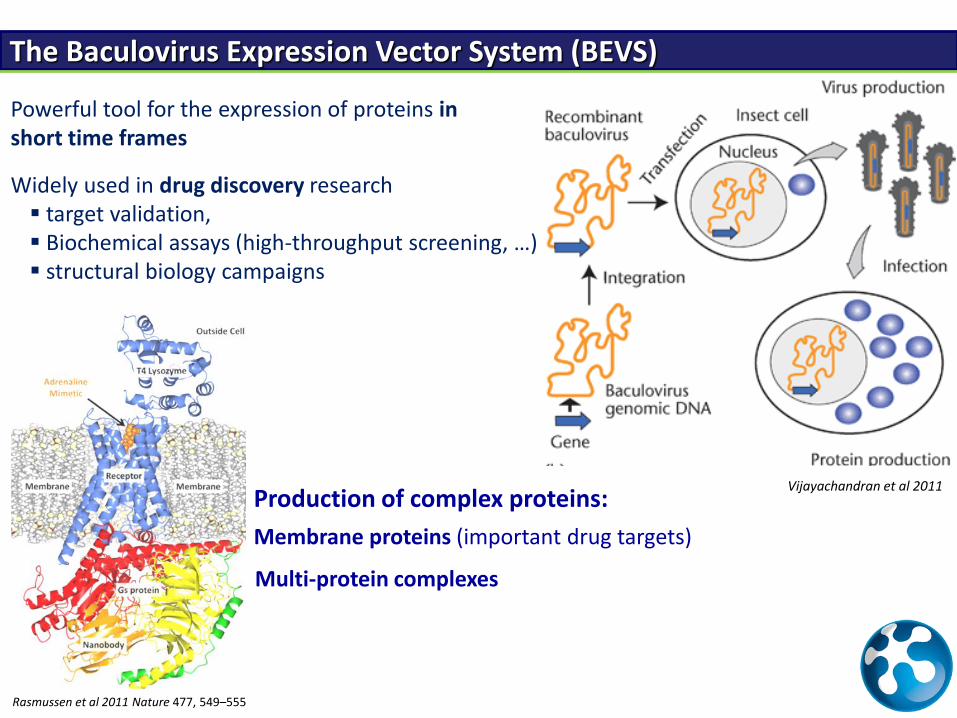
The Baculovirus Expression Vector System (BEVS)
Vijayachandran et al 2011
Powerful tool for the expression of proteins in short time frames
Widely used in drug discovery research target validation, Biochemical assays (high-throughput screening, …) structural biology campaigns
The Baculovirus Expression Vector System (BEVS)
Vijayachandran et al 2011
Powerful tool for the expression of proteins in short time frames
Multi-protein complexes
Rasmussen et al 2011 Nature 477, 549–555
Production of complex proteins:
Membrane proteins (important drug targets)
Widely used in drug discovery research target validation, Biochemical assays (high-throughput screening, …) structural biology campaigns
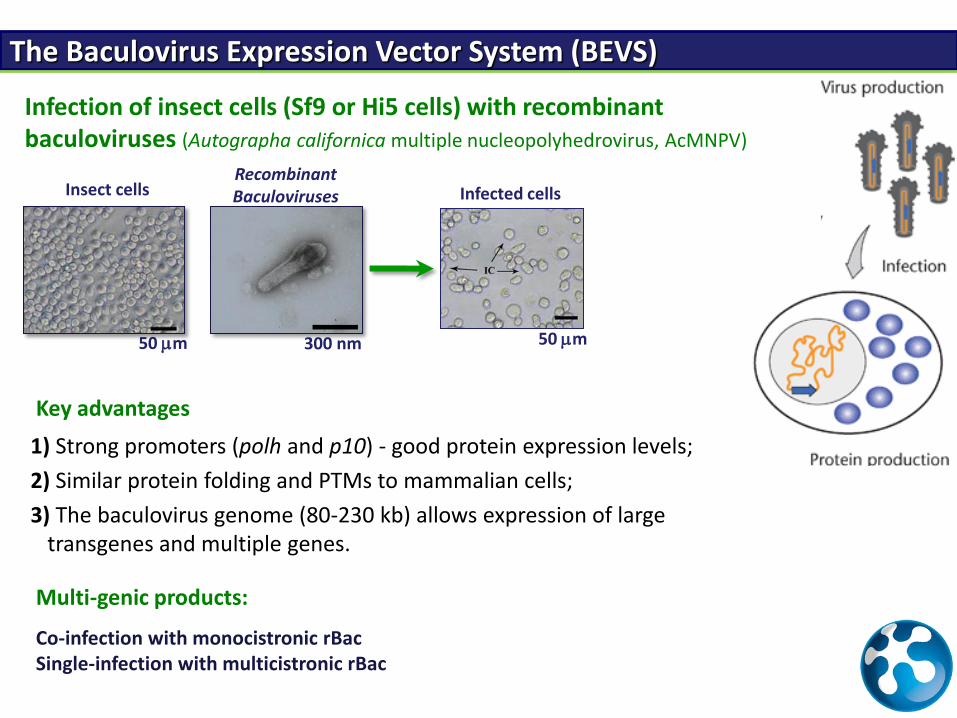
Insect cells Recombinant Baculoviruses
50 m 300 nm 50 m
Infected cells
Co-infection with monocistronic rBac Single-infection with multicistronic rBac
Key advantages
1) Strong promoters (polh and p10) - good protein expression levels;
2) Similar protein folding and PTMs to mammalian cells;
3) The baculovirus genome (80-230 kb) allows expression of large transgenes and multiple genes.
Multi-genic products:
Infection of insect cells (Sf9 or Hi5 cells) with recombinant baculoviruses (Autographa californica multiple nucleopolyhedrovirus, AcMNPV)
The Baculovirus Expression Vector System (BEVS)
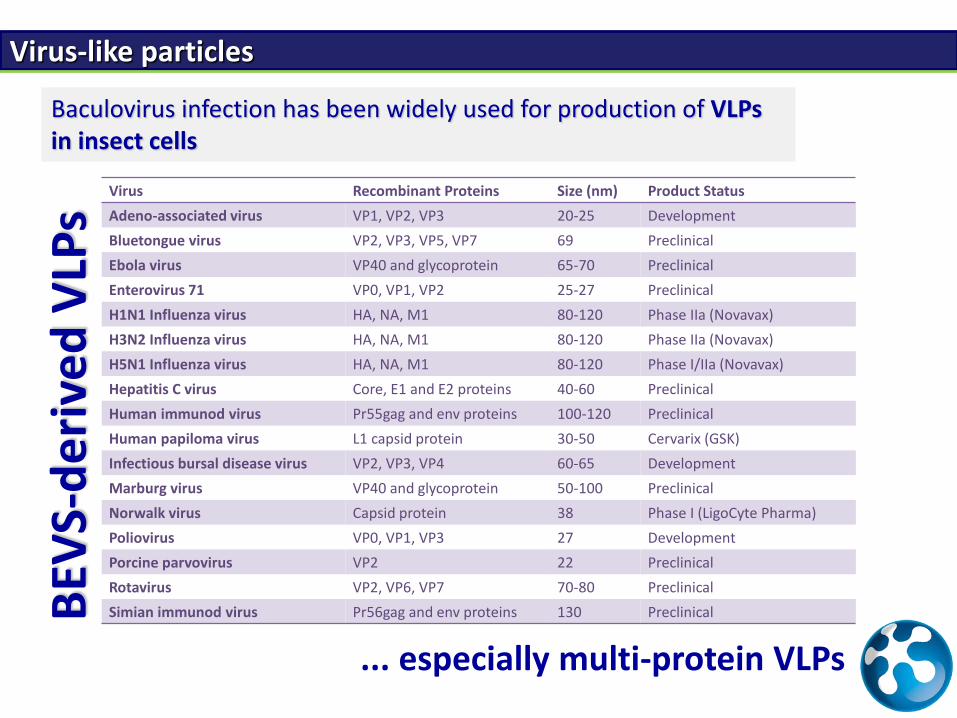
Virus Recombinant Proteins Size (nm) Product Status
Adeno-associated virus VP1, VP2, VP3 20-25 Development
Bluetongue virus VP2, VP3, VP5, VP7 69 Preclinical
Ebola virus VP40 and glycoprotein 65-70 Preclinical
Enterovirus 71 VP0, VP1, VP2 25-27 Preclinical
H1N1 Influenza virus HA, NA, M1 80-120 Phase IIa (Novavax)
H3N2 Influenza virus HA, NA, M1 80-120 Phase IIa (Novavax)
H5N1 Influenza virus HA, NA, M1 80-120 Phase I/IIa (Novavax)
Hepatitis C virus Core, E1 and E2 proteins 40-60 Preclinical
Human immunod virus Pr55gag and env proteins 100-120 Preclinical
Human papiloma virus L1 capsid protein 30-50 Cervarix (GSK)
Infectious bursal disease virus VP2, VP3, VP4 60-65 Development
Marburg virus VP40 and glycoprotein 50-100 Preclinical
Norwalk virus Capsid protein 38 Phase I (LigoCyte Pharma)
Poliovirus VP0, VP1, VP3 27 Development
Porcine parvovirus VP2 22 Preclinical
Rotavirus VP2, VP6, VP7 70-80 Preclinical
Simian immunod virus Pr56gag and env proteins 130 Preclinical
Baculovirus infection has been widely used for production of VLPs in insect cells
... especially multi-protein VLPs
BEV
S-d
eri
ved
VLP
s Virus-like particles

Market approval: 2010
Market approval: 2013 Market approval: 2007 in EU
Vaccines produced using BEVS
Human papilloma virus vaccine
Autologous cellular immunotherapy – prostate cancer
Influenza vaccine
Short production time required
Influenza VLP, Phase II
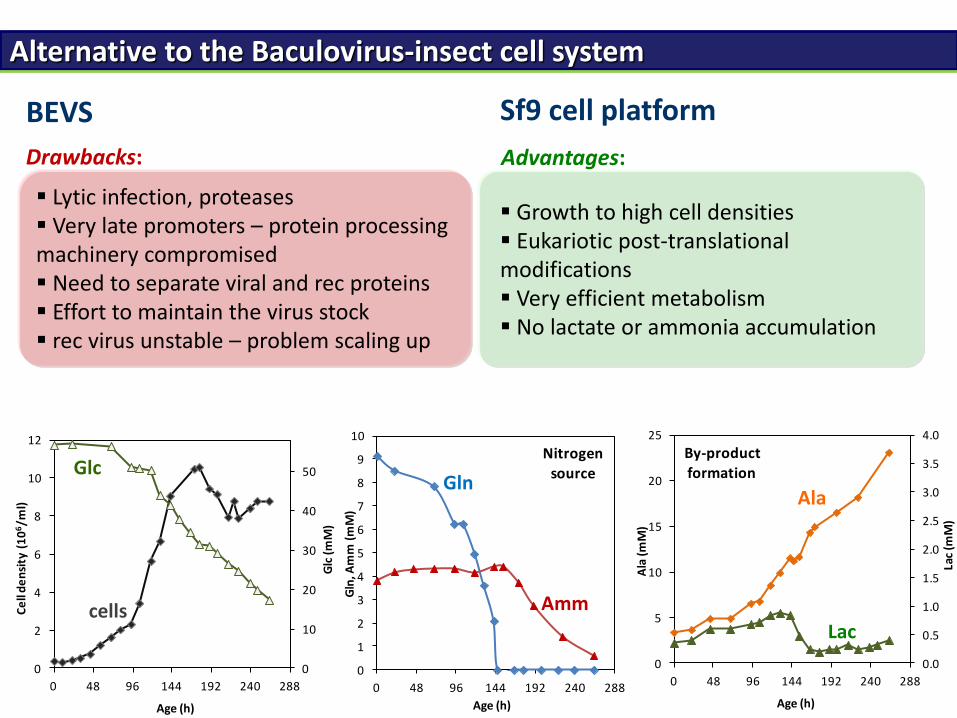
Alternative to the Baculovirus-insect cell system
Sf9 cell platform
Advantages:
Growth to high cell densities Eukariotic post-translational modifications Very efficient metabolism No lactate or ammonia accumulation
BEVS
Drawbacks:
Lytic infection, proteases Very late promoters – protein processing machinery compromised Need to separate viral and rec proteins Effort to maintain the virus stock rec virus unstable – problem scaling up
0
1
2
3
4
5
6
7
8
9
10
0 48 96 144 192 240 288
Gln
, Am
m (
mM
)
Age (h)
Nitrogen
source
0.0
0.5
1.0
1.5
2.0
2.5
3.0
3.5
4.0
0
5
10
15
20
25
0 48 96 144 192 240 288
Lac
(mM
)
Ala
(m
M)
Age (h)
By-product
formation
0
10
20
30
40
50
0
2
4
6
8
10
12
0 48 96 144 192 240 288
Glc
(m
M)
Ce
ll d
en
sity
(1
06/m
l)
Age (h)
cells
Glc Gln
Amm
Ala
Lac
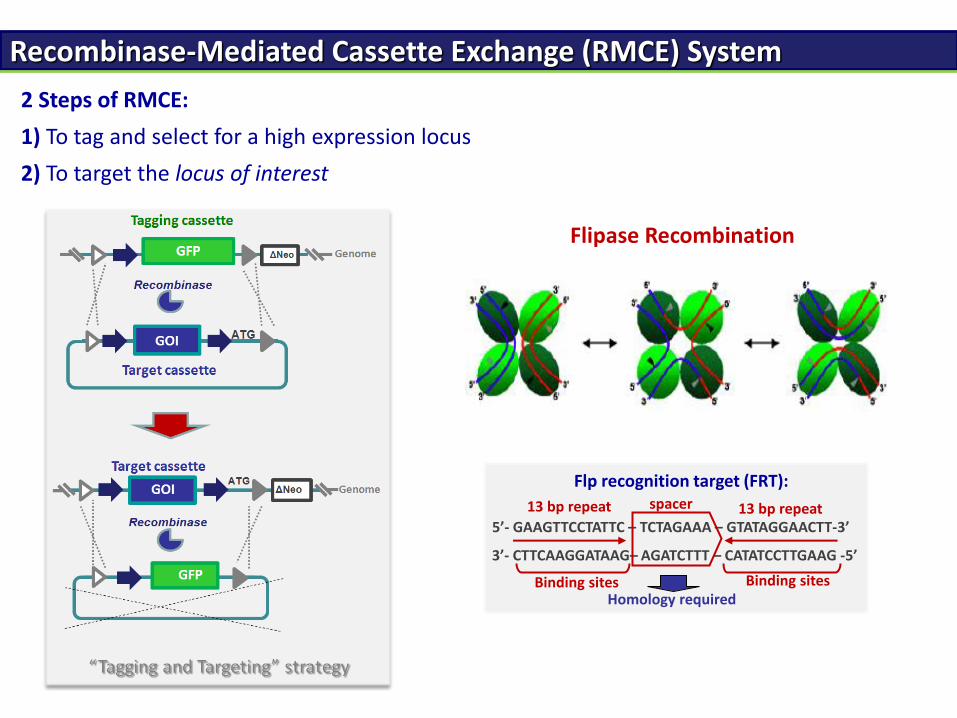
Recombinase-Mediated Cassette Exchange (RMCE) System
2 Steps of RMCE:
1) To tag and select for a high expression locus
2) To target the locus of interest
Flipase Recombination
5’- GAAGTTCCTATTC – TCTAGAAA – GTATAGGAACTT-3’
3’- CTTCAAGGATAAG– AGATCTTT – CATATCCTTGAAG -5’
Flp recognition target (FRT): spacer 13 bp repeat 13 bp repeat
Binding sites Binding sites Homology required
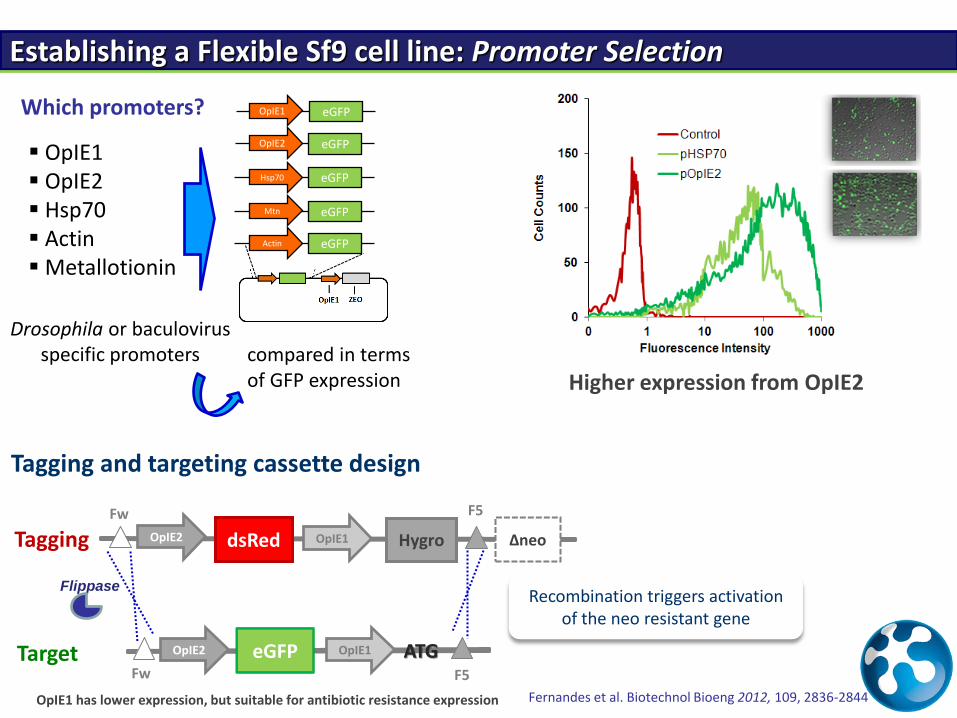
Establishing a Flexible Sf9 cell line: Promoter Selection
Which promoters?
OpIE1 OpIE2 Hsp70 Actin Metallotionin
Drosophila or baculovirus specific promoters
OpIE1
OpIE2
Hsp70
Mtn
Actin
eGFP
eGFP
eGFP
eGFP
eGFP
compared in terms of GFP expression Higher expression from OpIE2
Tagging and targeting cassette design
Recombination triggers activation of the neo resistant gene
eGFP Fw F5
Target ATG
Δneo dsRed
Fw
Hygro Tagging
F5
OpIE2
Flippase
OpIE2 OpIE1
OpIE2 OpIE1
OpIE1 has lower expression, but suitable for antibiotic resistance expression Fernandes et al. Biotechnol Bioeng 2012, 109, 2836-2844
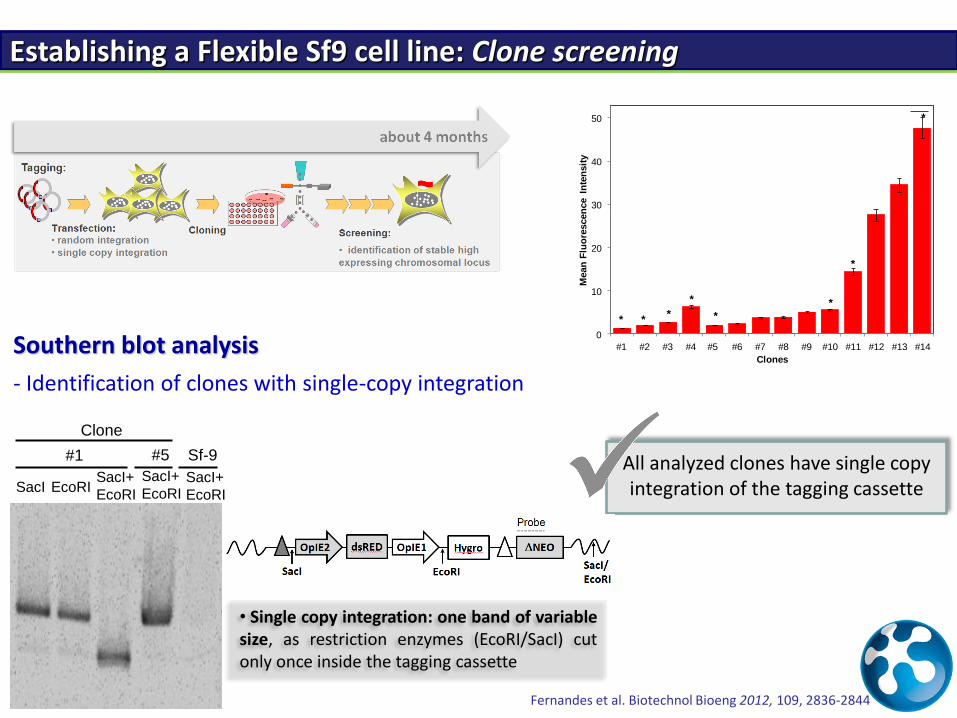
Establishing a Flexible Sf9 cell line: Clone screening
Southern blot analysis
- Identification of clones with single-copy integration
• Single copy integration: one band of variable size, as restriction enzymes (EcoRI/SacI) cut only once inside the tagging cassette
All analyzed clones have single copy integration of the tagging cassette
#1
SacI EcoRI SacI+
EcoRI
#5
SacI+
EcoRI
Sf-9
SacI+
EcoRI
Clone
0
10
20
30
40
50
#1 #2 #3 #4 #5 #6 #7 #8 #9 #10 #11 #12 #13 #14
Mean
Flu
ore
scen
ce I
nte
nsit
y
Clones
Lipotransfection
Electroporation
**
*
*
*
*
*
*
Fernandes et al. Biotechnol Bioeng 2012, 109, 2836-2844
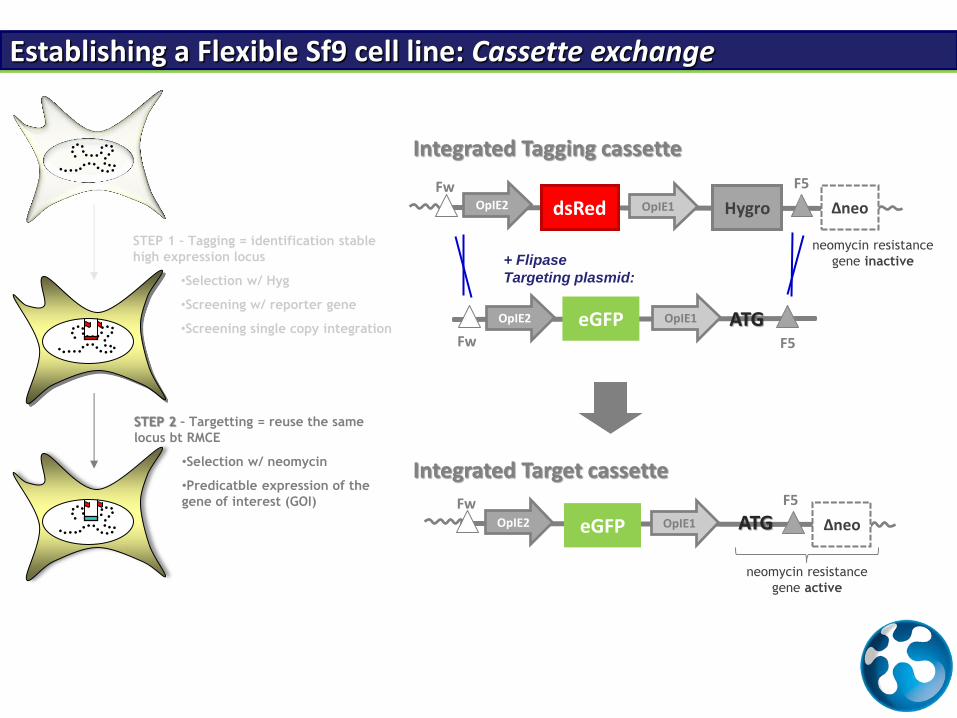
Integrated Tagging cassette
+ Flipase
Targeting plasmid:
eGFP Fw F5
ATG OpIE2 OpIE1
STEP 1 – Tagging = identification stable
high expression locus
•Selection w/ Hyg
•Screening w/ reporter gene
•Screening single copy integration
STEP 2 – Targetting = reuse the same
locus bt RMCE
•Selection w/ neomycin
•Predicatble expression of the
gene of interest (GOI)
neomycin resistance
gene inactive
Δneo dsRed Fw
Hygro
F5
OpIE2 OpIE2 OpIE1
Δneo Fw F5
OpIE2 OpIE2 OpIE1 eGFP ATG
neomycin resistance
gene active
Integrated Target cassette
Establishing a Flexible Sf9 cell line: Cassette exchange
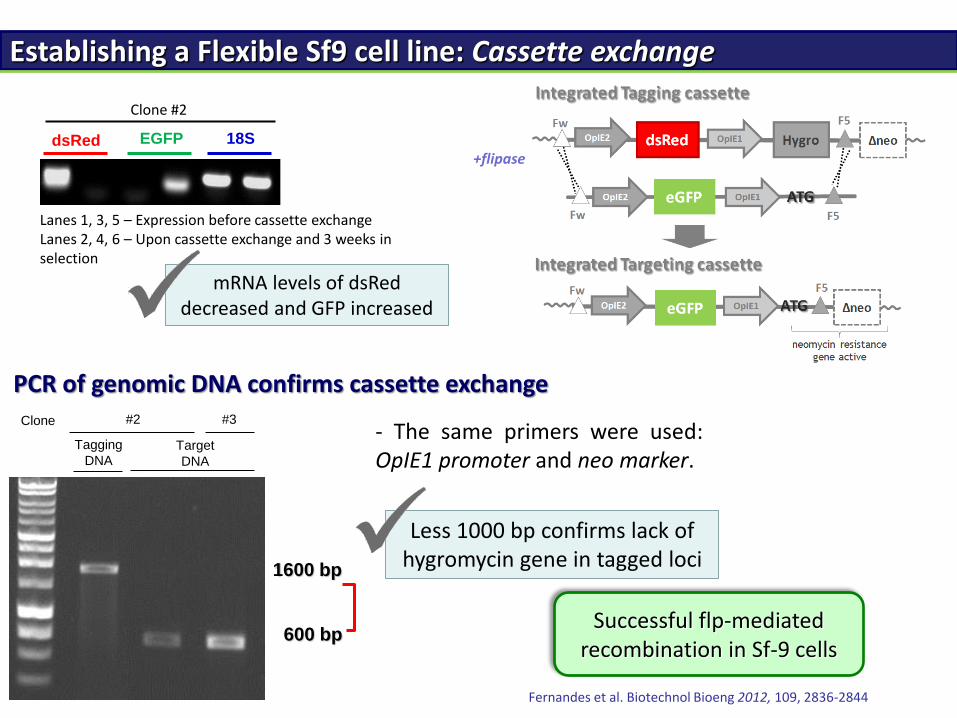
Lanes 1, 3, 5 – Expression before cassette exchange Lanes 2, 4, 6 – Upon cassette exchange and 3 weeks in selection
mRNA levels of dsRed decreased and GFP increased
Establishing a Flexible Sf9 cell line: Cassette exchange
Successful flp-mediated recombination in Sf-9 cells
dsRed EGFP 18S
Clone #2
PCR of genomic DNA confirms cassette exchange
1600 bp
600 bp
Less 1000 bp confirms lack of hygromycin gene in tagged loci
- The same primers were used: OpIE1 promoter and neo marker.
Tagging
DNA Target
DNA
#2 #3 Clone
+flipase
Fernandes et al. Biotechnol Bioeng 2012, 109, 2836-2844
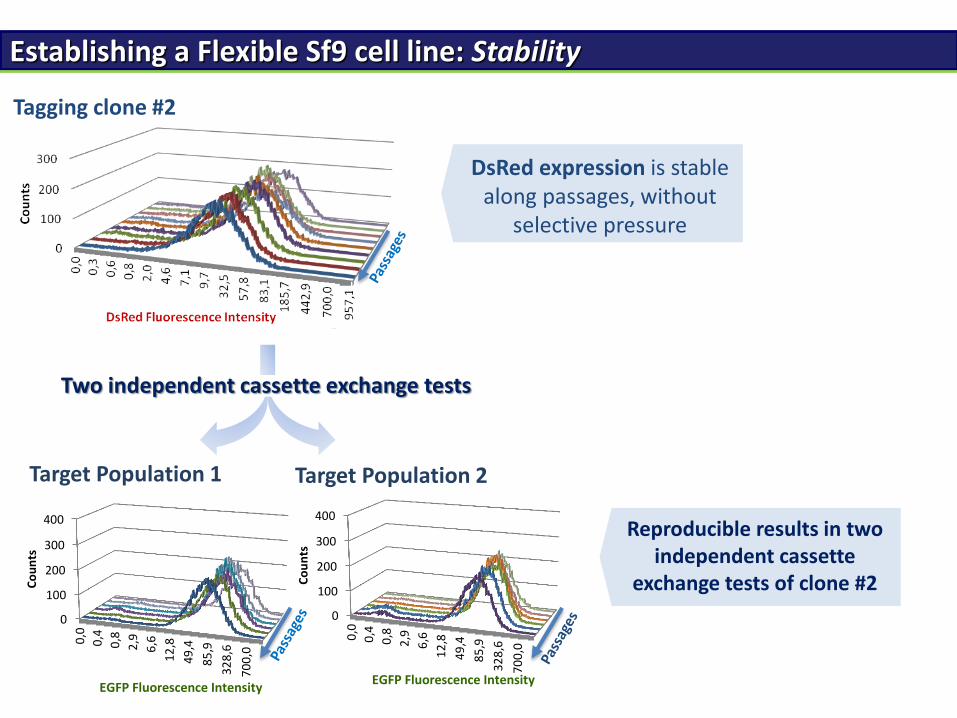
Establishing a Flexible Sf9 cell line: Stability
Tagging clone #2
DsRed expression is stable along passages, without
selective pressure
0
100
200
300
400
0,0
0,4
0,8
2,9
6,6
12
,8
49
,4
85
,9
32
8,6
70
0,0
Co
un
ts
EGFP Fluorescence Intensity
Target Population 1
0
100
200
300
400
0,0
0,4
0,8
2,9
6,6
12
,8
49
,4
85
,9
32
8,6
70
0,0
Co
un
ts
EGFP Fluorescence Intensity
Target Population 2
Reproducible results in two independent cassette
exchange tests of clone #2
Two independent cassette exchange tests
0
1
2
3
4
5
6
7
0 24 48 72 96 120 144 168 192 216
Xv
(10
6ce
ll/m
l)
Culture time (h)
Cell line 2 Cell line 3
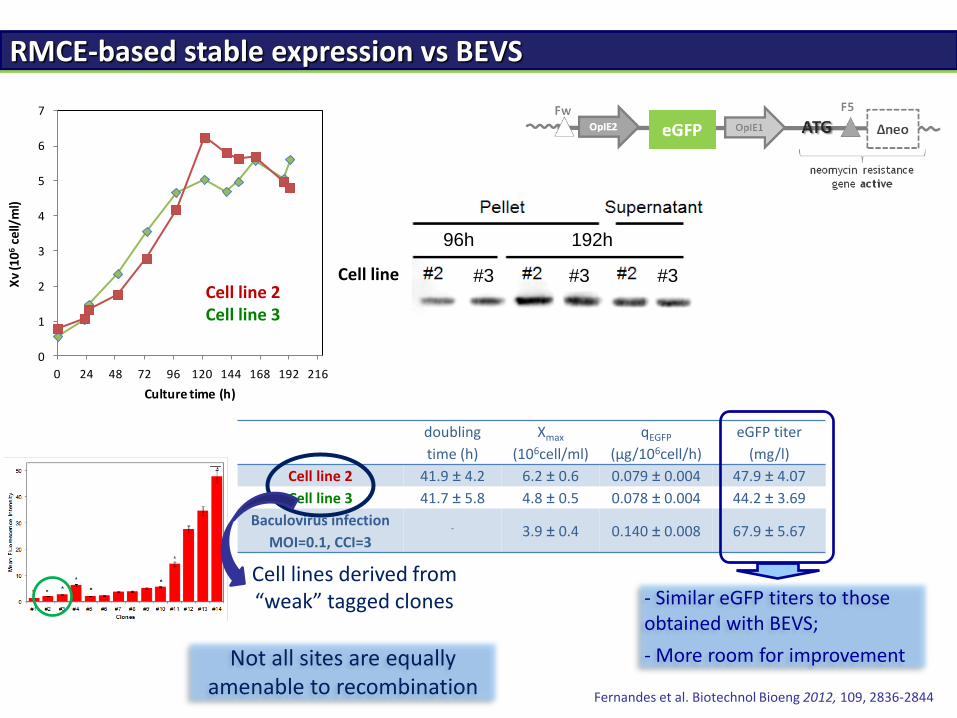
RMCE-based stable expression vs BEVS
doubling
time (h)
Xmax
(106cell/ml)
qEGFP
(µg/106cell/h)
eGFP titer
(mg/l)
Cell line 2 41.9 ± 4.2 6.2 ± 0.6 0.079 ± 0.004 47.9 ± 4.07
Cell line 3 41.7 ± 5.8 4.8 ± 0.5 0.078 ± 0.004 44.2 ± 3.69
Baculovirus infection
MOI=0.1, CCI=3 - 3.9 ± 0.4 0.140 ± 0.008 67.9 ± 5.67
96h 192h
#3 #3 #3
- Similar eGFP titers to those obtained with BEVS;
- More room for improvement
Cell line
Cell lines derived from “weak” tagged clones
Not all sites are equally amenable to recombination
Fernandes et al. Biotechnol Bioeng 2012, 109, 2836-2844
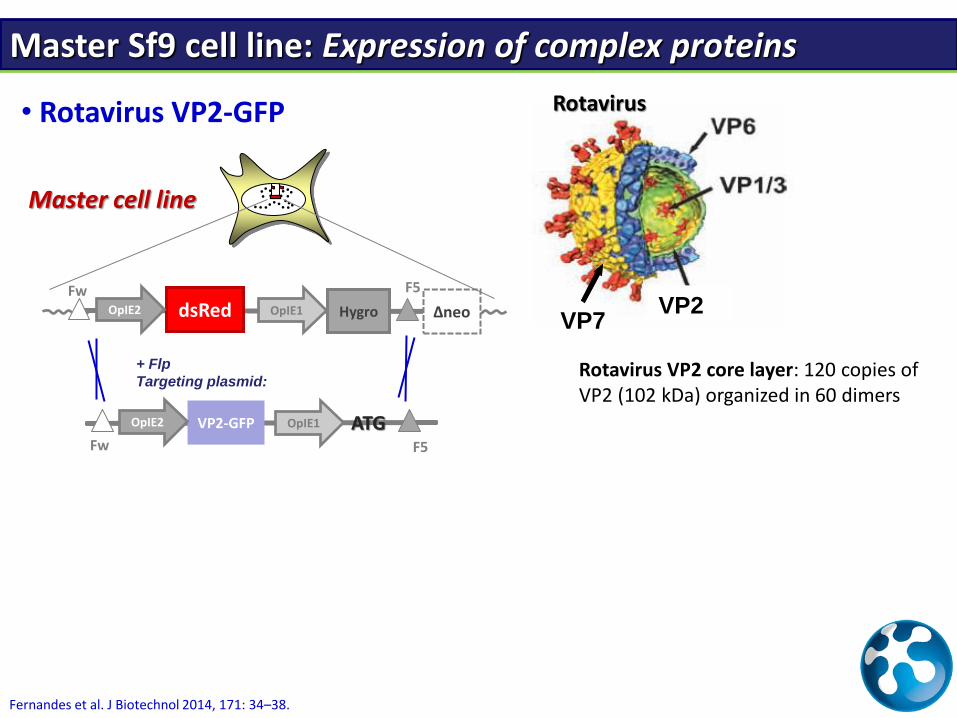
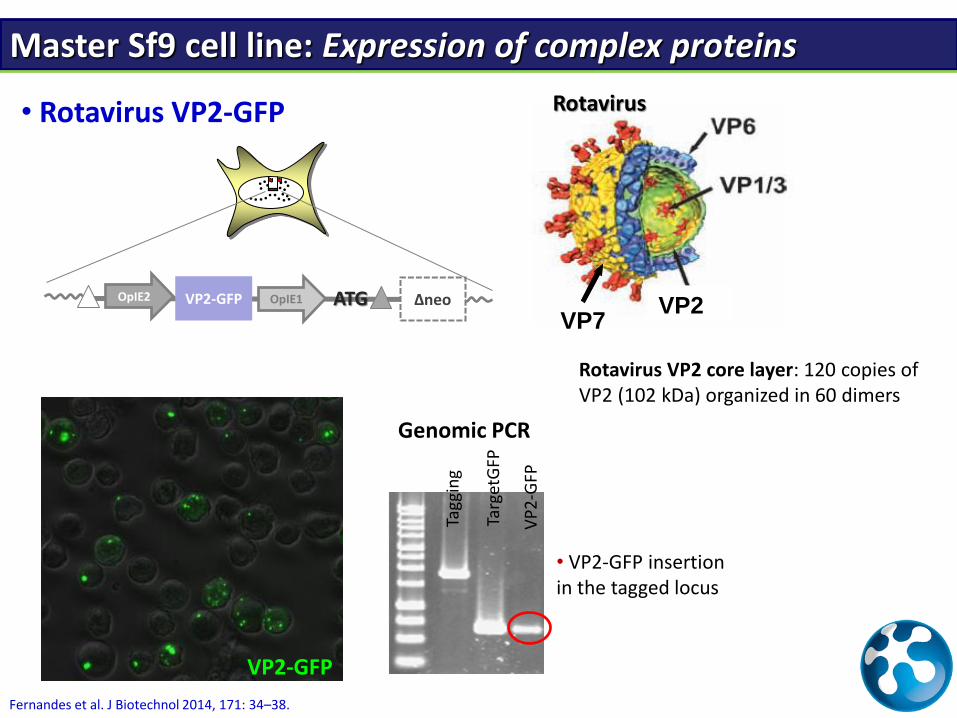
Master Sf9 cell line: Expression of complex proteins
VP2
Rotavirus
VP7
• Rotavirus VP2-GFP
Master cell line
+ Flp
Targeting plasmid:
VP2-GFP
Fw F5
ATG OpIE2 OpIE1
Δneo dsRed Fw
Hygro
F5
OpIE2 OpIE2 OpIE1
Rotavirus VP2 core layer: 120 copies of VP2 (102 kDa) organized in 60 dimers
Fernandes et al. J Biotechnol 2014, 171: 34–38.
VP2
Rotavirus
VP7 Δneo OpIE2 OpIE2 OpIE1 VP2-GFP ATG
VP2-GFP
Tagg
ing
Targ
etG
FP
VP
2-G
FP
• VP2-GFP insertion in the tagged locus
Genomic PCR
Rotavirus VP2 core layer: 120 copies of VP2 (102 kDa) organized in 60 dimers
• Rotavirus VP2-GFP
Master Sf9 cell line: Expression of complex proteins
Fernandes et al. J Biotechnol 2014, 171: 34–38.

0
2
4
6
8
10
12
0 24 48 72 96 120 144 168 192
Via
ble
ce
ll co
nce
ntr
atio
n(1
06
cells
/mL)
Time (h)
Sf9-VP2GFP
BEVS
Time of infection
Shake flask cultures (50 ml)
VP2-GFP Expression: Stable Sf9-Flp vs Sf9-BEVS
Flow cytometry
Confocal microscopy
BEVS: higher fluorescence intensity at population level - stronger promoter (polh) and high transgene copy number
120 KDa
100 KDa
Similar volumetric yields
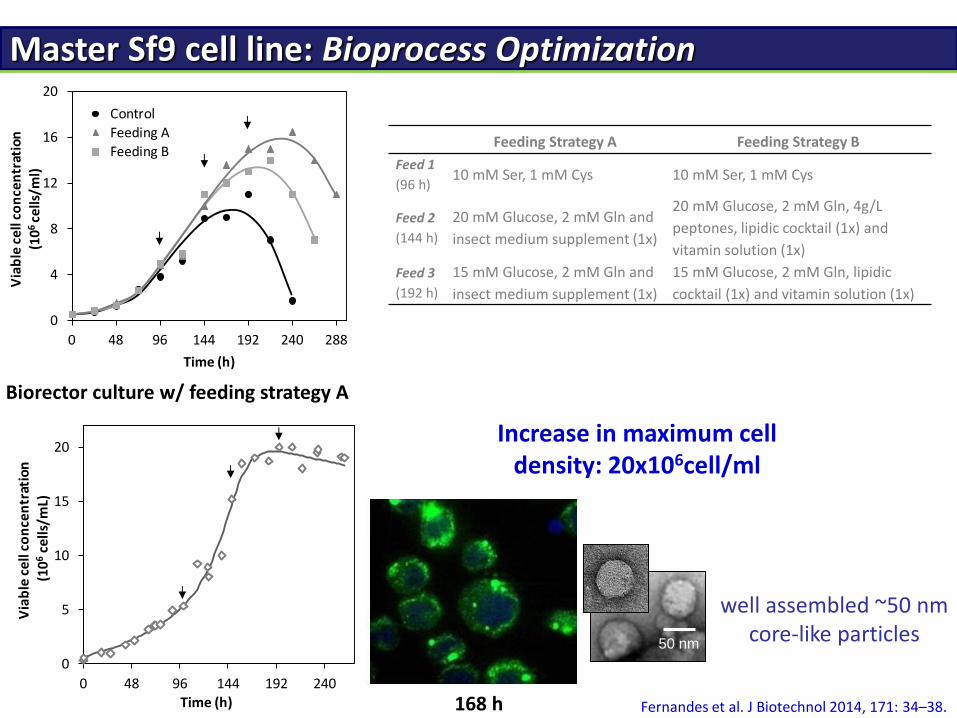
Master Sf9 cell line: Bioprocess Optimization
Feeding Strategy A Feeding Strategy B
Feed 1
(96 h) 10 mM Ser, 1 mM Cys 10 mM Ser, 1 mM Cys
Feed 2
(144 h)
20 mM Glucose, 2 mM Gln and
insect medium supplement (1x)
20 mM Glucose, 2 mM Gln, 4g/L
peptones, lipidic cocktail (1x) and
vitamin solution (1x)
Feed 3
(192 h)
15 mM Glucose, 2 mM Gln and
insect medium supplement (1x)
15 mM Glucose, 2 mM Gln, lipidic
cocktail (1x) and vitamin solution (1x)
0
4
8
12
16
20
0 48 96 144 192 240 288
Via
ble
ce
ll co
nce
ntr
atio
n
(106
ce
lls/m
l)
Time (h)
Control
Feeding A
Feeding B
Biorector culture w/ feeding strategy A
Increase in maximum cell density: 20x106cell/ml
168 h
50 nm
50 nm
0
5
10
15
20
0 48 96 144 192 240
Via
ble
ce
ll co
nce
ntr
atio
n(1
06ce
lls/m
L)
Time (h)
well assembled ~50 nm core-like particles
Fernandes et al. J Biotechnol 2014, 171: 34–38.
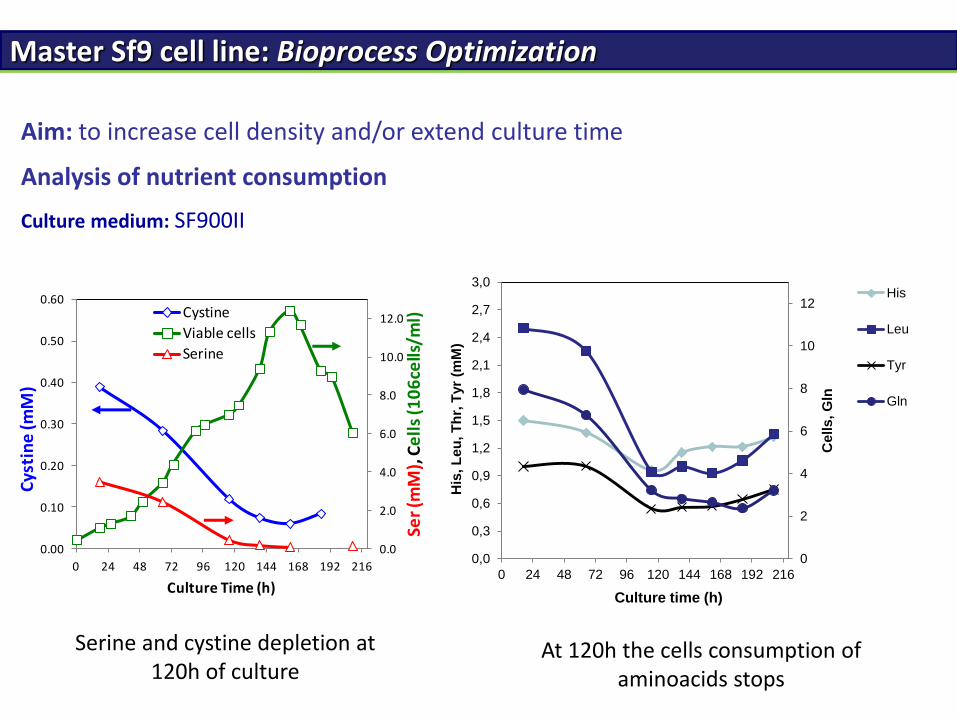
Master Sf9 cell line: Bioprocess Optimization
Aim: to increase cell density and/or extend culture time
0
2
4
6
8
10
12
0,0
0,3
0,6
0,9
1,2
1,5
1,8
2,1
2,4
2,7
3,0
0 24 48 72 96 120 144 168 192 216
Ce
lls
, G
ln
His
, L
eu
, T
hr,
Tyr
(mM
)
Culture time (h)
His
Leu
Tyr
Gln
0.0
2.0
4.0
6.0
8.0
10.0
12.0
0.00
0.10
0.20
0.30
0.40
0.50
0.60
0 24 48 72 96 120 144 168 192 216
Ser
(mM
), C
ell
s (1
06
cells
/ml)
Cys
tin
e (m
M)
Culture Time (h)
Cystine
Viable cells
Serine
Analysis of nutrient consumption
Serine and cystine depletion at 120h of culture
Culture medium: SF900II
At 120h the cells consumption of aminoacids stops
0.0
0.3
0.5
0.8
1.0
1.3
1.5
1.8
2.0
2.3
2.5
0
3
6
9
12
15
18
21
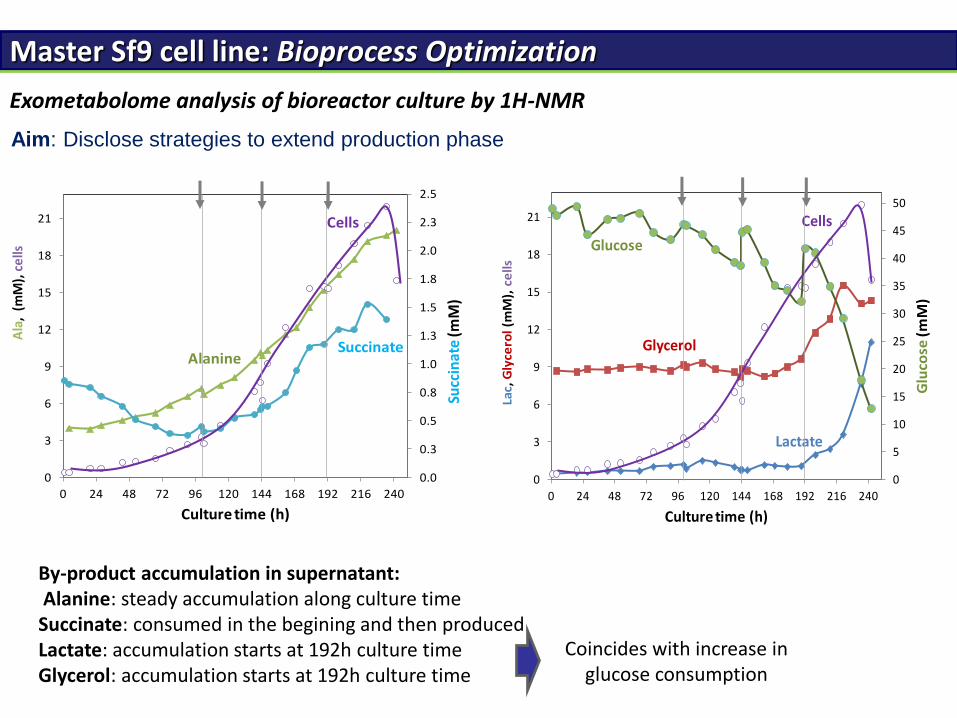
0 24 48 72 96 120 144 168 192 216 240
Succ
inat
e (m
M)
Ala
, (m
M),
ce
lls
Culture time (h)
Cells
SuccinateAlanine
Exometabolome analysis of bioreactor culture by 1H-NMR
By-product accumulation in supernatant: Alanine: steady accumulation along culture time Succinate: consumed in the begining and then produced Lactate: accumulation starts at 192h culture time Glycerol: accumulation starts at 192h culture time
Coincides with increase in glucose consumption
0
5
10
15
20
25
30
35
40
45
50
0
3
6
9
12
15
18
21
0 24 48 72 96 120 144 168 192 216 240
Glu
cose
(mM
)
Lac,
Gly
cero
l (m
M),
ce
llsCulture time (h)
Glycerol
Lactate
Cells
Glucose
Aim: Disclose strategies to extend production phase
Master Sf9 cell line: Bioprocess Optimization

• 4 weeks to have Sf9-Flp expressing a new protein
• Proof-of-concept with GFP and VP2 rotavirus core-like-particles
• Bioprocess optimization allowed similar protein titers to those obtained with BEVS
But we were working with “weak” clones...
... because the strongest clones were not amenable to recombination
Sf9 tagging clones
Status of 1st generation Sf9-Flp expression platform
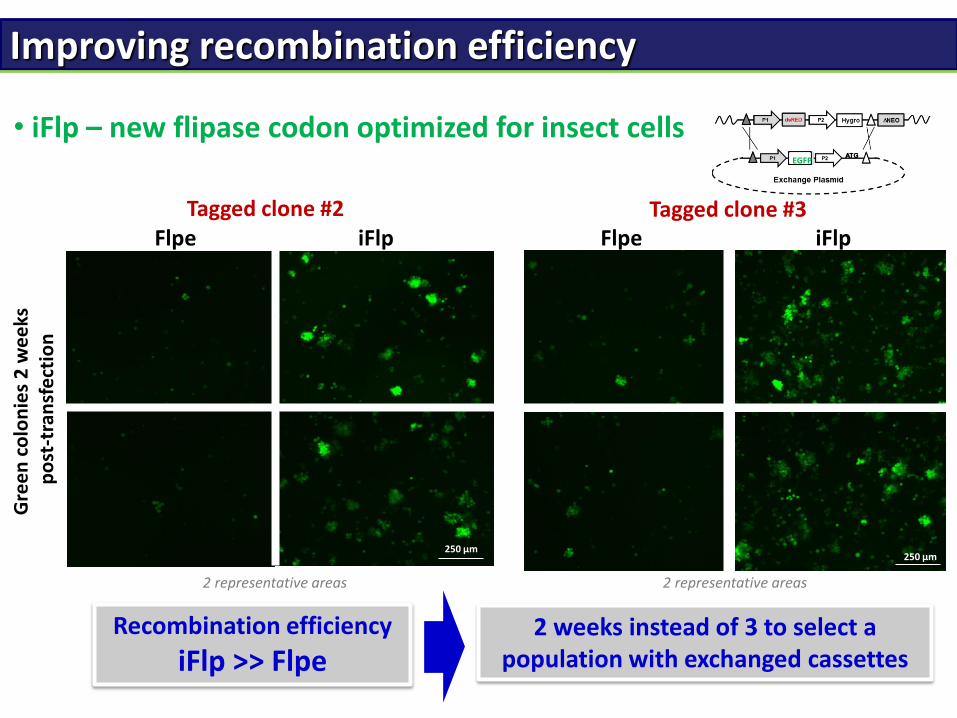
250 µm
Gre
en
co
lon
ies
2 w
ee
ks
po
st-t
ran
sfe
ctio
n
Tagged clone #2 Flpe iFlp
250 µm
Flpe iFlp
2 representative areas
Tagged clone #3
EGFP
Recombination efficiency
iFlp >> Flpe 2 weeks instead of 3 to select a
population with exchanged cassettes
• iFlp – new flipase codon optimized for insect cells
2 representative areas
Improving recombination efficiency
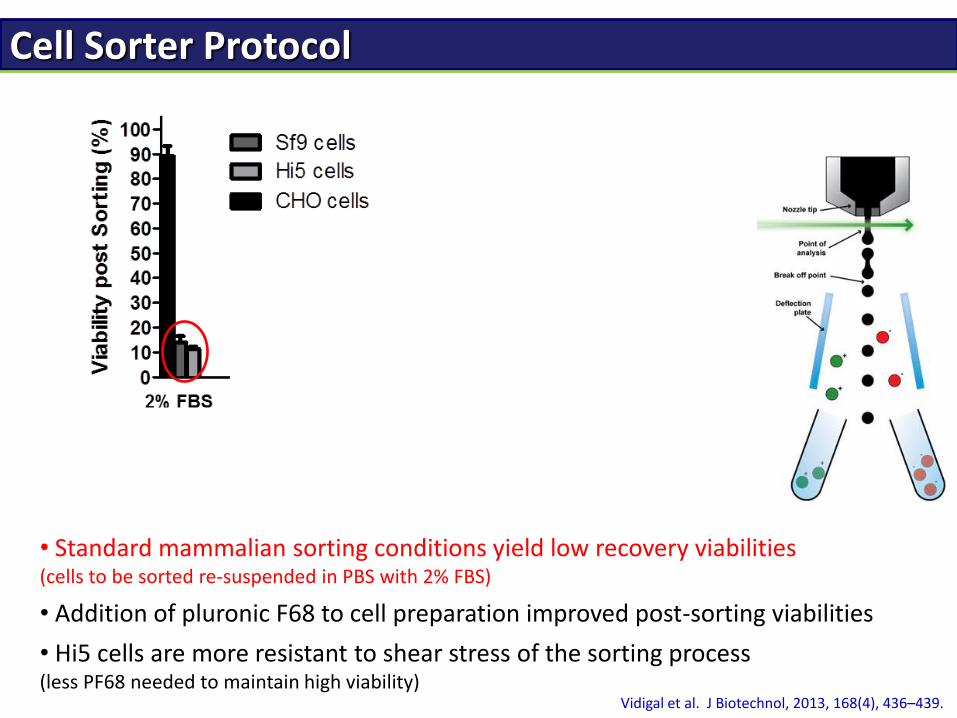
Cell Sorter Protocol
Vidigal et al. J Biotechnol, 2013, 168(4), 436–439.
• Standard mammalian sorting conditions yield low recovery viabilities (cells to be sorted re-suspended in PBS with 2% FBS)
• Addition of pluronic F68 to cell preparation improved post-sorting viabilities
• Hi5 cells are more resistant to shear stress of the sorting process (less PF68 needed to maintain high viability)
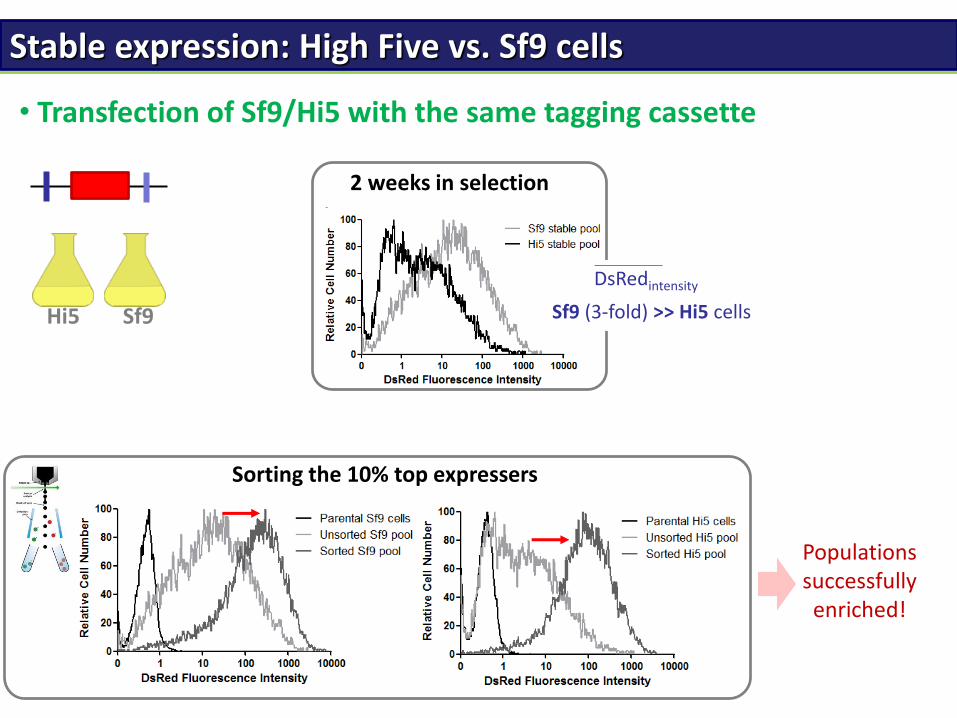
Stable expression: High Five vs. Sf9 cells
2 weeks in selection
• Transfection of Sf9/Hi5 with the same tagging cassette
DsRedintensity
Sf9 (3-fold) >> Hi5 cells Hi5 Sf9
Sorting the 10% top expressers
Populations successfully enriched!
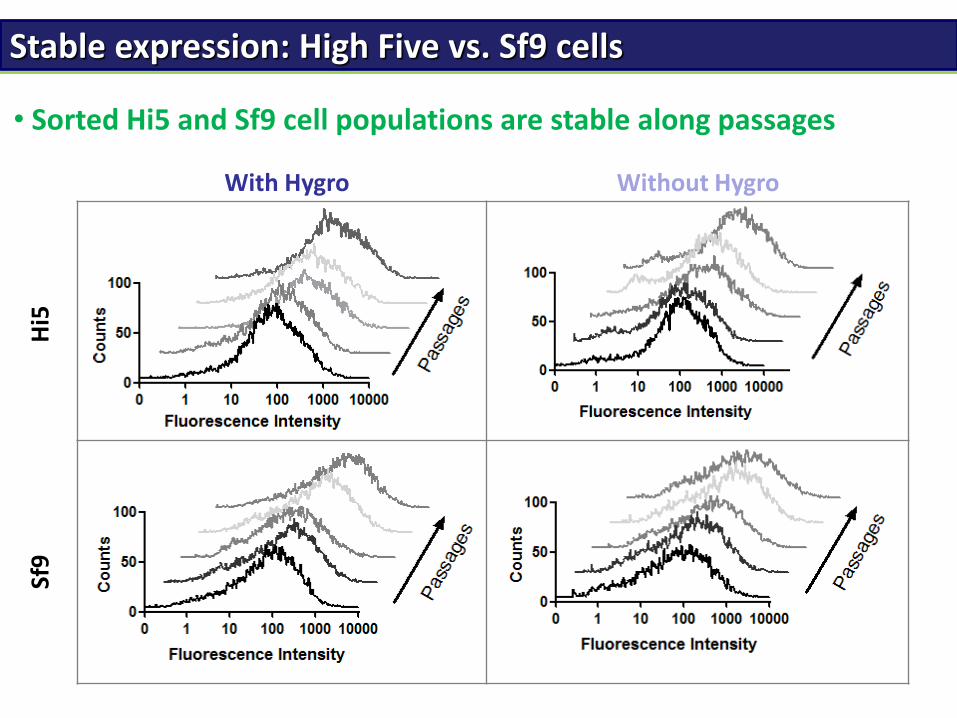
• Sorted Hi5 and Sf9 cell populations are stable along passages
Hi5
With Hygro Without Hygro
Sf9
Stable expression: High Five vs. Sf9 cells
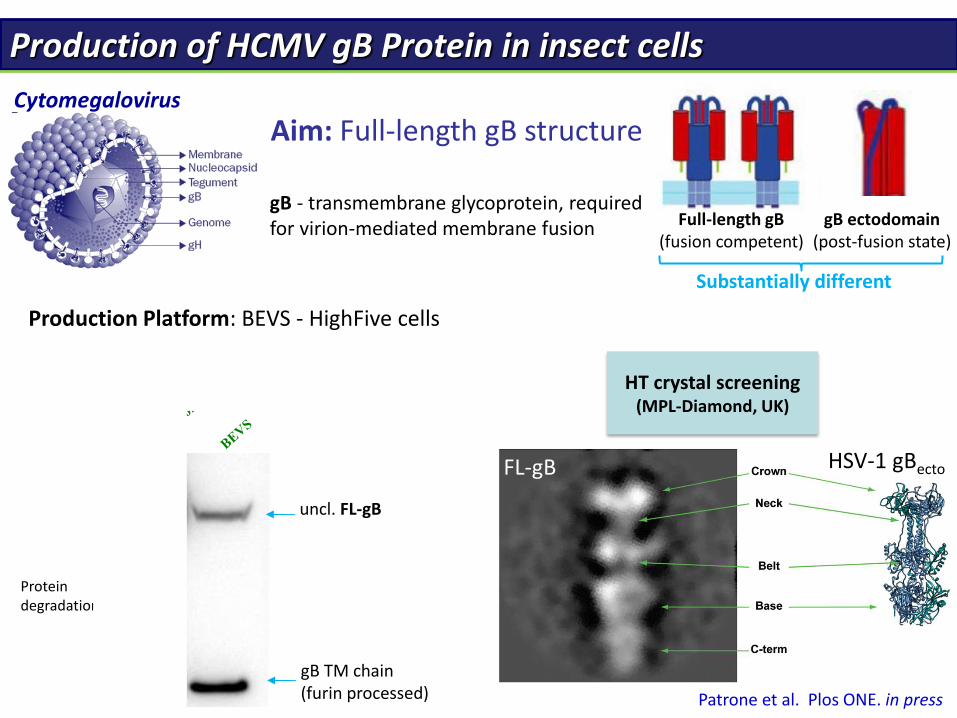
Production of HCMV gB Protein in insect cells
Cytomegalovirus
Full-length gB (fusion competent)
gB ectodomain (post-fusion state)
Substantially different
Aim: Full-length gB structure
gB - transmembrane glycoprotein, required for virion-mediated membrane fusion
Production Platform: BEVS - HighFive cells
• Intensive process optimisation allowed 0.35 mg/L
uncl. FL-gB
gB TM chain (furin processed)
Protein degradation
Patrone et al. Plos ONE. in press
HT crystal screening (MPL-Diamond, UK)
FL-gB HSV-1 gBecto
Sf9 / Hi5 populations expressing FL-gB
Higher specific productivity in Hi5 cells
gB standard(ng)
12.55
Sf9-gB sorted
10th9th8th
Hi5-gB sorted
6th5th4th
Hi5
-eG
FP
Sf9
-eG
FP
120kDa
55kDa
gB precursor
gB TM chain (Furin processed)
day
• Cassette exchange; G418 selection; Sorting of DsRed- cells
ii) FL-gB
0
2
4
6
8
10
12
14
0 1 2 3 4 5 6 7 8 9 10 11
Via
ble
ce
ll d
en
sity
(1
06ce
ll/m
l)
Time (days)
gB-expressing cells
Hi5 Sf9
0.00
0.10
0.20
0.30
0.40
0.50
Hi5-BEVS Hi5-gB Sf9-gBP
rote
in y
ield
(mg
/L)
• Comparison of expression from single copy integration
Stable expression: High Five vs. Sf9 cells
Final titers in Hi5-Flp similar to those obtained with optimized Hi5-BEVS
All lanes loaded with protein extracts from same number of cells
120 KDa
55 KDa
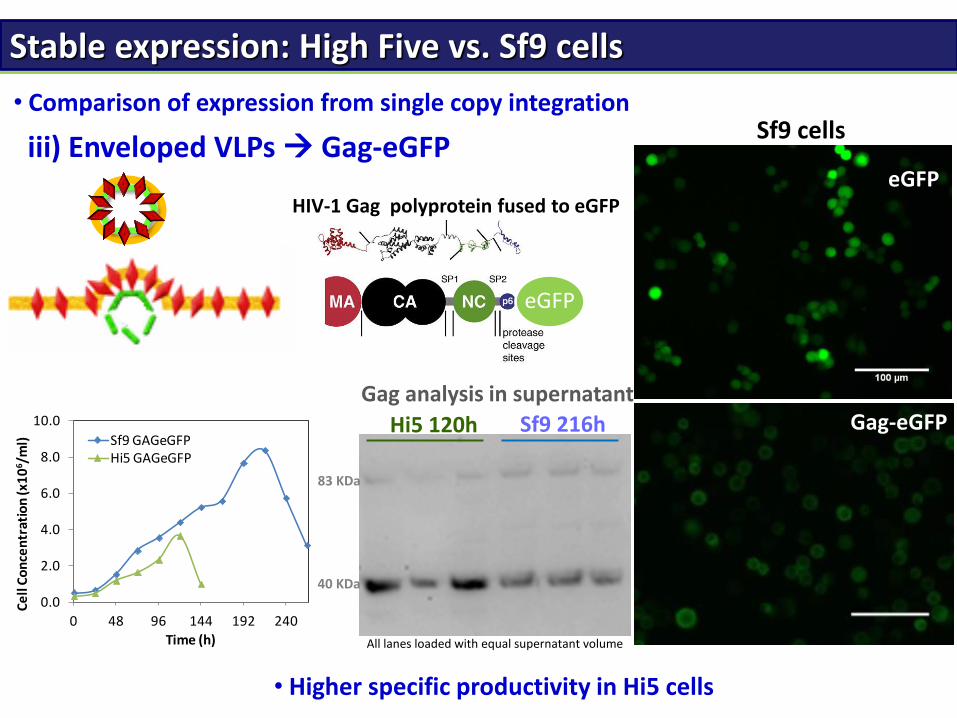
iii) Enveloped VLPs Gag-eGFP
• Comparison of expression from single copy integration
Stable expression: High Five vs. Sf9 cells
Gag-eGFP
Sf9 cells
eGFP
Hi5 120h Sf9 216h
0.0
2.0
4.0
6.0
8.0
10.0
0 48 96 144 192 240
Ce
ll C
on
cen
trat
ion
(x1
06 /
ml)
Time (h)
Sf9 GAGeGFPHi5 GAGeGFP
• Higher specific productivity in Hi5 cells
83 KDa
40 KDa
HIV-1 Gag polyprotein fused to eGFP
eGFP
All lanes loaded with equal supernatant volume
Gag analysis in supernatant
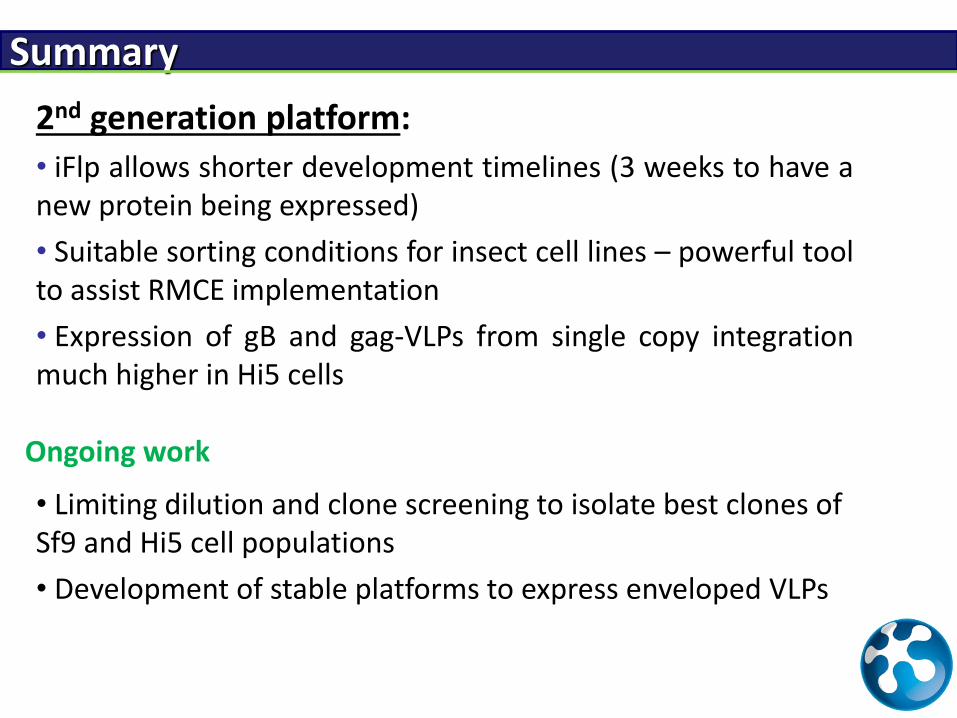
Summary
Ongoing work
2nd generation platform:
• iFlp allows shorter development timelines (3 weeks to have a new protein being expressed)
• Suitable sorting conditions for insect cell lines – powerful tool to assist RMCE implementation
• Expression of gB and gag-VLPs from single copy integration much higher in Hi5 cells
• Limiting dilution and clone screening to isolate best clones of Sf9 and Hi5 cell populations
• Development of stable platforms to express enveloped VLPs
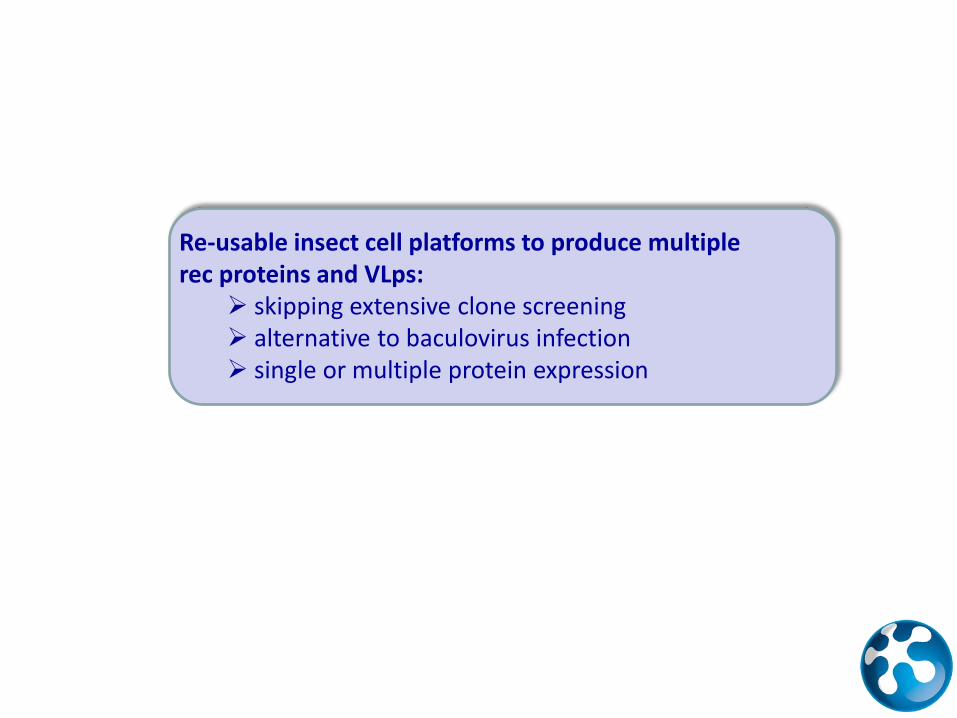
Re-usable insect cell platforms to produce multiple rec proteins and VLps:
skipping extensive clone screening alternative to baculovirus infection single or multiple protein expression
METABOLIC PROFILING OF INSECT CELL LINES
Disclosing cell line determinants behind system’s productivity
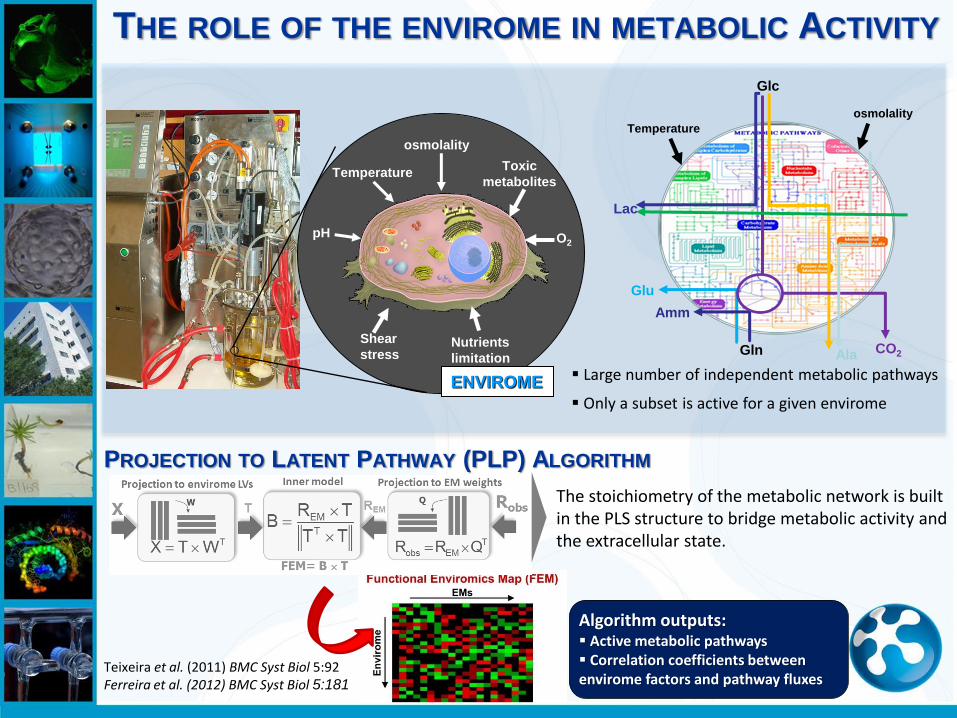
Temperature
pH
Shear
stress
osmolality
Toxic
metabolites
Nutrients
limitation
ENVIROME
O2
Large number of independent metabolic pathways
Only a subset is active for a given envirome
Glc
Lac
Ala Gln
Glu
Amm
CO2
osmolality
Temperature
THE ROLE OF THE ENVIROME IN METABOLIC ACTIVITY
Algorithm outputs: Active metabolic pathways Correlation coefficients between envirome factors and pathway fluxes
PROJECTION TO LATENT PATHWAY (PLP) ALGORITHM
Teixeira et al. (2011) BMC Syst Biol 5:92 Ferreira et al. (2012) BMC Syst Biol 5:181
The stoichiometry of the metabolic network is built in the PLS structure to bridge metabolic activity and the extracellular state.
Background
rNe
u A
ctiv
ity
(U/1
06
cel
ls)
0
1x10⁻¹
2x10⁻¹
3x10⁻¹
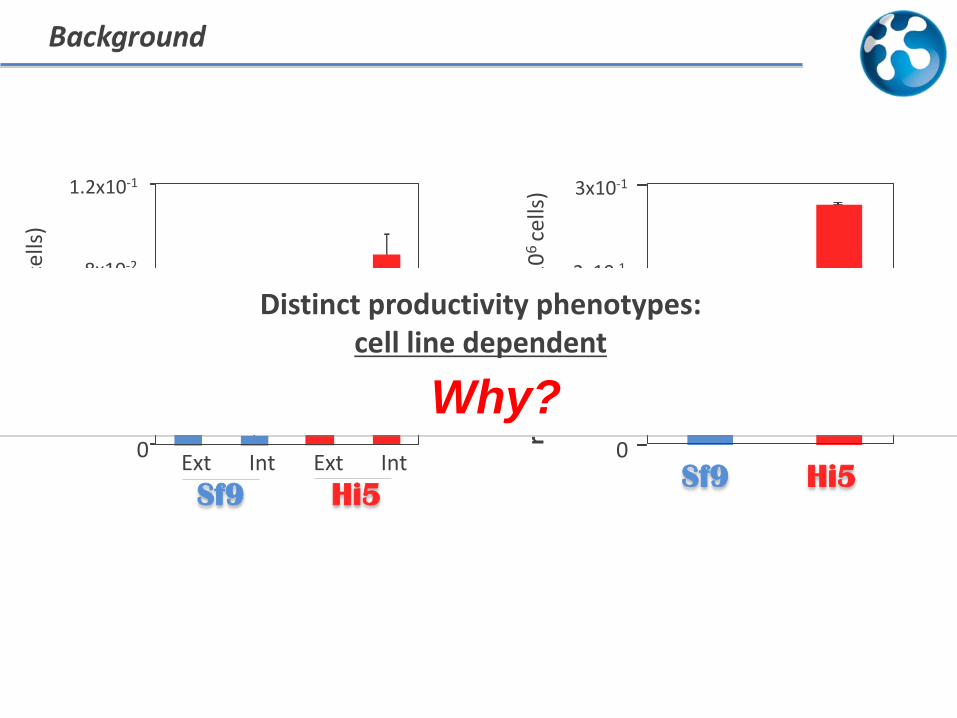
Sf9 Hi5 0
4x10⁻²
8x10⁻²
Ext Int Ext Int
Sf9 Hi5
GFP
(µ
g/1
06
cel
ls)
1.2x10⁻¹
rNe
u A
ctiv
ity
(U/1
06
cel
ls)
0
1x10⁻¹
2x10⁻¹
3x10⁻¹
Sf9 Hi5 0
4x10⁻²
8x10⁻²
Ext Int Ext Int
Sf9 Hi5
GFP
(µ
g/1
06
cel
ls)
1.2x10⁻¹
Distinct productivity phenotypes: cell line dependent
Why?
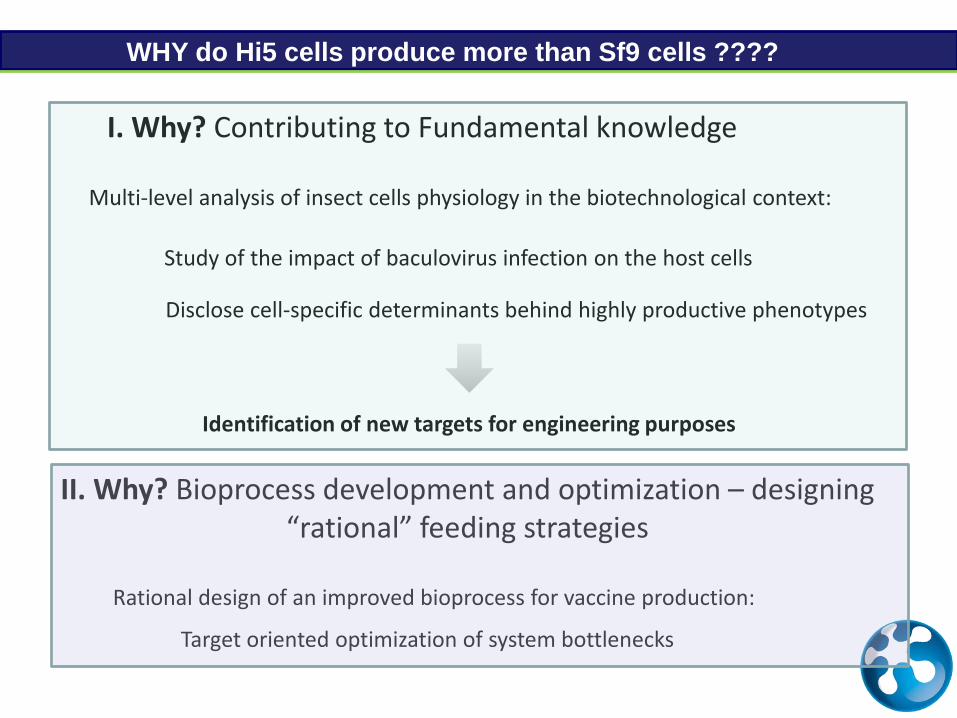
I. Why? Contributing to Fundamental knowledge
II. Why? Bioprocess development and optimization – designing “rational” feeding strategies
Multi-level analysis of insect cells physiology in the biotechnological context:
Study of the impact of baculovirus infection on the host cells
Disclose cell-specific determinants behind highly productive phenotypes
Identification of new targets for engineering purposes
Rational design of an improved bioprocess for vaccine production:
Target oriented optimization of system bottlenecks
WHY do Hi5 cells produce more than Sf9 cells ????
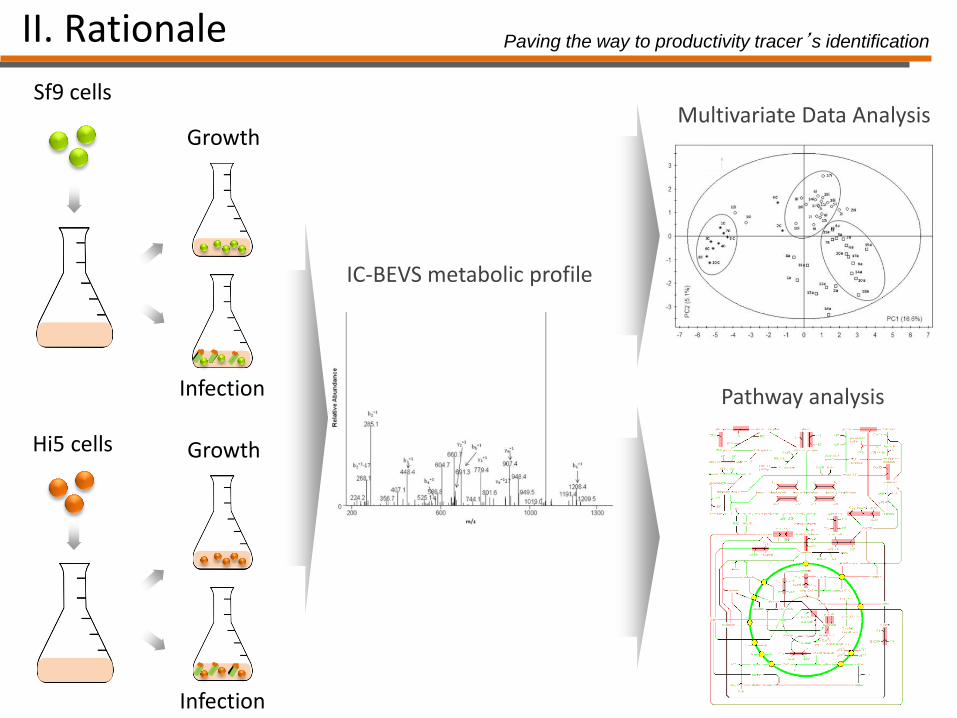
IC-BEVS metabolic profile
II. Rationale
Sf9 cells
Hi5 cells
Growth
Infection
Growth
Infection
Multivariate Data Analysis
Pathway analysis
Paving the way to productivity tracer’s identification
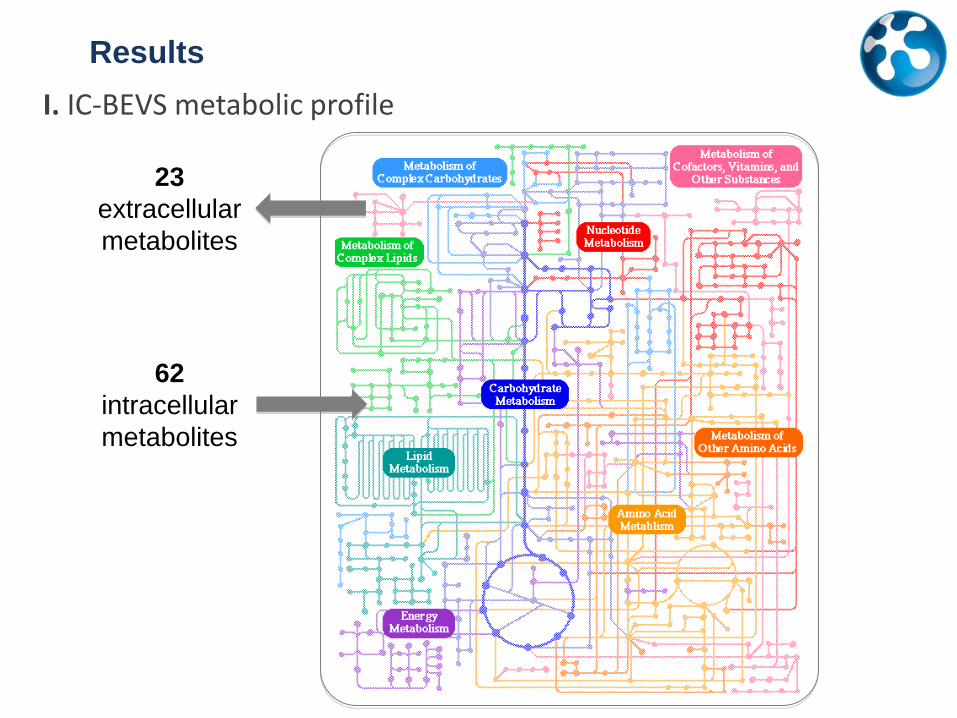
Results
I. IC-BEVS metabolic profile
23
extracellular
metabolites
62
intracellular
metabolites
Results
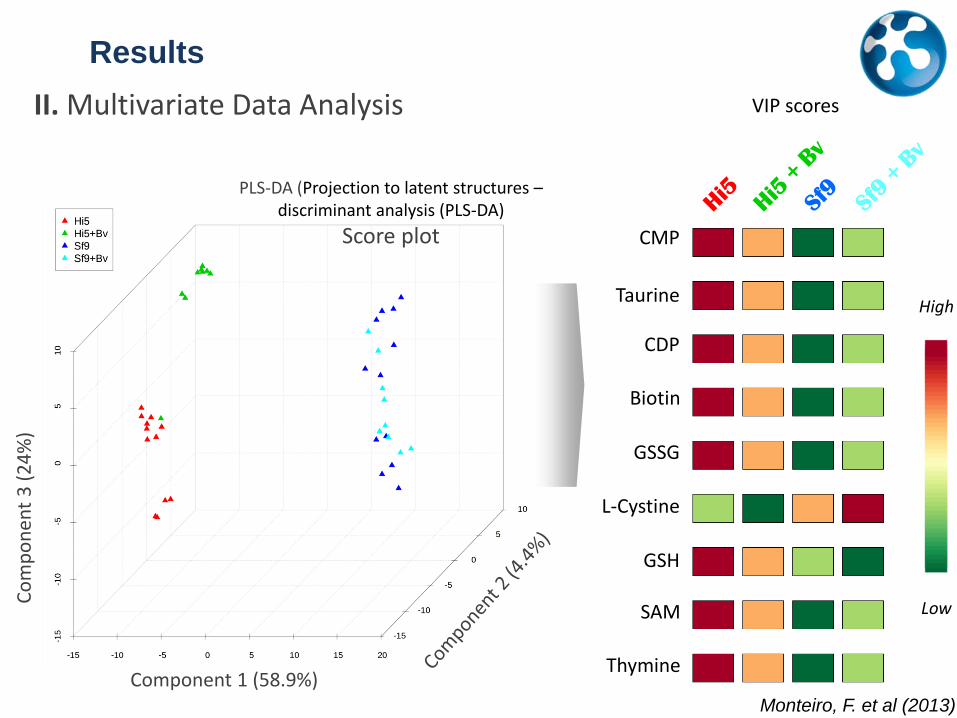
II. Multivariate Data Analysis
Component 1 (58.9%)
Co
mp
on
ent
3 (
24
%)
PLS-DA (Projection to latent structures – discriminant analysis (PLS-DA)
Score plot
High
Low
CMP
Taurine
CDP
Biotin
GSSG
L-Cystine
SAM
GSH
Thymine
VIP scores
Monteiro, F. et al (2013)
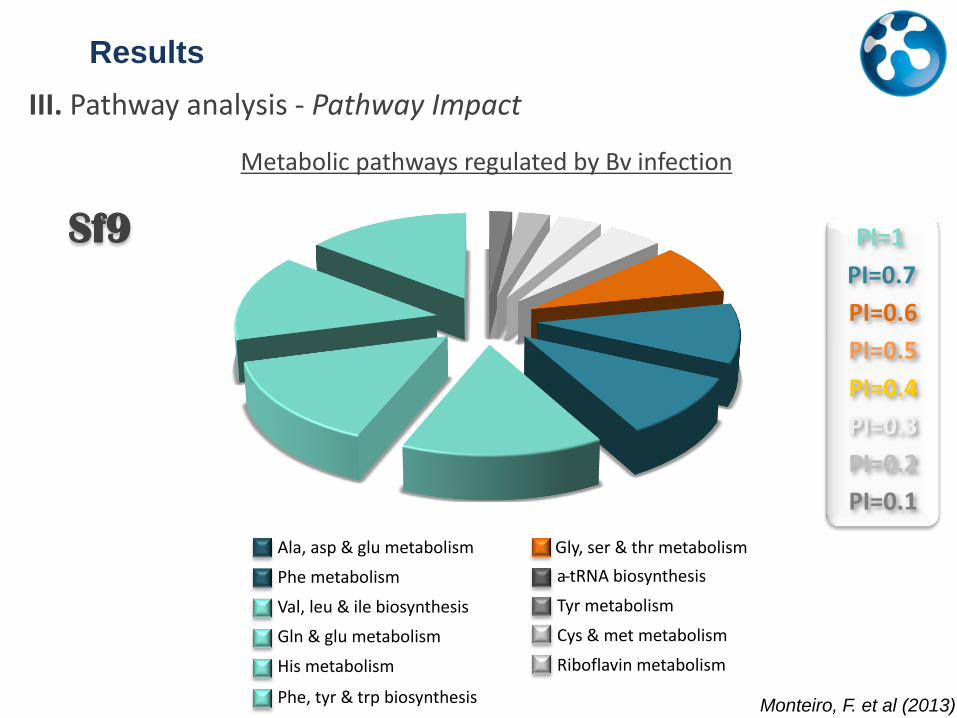
Results
III. Pathway analysis - Pathway Impact
Ala, asp & glu metabolism
Phe metabolism
Val, leu & ile biosynthesis
Gln & glu metabolism
His metabolism
Phe, tyr & trp biosynthesis
a - tRNA biosynthesis
Tyr metabolism
Cys & met metabolism
Riboflavin metabolism
Gly, ser & thr metabolism
Metabolic pathways regulated by Bv infection
PI=1
PI=0.7
PI=0.6
PI=0.5
PI=0.4
PI=0.3
PI=0.2
PI=0.1
Sf9
Monteiro, F. et al (2013)
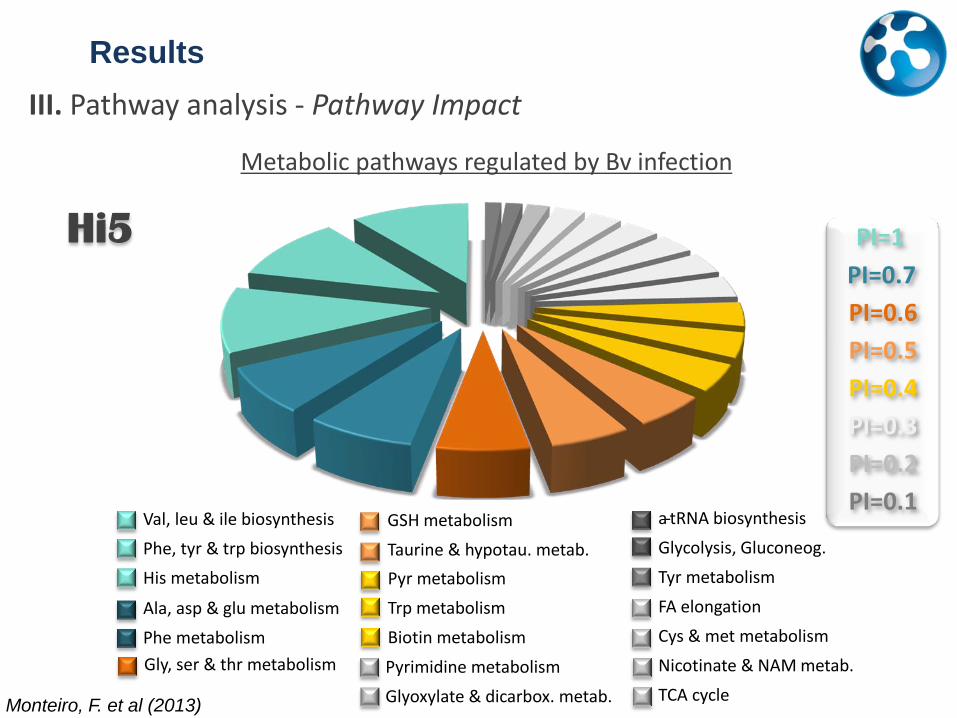
Results
III. Pathway analysis - Pathway Impact
Metabolic pathways regulated by Bv infection
PI=1
PI=0.7
PI=0.6
PI=0.5
PI=0.4
PI=0.3
PI=0.2
PI=0.1
Hi5
Val, leu & ile biosynthesis
Phe, tyr & trp biosynthesis
His metabolism
Ala, asp & glu metabolism
Phe metabolism
Gly, ser & thr metabolism
tRNA biosynthesis
Glycolysis, Gluconeog.
Tyr metabolism
FA elongation
Cys & met metabolism
Nicotinate & NAM metab.
TCA cycle
a - GSH metabolism
Taurine & hypotau. metab.
Pyr metabolism
Trp metabolism
Biotin metabolism
Pyrimidine metabolism
Glyoxylate & dicarbox. metab. Monteiro, F. et al (2013)
Conclusions
Multivariate analysis pin-pointed specific metabolite families related to hyper productive states;
Hi5 cells re-orient their metabolic activity towards feeding the increased biosynthetic activity, a key factor to hyper-productivity, whilst Sf9 do not; The “metabolomic decomposition” of the IC-BEVS system identified traits leveraging productivity, and specific pathways of utmost importance to support it.
Summary and Future Work Acknowledgements
Kristala Prather (MIT) Jopp Van den Heuvel (HZI) Hansjorg Hauser (HZI)
Funding:
Ana Sofia Coroadinha Manuel Carrondo Cristina Peixoto Marcos Sousa
Ana Teixeira
Fabiana Fernandes
João Vidigal
Mafalda Dias
Marco Patrone
Francisca Monteiro