insider trading and conflicts of interest: evidence from...
TRANSCRIPT

Insider Trading and Conflicts of Interest: Evidence from Corporate Bonds
Simi Kedia and Xing Zhou1
ABSTRACT
This paper examines the prevalence of insider trading in the corporate debt market prior to takeover announcements, and the related conflicts of interest within financial intermediaries. We document significant pre-announcement trading activities and price movements in target bonds, in directions consistent with the nature of pending information. Unlike target stocks, target bonds do not always gain in an acquisition. Target bonds rated higher than the acquirer’s stand to lose whereas those rated lower stand to gain. Since selling (buying) target bonds that stand to lose (gain) prior to the public announcement requires information about acquirer characteristics, our evidence cannot be attributed to market anticipation, but is consistent with insider trading. Further, bond dealers affiliated with advisory investment banks sell in anticipation of negative news on bonds, pointing to a possible channel of information leakage. Such negative news seems to be incorporated into bond prices no slower than into the target stocks. Finally, recent improvements in bond market transparency appear to deter insider trading in bonds.
1 Both authors are at the Rutgers Business School. The respective contact information is [email protected] and [email protected]. We would like to thank Andriy Bodrunak, Henrik Cronqvist, John Griffin, Jean Helwege, Edith Hotchkiss, Lisa Meulbroek, Itzhak Venezia, Dan Weaver and seminar participants at 2009 WFA meetings at San Diego, Rutgers University, University of Alabama, and the 2nd Corporate Governance Conference at Drexel for helpful comments. We thank the Whitcomb Center for financial support. All errors are ours.

2
In a recent keynote address, Linda Thomsen, director of the SEC enforcement
division, announced the establishment of the Hedge Fund Working Group for the purpose
of addressing “securities law violations by hedge funds, with particular attention to the
issue of insider trading….”2 This was motivated by the recent unusual spikes in stock
trading prior to corporate mergers and acquisitions. While such attention to insider
trading in the stock markets reflects the regulators’ continuing scrutiny of potential abuse
of material nonpublic information, it also raises questions and accompanying concerns
about the relatively scant surveillance of the workings of the corporate bond market,
given its importance in corporate financing.3 In particular, does insider trading ever
occur in the corporate bond market? If so, what are the potential channels for
information leakage prior to its public release? Further, how do informed traders time
and distribute their trading activities across the issuer’s stock and bonds given the nature
of new information? And finally, has the market transparency brought by recent
implementation of the Trade Reporting and Compliance Engine (TRACE) helped deter
insider trading in bonds?
In this paper, we try to address these questions by examining trading activities in
the corporate bond market prior to merger and acquisition (M&A) announcements.
Corporate bonds provide a more effective tool than traditional stock prices for examining
the potential leakage of information prior to its public releases. As target shareholders
always gain in a merger, a run-up in stock prices prior to the announcement of the
takeover can either be attributed to the leakage of information, or market anticipation. It
2 Regulatory Keynote Address at the Second Annual Capital Markets Summit at the U.S. Chamber of Commerce on March 26, 2008. 3 Edwards, Harris and Piwowar (2007) find that the aggregate value of corporate bonds is roughly equal to that of stocks in the U.S.

3
is difficult to distinguish between these two possibilities by studying prices and trading
volume of the target equity. Target bond holders, by contrast, do not always benefit in a
takeover. In fact, target bondholders only benefit when their bonds carry greater risk than
those of the acquiring company, and will lose out otherwise. Therefore, profitable
trading strategies, i.e., selling target bonds that stand to lose or buying target bonds that
stand to gain prior to the public announcement, require information about acquirer
characteristics, and this cannot be attributed simply to market anticipation of a takeover.
Further, the bond market also facilitates an examination of potential channels of
information leakage by making it possible to identify the dealers involved in a bond trade.
Such information allows us to examine whether affiliation of the bond dealers with
target/acquirer advisory investment banks, who are privy to the takeover details, is a
potential source of informed trading.
Despite extensive study on insider trading in equity and derivative markets, there
has been no systematic work on potential insider trading in the corporate bond market.
Even though bond investors face lower overall liquidity than investors in other securities,
the lack of regulatory oversight and the relative opacity of the bond market may render it
a preferred venue for informed trading.4 Using all completed merger and acquisition
deals from 1994 to 2006 where both the target and acquirer have bonds that are included
on the Mergent Fixed Income Securities Database (FISD), we find that relative to a
4 Rule 10b-5 prohibits “any” fraudulent or deceptive scheme “in connection with the purchase and sale of any security by any individual with fiduciary duty to a firm’s shareholders.” However, the legal rule of liability with respect to corporate bonds has never been as broad as the literal language of Rule 10b-5 partially due to ambiguous nature of “fiduciary” duty owed to bondholders. On the other hand, Rule 14e-3 appears to clearly bar insider trading in corporate bonds during the takeover process. The lack of reporting on bond trades and the resulting market opacity makes it extremely difficult to detect any violation of the insider trading law in the corporate bond market. Lower regulatory oversight in bonds is also evidenced by the fact that insiders do not have to report their transactions in straight bonds to the SEC under Section 16(a) of the Securities Exchange Act of 1934.

4
control group, target bonds are significantly more likely to be traded in the three month
period prior to announcement (See Figure 1A). Accompanying this higher volume,
abnormal target bond returns in the three month pre-announcement period are highly
related to the degree of risk of target bonds relative to that of the acquirer bonds. In other
words, pre-announcement abnormal bond returns are positive when the target bond stands
to gain and negative when the target bond stands to lose (Figure 1B). The fact that the
pre-announcement bond returns are significantly related to acquirer characteristics
suggests the role of information rather than anticipation of the acquisition.
Of great interest are the potential channels for such information leakage prior to
its public release. The National Association of Insurance Commissioners (NAIC) bond
transaction data used in this study provides information identifying the broker/dealer and
the direction of their transactions. For each trade, we identify the bond dealer as
potentially informed if they are affiliated with one of the M&A advisors. We find that
active trading by affiliated dealers is associated with larger pre-announcement returns.
Further, when bond dealers are affiliated with one of the target advisors they tend to sell
more of the bonds that stand to lose. These results suggest that information flows
between groups within investment banks.
If such informed trading does occur in the corporate bond market, how is it
related to the trading activities in the issuer’s equity? We find that the timing of informed
trading between these two markets seems to be determined by the nature of the
information. When target bonds stand to gain from the acquisition, target stock
experiences positive returns before significant bond trading occurs. However, when
target bonds stand to lose from the acquisition, the direction of information flow is

5
reversed: information is first incorporated in the bond market, followed by a substantial
positive return in the stock market. Therefore, bond markets appear to be the first choice
of informed traders when the acquisition has negative influence on the bond value. This
evidence of informed trading, together with the bond market’s great appeal for informed
trading in certain scenarios, suggests the need to increase transparency and surveillance
in these markets.
To explore the potential effect of improved transparency in the bond market, we
directly examine whether the recent implementation of the TRACE system helped deter
informed trading in bonds. Centralized reporting and immediate dissemination on bond
transaction information should facilitate effective monitoring of the market and result in a
lower incidence of insider trading. In fact, we find that targets which have at least one
bond included in the TRACE system at the time of merger announcement experience less
pre-announcement price movement, and there is less evidence of the affiliated bond
dealer’s informed trading prior to the public announcement. Our findings suggest an
important role of transparency in limiting informed trading.
The rest of the paper is organized as follows. Section I discusses related literature
while section II presents information on the sample data and methodology used in this
study. We examine pre-announcement abnormal bond returns in section III. Section IV
explores the potential channels of information leakage. Section V discusses the impact of
market transparency, and section VI focuses on the flow of information across stock and
bond markets. Section VII concludes.

6
I. Related Literature
Our study relates to several strands of literature. First, it is linked to the literature
on insider trading and its influences on market prices. Several studies find evidence of
abnormal volume and price increases during periods of known insider trading (see
Cornell and Sirri (1992), Meulbroek (1992), Meulbroek and Hart (1997), Chakravarty
and McConnell (1997, 1999), Fishe and Robe (2004)). However, if it is not known when
insider trading occurs, it is difficult to conclude its prevalence from a study of stock price
and volume in the period prior to announcement. Indeed, by examining trading in target
firms prior to M&A announcements, other studies (Jarrell and Poulsen (1989), King and
Padalko (2005), Gao and Oler (2008)) conclude that the observed abnormal trading
activities and the resulting price run-ups are consistent with market anticipation of a
takeover announcement, and hence cannot be used as evidence of insider trading.
We differentiate between insider trading and market anticipation by examining
pre-announcement activity in the corporate bond market. Unlike equity, target bonds do
not always gain in an acquisition. Early theoretical work suggests that target bondholders
could lose if the target’s credit worthiness exceeds that of the acquirer. On the other hand,
target bondholders could gain if the coinsurance effect of combining the two imperfectly
correlated cash flows result in a reduction in default risk (see Levy and Sarnat (1970),
Lewllen (1971), Higgins and Schall (1975), Galai and Masulis (1976), Shastri (1990)).
Though earlier empirical studies failed to find significant abnormal bond returns prior to
M&A announcements (see Kim and McConnell (1977), Asquith and Kim (1982), Eger
(1983), Dennis and McConnel (1986), and Maquieira, Megginson, and Nail (1998)),
Billett, King and Mauer (2004) (BKM thereafter) use relatively new data and find

7
significant support for the theoretical predictions. In particular, they find that target
bonds rated below the acquirer’s earn significant positive returns while those rated no
lower than the acquirer’s experience significant negative returns. As target bond returns
are determined by acquirer characteristics, any evidence of pre-announcement trading in
a direction consistent with acquirer characteristics suggests a possible leakage of
information, rather than market anticipation.
Second, this paper fits into the literature on the conflicts of interest within
financial intermediaries. Acharya and Johnson (2007, 2008) and Ivashina and Sun (2007)
document evidence that banks potentially use information from lending relationships to
trade credit default swaps and equity. Ritter and Zhang (2007) find that lead underwriters
allocate hot IPOs to affiliated funds. Ellis, Michaely, and O’Hara (2000) show that
NASDAQ market makers support the post-IPO stock price of firms underwritten by
affiliated investment banks. Our paper is also related to and complements Bodnaruk,
Massa and Simonov (2007), who find that equity investment desks affiliated with
acquirer investment banks increase their investment in target equities prior to takeover
announcements. Though they conduct robustness tests to control for potential
anticipation of the takeover, our use of corporate bonds allows us to better rule out this
possibility. Moreover, the exact timing of bond trades and dealer identification
information contained in the NAIC database allows us to examine trading activities close
to the announcement of the takeover, rather than be restricted to examining equity
positions at the end of calendar quarters. Further, changes in bond regulation over this
time period allow us to shed some light on potential approaches to control insider trading.
Along with Bodnaruk, Massa and Simonov (2007), our findings of abnormal trading

8
behavior by dealers who are affiliated with M&A advisors, but not by those without,
provide significant insights into the potential channels of information leakage in these
corporate events, and the resulting conflicts of interest within financial intermediaries.
Third, our study is also related to several recent papers that examine the influence
of market transparency brought by the implementation of the TRACE system.5 TRACE-
induced transparency has been shown to reduce transaction costs in bonds (Edwards,
Harris and Piwowar (2007)), lower spreads for large trades in a sample of BBB bonds
(Goldstein, Hotchkiss and Sirri (2007)), cut transaction costs by 50% for TRACE-eligible
bonds and by 20% for non-eligible ones (Bessembinder, Maxwell and Venkataraman
(2006)) and decrease volatility and reaction time to news (Ronen and Zhou (2008)).
However, Bessembinder and Maxwell (2008) find that improved transparency in bond
markets may shift trading towards other securities such as syndicated bank loans and
credit default swaps (CDS), as it discourages dealers from carrying inventory and sharing
their research. Our paper compares the pre-announcement abnormal returns for bonds by
firms with TRACE coverage versus those without to study whether increased bond
transparency impacts the incidence of insider trading.
Finally, the question of ‘where does information-based trading occur first’ has
been receiving much attention in the literature recently. While earlier studies have relied
on the Vector Auto-regression (VAR) models to determine the lead-lag relationships
between stock and bond returns, Ronen and Zhou (2008) question this approach in
capturing the dynamics of information revelation. In fact, by studying bond trade and
price reactions to earnings announcements, they find that bond markets serve as an
5 The TRACE system began in July 1, 2002 and requires all its members to report corporate bond market transactions within 75 minutes (now 15 minutes). Dissemination of trade information was gradually phased in, and since February 7, 2005, all corporate bonds are subject to immediate dissemination.

9
important venue for informed trading, especially when equity liquidity is low. Datta and
Iskandar-Datta (1993) find significant bond price response to the Wall Street Journal’s
Insider Trading Spotlight publication of insiders’ stock trading. Acharya and Johnson
(2008) find that equity related news appears to be incorporated in the stock and options
markets first, while credit news is initially traded in the debt and CDS markets. By
studying the stock price reaction prior to and around potentially informed bond trades,
our paper highlights the importance of the nature of information in the determination of
where informed traders trade.
II. Data, Methodology and Summary Statistics
A. Sample
Our sample consists of all completed M&As from 1994 through 2006.6 Of the
3,406 deals for which we were able to retrieve deal information from SDC and firm
characteristics from Compustat, 642 involve a target and an acquirer which have bond
characteristic information from the FISD database. These 642 target firms had a total of
2,344 bonds outstanding during the merger or acquisition period.7 Since credit rating
changes tend to be accompanied by abnormal volume and price changes, we excluded
bonds which experienced any rating changes in three-month pre-announcement period.
The final sample consists of 1,611 bonds issued by 442 unique target firms.
6 The sample included transactions that involved full acquisitions or acquisition of majority interest, and where both the target and acquirer were public firms. This resulted in 4,168 deals, which was further reduced to 3,406 after ensuring that both target and acquirer were covered in CRSP and Compustat. 7 We remove 13 bonds due to missing value of coupons, 66 bonds due to missing day count basis, 79 bonds with floating coupon rates, 21 bonds with non semi-annual coupon payments, and 67 bonds with missing information on first coupon date. Bonds that are in default and bonds that are callable following the merger have also been removed. Finally, we exclude bonds that have change in control provisions and a bond price that is below par. As most of change in control provisions specify that bonds are putable at par, these provisions are not meaningful if bonds are trading above par.

10
We obtained tick-by-tick trade information for this sample of bonds from the
FISD’s NAIC bond transactions file. This data file includes all purchases and sales of
public fixed income securities by insurance companies who are required to report all their
bond trades to NAIC8. We then applied the reversal filter from Edwards, Harris and
Piwowar (2007) to exclude trades with suspicious data pricing errors. Equity data for the
target firms were retrieved from CRSP.
B. Trading Frequency and Volume
As discussed above, several studies find significant increases in equity volume
during episodes of insider trading. The possible leakage of information in the corporate
bond market prior to its public announcement should also be marked by abnormally high
trading activities. We begin by examining the propensity of target bonds to be traded in
the three-month pre-announcement period. We first calculate the total number of trades
and turnover for each bond within this period.9 We then benchmark these two measures
to those of a control group of bonds, which consists of all other bonds (not subject to any
takeover) that had a similar credit rating and time to maturity as the target bond over the
same period.10 On average, the control-adjusted number of trades and turnovers are
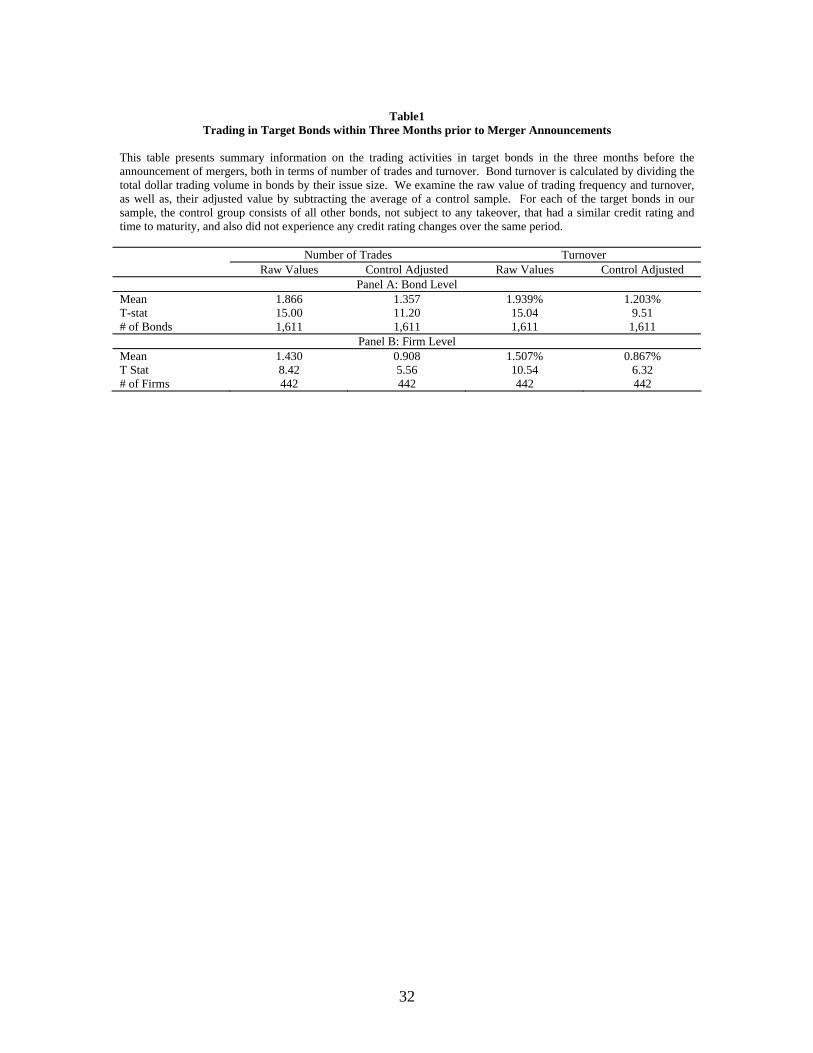
1.357 trades and 1.2% respectively, and are both significant (Table 1). In summary,
target bonds have a significantly higher frequency and volume of trading in the three
months prior to announcement.
8 The NAIC data have also been analyzed in a number of papers such as Schultz (2001), Campbell and Taksler (2003), Krishnan, Ritchken, Thomson (2004), Bessembinder, Maxwell and Venkataraman (2006), and Cai, Helwege and Warga (2007). 9 Turnover is calculated by dividing the aggregate three month trading volume by the bond’s issue size. 10 We consider two bonds with maturities within one year of each other to have similar time to maturity. Further, all bonds in the control group should have no credit rating changes during this three month period. If a target bond did not have at least 5 control bonds, we excluded it from this analysis.

11
To examine if this higher trade volume observed at the bond level is also seen at
the firm level, we calculate the weighted average trading frequency and turnover across
all bonds by a single firm, with the weights being the bond issue size. Consistent with
the bond level results, there exist significant evidence of high trading frequency and
volume at the firm level prior to the public release of corporate takeovers.
C. Abnormal Bond Returns
For each of our sample bonds, we also calculate the abnormal bond returns in a
way similar to that of Cai, Helwege and Warga (2007) and Bessembinder, Kahle,
Maxwell and Xu (2008). Since bond trades of different sizes tend to occur at very
different prices, we calculate daily volume weighted average price to get a better estimate
of the value of the bond at date t. Bessembinder, Kahle, Maxwell and Xu (2008) also
favor weighting individual bond trades by size, rather than using the last trade of the
day.11 We then add the accrued interest to get the full bond price for date t. The actual
bond return is calculated as the percentage change in the full price across two trading
days, where both trading days are within the three months period prior to the
announcement of the acquisition. 299 bonds issued by 118 firms meet this criterion and
comprise the sample for the remainder of our study.
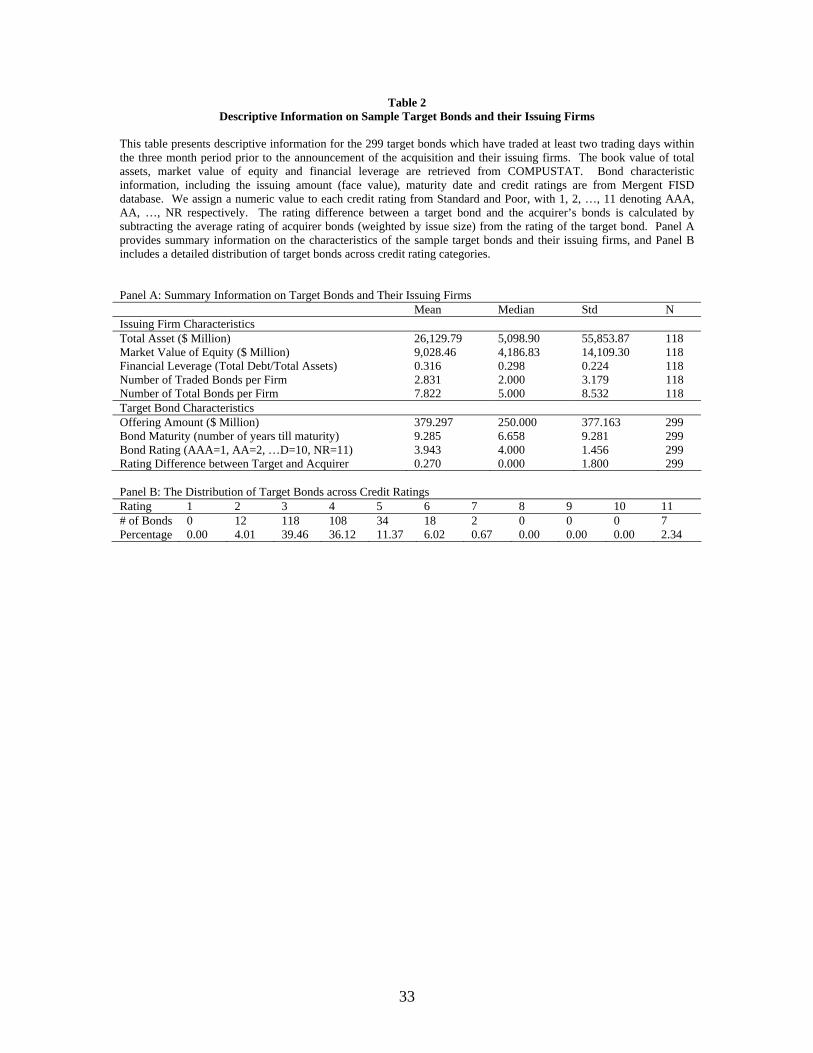
Table 2 provides descriptive information on our sample bonds and their issuing
firms. The average market value of the equity of our sample target firms is 9.03 billion,
with an average financial leverage of 0.32. While these target firms on average have
about 8 bonds outstanding, less than 3 of them are traded during the three-month pre-
11 Bessembinder, Kahle, Maxwell and Xu (2008) also suggest excluding non-institutional trades (defined as trades under $100,000) in calculating the weighted average daily prices. As our sample consists only of bond trades by insurance companies, we do not eliminate trades less than $100,000 from our sample.

12
announcement period. Further, these 299 sample bonds on average have about 9 years
till maturity and are rated between BBB and A by Standard & Poor during the sample
period, with almost 75% of our sample target bonds rated either BBB or A (panel B). We
also calculated the difference between a target bond’s rating and the average rating of the
acquirer bonds (weighted by issue size). Target bonds are rated slightly lower than the
acquirer bonds, with an average difference of 0.27 in the credit rating differences.
We estimate abnormal bond returns by subtracting the market returns, proxied by
the returns in the Lehman Brothers Corporate Indices for bonds with similar credit ratings
and maturity from raw returns.12 Since trading on inside information is more likely to
occur in the days immediately prior to the announcement of the merger, we examine the
abnormal bond returns over the last two days when trading occurred prior to the
announcement, which we refer to as the last abnormal return. We also examine the
cumulative abnormal returns (CAR) over the three month period by accumulating
abnormal returns over all bond transactions in this period. As illustrated in Figure 2, the
last abnormal return and the three month CAR can be represented as AR1 and (AR1+AR2)
respectively.
The abnormal returns around takeover announcements are also calculated using
two trading days, where the first trading day is the last day the bond is traded prior to
announcement, and the second trading day is the first day the bond is traded after the
announcement. To calculate this cross announcement return, we require the second day
to be within three months of the acquisition announcement, which is available for only
12 We classified a bond into intermediate (long-term) if its time to maturity is less (no less) than 10 years followings Lehman Brothers rules in constructing their indices for bonds with different maturities.

13
256 out of the total 299 sample bonds. In Figure 2, the cross announcement abnormal
return is represented by AR3.
Consistent with BKM, we find that target bonds on average earn abnormal returns
of 1.1% across announcements, which is significant at 1% level (Table 3). Mean pre-
announcement returns, measured by both last abnormal return and CAR are positive and
significant. A similar pattern emerges when bond returns are aggregated at the firm level
(Panel B of Table 3).
As discussed in section I, target bonds could gain or lose depending on its credit
rating relative to that of the acquirer bonds. Target bonds are classified as losing (gaining)
bonds if they stand to lose (gain) in the acquisition, i.e., if their rating is better (worse)
than the highest (lowest) rated acquirer bond.13 All remaining bonds are in the other
13 We assign a numeric value to each credit rating from Standard and Poor, with 1, 2, …, 11 denoting AAA, AA, …, NR respectively. As better rated bonds have smaller ratings, losing bonds would have a value that is smaller than the lowest rated acquirer bond.
Three Months
After
AR2 AR1
Trading Day +1
Figure 2 Timing of Bond Trades around M&A Announcement
M&A Announcement
Three Months Before
AR3
Trading Day -1
Trading Day -2
Trading Day -3

14
category. Note that this is a conservative classification, with bonds being classified as
gaining or losing only if they are going to benefit or lose unambiguously.
As expected, the bonds in the losing category have negative pre-bond returns
though these are not significant. The across announcement return for the losing bonds is
negative though again not significant. The last returns are positive for bonds that stand to
gain and those that belong to the intermediate category. Not surprisingly, the difference
between gaining and losing bonds is significant.
III. Evidence of Insider Trading: Target Bond Prices and Acquirer Characteristics
A. Abnormal Pre-announcement Bond Returns
In this section, we do multivariate analysis to explore the informational content of
pre-announcement abnormal bond returns. Instead of examining the two extreme groups
of gaining/losing bonds, in this section we create a continuous variable to capture the
potential gain/loss of the target bond. We first estimate the acquirer’s average credit
rating across all its bonds, which is the weighted average rating with the weights being
issue size.14 The difference between an individual target bond rating and the acquirer’s
average bond rating, referred to as CreditDiff, captures the potential gain for the target.
The larger this CreditDiff the lower the target bond rating relative to the average acquirer
rating, and the more the target bond is expected to gain. This is so because lower rated
bonds have higher numerical values. In particular, if the CreditDiff is negative it
signifies that the target bonds are likely to lose from the acquisition. If informed trading
exists in the bond market prior to the announcement, then CreditDiff should be positively
related to pre-announcement abnormal returns. 14 As some of a firm’s bonds are not traded in the same period, we use each bond’s issue size (instead of its market value as in BKM) as the weight to calculate the average credit rating for the acquirer.

15
Our tests control for bond credit ratings and maturities as the abnormal bond
returns are estimated by subtracting the same period return in the Lehman Index matched
on credit rating and maturity. In addition, we control for potential bond liquidity effects
by including the age and issue size of the bond. Finally, we control for firm specific
characteristics, such as market value of the issuer, financial leverage (the ratio of total
debt to total assets) and profit margin (net income to sales ratio) from the last fiscal year
prior to the acquisition announcement. The base specification, whose results are reported
in Table 4, is as follows:
** *
***
PMFinLevIssuerSize
AgeIssueSizeCreditDiffABR
PMleveragesize
ageSizeIssueiCreditDiffi
βββ
βββα
+++
+++=
(1)
where ABRi denotes the ith target bond’s last abnormal return, and other variables are as
discussed above. Note that if the variable of interest, CreditDiff has a positive coefficient,
it implies that there is a price run-up (decline) in target bonds which is associated with
positive (negative) information on bonds.
As seen in the Table 4, the coefficient of CreditDiff is positive and significant at
1% level. The results are robust to controlling for target bond and firm characteristics.
A significant positive coefficient on CreditDiff implies that target bonds that have a
better (worse) rating than the acquirer have significant negative (positive) abnormal
returns. The coefficient on CreditDiff of 0.357 implies that almost 25% of the total gain
arising from the acquisition of target bonds, rated one category lower than the acquirer
bonds, are realized prior to the public announcement.15
15 Since the average last return is 0.348 and the average return across M&A is 1.102, the overall average return from the M&A is 1.45%. The return of 0.357 for one credit rating difference is about 25% of the total return.

16
As Acharya and Johnson (2008) find that credit default swaps are more sensitive
to negative news, we examine if there is a similar effect for the bonds that stand to lose.
To capture this effect we introduce a loss dummy that takes the value of one if the target
bond is rated better than the highest rated bond of the acquirer. As shown in Panel IV of
Table 4, the coefficient of Loss Dummy is negative though not significant. The lower
abnormal return for the losing bonds appears to be mostly captured by CreditDiff.
B. Robustness Check
In this section we examine the sensitivity of our results to 1) analysis conducted at
the aggregate firm level, 2) alternate ways to estimate the potential for gain or loss of
target bonds, 3) using a six month period prior to announcement for our analysis, 4) an
alternate proxy for pre-announcement returns, and 5) extending the sample to also
include private acquirers and Leveraged Buyout transactions (LBOs).
While the focus of our analysis in on the bond level, we also conduct our analysis
at the firm level to address concerns of possible correlation among bonds issued by the
firm and overweighing firms with multiple bond issues (see Bessembinder, Kahle,
Maxwell and Xu (2008)). A firm’s abnormal bond return is estimated by averaging the
last abnormal return across bond issues by the same firm weighted by its issue size.
CreditDiff is then redefined as the difference between the weighted average rating of
target bonds and that of the acquirer bonds. Panel A of table 5 shows that CreditDiff
continues to be positive and significant, with its economic magnitude somewhat higher
than that estimated at the bond level.
To examine if our results are sensitive to our methodology of estimating
CreditDiff, we estimate our model using two alternative measures. First, we use acquirer

17
median bond rating rather than its mean bond rating to calculate CreditDiff. This ensures
that the acquirer ratings are not influenced by a few bond issues with extreme ratings. As
seen in Panel B, this does not materially change our results. Second, we use finer credit
ratings from Standard and Poor’s to estimate the CreditDiff variable. Consider for
example a target bond with a rating of A+ while the acquirer rating is A-. Our new
measure, based on finer bond ratings, will capture this difference even though their broad
credit ratings are the same. The coefficient of the new Creditdiff continues to be highly
significant as seen in Panel C. The estimated coefficient is smaller, which is not
surprising as this measure captures smaller changes in credit differences.
Next, we increased the window of investigation from three months to six months
by including those target bonds that were traded at least two days in the six month period,
with the last trade occurring within three months before the public announcement. This
has the advantage of increasing our sample from 299 bonds to 377 bonds, though
potentially adding noise to our estimation. Our results are robust: the coefficient of
CreditDiff remains positive and highly significant (see Panel D).
As an alternative to the last abnormal return we also use three month cumulative
abnormal bond returns. The results, as provided in Panel E, again are qualitatively
similar. Lastly, we expand our sample to also include M&A transactions where the
acquirer is a private firm or where the acquirer bonds were not covered in FISD. Note
that this sample includes Leverage buyouts (LBO) transactions. As acquirers in these
transactions do not have bond ratings, we are unable to estimate our Creditdiff variable to
capture the extent of expected gain or loss for target bonds. Therefore, we use actual
bond rating changes within three months of the M&A to create a pseudo CreditDiff

18
variable. This Psuedo CreditDiff can be created for all target bonds irrespective of
whether the acquirer bonds are covered under FISD. For example, consider a BBB target
bond that is acquired by a private acquirer and subsequent to the merger the bond was
downgraded to B. In this case, the Psuedo CreditDiff takes the value -2.
Though Pseudo CreditDiff is a noisy measure of the expected gain or loss for the
target bonds, it expands our sample of bonds to 362. As this measure is based on actual
bond rating changes, it takes into account change in control provisions that were not
explicitly mentioned (and hence not taken into account in our ex ante measure) but
nevertheless impacts pre-announcement returns. As shown in Panel F, we continue to
find significant pre-announcement bond returns. Bonds that experience a downgrade
(upgrade) after the merger have significant negative (positive) returns prior to the merger
announcement.
IV. Information Leakage: What is the Potential Channel?
If trading on nonpublic information about pending corporate takeovers does occur
in the corporate bond market, what is the source of this information? Several recent
studies point to a promising direction. In particular, Acharya and Johnson (2007) find
that the number of financing participants in private equity buyouts is related to the
likelihood of insider trading prior to the bid announcement. Bodnaruk, Massa and
Simonov (2007) show that advisory banks take positions in the target’s equity before the
announcement of the M&A deal. If information flows within financial institutions as
suggested by the papers above, it is possible that bond dealers who are affiliated with the
investment advisors in the acquisition are informed about the transaction prior to its
announcement.

19
We retrieved a list of advisory investment banks for each M&A deal from SDC,
and hand matched it with bond dealers to generate a variable on the affiliation between
bond dealers and investment banks. In creating this affiliation variable, we took into
account various mergers between investment banks during this time period. For example,
Travelers acquired Smith Barney in 1988 and was acquired by Citigroup in 1997. In
1998, if Citigroup was an investment advisor in an acquisition deal and the bond dealer
was Smith Barney, they were classified as being affiliated.
We examine the potential impact of informed affiliated dealers by examining
whether 1) active trading by affiliated dealers is associated with larger pre-announcement
returns, and 2) affiliated dealers’ net trading volume is in line with the bond’s expected
M&A return. In other words, are affiliated dealers net sellers of the bonds that are going
to lose value in the M&A transactions?
To examine whether the presence of affiliated dealers makes the pre-
announcement bond price more informative, we create a dummy variable, AF dummy, to
capture whether the affiliated dealer traded in the last day of trading prior to the
announcement of the acquisition. Abnormal last returns should move more in response to
CreditDiff when affiliated dealers trade, i.e., when AF dummy is 1. As shown in Panel A
of Table 6, the coefficient of CreditDiff is higher when affiliated dealers are present than
when they are not present, though the statistic significance is low (p value = 0.115).
Second, we classify bond transactions into two categories based on whether the
corresponding bond dealer is affiliated with the advisors in the M&A deal, and calculate
the aggregate net selling by bond dealers for each category. We then estimate the
following model:

20
** **
***
PMFinLevIssuerSizeAge
SizeIssueLoseDummyCreditDiffNetSell
PMleveragesizeage
SizeIssueLoseDumiCreditDiffi
ββββ
βββα
++++
+++=(2)
where NetSelli denotes net selling by affiliated and non-affiliated bond dealers for bond i,
and the explanatory variables are the same as those included in model (1).
The results from the estimation of model (2) are displayed in Panel B of Table 6.
We find that the coefficient for the Loss Dummy is positive and significant, suggesting
that affiliated bond dealers sell aggressively (and hence reduce their inventories) in bonds
which are going to lose value in the subsequent M&A announcement. We find no
evidence that that non-affiliated dealers are informed (Panel C). This finding implies that
affiliated dealers exploit information in the bond market, especially in anticipation of
negative news.
V. Market Transparency and Informed Trading
The documented empirical evidence of insider trading confirms regulators’
concern of possible violation of security laws in the corporate debt markets, and validates
efforts in improving its transparency. Arthur Levitt, former SEC chairman, stated that the
SEC has “found anecdotal evidence of the possible misuse of inside information in the
high-yield (debt) market.”16 Such concerns resulting from the opacity of the market
started to be addressed by the implementation of the FIPS and the later TRACE systems.
Several studies in the equity literature have examined the effect of transparency
on market quality, resulting in contradictory conclusions. Taking advantage of recent
available bond transaction data from TRACE, a few papers study the impact of price
dissemination through the TRACE system on corporate bond liquidity and transaction
16 See speech by SEC Chairman Arthur Levitt: “The Importance of Transparency in America’s Debt Market”, at the Media Studies Center, New York, N.Y., on September 9th, 1998.

21
costs. Using the same NAIC bond transaction data as in our study, Bessembinder,
Maxwell and Venkataraman (2006) find trade execution costs for institutional investors
dramatically drop following the initiation of public reporting through the TRACE system.
Consistent transparency effects from TRACE data are documented in Edwards, Harris
and Piwowar (2007) and Goldstein, Hotchkiss and Sirri (2007).
In this section, we examine whether improved transparency in the corporate bond
market discourages insider trading. We first classify target firms into pre- and post-
TRACE targets based on whether the target firm has bonds subject to TRACE
dissemination at the time of M&A announcements. We then estimate the following
model to address whether pre-announcement price changes and net selling by target
affiliated dealers exhibit different patterns during these two periods:
** *****
****)(
PMFinLevIssuerSizeAgeSizeIssueLoseDummypostTRACELoseDummypreTRACE
CreditDiffpostTRACECreditDiffpreTRACENetSellABR
PMleveragesizeageSizeIssue
postTRACELoseDum
preTRACELoseDum
ipostTrace
CreditDiffipreTrace
CreditDiffii
βββββββ
ββα
+++++++
++=
where the independent variable is either abnormal bond returns or the net selling by
affiliated bond dealers, and preTRACE (postTRACE) is a dummy variable which takes a
value of 1 if the issuing firm is in its pre-TRACE (post-TRACE) period at the time of
merger announcement. Other variables are defined as in Models (1) and (2).
Panel A of Table 7 shows that the coefficient for the term preTRACE*CreditDiff
is 0.389, significant at 1% level, while the coefficient for postTRACE*CreditDiff is 0.07
and not significant. This finding suggests that there is very little evidence of insider
trading after the implementation of the TRACE system. As insider trading by affiliated
dealers is more likely to be detected, we examine if TRACE has a larger effect on insider
trading by affiliated dealers. As seen in Panel B, the impact of CreditDiff on last bond

22
returns drops from 0.474 in the pre-TRACE period to -0.036 in the post-TRACE period
for affiliated dealers and this drop in insider trading is significant at the 10% level. In
contrast, the coefficient of CreditDiff drops from 0.354 in the pre-TRACE period to
0.153 in the post-TRACE period for the non-affiliated dealers with the difference not
being statistically significant. As expected, increased disclosure through TRACE has a
stronger impact of curbing insider trading by affiliated dealers.
Further support for the effect of TRACE on insider trading by affiliated dealers is
provided when we study its effect on net selling by affiliated advisors. As seen in Panel
C, there is significant evidence that pre-announcement selling of bonds that stand to lose
by affiliated dealers occurs only in the period prior to the TRACE implementation.
Evidence that insider trading is lower in the post-TRACE period is consistent with the
notion that greater transparency reduces the opportunities for taking advantage of
uninformed traders.
VI. Where do Informed Traders Trade first?
In this section, we examine trading in the target bond market in conjunction with
that in the target’s stock to explore where informed traders trade. As the timing of the
bond trades is known, we can examine abnormal target stock price movements around
bond trading. If informed traders primarily trade in target stock, then the abnormal stock
returns should precede bond trades. Further, there should be little impact of bond trading
on subsequent abnormal stock returns.
We examine the stock price reaction to the last bond trade for each firm. This is
consistent with the prior return results as the price of the bond on the last bond trading
day is used to calculate the last abnormal return for the bond. As the abnormal stock

23
returns are estimated for the firm, we classify the last bond trading day for the whole firm
as the last day of trading across all its traded bonds. For our sample of 118 targets with
traded bonds in the three months prior to announcement, the average last bond trading
day is about 12 days prior to the announcement of the acquisition, with the median being
8 days prior. As seen in Table 8, we find that the mean cumulative abnormal stock return
(CAR) from days -5 to -2 where 0 is the last bond trading day is a significant 0.8%. The
CAR over the three day period, -1 to 1 around the last bond trading day is a significant
2.04% where the difference between the two is not statistically significant. As the CAR
prior to bond trading is significant, and there is no significant change around bond trading,
this suggests that information first gets incorporated in the stock markets with there being
little additional impact of bond trades.
However, as documented by Acharya and Johnson (2007) the credit markets react
faster to negative information. Therefore, we split our sample into firms where the bonds
stand to clearly gain or lose due to the takeover. As firms carry bonds with different
credit ratings, we classify a firm as a winner in the bond market if it has at least one bond
that is clearly going to gain (i.e., when it is has credit rating that is worse than the lowest
rated bond of the acquirer). Similarly, a firm is classified as a losing firm if it has at least
one bond that clearly stands to lose. There are no firms in our sample that span both
these categories, i.e., have both a bond that stands to clearly gain and one that stands to
clearly lose. The remaining firms are classified as belonging to an intermediate group.
Of the 118 firms in our sample, 42 stand to clearly gain, 14 stands to clearly lose and 62
belong to the intermediate group.

24
As expected, for firms whose bonds stand to lose the patterns are different. The
abnormal stock returns prior to the last bond trade are zero. These become significantly
positive after the last bond trading. The positive abnormal return of 3.19% is striking
because it accompanies a -0.91% return in the bond market. This suggests that the stock
markets do not interpret the negative last bond return as information that points to
worsening prospects for the firms, but rather correctly as an event that has negative
consequences for the bond market but positive consequences for stock. In summary, the
results suggest that, at least for the losing category, the bond markets appear to be the
preferred venue of trading for informed traders.
We also examine the 332 target firms with bonds outstanding that are covered in
FISD but with no trades in the three month period prior to the announcement of the
acquisition. As these firms do not have any bond trading, we examine abnormal stock
returns 8 days prior to the announcement, which is the median time from the last bond
trade to the announcement in our sample. The CARs before and after the pseudo bond
trading day are significantly positive but not significantly different from each other. One
reason for the lack of any bond trading prior to the merger announcement may be bond
characteristics associated with reduced liquidity.
To shed light on characteristics that may be associated with liquidity we compare
the 299 bonds that were traded and have been studied so far with the other non traded
bonds issued by sample firms. There are in total 468 bonds issued by our target firms
that did not trade in the three months prior to the announcement. As seen in Table 9 there
are significant differences in the traded and non-traded bonds of our sample firms.
Briefly, we find that liquid and traded bonds are younger, have higher offering amounts,

25
have better credit ratings, are less likely to have embedded options, and are more likely to
be public. When we examine bonds of the non traded firms, i.e., target firms that had no
bonds that were traded three months prior to announcement, we find characteristics more
likely to be associated with lower liquidity. These bonds have historically also had low
liquidity, few trades and low trading volume in the two years prior to the
announcement.17 In summary, firms with no bond trading in the three months prior to
announcement are firms whose bonds have low liquidity.
VII. Concluding Remarks
Taking advantage of the unique case provided by corporate bonds, this paper
documents strong evidence of informed trading on pending takeovers in the corporate
bond market. Unlike target shareholders, who always benefit in a merger deal, target
bondholders could either lose or gain, depending on whether the takeover increases or
reduces the credit risks embedded in the bonds. We find that target bonds experienced
abnormal trading volumes prior to the public announcement of the M&A deal, and that
their prices increases (declines) before they are acquired by firms with better (worse)
rated bonds. As profitable trading in bonds requires information for target and acquirer
characteristics, our findings are more likely to be attributed to insider information rather
than market anticipation.
Our study also finds that one possible channel for such information leakage can
be traced to the affiliation of the bond dealers with investment banks involved in the
acquisition. We find somewhat higher price impact of affiliated trades, and further in
17 Hotchkiss, Jostova and Warga (2007) find that bonds of public companies are more likely to be traded than those with private equity. As our sample consists of only public firms this characteristics is not relevant for our study.

26
cases when the target bonds stand to lose from the merger, affiliated bond dealers exhibit
much more selling than buying. This suggests a possible breach of the Chinese wall
within financial intermediaries. We also find that such information tends to arrive in the
bond market first, followed by significant positive stock returns.
Finally, the longstanding opacity and the resulting potential misuse of nonpublic
information in the corporate bond market has drawn much effort from regulators toward
increasing the transparency of the market. Our findings of less insider trading, especially
through affiliated bond dealers, during the post-TRACE periods seem to validate the role
of transparency in reducing the opportunities for taking advantages of uninformed traders.

27
REFERENCES Andrade, Gregor, Mark Mitchess and Erik Stafford, 2001, New evidence and perspectives on mergers, Journal of Economic Perspectives 15, 103-120. Acharya, Viral, and Timothy Johnson, 2007, Insider trading in credit derivatives, Journal of Financial Economics 84, 110-141. Acharya, Viral, and Timothy Johnson, 2008, More insiders, more insider trading: Evidence from private equity buyouts, working paper. Asquith, Paul, and E. Han Kim, 1982, The impact of merger bids on the participating firms' security holders, Journal of Finance 37, 1209-1228. Bessembinder, Hendrick, Kathleen M. Kahle, William M. Maxwell, and Danielle Xu, 2008, Measuring abnormal bond performance, Review of Financial Studies, Forthcoming. Bessembinder, Hendrick, and William F. Maxwell, 2008, Transparency and the corporate bond market, Journal of Economic Perspectives , Forthcoming. Bessembinder, Hendrick, William F. Maxwell, and Kumar Venkataraman, 2006, Market transparency, liquidity externalities, and institutional trading costs in corporate bonds, Journal of Financial Economics 82, 251-288. Billett, Matthem T., Tao-Hsien Dolly King and David C. Mauer, 2004, Bondholder wealth effects in mergers and acquisitions: new evidence from the 1980s and 1990s. Journal of Finance, 107-135. Bloomfield, Robert, and Maureen O’Hara, 1999, Market transparency: Who wins and who loses? Review of Financial Studies 12, 5-35. Bloomfield, Robert, and Maureen O’Hara, 2000, Can transparent markets survive? Journal of Financial Economics 55, 425-459. Bodnaruk, Andriy, Massimo Massa, and Andrei Simonov, 2007, Investment Bank as Insiders and the market for corporate control, working paper. Cai, Nianyun, Jean Helwege and Arthur Warga, 2007, Underpricing in the corporate bond market, Review of Financial Studies 20, 2021-2046. Campbell, J., and G. Taksler, 2003, Equity Volatility and Corporate Bond Yields, Journal of Finance, Vol. 58 2321-2349. Chakravarty, Sugato, and John J. McConnell, 1997, An analysis of prices, bid/ask spreads, and bid and ask depths surrounding Ivan Boesky's illegal trading in Carnation's stock, Financial Management 26, 18-34.

28
Chakravarty, Sugato, and John J. McConnell, 1999, Does insider trading really move stock prices? Journal of Financial and Quantitative Analysis 34, 191-209. Cornell, Bradford, and Eric Sirri, 1992, The reaction of investors and stock prices to insider rrading," Journal of Finance, 1031-1059. Datta, Sudip, and Mai. Iskandar-Datta, 1996, Does insider trading have information content for the bond market? Journal of Banking and Finance 20, 555-575. Dennis, Debra K., and John J. McConnell, 1986, Corporate mergers and security returns, Journal of Financial Economics 16, 143-87. Edwards, Amy K., Lawrence Harris, and Michael S. Piwowar, 2007, Corporate bond market transaction costs and transparency, Journal of Finance 62, 1421-1451. Eger, Carol E., 1983, An empirical test of the redistribution effect in pure exchange mergers, Journal of Financial and Quantitative Analysis 4, 547–572. Ellis, Katrina, R. Michaely and Maureen O’Hara, 2006, Competition in Investment Banking, Working paper, Cornell University Fishe, Raymond P., and Michel.A. Robe, 2004, The impact of illegal insider trading in dealer and specialist markets: Evidence from a natural experiment, Journal of Financial Economics 71, 461-88. Flood, Mark, Ronald Huisman, Kees Koedijk, and Ronald Mahieu, 1999, Quote disclosure and price discovery in multipledealer financial markets, Review of Financial Studies 12, 37-59. Galai, D., and R. Masulis, 1976, The Option Pricing Model and the Risk Factor of Stock, Journal of Financial Economics, V. 3, 53-81. Gao, Yuan, and Derek Oler, 2008, Rumors and pre-announcement trading: Why sell target stocks before acquisition announcements? Working paper. Gemmill, Gordon., 1996, Transparency and liquidity: A study of block trades on the London Stock Exchange under different publication rules, Journal of Finance 51, 1765-1790. Goldstein, Michael A., Hotchkiss, Edith S., and Erik R. Sirri, 2007, Transparency and liquidity: A controlled experiment on corporate bonds, Review of Financial Studies 20, 235 - 273. Higgins, R., and L.Schall, 1975, Corporate Bankruptcy and Conglomerate Merger, Journal of Finance, Vol 30, 93-113.

29
Hotchkiss, Edith, Gergana Jostova, and Arthur Warga, 2007, Determinants of corporate bond trading: A comprehensive analysis, working paper. Insider trading in junk bonds source, Harvard Law Review, Vol. 105, No. 7 (May, 1992), 1720-1740. Ivashina, V. and Z. Sun, 2007, Institutional Stock Trading on Loan Market Information, Working Paper, Harvard Univesity. Jarrell, Gregg A., and Annette E. Poulsen, 1989, Stock trading before the annoucement of tender offers: Insider trading or market anticipation? Journal of Law, Economics, and Organization 5, 225-248. Jensen, Michael C., and Richard S. Ruback, 1983, The market for corporate control: The scientific evidence, Journal of Financial Economics 11, 5-50. Kim, E. Han, and John J. McConnell, 1977, Corporate mergers and the co-insurance of corpo- rate debt. Journal of Finance 32, 349-65. King, Michael R., and Maksym Padalko, 2005, Pre-bid run-ups head of Canadian takeovers: How big is the problem? Working paper, Bank of Canada. Krishnan, C., P. Ritchken, and J. Thomson, 2006, On Credit-Spread Slopes and Predicting Bank Risk, Journal of Money, Credit, and Banking, Vol 38, 1545-1574. Levy, H. and M. Sarnat, 1970, Diversification, Portfolio Analysis and the Uneasy Case for Conglomerate Mergers, Journal of Finance, V 25, 795-802 Lewellen, W., 1971, A Pure Financial Rational for Conglomerate Merger, Journal of Finance, Vol 26, 521-537. Madhavan, Ananth. 1995, Consolidation, fragmentation, and the disclosure of trading information, Review of Financial Studies 8, 579-603. Madhavan, Ananth, 2000, Market microstructure: A survey, Journal of Financial Markets 3, 205-208. Madhavan, Ananth, David Porter, and Daniel Weaver, 2005, Should securities markets be transparent? Journal of Financial Markets 8, 265-287. Maquieira, Carlos P., William L. Megginson, and Lance A. Nail, 1998, Wealth creation versus wealth redistributions in pure stock-for-stock mergers, Journal of Financial Economics 48, 3–33.

30
Meulbroek, Lisa K., 1992, An Empirical analysis of illegal insider trading, Journal of Finance, 1661-1699. Meulbroek, Lisa and Carolyn Hart, 1997, The Effect of Illegal Insider Trading on Takeover Premia, European Economic Review 1, 51-80. Naik, Narayan, Anthony Nueberger, and S. Viswanathan, 1999, Disclosure regulation in markets with negotiated trades, Review of Financial Studies 12, 873-900. O’Hara, Maureen, 1997, Market microstructure theory, Basil Blackwell, Cambridge, MA. Pagano, Marco, and Ailsa Roell, 1996, Transparency and liquidity: A comparison of auction and dealer markets with informed trading, Journal of Finance 51, 579-611. Ritter, Jay and D. Zhang, 2007, Affiliated Mutual Funds and the Allocation of Initial Public Offerings, Working paper, University of Florida Ronen, T and X. Zhou, 2008, Where did all the Information Go? Trade in the Corporate Bond Market, Working Paper, Rutgers University. Shastri, K., 1990, The Differential Effects of Mergers on Corporate Security Values, Research in Finance, Vol. 8, 179-201 Shultz, P, 2001, Corporate Bond Trading Costs: A Peek behind the Curtain, Journal of Finance, Vol. 56, 677-698.

31
Figure 1A Turnover is target bond volume normalized by issue size and expressed as a percentage. The number of trades, as well as turnover, is over the three months prior to the takeover announcement. Both turnover and number of trades are control adjusted, where the control group is all bonds with the same credit rating and time to maturity. Gaining (Losing) Bonds are target bonds where the acquirer has a better (worse) credit rating than the target bond.
Turnover By Bond Category
0.00
1.00
2.00
3.00
4.00
5.00
6.00
7.00
8.00
Control Adjusted Turnover Control Adjusted Number of Trades
Full SampleGaining BondsLosing Bonds
Figure 1B Last abnormal bond return is the abnormal return for the last target bond transaction prior to the announcement of the takeover. The abnormal return is defined as the difference between the last bond return and the return to credit and maturity matched Lehman Bond Index. M&A Bond return is the abnormal bond return across the M&A announcement. The returns are expressed in percentages. Gaining (Losing) Bonds are target bonds where the acquirer has a better (worse) credit rating than the target bond.
Bond Returns by Bond Category
-1.5
-1
-0.5
0
0.5
1
1.5
2
2.5
3
3.5
Last Abnormal Bond Return M&A Bond Return
Full SampleGaining BondsLosing Bonds
32
Table1
Trading in Target Bonds within Three Months prior to Merger Announcements This table presents summary information on the trading activities in target bonds in the three months before the announcement of mergers, both in terms of number of trades and turnover. Bond turnover is calculated by dividing the total dollar trading volume in bonds by their issue size. We examine the raw value of trading frequency and turnover, as well as, their adjusted value by subtracting the average of a control sample. For each of the target bonds in our sample, the control group consists of all other bonds, not subject to any takeover, that had a similar credit rating and time to maturity, and also did not experience any credit rating changes over the same period.
Number of Trades Turnover Raw Values Control Adjusted Raw Values Control Adjusted
Panel A: Bond Level Mean 1.866 1.357 1.939% 1.203% T-stat 15.00 11.20 15.04 9.51 # of Bonds 1,611 1,611 1,611 1,611
Panel B: Firm Level Mean 1.430 0.908 1.507% 0.867% T Stat 8.42 5.56 10.54 6.32 # of Firms 442 442 442 442
33
Table 2 Descriptive Information on Sample Target Bonds and their Issuing Firms
This table presents descriptive information for the 299 target bonds which have traded at least two trading days within the three month period prior to the announcement of the acquisition and their issuing firms. The book value of total assets, market value of equity and financial leverage are retrieved from COMPUSTAT. Bond characteristic information, including the issuing amount (face value), maturity date and credit ratings are from Mergent FISD database. We assign a numeric value to each credit rating from Standard and Poor, with 1, 2, …, 11 denoting AAA, AA, …, NR respectively. The rating difference between a target bond and the acquirer’s bonds is calculated by subtracting the average rating of acquirer bonds (weighted by issue size) from the rating of the target bond. Panel A provides summary information on the characteristics of the sample target bonds and their issuing firms, and Panel B includes a detailed distribution of target bonds across credit rating categories. Panel A: Summary Information on Target Bonds and Their Issuing Firms Mean Median Std N Issuing Firm Characteristics Total Asset ($ Million) 26,129.79 5,098.90 55,853.87 118 Market Value of Equity ($ Million) 9,028.46 4,186.83 14,109.30 118 Financial Leverage (Total Debt/Total Assets) 0.316 0.298 0.224 118 Number of Traded Bonds per Firm 2.831 2.000 3.179 118 Number of Total Bonds per Firm 7.822 5.000 8.532 118 Target Bond Characteristics Offering Amount ($ Million) 379.297 250.000 377.163 299 Bond Maturity (number of years till maturity) 9.285 6.658 9.281 299 Bond Rating (AAA=1, AA=2, …D=10, NR=11) 3.943 4.000 1.456 299 Rating Difference between Target and Acquirer 0.270 0.000 1.800 299 Panel B: The Distribution of Target Bonds across Credit Ratings Rating 1 2 3 4 5 6 7 8 9 10 11 # of Bonds 0 12 118 108 34 18 2 0 0 0 7 Percentage 0.00 4.01 39.46 36.12 11.37 6.02 0.67 0.00 0.00 0.00 2.34

Table 3 Summary Statistics for Abnormal Bond Returns
Abnormal returns are defined as the difference between the bond return and the return on a maturity and credit rating matched Lehman Index. Last return is the last abnormal bonds return prior to the merger announcement and is estimated from the last two days traded prior to the announcement of the merger. CAR is the cumulative abnormal return a target bond earns during the three month period prior to the announcement. M&A return (announcement return) refers to the abnormal return following the merger announcement and is calculated from the last day traded in the three months prior to the announcement and the first day traded in the three month period following the announcement. Losing bonds include all target bonds whose credit ratings were better than the highest rated acquirer bond. Gaining bonds include target bonds whose credit ratings were worse than the worst rated acquirer bond. All other target bonds were included in the other bonds category. Panel B reports summary statistics at the firm level, which are a weighted average of all the bond values, with the weights being issue size. ***, **, and * represent significance at the 1%, 5% and 10% level respectively.
Panel A: Bond Level Panel B: Firm Level
Mean T-test Median Wilcoxon
test # of Obs. Mean T-test Median Wilcoxon
test # of Obs. Full Sample
Last Return 0.348 (0.006)*** 0.269 (<0.0001)*** 299 0.590 (0.009)*** 0.372 (<0.0001)*** 118 CAR 0.660 (0.0001)*** 0.562 (<0.0001)*** 299 1.046 (0.001)*** 0.670 (<0.0001)*** 118 M&A Return 1.102 (0.0001)*** 0.695 (0.0001)*** 256 1.377 (0.001)*** 0.894 (0.0001)*** 104
Losing Bonds Last Return -0.510 (0.356) -0.188 (0.245) 29 -0.882 (0.239) 0.021 (0.502) 14 CAR -0.101 (0.876) 0.006 (0.876) 29 -0.269 (0.798) -0.172 (1.000) 14 M&A Return -1.016 (0.345) 0.386 (0.890) 24 -0.562 (0.751) -0.024 (0.622) 12
Gaining Bonds Last Return 0.750 (0.020)** 0.432 (0.008)*** 75 1.158 (0.006)*** 0.590 (0.0007)*** 42 CAR 1.041 (0.023)** 0.611 (0.013)** 75 1.637 (0.013)** 0.752 (0.0007)*** 42 M&A Return 3.091 (<.0001)*** 2.116 (<.0001)*** 61 2.845 (0.0004)*** 2.079 (<0.0001)*** 34
Other Bonds Last Return 0.321 (0.010)*** 0.285 (<.0001)*** 195 0.537 (0.048)** 0.322 (0.0024)*** 62 CAR 0.597 (0.0007)** 0.583 (0.0001)*** 195 0.942 (0.007)*** 0.651 (0.0004)*** 62 M&A Return 0.690 (0.011)** 0.445 (0.0009)*** 171 0.917 (0.048)** 0.433 (0.069)** 58
Difference Between Losing and Gaining bonds Last Return (0.025)** (0.009)*** (0.010)** (0.014)** CAR (0.119) (0.073)* (0.064)* (0.149) M&A Return (0.0007)*** (<.0001)*** (0.044)** (0.006)***

35
Table 4 Pre-announcement Abnormal Bond Returns
The dependent variable for regression analysis reported in this table is the last abnormal bond return prior to the announcement of the merger. CreditDiff is the difference between the credit rating of the target bond and the weighted average rating of the acquirer bond. Loss dummy takes the value one when the credit rating of the target bond is better than the best rated bond of the acquirer, and zero otherwise. Issuer market value is the market value of the target firm, financial leverage is the total debt to asset ratio for the target, and profit margin is the net income to sales ratio for the target firm. We also control for bond liquidity using its age and issue size. Age is the number of years since bond issuance and issue size is the bond offering amount. Only target bonds that traded at least twice in the three months prior to the announcement were included. There are 299 bonds in the sample. ***, **, and * represent significance at the 1%, 5% and 10% level respectively. The standard errors are corrected for firm level clustering.
I II III IV Intercept 0.252 0.463 -0.007 0.048 (0.039)** (0.044)** (0.993) (0.947) CreditDiff 0.357 0.361 0.341 0.330 (<.0001)*** (<.0001)*** (<.0001)*** (<.0001)*** Loss Dummy -0.193 (0.694) Age -0.021 -0.032 -0.033 (0.674) (0.603) (0.592) Issue Size -0.401 -0.189 -0.194 (0.208) (0.621) (0.612) Issuer Market Value -0.148 -0.140 (0.252) (0.285) Financial Leverage -0.563 -0.521 (0.452) (0.491) Profit Margin -0.722 -0.779 (0.576) (0.548) Adj. R-Square (%) 8.47 8.36 8.39 8.09

36
Table 5 Robustness Check
This table provides robustness checks of our results on the informational content of pre-announcement target bond abnormal returns. The dependent variable for Panels A to D is the last return prior to the announcement and for Panels E and F is the three month cumulative abnormal bond return. The sample includes all bonds that are traded at least two days within the three months prior to announcement. For Panel A, firm level last return is the weighted average last return for all bonds issued by the same firm weighted by issue size. Panel B uses median acquirer bond ratings while Panel C uses finer notches of rating to estimate CreditDiff. CreditDiff is the difference between the credit rating of the target bond and the weighted average rating of acquirer bonds. Psuedo CreditDiff is the difference between the target bond rating before the M&A announcement and its rating within three months after the M&A. Issuer Market Value is the market value of the issuing firm, Financial Leverage is the ratio of total debt to total assets, and Profit Margin is the ratio of net income to sales. Age is the number of years since bond issuance and issue size is the bond offering amount. ***, **, and * represent significance at the 1%, 5% and 10% level respectively. Standard errors are corrected for firm level clustering.
Panel A: Firm Level
Panel B: Median Rating of Acquirer Bonds
Panel C: Fine Rating Category
Panel D: Six Month Window
Panel E: Three-Month CAR
Panel F: Expanded Sample:
Private Acquirers and LBOs
Intercept -0.351 -0.010 -0.066 0.163 -1.732 -2.123 (0.788) (0.989) (0.928) (0.824) (0.064)* (0.008)*** CreditDiff 0.442 0.300 0.118 0.372 0.482 (<0.0001)*** (<0.0001)*** (<0.0001)*** (<.0001)*** (<.0001)*** Psuedo CreditDiff 0.634 (0.006)*** Age -0.012 -0.036 -0.034 -0.050 -0.093 -0.081 (0.923)** (0.552) (0.583) (0.392) (0.242) (0.204) Issue Size -0.352 -0.143 -0.136 -0.208 0.628 0.979 (0.601) (0.709) (0.724) (0.623) (0.209) (0.039)** Issuer Market Value -0.221 -0.153 -0.156 -0.162 -0.421 -0.501 (0.310) (0.242) (0.235) (0.191) (0.013)* (0.004)*** Financial Leverage -0.452 -0.662 -0.542 -0.957 0.931 1.075 (0.660) (0.378) (0.474) (0.208) (0.342) (0.207) Profit Margin -1.304 -0.909 -0.768 -1.345 2.467 1.066 (0.396) (0.482) (0.573) (0.334) (0.144) (0.318) Adj. R-Square (%) 20.27 7.36 6.91 7.24 14.30 6.72 Number of Observations 118 299 298 377 299 362

37
Table 6 Pre-announcement Trading by Affiliated Bond Dealers
The dependent variable for Panel A is the last abnormal bond return prior to the acquisition announcement. The dependent variable for Panel B (Panel C) is net selling by affiliated (non-affiliated) bond dealers. The explanatory variables of interest are CreditDiff and Loss Dummy. CreditDiff represent the difference between the credit rating of the target bond and the weighted average rating of acquirer bonds. Loss dummy takes the value one when the target credit rating is better than the best rated acquirer bond, and zero otherwise. AF dummy takes the value one when the affiliated dealer trades on the last trading day prior to the acquisition announcement. We include both bond level specific controls, such as age and issue size, as well as firm level controls, including issuer market value, financial leverage and profit margin, which are defined similarly as in Table 5. ***, **, and * represent significance at the 1%, 5% and 10% level respectively. Standard errors are corrected for firm level clustering.
Panel A:
Last Abnormal Bond Return
Panel B: Affiliated Dealer Selling
Panel C: Non-Affiliated Dealer
Selling Intercept 0.034 -0.234 -0.167 (0.962) (0.787) (0.918) CreditDiff*AF Dummy 0.498 (0.003)*** CreditDiff*NonAF Dummy 0.301 (0.0003)*** CreditDiff 0.088 -0.157 (0.353) (0.379) Loss Dummy 1.238 -0.727 (0.034)** (0.507) Age -0.035 0.105 -0.136 (0.564) (0.146) (0.32) Issue Size -0.167 -0.352 -1.072 (0.662) (0.439) (0.21) Issuer Market Value -0.152 0.060 -0.055 (0.241) (0.699) (0.851) Financial Leverage -0.659 0.671 1.414 (0.381) (0.456) (0.403) Profit Margin -1.109 1.068 3.272 (0.408) (0.489) (0.26) Adj. R-Square (%) 8.41 0.38 0.00

38
Table 7 The Influence of TRACE Implementation on Informed Trading in Corporate Bonds
This table examines the effect of TRACE implementation on informed trading in corporate bonds. The dependent variables in Panels A and B are the last abnormal bond returns in the three months prior to the announcement, while in Panel C it is net selling by affiliated bond dealers. Pre- (Post-) TRACE dummy takes the value one for bonds whose issuer’s debt instruments are subject to TRACE dissemination. CreditDiff is the difference between the credit rating of the target bond and the weighted average rating of acquirer bonds. AF Dummy takes the value one when affiliated dealers trade on the last trading day before the acquisition announcement. Loss dummy takes the value one when the target credit rating is better than the best rated acquirer bond, and zero otherwise. We include both bond level specific controls, such as age and issue size, as well as firm level controls, including Issuer Market Value, Financial Leverage and Profit Margin, which are defined similarly as in Table 5. ***, **, and * represent significance at the 1%, 5% and 10% level respectively. Standard Errors are corrected for firm level clustering.
Panel A:
Pre- and Post-TRACE
Panel B: Affiliated vs.
Non-Affiliated
Panel C: Net Selling by
Affiliated Dealers
Intercept -0.114 -0.049 -0.322 (0.874) (0.945) (0.711) CreditDiff *Pre-TRACE Dummy 0.389 0.024 (<.0001)*** (0.877) CreditDiff *Post-TRACE Dummy 0.070 0.117 (0.704) (0.295) Loss Dummy*Pre-TRACE Dummy 1.489 (0.016)** Loss Dummy*Post-TRACE Dummy -0.462 (0.759) CreditDiff*AF Dummy* Pre-TRACE Dummy 0.474 (0.002)*** CreditDiff*AF Dummy* Post-TRACE Dummy -0.036 (0.888) CreditDiff*NonAF Dummy* Pre-TRACE Dummy 0.354 (0.0002)*** CreditDiff*NonAF Dummy* Post-TRACE Dummy 0.153 (0.525) Age -0.025 -0.028 0.104 (0.684) (0.651) (0.150) Issue Size 0.045 0.018 -0.319 (0.911) (0.966) (0.483) Issuer Market Value -0.153 -0.153 0.036 (0.234) (0.235) (0.817) Financial Leverage -0.529 -0.610 0.537 (0.478) (0.416) (0.553) Profit Margin -0.837 -1.175 1.184 (0.515) (0.389) (0.452) Adj. R-Square (%) 8.92 8.46 0.24

39
Table 8
Trading across Issuer’s Equity and Debt This table presents the timing and distribution of informed trading across the target’s equity and debt. We calculate the cumulative abnormal returns in the target’s stock surrounding its bond transactions, expressed as percentage returns, and examine the patterns for different groups of target firms based on whether their bonds are traded and their relative credit quality compared to that of the acquirer using both t-test and Wilcoxon signed rank test. ***, **, and * represent significance at the 1%, 5% and 10% level respectively.
Full Traded Sample
Firms whose
Bonds Gain from
Merger
Firms whose
Bonds Lose from
Merger
Firms whose
bonds are rated
similar to acquirer
Firms which have no bonds
traded
Group 1 Group 2 Group 3 Group 4 CARs from (-5,-2) relative to the last bond trade (A) Mean 0.8** 1.24** 0.13 0.7 0.84** Median 0.0 0.8* 0.0 0.0 0.269 CARs from (-1,+1) around the last bond trade (B) Mean 2.04*** 1.4 3.19* 2.2** 0.89*** Median 0.63** 0.16 0.18 0.7** 0.17** CAR from (-1,1) around the announcement of the Merger 14.86 16.2 9.8 15.06 17.89 Average Last Bond Return 0.487 1.18 -0.91 0.33 0 T statistic for the paired T-test for difference in (A) and (B)
1.62 0.14 1.52 1.33 0.13
Z statistic for the Wilcoxon matched pairs signed rank test for difference in (A) and (B)
0.86 0.68 1.6* 0.91 0.11
Number of Observations 118 42 14 62 332

Table 9 Which Bonds are more likely to be Traded?
This table provides summary information on the characteristics of bonds that are traded prior to M&A announcements versus those which are not traded. Such information includes the total amount offered to the market, the credit rating, time to maturity, and age at the time of the M&A. We also provide information on the likelihood that each group of bonds examined have some type of embedded options, whether they are Rule 144a bonds or medium term bonds, the seniority of the bonds, as well as how likely they are to be traded within the past 2 years before the three-month period. ***, **, and * represent significance at the 1%, 5% and 10% level respectively.
Target Firms with Bonds Traded in the Three-month
Pre-announcement Period
Bonds that are Traded at least 2 Days in the three months prior to announcements
(Group 1)
Bonds that did not trade (Group 2)
T-test for difference between
Group 1 and Group 2
Target Firms with No Bonds Traded in Three-month
Pre-announcement Period
Offering Amount ($Million) 379.297 293.973 (0.003)*** 193.048 Credit Rating 3.936 4.603 (<0.0001)*** 5.604 Time to Maturity 9.285 9.083 (0.772) 9.207 Age 2.818 7.053 (<0.0001)*** 5.729 Embedded Options: Putable 0.033 0.079 (0.005)*** 0.080 Convertible 0.037 0.113 (<0.0001)*** 0.223 Redeemable 0.415 0.630 (<0.0001)*** 0.732 Rule 144a 0.037 0.171 (<0.0001)*** 0.158 Medium Term Note 0.000 0.034 (<0.0001)*** 0.021 Seniority 0.926 0.959 (0.0477)** 0.99969 Total Number of Trades 43.657 8.038 (<0.0001)*** 10.740 Total Trade Volume ($million) 311.111 104.691 (<0.0001)*** 124.733 Number of Observation 299 468 994