insight department: tourism employment in scotland · although down from 2015’s nine year high...
TRANSCRIPT

December 2018
Insight Department:Tourism employmentin Scotland

Introduction
INSIGHT DEPARTMENT: TOURISM EMPLOYMENT IN SCOTLAND
This document provides Scotland’s sustainable tourism employment1 statistics for 2017 and compares them to the position in 2009 and 2012.
The report contains the following information:
• Tourism employment levels from 2009-2017;
• Tourism employment by SIC Code & rate of change 2009-2017;
• Tourism employment by Local Authority area and rate of change 2009-2017;
• Tourism employment as % of Scotland total & all jobs in Local Authority Area 2017; and
• Tourism employment relative to employment in other Scottish Growth Sectors in 2017.
This report has been prepared by VisitScotland using Scottish Government Growth Sector statistics (published in October 2018) and Nomis - Official Labour Market Statistics (sourced in November 2018). Both datasets relate to the year 2017.
1As defined by Scottish Government using the SIC codes available in Table 1 on page 3
1

INSIGHT DEPARTMENT: TOURISM EMPLOYMENT IN SCOTLAND
Tourism employment recently fell from 207,000 in 2016 to 206,000 in 2017. This level of employment although down from 2015’s nine year high remains above the long term average from 2009 to 2017.2
Tourism employment has increased by 13% over the past five years (2012-2017) which coincides with the introduction of the national tourism strategy in 2012. This compared favourably to a 5% fall in the preceding four-year period (2009-2012).
Figure 1: Tourism Employment 2009-2017
2012: National tourism strategy Tourism
Scotland 2020 (TS2020) launched
Source: VisitScotland using Scottish Government Growth Sector Statistics (October 2018)
22009 -2017 average is198,100 compared to 185,175 between 2009-2012 and 203,950 between 2012-2017
Tourism Employment levels from 2009 -2017
2

INSIGHT DEPARTMENT: TOURISM EMPLOYMENT IN SCOTLAND
The tourism growth sector is defined by the activity of 14 SIC codes in Table 1 that make up the sustainable tourism sector as defined by Scottish Government.
SUSTAINABLE TOURISM STANDARD INDUSTRY CLASSIFICATION (SIC) CODE
VALUE NO. CHANGE % CHANGE
2009 2012 2017 2009-2012
2012-2017
2009-2012
2012-2017
SIC 56.1: Restaurants and mobile food service activities 66,900 64,900 79,000 -2,000 14,100 -3% 22%
SIC 55.1: Hotels and similar accommodation 49,200 50,100 50,000 900 -100 2% 0%
SIC 56.3: Beverage serving activities 41,600 30,500 36,000 -11,100 5,500 -27% 18%
SIC 93.11: Operation of sports facilities 13,400 13,400 15,000 0 1,600 0% 12%
SIC 93.199: Other sports activities (not including activities of racehorse owners) nec
2,000 3,800 4,500 1,800 700 90% 18%
SIC 91.02: Museum activities 4,100 4,400 4,500 300 100 7% 2%SIC 55.2: Holiday and other short-stay accommodation 2,900 3,000 3,500 100 500 3% 17%
SIC 91.03: Operation of historical sites and buildings and similar visitor attractions
1,000 2,200 2,500 1,200 300 120% 14%
SIC 55.3: Camping grounds, recreational vehicle parks and trailer parks
2,200 2,300 2,500 100 200 5% 9%
SIC 91.04: Botanical and zoological gardens and nature reserve activities 2,100 1,800 2,250 -300 450 -14% 25%
SIC 93.29: Other amusement and recreation activities 2,300 2,000 3,000 -300 1,000 -13% 50%
SIC 79.12: Tour operator activities 1,600 1,400 2,000 -200 600 -13% 43%SIC 79.9: Other reservation service and related activities 1,000 1,200 800 200 -400 20% -33%
SIC 93.21 Activities of amusement parks and theme parks 600 500 600 -100 100 -17% 20%
Total 190,700 181,500 206,000 -9,400 24,650 95% 13%
Source: VisitScotland using Scottish Government Growth Sector Statistics (October 2018) *May not sum due to Scottish Government controlled rounding criteria
Table 1: Tourism Employment by SIC Code & Rate of Change 2009-2012 & 2012-2017
Tourism Employment by SIC Code & Rate of Change 2009-2017
3

Source: VisitScotland using Scottish Government Growth Sector Statistics (October 2018)
Approximately four in every five tourism related jobs are in three well represented sub sectors: restaurants; hotels and beverage services. Employment in these dominant sub sectors has increased by 5% from 2009
-2017 mainly due to a sizable increase in restaurant and food services employment from 2012-2016.
Employment in hotels is broadly similar to its 2009 position. However, beverage services employment while recovering slightly between 2012-2017 experienced the highest loss of employees over the period 2009-2017. Employment in this sector contracted by 5,600 workers (-13%) since 2009.
Employment in the remaining 11 SIC codes all increased markedly between 2012-17 (with the notable exception of operation of sports facilities). Overall these fluctuations have resulted in a longer-term trend which is helping to provide a more even balance between in the top three SIC codes and the remaining 11 SIC Codes (see Tables 2 & 3).
Table 2: Tourism Employment Top 3 SIC codes v bottom 11 SIC Codes 2009-2012 & 2012-2017
2009 2012 2017Top 3 SICs 157,700 145,500 165,000 As % of total 82.6% 80.2% 80.0%Remaining 11 SICs 33,200 36,000 41,150 As % of total 17.4% 19.8% 20.0%
Source: VisitScotland using Scottish Government Growth Sector Statistics (October 2018)
Table 3: Tourism Employment by Local Authority Area and Rate of Change 2009-2012 & 2012-2017
2009-12 2012-16 2009-2017Top 3 SICs -7.7% 13.4% 4.6%Remaining 11 SICs 8.4% 14.3% 23.9%
INSIGHT DEPARTMENT: TOURISM EMPLOYMENT IN SCOTLAND
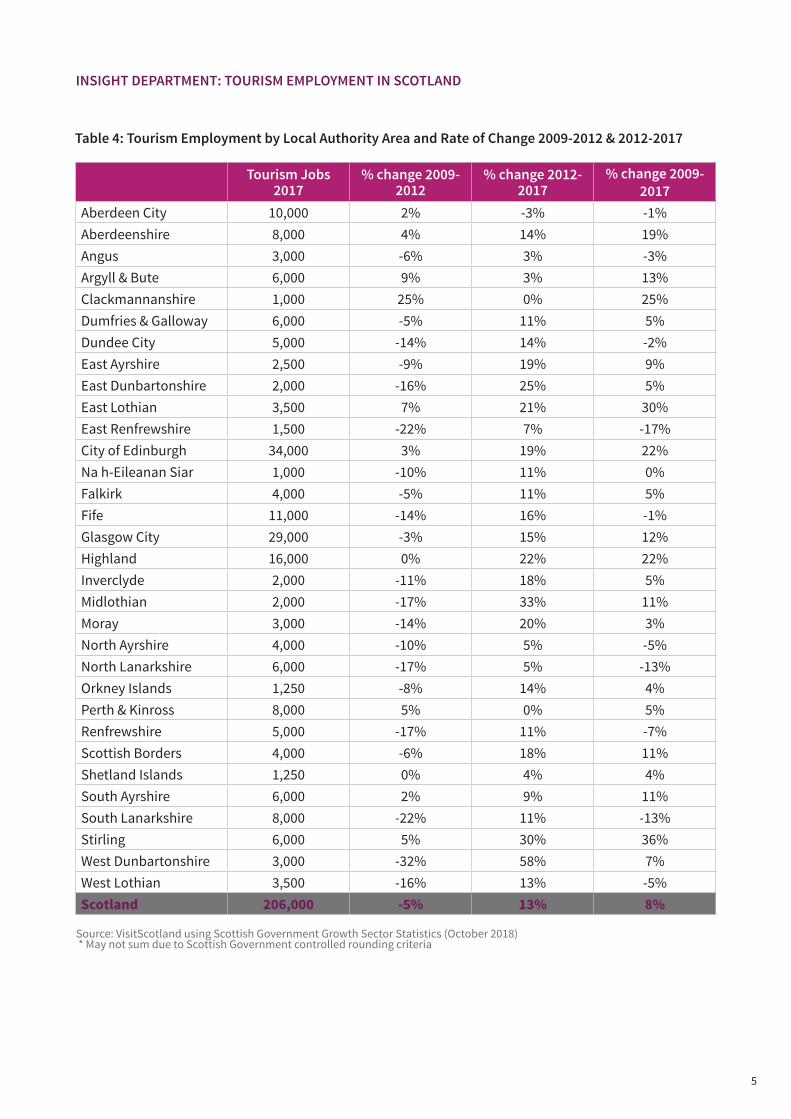
Table 4 shows the level of tourism employment in each local authority area and the rate of change over the three distinct time periods. Tourism employment declined in 21 local authorities between 2009-12 which contrasts to the period 2012-2017 when tourism employment increased in all but one local authority area.
Tourism employment over the longer term from 2009-2017 has generally grown in Scotland’s city regions: Edinburgh (22%); Glasgow (12%); Perth & Kinross (5%) and Inverness/Highland (22%) with the exceptions of Dundee and Aberdeen where tourism employment marginally decreased (-2% and -1% respectively).
Tourism employment in the South of Scotland (Dumfries & Galloway and Scottish Borders (5% and 11% respectively)) experienced strong growth from 2012-2017 following a period of decline in the previous period.
Tourism Employment by Local Authority Area & Rate of Change 2009-2017
4
INSIGHT DEPARTMENT: TOURISM EMPLOYMENT IN SCOTLAND
Tourism Jobs 2017
% change 2009-2012
% change 2012-2017
% change 2009-2017
Aberdeen City 10,000 2% -3% -1%Aberdeenshire 8,000 4% 14% 19%Angus 3,000 -6% 3% -3%Argyll & Bute 6,000 9% 3% 13%Clackmannanshire 1,000 25% 0% 25%Dumfries & Galloway 6,000 -5% 11% 5%Dundee City 5,000 -14% 14% -2%East Ayrshire 2,500 -9% 19% 9%East Dunbartonshire 2,000 -16% 25% 5%East Lothian 3,500 7% 21% 30%East Renfrewshire 1,500 -22% 7% -17%City of Edinburgh 34,000 3% 19% 22%Na h-Eileanan Siar 1,000 -10% 11% 0%Falkirk 4,000 -5% 11% 5%Fife 11,000 -14% 16% -1%Glasgow City 29,000 -3% 15% 12%Highland 16,000 0% 22% 22%Inverclyde 2,000 -11% 18% 5%Midlothian 2,000 -17% 33% 11%Moray 3,000 -14% 20% 3%North Ayrshire 4,000 -10% 5% -5%North Lanarkshire 6,000 -17% 5% -13%Orkney Islands 1,250 -8% 14% 4%Perth & Kinross 8,000 5% 0% 5%Renfrewshire 5,000 -17% 11% -7%Scottish Borders 4,000 -6% 18% 11%Shetland Islands 1,250 0% 4% 4%South Ayrshire 6,000 2% 9% 11%South Lanarkshire 8,000 -22% 11% -13%Stirling 6,000 5% 30% 36%West Dunbartonshire 3,000 -32% 58% 7%West Lothian 3,500 -16% 13% -5%Scotland 206,000 -5% 13% 8%
Table 4: Tourism Employment by Local Authority Area and Rate of Change 2009-2012 & 2012-2017
Source: VisitScotland using Scottish Government Growth Sector Statistics (October 2018) * May not sum due to Scottish Government controlled rounding criteria
5

INSIGHT DEPARTMENT: TOURISM EMPLOYMENT IN SCOTLAND
Tourism jobs as a % of Scotland total
Tourism employment as a % of total employment in LA in 2017
Tourism jobs per 1,000 of the Population
Aberdeen City 5% 8% 44Aberdeenshire 4% 6% 31Angus 1% 5% 26Argyll & Bute 3% 15% 69Clackmannanshire 0% 4% 19Dumfries & Galloway 3% 9% 40Dundee City 2% 8% 34East Ayrshire 1% 5% 21East Dunbartonshire 1% 4% 19East Lothian 2% 7% 33East Renfrewshire 1% 3% 16City of Edinburgh 17% 13% 64Na h-Eileanan Siar 0% 8% 37Falkirk 2% 5% 25Fife 5% 6% 30Glasgow City 14% 10% 47Highland 8% 13% 68Inverclyde 1% 6% 22Midlothian 1% 4% 22Moray 1% 7% 31North Ayrshire 2% 7% 29North Lanarkshire 3% 4% 18Orkney Islands 1% 10% 57Perth & Kinross 4% 11% 60Renfrewshire 2% 6% 34Scottish Borders 2% 8% 35Shetland Islands 1% 10% 54South Ayrshire 3% 12% 53South Lanarkshire 4% 5% 25Stirling 3% 14% 53West Dunbartonshire 1% 7% 25West Lothian 2% 4% 19Scotland 100% 8% 38
Table 5 shows the importance of tourism related jobs in each area relative to each areas population and employment profile.
Tourism related jobs are particularly prevalent in Scotland’s island and city economies. Commuter local authorities with good transport links to Glasgow and Edinburgh (i.e. East Renfrewshire; East Dunbartonshire and West Lothian) have the lowest number of tourism jobs per head of population.
Table 5: Tourism Employment as % of Scotland Total & all Jobs in Local Authority 2017
Tourism Employment as % of Scotland Total & all Jobs in Local Authority 2017
Source: VisitScotland using Scottish Government Growth Sector Statistics (October 2018)
6

INSIGHT DEPARTMENT: TOURISM EMPLOYMENT IN SCOTLAND
Figure 2 shows the number tourism jobs per 1,000 head of population4. It shows the importance of the tourism sector in the context of all residents not just the resident workforce.
Figure 2: Tourism Jobs per 1,000 head of population
Source: VisitScotland using Scottish Government Growth Sector Statistics (October 2018)
4includes economically unproductive part of each local authority area (i.e. children; unemployed and economically inactive).
7

Source: VisitScotland using Scottish Government Growth Sector Statistics (October 2018)
INSIGHT DEPARTMENT: TOURISM EMPLOYMENT IN SCOTLAND
Local Authority 2009 2012 2017 Largest Growth Sector in LA Aberdeen City 16% 16% 17% Energy (45%)Aberdeenshire 19% 19% 18% Food and Drink (36%)Angus 28% 27% 26% Food and Drink (43%)Argyll & Bute 45% 48% 46% Sustainable TourismClackmannanshire 30% 36% 34% Sustainable TourismDumfries & Galloway 29% 29% 28% Food and Drink (47%)Dundee City 34% 36% 39% Sustainable TourismEast Ayrshire 26% 23% 25% Financial and Business Services (35%)East Dunbartonshire 37% 31% 33% Sustainable TourismEast Lothian 35% 35% 37% Sustainable TourismEast Renfrewshire 45% 42% 38% Joint with Finance & Business ServicesCity of Edinburgh 25% 27% 29% Finance & Business Services (50%)Na h-Eileanan Siar 14% 14% 14% Food and Drink (72%)Falkirk 35% 33% 29% Joint with Finance & Business ServicesFife 36% 34% 35% Sustainable TourismGlasgow City 23% 24% 25% Financial and Business Services (47%)Highland 36% 36% 38% Sustainable TourismInverclyde 34% 29% 31% Financial and Business Services (54%)Midlothian 32% 27% 34% Sustainable TourismMoray 27% 24% 26% Food and Drink (52%)North Ayrshire 42% 41% 37% Sustainable TourismNorth Lanarkshire 28% 25% 25% Financial and Business Services (34%)Orkney Islands 27% 26% 26% Food and Drink (51%)Perth & Kinross 31% 35% 33% Sustainable TourismRenfrewshire 38% 34% 34% Sustainable TourismScottish Borders 30% 28% 28% Food and Drink (42%)Shetland Islands 23% 22% 52% Food and Drink (55%)South Ayrshire 50% 52% 52% Sustainable TourismSouth Lanarkshire 30% 25% 26% Financial and Business Services (29%)Stirling 37% 37% 37% Joint with Finance & Business ServicesWest Dunbartonshire 43% 33% 39% Joint with Finance & Business ServicesWest Lothian 25% 23% 26% Financial and Business Services (33%)Scotland 28% 28% 29% -
Scotland’s Economic Strategy identifies sustainable tourism as one of six growth sectors5 where Scotland has a distinct comparative advantage. Sustainable tourism is the most represented growth sector in Scottish Local Authorities. Tourism employment is the largest provider of employment in 16 out of 32 local authorities (50%) (Table 6)6.
Table 6: Tourism Employment relative to all Growth Sector Employment
Tourism Employment Relative to Employment in other Growth Sectors
5Growth Sectors: Food & Drink; Creative Industries (including digital); Sustainable Tourism’; Energy; Financial & Business Services and Life Sciences
8
6Sustainable Tourism is the largest growth sector in 12 local authorities and is the joint largest (with Finance & Business Services) in a further four. Food & Drink is the largest growth sector in eight local authorities followed by Finance & Business Services (seven) and Energy (one).

CONTACT US
Insight DepartmentVisitScotlandOcean Point One94 Ocean DriveEdinburgh EH6 6JH
0131 472 [email protected] 2018
visitscotland.com visitscotland.org
Disclaimer: VisitScotland has published this report in good faith to update stakeholders on its activity. VisitScotland has taken all reasonable steps to confirm the information contained in the publication is correct. However, VisitScotland does not warrant or assume any legal liability for the accuracy of any information disclosed and accepts no responsibility for any error or omissions. Images © VisitScotland
USING AND INTERPRETING STATISTICAL DATASource: VisitScotland using Scottish Government Growth Sector Statistics (October 2018)
PICTURESFront Cover: Kelburn Castle & Estate, Fairlie, North AyrshirePage 1: Mountain Bike World Cup, Fort William, HighlandPage 2: North Berwick Beach, East Lothian