insights and opportunities to improve control, maximise ...€¦ · travel & entertainment...
TRANSCRIPT

Insights and opportunities to improve control, maximise visibility and drive efficiencies in indirect spend
Katrina Cliffe,Vice President & General Manager,Global Commercial Card,American Express September 21st 2011

Agenda
American Express in Public Sector
Economic Outlook
Indirect Spend
Example: Making IT spend more efficient, transparent and accountable

3
American Express
! Founded in 1850! Issued first travellers cheque in
1891! First credit card issued in 1958
! 65,000 Employees! 55% outside US! 30% in Europe! 60% revenues outside US
! Global Card Spend of $640bn! Avg Annual Corporate Card Spend
of over $11k in UK
Public Sector ExperienceLargest Card spend
A Long History in PaymentsAn International Organisation
! 435 Public Sector partners globally! £881m public sector payments
annually
American Express is one of the world’s leading payments companies, with over 235,000 corporate payments customers globally. American Express combines
deep expertise, best-in-class service and industry leading products to understand public sector organisations and deliver process efficiency and
monetary savings on public sector payments across the globe.

Agenda
American Express in Public Sector
Economic Outlook
Indirect Spend
Example: Making IT spend more efficient, transparent and accountable

UK Economic OutlookThe UK economic situation remains weak" GDP in Q2 grew by 0.2%, excluding one-off factors the
growth would have been 0.7%" UK Inflationary pressure remains high, August saw an
increase of the CPI to 4.5% (from 4.4% in July) and is expected to rise to 5% before year end. RPI also saw an increase from 5.0% to 5.2%
" Retail sales growth slowed to 0.2% in July driven by inflation, unemployment and limited wage rises
" Inflationary pressures and overall concern around the economy have eased calls for a BoE rate change – rise not expected in 2011
" Unemployment rose by 80,000 in August to 7.9%, its sixth consecutive monthly increase. Private sector job increases are not sufficient to cover cuts in the public sector
" The 2012 economic outlook for the UK remains uncertain, with latest growth estimates ranging from 1.1% to 1.4%.
" The OECD forecast the GDP exit growth rate for Q4 will be 0.3%
" Consumer and business confidence is down, with client expectations of growth next year low
Source: EIU August 2011 Market Report

Your View of the UK’s Economic Prospects
Total (%)
Substantial economic expansion 1
Modest economic expansion 22
No change in economic prospects 22
Modest economic contraction 35
Substantial economic contraction 20
Not stated 1
Q1: ‘In your opinion, what are the economic prospectsfor the country over the next 12 months?’
Total (%)
Strongly agree 30
Agree 52
Neutral 12
Disagree 5
Strongly disagree 1
Not stated 1
Q2: Do you agree or disagree with the following statement?"Over the next two years, the businessenvironment will be more volatile/variable than during the period before the downturn."

Agenda
American Express in Public Sector
Economic Outlook
Indirect Spend
Example: Making IT spend more efficient, transparent and accountable

Organisations look ahead for profitable growth opportunities and long-term efficiencies
Organisations look ahead for profitable growth opportunities and long-term efficiencies
Organisations adjust to the ‘new normal’and invest selectively for growth
Organisations adjust to the ‘new normal’and invest selectively for growth
Broader expenditurereductions in all areas of businesses
Broader expenditurereductions in all areas of businesses
Short-term expenditure reductions adapt to changing economic conditions
Short-term expenditure reductions adapt to changing economic conditions
Why focus on Indirect Spend Management?
Financial Crisis
Financial Crisis
Slowing Recovery
Uncertain Outlook
2008 2009 2010 2011+
Increased focus on control and compliance
As the economic situation changes - we can see that organisations have the opportunity to drive savings from Indirect Spend within their business.

Travel & Entertainment Other Indirect Business Expenses$100B
$1Trillion
$230B
$770B
European Indirect Business Expenses Landscape
Based on recent research, American Express estimates the 2011 European Indirect Business Expenses landscape to be just over $1 Trillion
European Indirect Spend Market Estimate: €1,300 billion ($1,700 billion) was calculated as the total GDP for Europe multiplied by 9% of total revenue.

European Indirect Spend still represents a considerable opportunity for applying expenditure management practices
1. Improving control 2. Maximising visibility3. Driving efficiencies
Indirect Spend represents a far more complex mix of categories
Finance and procurement environments are growing increasingly complex, with organisations looking to balance three key goals
1. Driving growth2. Achieving cost savings 3. Meeting regulatory requirements
Progress has been made in many organisations to gain greater T&S
visibility and control – GPC has been a good tool for this
European Indirect Business Expenses Landscape

Study responses
11
Total number of respondents and total revenueTo
tal R
even
ue (i
n €
billio
ns) 247
217
30
Top 10 industries represented
" Chemicals, Oil and Gas
" Professional Services
" Engineering
" Telecommunications
" Medical Equipment
" Financial Institutions
" Food and Nutrition
" Construction
" High-Tech
" Pharmaceuticals
Organisation Segment Classification: Large: Revenue >= €572 million, Employees >= 500, Mid-sized: Revenue >= €2.3 million and < €572 million, Employees < 500
Total respondents: 162 94 68

12
The study reveals 3 particularly striking opportunities...
Summary of key findings
Findings
1. Compliance is a major challenge for organisations
2. Organisations have poor spend visibility and accuracy to support effective sourcing
3. There is very limited evidence that pure automation improves processing efficiency
Opportunities
‘Money is left on the table’
The organisations that took part in this Study could save up to €900 million
Major opportunity for improving efficiency by better practices
Improving Control
Driving Efficiencies
Maximising Visibility

13
On average, more than 70% of the organisations use preferred suppliers lists across indirect categories
Percentage of organisations that have preferred supplier lists
By organisation size By customer / non-customer
80%
64%76%
67%
Improving Control

14
However, on average, only approximately two thirds of the total Indirect Spend complies to preferred supplier lists
Percentage of spend that complies to preferred supplier list
67%63%
71% 68%64%
54%
67%
56%63%
60%
70% 69% 70% 73%
61% 62%
Amex customers Non-customer
71% of the total indirect spend for companies in the UK is compliant to preferred supplier lists as compared to 66% companies in the survey
Improving Control

15
On average, more than 60% of the organisations have contracted rates across indirect categories
Percentage of organisations that have contracted rates
By organisation size By customer / non-customer
66% 63% 59%
Improving Control
58%
16
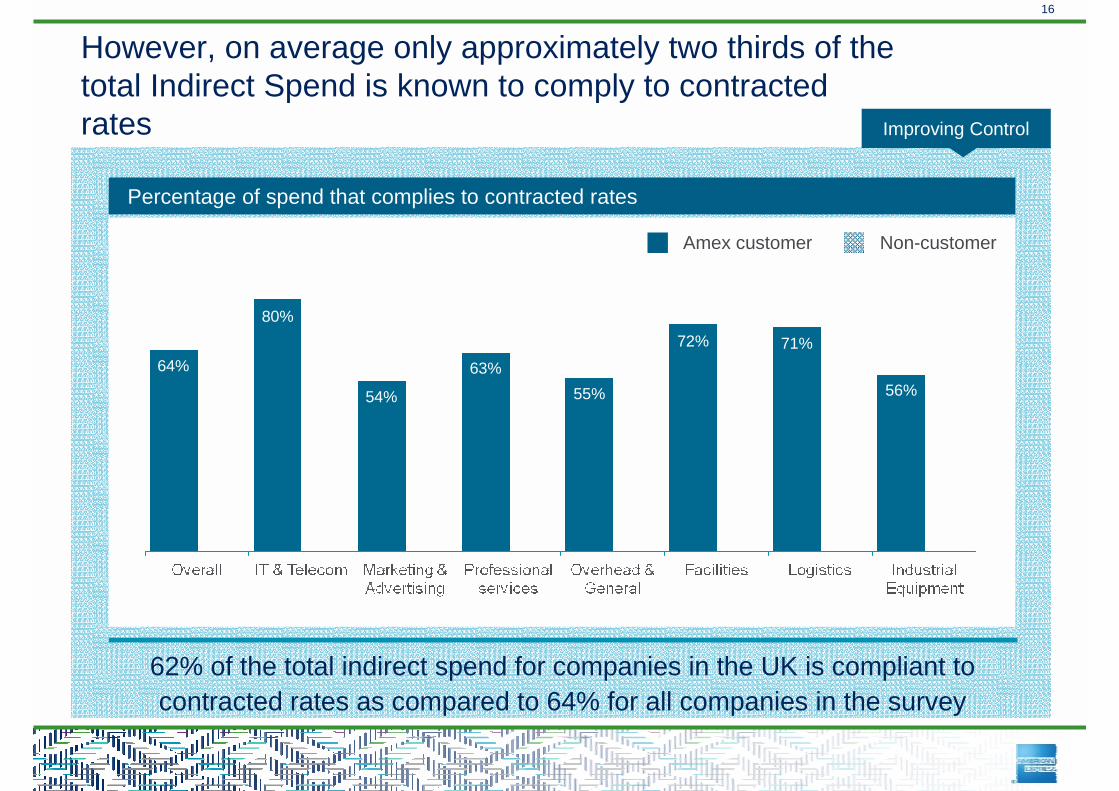
However, on average only approximately two thirds of the total Indirect Spend is known to comply to contractedrates
Percentage of spend that complies to contracted rates
64% 63%
80%73%
54% 57%63%
56% 55% 52%
72% 75%71% 71%
56% 55%
Amex customer Non-customer
62% of the total indirect spend for companies in the UK is compliant to contracted rates as compared to 64% for all companies in the survey
Improving Control

17
Approximately half of the organisations in the survey did not have controls in place to manage non compliance
Reasons for non-compliance to preferred supplier lists
Reasons for non-compliance to contracted rates
80%
64%38%
39%
55%
% of organisations that agree
Buyers have poor visibility
Adding new suppliers is easy
Controls to identify non-compliance are not in place
41%
69%
49%
% of organisations that agree
Buyers have poor visibility
Buyer have noincentives to comply
Controls to identify non-compliance are not in place
Improving Control

18
Overall, more than 40% of the organisations did not have adequate item level visibility of their Indirect Spend
Percentage of organisations with poor item level spend visibility
39%
50%
80%73%
48%
65%
38%
50%53%
68%
34% 35% 33%
44% 42%
50%
26%
38%
Amex customer Non-customer
67% of companies in the UK have high item level visibility as compared to average of 58% for all companies in the survey
Maximising Visibility

19
Of the organisations who have good item level spend visibility, one-third believed that their spend information is unreliable
Percentage of organisations that have poor item level spend accuracy
By organisation size By customer / non-customer
30%
37%
31%
39%
Maximising Visibility

20
Two in three organisations do not capture item level details on specifications and price that is required for effective sourcing
Reasons for poor item level spend visibility and accuracy
64%
58%
57%
% of organisations that agree
Poor compliance to procurement policy
Not all transactions are captured on the systems
Not all item level transaction details are captured
66%
Multiple systems within the organisations that do not integrate well
“Capturing line item data is becoming more and more important to us, as we recognise that this data helps us to better understand our future cost drivers.”
Michael Flueck, Assistant Vice President, ABB ManagementServices Ltd.
Maximising Visibility

21
The organisations that took part in this Study could save up to €900 million
Approach used for estimating size of the opportunity
€45 billion
€18 billion
Maximising Visibility
Total Indirect Spend for organisations in the survey
Savings opportunity
According to A.T. Kearney, Assessment of Excellence in Procurement study, effective procurement practices could yield up to 5% savings for addressable spend.
Applying 5% savings estimate to the €18 billion Indirect Spend that has poor spend visibility gives€900 million.

22
Unsurprisingly, organisations tend to have a higher usage of electronic purchase orders as compared to electronic invoices
Usage of electronic purchase orders and electronic invoices
José Luis Sebastian Fernandez, Purchasing Manager, Codere SA
“Most invoices from large suppliers are electronic, enabling them to be easily processed. For small suppliers who provide their invoices on paper, we often find it difficult to assign costs to projects accurately, which means it can take up to four weeks to settle them..”
51%
26%
Driving Efficiencies

23
Organisations that have implemented a high proportion of electronic invoices have reduced cycle times
Breakdown of the invoice receipt to approval cycle times (average number of days)
26%
5.3Organisations where less than 60% of the total invoices are electronic
Organisations where 60% or more of the total invoices are electronic
5.2 11.3
3.1 3.4 4.1
21.8
10.6
Input invoicesReconcile invoicesManagement time
Driving Efficiencies

24
However, there is limited correlation between automation and resource requirements
Correlation between usage of electronic purchase orders / invoices and FTE requirements
Large organisations
80%
64%
Ave
rage
FTE
s in
volv
ed
% of electronic purchase orders / invoices
Mid-sized organisations
80%
64%
Ave
rage
FTE
s in
volv
ed
% of electronic purchase orders / invoices
Average FTEs involved in raising POs
Average FTEs involved processing invoices
Driving Efficiencies
Average FTEs involved in raising POs
Average FTEs involved processing invoices

25
Making progress necessitates striking the right balance...
Key recommendations
1. Deploy ‘before the event’ controls without making it too bureaucratic
Behaviour
2. Create a feedback loop to make lack of compliance and its costs visible to users
3. Drive efficiency by following a top down, risk-based approach
Shift behaviour by creating the right environment
Controls Efficiency
Feedback loop

Agenda
American Express in Public Sector
Economic Outlook
Indirect Spend
Example: Making IT spend more efficient, transparent and accountable

27
Q: Please rank the importance to your organisation of each of the following areas over the next 12 months
Mean scores Total
Negotiating better deals with suppliers
4.2
Increasing visibility of all costs incurred
3.9
Improve administrative process efficiency(streamline/automate finance, accounts payable, procurement and other processes, etc.)
3.8
Increasing visibility of indirect expenses
3.5
Awarding contracts to more SME organisations
2.7
Mean scores Total
Travel and subsistence 0.8
IT -0.1
Temporary workforce 0.4
Stationery 0.3
Telecoms -0.1
Public Relations (Including Marketing and Advertising)
0.1
Consultancy 0.2
Business Cards 0.1
Q: ‘To what extent do you believe your department has visibility and control of the following indirect expenses?’
Q: Over the next 12 months, does your department plan to spend more, the same amount, or less in each of the following categories?
Mean scores Total
Transportation/logistics services -0.8
Computer hardware (PCs, servers, mobile technology)
-0.6
Enterprise-level IT systems -0.6
Labour/headcount -0.9
Business and professional services -0.8
Travel and entertainment -0.9
Advertising and marketing/PR services
-0.9
Depreciable assets (including real estate, facilities, and Property, Plant and Equipment)
-0.8
Production inputs (raw materials, intermediate goods, etc.)
-0.8
28
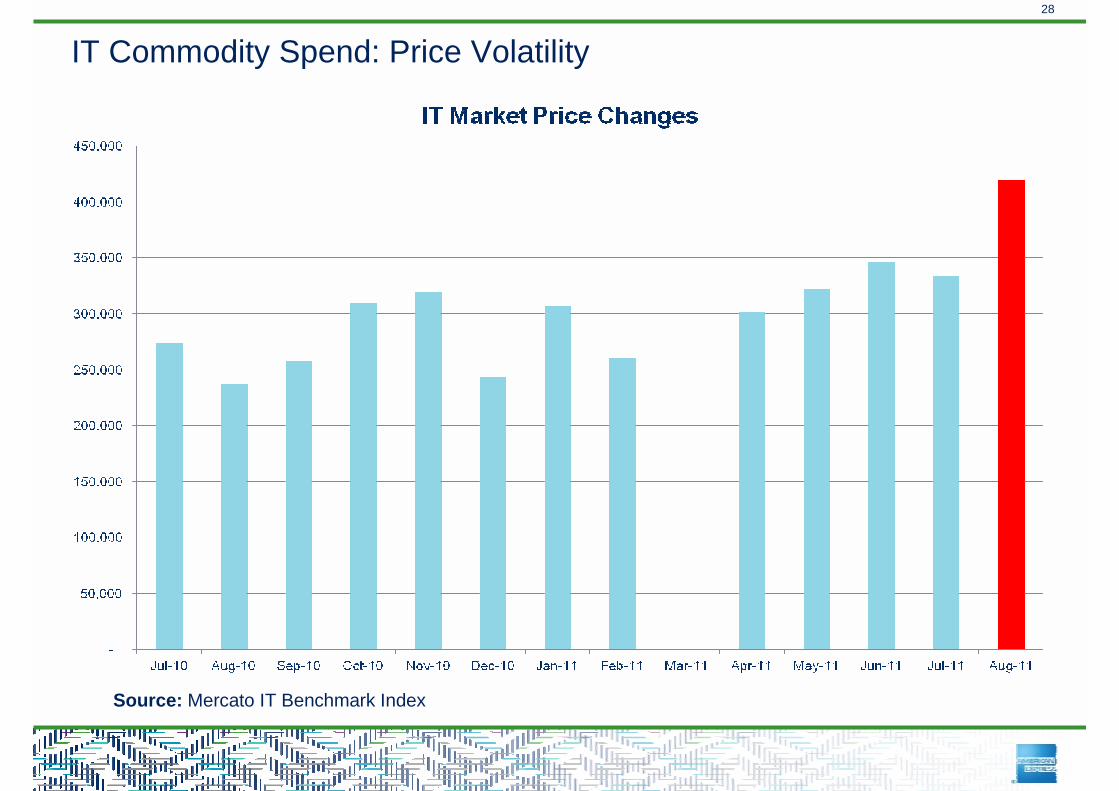
IT Commodity Spend: Price Volatility
Source: Mercato IT Benchmark Index

29
IT Commodity Spend
Lack of Visibility of
Spend
Desire to Reduce Spend
Highly volatile, complex pricing
ecosystem
A very challenging environment to control and reduce spend...
++ ++
==

HP Laserjet CP2025N Network Printer Colour Laser20 ppm Mono 20 ppm Colour600 x 600 dpi USB Fast Ethernet PC, Mac
Part Number: CB494A#B19
Framework Pricing Price
HP Local Government Buying Solutions (CITHS) IPG £244.12
HP Scotland Buying Solutions (CITHS) IPG £244.12
HP Defence Catalist IPG £244.12HP HealthBuying Solutions (CITHS) IPG £244.12
30
Real life example
Market Pricing £228.43
2,183 stock (+146)

31
Example: PROBRAND / American Express approach
ERP
eAuction"Aggregation of total order"Aggregation of all other system users
Full supply chain access:"Frameworks"Market Price"Other “special pricing” deals
DepartmentSpend Analytics
Full overview of purchase at line
item detail
Spend: £6,852.90
(30 printers at Market Price)
eAuction:
1.5% discount
Spend: £6,750.11
Supplier Order:£6,750.11
Rebate (0.5%)£33.75
Totals
Spend: £6,750.11
Rebate: £33.75
Net Spend: £6,716.36
Net Saving:6.13%
Economics through the
Process
Supplier 1
Level 3Data
AutomatedPayment
Level 3Data
Central Data Warehouse
Full overview of purchase at line
item detail

1.Lowest available price
2.Spot aggregation and eAuction saving
3.Payment of financial rebate under GPCIII contract
1.Process savings1. Complete automation of buy side process
2. Complete automation of payment process
2.Time savings
1.Total spend control & compliance
2.Complete visibility of spend
3.Good PR
32
Benefits
Soft Savings: Process Efficiencies
Control & Compliance
Hard Savings and Additional Income££! Driving efficiencies
Indirect Spend Management Drivers
! Maximising visibility
! Improving control
! Driving efficiencies
! Improving control

1. Economic environment is, and will remain challenging
2. There are some clear lessons to be drawn from the management of indirect spend
3. Companies like American Express will seek to help where there is an opportunity
33
SUMMARY