insights from zootaxa on potential trends in zoological taxonomic
TRANSCRIPT

DEBATE Open Access
Insights from Zootaxa on potential trends inzoological taxonomic activityElise Tancoigne1*, Cyprien Bole1, Anne Sigogneau2 and Alain Dubois1
Abstract
Background: An opinion currently shared by taxonomists and non taxonomists alike is that the work ofinventorying biodiversity is unbalanced: firstly, in favour of countries in which taxonomy has been studied for along time, and, secondly, in favour of vertebrates. In the current context of threats of species extinction, access fortaxonomists to biological material and information becomes crucial if the scientific community really aims at abetter knowledge of biological diversity before it is severely and irreversibly impoverished. We performed ananalysis of 748 papers published in Zootaxa in 2006 and 2007, as well as 434 questionnaires sent to their authorsto test these opinions. A generalization of these results to zoological taxonomy as a whole is discussed.
Discussion: We found that the disequilibrium is not exactly what it usually considered to be. The USA, China andBrazil are currently the three leading countries in zoological taxonomy. Each of them presents, however, a differentpattern. Taxonomists from Asia and South America are younger and mainly work in universities, not museums. Abias in favour of vertebrates still exists if we refer to the effort invested in each group to produce taxonomic data,but not to the number of papers. Finally, we insist on the idea that “describing a species” is very different from“knowing a species”.
Summary: The taxonomic involvement of a country, in terms of manpower and funding, appears to be a key factorin the development of fruitful taxonomic research. This message seems to have been understood by the countriesthat recently decided to increase considerably their taxonomic involvement. It still has to be received by thosewho did not.
BackgroundTaxonomy is the disciplinary field of biology in chargeof collecting, studying, describing, classifying and nam-ing living organisms and taxa. It is a fundamental disci-pline for biology as a whole. It is thus crucial thattaxonomists be given access to biological material andinformation. Previous studies [1-4] and widespread opi-nions [5,6] nevertheless postulate that access to speci-mens is unbalanced, both as regards the differentregions of the world and the taxonomic groups. First,countries and areas where researchers have historicallyworked for a longer time on zoological taxonomy(Europe, North America and Australia) would thereforedominate zoological taxonomy. Second, the attention
paid to Vertebrata would be higher than for other taxa,especially Arthropoda.Yet, a quick search of all papers describing new spe-
cies in the Web of Science in 2006 reveals that Braziland China are among the top five publishing countries(USA: 25%, China: 13%, Germany: 8%, Japan: 7%, Brazil:6%).So, as concerns the distribution of zoological taxon-
omy, where are we now? No recent quantitative studyexists at the world scale. Such surveys were either lim-ited to a taxon [3,7-11], or a country [12-22], or theyoffered a summary of fragmented information [23-25].However, today a mega-journal of taxonomy, Zootaxa,
provides a worldwide coverage and deals with numerouszoological taxa. In 2004, it published far more pagesthan the combined total published in the ten core jour-nals in systematic zoology [26]. It contributed 13% of allnew taxa of animals indexed in the Zoological Recordsince 2004 [27]. An analysis of this journal could
* Correspondence: [email protected] 7205 OSEB, Département Systématique et Evolution, Muséum nationald’Histoire naturelle, CP 30, 25 rue Cuvier, 75231 Paris Cedex 05, FranceFull list of author information is available at the end of the article
Tancoigne et al. Frontiers in Zoology 2011, 8:5http://www.frontiersinzoology.com/content/8/1/5
© 2011 Tancoigne et al; licensee BioMed Central Ltd. This is an Open Access article distributed under the terms of the CreativeCommons Attribution License (http://creativecommons.org/licenses/by/2.0), which permits unrestricted use, distribution, andreproduction in any medium, provided the original work is properly cited.

therefore produce a useful and relevant insight ontoday’s taxonomical practices in zoology.Quantitative tools will be used in this work to answer
two questions:
1. Is zoological taxonomy still mostly practised incountries that have historically been taxonomicallyactive?2. Is zoological taxonomy still unbalanced in favourof vertebrates, vs. arthropods?
In conclusion, we will discuss the possible generaliza-tion of our results to taxonomy as a whole.We determined the countries and areas in which (1)
more works are published in zoological taxonomy; (2)most of the active taxonomists are working; (3) foreigntaxonomists are mainly received; (4) taxonomists areinvolved in collaborations; (5) more species aredescribed from other areas; (6) types specimens arekept; and, finally, (7) research is carried out in museums,which are traditional institutions for taxonomic research[9,15,28-30].The disequilibrium in favour of vertebrates can be
documented in terms of either taxonomic production(publications, pages, new species), or in the meansemployed for the studies (number of taxonomists, of spe-cimens, of characters...). Therefore, we gathered addi-tional information on (8) the taxa to which are devotedthe higher number of publications, pages, new species aswell as the taxa represented by the highest numbers of(9) taxonomists, (10) characters and (11) specimens used.
MethodsSampling procedureWe chose to work on the years 2006 and 2007 becausethey were those when most articles had been producedat the time of our study (n = 2138). We randomlyselected 748 articles among all those published in Zoo-taxa during this period. We devised a method to fix thesampling size. This method is explained below. Then weused three main procedures to obtain the data from oursample: data extraction from literature, data mining ondatabases and a questionnaire sent to each author of thesample who had provided an email. The data obtainedfrom the articles or the questionnaire were entered intoa database built using Access2002.Five parameters describing each publication of the
whole set of 2138 articles published in Zootaxa in 2006-2007 were available in the Zoological Record online: (1)treated taxon, (2) number of pages, (3) number ofauthors, (4) number of described species and (5) num-ber of references. Three other parameters found on theZootaxa website [31] were added: (6) whether the articleis in open access or not, (7) its delay of publication after
submission and (8) its category (article or monograph).A sampling script was written with the R language [32].We made 1000 random samplings of 5% of the totalnumber of papers (function sample() without replace-ment of the default package base). This operation wasrepeatead nine successive times with increasing samplesizes. Thus, we obtained 1000 samplings of 107 articles,1000 samplings of 214 articles, etc. Then we used statis-tical tests to determine the rate of correct samples thateach operation produced. Each of the 10,000 sampleswas tested and considered correct if the eight para-meters did not significantly differ from the whole set(P < 0.05). As our data did not verify the normality con-dition, non-parametrical tests were performed for eachof the eight parameters: c2 for (1); Wilcoxon/Mann-Whitney for (2), (3), (4), (5), (7); and binomial tests for(6) and (8). We decided to choose the minimal samplesize for which 950 out of 1000 samples would not statis-tically differ from the whole set. This size is 35%, i.e.,748 articles (Figure 1). Finally, a random sampling of748 articles was performed. We also checked that it didnot significantly differ from the whole set for each ofthe eight parameters.
QuestionnaireThe 748 articles studied were written by 1778 authors.Once multiple authorships were removed, 1384 authorsremained, 1025 of whom had mentioned an e-mail
5060
7080
9010
0
Sample sizes (fraction of the global population)
Pro
port
ion
of s
ampl
es th
at fi
t the
glo
bal p
opul
atio
n
5% 10% 15% 20% 25% 30% 35% 40% 45% 50%
95
74
34%
Figure 1 Proportion of samples that correctly represents thetotal set of articles when the sample size is growing. Eightparameters were tested both over the total set and over thesamples. The probability of drawing a correct sample is 95% whenthe sampling size is 34% of the global population.
Tancoigne et al. Frontiers in Zoology 2011, 8:5http://www.frontiersinzoology.com/content/8/1/5
Page 2 of 13

address in the paper. A questionnaire had been sent viae-mail in May 2008 to 10% of these 1025 authors for apreliminary study. It received 56 answers and commentsfrom authors from most parts of the world (exceptAfrica). Our questionnaire was considered approved andit was then sent once again in May 2009 to the 939remaining authors. It was rejected by 105 mailboxes andreceived 434 answers in all (56 in 2008 and 378 in2009). Its answer rate was thus 47%. We used Email-Questionnaire software to send our questionnaire [33].
Data pickingWe obtained data for the 748 sampled articles; the 1778authors and their 1111 institutions; the 1413 new spe-cies that were described in it and their 1404 holotypes;15 syntypes; 23 468 paratypes and the 4987 other speci-mens used in descriptions. The 1778 taxonomic authorscorresponded to 1384 “real persons”, of whom 434 taxo-nomists sent us personal data. Table 1 presents the data.Each country was affiliated to a region through the
data of the CIA world factbook [34]. Major regions areabbreviated the following way: Af (Africa), As (Asia), E(Europe), M (Middle East), N (North America), O(Oceania), S (South America). Given the small amountof papers from Central America, this region wasgrouped with South America.Authors (i.e. names on paper) and taxonomists (i.e.
real persons) were distinguished. For example, a taxono-mist who writes two articles represents two authors.
AnalysesThe number of publications per major region or countrywas computed fractionally. For example, an article writ-ten by two authors from Asia and one author who men-tioned two addresses, one in South America and one inAfrica, counts for 0.5 for Asia, 0.25 for South Americaand 0.25 for Africa. The number of publications percategory of institution was also calculated fractionally.For example, an article written by two authors from theUniversity of Sao Paulo and one author who mentionedtwo addresses, one in the University of Sao Paulo andone in the American National Museum, counts for 0.75for Brazilian universities and 0.25 for North Americanmuseums. The number of type-specimens per categoryof institution is calculated directly. For example, a newspecies with one holotype kept in the University of SaoPaulo and 54 paratypes kept in the American NationalMuseum counts 1 for North American museums and 54for Brazilian universities. The number of taxonomistsper major region or country was calculated fractionallyonce duplicated authors (authors with same name andaddress) had been removed. For example, if an authormentioned two addresses in two different major regionss/he counts 0.5 for each region. The collaboration
indicator of the Observatoire des Sciences et des Techni-ques (Paris, France) was used to study collaborations:(number of publications of a region A with an otherregion B)/(total number of publications of region A).For instance, an article written by one author from Asiaand two from South America counts for one co-publica-tion between Asia and South America.All the data was analysed with the free statistical soft-
ware R [32] and packages ade4 [35], RODBC [36], vcd[37,38] and FactoMineR [39]. We used correspondenceanalysis (CA) to summarize the data’s structure andidentify similarities between the variables of a contin-gency table [40]. CA measures the distances betweenthe row and column points and presents the inter-rela-tions of variables in calculated dimensions that outlinesmaximum of variance (VARIMAX rotation). The analy-sis determines which category values lie close togetherand which are far from each other. These can be seenon a correspondence map, where the row and columncategories are plotted along the computed factor axes.Spatial proximity between categories does not imply acorrelation between the categories but instead a strongspecific link in relation to these factors. This graphicalmethod is based on a c2 test that measures the deviationto independence model. We also performed c2 statisticaltests to compare proportions when it was needed.
Evaluation of Zootaxa biasesOur choice to work on Zootaxa inevitably represents abias. Because our questions treat the different areas ofthe world and taxa, two possible biases concern therepresentativeness of (1) the taxa studied in Zootaxaand (2) the regions where the studies were carried out.We compared the proportion of the different taxa stu-
died in 2006 in Zootaxa and in all the publicationsindexed in the entire volume of the Zoological Recordfor 2006 (Figure 2). We observed that “taxo*”, “taxon-omy” or “systematic” did not even allow us to find allarticles published in Zootaxa in 2006. We used the key-word “sp nov”, coming from the Zoological Record’s the-saurus, to find these publications in the ZoologicalRecord. If all categories of Figure 2 are considered, a c2
test shows significant differences (P < 0.001) betweenthe Zoological Record and Zootaxa. However, the distri-bution does not show significant differences (P = 0.12) ifwe consider only three classes of taxa: ‘Arthropods’,‘Vertebrates’ and ‘Other’. Therefore, for the purposes ofour study the taxa were grouped as ‘Vertebrates’,‘Arthropods’ and ‘Other’.We also compared the proportions of the different
regions where new species were described in 2006 inZootaxa and in all the publications with the same pat-tern indexed in the entire volume of the Web of Science(WoS) for 2006 (Figure 3). We used the Analyze Results
Tancoigne et al. Frontiers in Zoology 2011, 8:5http://www.frontiersinzoology.com/content/8/1/5
Page 3 of 13
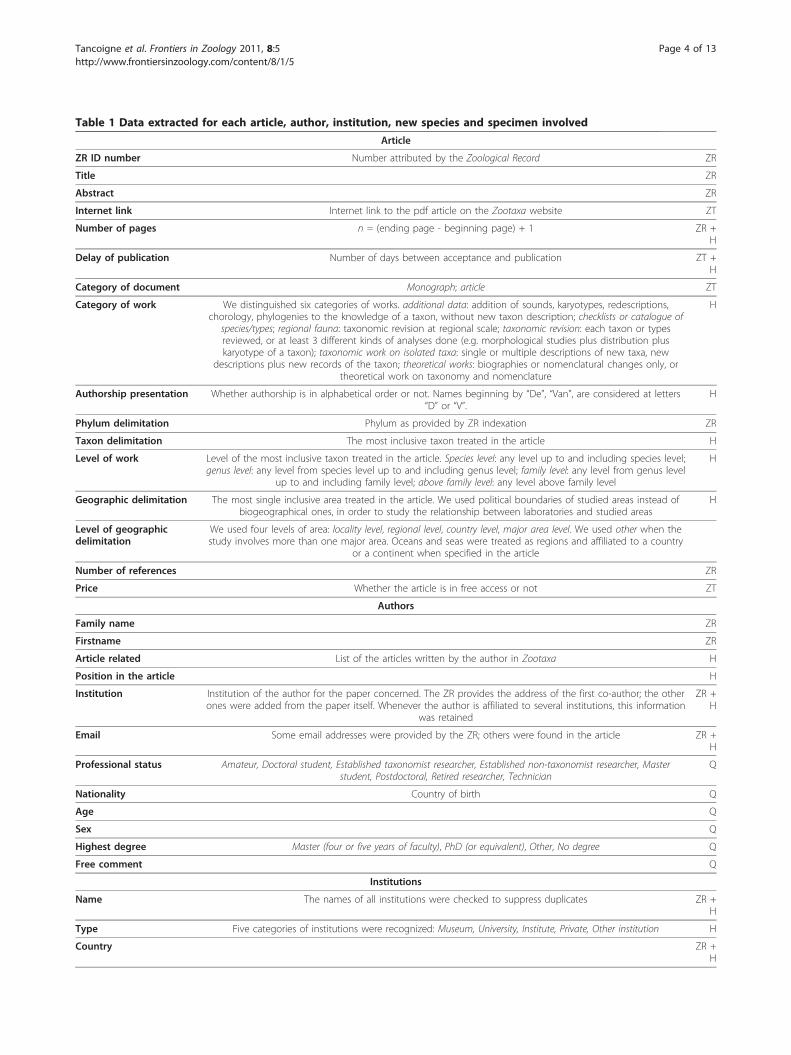
Table 1 Data extracted for each article, author, institution, new species and specimen involved
Article
ZR ID number Number attributed by the Zoological Record ZR
Title ZR
Abstract ZR
Internet link Internet link to the pdf article on the Zootaxa website ZT
Number of pages n = (ending page - beginning page) + 1 ZR +H
Delay of publication Number of days between acceptance and publication ZT +H
Category of document Monograph; article ZT
Category of work We distinguished six categories of works. additional data: addition of sounds, karyotypes, redescriptions,chorology, phylogenies to the knowledge of a taxon, without new taxon description; checklists or catalogue of
species/types; regional fauna: taxonomic revision at regional scale; taxonomic revision: each taxon or typesreviewed, or at least 3 different kinds of analyses done (e.g. morphological studies plus distribution pluskaryotype of a taxon); taxonomic work on isolated taxa: single or multiple descriptions of new taxa, new
descriptions plus new records of the taxon; theoretical works: biographies or nomenclatural changes only, ortheoretical work on taxonomy and nomenclature
H
Authorship presentation Whether authorship is in alphabetical order or not. Names beginning by “De”, “Van”, are considered at letters“D” or “V”.
H
Phylum delimitation Phylum as provided by ZR indexation ZR
Taxon delimitation The most inclusive taxon treated in the article H
Level of work Level of the most inclusive taxon treated in the article. Species level: any level up to and including species level;genus level: any level from species level up to and including genus level; family level: any level from genus level
up to and including family level; above family level: any level above family level
H
Geographic delimitation The most single inclusive area treated in the article. We used political boundaries of studied areas instead ofbiogeographical ones, in order to study the relationship between laboratories and studied areas
H
Level of geographicdelimitation
We used four levels of area: locality level, regional level, country level, major area level. We used other when thestudy involves more than one major area. Oceans and seas were treated as regions and affiliated to a country
or a continent when specified in the article
Number of references ZR
Price Whether the article is in free access or not ZT
Authors
Family name ZR
Firstname ZR
Article related List of the articles written by the author in Zootaxa H
Position in the article H
Institution Institution of the author for the paper concerned. The ZR provides the address of the first co-author; the otherones were added from the paper itself. Whenever the author is affiliated to several institutions, this information
was retained
ZR +H
Email Some email addresses were provided by the ZR; others were found in the article ZR +H
Professional status Amateur, Doctoral student, Established taxonomist researcher, Established non-taxonomist researcher, Masterstudent, Postdoctoral, Retired researcher, Technician
Q
Nationality Country of birth Q
Age Q
Sex Q
Highest degree Master (four or five years of faculty), PhD (or equivalent), Other, No degree Q
Free comment Q
Institutions
Name The names of all institutions were checked to suppress duplicates ZR +H
Type Five categories of institutions were recognized: Museum, University, Institute, Private, Other institution H
Country ZR +H
Tancoigne et al. Frontiers in Zoology 2011, 8:5http://www.frontiersinzoology.com/content/8/1/5
Page 4 of 13

tool of the Web of Science which computes informationon authors’ countries. Our search query “’sp nov’ OR‘new species’” found 675 articles for Zootaxa and 4313articles for the Web of Science. We did not use the trun-cated query “new sp” because it returned articles aboutlanguage ("speech”, “spoken”). If all the regions of Figure3 are considered, a c2 test shows significant differences(P < 0.001) between the Web of Science and Zootaxa.However, the distribution does not show significant dif-ferences if we consider only three classes of regions:Asia-South America (AsS), Europe-North America-Oceania (ENO) and Africa-Middle East (AfM) (P =0.46); or Africa-Europe-Oceania (AfEO), South Amer-ica-North America (SN) and Asia-Middle East (AsM)(P = 0.36).
ResultsPublications dealing with species are predominant inZootaxa (74% of the works analysed). Only 17% of thepapers deal with taxa between genus and family, and 9%with taxa above family level. Therefore, so-called “a-tax-onomy”, “microtaxonomy” [41], or “eidonomy” [42] ispredominant. Works on isolated taxa (single speciesdescriptions, etc.) are the most numerous (57%), fol-lowed by taxonomic revisions (17%), additions of new
data for taxa already known (11%), regional faunas (8%),checklists or catalogues of species/types (4%) and theo-retical works (3%). These terms are defined in Table 1.Most of the people who answered our questionnaire
are fully qualified researchers (60%), either taxonomists(45% of total) or not (15%). Students come in secondposition, with 15% PhD students and 7% MSc students.Postdoctoral students account for 9% and retiredresearchers, amateurs and technicians for the remaining9%. The proportions listed above vary between the threeareas previously defined (Figure 4). Figure 4 shows theresult of the CA between the age and the region of originof the authors. Professional status was used as supple-mentary data. We deleted the ‘retired researcher’ cate-gory because it was naturally linked with the (65, 90]category and made the map confusing. Africa is distanton the map because it has few values (0, 2, 1, and 0)which produce high frequencies (0, 66, 33 and 0). Dimen-sion 1 is strongly linked with the age and pits the (25, 35]category against the (55, 65] and (65, 90] categories. Thisis very interesting because this separation depends solelyon the nationality categories. Indeed, (25, 35] is linked toS and appear to be the category with the highest propor-tion of S and the (55, 65] and (65, 90] categories arelinked to M, O, N and appear to be the categories with
Table 1 Data extracted for each article, author, institution, new species and specimen involved (Continued)
Continent The affiliation of a country to a major area followed the CIA World Factbook data [34] H
Level of the institution Some institutions are subordinate to others, which may (or may not) appear in the address given by theauthor(s). For each of them, the following information was checked using their web sites:
1: whether the institution is autonomous2: whether it is subordinate to another institution
3: whether it is subordinate to two other institutions
H
Subordinating institution Name of the superordinate institution if relevant H
New species
Nomen ZR
Specimens involved List of the specimens involved H
Allotypes Whether allotypes are designated or not H
Developmental stages Whether numerous developmental stages are involved or not H
Methods used for treeconstruction
Parsimony, Bayesian/maximum likelihood, Distance, Combined methods H
Characters used Morpho-anatomical, Molecular, Bio-acoustic, Karyological, Other H
Specimens used to describe a new species
Number of specimens Number of specimens of each type for each new species H
Kind of specimen Holotype, Syntype, Neotype, Paratype, Other specimen H
Place of collect Collecting locality as stated in the paper, with GPS coordinates if available. Localities were distinguishedthrough their names or through their GPS coordinates. Each locality was referred to a country and a realm
whenever possible. The geographical delimitations used are the same as for the publications
H
Institution of conservation Institution where specimen(s) is/are kept H
Year of collect H
Size (cm) For holotypes only H
Sex For holotypes only. Male; Female; Hermaphrodite; Unknown when the information is lacking. Because manyauthors do not indicate the sex when they use juveniles, we also added the category Juvenile
H
H: data added by hand. Q: data from the questionnaire. ZR: data from the Zoological Record online. ZT: data from the Zootaxa website.
Tancoigne et al. Frontiers in Zoology 2011, 8:5http://www.frontiersinzoology.com/content/8/1/5
Page 5 of 13

the highest proportion of them. Being at the center of themap, the (35, 55] category represents the average cate-gory as related to nationality. E represents 38% of (35,55], S 23%, N 16%, As 15%, O 4%, M 2%, Af 1%.Dimension 2 separates M from the other categories
because no individuals belonging to the (65, 90] cate-gory answered our questionnaire. The supplementarydata show that the (25, 35] category was related to tech-nicians and postdocs, whereas (55, 65] was related toestablished taxonomic researchers, established non-taxo-nomic researchers and amateurs. These data suggest thatthe population of taxonomists is younger in As and S.Let us now consider the twelve questions that we
posed above.
Which areas and countries publish more in zoologicaltaxonomy?The region that provided the highest number of publica-tions is Europe, and then come, grouped together,North America, Asia and South America (Table 2-A). InEurope, no country provided more than 20% of publica-tions, the most productive country being Germany(20%). In contrast, for the other main regions, a singlecountry usually accounts for more than half the totalpublications: the USA for most publications from NorthAmerica (76%), China for most publications from Asia(52%), Brazil for most publications from South America(62%), South Africa for most publications from Africa
Inve
rteb
rates
Art
hrop
ods
Inse
cts
Cho
rdat
es
Ver
tebrat
es
Bee
tles
Che
licerat
es
Ara
chni
ds
Fis
h
Tru
e fli
es
Crustac
eans
Hym
enop
tera
ns
Mol
luscs
Lepi
dopt
eran
s
Tru
e bu
gs
Pro
tozo
ans
Mam
mals
Rep
tiles
Pla
tyhe
lmin
ths
Nem
atod
es
Am
phib
ians
Bird
s
Mis
cella
neou
s
ZRZT
Pro
port
ion
(%)
0
5
10
15
20
25
Figure 2 Comparison of the proportion of taxa studied in allworks publishing new species in 2006 and indexed in theZoological Record (ZR, 5620 articles) and in the Zootaxa subset(ZT, 743 articles). Search query: expression “sp nov” from ZRthesaurus AND “2006”.
Sou
th A
mer
ica
Eur
ope
Asia
Nor
th A
mer
ica
Oce
ania
Afr
ica
Mid
dle
Eas
t
Cen
tral
Am
erica
WoSZT
Pro
port
ion
(%)
0
10
20
30
40
50
Figure 3 Comparison of the proportion of regions publishingnew species in 2006 in journals indexed in the Web of Science(WoS, 4313 articles) and in the Zootaxa subset (ZT, 675articles). Search query: ("sp nov” OR “new species”) AND “2006”.
Figure 4 Result of the CA between the authors’ nationality andage. Af: Africa, As: Asia, E: Europe, M: Middle East, O: Oceania, N:North America, S: South America. Professional status is used assupplementary data.
Tancoigne et al. Frontiers in Zoology 2011, 8:5http://www.frontiersinzoology.com/content/8/1/5
Page 6 of 13

(39%) and Turkey for most publications from MiddleEast (67%).
In which areas and countries are taxonomists working?The number of publishing taxonomists per country isthe highest for Europe (27%), then for South America(24%), North America (21%) and Asia (20%). Germanyis the first country of Europe (20%); Brazil is the firstcountry of South America (61%), the USA of NorthAmerica (79%) and China of Asia (51%).
Which areas and countries mainly receive foreigntaxonomists?Concerning geographic mobility, 10% of the 427 authorswho answered the question were not working in theircountry of nationality. Most were fully qualifiedresearchers (69%), followed by predoctoral students(29%) and postdoctoral students (9%). Europeans arethose who move the most (53%). Europe and NorthAmerica are the areas with the highest rates of authorsoriginating from other areas (37% and 25%, respectively).Unfortunately, our results on taxonomists’ mobility donot allow us to know whether the weak mobility of tax-onomists from Asia and South America to Europe,North America and Oceania is due to short-term mobi-lity (which cannot be measured from our data) or to amore general lack of mobility.
How are international collaborations structured?Collaborations are numerous: 73% of the publicationshave at least two authors. Three kinds of collaborationpatterns were observed, corresponding to our previous
grouping in areas (Figure 5): regions which co-publishwith every other area of the world (ENO); regionswhich mainly co-publish with themselves (AsS) orwith ENO; and regions which do not publish much(AfM).Authors from ENO area do not predominantly sign
the publications as first authors (c2 test, P = 0.054).The percentages of single-author articles is greater in
ENO (28%) than in AsS (12%; c2 test, P = 9.49e-08).
In which external areas and countries are new speciesdescribed?From a zootaxonomic point of view, Asia and SouthAmerica are the most studied regions (see Table 2-B).Altogether they account for 50% of the publications and61% of the new species. Latitudes are provided in thepublications for 667 of the new species. Most of them(77%) come from latitudes higher than 10°, equallydistributed between North and South. The remaining23% are also equally distributed North and South (c2:P > 0.05).Figure 6 shows the result of the CA between the
region of origin of the holotype and authors labora-tories. The place of conservation of the holotype wasused as supplementary data. Dimension 1 and dimen-sion 2 together are strongly linked with both the originof the holotypes and authors laboratories. They separatethree groups: holotypes from AsS, holotypes from ENOand holotypes from AfM. AsS holotypes are linked toAsS collaborations and ENO-AsS collaborations whereasAfM holotypes are close to AfM, ENO-AfM, AsS-AMand ENO-AsS-AfM collaborations. However, AsS holo-types appear to be the category which is mainly studiedby AS and ENO-AsS collaborations and AfM holotypesappear to be the category which is mainly studied by allareas of the world. The ENO holotypes category islinked to ENO collaborations and ENO holotypesappear to be studied by authors from ENO areas only.Thus, only ENO authors work on all areas of the world.Dimension 2 is linked with the atypical work on AMholotypes: authors from AfM are the only ones to workon their regions only, with numerous collaborationsfrom all over the world.
Which areas and countries house the holotype specimens?The supplementary data of Figure 6 show that holotypesare not always kept in the areas they come from.Authors from ENO area keep their holotypes as well asthe holotypes from Africa and Middle East which theyhave studied in collaboration. On the other hand,authors from Asia and South America keep their holo-types even if studied in collaboration with authors fromEurope, North America or Oceania.
Table 2 Relationships between studied regions andregions of researchers’ labs
AStudying regions (%)
BStudied regions (%)
Asia 20 25
South America 21 25
Multi-areas - 12
North America 21 8
Oceania 7 8
Europe 29 7
Africa 2 6
Middle East 2 3
Central America 1 3
Antarctica - 1
Without region - 2
Studying regions: percentage of a fractional count of authors of publications.Studied regions: percentage of the number of publications. “Multi-areas”refers to work performed on more than one continent. Asia and SouthAmerica are the most studied areas and belong to the areas with the highestnumbers of publications.
Tancoigne et al. Frontiers in Zoology 2011, 8:5http://www.frontiersinzoology.com/content/8/1/5
Page 7 of 13

Are museums preferred for carrying out taxonomicresearch and keeping the type specimens?Author affiliations to universities are numerous (47%),followed by museums (28%), other institutions (21%) andprivate addresses (4%). Figure 7 shows the result of theCA between the geographical areas of authors and theirtype of institution. The places of conservation of theholotypes were used as supplementary data. Dimension 1is strongly linked with geographical areas and separatesthe AsM area from the AfEO area. Universities and otherinstitutions of work are linked to AsM and SN, whereasPrivate addresses and Museums are linked to AfEO. Thesupplementary data show that housing institutions differaccording to the region and follow authors’ affiliations,
except as concerns Universities. Holot_University is dis-tant from auth_University on the map because a highnumber of museums are subordinated to universities(63% in our data), especially in AsM, and are thus notmentioned in the authors’ address.The proportion of museums in authors’ affiliation
decreases to 33% (AfEO), 3% (AsM) and 7% (SN) whenthe institution that subordinates the museum is takeninto account. The proportion of universities alsoincreases to 44% for AfEO, 70% for AsM and 67% for SN.Noteworthy is the high proportion of museums (55%)
and private collections (21%) for AfEO. 28% of the typeskept in European private collections are holotypes andsyntypes; 72% are paratypes.
Figure 5 Nature of the cooperation between researchers from different areas of the world, for articles whose number of authorsexceeds 1. We used the OST (Observatoire des Sciences et des Techniques, Paris, France) indicator: (number of publications of a region A withan other region B)/(total number of publications of region A).
Tancoigne et al. Frontiers in Zoology 2011, 8:5http://www.frontiersinzoology.com/content/8/1/5
Page 8 of 13

Are there more works on Vertebrata?Most of the works on taxa (Table 3) deal with Arthro-poda (69%), Chordata (16%), followed by Mollusca (3%)and Platyhelminthes (2%). Other taxa occur for less than2% each and form the 10% remaining group. Arthropods
are mainly Insecta (64%) and Arachnida (14%), whereasChordata are only represented by vertebrates.It is thus not surprising that newly described species
are mainly arthropods (81%) and vertebrates (8%). Many(51%) of the new species are described in taxonomicrevisions, and only 35% in isolated works.Figure 8 shows the result of the CA between studied
phyla and the number of pages per new described spe-cies of each publication. The diversity of characters usedto describe each new species and the number of authorsof each document are used as supplementary data.Dimension 1 is strongly linked with phyla and separatesthe Vertebrata from the Arthropoda. Vertebrata islinked to category (10, 55] whereas Arthropoda is linkedto categories with fewer pages per new species.
Are there more taxonomists involved in Vertebratastudies?The supplementary data of Figure 8 show that the cate-gory Arthropoda is linked to few authors categories,whereas Vertebrata is linked to categories with morethan three authors.In the Vertebrata, a new species is described on aver-
age by 3.4 authors, whereas the figure is 0.9 in theArthropoda. Thus, for an equal number of taxonomists,taxonomists working on arthropods describe more newspecies than taxonomists working on vertebrates.
Are there more characters involved in Vertebrata studies?The supplementary data of Figure 8 show that the vari-ety of characters used to describe the new species ishigher for vertebrates. Whenever non-morphological
Figure 6 Result of the CA between the region of origin of theholotype and authors laboratory. The place of conservation of theholotype is used as supplementary data. cons_: region of conservationof the holotypes; orig_: origin of the holotypes. Af: Africa, As: Asia, E:Europe, M: Middle East, O: Oceania, N: North America, S: South America.
Figure 7 Result of the CA between the geographical areas ofauthors and their type of institution. The institution of conservationof the holotypes is used as supplementary data. holot_: holotypes’ typeof institution; auth_: authors’ type of institution. Af: Africa, As: Asia, E:Europe, M: Middle East, O: Oceania, N: North America, S: South America.
Table 3 Proportion of publication and new species foreach taxon
% of publication % of new species
Arthropoda 69 81
Insecta 45 58
Arachnida 10 11
Malacostraca 8 9
Other 6 3
Vertebrata 16 8
Amphibia 5 3
Actinopterygii 4 2
Reptilia 4 1
Chondrichthyes 1 1
Other 2 1
Mollusca 3 3
Platyhelminthes 2 2
Other 10 6
Sum 100 100
Left: n = 735. Right: n = 1416.
Tancoigne et al. Frontiers in Zoology 2011, 8:5http://www.frontiersinzoology.com/content/8/1/5
Page 9 of 13

characters are used in Vertebrata descriptions, these aremainly molecular or bio-acoustic.
Are there more specimens involved in Vertebrata studies?No significant difference between taxa was found in thisrespect. One species out of five was described from onespecimen only (20%), or known from one locality only(21%). As much as 53% of the new species were col-lected from more than 2 localities. Two species out offive were described from specimen(s) of one sex only.Nine species out of 10 were described on the basis of asingle stage of development (no significant differencebetween taxa). These figures vary when the year of col-lection is taken into account. New species known onlyfrom 1 specimen represent 64% of the new species withholotypes collected before the median year 1999. Theyrepresent 33% of the new species with holotypes col-lected after 1999 (n = 1261, P = 5.83e-08).
DiscussionIs zoological taxonomy still more developed in countriesthat have been historically taxonomically active?This study of Zootaxa’s 2006-2007 publications supportsthe idea that zoological taxonomy is still more devel-oped in countries that have historically been taxonomi-cally active. Taxonomists from Europe, North Americaand Oceania are the only ones to collaborate largelywith those from other regions, and they do so with allregions in the world. They also remain the only ones to
work on very wide geographical zones and to hostresearchers from abroad. A lack of studies in Africa hasalready been pointed out [11,25,43]. This lack still exists,as African regions are not well represented in oursample.However, this study also shows that Asian and South
American countries appear to play a prominent role inzoological taxonomy today. Their high number of publi-cations, the fact that they keep their own specimens andthe median age of their respondents show that theyhave a developed and active community of taxonomists.Previous studies on taxonomists’ age could not be usedfor a rigorous comparison because the enquiries werenot carried out at the same time [15,20,23,28,44-46].Are these results artefacts created by our choice of the
journal Zootaxa? We do not think so, for several rea-sons. First, we previously checked that our sampling wasnot biased questioning this respect. Second, the taxo-nomic growth of the two main countries responsible forthese results (China and Brazil) has already been pointedout in the literature [10,47]. China’s funding for researchincreased by 30% each year between 1998 and 2006,which benefited taxonomy: “The evaluation of thefunded projects in the Division [of Zoology] shows thatanimal morphology and taxonomy are the main sup-ported areas, accounting for half of the total funded“[48]. In 2004, China became the fifth country in termsof number of publications. The number of students hasbeen increasing everywhere in this country [49]. An ana-lysis of Brazil’s scientific production carried out by TheObservatoire des Sciences et Techniques (Paris, France)showed that it was quickly growing [50,51]. The figureswere even underestimated: a bibliometric study [50]showed that many Brazilian articles are published inPortuguese, in national journals. Thus they were notincluded in the calculation. Moreover, a recent study onamphibian taxonomic effort and expertise supportsthese results concerning China and Brazil [52]. It alsofound that the continental distribution of authors inZootaxa (n = 5663) was similar to the continental distri-bution of authors working on a given taxon (i.e. Amphi-bians, n = 647).Another argument in favour of this idea involves the
geographical origin of the new species. Surprisingly, nolatitude preference was identified regarding the origin ofthe newly described species. This contradicts the wide-spread idea that latitudes close to the equator have aricher biodiversity [53]. Why, then, do our data fail tofind high proportion of new species in the belt of 10°above and below the equator?In this respect we found that places where the highest
numbers of species were described recently (China,Brazil) are also those with the highest number of taxono-mists. A correlation exists between the number of
Figure 8 Result of the CA between studied phyla and thenumber of authors of each document. Supplementary data:number of pages per new species, diversity of characters used todescribe each new species. auth_: number of authors; pg_: numberof pages per new species.
Tancoigne et al. Frontiers in Zoology 2011, 8:5http://www.frontiersinzoology.com/content/8/1/5
Page 10 of 13
taxonomists and the number of species known in a phy-lum [54]. It is thus likely that the high number of newlydescribed species in China and Brazil is a reflection ofthe taxonomic involvement of these countries, in terms ofmanpower and funding. Thus, if China and Brazil appearto be the most studied regions, this is not only becausethey are large countries with a rich biodiversity [55-57],but also because they have numerous taxonomists andhave decided to invest in this branch of research.Finally, it is striking that a high proportion of our
respondents were professionals (fully qualified research-ers, students) despite the high number of amateurs inentomology [9]. Zootaxa would therefore reflect a biasedsub-sample of the taxonomic community, includingmostly professionals. One may wonder whether part ofthis phenomenon might be due to the fact that someamateur taxonomists, especially in entomology, tend topublish their works in their national languages innational periodicals whenever they still exist [58]. Unfor-tunately, professional categories are not expressed thesame way between studies, hence our figures are hardlycomparable with previous works [15,24,28,54]. We alsohave to keep in mind that the authors who providedtheir email addresses are mainly the correspondingauthors - a factor that might influence our results.
Is zoological taxonomy still in favour of vertebrates, vs.arthropods?On the basis of taxonomic output (number of publica-tions, number of new species), arthropods, especiallyinsects, appear to be much more studied than verte-brates. Vertebrates nevertheless concentrate a highernumber of taxonomists, characters and methods usedfor each new species. Thus, even if more results are pro-duced on arthropods, their study involves a lesseramount of means (number of taxonomists, number anddiversity of methods used).The long-studied vertebrates [2,59] are nowadays stu-
died with modern methods. Most of the time, thesemethods complement the morphological ones. As a con-sequence, morphological studies are a necessary step inany taxonomic work. They are not a sign of intellectualor technological backwardness when presented alone[60]. They are a strong indication of the amplitude ofour ignorance of the taxon in question. The data wegathered on the numbers of specimens, localities andkinds of characters used to recognize and describe anew taxon clearly show that we are very far from“knowing” a species once it has been “described” andnamed [61].Moreover, the taxa which benefit from a high taxo-
nomic involvement have nevertheless the lowest rates ofdescription of new species. If we aim at increasing thenumber of known species as quickly as possible,
taxonomists should give priority to taxa which do notrequire these new methods.We do not think that these results are artefacts cre-
ated by our choice to work on the journal Zootaxa. Wepreviously checked that our sampling was not biased forthis question and we already know that vertebrates havebeen studied for a longer time [2,59]. Our observationsmatch this idea.This disequilibrium of the taxonomic effort in favour
of vertebrates is problematic if we aim at better knowingthat which we know the least. Insects represent 58% ofthe new described species and vertebrates 7.2%. Yet,according to some estimates (figures computed from thesum of the ‘World Descr.’ and ‘Estimate World’ figuresfor chordates and invertebrates in [56]), vertebrateswould only represent 0.3% of the numbers of speciesthat remain to be described, whereas insects represent74%. Thus, this distribution of taxonomic effort betweentaxa is unsuitable when considering the needs[16,23,24,54,62]. The international and national scientificcommunities should hire more people to focus onarthropods, especially entomologists.The nature of the works published in Zootaxa show
that this journal gives priority to alpha-taxonomy. “Zoo-taxa considers papers on all animal taxa, both livingand fossil, and especially encourages descriptions of newtaxa“ [63]. We therefore consider our main results validfor zoological alpha-taxonomy.
ConclusionsWe found that the disequilibrium does not correspondexactly to that usually admitted. The USA, China andBrazil are currently the three leading countries in zoolo-gical alpha-taxonomy. However, each of them presents adifferent pattern. Taxonomists from Asia and SouthAmerica are younger and mainly work in universities,rather than museums. A bias in favour of vertebratesstill exists if we refer to the effort invested in eachgroup to produce taxonomic data, but not for the num-ber of papers. Finally, we insist on the idea that“describing a species” is very different from “knowing aspecies”. The taxonomic involvement of a country, interms of manpower and funding, appears here to be akey factor in the development of fruitful taxonomicresearch. If we aim at increasing our knowledge of thespecies of the world, we still have much efforts to makein terms of the efficient distribution of the taxonomiceffort between taxa.
AcknowledgementsWe thank all those who took time out of their already busy schedules to fillin and return the questionnaire. Thanks to Zhang Zhi-Qiang, whoencouraged this study, provided free access to Zootaxa’s articles andprovided critical comments on the work. We would also like to thank
Tancoigne et al. Frontiers in Zoology 2011, 8:5http://www.frontiersinzoology.com/content/8/1/5
Page 11 of 13

Sébastien Ballesteros, Julien Barnier and Gaël Millot for their statistical help. Ifany statistical mistake can be found in this paper, it must nevertheless beattributed to the authors. We would like to thank Sandra Dos Santos for hertranslations of the Portuguese papers and Annie Amirda, Julie Delacôte andMark Judson for the English corrections. We would also like to thankPhilippe Grandcolas, Aurélien Miralles, Antoine T. Mantilleri, FerdinandoBoero, Mark Judson and four anonymous referees for their criticalcomments.
Author details1UMR 7205 OSEB, Département Systématique et Evolution, Muséum nationald’Histoire naturelle, CP 30, 25 rue Cuvier, 75231 Paris Cedex 05, France.2SAP2S-DASTR, CNRS, 3 rue Michel Ange, 75794 Paris Cedex 16, France.
Authors’ contributionsET designed the sampling procedure and the database, compiled thedatabase, participated in the statistical analysis and drafted the manuscript.CB designed and participated in the statistical analysis. AS participated in theanalyses of the results and helped to draft the manuscript. AD designed thestudy, participated in the analysis of the results, and helped to draft andtranslate the manuscript. All authors read and approved the final manuscript.
Competing interestsThe authors declare that they have no competing interests.
Received: 19 October 2010 Accepted: 18 March 2011Published: 18 March 2011
References1. Wilson JRU, Proches S, Braschler B, Dixon ES, Richardson DM: The (bio)
diversity of science reflects the interests of society. Frontiers in ecologyand the environment 2007, 5:409-414.
2. Proença VM, Pereira HM, Vicente L: Organismal complexity is an indicatorof species existence value. Frontiers in ecology and the environment 2008,6:298-299.
3. Cribb TH: Living on the edge: parasite taxonomy in Australia.International Journal for Parasitology 2004, 34:117-123.
4. Bonnet X, Shine R, Lourdais O: Taxonomic chauvinism. Trends in Ecology &Evolution 2002, 17:1-3.
5. GBIF and Data Repatriation to Countries of Origin. [http://www.gbif.org/index.php?id=488].
6. EDIT: Report and online catalogue on existing taxonomic training resourcesin Europe. Brussels: Royal Belgian Institute of Natural Sciences; 2006.
7. Results of Surveys of Taxonomic Expertise in Parasitology in Canada andof Interest in National Faunal Projects on Parasites in Canada. [http://www.biology.ualberta.ca/parasites/ParSec/texten/modgap.htm].
8. Pallini A, Fadini MAM, Venzon M, De Moraes GJ, Barros-Battesti DM:Demandas e perspectivas para a Acarologia no Brasil (Demands andperspectives to acarology in Brazil). Neotropical Biology and Conservation2007, 2:169-175.
9. Löbl I, Leschen RAB: Demography of Coleopterists and Their Thoughts onDNA Barcoding and the Phylocode, with Commentary. The ColeopteristsBulletin 2005, 59:284-292.
10. Eggleton P: Termite species description rates and the state of termitetaxonomy. Insectes Sociaux 1999, 46:1-5.
11. Green SV: The taxonomic impediment in orthopteran research andconservation. Journal of Insect Conservation 1998, 2:151-159.
12. House of Lords Science and Technology Committee: Systematics andTaxonomy: Follow-up. 5th report. London 2008.
13. Valdecasas AG, Bello E, Becerra JM: La Taxonomía en España. Arbor:Ciencia, Pensamiento y Cultura; 1992:561:77-102.
14. Tillier S, De Wever P, (Eds): Systématique: ordonner la diversité du vivant -Rapport sur la science et la technologie n°11. Paris: Editions Tec & Doc; 2000.
15. Australian Government department of the Environment Water Heritage andthe Arts: Survey of Australian Taxonomic Capacity 2006.
16. Marques AC, Lamas CJE: Sistemática zoológica no Brasil: estado da arte,expectativas e sugestões de ações futuras. Papéis Avulsos de Zoologia2006, 46:139-174.
17. Kraus O, (Ed): Zoologischer Systematik in Mitteleuropa (Zoologicalsystematics in Central Europe). Hamburg & Berlin: Paul Parey; 1976.
18. Schminke HK: Wiederaufbau von Forschung und Lehre in Zoosystematik -eine nationale Aufgabe. Spektrum der Wissenschaft 1994, 9:114-116.
19. Smith GF, Buys M, Walters M, Herbert D, Hamer M: Taxonomic research inSouth Africa: the state of the discipline. South African Journal of Science2008, 140:254-256.
20. Simonetti JA: Biodiversity and a taxonomy of Chilean taxonomists.Biodiversity and Conservation 1997, 6:633-637.
21. Salazar Vallejo SL, Gonzalez NE, Schwindt E: Taxonomia de invertebradosmarinos: necesidades en latinoamérica (Marine invertebrate taxonomy:needs in Latin America). Interciencia 2008, 33:510-517.
22. Blackmore S, Cutler DF, (Eds): Systematics Agenda 2000: the challenge forEurope. Cardigan: Samara Publishing for the Linnean Society; 1996.
23. Shimura J, (Ed.): Global Taxonomy Initiative in Asia. Research Report fromthe National Institute for Environmental Studies. 2003.
24. Gaston KJ, May RM: Taxonomy of taxonomists. Nature 1992, 356:281-282.25. Klopper RR, Smith GF, Chikuni AC: The Global Taxonomy Initiative in
Africa. Taxon 2002, 51:159-165.26. Zhang ZQ: The first five years of Zootaxa. Zootaxa 2006, 1111:68.27. Top journals for new taxa and top journals for new taxonomic/
nomenclatural acts. [http://www.organismnames.com/metrics.htm?page=tsj].
28. Betsch J-M, (Ed): Livre Blanc de la Systématique. Société Française deSystématique; 1989.
29. Geeta R, Levy A, Hoch JM, Mark M: Where do most taxonomists work,and does it matter? Poster. Annual AIBS conference on “Bioethics in achanging world"; Washington, D. C., USA 2003.
30. Tillier S: Une espèce menacée: les taxonomistes en France. InSystématique: ordonner la diversité du vivant - Rapport sur la science et latechnologie n°11. Edited by: Tillier S, de Wever P. Paris: Editions Tec2000:20-23.
31. Zootaxa website. [http://www.mapress.com/zootaxa/].32. R Development Core Team: R: a language and environment for statistical
computing. Vienna, Austria 2008.33. CompressWeb: Email Questionnaire 4.1. 2007.34. Central Intelligence Agency: The World Factbook 2008. Washington, DC:
Central Intelligence Agency; 2008.35. Dray S, Dufour A, Chessel D: The ade4 package-II: Two-table and K-table
methods. R News 2007, 7:47-52.36. Ripley BD, Lapsley M: RODBC: ODBC Database Access. R package version
1.2-3. 2008.37. Meyer D, Zeileis A, Hornik K: The Strucplot Framework: Visualizing Multi-
Way Contingency Tables with vcd. Journal of Statistical Software 2006,17:1-48.
38. Zeileis A, Meyer D, Hornik K: Residual-based Shadings for Visualizing(Conditional) Independence. Journal of Computational and GraphicalStatistics 2007, 16:507-525.
39. Husson F, Lê S, Pagès J: Analyse de données avec R Rennes: PressesUniversitaires de Rennes; 2009.
40. Benzecri JP: In L’analyse des correspondances. L’analyse des données. Volume2. Paris: Dunod; 1973.
41. Mayr E, Ashlock PD: Principles of systematic zoology. New-York , Second 1991.42. Dubois A: Drôles d’espèces. Hybridation, perturbations de la méiose et
spéciation dans le règne animal: quelques points délicats determinologie, d’éidonomie et de nomenclature. In Peut-on classer levivant? Linné et la systématique aujourd’hui. Edited by: Prat D, Raynal-RoquesA, Roguenant A. Paris: Belin; 2008:169-202.
43. Slater JA: The place of systematists in contemporary society. Bulletin ofthe Entomologial Society of America 1984, 30:4-7.
44. House of Lords Science and Technology Committee: Systematic BiologyResearch. 1st report 1991-92. London 1992.
45. Krebs JR, (Ed): Evolution and Biodiversity: The New Taxonomy. London:UK Natural Environment Research Council; 1992.
46. Tillier S: Les communautés scientifiques nationales. In Systématique:ordonner la diversité du vivant - Rapport sur la science et la technologie n°11.Edited by: Tillier S, de Wever P. Paris: Editions Tec 2000:42-43.
47. Joly CA: Taxonomy: programmes developing in the South too. Nature2006, 440:24-24.
48. Division of Zoology, Animal Husbandry and Veterinary Science andAquatic Science Animal Husbandry and Veterinary Science. [http://www.nsfc.gov.cn/e_nsfc/desktop/zn/jn/0124.htm].
Tancoigne et al. Frontiers in Zoology 2011, 8:5http://www.frontiersinzoology.com/content/8/1/5
Page 12 of 13

49. Observatoire des Sciences et des Techniques: Chine: dossier-pays OST,décembre 2006 2006.
50. Observatoire des Sciences et des Techniques: Brésil: dossier-pays OST, juin2003 2003.
51. Michán L, Llorente Bousquets J: Bibliometría de la sistemática biológicasobre América Latina durante el siglo XX en tres bases de datosmundiales. Revista de Biología Tropical 2009, 58:531-545.
52. Rodrigues ASL, Gray CL, Crowter BJ, Ewers RM, Stuart SN, Whitten T,Manica A: A Global Assessment of Amphibian Taxonomic Effort andExpertise. Bioscience 2010, 60:798-806.
53. Dubois A: Threatened amphibians. Alytes 2009, 27:25-37.54. Bello E, Becerra JMG, Valdecasas A: Counting on taxonomy. Nature 1992,
357:531.55. Biodiversity Committee of the Chinese Academy of Sciences: Species
diversity. Biodiversity in China: status and conservation needs. Beijing 1992.56. Chapman AD: Numbers of Living Species in Australia and the World.
Canberra: Australian Biodiversity Information Services, 2 2009.57. Lewinsohn TM, Prado PI: How Many Species Are There in Brazil.
Conservation Biology 2005, 19:619-624.58. Dubois A: Should we care about taxonomic journals? A plea for Biotaxa,
a new kind of online subscription package. Newsletter (EuropeanDistributed Institute of Taxonomy) 2008, 9:12-14.
59. California Academy of Sciences: A century of progress in the natural sciences,1853-1953. San Francisco 1955.
60. La Salle J, Wheeler Q, Jackway P, Winterton S, Hobern D, Lovell D:Accelerating taxonomic discovery through automated characterextraction. Zootaxa 2009, 2217:43-55.
61. Dubois A: List of European species of amphibians and reptiles: will wesoon be reaching stability? Amphibia-Reptilia 1998, 19:1-28.
62. Blackmore S: A Summary of UK Based Expertise in Systematic Biology. UKSYSTEMATICS FORUM; 1996.
63. Information for authors. [http://www.mapress.com/zootaxa/support/author.html].
doi:10.1186/1742-9994-8-5Cite this article as: Tancoigne et al.: Insights from Zootaxa on potentialtrends in zoological taxonomic activity. Frontiers in Zoology 2011 8:5.
Submit your next manuscript to BioMed Centraland take full advantage of:
• Convenient online submission
• Thorough peer review
• No space constraints or color figure charges
• Immediate publication on acceptance
• Inclusion in PubMed, CAS, Scopus and Google Scholar
• Research which is freely available for redistribution
Submit your manuscript at www.biomedcentral.com/submit
Tancoigne et al. Frontiers in Zoology 2011, 8:5http://www.frontiersinzoology.com/content/8/1/5
Page 13 of 13