insights into the demographic history of african pygmies from
TRANSCRIPT

Insights into the Demographic History of African Pygmiesfrom Complete Mitochondrial Genomes
Chiara Batini,�,1,2 Joao Lopes,3 Doron M. Behar,4 Francesc Calafell,1,5 Lynn B. Jorde,6 Lolke van derVeen,7 Lluis Quintana-Murci,8 Gabriella Spedini,2,9 Giovanni Destro-Bisol,2,9 and David Comas*,1,5
1Institut de Biologia Evolutiva (CSIC-UPF), Department de Ciencies Experimentals i de la Salut, Universitat Pompeu Fabra,Barcelona, Spain2Dipartimento di Biologia Animale e dell’Uomo, Sapienza Universita’ di Roma, Roma, Italy3Centro de Ciencias do Mar, Faculdade de Ciencias e Tecnologia, Universidade do Algarve, Faro, Portugal4Molecular Medicine Laboratory, Rambam Health Care Campus, Haifa,, Israel5Centro de Investigacion Biomedica en Red de Epidemiologıa y Salud Publica, Barcelona, Spain6Department of Human Genetics, University of Utah Health Sciences Center7Laboratoire Dynamique du Language, UMR 5596, Institut des Sciences de l’Homme, Lyon, France8Human Evolutionary Genetics, CNRS URA3012, Institut Pasteur, Paris, France9Istituto Italiano di Antropologia, Roma, Italy
�Present address: Department of Genetics, University of Leicester, Leicester, United Kingdom.
*Corresponding author: E-mail: [email protected].
Associate editor: Anne Stone
Abstract
Pygmy populations are among the few hunter-gatherers currently living in sub-Saharan Africa and are mainly representedby two groups, Eastern and Western, according to their current geographical distribution. They are scattered across theCentral African belt and surrounded by Bantu-speaking farmers, with whom they have complex social and economicinteractions. To investigate the demographic history of Pygmy groups, a population approach was applied to the analysisof 205 complete mitochondrial DNA (mtDNA) sequences from ten central African populations. No sharing of maternallineages was observed between the two Pygmy groups, with haplogroup L1c being characteristic of the Western group butmost of Eastern Pygmy lineages falling into subclades of L0a, L2a, and L5. Demographic inferences based on Bayesiancoalescent simulations point to an early split among the maternal ancestors of Pygmies and those of Bantu-speakingfarmers (;70,000 years ago [ya]). Evidence for population growth in the ancestors of Bantu-speaking farmers has beenobserved, starting ;65,000 ya, well before the diffusion of Bantu languages. Subsequently, the effective population size ofthe ancestors of Pygmies remained constant over time and ;27,000 ya, coincident with the Last Glacial Maximum, Easternand Western Pygmies diverged, with evidence of subsequent migration only among the Western group and the Bantu-speaking farmers. Western Pygmies show signs of a recent bottleneck 4,000–650 ya, coincident with the diffusion of Bantulanguages, whereas Eastern Pygmies seem to have experienced a more ancient decrease in population size (20,000–4,000ya). In conclusion, the results of this first attempt at analyzing complete mtDNA sequences at the population level in sub-Saharan Africa not only support previous findings but also offer new insights into the demographic history of Pygmypopulations, shedding new light on the ancient peopling of the African continent.
Key words: mitochondrial genome, African Pygmies, coalescent simulations, demography, phylogeography.
IntroductionAfrican Pygmy populations are one of the few humangroups identified by their physical appearance rather thanethnographic, cultural, geographical, or linguistic criteria.Their height, among the smallest recorded for human pop-ulations (Cavalli-Sforza 1986b; Hitchcock 1999), has beeninterpreted as the consequence of different selective pres-sures (reviewed in Perry and Dominy 2009). These includethermoregulatory adaptation to the environment of thetropical forest (Cavalli-Sforza et al. 1993), reduction ofthe total caloric intake in a food-limited environment (Hartand Hart 1986), improved mobility in the dense forest (Di-amond 1991), or advantageous earlier reproductive age in
short lifespan conditions (Migliano et al. 2007). Nowadays,these populations live scattered in the Central African rain-forest and are clustered into two main groups, Western andEastern Pygmies. The former is estimated to include 55,000individuals inhabiting the Western Congo basin, across Ca-meroon, Republic of Congo, Gabon, and Central AfricanRepublic, and its subgroups are identified by differentnames, such as Binga, Baka, Biaka, and Aka (Cavalli-Sforza1986c; Hitchcock 1999). Eastern Pygmies number approx-imately 30,000 individuals living in the Ituri forest (in thenorth-east of the Democratic Republic of Congo) and areusually referred to as Mbuti (Cavalli-Sforza 1986c; Hitch-cock 1999). Other minor and scattered groups of Pygmies
© The Author 2010. Published by Oxford University Press on behalf of the Society for Molecular Biology and Evolution. All rights reserved. For permissions, pleasee-mail: [email protected]
Mol. Biol. Evol. 28(2):1099–1110. 2011 doi:10.1093/molbev/msq294 Advance Access publication November 1, 2010 1099
Research
article
are found in the Democratic Republic of Congo, Rwanda,and Burundi and are identified as Twa (Cavalli-Sforza1986c). Most Pygmy groups live as hunter-gatherers, butnone base their subsistence exclusively on forest productsbecause they trade with neighboring farmers, creating a com-plex network of economic and social exchange. Intermar-riage exists but seems to be mostly limited to unionsbetween Pygmy females and farmer males (Cavalli-Sforza1986a; Sayer et al. 1992). Pygmies speak languages that be-long to Central Sudanic, Adamawa-Ubangian, or Bantugroups, mirroring those of their farmer neighbors. Severalstudies have attempted to identify remnants of an ancientPygmy language, which might have been lost after contactwith farmers (Letouzey 1976; Bahuchet 1993; Demolin 1996).
The issue of the origin of African Pygmies has stimulateda great deal of research because of their particular physicalcharacteristics and their possible continuity with the firstcommunities inhabiting Central Africa. However, this issueis still controversial, and different scenarios have been pro-posed. One hypothesis suggests that Pygmy ancestors oc-cupied the equatorial forest since ancient times as a singlegroup and diverged into Eastern and Western branchesrecently, around 5 thousands of years ago (Kya), whenBantu-speaking farmers expanded from the current Niger-ia/Cameroon border and migrated southward through thetropical forest (Cavalli-Sforza 1986a). Pygmies from thewest probably admixed with Bantu-speaking agricultural-ists to a greater extent than those from the east, whoare therefore regarded as the ‘‘purer’’ Pygmy group. Alter-natively, the differences found between the Pygmy groupshave been explained on the basis of independent and olderorigins, as ancient as the divergence between Pygmies’ andfarmers’ ancestors (Hiernaux 1974, 1977). Finally, a thirdhypothesis suggests that Pygmy groups are the descend-ants of a specialized hunting-gathering subcaste of Bantuand Adamawa-Ubangian–speaking populations, whichevolved to seasonally exploit the tropical forest. In this case,the divergence of Pygmies would trace back to 4–5 Kya,the time when Bantu-speaking agriculturalists started theirexpansion through the forest environment (Blench 1999).
Genetic studies have provided useful insights into theorigin and relationships of Pygmies with other sub-Saharanpopulations. In general, autosomal data have highlighteda substantial homogeneity among Niger-Congo–speakinggroups (including Bantu) and a deep structure amonghunter-gatherer communities in sub-Saharan Africa, al-though the data are still scanty and contradictory (Rosen-berg et al. 2002; Watkins et al. 2003; Jakobsson et al. 2008; Liet al. 2008; Tishkoff et al. 2009). Whole-genome analyses insub-Saharan Africa have shown that hunter-gatherers, in-cluding Pygmies, are located near the root of African diver-sity (Jakobsson et al. 2008; Li et al. 2008; Tishkoff et al. 2009),suggesting a common origin for hunter-gatherers with anancient divergence. The reconstruction of migration pat-terns and the estimation of population sizes and diver-gence times was first attempted in two studies ofautosomal variation using coalescent simulations. Analysisof 28 autosomal STRs in Western Pygmies and neighboring
populations pointed to an ancient origin of Western Pyg-mies followed by a recent separation within this group (;3Kya), coincident with the expansion of farmers (Verdu et al.2009). Even more recently, the sequencing of ;33 kb ofautosomal neutral regions in Pygmies and neighboringpopulations (Patin et al. 2009) suggested a common originof Eastern and Western Pygmies (with a separation time of;20 Kya) and their early divergence from the ancestors ofneighboring farmers (;60 Kya), with differential migrationpatterns and effective population sizes.
Phylogeographic analyses of uniparental genomes,Y chromosome, and mitochondrial DNA (mtDNA) haveprovided evidence for asymmetrical gene flow betweenPygmies and Bantu-speaking farmers, identified Pygmy-specific mtDNA lineages, and highlighted the differentmtDNA haplogroup composition among the two Pygmygroups (Destro-Bisol, Coia, et al. 2004; Destro-Bisol, Donati,et al. 2004; Wood et al. 2005; Batini et al. 2007; Behar et al.2008; Quintana-Murci et al. 2008; Berniell-Lee et al. 2009),although the paucity of data for Eastern Pygmies makesfurther sampling necessary for more robust inferences tobe made. The two Pygmy groups share a high frequencyof the Y chromosome B2b lineage (Wood et al. 2005;Berniell-Lee et al. 2009), which is also found in Khoisan-speaking populations, suggesting a possible common rootamong African hunter-gatherers. By contrast, Western Pyg-mies are distinguished by the very high frequencies (up to100%) of specific subclades of the L1c mtDNA haplogroup(Batini et al. 2007; Quintana-Murci et al. 2008) while suchlineages have not been detected in Eastern Pygmies, sug-gesting a possible ancient maternal separation betweenthe two groups of Pygmies (Destro-Bisol, Coia et al.2004; Destro-Bisol et al. 2006).
Analysis of complete mtDNA genomes has provided a re-fined phylogeny of maternal lineages (Ingman et al. 2000;Finnila et al. 2001; Maca-Meyer et al. 2001; Herrnstadt et al.2002; Roostalu et al. 2007; Achilli et al. 2008; Behar et al.2008; Quintana-Murci et al. 2008). These studies have fo-cused on individuals, whose mtDNAs belong to specifichaplogroups, making it possible to estimate their diversityand time depth. However, no inferences directly dealingwith demography and history of human populations weredrawn.
The present investigation tackles for the first time theanalysis of complete mtDNA genomes at the populationlevel in sub-Saharan Africa, with the aim of unravelingthe history and evolution of Pygmies. Our results shednew light on the origin of maternal lineages of African Pyg-mies and their relationships with neighboring populations,providing estimates of divergence times, changes ineffective population sizes, and female migration rates.
Materials and Methods
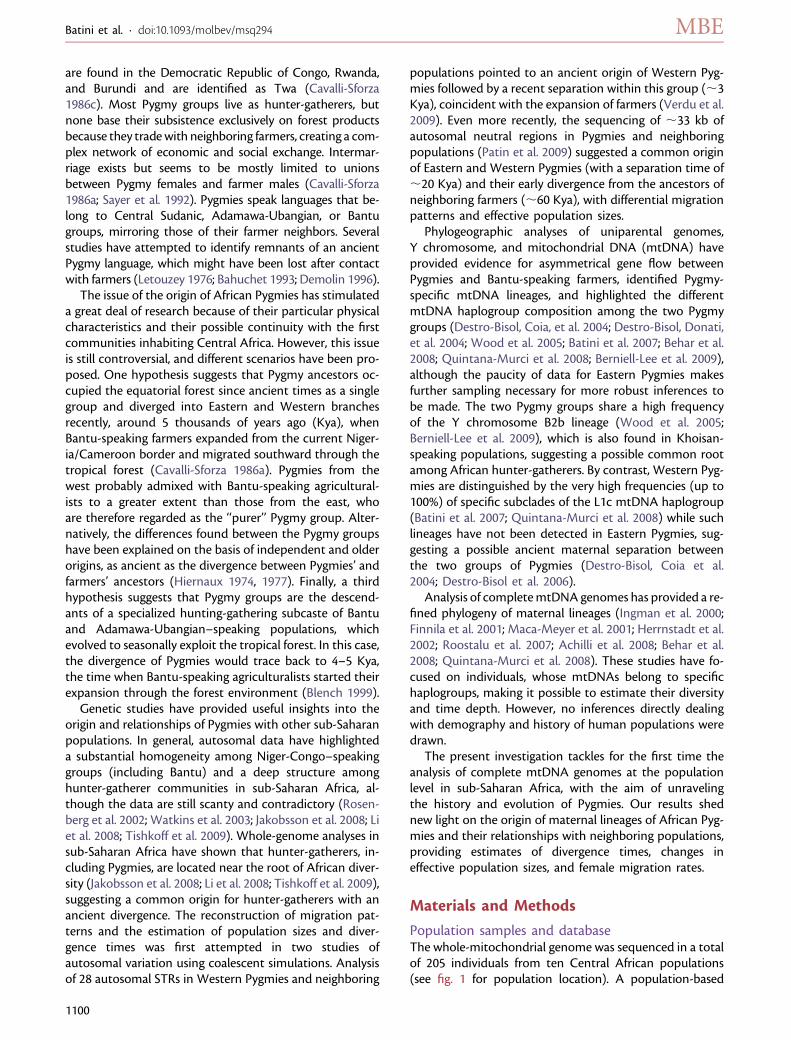
Population samples and databaseThe whole-mitochondrial genome was sequenced in a totalof 205 individuals from ten Central African populations(see fig. 1 for population location). A population-based
Batini et al. · doi:10.1093/molbev/msq294 MBE
1100
approach was applied for the selection of the samples, ig-noring any previous information about the haplogroup clas-sification derived from hypervariable regions. The data setincludes 169 individuals from eight Pygmy populations: sixWestern (WPYG: 23 Babinga from the Republic of Congo,27 Baka from Cameroon, 20 Baka from Gabon, 11 Bakolafrom Cameroon, 23 Biaka from Central African Republic,30 Mbenzele from Central African Republic) and two East-ern (EPYG: 2 different Mbuti samples from the DemocraticRepublic of Congo with 14 and 21 individuals, respectively).Furthermore, we analyzed 36 individuals from two Bantu-speaking farming populations (WAGR: 17 Fang and 19 Nze-bi from Gabon). All DNA samples were obtained from bloodor buccal swabs and collected from unrelated healthy indi-viduals who gave appropriate informed consent.
A database of 768 additional sequences was built forphylogeographic comparison (supplementary table S1,Supplementary Material online; Behar et al. 2008; Justet al. 2008).
Complete mtDNA Sequencing and HaplogroupClassificationThe complete mitochondrial genome was amplified in fouroverlapping fragments (ranging from 4 to 5 kb) using thefour primer pairs reported in supplementary table S2 (Sup-plementary Material online). Polymerase chain reactions(PCRs) (23 ll) contained 1� EcoTaq buffer, 220 lM dNTPs,1 mM MgCl2, primers at 0.45 mM each, 2 U of EcoTaq poly-merase, and 10–50 ng of DNA. Samples were denatured for2 min at 94 �C; amplified for 14 cycles at 94 �C for 20 s, 60�C for 30 s, and 68 �C for 5.5 min; for 16 cycles at 94 �C for20 s, 60 �C for 30 s, and 68 �C for 5.5 min þ 15 s per cycle;and given a final extension at 68 �C for 10 min. PCR prod-
ucts were purified using a MultiScreen PCRl96 Filter Platethrough a size-exclusion membrane and vacuum filtration.
The four resulting fragments were sequenced in a totalof 32 reactions on the light chain of the mtDNA using theforward primers (L primers) described in Maca-Meyer et al.(2001). An alternative primer was designed: L10403 was re-placed by L10396 (5#CTACAAAAAGGATTAGACTG3#)due to the common presence in African populations ofa polymorphism at position 10398. In some samples,a poly-cytosine length polymorphism at positions 303–315, 567–573, 5894–5899, 8272–8278, and 16184–16193prevented reading of the final tract of the sequence. Inthese cases, the heavy chain was sequenced using reverseprimers (H408, H1232, H6460, H8416, and H16401). Theheavy chain was also sequenced in cases of ambiguity orpossible phantom mutations. Except for primers H1232(5#CTGAGCAAGAGGTGGTGAGG3#), H6460 (5#TGCT-GTGATTAGGACGGATC3#), and H8416 (5#TGATGAGGA-ATAGTGTAAGG3#), all reverse primers were previouslypublished in Maca-Meyer et al. (2001). The sequence reac-tion was performed with the BigDye Terminator v3.1 CycleSequencing kit (Applied Biosystems) and sequencing prod-ucts purified using a Montage SEQ96 Sequencing ReactionCleanup Kit (Millipore) through a size-exclusion membraneand vacuum filtration. Sequence products were run on anABI PRISM 3100 sequencer (Applied Biosystems).
Sequences were assembled using SeqMan 5.05 softwarecontained in the Lasergene 5.0 package (DNASTAR, Inc.)and annotated according to the revised Cambridge Refer-ence Sequence (rCRS; Andrews et al. 1999). Because fourindependent overlapping PCR amplicons were sequenced,a total of 1,600 bp (;10%) for each individual have beensequenced twice from independent fragments, which
FIG. 1. Geographical location of populations analyzed in the present study. 1, Babinga; 2, BakaC (from Cameroon); 3, BakaG (from Gabon); 4,Bakola; 5, Biaka; 6, Mbenzele; 7, MbutiCEPH; 8, Mbuti; 9, Fang; 10, Nzebi. Blue, Western Pygmies; purple, Eastern Pygmies; light blue, Bantu-speaking farmers.
Complete mtDNA in African Pygmies · doi:10.1093/molbev/msq294 MBE
1101
allowed us to use them as an internal sequencing control.In addition, quality control was carried out through a phy-logenetic approach (see Behar et al. 2008), and previouslyunobserved mutations, as well as unexpected patterns,were rechecked through resequencing. The 121 differentsequences found in this study have been deposited in Gen-Bank (accession numbers HM771113–HM771233). Haplo-types and their absolute frequencies in the populationsanalyzed are also reported in supplementary table S3 (Sup-plementary Material online). Length polymorphisms at po-sitions 303–315, 567–573, 5894–5899, 8272–8278, and16184–16193 were excluded from all analyses. Sequenceswere assigned to previously described haplogroupsaccording to Behar et al. (2008).
Data AnalysisIntra-population diversity parameters (number of sequen-ces, number of polymorphic sites, sequence diversity, meannumber of pairwise differences, and nucleotide diversity)and neutrality tests (Tajima’s D and Fu’s Fs) were calculatedwith the Arlequin 3.11 package (Excoffier et al. 2005) forthree different data sets: complete sequences, coding re-gion (positions 577–16023), and control region (positions16024–576).
Pairwise difference genetic distances between popula-tions were calculated with the Arlequin 3.11 package.The distance matrix, corrected for nonsignificant valuesto 0, was represented in a multidimensional scaling(MDS) plot using the SPSS 15.0 software. In order to testwhether the difference between two genetic distances wassignificantly larger (or smaller) than zero, a permutationtest was performed. Population samples were created bysampling with replacement from each original sample; ge-netic distances between these samples were computed,and the sign of the difference was recorded. This was re-peated 100,000 times, and the real difference was deemedsignificant if the original sign was found in at least 95% ofthe iterations.
A total of 973 complete sequences belonging to hap-logroup L (present data and data from Behar et al. 2008and Just et al. 2008) was represented in a median-joiningnetwork (Bandelt et al. 1999) using Network 4.5 (availableat www.fluxus-engineering.com). The control region was ex-cluded to allow comparisons with all available data (e.g.,those published in Kivisild et al. 2004) and to avoid retic-ulations arising from recurrent mutations. Therefore, the re-sulting range was between nucleotide positions 435 and16023 with respect to rCRS. In order to weight each positionaccording to its evolutionary rate, the parameters suggestedin Kong et al. (2008) were used. The time depth of differenthaplogroups (time to the most recent common ancestor[TMRCA]) was estimated from the coding region usingthe software BEAST 1.5.3 (Drummond et al. 2005; Drum-mond and Rambaut 2007). Markov chain Monte Carlo(MCMC) samples were based on 100,000,000 generations,logging every 1,000 steps, with the first 10,000,000 genera-tions discarded as the burn-in. We used a constant size co-alescent tree prior, HKY substitution model, and a strict
clock with a mean substitution rate of 1.16649E-8 substitu-tions/site/year (adapted from Soares et al. 2009 to thesequence range considered in the present analysis).
Three main evolutionary scenarios were tested throughan Approximate Bayesian Computation (ABC) approach(Beaumont et al. 2002). The scenarios considered werea common recent origin of Pygmy populations (Cavalli-Sforza 1986a), an independent origin of Pygmies anda shared history among populations of the same geograph-ical region (Hiernaux 1974, 1977), and an external scenariothat assumes a common origin of Eastern Pygmies and agri-culturalists who diverged only after the separation from theWestern Pygmies (see supplementary fig. S1, Supplemen-tary Material online). Each of these scenarios was testedwith five different patterns of migration among popula-tions (absent, among all three populations, and pairwise),resulting in 15 different topologies (see supplementary fig.S1, Supplementary Material online). In order to focus onneutrally evolving sites and to avoid the confounding ef-fects of common homoplasy in the control region, we builta data set with only the sequence of the 13 protein-codinggenes (with the ND6 gene reverse complemented to givethe same reading direction as the other genes), in whichnonsynonymous mutations were considered nonpolymor-phic, as previously reported (Soares et al. 2009). Priors fordivergence times (t) were defined on the basis of archae-ological evidence (Phillipson 1993; Cornelissen 2002; Mar-ean and Assefa 2005) (table 1). Priors for migration rates(m) and effective population sizes (Ne) were set accordingto previous simulation-based studies (Patin et al. 2009;Verdu et al. 2009) (table 1).
The model selection was performed using an ABC-regres-sion method (e.g., Beaumont et al. 2002; Fagundes et al.2007). Each model was given a prior probability of 1/15so that their prior distribution was uniform. The popABCprogram (Lopes et al. 2009) was used to perform the ABCalgorithm by simulating 500,000 data sets per model, thusobtaining 7,500,000 total simulated data. The tolerance forthe rejection step was set to 0.12% (9,000 data accepted).Prior to model selection, the ABC-regression method wastested against synthetic data (i.e., simulated data sets forwhich we knew the true values of the parameters) underthe same conditions that were applied to the experimentaldata set. We ran the method on 500 synthetic data for eachmodel considered (a total of 7,500 data sets). The overallperformance of the ABC method was good (supplementaryfig. S2, Supplementary Material online), in that the truemodel was estimated in up to 75% of cases and interestingly,when grouping the models according to migration pattern,this proportion reached almost 85% in all groups.
After model choice, a standard ABC-regression methodwas used to estimate the historical demographic parame-ters. A total of 3,000,000 data sets were simulated, fromwhich the closest 0.3% (9,000 simulations) were accepted.The point estimates were taken as the mode of the poste-rior distributions. The prior probability for the mutationrate was set as a lognormal distribution of base 10 witha mean of �2.57 and a standard deviation (SD) of 0.055
Batini et al. · doi:10.1093/molbev/msq294 MBE
1102
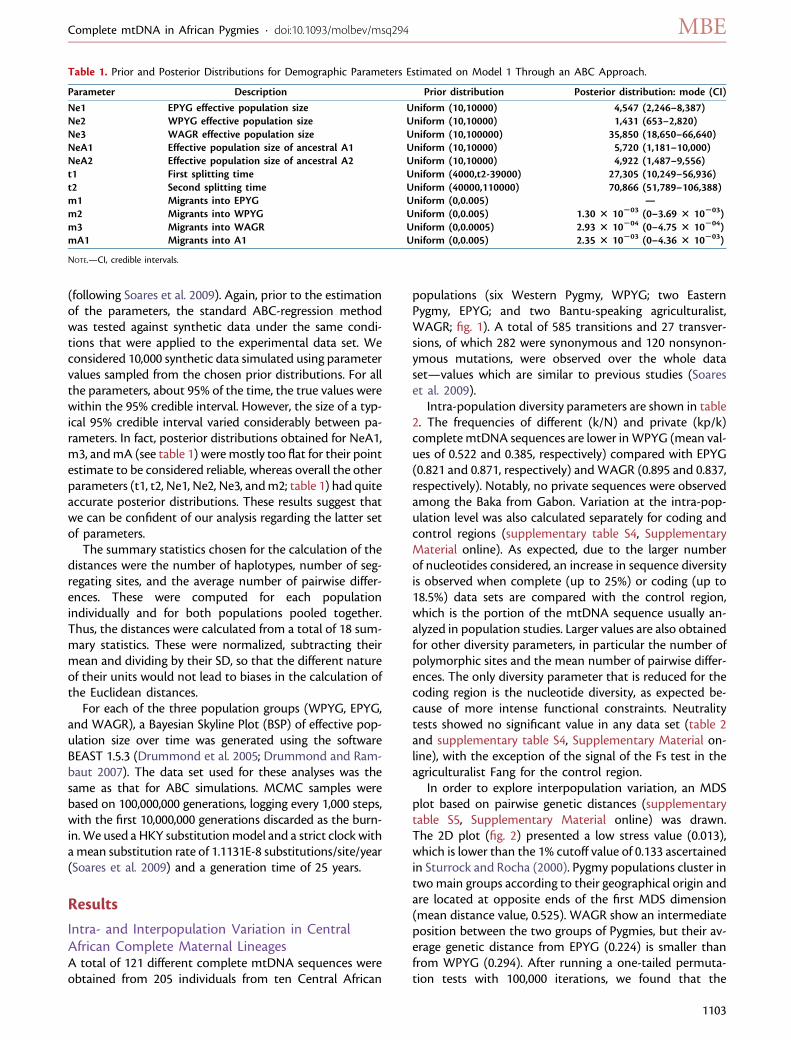
(following Soares et al. 2009). Again, prior to the estimationof the parameters, the standard ABC-regression methodwas tested against synthetic data under the same condi-tions that were applied to the experimental data set. Weconsidered 10,000 synthetic data simulated using parametervalues sampled from the chosen prior distributions. For allthe parameters, about 95% of the time, the true values werewithin the 95% credible interval. However, the size of a typ-ical 95% credible interval varied considerably between pa-rameters. In fact, posterior distributions obtained for NeA1,m3, and mA (see table 1) were mostly too flat for their pointestimate to be considered reliable, whereas overall the otherparameters (t1, t2, Ne1, Ne2, Ne3, and m2; table 1) had quiteaccurate posterior distributions. These results suggest thatwe can be confident of our analysis regarding the latter setof parameters.
The summary statistics chosen for the calculation of thedistances were the number of haplotypes, number of seg-regating sites, and the average number of pairwise differ-ences. These were computed for each populationindividually and for both populations pooled together.Thus, the distances were calculated from a total of 18 sum-mary statistics. These were normalized, subtracting theirmean and dividing by their SD, so that the different natureof their units would not lead to biases in the calculation ofthe Euclidean distances.
For each of the three population groups (WPYG, EPYG,and WAGR), a Bayesian Skyline Plot (BSP) of effective pop-ulation size over time was generated using the softwareBEAST 1.5.3 (Drummond et al. 2005; Drummond and Ram-baut 2007). The data set used for these analyses was thesame as that for ABC simulations. MCMC samples werebased on 100,000,000 generations, logging every 1,000 steps,with the first 10,000,000 generations discarded as the burn-in. We used a HKY substitution model and a strict clock witha mean substitution rate of 1.1131E-8 substitutions/site/year(Soares et al. 2009) and a generation time of 25 years.
Results
Intra- and Interpopulation Variation in CentralAfrican Complete Maternal LineagesA total of 121 different complete mtDNA sequences wereobtained from 205 individuals from ten Central African
populations (six Western Pygmy, WPYG; two EasternPygmy, EPYG; and two Bantu-speaking agriculturalist,WAGR; fig. 1). A total of 585 transitions and 27 transver-sions, of which 282 were synonymous and 120 nonsynon-ymous mutations, were observed over the whole dataset—values which are similar to previous studies (Soareset al. 2009).
Intra-population diversity parameters are shown in table2. The frequencies of different (k/N) and private (kp/k)complete mtDNA sequences are lower in WPYG (mean val-ues of 0.522 and 0.385, respectively) compared with EPYG(0.821 and 0.871, respectively) and WAGR (0.895 and 0.837,respectively). Notably, no private sequences were observedamong the Baka from Gabon. Variation at the intra-pop-ulation level was also calculated separately for coding andcontrol regions (supplementary table S4, SupplementaryMaterial online). As expected, due to the larger numberof nucleotides considered, an increase in sequence diversityis observed when complete (up to 25%) or coding (up to18.5%) data sets are compared with the control region,which is the portion of the mtDNA sequence usually an-alyzed in population studies. Larger values are also obtainedfor other diversity parameters, in particular the number ofpolymorphic sites and the mean number of pairwise differ-ences. The only diversity parameter that is reduced for thecoding region is the nucleotide diversity, as expected be-cause of more intense functional constraints. Neutralitytests showed no significant value in any data set (table 2and supplementary table S4, Supplementary Material on-line), with the exception of the signal of the Fs test in theagriculturalist Fang for the control region.
In order to explore interpopulation variation, an MDSplot based on pairwise genetic distances (supplementarytable S5, Supplementary Material online) was drawn.The 2D plot (fig. 2) presented a low stress value (0.013),which is lower than the 1% cutoff value of 0.133 ascertainedin Sturrock and Rocha (2000). Pygmy populations cluster intwo main groups according to their geographical origin andare located at opposite ends of the first MDS dimension(mean distance value, 0.525). WAGR show an intermediateposition between the two groups of Pygmies, but their av-erage genetic distance from EPYG (0.224) is smaller thanfrom WPYG (0.294). After running a one-tailed permuta-tion tests with 100,000 iterations, we found that the
Table 1. Prior and Posterior Distributions for Demographic Parameters Estimated on Model 1 Through an ABC Approach.
Parameter Description Prior distribution Posterior distribution: mode (CI)
Ne1 EPYG effective population size Uniform (10,10000) 4,547 (2,246–8,387)Ne2 WPYG effective population size Uniform (10,10000) 1,431 (653–2,820)Ne3 WAGR effective population size Uniform (10,100000) 35,850 (18,650–66,640)NeA1 Effective population size of ancestral A1 Uniform (10,10000) 5,720 (1,181–10,000)NeA2 Effective population size of ancestral A2 Uniform (10,10000) 4,922 (1,487–9,556)t1 First splitting time Uniform (4000,t2-39000) 27,305 (10,249–56,936)t2 Second splitting time Uniform (40000,110000) 70,866 (51,789–106,388)m1 Migrants into EPYG Uniform (0,0.005) —m2 Migrants into WPYG Uniform (0,0.005) 1.30 3 10203 (0–3.69 3 10203)m3 Migrants into WAGR Uniform (0,0.0005) 2.93 3 10204 (0–4.75 3 10204)mA1 Migrants into A1 Uniform (0,0.005) 2.35 3 10203 (0–4.36 3 10203)
NOTE.—CI, credible intervals.
Complete mtDNA in African Pygmies · doi:10.1093/molbev/msq294 MBE
1103
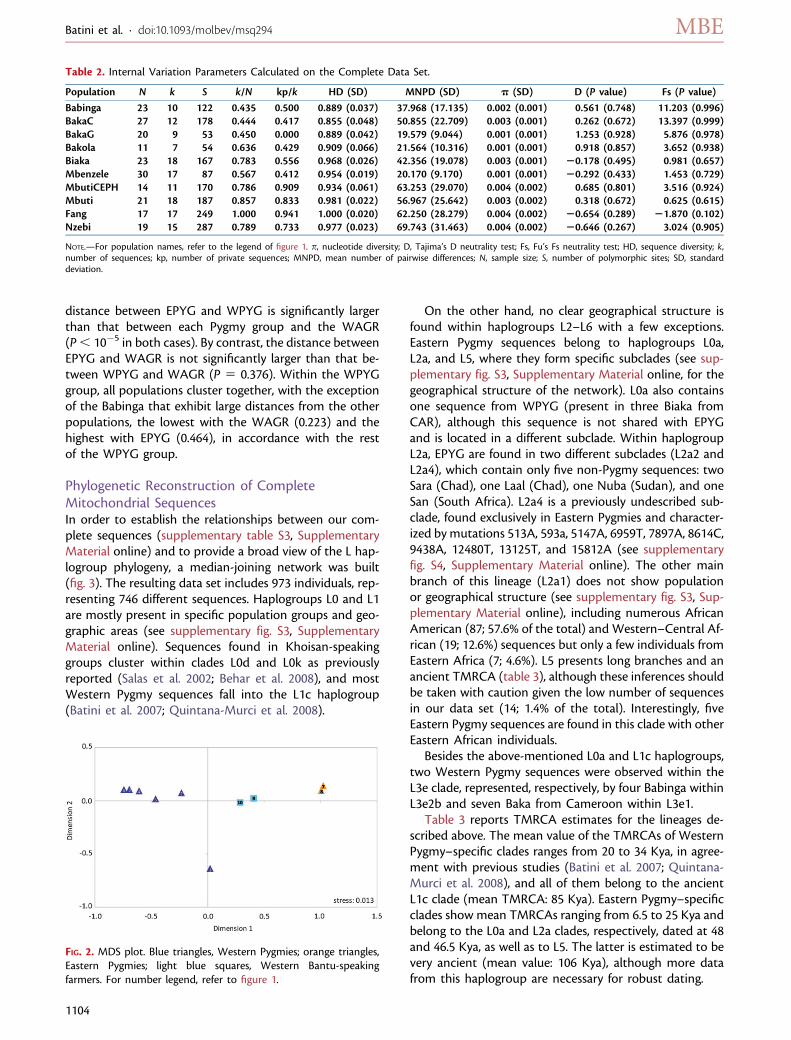
distance between EPYG and WPYG is significantly largerthan that between each Pygmy group and the WAGR(P, 10�5 in both cases). By contrast, the distance betweenEPYG and WAGR is not significantly larger than that be-tween WPYG and WAGR (P 5 0.376). Within the WPYGgroup, all populations cluster together, with the exceptionof the Babinga that exhibit large distances from the otherpopulations, the lowest with the WAGR (0.223) and thehighest with EPYG (0.464), in accordance with the restof the WPYG group.
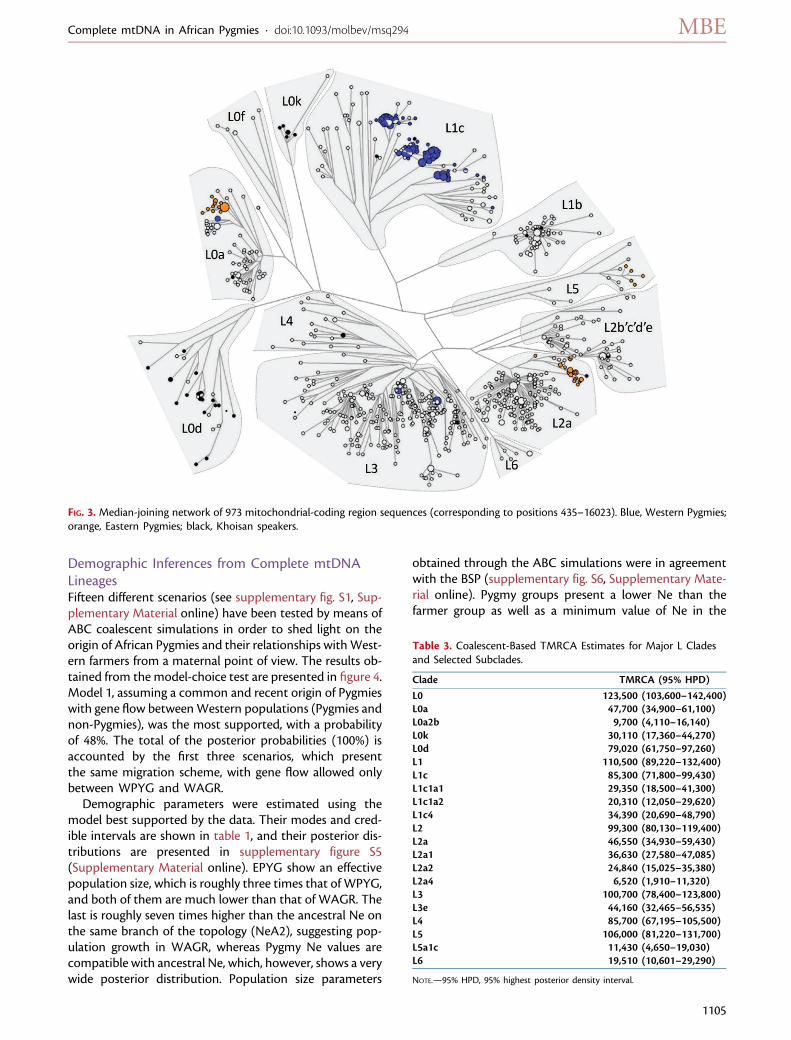
Phylogenetic Reconstruction of CompleteMitochondrial SequencesIn order to establish the relationships between our com-plete sequences (supplementary table S3, SupplementaryMaterial online) and to provide a broad view of the L hap-logroup phylogeny, a median-joining network was built(fig. 3). The resulting data set includes 973 individuals, rep-resenting 746 different sequences. Haplogroups L0 and L1are mostly present in specific population groups and geo-graphic areas (see supplementary fig. S3, SupplementaryMaterial online). Sequences found in Khoisan-speakinggroups cluster within clades L0d and L0k as previouslyreported (Salas et al. 2002; Behar et al. 2008), and mostWestern Pygmy sequences fall into the L1c haplogroup(Batini et al. 2007; Quintana-Murci et al. 2008).
On the other hand, no clear geographical structure isfound within haplogroups L2–L6 with a few exceptions.Eastern Pygmy sequences belong to haplogroups L0a,L2a, and L5, where they form specific subclades (see sup-plementary fig. S3, Supplementary Material online, for thegeographical structure of the network). L0a also containsone sequence from WPYG (present in three Biaka fromCAR), although this sequence is not shared with EPYGand is located in a different subclade. Within haplogroupL2a, EPYG are found in two different subclades (L2a2 andL2a4), which contain only five non-Pygmy sequences: twoSara (Chad), one Laal (Chad), one Nuba (Sudan), and oneSan (South Africa). L2a4 is a previously undescribed sub-clade, found exclusively in Eastern Pygmies and character-ized by mutations 513A, 593a, 5147A, 6959T, 7897A, 8614C,9438A, 12480T, 13125T, and 15812A (see supplementaryfig. S4, Supplementary Material online). The other mainbranch of this lineage (L2a1) does not show populationor geographical structure (see supplementary fig. S3, Sup-plementary Material online), including numerous AfricanAmerican (87; 57.6% of the total) and Western–Central Af-rican (19; 12.6%) sequences but only a few individuals fromEastern Africa (7; 4.6%). L5 presents long branches and anancient TMRCA (table 3), although these inferences shouldbe taken with caution given the low number of sequencesin our data set (14; 1.4% of the total). Interestingly, fiveEastern Pygmy sequences are found in this clade with otherEastern African individuals.
Besides the above-mentioned L0a and L1c haplogroups,two Western Pygmy sequences were observed within theL3e clade, represented, respectively, by four Babinga withinL3e2b and seven Baka from Cameroon within L3e1.
Table 3 reports TMRCA estimates for the lineages de-scribed above. The mean value of the TMRCAs of WesternPygmy–specific clades ranges from 20 to 34 Kya, in agree-ment with previous studies (Batini et al. 2007; Quintana-Murci et al. 2008), and all of them belong to the ancientL1c clade (mean TMRCA: 85 Kya). Eastern Pygmy–specificclades show mean TMRCAs ranging from 6.5 to 25 Kya andbelong to the L0a and L2a clades, respectively, dated at 48and 46.5 Kya, as well as to L5. The latter is estimated to bevery ancient (mean value: 106 Kya), although more datafrom this haplogroup are necessary for robust dating.
Table 2. Internal Variation Parameters Calculated on the Complete Data Set.
Population N k S k/N kp/k HD (SD) MNPD (SD) p (SD) D (P value) Fs (P value)
Babinga 23 10 122 0.435 0.500 0.889 (0.037) 37.968 (17.135) 0.002 (0.001) 0.561 (0.748) 11.203 (0.996)BakaC 27 12 178 0.444 0.417 0.855 (0.048) 50.855 (22.709) 0.003 (0.001) 0.262 (0.672) 13.397 (0.999)BakaG 20 9 53 0.450 0.000 0.889 (0.042) 19.579 (9.044) 0.001 (0.001) 1.253 (0.928) 5.876 (0.978)Bakola 11 7 54 0.636 0.429 0.909 (0.066) 21.564 (10.316) 0.001 (0.001) 0.918 (0.857) 3.652 (0.938)Biaka 23 18 167 0.783 0.556 0.968 (0.026) 42.356 (19.078) 0.003 (0.001) 20.178 (0.495) 0.981 (0.657)Mbenzele 30 17 87 0.567 0.412 0.954 (0.019) 20.170 (9.170) 0.001 (0.001) 20.292 (0.433) 1.453 (0.729)MbutiCEPH 14 11 170 0.786 0.909 0.934 (0.061) 63.253 (29.070) 0.004 (0.002) 0.685 (0.801) 3.516 (0.924)Mbuti 21 18 187 0.857 0.833 0.981 (0.022) 56.967 (25.642) 0.003 (0.002) 0.318 (0.672) 0.625 (0.615)Fang 17 17 249 1.000 0.941 1.000 (0.020) 62.250 (28.279) 0.004 (0.002) 20.654 (0.289) 21.870 (0.102)Nzebi 19 15 287 0.789 0.733 0.977 (0.023) 69.743 (31.463) 0.004 (0.002) 20.646 (0.267) 3.024 (0.905)
NOTE.—For population names, refer to the legend of figure 1. p, nucleotide diversity; D, Tajima’s D neutrality test; Fs, Fu’s Fs neutrality test; HD, sequence diversity; k,number of sequences; kp, number of private sequences; MNPD, mean number of pairwise differences; N, sample size; S, number of polymorphic sites; SD, standarddeviation.
FIG. 2. MDS plot. Blue triangles, Western Pygmies; orange triangles,Eastern Pygmies; light blue squares, Western Bantu-speakingfarmers. For number legend, refer to figure 1.
Batini et al. · doi:10.1093/molbev/msq294 MBE
1104
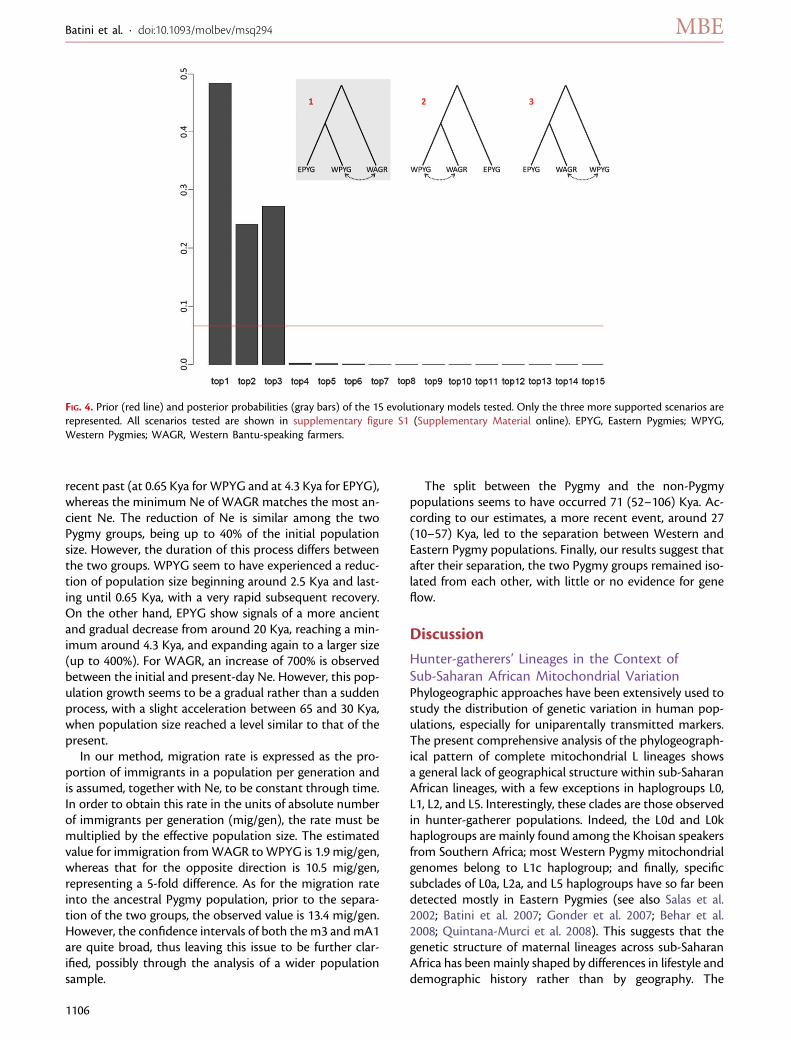
Demographic Inferences from Complete mtDNALineagesFifteen different scenarios (see supplementary fig. S1, Sup-plementary Material online) have been tested by means ofABC coalescent simulations in order to shed light on theorigin of African Pygmies and their relationships with West-ern farmers from a maternal point of view. The results ob-tained from the model-choice test are presented in figure 4.Model 1, assuming a common and recent origin of Pygmieswith gene flow between Western populations (Pygmies andnon-Pygmies), was the most supported, with a probabilityof 48%. The total of the posterior probabilities (100%) isaccounted by the first three scenarios, which presentthe same migration scheme, with gene flow allowed onlybetween WPYG and WAGR.
Demographic parameters were estimated using themodel best supported by the data. Their modes and cred-ible intervals are shown in table 1, and their posterior dis-tributions are presented in supplementary figure S5(Supplementary Material online). EPYG show an effectivepopulation size, which is roughly three times that of WPYG,and both of them are much lower than that of WAGR. Thelast is roughly seven times higher than the ancestral Ne onthe same branch of the topology (NeA2), suggesting pop-ulation growth in WAGR, whereas Pygmy Ne values arecompatible with ancestral Ne, which, however, shows a verywide posterior distribution. Population size parameters
obtained through the ABC simulations were in agreementwith the BSP (supplementary fig. S6, Supplementary Mate-rial online). Pygmy groups present a lower Ne than thefarmer group as well as a minimum value of Ne in the
FIG. 3. Median-joining network of 973 mitochondrial-coding region sequences (corresponding to positions 435–16023). Blue, Western Pygmies;orange, Eastern Pygmies; black, Khoisan speakers.
Table 3. Coalescent-Based TMRCA Estimates for Major L Cladesand Selected Subclades.
Clade TMRCA (95% HPD)
L0 123,500 (103,600–142,400)L0a 47,700 (34,900–61,100)L0a2b 9,700 (4,110–16,140)L0k 30,110 (17,360–44,270)L0d 79,020 (61,750–97,260)L1 110,500 (89,220–132,400)L1c 85,300 (71,800–99,430)L1c1a1 29,350 (18,500–41,300)L1c1a2 20,310 (12,050–29,620)L1c4 34,390 (20,690–48,790)L2 99,300 (80,130–119,400)L2a 46,550 (34,930–59,430)L2a1 36,630 (27,580–47,085)L2a2 24,840 (15,025–35,380)L2a4 6,520 (1,910–11,320)L3 100,700 (78,400–123,800)L3e 44,160 (32,465–56,535)L4 85,700 (67,195–105,500)L5 106,000 (81,220–131,700)L5a1c 11,430 (4,650–19,030)L6 19,510 (10,601–29,290)
NOTE.—95% HPD, 95% highest posterior density interval.
Complete mtDNA in African Pygmies · doi:10.1093/molbev/msq294 MBE
1105
recent past (at 0.65 Kya for WPYG and at 4.3 Kya for EPYG),whereas the minimum Ne of WAGR matches the most an-cient Ne. The reduction of Ne is similar among the twoPygmy groups, being up to 40% of the initial populationsize. However, the duration of this process differs betweenthe two groups. WPYG seem to have experienced a reduc-tion of population size beginning around 2.5 Kya and last-ing until 0.65 Kya, with a very rapid subsequent recovery.On the other hand, EPYG show signals of a more ancientand gradual decrease from around 20 Kya, reaching a min-imum around 4.3 Kya, and expanding again to a larger size(up to 400%). For WAGR, an increase of 700% is observedbetween the initial and present-day Ne. However, this pop-ulation growth seems to be a gradual rather than a suddenprocess, with a slight acceleration between 65 and 30 Kya,when population size reached a level similar to that of thepresent.
In our method, migration rate is expressed as the pro-portion of immigrants in a population per generation andis assumed, together with Ne, to be constant through time.In order to obtain this rate in the units of absolute numberof immigrants per generation (mig/gen), the rate must bemultiplied by the effective population size. The estimatedvalue for immigration from WAGR to WPYG is 1.9 mig/gen,whereas that for the opposite direction is 10.5 mig/gen,representing a 5-fold difference. As for the migration rateinto the ancestral Pygmy population, prior to the separa-tion of the two groups, the observed value is 13.4 mig/gen.However, the confidence intervals of both the m3 and mA1are quite broad, thus leaving this issue to be further clar-ified, possibly through the analysis of a wider populationsample.
The split between the Pygmy and the non-Pygmypopulations seems to have occurred 71 (52–106) Kya. Ac-cording to our estimates, a more recent event, around 27(10–57) Kya, led to the separation between Western andEastern Pygmy populations. Finally, our results suggest thatafter their separation, the two Pygmy groups remained iso-lated from each other, with little or no evidence for geneflow.
Discussion
Hunter-gatherers’ Lineages in the Context ofSub-Saharan African Mitochondrial VariationPhylogeographic approaches have been extensively used tostudy the distribution of genetic variation in human pop-ulations, especially for uniparentally transmitted markers.The present comprehensive analysis of the phylogeograph-ical pattern of complete mitochondrial L lineages showsa general lack of geographical structure within sub-SaharanAfrican lineages, with a few exceptions in haplogroups L0,L1, L2, and L5. Interestingly, these clades are those observedin hunter-gatherer populations. Indeed, the L0d and L0khaplogroups are mainly found among the Khoisan speakersfrom Southern Africa; most Western Pygmy mitochondrialgenomes belong to L1c haplogroup; and finally, specificsubclades of L0a, L2a, and L5 haplogroups have so far beendetected mostly in Eastern Pygmies (see also Salas et al.2002; Batini et al. 2007; Gonder et al. 2007; Behar et al.2008; Quintana-Murci et al. 2008). This suggests that thegenetic structure of maternal lineages across sub-SaharanAfrica has been mainly shaped by differences in lifestyle anddemographic history rather than by geography. The
FIG. 4. Prior (red line) and posterior probabilities (gray bars) of the 15 evolutionary models tested. Only the three more supported scenarios arerepresented. All scenarios tested are shown in supplementary figure S1 (Supplementary Material online). EPYG, Eastern Pygmies; WPYG,Western Pygmies; WAGR, Western Bantu-speaking farmers.
Batini et al. · doi:10.1093/molbev/msq294 MBE
1106
distinctive mitochondrial heritage of hunter-gatherers isalso supported by the prevalence (frequencies from 0.48to 0.60) of haplogroup L4g (absent from this data set)among Hadza and Sandawe from Tanzania, which con-trasts with its rarity across the African continent (Kivisildet al. 2004; Gonder et al. 2007; Tishkoff et al. 2007).
This deep structure, together with ancient ancestries ofmost of these lineages (see table 3), suggests an ancientseparation of the ancestors of present-day hunter-gatherercommunities, followed by isolation. This pattern contrastswith results of previous studies based on Y chromosomeand genome-wide variation in African samples (Woodet al. 2005; Hellenthal et al. 2008; Tishkoff et al. 2009), whichpoint instead to a shared common ancestry between Cen-tral African Pygmies and Khoisan-speaking populations asa result of a common origin (.30 Kya) of hunter-gathererpopulations (Tishkoff et al. 2009; Scheinfeldt et al. 2010).The discrepancy between these two lines of evidence mightbe explained by different factors. It has been previously pro-posed that gene flow of mtDNA lineages from non-Pygmiesto Pygmies should be virtually absent or at least consider-ably less than that for Y chromosome and autosomes, asa result of social constraints (Cavalli-Sforza 1986a; Destro-Bisol, Donati, et al. 2004). Consequently, a higher degree ofcontinuity between the ancestral and extant gene pool anda less marked homogenizing effect of gene flow from neigh-boring farmers are expected for mtDNA than for other ge-netic systems. However, the shared common ancestryfound for other loci, both among Pygmy groups and
between them and Khoisan-speaking populations, couldbe explained on the basis of recent demographic male-mediated direct or indirect contact among these groups(this is corroborated by the very recent dating of thelineages involved; Batini C, Comas D, Capelli C, personalcommunication).
Common Origin of Pygmies and Their Relationshipwith Bantu SpeakersThe issue of the origin of African Pygmies has been inten-sively discussed and three main evolutionary scenarios havebeen proposed. It has been suggested that the evolution ofphenotypic features in Pygmies (e.g., stature and pigmen-tation) occurred in a single population that diverged onlyrecently to form present-day groups (Cavalli-Sforza 1986a).Other authors have argued that the differences observedamong Pygmy populations could be explained by an an-cient and separate origin with convergent evolution forshort stature as an adaptation to the hot and wet environ-ment of the equatorial forest (Hiernaux 1974, 1977). Finally,Pygmies have been proposed to have originated as inde-pendent subgroups of expanding farmers in the last fewmillennia (Blench 1999).
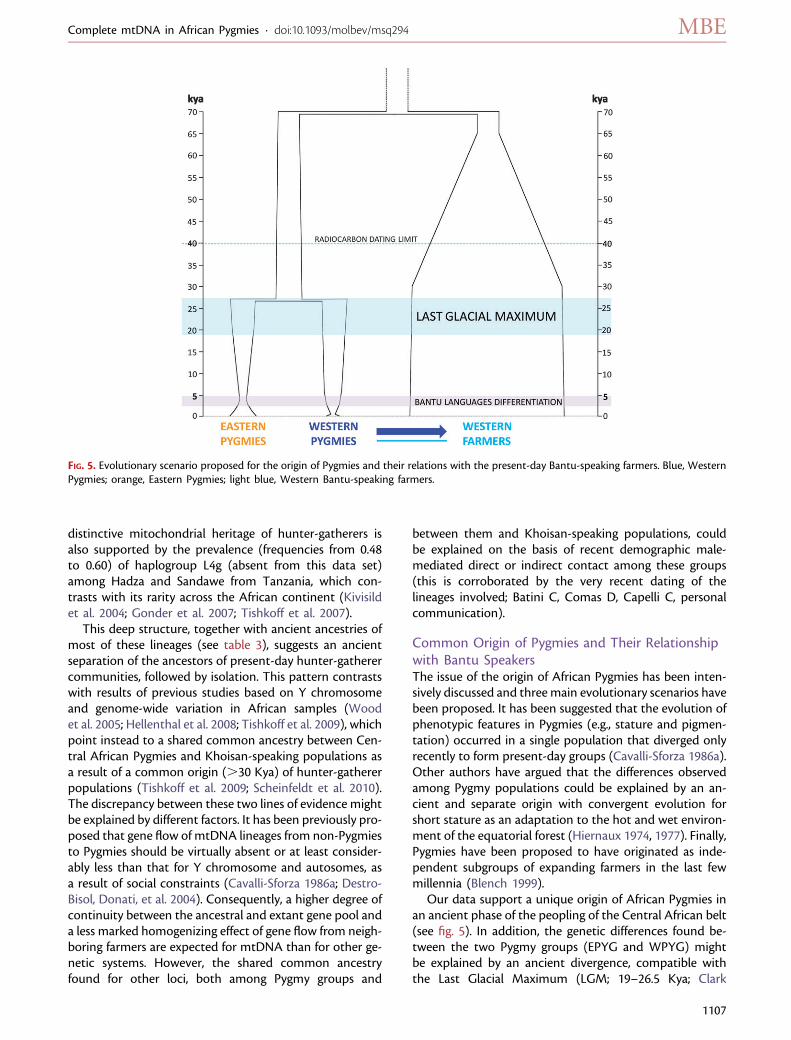
Our data support a unique origin of African Pygmies inan ancient phase of the peopling of the Central African belt(see fig. 5). In addition, the genetic differences found be-tween the two Pygmy groups (EPYG and WPYG) mightbe explained by an ancient divergence, compatible withthe Last Glacial Maximum (LGM; 19–26.5 Kya; Clark
FIG. 5. Evolutionary scenario proposed for the origin of Pygmies and their relations with the present-day Bantu-speaking farmers. Blue, WesternPygmies; orange, Eastern Pygmies; light blue, Western Bantu-speaking farmers.
Complete mtDNA in African Pygmies · doi:10.1093/molbev/msq294 MBE
1107
et al. 2009), and largely predating the later spread of variousforms of agriculture in the area, which started ;5 Kya(Phillipson 1993). The distribution of mitochondrial ge-nome variation and haplogroup composition showsa clear-cut difference between EPYG and WPYG, andour simulations suggest that their large genetic distancescould be explained by an ancient separation around 27(10–57) Kya, followed by complete isolation. The diver-gence between Pygmy groups occurred after the separationof the proto-Pygmy group from the ancestors of present-day Bantu-speaking farmers, which took place around 71(52–106) Kya (see fig. 5). The two groups could have ex-ploited different ecological niches, wooded environments,or savannah and open spaces, respectively (see Thomas2000; Cornelissen 2002; Mercader 2003). Indeed, evidencefor different types of Middle Stone Age industries in CentralAfrica, mainly Lupemban and quartz microlithics, preced-ing the limit of radiocarbon dating (;40 Kya) has been re-ported (see Cornelissen 2002; Marean and Assefa 2005).
Our estimates of population divergence times are inagreement with recent studies based on 20 autosomal1-kb regions (Patin et al. 2009) and on autosomal STRs(Verdu et al. 2009), as well as previous studies based onmtDNA phylogenetic-based dating of specific clades inWestern Pygmy populations (Destro-Bisol, Coia, et al.2004; Batini et al. 2007; Quintana-Murci et al. 2008).Interestingly, the TMRCA estimates for the coding mito-chondrial regions in Western Pygmy–specific clades(recalibrated using the latest revised mtDNA mutation ratepresented in Soares et al. 2009) are compatible with thedivergence date between the two groups estimated by co-alescent simulations, whereas Eastern Pygmy clades showyounger coalescence dates, with the sole exception ofL2a2 (see table 3). This suggests that some of the extantphylogenetic variation could have been shaped in recentdemographic events, whereas most of it seems to be theresult of a separation during the LGM, which could havebeen the ecological cause of the split (see fig. 5). In fact,it has been observed that, during this climatic phase,the tropical forest in Africa suffered a dramatic reductionin size (Sayer et al. 1992). Despite controversy about theintensity of this process and the continuity and locationof what have been defined as refuge areas (see Brooket al. 1990; Mercader et al. 2000; Thomas 2000), it is intrigu-ing that the current distribution of the two Pygmy groupsconsidered here mirrors the location of those areas inwhich concentration peaks of both animal and plant en-demisms are observed (Hamilton 1982; Sayer et al.1992). The same ecological isolation mechanisms couldhave acted on Pygmy populations, whose separation wouldtherefore have been independent from the putative expan-sion of Bantu-speaking populations through sub-SaharanAfrica since 5 Kya (Bahuchet 1993; Phillipson 1993; Nurseand Philippson 2003). Finally, we detected signatures ofgene flow only among the two Western (Pygmy andnon-Pygmy) groups with a ratio of 5:1 female migrantsfrom Western Pygmies to Bantu-speaking farmers. How-ever, the posterior distribution of the migration rate into
the the WAGR group is wide, thus leaving this issue to befurther clarified.
Genetic Signatures of Differential Recent Events inPygmy Demographic HistoriesThe effective population size estimated for Pygmies is lowerthan that for Western farmers but not very different fromthat of the ancestral population, suggesting that Pygmiesmay have maintained population sizes similar to earlyHomo sapiens communities. This would be in agreementwith the demographic expansion thought to be associatedwith the rapid diffusion of Bantu languages throughoutsub-Saharan Africa in the last 3–5 Kya (Ehret andPosnansky 1982; Phillipson 1993; Vansina 1995; Nurseand Philippson 2003). However, our demographic esti-mates suggest a more gradual increase in population sizeduring the last millennia. The acceleration in the popula-tion growth rate of Western farmers is observed long beforethe expected demographic expansion at 3–5 Kya, between65 and 30 Kya, leading to a present-day population sizeseven times higher than that of the ancestral one. By con-trast, both Pygmy groups show signals of decrease in pop-ulation size during the last 70 Kya, with the ratio of Westernand Eastern Pygmies compared with the ancestral popula-tion of 0.25:1 and 0.80:1, respectively. Both Pygmy groupsshow evidence of recent bottlenecks with similar intensity(up to 40% reduction of the original Ne), although theirtiming is different. Eastern Pygmies show a gradual decreaseof Ne starting 20 Kya and reaching its minimum 4 Kya, West-ern Pygmies show a sudden population reduction between 4and 0.65 Kya, which overlaps with the putative dates of thediffusion of Bantu languages (see fig. 5).
Comparing our scenario with that obtained from auto-somal markers (Patin et al. 2009), two important differen-ces can be noticed. First, the strength of the reduction of Neis greater with autosomal data (up to 80% for WPYG and to95% for EPYG). Second, Eastern Pygmies showed signals ofa more recent bottleneck than Western Pygmies. Differen-tial social and demographical dynamics acting on the fe-male and male component of Pygmy populations duringtheir evolutionary history may help to explain this discrep-ancy, although only a larger sampling, as well as data fromEastern African Central Sudanic and Bantu speakers, couldmake any comparison and subsequent interpretation morerobust. Also, we observe a greater heterogeneity in EasternPygmy samples compared with Western Pygmies, which iscompatible with a more ancient bottleneck and almostcomplete restoration of population size. However, geneflow is expected to increase effective population sizeand internal diversity, and its detection could have beenlimited by the lack of key neighboring population samples.With a more comprehensive sampling of Pygmy groupsand especially of Eastern Pygmy neighboring populations,issues like these may be further clarified.
In conclusion, we have presented the first populationstudy of complete mtDNA variation among African Pyg-mies and have drawn a detailed demographic scenariofor their evolutionary history. This investigation marks
Batini et al. · doi:10.1093/molbev/msq294 MBE
1108
a substantial difference from previous studies, where thegenomic approach was applied to dissect specific lineagesfor phylogeographic purposes. We are aware that mtDNAoffers a partial—maternal—view of population history,whereas lineage loss may confound results in small-sizedpopulations. Nonetheless, our results support and comple-ment previous findings, contributing to a more completepicture of the evolutionary history of African Pygmies andhighlighting the importance of complete mtDNA sequenc-ing at the population level for deciphering the prehistory ofhuman populations.
Supplementary MaterialSupplementary figures S1 to S6 and supplementary tablesS1 to S5 are available at Molecular Biology and Evolutiononline (http://www.mbe.oxfordjournals.org/).
AcknowledgmentsWe would like to thank Roger Anglada, Stephanie Plaza, Kris-tin Kristinsdottir, Monica Valles (Universitat Pompeu Fabra,Barcelona, Spain), and Roberto Feuda (National University ofIreland Maynooth, Ireland) for technical support; Mark Jo-bling (University of Leicester, United Kingdom) for his usefulcomments; Philip Fischer (Mayo Clinic, New York, NY, USA)and Micheal Bamshad (University of Washington, Washing-ton, DC, USA) for supporting the sampling of Mbuti popu-lation in the Democratic Republic of Congo. We also wouldlike to thank all the volunteers who donated their DNA,making this study possible. The research presented was sup-ported by the Direccion General de Investigacion, Ministeriode Educacion y Ciencia, Spain (CGL2007-61016), and Direc-cio General de Recerca, Generalitat de Catalunya(2009SGR1101). D.C. conceived and designed the experi-ments. L.B.J., L.v.d.V., L.Q.-M., and G.S. collected and providedthesamples.C.B.performed theexperiments.C.B., J.L.,D.M.B.,and F.C. analyzed the data. C.B., G.D.B., and D.C. wrote thepaper.
ReferencesAchilli A, Perego UA, Bravi CM, Coble MD, Kong QP, Woodward SR,
Salas A, Torroni A, Bandelt HJ. 2008. The phylogeny of the fourpan-American MtDNA haplogroups: implications for evolution-ary and disease studies. PLoS One. 3:e1764.
Andrews RM, Kubacka I, Chinnery PF, Lightowlers RN, Turnbull DM,Howell N. 1999. Reanalysis and revision of the Cambridge referencesequence for human mitochondrial DNA. Nat Genet. 23:147.
Bahuchet S. 1993. History of the inhabitants of the central Africanrain forest: perspectives from comparative linguistics. In: HladikCM, Hladik A, Linares OF, Pagezy H, Semple A, Hadley M,editors. Tropical forests, people and food. New York: UNESCOp. 37–54.
Bandelt HJ, Forster P, Rohl A. 1999. Median-joining networks forinferring intraspecific phylogenies. Mol Biol Evol. 16:37–48.
Batini C, Coia V, Battaggia C, Rocha J, Pilkington MM, Spedini G,Comas D, Destro-Bisol G, Calafell F. 2007. Phylogeography of thehuman mitochondrial L1c haplogroup: genetic signatures of theprehistory of central Africa. Mol Phylogenet Evol. 43:635–644.
Beaumont MA, Zhang W, Balding DJ. 2002. Approximate Bayesiancomputation in population genetics. Genetics 162:2025–2035.
Behar DM, Villems R, Soodyall H, et al. 15 co-authors. 2008. Thedawn of human matrilineal diversity. Am J Hum Genet.82:1130–1140.
Berniell-Lee G, Calafell F, Bosch E, Heyer E, Sica L, Mouguiama-Daouda P, van der Veen L, Hombert JM, Quintana-Murci L,Comas D. 2009. Genetic and demographic implications of theBantu expansion: insights from human paternal lineages. MolBiol Evol. 26:1581–1589.
Blench R. 1999. Are the African pygmies an ethnographic fiction?. In:Biesbrouck K, Elders S, Rossel G, editors. Central African hunter-gatherers in a multidisciplinary perspective: challenging elusive-ness. Leiden (The Netherlands): CNWS, Universiteit Leiden. p.41–60.
Brook GA, Burney DA, Cowart JB. 1990. Paleoenvironmental data forIturi, Zaire, from sediments in Matupi Cave, Mt Hoyo. In: BoazNT, editor. Evolution of environments and Hominidae in theAfrican Western Rift Valley. Martinsville: Virginia Museum ofNatural History Memoir 1. p. 49–70.
Cavalli-Sforza LL. 1986a. African pygmies: an evaluation of the stateof research. In: Cavalli-Sforza LL, editor. African pygmies.Orlando (FL): Orlando Academic Press. p. 361–426.
Cavalli-Sforza LL. 1986b. Anthropometric data. In: Cavalli-Sforza LL,editor. African pygmies. Orlando (FL): Orlando Academic Press.p. 81–93.
Cavalli-Sforza LL. 1986c. Demographic data. In: Cavalli-Sforza LL,editor. African pygmies. Orlando (FL): Orlando Academic Press.p. 23–44.
Cavalli-Sforza LL, Menozzi P, Piazza A. 1993. The history andgeography of human genes. Princeton (NJ): Princeton UniversityPress.
Clark PU, Dyke AS, Shakun JD, Carlson AE, Clark J, Wohlfarth B,Mitrovica JX, Hostetler SW, McCabe AM. 2009. The last glacialmaximum. Science 325:710–714.
Cornelissen E. 2002. Human responses to changing environments incentral Africa between 40,000 and 12,000 BP. J World Prehist.16:197–235.
Demolin D. 1996. The languages spoken by the pygmies in the Ituri:comparative and historical perspectives. Colloquium on hunter-gatherers of Equatorial Africa; October 1996; Leiden, Nether-lands.
Destro-Bisol G, Battaggia C, Coia V, Batini C, Spedini G. 2006. Thewestern pygmies from central African republic: new data onautosomal loci. J Anthropol Sci. 84:161–164.
Destro-Bisol G, Coia V, Boschi I, Verginelli F, Caglia A, Pascali V,Spedini G, Calafell F. 2004. The analysis of variation of mtDNAhypervariable region 1 suggests that eastern and westernPygmies diverged before the Bantu expansion. Am Nat. 163:212–226.
Destro-Bisol G, Donati F, Coia V, Boschi I, Verginelli F, Caglia A,Tofanelli S, Spedini G, Capelli C. 2004. Variation of female andmale lineages in sub-Saharan populations: the importance ofsociocultural factors. Mol Biol Evol. 21:1673–1682.
Diamond JM. 1991. Why are pygmies small? Nature. 354:111–112.Drummond AJ, Rambaut A. 2007. BEAST: Bayesian evolutionary
analysis by sampling trees. BMC Evol Biol. 7:214.Drummond AJ, Rambaut A, Shapiro B, Pybus OG. 2005. Bayesian
coalescent inference of past population dynamics frommolecular sequences. Mol Biol Evol. 22:1185–1192.
Ehret C, Posnansky M. 1982. The archaeological and linguistic recon-struction of African history. Berkley: University of California Press.
Excoffier L, Laval G, Schneider S. 2005. Arlequin (version 3.0): anintegrated software package for population genetics dataanalysis. Evol Bioinform Online. 1:47–50.
Fagundes NJ, Ray N, Beaumont M, Neuenschwander S, Salzano FM,Bonatto SL, Excoffier L. 2007. Statistical evaluation of alternative
Complete mtDNA in African Pygmies · doi:10.1093/molbev/msq294 MBE
1109
models of human evolution. Proc Natl Acad Sci U S A. 104:17614–17619.
Finnila S, Lehtonen MS, Majamaa K. 2001. Phylogenetic network forEuropean mtDNA. Am J Hum Genet. 68:1475–1484.
Gonder MK, Mortensen HM, Reed FA, de Sousa A, Tishkoff SA.2007. Whole-mtDNA genome sequence analysis of ancientAfrican lineages. Mol Biol Evol. 24:757–768.
Hamilton AC. 1982. Environmental history of east Africa: a study ofthe quaternary. London: Academic Press.
Hart TB, Hart JA. 1986. The ecological basis of hunter-gatherersubsistence in African rain forests: the Mbuti of eastern Zaire.Hum Ecol. 14:29–55.
Hellenthal G, Auton A, Falush D. 2008. Inferring human colonizationhistory using a copying model. PLoS Genet. 4:e1000078.
Herrnstadt C, Elson JL, Fahy E, et al. (11 co-authors). 2002. Reduced-median-network analysis of complete mitochondrial DNAcoding-region sequences for the major African, Asian, andEuropean haplogroups. Am J Hum Genet. 70:1152–1171.
Hiernaux J. 1974. The people of Africa. New York: Charles Scribner’sSons.
Hiernaux J. 1977. Long-term biological effects of human migrationfrom the African savanna to the equatorial forest: a case study ofhuman adaptation to a hot and wet climate. In: Harrison GA,editor. Population structure and human variation. Cambridge:Cambridge University Press. p. 187–217.
Hitchcock RK. 1999. Introduction: Africa. In: Lee RB, Daly RH,editors. The Cambridge encyclopedia of hunters and gatherers.Cambridge: Cambridge University Press. p. 175–184.
Ingman M, Kaessmann H, Paabo S, Gyllensten U. 2000. Mitochon-drial genome variation and the origin of modern humans.Nature 408:708–713.
Jakobsson M, Scholz SW, Scheet P, Gibbs JR, VanLiere JM, Fung HC,Szpiech ZA, Degnan JH, Wang K, Guerreiro R. 2008. Genotype,haplotype and copy-number variation in worldwide humanpopulations. Nature 451:998–1003.
Just RS, Diegoli TM, Saunier JL, Irwin JA, Parsons TJ. 2008. Completemitochondrial genome sequences for 265 African American andU.S. ‘‘Hispanic’’ individuals. Forensic Sci Int Genet. 2:e45–e48.
Kivisild T, Reidla M, Metspalu E, Rosa A, Brehm A, Pennarun E,Parik J, Geberhiwot T, Usanga E, Villems R. 2004. Ethiopianmitochondrial DNA heritage: tracking gene flow across andaround the gate of tears. Am J Hum Genet. 75:752–770.
Kong QP, Salas A, Sun C, Fuku N, Tanaka M, Zhong L, Wang CY,Yao YG, Bandelt HJ. 2008. Distilling artificial recombinants fromlarge sets of complete mtDNA genomes. PLoS One. 3:e3016.
Letouzey R. 1976. Contribution de la botanique au probleme d’uneeventuelle langue pygmee. Paris: SELAF.
Li JZ, Absher DM, Tang H, et al. 11 (co-authors). 2008. Worldwidehuman relationships inferred from genome-wide patterns ofvariation. Science 319:1100–1104.
Lopes JS, Balding D, Beaumont MA. 2009. PopABC: a program to inferhistorical demographic parameters. Bioinformatics 25:2747–2749.
Maca-Meyer N, Gonzalez AM, Larruga JM, Flores C, Cabrera VM.2001. Major genomic mitochondrial lineages delineate earlyhuman expansions. BMC Genet. 2:13.
Marean CW, Assefa Z. 2005. The middle and upper PleistoceneAfrican record for the biological and behavioral origins ofmodern humans. In: Sthal AB, editor. African archaeology.Oxford: Blackwell Publishing. p. 93–129.
Mercader J. 2003. Introduction: the Paleolithic settlement of rainforest. In: Mercader J, editor. Under the canopy: the archaeologyof tropical rain forests. London: Rutgers University Press. p. 1–31.
Mercader J, Runge F, Vrydaghs L, Doutrelepont H, Ewango CEN,Juan-Tresseras J. 2000. Phytoliths from archaeological sites in the
tropical forest of Ituri, democratic republic of Congo. Quat Res.54:102–112.
Migliano AB, Vinicius L, Lahr MM. 2007. Life history trade-offsexplain the evolution of human pygmies. Proc Natl Acad SciU S A. 104:20216–20219.
Nurse D, Philippson G. 2003. The Bantu languages. London:Routledge.
Patin E, Laval G, Barreiro LB, et al. (15 co-authors). 2009. Inferringthe demographic history of African farmers and pygmy hunter-gatherers using a multilocus resequencing data set. PLoS Genet.5:e1000448.
Perry GH, Dominy NJ. 2009. Evolution of the human pygmyphenotype. Trends Ecol Evol. 24:218–225.
Phillipson DW. 1993. African archaeology. Cambridge: CambridgeUniversity Press.
Quintana-Murci L, Quach H, Harmant C, et al. 23 co-authors. 2008.Maternal traces of deep common ancestry and asymmetric geneflow between pygmy hunter-gatherers and Bantu-speakingfarmers. Proc Natl Acad Sci U S A. 105:1596–1601.
Roostalu U, Kutuev I, Loogvali EL, Metspalu E, Tambets K, Reidla M,Khusnutdinova EK, Usanga E, Kivisild T, Villems R. 2007. Originand expansion of haplogroup H, the dominant humanmitochondrial DNA lineage in west Eurasia: the near easternand Caucasian perspective. Mol Biol Evol. 24:436–448.
Rosenberg NA, Pritchard JK, Weber JL, Cann HM, Kidd KK,Zhivotovsky LA, Feldman MW. 2002. Genetic structure ofhuman populations. Science 298:2381–2385.
Salas A, Richards M, De la Fe T, Lareu MV, Sobrino B, Sanchez-Diz P,Macaulay V, Carracedo A. 2002. The making of the AfricanmtDNA landscape. Am J Hum Genet. 71:1082–1111.
Sayer JA, Harcourt CS, Collins NM. 1992. The conservation atlas oftropical forests: Africa. London: UCN, WCMC, Macmillan.
Scheinfeldt LB, Soi S, Tishkoff SA. 2010. Colloquium paper: workingtoward a synthesis of archaeological, linguistic, and genetic datafor inferring African population history. Proc Natl Acad Sci U SA. 107(Suppl 2):8931–8938.
Soares P, Ermini L, Thomson N, Mormina M, Rito T, Rohl A, Salas A,Oppenheimer S, Macaulay V, Richards MB. 2009. Correcting forpurifying selection: an improved human mitochondrial molec-ular clock. Am J Hum Genet. 84:740–759.
Sturrock K, Rocha J. 2000. A multidimensional scaling stressevaluation table. Field Methods. 12:49–60.
Thomas MF. 2000. Late quaternary environmental changes and thealluvial record in humid tropical environments. Quat Int.72:23–36.
Tishkoff SA, Gonder MK, Henn BM, et al. 12 co-authors. 2007.History of click-speaking populations of Africa inferred frommtDNA and Y chromosome genetic variation. Mol Biol Evol.24:2180–2195.
Tishkoff SA, Reed FA, Friedlaender FR, et al. 25 co-authors. 2009. Thegenetic structure and history of Africans and African Americans.Science. 324:1035–1044.
Vansina J. 1995. New linguistic evidence and ‘the Bantu expansion’.J Afr Hist. 36:173–195.
Verdu P, Austerlitz F, Estoup A, et al. 14 co-authors. 2009. Originsand genetic diversity of pygmy hunter-gatherers from westerncentral Africa. Curr Biol. 19:312–318.
Watkins WS, Rogers AR, Ostler CT, Wooding S, Bamshad MJ,Brassington AME, Carroll ML, Nguyen SV, Walker JA, Prasad B.2003. Genetic variation among world populations: inferences from100 Alu insertion polymorphisms. Genome Res. 13:1607–1618.
Wood ET, Stover DA, Ehret C, et al. (11 co-authors). 2005.Contrasting patterns of Y chromosome and mtDNA variation inAfrica: evidence for sex-biased demographic processes.Eur J Hum Genet. 13:867–876.
Batini et al. · doi:10.1093/molbev/msq294 MBE
1110