insights into the food, beverage, and consumer products ... · pdf fileinsights into the food,...
TRANSCRIPT

Insights into the Food, Beverage, and Consumer Products Industry GMA Overview of Industry Economic Impact, Financial Performance, and Trends

The member firms of the PricewaterhouseCoopers network (www.pwc.com) provide industry-focused assurance, tax, and advisory services to build public trust and enhance value for its clients and their stakeholders. More than 130,000 people in 148 countries across our network work collaboratively using connected thinking to develop fresh perspectives and practical advice.
© 2006 PricewaterhouseCoopers LLP. All rights reserved. “PricewaterhouseCoopers” refers to PricewaterhouseCoopers LLP (a Delaware limited liability partnership) or, as the context requires, the PricewaterhouseCoopers global network or other member firms of the network, each of which is a separate and independent legal entity.
For more information, visit PricewaterhouseCoopers’ website at www.pwc.com
For more information about PricewaterhouseCoopers’ Retail and Consumer Products Industry Practice, visit www.pwc.com/r&c
The Grocery Manufacturers Association (GMA) represents the world’s leading branded food, beverage, and consumer products companies. Since 1908, GMA has been an advocate for its members on public policy issues and has championed initiatives to increase industrywide productivity and growth. GMA member companies employ more than 2.5 million workers in all 50 states and account for more than $680 billion in global annual sales. The association is led by a board of member company chief executives.
For more information, visit the GMA website at www.gmabrands.com
The Food Products Association (FPA) is the largest trade association serving the food and beverage industry in the United States and worldwide. FPA’s laboratory centers, scientists, and professional staff provide technical and regulatory assistance to member companies and represent the food industry on scientific and public policy issues involving food safety, food security, nutrition, consumer affairs, and international trade.
For more information, visit FPA’s website at www.fpa-food.org

The Grocery Manufacturers Association (GMA) and PricewaterhouseCoopers (PwC) are pleased to be able to collaborate and provide you with this year’s overview of industry economic impact, financial performance, and trends. This GMA Report, now in its tenth year, continues to take an in-depth look at some of the financial trends affecting the consumer packaged goods (CPG) industry. However, in addition to providing corporate-level financial performance benchmarking metrics, this year’s analysis has been expanded to include two new sections, providing a more comprehensive understanding of the industry and its significance to the U.S. economy.
In Section 1 we provide a perspective on the impact the industry has on the U.S. economy, estimating overall contribution to gross domestic product as well as other key metrics. In Section 2 we take a look at some of the key issues and trends impacting the industry and, through examples, provide insight into how companies are addressing these issues. Finally, Section 3 provides key financial performance benchmarking results for the overall food, beverage, and consumer products industry as well as various size- and product-based segmentations.
Throughout this GMA Report, we draw upon publicly reported company financial data, government economic studies and statistics, and other published information for over 250 companies representing the CPG industry, as well as other industries. We have relied upon individual company and aggregate industry information as it has been publicly reported and we have cited all sources as appropriate. Example activities by specific companies referenced throughout this publication have been selected as illustrative of how GMA member and non-GMA member companies have responded to the various trends discussed.
As you read through the report, we hope you will find it informative and insightful—helping to increase overall knowledge of the industry as well as key issues and financial performance trends. GMA and PwC look forward to the opportunity to engage in discussion around these trends, issues, and analysis.
Stephen A. SibertGroup Vice President, Industry Affairs & MembershipGrocery Manufacturers Association
John G. MaxwellGlobal Consumer Packaged Goods Industry LeaderPricewaterhouseCoopers, LLP
Lisa Feigen DugalNorth American Retail and Consumer Packaged Goods Advisory LeaderPricewaterhouseCoopers, LLP
Foreword

Insights into the Food, Beverage, and Consumer Products Industry
Executive Overview ......................................................................................................................................1
Section 1: Everyday Products Make a Big Impact: Economic Analysis .................................................4 Method of Analysis .............................................................................................................................4 Total Economic Impact .......................................................................................................................5 The CPG Industry’s Total Economic Impact Is Far-Reaching and Increasing ....................................6 Direct Economic Impact: CPG Growth Gains Momentum Relative to the U.S. Economy ................7
Section 2: Targeted Collaboration Unlocks Joint Value: Critical Issues and Trends ............................8 An Open Business Model: Redefining Relationships for the Convergence Era .................................8 Revenue Growth and Expense Management: Leveraging the Balance ...........................................15 Sustainability: Proactively Adapting to Evolving Stakeholder Values ...............................................24
Section 3: Company Size Affects Results: Financial Performance Benchmarking ............................30 Industry Overview .............................................................................................................................30 Sector-Specific Analysis ...................................................................................................................35 Size-Specific Analysis .......................................................................................................................37 Very Small Companies ......................................................................................................................40 Very Large Companies ......................................................................................................................42
Appendix A: Economic Analysis Methodology .......................................................................................44
Appendix B: Financial Performance Benchmarking Methodology .......................................................51
Appendix C: Financial Performance Benchmarking Company Listing ................................................53
Appendix D: Definitions ............................................................................................................................54
Table of Contents

1GMA Overview of Industry Economic Impact, Financial Performance, and Trends
Today’s business environment is tough. Yet, the consumer packaged goods (CPG) industry continues to make a significant contribution to the overall economy. In mature markets like the U.S., financial growth and profitability can be constrained by factors such as slowing population growth, more discerning but less loyal consumers, and an operating environment in which it has been difficult to raise prices. Competitive pressures are increasing because CPG companies’ biggest customers (i.e., large retailers) are gaining power through rapid consolidation. In the emerging-market arena, the strategic focus is shifting to the expanding consumer markets of Asia, Central and Eastern Europe, and South America. China and India, in particular, offer new opportunities for growth and profitability through both supply chain efficiencies and market expansion. But doing business in emerging economies entails its own challenges, from managing risks related to outsourcing to innovating for local tastes and preferences.
CPG companies are effectively addressing some of these industry issues through targeted collaboration and openness to new ways of operating. This year’s report shows how, in spite of numerous issues (see sidebar), the CPG industry has much to celebrate through 2005. Median three-year and five-year total shareholder returns (TSR) remained above 8 percent, although median one-year TSR was 4 percent. Overall CPG industry median sales growth remains above 5 percent, earnings before interest and taxes (EBIT) growth continues, and overall productivity (as measured by return on average assets and employee productivity) is on the rise.
These thoughts and some of the industry issues are further explored in the sections of this report detailed on the following pages.
Executive Overview
Important Issues Affecting the CPG Industry
Ethics, Fraud, and ComplianceIn addition to increasing regulatory pressure from U.S. Food and Drug Administration and European Union regulators, CPG companies face increasing scrutiny from the SEC and local governments in the global market. The cost and complexity of meeting these requirements is growing, and the increasingly global nature of many CPG manufacturers adds further complexity.
GlobalizationFor non-food products, the influx and sourcing of cheaper-priced goods from low-cost countries has helped to push down some prices for many segments. Additionally, the expansion of many companies across borders continues as foreign manufacturers continue to sell in U.S. markets and U.S.-based companies increase their overseas presence to tap into new and quickly growing markets.
Need for Continual Product Portfolio ManagementCPG companies must focus their efforts on both long- and short-term financial perspectives, and on domestic and global growth opportunities. This means they must continually adjust their overall product portfolios to individual brands to ensure compatibility with the overall financial objectives of the company.
Private-Label ProductsNational brands, which have always competed with one another for limited shelf space, continue to be faced with additional and growing competition from retailers that are aggressively marketing and increasingly delivering high-quality private-label products. As shoppers continue to become more discerning and accepting of quality private-label products, this will significantly impact CPG manufacturers in the areas of pricing, brand building, and managing margin for sustained improvement.
Retail PowerRetailers will continue to consolidate in order to create scale and develop additional market presence. This ongoing phenomenon in a mature market such as the U.S. has significant implications for the CPG industry because growing retail strength continues to drive supplier response in the value chain.
Rising Input CostsPrice increases for a number of CPG input materials and services have generated increased pressure on gross margins. Increased demand within the industry, new competition for these materials, and diminished overall supply have pushed price levels for many goods to historical highs. The challenge is that some of these influences are structural and unlikely to disappear anytime soon.
Shifting Consumption PatternsProfound changes in attitudes, health, convenience, and lifestyles have made it difficult to segment consumers according to traditional demographics (age, gender, income, etc.). Shifts in consumer demand and purchase rationale are driving CPG behavior in areas such as developing health-conscious foods, new convenience product categories, total “solution” products, and “high-low spending” patterns.
Stakeholder DemandsDemands such as confronting the obesity challenge in the U.S., adhering to high environmental and labor standards in worldwide operations, and tackling corporate fraud are shaping CPG companies’ branding and positioning strategies. Stakeholders are taking a more proactive approach to attempting to influence corporate direction and general oversight.
Supply Chain ComplexityAs CPG companies develop new products to meet shifting consumer demands and expand into markets outside the U.S., supply chains are lengthening and new risks are emerging at every stage. Companies must pay closer attention to potential inventory effects and complexity issues as well as manage concerns such as protecting proprietary processes and supply chain security.

2 Insights into the Food, Beverage, and Consumer Products Industry
Section 1: Everyday Products Make a Big Impact: Economic Analysis
Generating revenues of $2.1 trillion and contributing more than $1 trillion to the total gross domestic product (GDP) of the United States economy, the CPG industry clearly exerts an influence far beyond supermarket shelves and household kitchens.1 The enormous industry spending on securing raw materials and delivering finished goods impacts many other industries, such as ranching, farming, oil refineries, wholesale trade, and transportation.
Additionally, employees of CPG companies and their suppliers contribute significantly to the local and national economy through such vehicles as taxes, healthcare spending, local dining establishments, and real estate. The combination of these impacts is significant, as shown in exhibit 1.
Exhibit 1: CPG Industry Total Impact on U.S. Economy, 2004*
Employment (000s) Employment Compensation ($B) Taxes Paid ($B) Revenues ($B) Contribution to GDP ($B)
14,672 569 242 2,069 1,033
*See page 5 for definitions of impact measuresSource: Minnesota IMPLAN Group Inc. and PwC Analysis
Between 2002 and 2003, growth of the U.S. economy outpaced CPG growth by 4 percentage points, but between 2003 and 2004, the CPG industry grew more than 1 percentage point faster than the overall economy.2 This growth corresponds to industry-wide improvements in both asset productivity and employee productivity.
Exhibit 5 (page 6) provides a breakdown of CPG’s economic impact on selected other industries in the economy in 2004 and provides a unique perspective on the impact of the CPG industry—which operates as a conduit that ties consumers, retailers, manufacturers and suppliers together to significantly contribute to the overall economy. The impact of the CPG industry is substantial, and our review details the wide range of sectors influenced by it.
Section 2: Targeted Collaboration Unlocks Joint Value: Critical Issues and Trends
In spite of a spate of challenges, what is driving the success of the industry is a bold new way of doing business: Companies are employing more agile business models and are seizing new opportunities for targeted collaboration, generating efficiencies, and unlocking the potential for joint value creation. By aggressively working to eliminate internal silos between business units as well as external walls between the company, its partners, and other strategic business allies, companies clearly are reaping the benefits. This targeted collaboration is particularly manifest in three areas:
• An Open Business Model: Redefining Relationships for the Convergence Era: The most successful CPG companies are devising new strategies for growth by incorporating a greater degree of openness in their business models. The traditional lines of responsibilities between retailers and manufacturers and suppliers are blurring as companies exchange traditional positions along the value chain. Retail consolidation continues and private-label competition is becoming stronger. Companies must move beyond a historial lack of trust, both internally within CPG companies’ business units and externally between CPG companies and retailers—for example, by building targeted partnerships to create value and achieve specific goals.
1 Measures of the CPG industry’s economic impact are based on U.S. figures for 2004, the latest year for which data were available, and were derived from the development of a new industry aggregation based upon U.S. Bureau of Economic Analysis industry classifications.
2 Minnesota IMPLAN Group Inc, and PwC Analysis.

3GMA Overview of Industry Economic Impact, Financial Performance, and Trends
• Revenue Growth and Expense Management: Leveraging the Balance: Regardless of size, companies that focus on achieving appropriate balance between revenues and expenses and steady improvements to margin (profitability) are more successful than those focusing solely on cost reduction. This manifests itself in a comprehensive effort to actively reign in and improve margins through strategic outsourcing, efficient commodity management, and effective leverage of brand strength, investment, and customer relationships. These efforts have contributed to the CPG industry’s gross margin climb to 39.5 percent in 2005.3
• Sustainability: Proactively Adapting to Evolving Stakeholder Values: CPG companies can realize significant tangible shareholder benefits when they manufacture products with more openness toward global stakeholders and in a manner that adheres to principles of sustainability. For years, some companies have concentrated efforts on such issues as recycling, waste reduction, and source reduction. Today, in this global, electronically connected marketplace, with more active and educated stakeholders, a broader and more agile approach to these sustainability issues is needed. The markets, it appears, also reward this focus. Over the past several years, stock indexes of “sustainable” companies have outperformed the S&P by 15 percent.4
Section 3: Company Size Affects Results: Financial Performance Benchmarking
Traditionally, this report has provided financial performance metrics for a benchmark set of CPG companies. In this year’s report, we continue that analysis and provide corporate-level benchmarks for a set of 252 publicly and privately held companies. We rank performance against a series of nine key metrics for various size (very small, small, medium, large, very large) and industry (overall CPG, food, beverage, household products) segmentations.
The key findings: The size of the enterprise continues to matter, as larger companies outperform all other industry segments in terms of overall sales growth and margins. This relative success by larger companies means that small to midsize companies need to strive to create scale and ruthlessly focus on efficiency while meeting specific, emerging customer needs through focus, openness and targeted collaboration.
• For companies with net sales greater than $4 billion (large companies), median gross margin remains higher than the balance of the industry, while selling, general, and administrative (SG&A) expenses are also increasing. However, large company total shareholder return (TSR) for 2005 was lower than the industry TSR, primarily due to reductions in nets sales growth rates and a general concern over the impact of market shocks such as Hurricane Katrina and high oil prices.
• For companies with net sales less than $4 billion (small to midsize companies), median cost of goods sold (COGS) as a percent of net sales is higher than industry median but SG&A as a percent of net sales has been falling, helping to sustain overall profitability. The fastest growing midsize companies are growing based on acquisition, primarily as a response to changing consumer demands and demographics.
• Companies in the beverage sector posted strong sales growth (over 10 percent) and were rewarded by the market as a result, posting a 10 percent median one-year shareholder return—the highest of the three sectors reviewed in this report. While the household products sector continued to post the highest gross margins (over 50 percent) in the overall industry, the market reacted to a decline in sales growth with a drop in median one-year shareholder return. The food sector experienced a relatively steady year, as median sales growth rose for the third straight year, increasing slightly to 7.5 percent. While the food sector also experienced the reduction in median one-year shareholder return that was felt across the overall CPG industry, the steady rise of sales growth since 2002 and relatively stable margins have enabled the food sector to deliver the highest five-year shareholder return (12.5 percent) for the CPG industry as a whole.
3 Reuters Global Fundamentals, Thomson Financial, Yahoo Finance, and PwC Analysis.4 SunGuard PowerData and PwC Analysis.

4 Insights into the Food, Beverage, and Consumer Products Industry
The CPG industry’s important role in the current and future vitality of the U.S. economy is palpable, as its products meet the basic, everyday needs of all consumers. As such, the industry’s significance also is felt in intangible ways. CPG brands represent values, aspirations, and lifestyles, and consumers often have close and familiar relationships with them.
In order to quantify and fully understand the ways in which the industry impacts the U.S. economy, it is necessary to trace the flow of spending on inputs to manufacture these products and brands. By doing so, we are able to estimate the impact of the CPG industry on national output, contribution to GDP, jobs, employment compensation, and tax revenues.
CPG manufacturers’ revenue (sales) is considered a direct contribution to the U.S. economy. Additionally, their production drives revenue for the suppliers of all raw materials consumed. Finally, the manufacturer and suppliers employ and compensate workers, whose wages drive further spending in the economy, as for example on real estate, healthcare, restaurants, or consumer durables. Thus, the CPG industry has three impacts on the U.S. economy:
1. A direct impact through its own production2. An indirect impact through production along the entire supply chain3. An induced impact through spending of wages and payment of taxes
Method of Analysis
CPG is an industry comprised of many sectors and is not commonly defined in public data sources. Therefore, for this analysis we selected 36 of 509 separate industry sectors from the North American Industry Classification System (NAICS) to define the CPG industry. Ten of these CPG sectors make up 59 percent of total CPG revenues. The largest sector, soft drink and ice manufacturing, comprises 8 percent of CPG revenues. Other top sectors include fruit and vegetable canning, toilet preparation manufacturing, fluid milk manufacturing, and bread and bakery products.
In the following pages, we analyze the total economic impact (direct, indirect, and induced) of the CPG industry as a whole (exhibit 4) as well the direct economic impact
in detail of each of the 36 CPG sectors (exhibit 29, Appendix A). To illustrate the linkages between the CPG industry and other sectors of the U.S. economy, we have measured its impact on selected non-CPG sectors (exhibit 5). Finally, to put our analysis in greater perspective, we have compared the direct economic impact of the CPG industry with that of other private-goods-producing industries (exhibits 30 to 34, Appendix A).
This report uses input-output (I-O) analysis to estimate the different components of the economic impact of the CPG industry. The I-O analysis considers how industries provide input to, and use output from, each other. Please see Appendix A for a detailed description of the economic analysis methodology used. The key metrics to measure economic impact are explained in exhibit 3.
Section 1Everyday Products Make a Big Impact: Economic Analysis
Exhibit 2: 2004 Economic Overview
EmploymentDirect 1.1 millionIndirect 3.2 millionInduced 10.3 million
Total 14.7 million
Employee CompensationDirect $58 billionIndirect $116 billionInduced $394 billion
Total $569 billion
Taxes PaidFederal $145 billionState $97 billion
Total $242 billion
RevenuesDirect $450 billionIndirect $478 billionInduced $1,142 billion
Total $2,069 billion
Contribution to GDPDirect $133 billionIndirect $226 billionInduced $674 billion
Total $1,033 billion
Source: Minnesota IMPLAN Group, Inc. and PwC AnalysisNote: Totals may not add up precisely due to rounding

5GMA Overview of Industry Economic Impact, Financial Performance, and Trends
Exhibit 3: Key Metrics: Economic Terms and Definitions
Metric Definition Closest Equivalent Financial Metric
Revenues (Gross output) Sales, receipts, and other operating income
Revenues
Contribution to GDP (Value added) Gross domestic product (GDP); or, the difference between the value of gross output and the cost of intermediate inputs such as energy, raw materials, semi-finished goods, and services
Gross profit before tax plus employee compensation
Employment The number of full-time and part-time workers, measured in annual average jobs
Average total employees
Employee compensation Wages and salary paid to employees as well as benefits such as health and life insurance, retirement payments, and any other non-cash compensation
Total wage, salary, and any employee benefit expenses paid by the employer
Total Economic Impact
In 2004, the CPG industry generated an estimated $2.1 trillion of revenues and contributed $1 trillion to GDP in the U.S., supporting 14.7 million American jobs.5 Exhibit 4 shows that the direct impact on total output by CPG producers of $450 billion was matched by an indirect impact along their supply chain of $478 billion. Further, the induced impact on output by all employees was $1.1 trillion. Collectively, employees along the value chain earned a total compensation of $569 billion. CPG production resulted in $242 billion in tax revenues, or $145 billion in federal taxes and $97 billion in state taxes. Exhibit 4: Economic Impact of CPG Companies in 2004
Economic Impact by Type
Gross Output ($B) Value Added ($B)
Employment Compensation ($B)
Employment (000s)
Direct Impact of CPG producers
450.0 133.1 58.4 1,126
Indirect Impact of CPG suppliers and their suppliers
477.9 226.0 116.0 3,229
Induced Impact generated by purchases of goods and services that result from additional income earned by both CPG producer employees and CPG supplier employees
1,141.6 673.8 394.5 10,317
Total Direct, indirect, and induced
2,069.5 1,032.8 568.8 14,672
Source: Minnesota IMPLAN Group, Inc. and PwC AnalysisNote: Totals may not add up precisely due to rounding
5 The most recent output data by industry at this level are available for 2004.

6 Insights into the Food, Beverage, and Consumer Products Industry
The CPG Industry’s Total Economic Impact Is Far-Reaching and Increasing
The CPG industry exerts its influence far beyond supermarket shelves and household kitchens. For example, industry spending on securing raw materials and delivering finished goods is high. This impacts several other industries, such as ranching, farming, oil refineries, wholesale trade, and transportation. Additionally, CPG and supplier-paid employees contribute significantly to the local and national economy through such vehicles as taxes, healthcare spending, local dining establishments, and real estate. Exhibit 5 provides a breakdown of the economic impact of CPG on selected other industries in the economy in 2004.
Exhibit 5: Total Economic Impact of Demand by CPG Companies on Selected Non-CPG Sectors, by Output in 2004
IndustryGross Output ($B)
Value Added ($B)
Employment Compensation ($B)
Employment (000s)
Wholesale trade 90.8 69.0 36.7 623
Real estate 68.5 47.1 5.0 386
State and local education 36.8 36.8 33.0 775
Food services and drinking places 35.0 16.6 11.4 743
Cattle ranching and farming 32.5 3.5 1.7 355
Telecommunications 30.9 17.0 5.8 87
Truck transportation 24.2 11.9 7.4 229
Petroleum refineries 23.4 2.6 0.9 6
Power generation and supply 22.5 16.1 3.4 35
All other food manufacturing 18.9 4.5 3.2 69
Other Industries 1,236.2 674.5 401.9 10,238
Subtotal 1,619.5 899.7 510.5 13,546
CPG industries’ direct impact 450.0 133.1 58.4 1,126
Total 2,069.5 1,032.8 568.8 14,672
Source: Minnesota IMPLAN Group, Inc. and PwC AnalysisNote: Totals may not add up precisely due to rounding
7GMA Overview of Industry Economic Impact, Financial Performance, and Trends
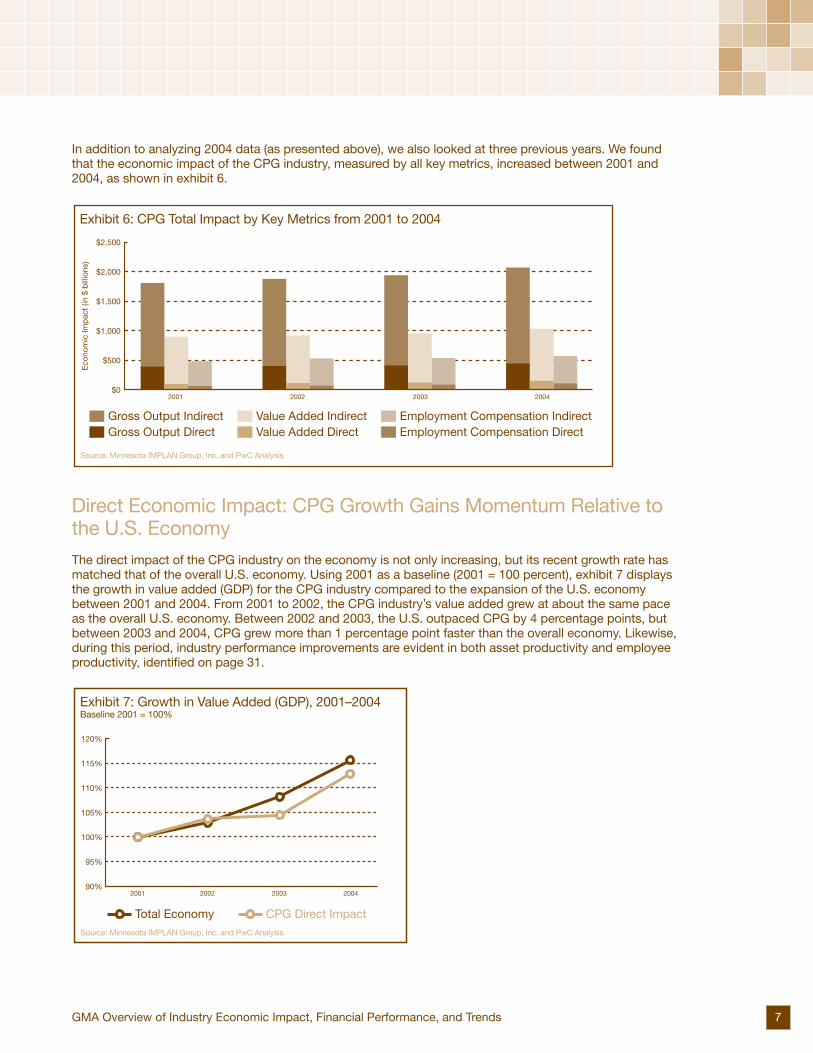
In addition to analyzing 2004 data (as presented above), we also looked at three previous years. We found that the economic impact of the CPG industry, measured by all key metrics, increased between 2001 and 2004, as shown in exhibit 6.
Direct Economic Impact: CPG Growth Gains Momentum Relative to the U.S. Economy
The direct impact of the CPG industry on the economy is not only increasing, but its recent growth rate has matched that of the overall U.S. economy. Using 2001 as a baseline (2001 = 100 percent), exhibit 7 displays the growth in value added (GDP) for the CPG industry compared to the expansion of the U.S. economy between 2001 and 2004. From 2001 to 2002, the CPG industry’s value added grew at about the same pace as the overall U.S. economy. Between 2002 and 2003, the U.S. outpaced CPG by 4 percentage points, but between 2003 and 2004, CPG grew more than 1 percentage point faster than the overall economy. Likewise, during this period, industry performance improvements are evident in both asset productivity and employee productivity, identified on page 31.
2001 2002 2003 2004
Exhibit 6: CPG Total Impact by Key Metrics from 2001 to 2004
$2,500
$2,000
$1,500
$1,000
$500
$0
Eco
nom
ic Im
pac
t (in
$ b
illio
ns)
Gross Output IndirectGross Output Direct
Value Added IndirectValue Added Direct
Employment Compensation IndirectEmployment Compensation Direct
Source: Minnesota IMPLAN Group, Inc. and PwC Analysis
2001 2002 2003 2004
Exhibit 7: Growth in Value Added (GDP), 2001–2004Baseline 2001 = 100%
120%
115%
110%
105%
100%
95%
90%
Total Economy CPG Direct ImpactSource: Minnesota IMPLAN Group, Inc. and PwC Analysis
8 Insights into the Food, Beverage, and Consumer Products Industry
New strategies are required to cope with today’s tough business environment. In mature markets like the U.S., customers continue to rapidly consolidate and consumers are becoming more discerning and less loyal. Globally, some of the strategic focus is shifting to the expanding consumer markets of Asia, Central and Eastern Europe, and South America. This expansion entails its own challenges, from managing risks related to outsourcing to innovating for local tastes and expense structures.
At the same time, a wider range of stakeholders demand greater accountability on all fronts, and are quick to punish companies that seem to fall short on their standards. There are few barriers to information today and news—especially bad news—travels quickly. CPG companies have to become ever more adept at managing social, ethical, and environmental risks all along their complex supply chains.
Yet, these are not the only concerns with which the CPG industry must contend. In the executive summary, we identified a series of specific issues affecting the CPG industry. Here, we examine three key trends that are particularly significant because they encompass many of the issues and challenges facing the industry today, and in the long run. On the following pages, through examples, we illustrate how successful CPG companies are not only responding to current challenges, but also finding new opportunities in this environment. The trends explored are:
• An Open Business Model: Redefining Relationships for the Convergence Era • Revenue Growth and Expense Management: Leveraging the Balance• Sustainability: Proactively Adapting to Evolving Stakeholder Values
An Open Business Model: Redefining Relationships for the Convergence Era
The boundaries between retail and CPG manufacturing are blurring. The traditionally separate industries are converging and manufacturers are responding with new and more collaborative ways of doing business. Customers of CPG companies are consolidating, and their power to drive supplier terms is increasing. Retail and manufacturing are converging, which is shaping corporate strategies and changing business models. Retailers in the supermarket, club store, mass merchandising, and drugstore segments are also aggressively marketing their private-label brands. As profit margins are being squeezed, CPG companies are fighting back to protect their portfolios and capture higher value margins. Some in the industry are developing a total experience for their consumers and forging partnerships with companies outside their core businesses.
GROWING RETAIL STRENGTH…
Supermarkets, club stores, mass merchants, and drugstores, where a number of CPG brands compete for shelf space with each other and private labels, are becoming increasingly consolidated, with many existing outlets being replaced by supercenters. The supercenter is the most rapidly expanding retail format, increasing in numbers as well as sales.6 But while consumers are flocking to supercenters to take advantage of convenience and consistently low prices, there is also a demand and place for specialty stores like Whole Foods and Trader Joe’s, where consumers are willing to pay premiums for products and brands that meet their specific needs.
Section 2Targeted Collaboration Unlocks Joint Value: Critical Issues and Trends
6 Standard & Poor’s, Supermarkets & Drugstores Industry Survey (July 27, 2006).

9GMA Overview of Industry Economic Impact, Financial Performance, and Trends
The result of this consolidation and shift is that CPG manufacturers are now serving a smaller number of powerful customers. An indication of this trend is that ten of the top 25 public CPG companies7 reported disclosures in their 2005 financial statement filings for those customers that account for 10 percent or more of consolidated net sales. Only four of these same companies had similar disclosures in their 2000 financial statement filings.
Exhibit 8: Top Ten Supermarket Chains, 2005 (Ranked by Sales)
ChainSales ($M)
Number of Stores
Sq. Ft. Selling Area (000s) Top Banner Names
1. Wal-Mart* 98,745 2,089 130,078 Wal-Mart Supercenter, Wal-Mart Neighborhood Market
2. Kroger 58,545 2,501 103,950 Kroger, Ralph’s Grocery, Smith’s Food & Drug
3. Albertsons** 36,288 1,765 88,904 Albertsons, Jewel-Osco, Shaw’s
4. Safeway 32,733 1,540 56,082 Safeway, Vons Market, Dominick’s Finer Foods
5. Ahold USA 23,848 824 34,603 Stop & Shop, Giant Food Store, Tops
6. Publix 18,532 876 33,971 Publix Super Market
7. Delhaize America 16,480 1,544 45,099 Food Lion, Hannaford Food & Drug, Kash n’ Karry
8. H-E-B 10,422 272 13,187 H-E-B, Central Market, H-E-B Plus
9. SuperValu** 8,633 619 17,370 Save-A-Lot, Cub Foods, Shoppers Food Warehouse
10. Winn-Dixie*** 7,092 563 26,104 Winn-Dixie, Save Rite
*Estimated data for supermarket items only**Albertsons and SuperValu merged in June 2006***Prior to 2006 divestiture of several storesSource: Progressive Grocer
Further, the top five food retailers accounted for nearly 50 percent of food sales in 2005, compared with less than 40 percent in 2000 and only 26.5 percent in 1980, according to Progressive Grocer, as cited in Standard & Poor’s (S&P) industry survey of supermarkets and drugstores. The S&P report also used statistics from Chain Drug Review to show that the top three drugstore chains in 2005 accounted for 55 percent of traditional drugstore market share.
…IS DRIVING SUPPLIER RESPONSE
Historically, some retailers have made requests that increase suppliers’ costs to serve in areas such as inventory management, customization, and promotional expenses. CPG companies’ heavy reliance on a smaller number of key customers is diminishing their ability to raise prices and is squeezing margins. The CPG industry must develop a robust, sustainable response to this challenge through new supply chain efficiencies and other new collaborative business practices.
7 Ranked according to 2005 net sales as reported in Reuters Global Fundamentals.

10 Insights into the Food, Beverage, and Consumer Products Industry
RETAILERS’ PRIVATE-LABEL BUSINESS IS EXPANDING
Making the environment even more competitive for CPG companies is the increasing impact of private labels, which retailers are aggressively using to entice consumers with quality products at consistently low prices.
The share of private labels is increasing across all channels, from grocery and drugstores to supercenters and mass merchandisers, as shown in exhibit 9.
The overall size of the private-label market in food, beverage, and personal care is still relatively small —accounting, according to one analysis, for $108 billion out of total estimated grocery industry sales of $863 billion in 2005 (see exhibit 10).8 But the impact of private labels is expected to grow in the next two years. In the U.S. between 2000 and 2005, the market for private labels grew at an annual rate of 5.3 percent, with food products representing the strongest growth. By 2010, the market value of private-label food alone is expected to surpass $100 billion.9 Once seen as low-cost generic versions of name brands, private labels are now competing with established brands on quality and image, often offering an attractive price-value proposition to consumers. In addition, shoppers are demonstrating “high-low spending” patterns—i.e., a willingness to trade down on certain categories in order to spend more on others—favoring both the low-cost alternative private-label products as well as the high-end specialty products.
Exhibit 9: 2005 CPG Private Label Share by Channel
Wal-Mart
Drugstore
Supercenter
Grocery
MassMerchandisers
All Outlets
Private LabelShare Point Change vs. 2004
Volume Dollar
+.03 (.02)
+.03 +.01
+0.0 (0.3)
+0.4 +0.2
+1.2 +.02
+0.6 +0.3
Volume Share Dollar Share
28.7%
18.0%
28.0%
14.0%
27.9%
18.0%
27.1%
18.1%
25.5%
15.8%
22.5%
12.2%
Source: IRI Consumer Networks
8 Standard & Poor’s, Supermarkets & Drugstores Industry Survey (July 27, 2006).9 Datamonitor, New Consumer Insight: How to Resist the Private Label Threat in 2006 (December 26, 2005).

11GMA Overview of Industry Economic Impact, Financial Performance, and Trends
Source: Datamonitor AnalysisNote: Totals may not add up precisely due to rounding
BOUNDARIES BETWEEN RETAIL AND MANUFACTURING ARE BLURRING
There are examples of retailers and manufacturers crossing over into each other’s industries where they have traditionally been separate. In order to improve asset utilization, some CPG companies manufacture private-label products that can potentially compete with their own branded goods. In other instances, retailers’ manufacturing operations produce their own private-label goods and also supply products to others. Safeway’s wholly owned subsidiary OmniBrands, for example, manufactures products for the food industry in more than 30 plants in the U.S. and Canada.
Forty-five percent of respondents to PricewaterhouseCoopers’ Consumer Products Barometer survey (a quarterly survey of executives in large, U.S.-based consumer products companies) reported in the second quarter of 2006 that they engaged in the manufacture of private-label brands for another reseller. Those producing private-label brands for others were much larger than companies that manufactured their own branded products, an indication of excess capacity among large companies.10
Retailers, meanwhile, are concentrating on turning private-label products into brands in their own right. Kroger’s private-label food products are marketed under three quality tiers: “Private Selection,” which competes with gourmet brands; ”Banner Brand,” which competes with national brands; and “For Maximum Value,” which aims to deliver quality products at affordable prices. In order to gain greater control over its supply chain, Kroger has established 42 manufacturing plants to produce these private-label goods.11
DRIVING SUCCESS THROUGH AN OPEN BUSINESS MODEL
An open business model is one in which barriers between a company and its partners or stakeholders are eliminated so that true targeted collaboration can occur. CPG companies that are successfully competing during this period of convergence are open to this new way of doing business. For example, some are building targeted partnerships with retailers to achieve specific goals such as capturing rich data on consumer activity. Throughout the 1990s, CPG companies focused on achieving internal productivity gains. Now they are also looking outside their walls and devising targeted collaboration and partnering strategies in order to remain competitive.
On the following pages are three areas where CPG companies and others whose industries are undergoing transformation through convergence of different sectors have successfully leveraged new ways of doing business.
10 PricewaterhouseCoopers, “U.S. Consumer Products Companies Expect Positive Revenue Growth in the Year Ahead,” Consumer Products Barometer (August 22, 2006).
11 Datamonitor Company Profiles, Kroger Co., SWOT analysis (June 26, 2006).
Exhibit 10: U.S. Private Label CPG Spending 2000–2010 (US$M)
(US$M) 2000 2005 2010 CAGR 2000–05 CAGR 2006–10
Beverage 13,787 17,736 20,814 5.2% 3.3%
Food 65,189 84,732 102,575 5.4% 3.9%
Personal care 4,343 5,519 7,414 4.9% 6.1%
Overall 83,318 107,986 130,803 5.3% 3.9%

12 Insights into the Food, Beverage, and Consumer Products Industry
Creating Joint Value through Targeted CollaborationCPG companies and retailers are trading partners that benefit from collaborating on processes like trade promotions, co-marketing, inventory management, product launches, and supply chain operations. Successful CPG companies understand that product and brand development remains their core competency and that they can offer a value proposition to their consumers based on specific product attributes or brand strengths. The concept of collaboration is not new, but true alignment between CPG suppliers and retailers has not realized its full potential because of a fundamental lack of trust.12 Increasingly, industry manufacturers are working with their retail trading partners and through their industry association to build mutually beneficial collaborative partnerships and strong inter-industry cooperation.
Apparel and home furnishing marketers have led the way in targeted collaboration with retailers in one area: trade spending. Exclusive merchandising relationships (for example, Isaac Mizrahi at Target, Chaps and Vera Wang at Kohl’s, and Nate Berkus at Linens n’ Things) create joint value because retailers heavily promote “affordable chic” product lines that the competition cannot obtain. When collaboration occurs on a case by case basis, both parties can find a workable method to give more than they currently do, based on trust and understanding of strategic goals and objectives. More targeted collaboration—for example, within a product line or in a particular location—helps to scale the walls that exist between suppliers and retailers.
Recent efforts across the industry have begun to identify ways to work through these obstacles. A recent study by GMA, for example, showed that customization programs based on collaborative strategic decisions tended to be more effective than others. Specifically, better collaboration led to significantly higher success rates for display customization when compared to programs initiated by manufacturers who were not collaborating as well.13
Another initiative toward joint value creation is global data synchronization (GDS). With GDS, companies can harmonize data all along the value chain, whether at a plant, a distribution center, or a store. The study Synchronization: The Next Generation of Business Partnering, released by GMA in 2006, quantifies the benefits that have accrued to both retailers and manufacturers as a result of GDS. For example, it estimates that the retailer realizes 6.5 percent in transportation cost savings, while the manufacturers capture anywhere between 2 and 8 percent.14
At a time when competition is intense, domestic markets are mature, and input costs are on the rise (see pages 15-23 for our discussion of rising costs), focused and targeted collaboration between retailers and manufacturers or suppliers helps to create value for all. By leveraging this targeted collaboration more broadly (with other customers or other components of the value chain), CPG manufacturers also can begin to improve overall value chain performance, outside of the immediate collaboration opportunity. What used to be perceived as an extra requirement can become truly value added.
12 Forrester Research, Consumer Goods Technology, and RIS, Shared Strategy Study: The State of Collaboration 2005 (November 2005).
13 GMA, Booz Allen Hamilton, Creating Value through Customization: Winning through Shelf-Centered Collaboration (2006).14 GMA, Food Marketing Institute, Wegmans Food Markets, Accenture LLP, and 1SYNC, Synchronization: The Next Generation of
Business Partnering—How Leading Companies Are Delivering Actual Results (2006).

13GMA Overview of Industry Economic Impact, Financial Performance, and Trends
Creating New Consumer ExperiencesBy creating meaningful experiences for consumers around their established brands, CPG companies can offer value that is impossible for private labels to replicate. Mars, Inc. and The Hershey Company have crossed over into retail and entertainment to provide consumer brand-related experiences. Mars’ Ethel’s Chocolate Lounges (named after its Ethel’s brand of chocolate) have an ambience that encourages indulgence and exploration of gourmet chocolate. At Hershey’s stores in New York City’s Times Square and on Chicago’s Michigan Avenue, customers can create their own chocolate and sing and dance along with the “Hershey-izer,” a store baker who uses Hershey’s toppings.
In August this year, The Procter & Gamble Company (P&G) forayed into the domain of retailers by opening the first U.S. Oil of Olay kiosk in its hometown of Cincinnati, providing a complete beauty experience. The company already sells directly to consumers through such kiosks in Poland, Spain, Russia, and Mexico. These kiosks help the company to create an emotional bond with its consumers. They also provide the company a direct window to observing and understanding consumer behavior and preferences. Women’s interaction with beauty consultants reveals a lot about how and why they choose beauty products.
While unique factors, both internal and external, shape the operations and strategies of companies in the CPG industry, lessons can be learned from other industries that have faced similar challenges and realized success through opening up their business models. Like CPG companies, apparel manufacturers also rely heavily on a few key customers. Some in that industry are aggressively expanding into retail in pursuit of growth. For example, Liz Claiborne expects its company-operated retail stores to account for roughly 30 percent of total revenue by 2010.15 Jones Apparel Group, which owns brands such as Jones New York, Nine West, and Bandolino, ventured into luxury retail outlets with the acquisition of Barneys in late 2004.
Entering the domain of retailers in this way allows companies to understand consumer behavior at a time when segmentation has become complex due to pronounced shifts in demographics, family structures, and social norms. Age, gender, and income have become less relevant as predictors of attitudes and behavior. For example, baby boomers entering into retirement are healthier and more affluent than the previous generation of seniors, and they are making youthful lifestyle choices while showing a strong appreciation for real value. Young consumers, meanwhile, are increasing their spending on personal care products, and are both brand- and price-conscious.
Companies across all industries ask themselves what kind of user experiences customers are demanding, especially in times of profound changes. Today, technology, telecommunications, and media are converging into a huge multimedia market, and business models are changing to respond to new patterns of consumer behavior. Opportunities exist in the CPG industry to capitalize upon this dynamic interaction with consumers. For example, to help capture consumers for its new line, Dove Calming Night, Unilever sponsored an America Online microsite for women (“Chief Everything Officers”) and created three webisodes to advertise the new line. In the webisodes, directed by Penny Marshall, Desperate Housewives star Felicity Huffman plays a mother who takes a shower before bed, falls asleep, and wakes up as a character in The Brady Bunch, The Munsters, and Leave It to Beaver.16
Today’s marketplace is characterized by new technologies, new channels of distribution, and new ways of delivering services. Many CPG brand owners are seizing the opportunity this environment offers and are interacting more directly with their consumers.
15 Datamonitor Company Profiles, Liz Claiborne, Inc., SWOT analysis (June 17, 2006).16 Gavin O’Malley, “Desperate Housewives Actress Stars in Dove Webisodes,” Online Media Daily (March 2, 2006).

14 Insights into the Food, Beverage, and Consumer Products Industry
Enhancing Prestige and Value with Co-BrandingCo-branding relates to major brands converging to enhance the image of both products. Co-branding is not new. The financial services industry has been co-branding for years through credit cards that are marketed to consumers of the co-branded product. As CPG companies become more open to forging new relationships and alliances, those with well-known brands can partner with other recognized brands to mutually enhance the prestige of both and offer a compelling value proposition to consumers. This works especially well when traditional boundaries get blurred and industries enter each others’ domains. As retailers have grown in size and expanded into new formats such as supercenters, they have built successful co-branding partnerships with food franchises—for example Stop & Shop with Dunkin’ Donuts and Wal-Mart with McDonald’s. Apple and Nike have entered into a co-branding partnership that targets consumers who exercise to music. A tiny pedometer fits inside the Nike shoe and connects with an adapter to the iPod nano. The pedometer tracks the athlete’s movements and communicates information to the nano, which records and displays in almost real time statistics such as distance traveled, calories burned, and time elapsed.
CPG companies have also scored hits with co-branding. The North American Coffee Partnership between PepsiCo and Starbucks, under which PepsiCo manufactures the 9.5-ounce bottled version of Starbucks’ blended ice beverage Frappuccino, has been very successful: In the $191 million ready-to-drink coffee category, Frappuccino accounts for $158 million.17
The new economy requires CPG companies to think out of the box. Industry dynamics are ensuring that convergence is here to stay and CPG companies are becoming more open to new ways of leveraging targeted collaboration to create value in this environment. They are redefining relationships with their customers as well as consumers. Improving margins also is not easy at a time when commodity prices are soaring and powerful retailers are driving hard bargains. The industry is demonstrating similar openness in its relationships around traditional back-office functions such as procurement, IT, and logistics. This is helping offset rising input costs, a phenomenon that is contributing to squeezed margins. In the following pages, we analyze the impact of rising input costs on the CPG industry and offer some strategies that have helped companies to maintain healthy margins in a tough environment.
17 Kenneth Hein, “Caffeine: The Last Vice Standing,” Brandweek (May 15, 2006).

15GMA Overview of Industry Economic Impact, Financial Performance, and Trends
Revenue Growth and Expense Management: Leveraging the Balance
Some CPG companies are moving away from a narrow focus on cost reductions and are taking a broader approach to achieving the appropriate balance between revenues and expenses and attaining steady improvements to margin (profitability). Today’s tough environment, in which commodity prices are volatile and the ability to pass on increases to customers limited, requires companies to seek new efficiencies in their operations. Cost-cutting measures such as outsourcing back-office operations and procuring commodities at hedged prices have been tried, tested, and adopted by some in the industry. But such measures alone are not adequate. That is why many CPG companies are moving away from piecemeal measures of cost cutting and instead taking a holistic approach to sustained margin improvement. They are, for example, looking at ways to derive higher value from targeted outsourcing, a more selective focus on resources, and making operational improvements to achieve better utilization of inputs.
RISING INPUT COSTS
Many of the major cost categories for CPG companies—such as energy, agricultural commodities, packaging, and transportation—are highly exposed to price increases. Oil prices are a top concern for CPG companies since they incur high energy costs at all stages of their business: raw material sourcing, product manufacturing, product packaging, product distribution, and retailing. In 2006, oil rose to the highest level since trading began in 1983. Exhibit 11 shows the doubling of oil prices since 2003.
Energy consumption in transportation is projected to outpace that in other sectors, which negatively impacts the CPG industry because of its need to move products by ship, rail, and trucks.
Exhibit 11: Oil Prices, 2003–2006 (Light Sweet Crude Oil)
Source: NYMEX
$80
$70
$60
$50
$40
$30
$20
$10
$0
Feb
03
Jun
03
Oct
03
Feb
04
Jun
04
Oct
04
Feb
05
Jun
05
Oct
05
Feb
06
1980 1990 2000 2004 2010 2020 2030
Exhibit 12: Delivered Energy Consumption by Sector, 1980–2030 (Quadrillion Btu)
40
30
20
10
0
Transportation ResidentialIndustrial Commercial
Source: Annual Energy Outlook 2006, Energy Information Administration, U.S. Department of Energy, February 2006, p. 5
History Projections

16 Insights into the Food, Beverage, and Consumer Products Industry
The CPG industry also suffered the consequences of a severe hurricane season in 2005. Hurricane Katrina disrupted oil refineries and resin factories, causing major plastics producers such as Dow Chemical, ExxonMobil, and Chevron Phillips Chemical Company to delay contracted deliveries. As a result of the lack of production capacity and increased price of oil (raw material used in the production of polyethylene teraphtalate [PET] resin), in November 2005, prices of plastic resins used for packaging were up 20 to 30 percent over August 2005.18
As shown in exhibit 13, the net result of these pressures is that the indexed growth of COGS for the industry rose by five percentage points from 2002 to 2005.
Looking forward, industry sentiment is that this issue will continue to influence the business environment. In PricewaterhouseCoopers’ Consumer Products Barometer survey for the second quarter of 2006, 73 percent of respondents cited energy prices as a potential roadblock to growth over the next 12 months, compared to an all-industries consensus of 54 percent.19
Yet oil is not the only commodity whose increased demand and diminished supply has pushed input prices to historical highs. Sugar prices reached a 25-year high in February 2006. Brazil, the world’s largest producer of sugar, contributed to the price rise by using it to produce ethanol as an alternative source of energy, decreasing the global sugar supply. Meanwhile, persistent drought in the Great Plains is creating wheat shortages and increasing wheat prices. The U.S. Department of Agriculture recently announced it expected the annual price of corn and wheat to go up 24 and 17 percent, respectively, over last year.20 In addition to the rising cost of commodity-based inputs, other expenses are squeezing the CPG manufacturers’ margins. For example, over the years CPG companies’ spending on advertising and media, trade promotion, and consumer promotion has been increasing as they compete to build brand strength and gain shelf presence.
18 Packaging Machinery Manufacturers Institute, “Rising Plastic Prices Squeeze End Users,” Food & Drug Packaging (December 1, 2005).
19 PricewaterhouseCoopers, Consumer Products Barometer (August 22, 2006).20 Timothy W. Martin, “Wheat Could Fuel Rise in Food Prices,” The Wall Street Journal (July 13, 2006).
2002 2003 2004 2005
Exhibit 13: COGS Indexed to 2002, CPG Industry
6%
5%
4%
3%
2%
1%
0%
Source: Reuters Global Fundamentals and PwC Analysis

17GMA Overview of Industry Economic Impact, Financial Performance, and Trends
ADDITIONAL PRESSURES: LIMITED PRICING POWER
CPG companies are not alone in confronting the challenge of rising input costs. An analysis of the value chain of the packaged food business shows that CPG companies and agribusinesses (suppliers) incurred higher COGS growth in the past three years than retailers (customers). See exhibit 14.
But as exhibit 15 shows, both retailers and agribusinesses have seen their operating margins rise, while CPG companies have experienced a slight decline.
As retailers consolidate and influence supplier terms, private-label competition intensifies, and consumers become more selective and value-conscious, it can be difficult for CPG companies to increase prices, especially in a mature, highly competitive domestic market.
Agribusiness CPG Retail
Exhibit 14: 2003–2005 COGS Compound Annual Growth Rate, Weighted Average
7%
6%
5%
4%
3%
2%
1%
0%
6.4% 6.4%
3.5%
Source: Reuters Global Fundamentals and PwC Analysis
CPG Agribusiness Retail
Exhibit 15: 2003-2005 Operating Profit Margin, Weighted Average
25%
20%
15%
10%
5%
0%
2003 20052004Source: Reuters Global Fundamentals and PwC Analysis

18 Insights into the Food, Beverage, and Consumer Products Industry
THE AGILE BUSINESS MODEL: FROM COST CUTTING TO MARGIN IMPROVEMENT
Forward-thinking companies in the industry are taking a close, hard look at their value chain, examining it from both input and output perspectives. We already explained on pages 12-14 how companies are redefining their relationships with customers and consumers as they become more open to new ways of targeted collaboration to create value. Many CPG companies are also forging new relationships with logistics providers and suppliers to achieve new efficiencies, and making other long-term operational changes such as gradually reducing their exposure to volatile commodities and streamlining portfolios to focus on core products (see sidebar pages 20-22). In some instances, leaders in the industry have been able to leverage their brand power to pass on cost increases to loyal consumers.
Below we look at some strategies that are contributing to healthier margins for successful companies in the CPG industry.
Improving Margins through Strategic OutsourcingThe first wave of outsourcing was defined by business process outsourcing (BPO), which involved contracting functions like IT infrastructure, finance and accounting, human resources, etc. to overseas suppliers. The defining characteristic of BPO was labor arbitrage—i.e., cutting costs by employing low-cost, skilled or unskilled workers in China, India, and other economies opening up to trade and foreign investment. Today, business leaders (both customers and suppliers) are charting the path to a different kind of outsourcing known as knowledge process outsourcing (KPO). BPO delegated processes to outsiders so organizations could concentrate on core processes and strategies. In contrast, KPO builds global delivery teams to support those core competencies. KPO is driven by a global talent pool and defined by diffusion and aggregation of knowledge across national boundaries.21
Within the CPG industry, The Procter & Gamble Company has adopted a flexible approach to its R&D strategy. Its CEO, A.G. Lafley, has declared that by 2010, half of all new P&G products will come from outside compared to only 20 percent now.22 In order to achieve this goal, the company has put outsourcing at the center of its innovation model. P&G has already made major operational changes and it estimates that currently 45 percent of its product-development initiatives have key elements that were discovered externally. Between 2000 and 2006, the company’s innovation success rate more than doubled, while R&D investment as a percentage of sales decreased from 4.8 percent to 3.4 percent.23
P&G’s strategy is less radical than it sounds. The company derives a strategic advantage from collaborative networks in its global supply chain, and it is applying the same principle to offshoring innovation. For example, it uses exclusive distributors in emerging economies, which increases the speed at which its products reach far-flung areas. It has the scale to ensure that these distributors earn healthy profits by focusing their attention only on P&G.24
The benefit of sourcing talent and innovation from around the world is clear: Companies can increase their pool of knowledge workers while keeping constant or even decreasing their costs of product development. Beyond cost savings, there are other competitive advantages to be achieved from outsourcing. Often, processes are outsourced to emerging economies like China and India where new consumers with rising incomes can be found. Collaborating with suppliers on areas like R&D in those locations can decrease time to market.
21 PricewaterhouseCoopers, Global Integration through Knowledge Process Offshoring (2005).22 Pete Engardio, “The Future of Outsourcing: How It’s Transforming Whole Industries and Changing the Way We Work,” Business
Week (January 30, 2006).23 Larry Huston and Nabil Sakkab, “P&G’s New Innovation Model,” Harvard Business Review (March 20, 2006).24 Datamonitor Company Profiles, The Procter & Gamble Company, SWOT analysis (June 17, 2006).

19GMA Overview of Industry Economic Impact, Financial Performance, and Trends
In a recent survey of Forbes 2000 companies conducted by Duke University and Archstone Consulting, 73 percent of respondents said offshoring was an important part of their growth strategy and 81 percent associated it with product development (R&D, product design, and engineering).25 The CPG industry has lagged behind others such as financial services and technology in exploiting the potential of outsourcing. Responders to the Consumer Products Barometer survey conducted by PricewaterhouseCoopers indicated that their three primary areas of outsourcing for large companies include manufacturing, back office accounting, and logistics/supply chains. However, the results indicate that a significant opportunity still exists to expand the co-sourcing and outsourcing of product development.
Exhibit 16: CPG Outsourcing Areas
Function
Companies Involved in Outsourcing Function (%)
Manufacturing 35%
Back office accounting 33%
Logistics/supply chain 30%
Research and development 15%
Marketing and sales 13%
Customer service 13%
Telemarketing 8%
Source: PricewaterhouseCoopers Consumer Products Barometer (Q1 2006)
India’s National Association of Software and Service Companies (Nasscom) estimates that by 2020 offshored engineering spend will have grown to between $150 and $225 billion as companies expand their global innovation capacities. The report focused on engineering outside of software and other IT-enabled services.26 As outsourcing in the area of product development becomes widespread and companies continue to look for further improvements in core processes, we expect more CPG companies to take advantage of the opportunity.
Without a doubt, outsourcing product-development-related functions entails its own set of risks. For example, the controls over intellectual property could be compromised in a country with IP protection laws that are less stringent than those in the U.S. But as outsourcing matures and enters a new phase, companies are also implementing effective governance and oversight structures to help manage risks.
Improving Margins by Leveraging the BrandEven as retailers drive a hard bargain and shoppers become more value-conscious, some in the CPG industry have been able to improve margins by refocusing their efforts on those areas which are most important to them and leveraging the strength of their brands to pass on cost increases.
One area in which this focus is evident is product portfolio management. Currently, the trend is for CPG manufacturers to focus on core products and services. With significant amounts of investment dollars available in their funds, private equity firms are facilitating divestiture of non-core holdings from CPG companies. The value of private-equity-backed acquisitions grew 79 percent between 2004 and 2005.27 In our private equity case study on page 20, we explore this trend more closely.
25 Duke University Center for International Business Education and Research and Archstone Consulting, 2nd Bi-annual Offshore Survey Results (December 2005).
26 Nasscom Press Release, “Globalisation of Engineering Services—The Next Growth Frontier for India” (August 3, 2006).27 Thomson Financial and PwC Analysis.

20 Insights into the Food, Beverage, and Consumer Products Industry
Trade promotion, a major cost component for CPG companies, is integral to building brands, and is another area where companies are focusing on driving more effective use of resources. The efficiency and effectiveness of trade promotion has always been a top concern for many manufacturers that believe they don’t get adequate return on investment. Just as CPG companies are streamlining their product portfolios to focus on core brands, they are also reallocating their marketing resources to where they can get the maximum return. For example, some brand owners understand that heavy promotions based on in-store discounts increase short-term sales but can erode the long-term value of the brand. These companies are increasing advertising and other consumer-oriented marketing effectiveness to enhance the strength and penetration of their brands.
Recently, some companies also have been able to pass on cost increases to their consumers in the form of higher prices. These large, powerful, and recognized brands have been able to increase organic revenue growth (and overall profitability) through higher wholesale prices while maintaining the overall value proposition for the consumer. These companies have been able to make these price increases hold based on the strength of their brands.
But the reality for many CPG companies is that they do not have the brand power to push price increases on to the marketplace. The industry is highly fragmented, with a spectrum of brand strength across companies within each segment. Some categories simply lack distinguishing features to the consumer and thus have little negotiating leverage with the retailer. But the few that wield tremendous brand power can leverage it to improve their margins.
28 Steve Rosenbush, “Fresh Barbarians at the Gates?,” BusinessWeek Online (June 13, 2006).29 PricewaterhouseCoopers Forecast, “M&A Will Remain Strong through 2006, But Could Peak Thereafter” (July 13, 2006).
Private Equity Is Facilitating Focus on Core Businesses
Private equity deals facilitate divesture of peripheral businesses, allowing CPG companies to focus on value-creating activities. For CPG companies, the timing has been fortuitous. Many companies in the industry are streamlining their product portfolios, divesting non-core businesses to concentrate on narrower and more strategic product lines.
Globally, the private equity market has been buoyant. With superior annual returns (15–20 percent or more) relative to public markets, more capital is being invested in private equity and its cash resources now exceed $300 billion.28 The share of private equity in the merger and acquisition market is at its highest level in nearly a decade, showing its increased involvement in bigger, more complex transactions.29 In the second quarter of 2006, private equity represented 30 percent of U.S. deal value compared to an average between 10 and 15 percent in the late 1990s.
Exhibit 17: Private Equity Share of Total Deal Value, 1997–Q3 2006
40%
30%
20%
10%
0%
Average: 15.3%
1Q 1
997
3Q 1
997
1Q 1
998
3Q 1
998
1Q 1
999
3Q 1
999
1Q 2
000
3Q 2
000
1Q 2
001
3Q 2
001
1Q 2
002
3Q 2
002
1Q 2
003
3Q 2
003
1Q 3
004
3Q 2
004
1Q 2
005
3Q 2
005
1Q
200
6
3Q 2
006
Source: Thomson Financial and PwC Analysis

21GMA Overview of Industry Economic Impact, Financial Performance, and Trends
The value of private-equity-backed acquisitions in the CPG industry increased 79 percent, from $1.5 billion in 2004 to $2.6 billion in 2005. Annualized 2006 data indicate that the rising trend is likely to continue at least in the short term.
The number of deals has also been rising. There were four more private-equity-backed acquisitions in 2005 compared to 2004 and 16 more compared to 2000.30
CPG products are attractive to private equity for a number of reasons. They are differentiated by brand, advertising, and marketing strategies, but basic operations do not change significantly from company to company. Private equity can concentrate on increasing the advertising and marketing effort around products to build up the brand. Consumer spending on CPG products is generally non-discretionary—i.e., does not fluctuate drastically even during economic downturn. This makes CPG businesses ideal for “defensive” investment strategies. Private equity firms can predict cash flows from them, forecast the time required to pay off debts, and plan their exit strategies.31
Access Private Equity to Sharpen Focus on Core BusinessesFor all CPG companies, big or small, capital in the form of private equity buyouts and investments has unlocked new opportunities by facilitating restructurings and streamlining of product portfolios, and funding expansion.
For example, ConAgra, a leading food producer, has made the strategic decision to focus firmly on the processed-food segment of its business. Many of its brands (such as Egg Beaters, Healthy Choice, Hunt’s, Orville Redenbacher’s, and Reddi-Whip) have high household penetration and are market leaders in their categories.32 As it focuses on its core brands, the company has been exiting the volatile fresh meat business in stages through divestitures by selling it to private equity firms. In 2002, analysts applauded when ConAgra transferred 54 percent of ownership of its beef and pork operations to a private equity venture led by Hicks, Muse, Tate & Furst, in a deal valued in excess of $1.4 billion.33 The new company, called Swift, operated as a joint venture for a little over two years until ConAgra sold its remaining stake to the private equity group in 2004, saying it wanted to concentrate on packaged food brands.34 Through divestures of its refrigerated meat businesses and improving supply chain
30 PwC Analysis of Thomson Financial data on announced mergers and acquisitions.31 Mergent Industry Reports, Food & Beverage – North America (April 1, 2006).32 Datamonitor Company Profiles, ConAgra Foods, Inc., SWOT analysis (August 12, 2006).33 Peter Thal Larsen, “ConAgra Beef and Pork Unit in $1.4 Billion Deal,” Financial Times (May 22, 2002), and John Taylor, “Omaha,
Neb.–Based Company to Transfer Majority Interest to Dallas Group,” Knight Ridder/Tribune Business News (May 24, 2002).34 “Hicks Muse Pays $194 Million for ConAgra Unit,” Associated Press Newswires (September 28, 2004).
2001 2002 2003 2004 2005 2006*
Exhibit 18: Private Equity Acquisitions of CPG Companies
70
60
50
40
30
20
10
0
$5,000
$4,500
$4,000
$3,500
$3,000
$2,500
$2,000
$1,500
$1,000
$500
$0
Cou
nt
Valu
e (in
mill
ions
)
Count Value ($) *annualized
Source: Thomson Financial

22 Insights into the Food, Beverage, and Consumer Products Industry
Improving Margins with Collaboration for Efficient ProcurementTraditionally, CPG companies have relied on procurement strategies that lock in fixed volumes at budgeted prices. Many also view procurement in terms of risk management and use financial hedges to reduce the impact of price volatility. These strategies, though useful, meet only short-term objectives. Today’s environment, in which the global fight for resources is intensifying right when pricing power is weakening, calls for a more robust and sustainable response. That is why instead of concentrating on fighting price variability, many CPG companies are making operational improvements that aim to reduce long-term dependency on raw materials.
and manufacturing capabilities, ConAgra is aiming to save more than $500 million a year by 2009. Simultaneously, it is growing its international operations by marketing its branded foods to industrial customers and retailers in Europe and Asia.35
Entrepreneurial U.S. companies in the CPG industry are capitalizing on the easy availability of global private equity capital to fund their ambitions. Glacéau, the marketer of nutrient-enhanced vitaminwater, electrolyte-enhanced smartwater, and flavor-enhanced fruitwater, recently received $677 million from the Indian conglomerate Tata Group. The $22 billion Tata picked up a 30 percent stake in Glacéau, and the deal offers tremendous growth potential for both entities. Glacéau, which competes with drinks such as Snapple and Gatorade in the U.S., will utilize the capital to improve the availability of its stocks in domestic retail outlets and explore international markets.36 Tata, owner of Tetley Tea, Good Earth Teas, and Eight O’Clock Coffee, would like to increase its presence in the North American beverage market, especially in a fast-growing segment like healthy beverages.
Private equity is always looking for the opportunity to buy undervalued businesses, reinvigorate them, and earn profits. Free from the pressure to meet the market’s short-term expectations, private equity can spend time and effort on thoroughly examining the business, implementing process and operational improvements, and improving the performance of their investments.37
Yet it would be speculative to predict how sustainable and enduring the current boom in the private equity market is, especially in an environment of rising interest rates. Improved performance of public markets could also depress the future supply of private equity. But for now, as the industry copes with rising input costs and squeezed margins, private equity is helping companies restructure and refocus their activities on profitable avenues.
35 Datamonitor Company Profiles, ConAgra Foods, Inc., SWOT analysis (August 12, 2006).36 Steve Rosenbush, “Tata Takes a Swig of Vitaminwater,” BusinessWeek Online (August 24, 2006).37 Steve Rosenbush, “The Allure of Going Private,” BusinessWeek Online (March 29, 2005).

23GMA Overview of Industry Economic Impact, Financial Performance, and Trends
38 “Sara Lee Corporation Makes Progress in Transforming Company to Drive Long-Term, Consistent Growth; Dozens of New Products Fill the Company’s Innovation Pipeline for Fiscal 2007,” Business Wire (September 18, 2006).
39 William Atkinson, “Centralizing Delivers New Procurement Value,” Purchasing.com (July 13, 2006).40 Ismail Serageldin, “The World Water Gap—World’s Ability to Feed Itself Threatened by Water Shortage,” Press Release, World
Commission on Water for the 21st Century (March 20, 1999).41 Andrew W. Savitz with Karl Weber, The Triple Bottom Line, John Wiley & Sons (2006). 42 Datamonitor Company Profiles, BASF Aktiengesellschaft, SWOT analysis (July 1, 2006).
Once again, new collaborative relationships are being formed to achieve strategic objectives. At Sara Lee, for example, procurement had historically been handled separately by each unit, but last year the company established a centralized, strategic procurement function.38 In addition to commodity buying and risk-management strategies, corporate-wide procurement is building long-term relationships with strategic suppliers. It has created cross-functional teams made up of purchasing, plant, and supplier representatives who participate in knowledge-sharing and problem-solving initiatives. For example, one team was able to reduce the number of packages some plants used. The company estimates that new ideas and the ability to implement them quickly resulted in annualized savings of about 10 percent.39
In many instances, operational improvements are extending beyond measures like reducing the size of packaging and the thickness of bottles. PepsiCo, for example, has redesigned its operations to confront the challenge of global water scarcity. It is estimated that by 2025, global population will have increased by three billion people, who will need 20 percent more water than is now available.40 At PepsiCo’s plant in water-scarce India’s state of Kerala, the company has created ponds to increase the recharge of the aquifer. Such efforts are integral to PepsiCo’s overall business strategy and operations. When the company calculates the return on investment of any project, it takes into account environmental and societal risks. Its operational decisions aim to increase profitability while minimizing environmental impact.41
Such efforts are being made by companies across many industries. Chemical companies, like those in the CPG industry, have extensive exposure on the buying side and limited ability to pass on cost increases to customers. The German chemicals giant BASF is examining its entire value chain from both input and output sides. BASF has made the concept of Verbund (a German word meaning “linked” or “integrated” to the maximum degree) central to its operating structure. At Verbund sites, byproducts of chemical reactions are turned into raw materials for other processes. For instance, many chemical processes release heat energy that BASF converts into steam to drive other processes. The success of this strategy is reflected in BASF’s operating margins, which at 9.7 percent were higher than the industry average of 8.5 percent in the 2001–2005 period.42
Managing input costs through long-term operational improvements contributes to healthier margins and makes businesses sustainable over time. This is a necessity for today’s companies because the supply-demand cycle of resources is becoming increasingly unpredictable. We also are in the age of global information explosion, where environmental and social concerns are actively debated. CPG companies, especially big brand owners, are often questioned about not only their activities but also about those of all entities along their supply chains. Sustainability is an important topic for CPG companies, and on the following pages we discuss it in more detail.

24 Insights into the Food, Beverage, and Consumer Products Industry
Sustainability: Proactively Adapting to Evolving Stakeholder Values
Stakeholders are scrutinizing CPG companies and holding them ethically accountable at all stages of their complex value chains, raising new reputation and compliance risks but also presenting new opportunities. The iconic status of big brands makes them easily identifiable targets, and CPG companies that own them face investor and consumer backlash if their actions are perceived to be against the interests of society at large. While some traditionally associate the term “sustainability” with the concept of eco-sensitive business, we define “sustainability” in a broader context in this report. Sustainability is the practice of realizing corporate benefits by embracing the values of stakeholders from the workplace, marketplace, community, and environment. To build sustainable businesses—i.e., those that seek to increase shareholder value by improving economic, social, and environmental performance—companies must actively engage with all their stakeholders. Listening to and partnering with consumers, regulators, suppliers, media, and nongovernmental organizations (NGOs) helps a business identify value drivers as well as risks. Companies that are doing this are shifting away from the traditional view of compliance (focused on laws and regulations or purely environmental in scope) to an enterprise-wide sustainability model linked to every business function and aligned to the company’s overall strategy and bottom line. By seeking the common good between the interests of their financial stakeholders and the interests of society at large (i.e., the non-financial stakeholders), some CPG companies are not only managing their risks better but also differentiating their brands in the marketplace.
STAKEHOLDERS EXPECT ETHICAL BUSINESS PRACTICES …
Concern about social and environmental issues is not new. What is new is the level of attention being paid to them by all stakeholders—customers, investors, regulators, competitors, consumer advocacy groups, and other NGOs—in this age of instant, ’round-the-clock communication and organized protest movements. Such is the awareness and activism around these issues that, according to Social Investment Forum, in the last decade growth in socially responsible investment (SRI) assets slightly outpaced that in all managed assets. SRI assets grew more than 258 percent, from $639 billion in 1995 to $2.29 trillion in 2005, while all managed assets rose 249 percent, from $7 trillion to $24.4 trillion.43
…RAISING THE STAKES FOR BRAND OWNERS
This trend is of particular significance for CPG companies because they are brand owners susceptible to reputational risk. The value of a brand comprises its tangible, functional attributes (no additives, fat-free, etc.) as well as intangible, emotional attributes (lifestyle, taste, etc.). Because consumers choose a brand for the distinctive qualities it represents, they are equally quick to punish that brand if they lose trust in it. This is almost immediately reflected in the company’s performance in the financial markets, which react quickly to news detrimental to corporate reputation.
In financial terms, brand value can be defined as the present value of expected future earnings accruing as a result of brand ownership.44 Increasingly, shareholders are demanding information about the strategy underpinning the brands’ expected future cash flows. In addition to business fundamentals such as market share and profitability, this strategy must encompass various areas such as product and packaging design, resource use, and labor standards. Exhibit 19 on the next page shows the full breadth of issues CPG companies must consider if they are to embrace this broader view of corporate sustainability.
43 Social Investment Forum, 2005 Report on Socially Responsible Investing Trends in the United States, 10-Year Review (January 24, 2006). The report identifies three core socially responsible investing strategies: screening portfolios and mutual funds based on environmental and social criteria, shareholder advocacy on these issues, and community investing that directs capital into communities underserved by traditional financial services.
44 PricewaterhouseCoopers, Predicting the Unpredictable: Protecting Retail & Consumer Companies Against Reputation Risk (2005).

25GMA Overview of Industry Economic Impact, Financial Performance, and Trends
FROM COMPLIANCE TO SUSTAINABILITY: STAKEHOLDER ENGAGEMENT IS BECOMING A CORE COMPETENCE
Business leaders are finding that a broad shift toward sustainability helps to maximize shareholder return. New stock market indexes, such as the Dow Jones Sustainability World Index and FTSE4Good Indexes, list companies that demonstrate good behavior on environmental, social, and economic dimensions. As a means to compare companies that have embraced sustainability with other high-performing companies, the indexed returns in exhibits 20 and 21 show that these two indexes outperformed the S&P 500 by 16 percent and 15 percent, respectively.
Exhibit 20: Indexed Return of FTSE4GOOD and S&P 500 Indexes
40%
30%
20%
10%
0%
-10%
-20%
-30%
-40%
Nov
01
Feb
02
May
02
Aug
02
Nov
02
Feb
03
May
03
Aug
03
Nov
03
Feb
04
May
04
Aug
04
Nov
04
Feb
05
May
05
Aug
05
Nov
05
Feb
06
May
06
Aug
06
S&P 500 FTSE4GOOD Global
Source: SunGard PowerData and PwC Analysis
Exhibit 19: Components of Corporate Sustainability in the Retail and Consumer Sector
Workplace Marketplace Environment Community
Employee Development• Training and skills development• Motivation and retention
Corporate Values• Embedding corporate responsibility
values at all levels of organization
Occupational Health and Safety• High OH&S standards across all
sites
Leadership
Employee Welfare
Risk Management
Remuneration• Fair remuneration in line with local
economy
Workplace Diversity• Equal opportunites• Diversity
Policies
Product Safety• Accurate labeling• Product/food safety
Responsible Products and Services• Responsible advertising• Demand for healthy/non–animal
tested/fair trade products
Labor Rights in the Supply Chain• Labor standards• Child labor
Business Conduct• Fair price for produce• Supplier payment terms• Business integrity
(bribery/corruption)
Stakeholder Engagement• NGOs• Local communities• Producer association
Reporting and Assurance
Energy and Transport• Factory/store energy consumption• Product miles (air/sea/road freight)
Global Warming/Emissions to Air• Product miles (air/sea/road freight)
Water Consumption/Pollution• Environmental liability/
contamination
Local Impacts
Chemical Use• Pesticides
Biodiversity• Genetically modified organisms
(GMOs)
Waste Management• Manufacturing waste• Recycling at end of product life• Packaging
Design• Product and packaging design• Factory/distribution network/store
design
Resource Use• Efficient, sustainable use of natural
resources
Community Investment
Economic Development
Human Rights• Upholding labor standards
Business-Related Community Programs• Supplier development programs
Corporate Giving
Exhibit 21: Indexed Return of Dow Jones Sustainabilityand S&P 500 Indexes
30%
25%
20%
15%
10%
5%
0%
-5%
Jan
05
Feb
05
Mar
05
Ap
r 05
May
05
Jun
05
Jul 0
5
Aug
05
Sep
05
Oct
05
Nov
05
Dec
05
Jan
06
Feb
06
Mar
06
Ap
r 06
May
06
Jun
06
Jul 0
6
Aug
06
S&P 500 Dow Jones Sustainability World
Source: SunGard PowerData and PwC Analysis

26 Insights into the Food, Beverage, and Consumer Products Industry
These companies are mapping risks related to social, political, and environmental factors by listening to and engaging with all stakeholders, such that stakeholder engagement has become a core competence like product development. Through a continuous and open dialogue with all stakeholders, these companies are identifying the long-term value drivers of their businesses. They have moved beyond activities such as managing costs in the supply chain to actively seeking competitive advantage through changes that differentiate their companies and brands. These companies are also actively communicating this view of their value to all stakeholders. This involves not only disclosing a range of financial and non-financial information relevant to the business’s long-term performance, but also demonstrating how issues are being managed.
Companies can actively communicate with their stakeholders on sustainability issues in a number of ways. Leaders in the CPG industry such as P&G, Unilever, PepsiCo, Coca-Cola, Nestlé, and Johnson & Johnson all publish sustainability reports that provide stakeholders greater transparency and accountability around these companies’ business operations.
Following are examples of how CPG companies and others have created significant value by incorporating stakeholder mandates related to social and environmental issues into their business strategy.
Engaging with Consumers: Find Fortune at the Bottom of the Pyramid45
Emerging economies are powering up the global economy, their long-term prospects look promising, and businesses are turning to them for driving growth and profitability. Last year, the combined output of emerging economies accounted for more than half of the global GDP (measured in terms of purchasing power parity) and this share is expected to increase rapidly. If IMF forecasts are borne out (with emerging markets notching up 6.8 percent growth per year on average over the next five years, compared to the developed world’s 2.7 percent), within 20 years two-thirds of the global output would come from emerging economies.46 Goldman Sachs has identified Brazil, Russia, India, and China (collectively, “BRIC”) as the biggest emerging economies, projecting that by 2050 the BRICs would comprise four of the world’s six largest economies (the U.S. and Japan being the other two).47
CPG companies are taking notice because consumer spending is on the rise in these countries. China’s growth rate of 9.9 percent in 2005 was driven not just by investment but also by private consumer spending (which accounted for a third of the growth). India’s consumer spending has grown at an average of 11.5 percent a year for more than a decade.48 Yet, CPG companies must also confront the reality of wide income inequalities in these countries: The fastest-growing markets are also where many of the world’s poorest people live. More than 4 billion potential consumers live on less than $2 a day. Making healthy, clean products affordable to these consumers is changing the way CPG products are produced and distributed.
In many of Unilever’s markets, consumers are deficient in iodine. In India, for example, the primary source of iodine for most people is salt, but most of the iodine in salt gets lost during storage, transportation, and cooking. Unilever’s subsidiary in India developed molecular encapsulation, now a patented technology, to protect iodine from external conditions while retaining the texture and flavor of salt.49 This process could have much greater impact. More than 740 million people in developing countries suffer from iodine deficiency disorders such as goiters, mental retardation, brain damage, congenital defects, and stillbirths. Following its success in India, Unilever worked with local businesses in Ghana to outsource the production of iodised salt to make it cost-competitive with raw non-iodised salt. It also worked with schools to drive an education program about the need for iodine in the diet.50
45 The term “fortune at the bottom of the pyramid” was coined by C. K. Prahalad, management consultant and professor of corporate strategy and international business at the University of Michigan Business School.
46 “The New Titans,” The Economist (September 16, 2006).47 Goldman Sachs, Dreaming with the BRICs: The Path to 2050 (2003).48 PricewaterhouseCoopers, “Globalization—What U.S. CEOs Think,” View, Issue 4 (July 2006).49 C. K. Prahalad, Fortune at the Bottom of the Pyramid: Eradicating Poverty Through Profits, Pearson Education (2005).50 PricewaterhouseCoopers, Corporate Finance Insights: Food Sector (2006).

27GMA Overview of Industry Economic Impact, Financial Performance, and Trends
Engaging with Consumers in Mature Markets: Profitably Deliver Health and Fitness SolutionsServing affluent consumers also requires continuous engagement with stakeholders so that their concerns are understood and demands served with innovative products and services. In the U.S., 31 percent of the population is obese, facing high risks of chronic illnesses such as diabetes, asthma, cardiovascular disorders, arthritis, and hypertension. The costs of delivering healthcare services and medication to obese people are 36 percent and 77 percent higher, respectively, than those to people with normal weight.51 The World Health Organization estimates there are more than 1 billion overweight and obese people in the world.
As public concern over this trend grows, consumers are demanding healthier foods and drinks, including more choice and specific information about ingredients. According to The Food Institute, nine out of ten consumers are concerned about the nutritional content of food. Citing a study sponsored by the United Soybean Board, The Food Institute reports that 74 percent of surveyed consumers have changed their eating habits due to nutritional or health concerns. And 87 percent considered nutritional labeling important when purchasing food.52 Not surprisingly, some of the fastest growing areas of food retail are in organic, natural, and health foods. Total sales of natural and organic items added up to $45.8 billion in 2004, which was nearly a 7 percent increase over 2003, according to The Natural Foods Merchandiser.53 An example of successful consumer-centric innovation in response to health concerns is Sara Lee’s Soft & Smooth bread, which contains 30 percent whole-grain flour but tastes a lot like white bread. Soft & Smooth is a top-selling brand, and Sara Lee is the industry leader with 5.7 percent of the U.S. market share.54
CPG companies are discovering that supporting healthier lifestyles contributes to healthier bottom lines. PepsiCo affixes a green “Smart Spot” label on product packages that meet specific nutritional criteria. Between 2004 (when the company first started this labeling) and 2005, the sales of Smart Spot products such as Baked Lay’s potato chips, Diet Pepsi, and Tropicana orange juice grew 13 percent, while other products grew only four percent.55 PepsiCo is also building Smart Spot playgrounds all over the country, in partnership with KaBoom!, a not-for-profit organization. Earlier this year, most large soft drinks companies, including PepsiCo and Coca-Cola, agreed to stop the sale of sugared beverages in schools and limit the calorie and portion size of other beverages. These are just a few examples in a myriad of ways the CPG industry supports healthier lifestyles. For additional examples, refer to the GMA Health and Wellness report.
Consumer activists frequently allege that companies use product labeling to gain advertising advantage. For example, some say that serving sizes can be manipulated to qualify for a 0g transfat label. In the current litigious environment, transparency around product and package labeling—be it nutrition, sourcing and manufacturing, or recycling—is not only the right but also the pragmatic thing to do. And as we discuss below, working with regulators on matters that concern the industry as well as society at large helps companies set the pace for change rather than wait for regulation to set the agenda for them.
51 OECD, Health at a Glance: OECD Indicators 2005 (2005).52 “Consumers Are Less Willing to Pay More for Healthier Foods,“ The Food Institute Report (November 7, 2005).53 “Organic Foods Have Room for Growth,” The Food Institute Report (December 12, 2005).54 Steven Gray, “How Sara Lee Spun White, Grain into Gold,” The Wall Street Journal (April 25, 2006).55 Chad Terhune, “Pepsi Outlines Ad Campaign for Healthy Food,” The Wall Street Journal (October 15, 2005).

28 Insights into the Food, Beverage, and Consumer Products Industry
Engaging with Regulators: Collaborate to Build Trust and ConfidenceAs with most industries, the CPG industry continues to cope with a web of existing or proposed regulatory requirements that could impact the industry’s profitability. In order to stave off unwarranted and/or discriminatory legislative and regulatory action, CPG companies are also aligning their business models to more closely work with regulators. Activity continues both on the state and federal levels. Some policy areas are more active than others, including environmental sustainability, interstate commerce, and advertising to children. However, one area that stands out is how the industry’s efforts to combat obesity and improve health and wellness among its consumer base has translated into collaboration with government to respond to the threat of federal and state legislation. Food and beverage companies have reformulated products to reduce calories and reduce or eliminate such items as sugar, sodium, and saturated and transfats. In addition, many companies have altered their marketing practices to increase the promotion of products with enhanced nutritional profiles and voluntarily worked with the Federal Trade Commission and other regulatory agencies to ensure advertising to children is appropriate in terms of age and nutritional profile.
Another important area in which manufacturers and retailers have taken the lead in forming a voluntary partnership with the government is homeland security. The imperative for private- and public-sector collaboration on increasing security in the global supply chain became evident after the terrorist attacks of September 11, 2001. As many as 17,000 containers arrive at U.S. ports every day, and are vulnerable to security threats. Preventive activities such as increased inspection and higher insurance premiums are costly.56 To respond to this challenge, in 2002 BP America, DaimlerChrysler, Ford, General Motors, Motorola, Sara Lee, and Target formed a partnership with U.S. Customs and Border Protection called the Customs-Trade Partnership Against Terrorism (C-TPAT).57 Under this program, companies applying for C-TPAT certification must prove that they as well as their suppliers and carriers are implementing all agreed-upon security measures. With this initiative, businesses are not only partnering with the government on national security but also receiving faster clearances at ports because certified companies are regarded as less risky.
Lessons can also be learned from other industries that have faced similar challenges and realized success through coordinated efforts to collaborate with regulatory agencies at an industry-wide level. In 1999, the world’s largest mining companies led the initiative to develop a sustainability assessment framework for the industry (now known as Seven Questions to Sustainability) because they felt it needed a “social license to operate.”58 Reflecting similar concerns, the American Forest & Paper Association has established a Sustainable Forestry Initiative (SFI) program. More than 150 million acres of forestland in North America are enrolled in it. All members of the association must adhere to a prescribed set of forestry principles that integrate harvesting of trees with conservation of the natural environment.
Such a proactive approach on public policy issues helps to build sustainable businesses, keeps industry ahead of regulation, and in fact allows it to shape regulation in a way that builds trust and confidence among stakeholders. Building a resilient and safe supply chain also requires companies to control and manage the ethical implications of sourcing from overseas, as we discuss on the next page.
56 Hau L. Lee, “Supply Chain Security: Are You Ready?,” Graduate School of Business and Stanford Global Supply Chain Management Forum, Stanford University (September 3, 2004).
57 “U.S. Customs, Industry Team Up on Border Security,” CNN.com (April 16, 2002).58 International Institute for Sustainable Development, Mining, Minerals, and Sustainable Development—North America, www.iisd.
org/mmsd.

29GMA Overview of Industry Economic Impact, Financial Performance, and Trends
Engaging with Constituents in the Supply Chain: Ethical SourcingCPG companies operate as parts of increasingly complex supply chains. On one end are customers with immense bargaining power, and at the other end are vendors who are pushed toward rapid delivery times at low prices. These supply chains extend into emerging economies whose local labor and environmental standards may not be in accordance with international good practices. As brand owners, CPG companies are often questioned about the activities of all their far-flung suppliers. Thus they are exposed to high levels of social, political, and environmental risks in their supply chains, which they must manage.59
Many in the industry are now coordinating their efforts to respond to this challenge—for example, by enhancing the prestige of products in which they have collective interest. The Ethical Tea Partnership monitors conditions of tea production around the world and encourages improvement where needed. It is entirely funded by its members, including Sara Lee, Unilever, Tetley, and Twinings, who invest more than $2.7 million a year into the organization. The popularity of ethical sourcing has been growing for some time: Fairtrade Labelling Organizations International estimates that between 2004 and 2005, Fairtrade-labeled sales across the world grew by 32 percent to over 168,863 metric tons. Nestlé, Kraft, Sara Lee, and P&G have all expanded their coffee offerings to include Fairtrade products.60
On pages 8-14, we described the growing power of retailers and its impact on the CPG industry. Large retailers may attempt to push the burden of demonstrating sustainability onto their suppliers in terms of sourcing and product formulations. But targeted collaboration in this area can be beneficial to both parties. Unilever’s concentrated detergent All contains less water and requires less plastic packaging than standard products and is cheaper to transport. The company labels it “small and mighty,” and Wal-Mart promotes it heavily as part of its eco-initiative.61
Seeking the common good between the interests of their financial stakeholders and the interests of the public (i.e., the non-financial stakeholders) lies at the heart of companies’ sustainability efforts. For both retailers and manufacturers, integrating ethical objectives with sourcing issues yields valuable opportunities such as product differentiation and increased dialogue with consumers. This is a benefit over and above one we analyzed on pages 22-23, where we considered the impact of better resource use (through operational improvements) on margins.
CPG companies that are ahead of the curve in today’s tough business environment are demonstrating agility in their business planning and actively implementing operational changes where needed. A greater degree of openness in business models, focused collaboration with customers and suppliers, and continuous engagement with consumers and other stakeholders are proving to be winning strategies. Successful CPG companies will continue to be judged by traditional measures such as market share, gross margin, and shareholder return. But their ability to show openness and flexibility in the new economy will be rewarded through increased market presence, improved cost structure, and long-term durability.
In the next section, we analyze how these trends have impacted the financial performance of the CPG industry across several key performance indicators.
59 PricewaterhouseCoopers, Corporate Finance Insights: Food Sector (2006).60 “Nestlé Launches Fair Trade Coffee,” BBC News online (October 7, 2005).61 Marc Gunther, “The Green Machine,” Fortune (August 7, 2006).

30 Insights into the Food, Beverage, and Consumer Products Industry
The CPG industry in the U.S. is diverse, highly fragmented, and offers a wide range of low-cost products to satisfy consumer needs. Companies range in size from small to large and produce a wide variety of goods for the U.S. economy. After a performance downturn in 2001 which impacted both the CPG industry as well as the U.S. economy overall, results have begun to rebound.
This section of the report provides a set of clear reporting metrics for our CPG industry group, with financial performance measured using several key metrics relevant to the industry. The companies analyzed herein represent the core food, beverage, and household product manufacturers. Metrics are provided based on fiscal year and are calculated using publicly available, company-specific information. A detailed summary of the methodology and sources can be found in Appendix B.
Industry Overview
The industry’s overall growth rate has maintained its recent positive trends. This overall growth is indicative of a rebounding U.S. economy, expansion into emerging markets, and the slight expansion of total U.S. spend on food and beverages.
That said, the industry continues to feel the effects of higher raw material prices in both food and beverage categories. Most significantly, however, in calendar years 2004 and 2005 the producer price index for petroleum reached its highest level since 1998, as shown in exhibit 24.
Section 3Company Size Affects Results: Financial Performance Benchmarking
Exhibit 22: Size Segmentations for Financial Reporting Benchmarking
Small companies $50M < net sales ≤ $500M
Medium companies $500 < net sales ≤ $4B
Large companies net sales > $4B
Very small companies net sales ≤ $50M
Very large companies net sales > $10B
2000–01 2001–02 2002–03 2003–04 2004–05
3.5% 3.1%
6.8%7.6%
8.6%
Exhibit 23: CPG Industry Median Net Sales Growth
15%
10%
5%
0%
Source: Reuters Global Fundamentals and PwC Analysis

31GMA Overview of Industry Economic Impact, Financial Performance, and Trends
In spite of all these pressures, median gross margins for the overall industry increased slightly. In an attempt to keep margins in check, the industry has worked hard to focus on cost cutting through improved asset utilization and employee productivity and some outsourcing.
However, a closer look at individual segments (e.g. food, beverage, and household and personal care products) indicates that many companies experienced a squeeze of margins. Of the three sectors, only food companies experienced improved gross margins, rising to a median rate of 33.9 percent, up from 33.7 percent a year ago. Margins for household and personal care products companies held steady at 50.3 percent. Beverage companies experienced a relatively steep drop-off in margin performance, as the median gross margin fell from 46.2 percent in 2004 to 44.4 percent in 2005.
1998 1999 2000 2001 2002 2003 2004 2005*
*denotes provisional
Exhibit 24: Food, Beverage, and Petroleum Producer Price Indexes (Indexed to 1995)
120
100
80
60
40
20
0
Food
and
Bev
erag
e
Pet
role
um
350
300
250
200
150
100
50
0
Food Beverage Petroleum
Source: International Monetary Fund
2000 2001 2002 2003 2004 2005
Exhibit 25: Employee Productivity of CPG Industry
$350
$300
$250
$200
$150
$100
$50
$0
Sal
es (0
00s)
per
Em
plo
yee
$231 $229 $233 $252
$279 $301
Source: Reuters Global Fundamentals and PwC Analysis

32 Insights into the Food, Beverage, and Consumer Products Industry
From a size perspective, growth of the overall median gross margin rate was primarily driven by small62 companies, which saw their median gross margin bounce back to 35.7 percent, after falling to 35.0 percent in 2004. However, while very large63 companies continued to reap the benefit of scale, posting median gross margins of 47.4 percent (approximately 7.5 percentage points higher than the overall CPG industry median), this was a decline from the 2004 rate of 48.1 percent, a five-year high. Additionally, margins for midsize64 companies declined from 34.5 percent in 2004 to 33.1 percent in 2005.
Much as significant efforts in cost reduction helped to keep margins in check at the overall industry level, the industry managed to keep SG&A costs under control too. Median SG&A expenses as a percent of sales essentially remained flat, but again, this was not the case across all companies. Very large companies have a considerably higher (7.5 percentage points) SG&A spend, and the gap appears to be increasing. In light of increased competition from private labels and the need to reach the discerning consumer, these companies are investing in brand-building and improving shelf presence.
The net result of this effort is that while EBIT continued to grow, it grew at a slower rate than sales. Median industry return on sales declined slightly from 10.3 percent in 2004 to 10.0 percent in 2005.
2000 2001 2002 2003 2004 2005
Exhibit 26: CPG Industry Median Gross Margin
50%
40%
30%
20%
10%
0%
39.1% 37.7% 37.8% 39.0% 39.5% 39.9%
Source: Reuters Global Fundamentals and PwC Analysis
2000 2001 2002 2003 2004 2005
Exhibit 27: Median Return on Net Sales
12%
10%
8%
6%
4%
2%
0%
8.2% 8.5%8.9%
9.8%10.3% 10.0%
Source: Reuters Global Fundamentals and PwC Analysis
62 2005 net sales between $50 million and $500 million.63 2005 net sales greater than $10 billion.64 2005 net sales between $500 million and $4 billion.

33GMA Overview of Industry Economic Impact, Financial Performance, and Trends
Not surprisingly, the market did not reward the declining growth rates and return on sales with great market returns. One-year median total shareholder return (TSR) for the CPG industry was 4.2 percent, a noteworthy drop relative to both three- and five-year returns. While TSR dropped across all sizes and industry segments, the negative effect was most heavily felt amongst the largest players, which exhibited the largest decline in sales growth rates.
5-Year Return 3-Year Return 1-Year Return
Exhibit 28: CPG Total Shareholder Return
20%
10%
0%
8.8%
12.2%
4.2%
Source: Thomson Financial, Yahoo Finance, and PwC Analysis

34 Insights into the Food, Beverage, and Consumer Products Industry
Overall CPG Industry (all companies > US$50M)
Net Sales Growth
20%
15%
10%
5%
0%
-5%
-10%2000–01 2001–02 2002–03 2003–04 2004–05
EBIT Growth
40%
30%
20%
10%
0%
-10%
-20%2000–01 2001–02 2002–03 2003–04 2004–05
Gross Margin
60%
50%
40%
30%
20%
10%
0%2000 2001 2002 2003 2004 2005
8.8%
12.2%
4.2%
Return on Sales
20%
15%
10%
5%
0%2000 2001 2002 2003 2004 2005
Return on Market Capital
20%
15%
10%
5%
0%2001 2002 2003 2004 2005
Return on Average Assets
20%
15%
10%
5%
0%2001 2002 2003 2004 2005
Inventory Turnover
12
8
4
0
Num
ber
of T
urns
2000 2001 2002 2003 2004 2005
SG&A as Percent Sales
40%
30%
20%
10%
0%2000 2001 2002 2003 2004 2005
Median Shareholder Return
20%
15%
10%
5%
0%
-5%5-Year Return 3-Year Return 1-Year Return
Top QuartileMedianBottom Quartile
Source: Reuters Global Fundamentals, Thomson Financial, Yahoo Finance, and PwC Analysis

35GMA Overview of Industry Economic Impact, Financial Performance, and Trends
FOOD COMPANIES
The food sector experienced a relatively steady year. Median sales growth rose for the third straight year, increasing slightly to 7.5 percent, up from 6.8 percent over 2003–2004. Combined with a general reduction in SG&A expenses relative to sales, this has driven moderate increases in operating profit (EBIT) growth. Additionally, the sector demonstrated growth in return on capital, posting a median return of 18.6 percent. Median return on sales and return on average assets declined to 7.4 percent and 8.6 percent, respectively.
While the median gross margin rose slightly to 33.9 percent, the majority of companies experienced a decline in gross margins as COGS growth outpaced sales growth. Based on double-digit growth in both net sales and EBIT, some of the strong performers include American Dairy, The J.M. Smucker Company, Chiquita Brands International, Overhill Farms, Peet’s Coffee & Tea, Tootsie Roll Industries, Hormel Foods Corporation, Flowers Foods, and Otis Spunkmeyer Holdings.
The steady rise of sales growth since 2002 and relatively stable margins have enabled the food sector to deliver the highest five-year shareholder returns (12.5 percent) for the CPG industry as a whole.
BEVERAGE COMPANIES
The beverage sector posted strong sales growth figures as the sector continued its five-year trend of increasing growth, with median sales growth jumping to 10 percent from 2004 to 2005. However, following a strong year in 2004, companies generally saw a decline in margins in 2005. Median gross margin declined slightly to 44.4 percent as COGS growth kept pace with or exceeded sales growth.
Additionally, SG&A expenses as a percentage of sales continued to rise to a median level of 31.8 percent in 2005. As SG&A and COGS expenses rose in relation to sales, the declines in performance were also reflected in the returns on capital, average assets, and sales. Several companies continue to stand out as high performers in a highly competitive industry with double-digit sales and EBIT growth. These include Hansen Natural Corporation, Molson Coors Brewing Company, Quilmes Industrial, Embotelladora Andina, Constellation Brands, Vermont Pure Holdings, Fomento Economico Mexicano, PepsiAmericas, PepsiCo, and Brown-Forman Corporation.
While total shareholder return for the year (10 percent) showed a decline from the 13.8 percent three-year return, the beverage sector continued to deliver the highest returns.
HOUSEHOLD AND PERSONAL CARE PRODUCTS COMPANIES
The household and personal care sectors experienced a decline in growth in 2005. Net sales growth declined from a median rate of 11.8 percent in 2004 to a rate of 8.1 percent in 2005. An even more pronounced decline was noted in growth of operating profit (EBIT), which fell from 22.1 percent in 2004 to 4.7 percent in 2005. However, median gross margins held steady at 50.3 percent, and median returns on average assets and capital increased to 13.1 percent and 24.8 percent, respectively.
Despite the general decline in the industry, several companies stood out as strong performers in 2005, continuing to demonstrate strong growth of sales and EBIT. These companies include Abbott Laboratories, Church & Dwight Co., Parlux Fragrances, The Procter & Gamble Company, Jarden Corporation, and Physicians Formula Holdings.
Even with the decline in sales growth, the household and personal care products sector continues to generate the highest gross margins and return on assets as companies keep costs in check.
Sector-Specific Analysis

36 Insights into the Food, Beverage, and Consumer Products Industry
Median Net Sales Growth
20%
15%
10%
5%
0%2000–01 2001–02 2002–03 2003–04 2004–05
Median EBIT Growth
40%
30%
20%
10%
0%
-10%2000–01 2001–02 2002–03 2003–04 2004–05
Median Gross Margin
60%
50%
40%
30%
20%
10%
0%2000 2001 2002 2003 2004 2005
Median Return on Sales
20%
15%
10%
5%
0%2000 2001 2002 2003 2004 2005
Median Return on Market Capital
20%
15%
10%
5%
0%2001 2002 2003 2004 2005
Median Return on Average Assets
20%
15%
10%
5%
0%2001 2002 2003 2004 2005
Median Inventory Turnover
12
8
4
02000 2001 2002 2003 2004 2005
Median SG&A as Percent Sales
40%
30%
20%
10%
0%2000 2001 2002 2003 2004 2005
10.0
4.8
3.5
13.812.5
11.5
8.0
12.5
7.3
Median Shareholder Return
20%
15%
10%
5%
0%5-Year Return 3-Year Return 1-Year Return
Household ProductsFoodBeverage
Household ProductsFoodBeverage
Num
ber
of T
urns
Source: Reuters Global Fundamentals, Thomson Financial, Yahoo Finance, and PwC Analysis
Sector-Specific Data
37GMA Overview of Industry Economic Impact, Financial Performance, and Trends
In this section we look separately at financial benchmarking metrics for small, medium, and large companies (see Appendix B for definitions of company size).65
In the past five years, financial performance in the CPG industry was marked by solid performance across the size spectrum, with large and small established companies driving progress, proving that brand strength and filling a niche are still keys to success.
LARGE COMPANIES (Net Sales > $4 Billion)
Performance of large companies continued to outpace that of both medium and small companies for most of the past six years, across many of the financial metrics analyzed in this report.
Large companies sought to create brand value and distinction through significant investment in advertising and marketing spend. SG&A expenses (which typically include marketing expenses, the cost of media, advertising, and related costs) as a percent of sales have been higher for large companies than for medium and small companies, with an average difference of approximately 4 percentage points over the past six years. As a result, these companies have reaped financial benefits. Median return on average assets and median return on sales for large companies have been higher than for medium and small companies for each of the past six years, by an average of approximately 3 and 5 percentage points, respectively. Similarly, large companies have enjoyed a higher gross margin than medium and small companies, by an average of approximately 9 percentage points during the same period. Median inventory turnover has also been higher for large companies than for medium and small companies, by an average of approximately one turn for each of the last six years.
However, the power of size has its limitations in the CPG industry. While still growing, large companies have experienced similar or lower growth than their smaller, more nimble brethren. For example, median net sales growth for medium or small companies has exceeded that of large companies for four of the past five years. Additionally, median profitability (EBIT) growth has been only slightly better for large companies than for medium and small companies in only two of the past five years. Furthermore, one-year, three-year, and five-year shareholder returns are actually the lowest for large companies.
Large companies have exhibited an increasing to relatively flat trend year-over-year for most metrics. For example, net sales growth rates, EBIT growth rates, return on sales, and SG&A expenses as a percent of sales increased by approximately 3, 1, 2, and 2 percentage points, respectively, over the time period from 2000 to 2005. Gross margin, return on assets, and inventory turnover experienced negligible change from 2000 to 2005.
MEDIUM COMPANIES (Net Sales $500 Million ≤ $4 Billion)
On the heels of steady improvement in financial performance during the prior four years, medium companies experienced a year of decline in many financial performance measures. Net sales growth declined to 8.0 percent after increasing almost 9.5 percentage points from 2000 to 2004. EBIT growth rates declined 6.6 percentage points to 3.3 percent, after growing approximately 9 percentage points from 2000 to 2004. Return on sales declined for the second straight year, falling approximately 1 percentage point to a rate of 7.8 percent.
In fact, when compared to large and small companies, medium companies demonstrated the lowest performance in median gross margin, EBIT growth, return on sales, and return on assets. This has been coupled with an approximately 4 percentage point decrease in SG&A expenses as a percent of sales.
Size-Specific Analysis
65 For all size-specific information: Reuters Global Fundamentals, Thomson Finance, Yahoo Finance, and PwC Analysis.

38 Insights into the Food, Beverage, and Consumer Products Industry
SMALL COMPANIES (Net Sales $50 Million ≤ $500 Million)
While the distinction in performance of small companies vis-à-vis medium companies is less pronounced across the years, several small companies have also sought to create brand distinction to capture niche markets. Small companies have slightly outperformed medium companies in gross margin, return on sales, return on assets, and profitability growth for most of the prior five to six years. Additionally, small companies have generated strong one-year, three-year, and five-year shareholder returns of 14 percent, 25 percent, and 15 percent, respectively.
After experiencing a sharp drop in net sales growth rates from the 2000–2001 period to the 2002–2003 period, median net sales growth rates increased through the 2004–2005 period for small companies. The top performers in net sales growth (Hansen Natural, American Dairy, Monterey Gourmet Foods, and Diamond Foods) attributed much of their growth to a focus on developing new and existing brand presence and/or to targeted acquisitions. Other than sales growth, small companies experienced relatively flat to decreasing trends over time.

39GMA Overview of Industry Economic Impact, Financial Performance, and Trends
Median Net Sales Growth
20%
15%
10%
5%
0%2000–01 2001–02 2002–03 2003–04 2004–05
Median EBIT Growth
20%
15%
10%
5%
0%2000–01 2001–02 2002–03 2003–04 2004–05
Median Gross Margin
60%
50%
40%
30%
20%
10%
0%2000 2001 2002 2003 2004 2005
13.9
5.5
2.2
24.7
14.1
10.6
15.314.3
6.6
Median Return on Sales
20%
15%
10%
5%
0%2000 2001 2002 2003 2004 2005
Median Return on Market Capital
20%
15%
10%
5%
0%2001 2002 2003 2004 2005
Median Return on Average Assets
20%
15%
10%
5%
0%2001 2002 2003 2004 2005
Median Inventory Turnover
12
8
4
02000 2001 2002 2003 2004 2005
Median SG&A as Percent Sales
40%
30%
20%
10%
0%2000 2001 2002 2003 2004 2005
Median Shareholder Return
40%
30%
20%
10%
0%5-Year Return 3-Year Return 1-Year Return
Large CompaniesMedium CompaniesSmall Companies
Large CompaniesMedium CompaniesSmall Companies
Num
ber
of T
urns
Source: Reuters Global Fundamentals, Thomson Financial, Yahoo Finance, and PwC Analysis
Size-Specific Data

40 Insights into the Food, Beverage, and Consumer Products Industry
Very small companies are defined as companies with sales of less than US$50 million in their last reported fiscal year. Many of these niche companies have emerged over the past decade, responding to evolving consumer demands by delivering affordable luxury, organic, and health-conscious products. The performance of these companies is highly variable across many of the metrics. For example, while median net sales growth for these companies in 2005 was 3.5 percent, it ranges from over 100 percent to -85 percent. Overall, these companies have not yet found their appropriate place either in or out of the marketplace.
These very small companies have seen slight improvements in most metrics over the past year. Median net sales growth continues to improve. For the first time in several years, return on sales, while negative, trended upward, and EBIT growth was positive. However, these improvements have not yet translated into either positive return on assets or shareholder return.
Two other trends of note with the very small companies are the level of SG&A spending and gross margins. As noted in previous sections, economies of scale are keys to performance in the CPG industry and these companies have not yet been able to generate scale. As such, SG&A spending as a percent of sales is considerably higher and gross margin is lower than in any of the other industry size segments. As these companies continue to grow or they become part of larger companies, they should begin to reap those scale benefits and improve their situation relative to the balance of the industry.
Very Small Companies

41GMA Overview of Industry Economic Impact, Financial Performance, and Trends
Median Net Sales Growth
20%
15%
10%
5%
0%
-5%
-10%2000–01 2001–02 2002–03 2003–04 2004–05
Median EBIT Growth
20%
10%
0%
-10%
-20%2000–01 2001–02 2002–03 2003–04 2004–05
Median Gross Margin
40%
30%
20%
10%
0%2000 2001 2002 2003 2004 2005
4.7%6.5%
-4.6%
Median Return on Sales
20%
15%
10%
5%
0%
-5%
-10%2000 2001 2002 2003 2004 2005
Median Return on Market Capital
20%
15%
10%
5%
0%
-5%
-10%2001 2002 2003 2004 2005
Median Return on Average Assets
20%
15%
10%
5%
0%
-5%
-10%2001 2002 2003 2004 2005
Median Inventory Turnover
12
8
4
02000 2001 2002 2003 2004 2005
Median SG&A as Percent Sales
60%
50%
40%
30%
20%
10%
0%2000 2001 2002 2003 2004 2005
Median Shareholder Return
20%
15%
10%
5%
0%
-5%
-10%5-Year Return 3-Year Return 1-Year Return
Num
ber
of T
urns
Source: Reuters Global Fundamentals, Thomson Financial, Yahoo Finance, and PwC Analysis
Very Small Companies’ Data

42 Insights into the Food, Beverage, and Consumer Products Industry
At the other end of the operating spectrum are those companies with net sales greater than US$10 billion in their last reported fiscal year. These companies have generally been operating for a long time, enjoy economies of scale, and are among the better performing companies as indicated by many metrics. Many of these companies have historically built and maintained success through considerable investment in product enhancements and new innovations. These companies also tend to face issues such as foreign currency and market fluctuation risk, and complexities associated with managing a global enterprise.
In 2005, the net sales growth of these companies declined relative to previous years as the companies already had accounted for the impact of some large acquisitions. This also led to a corresponding decrease in annual EBIT growth. The key component to point out here is that in the CPG industry, the bigger do perform better on some operational fronts. Specifically, these companies had a considerably larger return on sales (~15 percent) than large (> $4B in net sales) companies overall, as well as better gross margins. These companies also invest more heavily in their brands and sales in order to improve overall brand strength—and thus, SG&A spending is higher than at large companies overall, higher than the industry as a whole, and increasing over time. This is in stark contrast to companies with sales less than $4 billion, which are tightening their belts in order to remain profitable.
While generating shareholder returns slightly below the overall industry median, these companies remain the market leaders, driving innovation and collaboration across the supply chain.
Very Large Companies

43GMA Overview of Industry Economic Impact, Financial Performance, and Trends
Median Net Sales Growth
20%
15%
10%
5%
0%2000–01 2001–02 2002–03 2003–04 2004–05
Median EBIT Growth
20%
15%
10%
5%
0%2000–01 2001–02 2002–03 2003–04 2004–05
Median Gross Margin
60%
50%
40%
30%
20%
10%
0%2000 2001 2002 2003 2004 2005
5.6% 5.9%
0.3%
Median Return on Sales
20%
15%
10%
5%
0%2000 2001 2002 2003 2004 2005
Median Return on Market Capital
20%
15%
10%
5%
0%2001 2002 2003 2004 2005
Median Return on Average Assets
20%
15%
10%
5%
0%2001 2002 2003 2004 2005
Median Inventory Turnover
12
8
4
02000 2001 2002 2003 2004 2005
Median SG&A as Percent Sales
40%
30%
20%
10%
0%2000 2001 2002 2003 2004 2005
Median Shareholder Return
20%
15%
10%
5%
0%5-Year Return 3-Year Return 1-Year Return
Num
ber
of T
urns
Source: Reuters Global Fundamentals, Thomson Financial, Yahoo Finance, and PwC Analysis
Very Large Companies’ Data

44 Insights into the Food, Beverage, and Consumer Products Industry
In pages 4-7, we present the economic impact of the consumer packaged goods (CPG) industry on the U.S. economy. This appendix describes the methodology used for our calculations. Economic impact analysis estimates the effect an industry has directly on its suppliers through production changes, indirectly through the effect of suppliers’ subsequent changes in input needs, and induced through changes in household spending caused by changes in income generated from the direct and indirect effects.
Customarily, economic impact is derived using data available in input-output (I-O) production tables originally developed by Nobel laureate Wassily Leontief (1906–1999). These tables report how industries provide input to, and use output from, each other to produce value added (also known as the contribution to the nation’s output, or GDP). To derive these effects, we use the IMPLAN database and a software package created by MIG, Inc. to build I-O economic impact models. MIG, Inc. explains that IMPLAN follows closely the accounting conventions used by the U.S. Department of Commerce’s Bureau of Economic Analysis (BEA), the standard convention for I-O tables in the U.S. Additionally, we use the 2003 structural model as the foundation for our analysis, as it is the latest structural model available. Using this model, we assume that the structural relationship between industries has been unchanged between 2001 and 2004.
I-O tables are created using data from two sources. First, data from the U.S. Census Bureau’s annual survey provide information about industry and commodity output. Second, data from the U.S. Bureau of Labor Statistics include producer prices and BEA estimates of final demand and industry returns to labor and capital from annual national income and product accounts (NIPAs). Combined, these data create an I-O framework that balances and reconciles industry production and commodity usage.
An industry’s value added is equal to its gross output (which consists of sales or receipts and other operating income, commodity taxes, and inventory change) minus its intermediate inputs (which consist of energy, raw materials, semi-finished goods, and services that are purchased from domestic industries or from foreign sources). The three primary components of value added are return to domestic labor (compensation of employees), net return to government (taxes on production and imports less subsidies), and return to domestic capital (gross operating surplus). For each component there are three interdependent effects that must be derived mathematically: direct effects, indirect effects, and induced effects, or the effects resulting from household spending. The resulting set of multipliers calculated describes the change in output caused by one dollar change in final demand for a given industry. These multipliers allow us to determine the impact of CPG industries based on their final demand.
For each year between 2001 and 2004, we have derived the direct, indirect, and induced effects on employment, output, taxes, and thus contribution to GDP for 36 industries to create the CPG industry aggregation. The 36 industries were chosen as they are representative predominantly of the type of products considered to be packaged foods, beverages, and household non-durables. At the margin, there are some industries—such as animal slaughtering or paperboard container manufacturing—which partially could be considered consumer products but are not included in the analysis as part of the direct impact. Instead, they are included as an indirect component, providing inputs to CPG production. They were excluded from the analysis of direct impacts in order to make conservative assumptions. Over time, as the CPG industry continues to evolve and companies’ outputs change, we will adjust the industry inclusions accordingly.
The direct impact of each of the 36 CPG sectors is detailed in exhibit 29. The sectors are ranked by direct gross output in 2004.
Appendix AEconomic Analysis Methodology

45GMA Overview of Industry Economic Impact, Financial Performance, and Trends
Exhibit 29: Detail of the Direct Impact of the CPG industry
IndustryGross Output ($B)
Value Added ($B)
Employment Compensation ($B)
Employment (000s)
Soft drink and ice manufacturing 36.1 7.6 4.1 69
Fruit and vegetable canning and drying 32.5 8.4 3.9 81
Toilet preparation manufacturing 32.4 13.1 4.2 67
Fluid milk manufacturing 28.1 3.8 3.0 50
Bread and bakery product- except frozen- manufacturing 26.2 12.4 7.7 210
Cheese manufacturing 25.9 2.6 1.9 40
Breweries 23.6 10.8 2.6 28
Frozen food manufacturing 23.3 6.9 3.4 82
All other food manufacturing 18.9 4.5 3.2 69
Soap and other detergent manufacturing 18.6 5.6 1.9 24
Other snack food manufacturing 13.3 4.1 1.3 27
Cookie and cracker manufacturing 11.9 4.1 1.6 36
Dog and cat food manufacturing 11.2 1.7 0.8 11
Dry, condensed, and evaporated dairy products 10.7 3.0 0.9 14
Wineries 10.3 3.4 1.7 30
Sanitary paper product manufacturing 10.2 3.8 1.6 23
Confectionery manufacturing from purchased chocolate 10.1 3.4 1.4 33
Polish and other sanitation good manufacturing 9.4 5.7 1.7 22
Flavoring syrup and concentrate manufacturing 9.0 2.3 0.5 4
Breakfast cereal manufacturing 8.3 1.2 0.7 8
Ice cream and frozen dessert manufacturing 8.2 2.1 1.0 20
Sugar manufacturing 7.8 1.1 0.8 14
Distilleries 7.8 4.9 0.7 8
Mayonnaise, dressing, and sauce manufacturing 6.1 1.9 0.8 16
Fats and oils refining and blending 6.1 0.6 0.3 5
Spice and extract manufacturing 6.1 2.2 0.8 13
Coffee and tea manufacturing 6.0 1.0 0.7 12
Non-chocolate confectionery manufacturing 5.9 2.3 1.1 22
Roasted nuts and peanut butter manufacturing 5.0 1.2 0.5 12
Mixes and dough made from purchased flour 4.9 1.5 0.7 11
Confectionery manufacturing from cacao beans 4.0 1.1 0.5 8
Frozen cakes and other pastries manufacturing 3.8 1.5 1.1 27
Primary battery manufacturing 2.9 1.6 0.5 8
Creamery butter manufacturing 1.8 0.2 0.2 4
Dry pasta manufacturing 1.7 0.6 0.2 5
Tortilla manufacturing 1.7 0.6 0.4 12
Total 450.0 133.1 58.4 1,126
Source: Minnesota IMPLAN Group, Inc. and PwC AnalysisNote: Totals may not add up precisely due to rounding
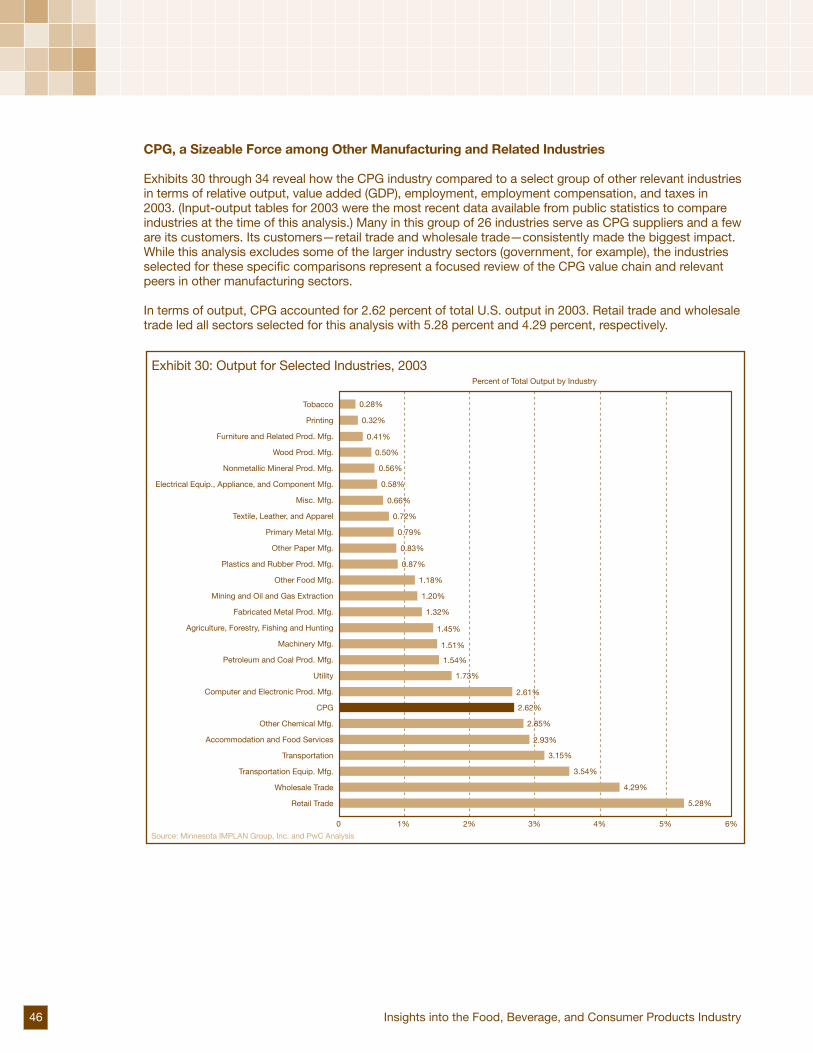
46 Insights into the Food, Beverage, and Consumer Products Industry
CPG, a Sizeable Force among Other Manufacturing and Related Industries
Exhibits 30 through 34 reveal how the CPG industry compared to a select group of other relevant industries in terms of relative output, value added (GDP), employment, employment compensation, and taxes in 2003. (Input-output tables for 2003 were the most recent data available from public statistics to compare industries at the time of this analysis.) Many in this group of 26 industries serve as CPG suppliers and a few are its customers. Its customers—retail trade and wholesale trade—consistently made the biggest impact. While this analysis excludes some of the larger industry sectors (government, for example), the industries selected for these specific comparisons represent a focused review of the CPG value chain and relevant peers in other manufacturing sectors.
In terms of output, CPG accounted for 2.62 percent of total U.S. output in 2003. Retail trade and wholesale trade led all sectors selected for this analysis with 5.28 percent and 4.29 percent, respectively.
Exhibit 30: Output for Selected Industries, 2003
Tobacco
Printing
Furniture and Related Prod. Mfg.
Wood Prod. Mfg.
Nonmetallic Mineral Prod. Mfg.
Electrical Equip., Appliance, and Component Mfg.
Misc. Mfg.
Textile, Leather, and Apparel
Primary Metal Mfg.
Other Paper Mfg.
Plastics and Rubber Prod. Mfg.
Other Food Mfg.
Mining and Oil and Gas Extraction
Fabricated Metal Prod. Mfg.
Agriculture, Forestry, Fishing and Hunting
Machinery Mfg.
Petroleum and Coal Prod. Mfg.
Utility
Computer and Electronic Prod. Mfg.
CPG
Other Chemical Mfg.
Accommodation and Food Services
Transportation
Transportation Equip. Mfg.
Wholesale Trade
Retail Trade
0.79%
0.72%
0.66%
0.58%
0.56%
0.50%
0.41%
0.32%
0.28%
0.83%
0.87%
1.18%
1.20%
1.32%
1.45%
1.51%
1.54%
1.73%
2.61%
2.62%
2.85%
2.93%
0 1% 2% 3% 4% 5% 6%
3.15%
3.54%
4.29%
5.28%
Percent of Total Output by Industry
Source: Minnesota IMPLAN Group, Inc. and PwC Analysis
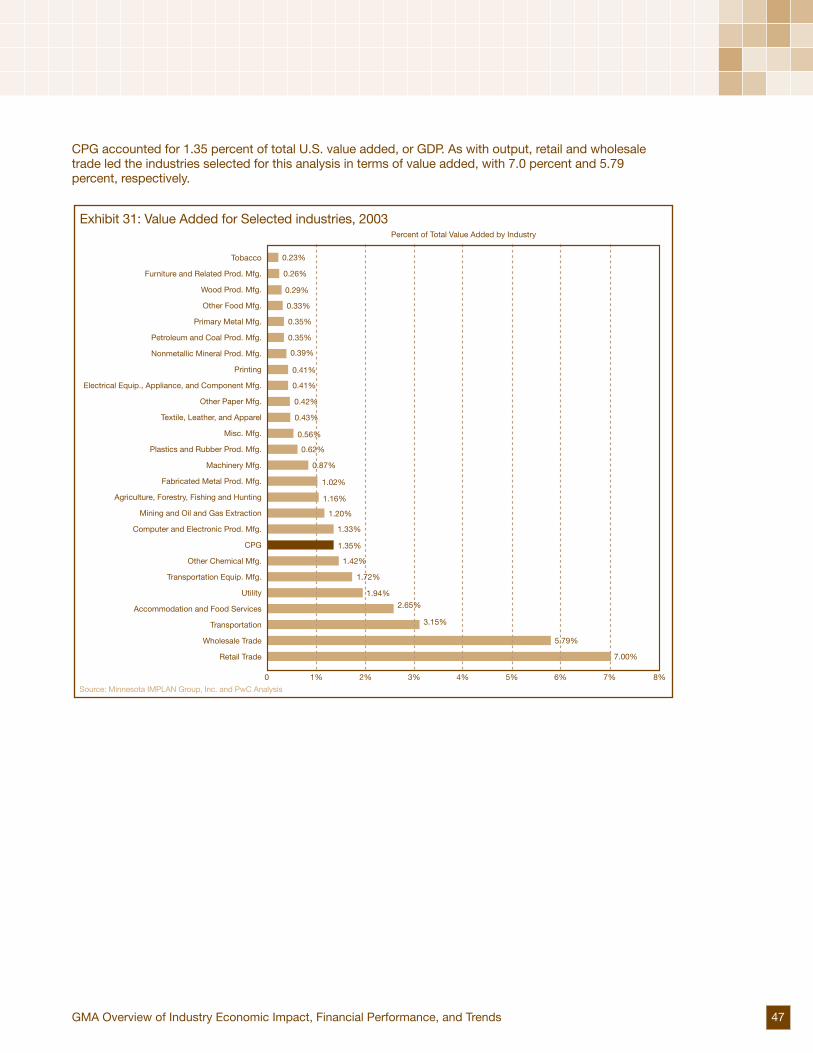
47GMA Overview of Industry Economic Impact, Financial Performance, and Trends
CPG accounted for 1.35 percent of total U.S. value added, or GDP. As with output, retail and wholesale trade led the industries selected for this analysis in terms of value added, with 7.0 percent and 5.79 percent, respectively.
Exhibit 31: Value Added for Selected industries, 2003
Tobacco
Furniture and Related Prod. Mfg.
Wood Prod. Mfg.
Other Food Mfg.
Primary Metal Mfg.
Petroleum and Coal Prod. Mfg.
Nonmetallic Mineral Prod. Mfg.
Printing
Electrical Equip., Appliance, and Component Mfg.
Other Paper Mfg.
Textile, Leather, and Apparel
Misc. Mfg.
Plastics and Rubber Prod. Mfg.
Machinery Mfg.
Fabricated Metal Prod. Mfg.
Agriculture, Forestry, Fishing and Hunting
Mining and Oil and Gas Extraction
Computer and Electronic Prod. Mfg.
CPG
Other Chemical Mfg.
Transportation Equip. Mfg.
Utility
Accommodation and Food Services
Transportation
Wholesale Trade
Retail Trade
0.41%
0.41%
0.39%
0.35%
0.35%
0.33%
0.29%
0.26%
0.23%
0.42%
0.43%
0.56%
0.62%
0.87%
1.02%
1.16%
1.20%
1.33%
1.35%
1.42%
1.72%
1.94%
0 1% 2% 3% 4% 5% 6% 7% 8%
2.65%
3.15%
5.79%
7.00%
Percent of Total Value Added by Industry
Source: Minnesota IMPLAN Group, Inc. and PwC Analysis

48 Insights into the Food, Beverage, and Consumer Products Industry
CPG accounted for 0.76 percent of all employment within the United States. In 2003, 1.3 million employees were working directly for CPG companies. Of the sectors selected for this analysis, those employing the largest percent of the workforce include the retail trade sector (employing 10.8 percent) and the accommodation and food services sector (employing 6.97 percent).
Exhibit 32: Employment for Selected Industries, 2003
Tobacco
Petroleum and Coal Prod. Mfg.
Electrical Equip., Appliance, and Component Mfg.
Other Paper Mfg.
Primary Metal Mfg.
Nonmetallic Mineral Prod. Mfg.
Utility
Furniture and Related Prod. Mfg.
Wood Prod. Mfg.
Other Food Mfg.
Mining and Oil and Gas Extraction
Printing
Misc. Mfg.
Other Chemical Mfg.
Plastics and Rubber Prod. Mfg.
Textile, Leather, and Apparel
Machinery Mfg.
CPG
Computer and Electronic Prod. Mfg.
Fabricated Metal Prod. Mfg.
Transportation Equip. Mfg.
Agriculture, Forestry, Fishing and Hunting
Transportation
Wholesale Trade
Accommodation and Food Services
Retail Trade
0.35%
0.34%
0.32%
0.30%
0.28%
0.28%
0.27%
0.07%
0.02%
0.40%
0.42%
0.43%
0.45%
0.47%
0.48%
0.51%
0.69%
0.76%
0.79%
0.88%
1.03%
2.40%
0% 2% 4% 6% 8% 10% 12%
3.25%
3.52%
6.97%
10.80%
Percent of Employment by Industry
Source: Minnesota IMPLAN Group, Inc. and PwC Analysis

49GMA Overview of Industry Economic Impact, Financial Performance, and Trends
In terms of employee compensation, CPG comprised 1.02 percent of the U.S. total in 2003. Top sectors selected for this analysis again include retail and wholesale trade, with 6.8 percent and 5.34 percent of employment compensation, respectively.
Exhibit 33: Employment Compensation for Selected Industries, 2003
Tobacco
Petroleum and Coal Prod. Mfg.
Wood Prod. Mfg.
Furniture and Related Prod. Mfg.
Other Food Mfg.
Nonmetallic Mineral Prod. Mfg.
Electrical Equip., Appliance, and Component Mfg.
Primary Metal Mfg.
Textile, Leather, and Apparel
Other Paper Mfg.
Printing
Misc. Mfg.
Agriculture, Forestry, Fishing and Hunting
Plastics and Rubber Prod. Mfg.
Mining and Oil and Gas Extraction
Utility
CPG
Machinery Mfg.
Other Chemical Mfg.
Fabricated Metal Prod. Mfg.
Computer and Electronic Prod. Mfg.
Transportation Equip. Mfg.
Accommodation and Food Services
Transportation
Wholesale Trade
Retail Trade
0.46%
0.46%
0.41%
0.39%
0.39%
0.34%
0.34%
0.24%
0.05%
0.47%
0.50%
0.57%
0.58%
0.60%
0.61%
0.78%
1.02%
1.10%
1.12%
1.16%
1.89%
2.45%
0 1% 2% 3% 4% 5% 6% 7% 8%
2.98%
3.68%
5.34%
6.80%
Percent of Total Compensation by Industry
Source: Minnesota IMPLAN Group, Inc. and PwC Analysis

50 Insights into the Food, Beverage, and Consumer Products Industry
The CPG industry accounted for 1.34 percent of total U.S. business taxes. Of the sectors selected for this analysis, top sectors included the retail trade industry and the wholesale trade industry, with 18.4 percent and 17.15 percent of total U.S. business taxes, respectively.
Exhibit 34: Business Taxes for Selected Industries, 2003
Furniture and Related Prod. Mfg.
Wood Prod. Mfg.
Printing
Misc. Mfg.
Textile, Leather, and Apparel
Electrical Equip., Appliance, and Component Mfg.
Nonmetallic Mineral Prod. Mfg.
Other Paper Mfg.
Plastics and Rubber Prod. Mfg.
Other Food Mfg.
Machinery Mfg.
Petroleum and Coal Prod. Mfg.
Fabricated Metal Prod. Mfg.
Primary Metal Mfg.
Transportation Equip. Mfg.
Computer and Electronic Prod. Mfg.
Other Chemical Mfg.
Agriculture, Forestry, Fishing and Hunting
Tobacco
CPG
Mining and Oil and Gas Extraction
Transportation
Accommodation and Food Services
Utility
Wholesale Trade
Retail Trade
0.19%
0.16%
0.12%
0.11%
0.11%
0.09%
0.07%
0.06%
0.04%
0.19%
0.20%
0.20%
0.22%
0.22%
0.37%
0.41%
0.51%
0.75%
0.86%
1.34%
1.76%
2.25%
0% 2% 4% 6% 8% 10% 12% 14% 16% 18% 20%
3.99%
4.26%
17.15%
18.40%
Percent of Business Taxes by Industry
Source: Minnesota IMPLAN Group, Inc. and PwC Analysis

51GMA Overview of Industry Economic Impact, Financial Performance, and Trends
In Section 3 we present several key metrics relevant to the CPG industry based on an analysis of financial data for a set of CPG companies. In this appendix, we describe the data sources used and the data preparation steps taken to produce these metrics.
Data Sources
Reuters Global Fundamentals was the primary source of data for the analysis presented in Section 3 of the report. The Reuters dataset includes annual financial data from 1999 through 2005, by fiscal year, for publicly traded companies. The report uses restated data that account for mergers, acquisitions, divestitures, and accounting changes. It is our understanding that Reuters makes no further adjustments to the actual values that the company reports, so that all data used to construct indicators in Section 3 are “as reported” by the companies.
Two variables used in the Financial Benchmarking analysis—share price and foreign exchange rate—are taken from alternate sources. Share price data are taken from Thomson Financial and Yahoo Finance. Exchange rates from Factiva were applied to data fields denominated in non-U.S. currencies.
Lastly, the study team utilized financial data for three private sector companies through a survey administered by GMA.
Company Choice
The companies analyzed in Section 3 were identified as companies that operate in the CPG industry. This designation is based on a company’s primary industry identified using the North American Industrial Classification System (NAICS). A total of 38 NAICS codes were identified that represent the core GMA manufacturing activities. These included NAICS codes across the food (26 NAICS codes), beverage (six NAICS codes), and household and personal care (six NAICS codes) sectors.66
Appendix BFinancial Performance Benchmarking Methodology
Exhibit 35: Distribution of NAICS Codes by Sector
Sector NAICS Code NAICS Code Description
Bev 312111 Soft drink manufacturing
Bev 312112 Bottled water manufacturing
Bev 312113 Ice manufacturing
Bev 312120 Breweries
Bev 312130 Wineries
Bev 312140 Distilleries
Food 311225 Fats and oils refining and blending
Food 311230 Breakfast cereal manufacturing
Food 311311 Sugarcane mills
Food 311312 Cane sugar refining
Food 311320 Chocolate and confectionery manufacturing from cacao beans
Food 311330 Confectionery manufacturing from purchased chocolate
Food 311340 Nonchocolate confectionery manufacturing
Food 311411 Frozen fruit, juice, and vegetable manufacturing
Food 311412 Frozen specialty food manufacturing
Food 311421 Fruit and vegetable canning
Food 311422 Specialty canning
Food 311511 Fluid milk manufacturing
Food 311512 Creamery butter manufacturing
Food 311513 Cheese manufacturing
Food 311514 Dry, condensed, and evaporated dairy product manufacturing
Food 311520 Ice cream and frozen dessert manufacturing
Food 311812 Commercial bakeries
Food 311823 Dry pasta manufacturing
Food 311911 Roasted nuts and peanut butter manufacturing
Food 311919 Other snack food manufacturing
Food 311920 Coffee and tea manufacturing
Food 311930 Flavoring syrup and concentrate manufacturing
Food 311941 Mayonnaise, dressing, and other prepared sauce manufacturing
Food 311942 Spice and extract manufacturing
Food 311991 Perishable prepared food manufacturing
Food 311999 All other miscellaneous food manufacturing
Household 311111 Dog and cat food manufacturing
Household 322291 Sanitary paper product manufacturing
Household 325611 Soap and other detergent manufacturing
Household 325612 Polish and other sanitation good manufacturing
Household 325620 Toilet preparation manufacturing
Household 335912 Primary battery manufacturing
66 Developed in conjunction with GMA.

52 Insights into the Food, Beverage, and Consumer Products Industry
Next, the 13,560 companies in the Reuters extract were matched to a primary industry using the NAICS code variable included in the Reuters dataset.67 Finally, the 38 CPG-related NAICS codes were used to generate a set of companies for inclusion in the analysis. Three private companies and 12 GMA members were then added to the set of companies for a total of 252 companies.68 Exhibit 35 gives the distribution of NAICS codes and NAICS code descriptions by sector used in Section 3 of the report.
Data Preparation and Metric Construction
The following data preparation steps were necessary before calculating financial benchmarking metrics.A total of 31 companies were identified as reporting financials in currencies other than U.S. dollars. Exchange rates from Factiva were applied to convert the financial data for these companies into U.S. dollars.
Eight companies were found to have changed their reported fiscal year starting and ending dates for at least one of the reporting periods. This resulted in duplicate data across fiscal years. The duplicate fiscal year observation was removed by annualizing the reported financials where necessary.
Data for selected companies were validated against 10-K filings to ensure that there were no inconsistencies between the 10-K filings and the data presented in Section 3.
Statistical software was then used to calculate each of the financial benchmarking metrics. Definitions for each metric can be found in Appendix D.
Data Reporting
Reported results utilize median and (where the sample size is large enough) quartile figures in order to minimize the effect of performance outliers on the overall benchmarking.
In the overall industry performance benchmarks, companies with less than US$50 million in net sales in their last reported fiscal year were excluded as their performance would have appreciably altered the median values. In order to provide insight, these “very small” companies are reported as a separate industry group.
Additionally, while they are included in the industry benchmark, we have provided another set of benchmark figures for “very large” companies—those with over US$10 billion in net sales in their last reported fiscal year.
Other size-based segmentations were defined using the following benchmarks (including any companies in the dataset with last reported net sales > US$50M):
• Small companies: $50M < net sales ≤ $500M• Medium companies: $500M < net sales ≤ $4B• Large companies: net sales > $4B
67 Reuters determines the dominant business segment of a company and then assigns, as the primary NAICS code, the NAICS code that describes that segment.
68 It should also be noted that nine companies were removed from the analysis because they trade on foreign exchanges, are inactive, or are wholly owned subsidiaries.

53GMA Overview of Industry Economic Impact, Financial Performance, and Trends
Appendix CFinancial Performance Benchmarking Company Listing
Abbott LaboratoriesAER Energy Resources, Inc.Alberto-Culver CompanyAlcoa Inc.Allied Domecq PLC (ADR)American Dairy, Inc.American Italian Pasta CompanyAmerican Water Star, Inc.Amway Japan Ltd. (ADR)Anheuser-Busch Companies, Inc.Aqua Clara BottlingArcher Daniels Midland CompanyArchibald Candy Corp.Armanino Foods of Distinction, Inc.Asconi CorporationAtlantic Wine Agencies Inc.Atlas Resources International, Inc.Avani International Group Inc.Avon Products, Inc.Azurel Ltd.B&G Foods, Inc.Barilla America, Inc.BASF AG (ADR)Battery Technologies Inc.Baywood International, Inc.BeautiControl, Inc.Ben & Jerry’s HomemadeBeringer Wine EstatesBestfoodsBig Rock Brewery Income Trust (USA)Birds Eye Foods, Inc.Block Drug Company, Inc.Boulder Specialty Brands, Inc.Brooklyn Cheesecake & Desserts Co.,
Inc.Brown-Forman CorporationCadbury Schweppes plc (ADR)Campbell Soup CompanyCargo Connection Logistics Holding,
Inc.Carson, Inc.Castle Brands, Inc.CCA Industries, Inc.Centennial Specialty Foods CorporationChalone Wine Group, Ltd.Chiquita Brands International, Inc.Church & Dwight Co., Inc.Clearly Canadian Beverage (USA)Coca-Cola Bottling Co. ConsolidatedCoca-Cola EnterprisesCoffee Holding Co., Inc.Colgate-Palmolive CompanyConAgra Foods, Inc.Constellation Brands, Inc.Cott Corporation (USA)Cruzan International, Inc.Cuisine Solutions, Inc.Darling International Inc.Davi Skin, Inc.Dean Foods Co.Dean Foods CompanyDel Laboratories, Inc.Del Monte Foods CompanyDeveloped Technology Resource, Inc.Diageo plc (ADR)
Diamond Foods, Inc.Doane Pet Care CompanyDreyer’s Grand Ice Cream Holdings Inc.Dryden Industries, Inc.Drypers CorporationDSG International LimitedDunwynn Exploration Inc.Ecolab Inc.Eldorado Artesian Springs, Inc.Electro Energy Inc.Elizabeth Arden, Inc.Embotelladora Andina S.A. (ADR)Enamelon, Inc.Energizer Holdings, Inc.Eskimo Pie CorporationEstee Lauder Companies, Inc.Exide TechnologiesFarmer Brothers Co.Flowers Foods, Inc.Flowers Industries, Inc.Fomento Economico Mexicano, S.A.Foster’s Group LimitedFrederick Brewing Co.Galaxy Nutritional Foods, Inc.Gales Industries Inc.General Mills, Inc.Genesee CorporationGeorgia-Pacific CorporationGlobal Beverage Solutions, Inc.Gold Kist Inc.Golden Enterprises, Inc.Golden State VintnersGordon Biersch Brewery Restaurant
Group, Inc.Greatbatch Inc.Green Mountain Coffee Roasters, Inc.Groupe Danone (ADR)Guest Supply, Inc.H.E.R.C. Products IncorporatedH.J. Heinz CompanyHanover Foods CorporationHansen Natural Corp.Heineken N.V. (ADR)Hibernia Foods plc (ADR)Hormel Foods CorporationHuman Pheromone Sciences, Inc.Hussmann InternationalHydron Technologies, Inc.Imagenetix, Inc.Imperial Sugar CompanyIntegrated Food Resources, Inc.Inter Parfums, Inc.Intercorp Excelle Inc.International Home FoodsInterstate Bakeries CorporationInventure Group, Inc.J&J Snack Foods Corp.Jarden CorporationJeremy’s Microbatch IceJohn B. Sanfilippo & Son, Inc.Johnson & JohnsonJones Soda Co. ( USA )Keebler Foods CompanyKellogg CompanyKimberly-Clark Corporation
Kirin Brewery Company, Ltd. (ADR)Kraft Foods Inc.Kyzen CorporationLancaster Colony Corp.Lance, Inc.Land O’Lakes, Inc.Leading Brand Inc.Lee PharmaceuticalsLifeway Foods, Inc.Lincoln Snacks CompanyL’OrealLucille Farms, Inc.M & F Worldwide Corp.Maui Land & Pineapple Company, Inc.MBC Holding CompanyMcCormick & Company, Inc.Medifast, Inc.Molson Coors Brewing CompanyMonsanto CompanyMontana Mills Bread Co., Inc.Montedison S.p.A. (ADR)Monterey Gourmet Foods, Inc.Nabisco Group HoldingsNabisco Holdings Corp.National Beverage Corp.NCH CorporationNestlé SANew Dragon Asia Corp.Northern Technologies International
Corp.Oak Ridge Micro-Energy, Inc.Ocean Bio-Chem, Inc.Ocean Spray Cranberries, Inc.Odwalla, Inc.OraLabs Holding Corp.Organic Food Products Inc.Otis Spunkmeyer Holdings, Inc.Overhill Farms, Inc.Owens-Illinois, Inc.Packaged Ice, Inc.Panamerican Beverages, Inc.Paradise, Inc.Paragon Trade BrandsParlux Fragrances, Inc.Payless Telecom Solutions, Inc.Peet’s Coffee & Tea, Inc.PepsiAmericas, Inc.PepsiCo, Inc.Physicians Formula Holdings, Inc.Pierre Foods, Inc.Pinnacle Foods Group Inc.Playtex Products, Inc.Pyramid Breweries Inc.Q.P. Corporation (ADR)Quaker Oats CompanyQuantrx Biomedical Corp.Quilmes Industrial (QUINSA) S.A. (ADR)R.H. Phillips, Inc.Ralcorp Holdings, Inc.Ralston Purina CompanyRavenswood Winery, Inc.Red Bell Brewing CompanyReddy Ice Holdings, Inc.Redhook Ale Brewery, IncorporatedRevlon, Inc.
Rocky Mountain Chocolate Factory, Inc.Royal Alliance Entertainment Inc.Royal Wessanen nv (ADR)SABMiller plcSara Lee Corp.Saratoga Beverage Group, Inc.Scott’s Liquid Gold Inc.Seneca Foods CorporationSherwood Brands, Inc.Shiseido Co. Ltd. (ADR)Southcorp Holdings Ltd. (ADR)Sovereign Exploration Associates
International, Inc.Sparta Foods, Inc.Spectrum Organic ProductsStearns & Lehman, Inc.Sterling Sugars, Inc.Styling Technology Corp.SUN Interbrew LimitedSuprema Specialties, Inc.Sweetheart Holdings Inc.Talisman Enterprises Inc.Tasker Products Corp.Tasty Baking CompanyTate & Lyle PLC (ADR)TCBY Enterprises, Inc.TenderCare International, Inc.The Boston Beer Company, Inc.The Classica Group, Inc.The Clorox CompanyThe Coca-Cola CompanyThe Dial CorporationThe Earthgrains CompanyThe Hain Celestial Group, Inc.The Hershey CompanyThe J.M. Smucker CompanyThe Lamaur CorporationThe Pepsi Bottling Group, Inc.The Procter & Gamble CompanyThe Robert Mondavi Corp.The Seagram Company Ltd.The Stephan Co.The Topps Company, Inc.The UniMark Group, Inc.ThermoLase CorporationTNR Technical, Inc.Tofutti Brands Inc.Tootsie Roll Industries, Inc.TreeHouse Foods, Inc.Ultralife Batteries, Inc.Unilever N.V. (ADR)United Foods, Inc.Vermont Pure Holdings, LtdVina Concha y Toro S.A. (ADR)Vitafort International Corp.Vlasic Foods International Inc.Welch Foods Inc.Wholesome & Hearty Foods CompanyWimm-Bill-Dann Foods OJSC (ADR)Wm. Wrigley Jr. CompanyYoCream International, IncZapata Corporation

54 Insights into the Food, Beverage, and Consumer Products Industry
Beverage manufacturers: Manufacturers of beverage products, including breweries and wine producers.
CPG manufacturers: Companies that manufacture food, beverage, and household and personal care products.
Debt to equity: Ratio of total debt to total book value of equity for the same fiscal year.
EBIT: Earnings from continuing operations, before interest and taxes.
Food manufacturers: Manufacturers of food products, including dry coffee and tea producers; frozen fruit, juice, and vegetable producers; and dry, condensed, and evaporated dairy product manufacturers.
Gross margin: Ratio of the difference of net sales minus cost of goods sold to net sales, for the same fiscal year.
Household and personal care manufacturers: Manufacturers of household and personal care products, including primary battery producers and producers of dog and cat food.
Inventory turnover: Cost of goods sold for a reported fiscal year divided by the average of the previous fiscal year’s and reported fiscal year’s total inventory.
Large companies: Companies with greater than $4 billion in net sales in their last reported fiscal year.
Market capital: Sum of total debt and total market value of equity.
Medium companies: Companies with greater than $500 million and less than or equal to $4 billion in net sales in their last reported fiscal year.
Net sales: Net sales as reported by a company. For companies that don’t report net sales, net sales is calculated by subtracting excise tax receipts and sales returns and allowances from gross revenue.
Return on average assets: EBIT for a reported fiscal year divided by the average of the previous fiscal year’s and reported fiscal year’s total assets.
Return on capital: Earnings before interest, taxes, and depreciation for a reported fiscal year, divided by the average of the previous fiscal year’s and reported fiscal year’s market capital.
Return on sales: EBIT for a reported fiscal year divided by net sales for that same year.
Selling, general, and administrative expense (SG&A) as a percent of sales: Ratio of selling, general, and administrative expense to net sales for the same fiscal year.
Shareholder return: Annualized percentage return from stock prices and reinvested dividends for a fiscal year end.
Small companies: Companies with greater than $50 million and less than or equal to $500 million in net sales in their last reported fiscal year.
Very large companies: Companies with greater than $10 billion in net sales in their last reported fiscal year.
Very small companies: Companies with less than $50 million in net sales in their last reported fiscal year.
Appendix DDefinitions

GMA and PwC professionals are available to discuss the data, analysis, and commentary in this report, as well as help you address the opportunities discussed within.
For further information, please contact: Stephen A. SibertGroup Vice President, Industry Affairs & MembershipGrocery Manufacturers Association(202) 337-9400
John G. MaxwellGlobal Consumer Packaged Goods Industry LeaderPricewaterhouseCoopers, LLP(973) 236-4780
Lisa Feigen DugalNorth American Retail and Consumer Packaged Goods Advisory LeaderPricewaterhouseCoopers, LLP(646) 471-6916
For additional copies of this report, please e-mail your request to [email protected]
© COPYRIGHT 2006 Grocery Manufacturers Association, Inc. and PricewaterhouseCoopers LLP. Reproduction of Insights into the Food, Beverage, and Consumer Products Industry: GMA Overview of Industry Economic Impact, Financial Performance, and Trends in any form is prohibited except with the prior written permission of both Grocery Manufacturers Association, Inc. (GMA) and PricewaterhouseCoopers LLP (PwC). GMA and PwC do not guarantee the accuracy, adequacy, completeness, or availability of any information and are not responsible for any errors or omissions or for the results obtained from the use of such information. GMA and PwC GIVE NO EXPRESS OR IMPLIED WARRANTIES, INCLUDING, BUT NOT LIMITED TO, ANY WARRANTIES OF MERCHANTABILITY OR FITNESS FOR A PARTICULAR PURPOSE OR USE. In no event shall GMA or PwC be liable for any direct, indirect, special, or consequential damages in connection with any use of the Insights into the Food, Beverage, and Consumer Products Industry: GMA Overview of Industry Economic Impact, Financial Performance, and Trends.
PricewaterhouseCoopers has exercised reasonable professional care and diligence in the collection, processing, and reporting of this information. However, the data used is from third-party sources and PricewaterhouseCoopers has not independently verified, validated, or audited the data. PricewaterhouseCoopers makes no representations or warranties with respect to the accuracy of the information, nor whether it is suitable for the purposes to which it is put by users.

Insights into the Food, Beverage, and Consumer Products Industry GMA Overview of Industry Economic Impact, Financial Performance, and Trends