insights on addressing water level variability
TRANSCRIPT
INSIGHTS ON ADDRESSING WATER LEVEL VARIABILITY
Presented by: Wendy Leger, Environment and Climate Change Canada Canadian Co-Chair, Great Lakes-St. Lawrence River Adaptive Management (GLAM) Committee
Changing Great Lakes Water Levels and Local Impacts May 17, 2016

Outline 2
¨ Water level variability – why worry? ¨ Integrated assessment / integrated
solutions ¨ Adaptive Management - It’s not easy

Lake Michigan-Huron Water Levels from January, 1918 to April, 2016
174.5
175.0
175.5
176.0
176.5
177.0
177.5
178.0
Elevationab
oveInternationa
lGreatLa
kesD
atum
(1985)
inmetres
Month- Year
MeasuredWaterLevel
Long TermMonthlyAverage(1918-2015)
Lakes Michigan/Huron Water Levels (IGLD 1985)
1986
2011 1964
1974
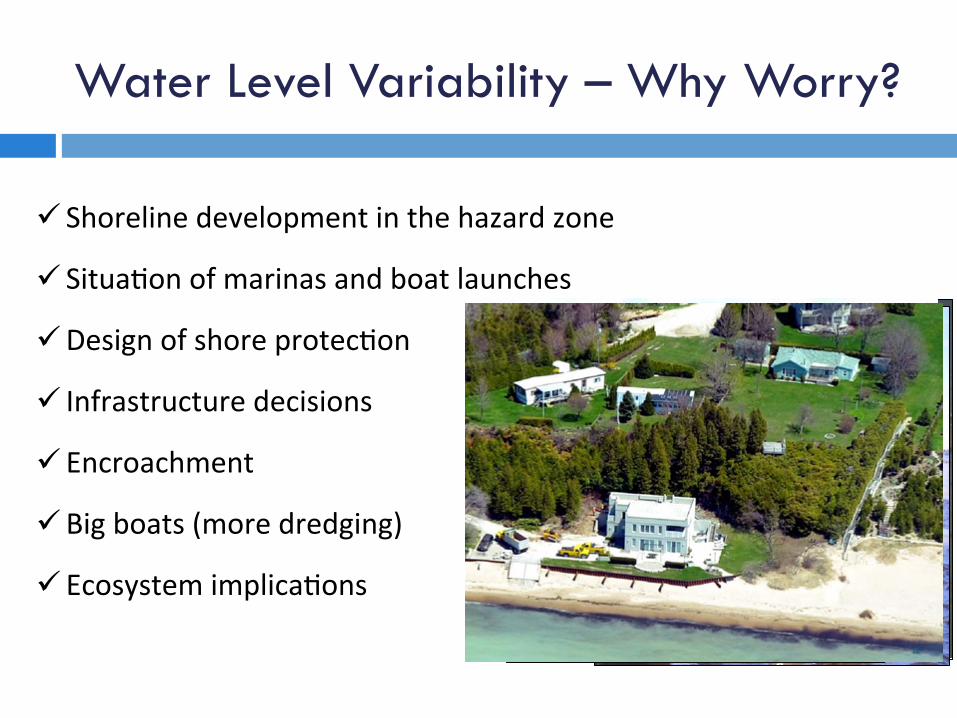
Water Level Variability – Why Worry?
Lake Michigan-Huron Water Levels from January, 1918 to April, 2016
174.5
175.0
175.5
176.0
176.5
177.0
177.5
178.0
Elevationab
oveInternationa
lGreatLa
kesD
atum
(1985)
inmetres
Month- Year
MeasuredWaterLevel
Long TermMonthlyAverage(1918-2015)
4
ü Shorelinedevelopmentinthehazardzone
ü Situa2onofmarinasandboatlaunches
ü Designofshoreprotec2on
ü Infrastructuredecisions
ü Encroachment
ü Bigboats(moredredging)
ü Ecosystemimplica2ons
Baird
Water Level Variability – Why Worry?

¨ Big storms ¨ Glacial isostatic adjustment
¨ Changing Ice conditions
¨ Natural changes in conveyance
¨ Erosion and deposition
¨ Changes in demographics ¨ Climate changes and uncertainty
5
Bing Maps
Water Level Variability – Why Worry?

Water Level Variability – Why Worry? Lake Michigan-Huron Water Levels
174.8
175.0
175.2
175.4
175.6
175.8
176.0
176.2
176.4
176.6
176.8
177.0
Elevatio
nabo
veInternation
alGreatLakesDatum
(1985)
inmetres
Month- Year
MeasuredWaterLevel
Long TermMonthlyAverage(1918-2015)
Lake Michigan-Huron Water Levels
174.8
175.0
175.2
175.4
175.6
175.8
176.0
176.2
176.4
176.6
176.8
177.0
Elevatio
nabo
veInternation
alGreatLakesDatum
(1985)
inmetres
Month- Year
MeasuredWaterLevel
Long TermMonthlyAverage(1918-2015)
Monthly Average Water Level in meters IGLD85
June 2013 June 2015
176.05 m 176.68 m
577.6 ft. 579.7 ft. Boat launch with reduced access to the water April 2013
Extended Beach April 2013
June 2015 - Reduced Beach - Water Level Closer to Homes
June 2015
June 2015
June 2013
June 2013
June 2015 - Better Boat Launch Access
Picture from April 2013
Tiny Township, ON Georgian Bay
Differenceof63cm(~25in)in2Years

Integrated Assessment 7
• Multiple objectives, multiple benefits, impacts and risks • Need to assess benefits, impacts and risks as a region
SAGINAW BAY - LAKE HURON
Coastal Property Owners
Photo Credit- dlpic
Commercial Shipping
Recreational Boating
Municipal and Industrial Uses
Ecosystem

1. Manage water levels and flows
8
2. Manage response to the impacts of water levels and flows
Integrated Solutions: Two Ways to Address Extremes
RecentIJCStudiesfocussedonhowtomanagefluctua2nglakelevelsinthefaceofuncertaintyoverfuturewatersupplies
IntegratedAssessmentworkfocussesonthis
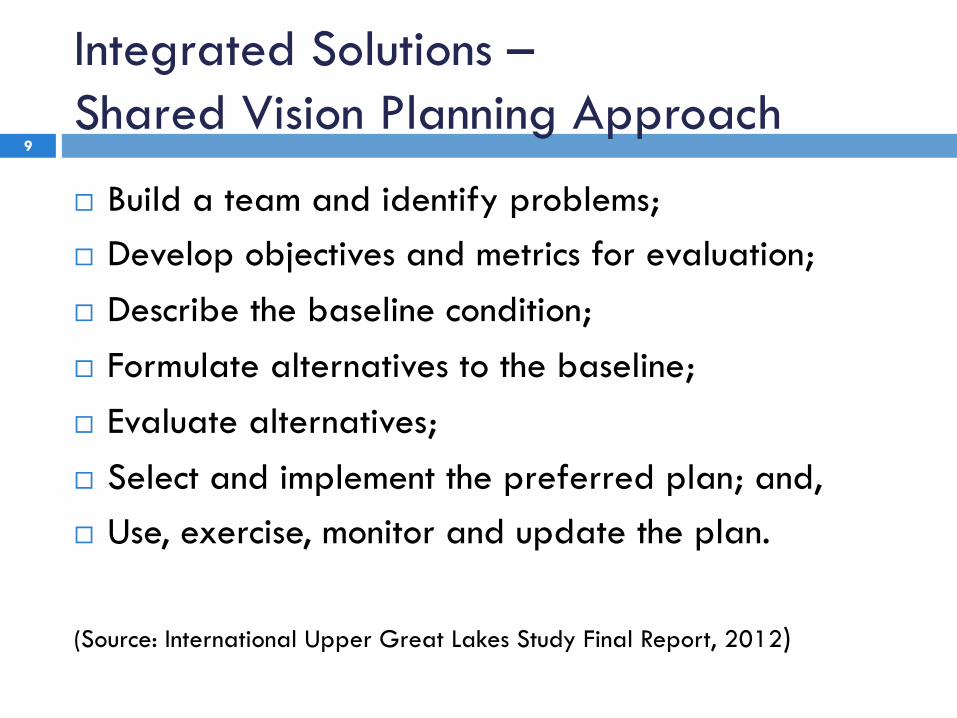
Integrated Solutions – Shared Vision Planning Approach
9
¨ Build a team and identify problems; ¨ Develop objectives and metrics for evaluation; ¨ Describe the baseline condition; ¨ Formulate alternatives to the baseline; ¨ Evaluate alternatives; ¨ Select and implement the preferred plan; and, ¨ Use, exercise, monitor and update the plan.
(Source: International Upper Great Lakes Study Final Report, 2012)

IJC Studies Recommend Adaptive Management
¨ Uncertainties in science and models
¨ Uncertainty due to climate changes
¨ Two most recent IJC Studies recommended Adaptive Management and a planning approach that links drivers (water levels and flows) to outcomes (performance indicators)
Uncertainty in climate
Uncertainty in impact evaluation
Photo courtesy of Port of Montreal
10

The Great Lakes-St. Lawrence River Adaptive Management Committee ¨ On January 2015 the IJC established the bi-national Great Lakes-
St. Lawrence River Adaptive Management (GLAM) Committee for on-going review of lake regulation plans
GLAM reports to all three Great Lakes Boards of Control
11

Adaptive Management
Adaptive Management (AM) Is an idea almost universally supported in theory Ø Make a decision based on best evidence
Ø Monitor key outcomes from the decision Ø Challenge the decision if the outcomes aren’t as expected
Ø Make necessary adjustments
12

Adaptive Management – It’s Not Easy
Adaptive management
A great concept almost never used in practice
It doesn’t fit the traditional funding model n Funding for a few years to support a decision analysis. n After the decision, funding stops
It requires collaboration n Many programs are managed
within silos
It requires working hypotheses - relating drivers to outcomes that can be tested and measured
n Many decisions are not tied explicitly enough to outcomes to know whether decisions require revisiting.
13

Understand the Drivers
Drivers: Water levels and Flows Understanding the Hydroclimate system, expected extremes and how they may be changing
14 Lighthousefriends.com
Stannard Rock

15 Ecosystems
DifficultyinDecisionMakingLinking Drivers to Outcomes Outcomes: What are we most worried about?

Linking Outcomes to Decisions
Decisions: Based on evaluations and comparison of performance indicators
16
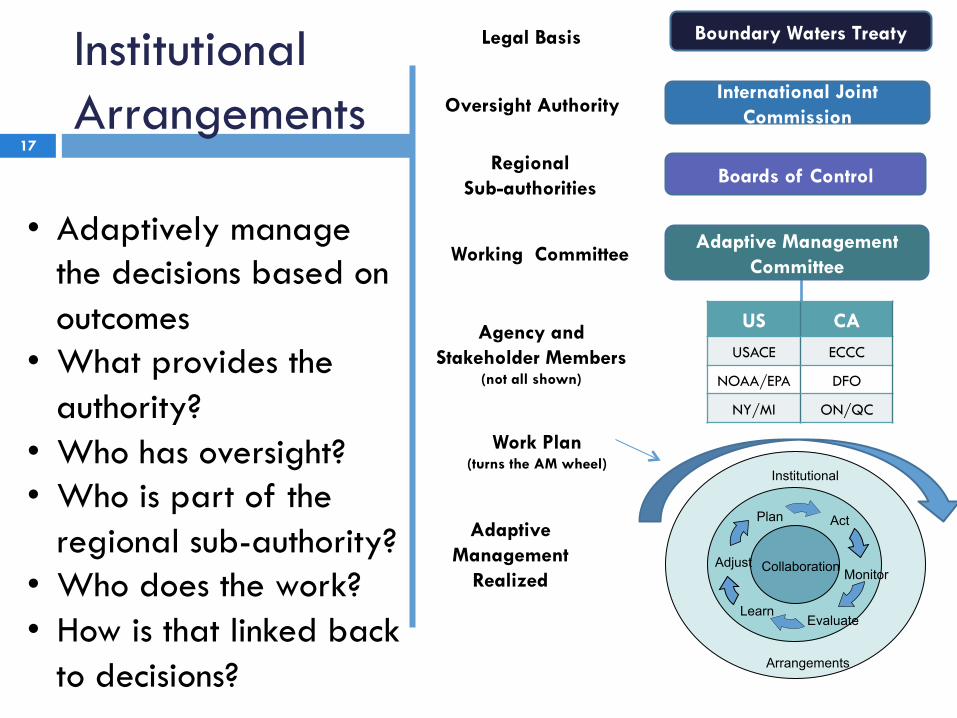
Institutional Arrangements
17
Legal Basis
Oversight Authority
Regional Sub-authorities
Working Committee
Agency and Stakeholder Members
(not all shown)
Adaptive Management
Realized
International Joint Commission
Boards of Control
Adaptive Management Committee
Institutional
Arrangements
Collaboration
Plan Act
Monitor
Evaluate Learn
Adjust
Work Plan (turns the AM wheel)
US CA USACE ECCC
NOAA/EPA DFO
NY/MI ON/QC
• Adaptively manage the decisions based on outcomes
• What provides the authority?
• Who has oversight? • Who is part of the
regional sub-authority? • Who does the work? • How is that linked back
to decisions?
Boundary Waters Treaty
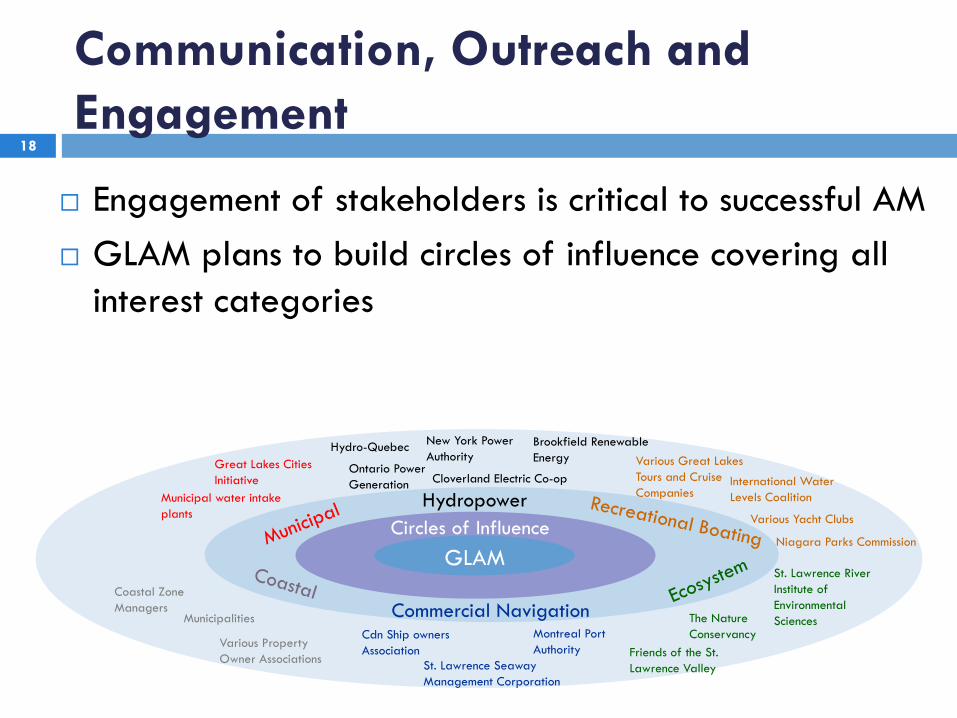
¨ Engagement of stakeholders is critical to successful AM ¨ GLAM plans to build circles of influence covering all
interest categories
Montreal Port Authority
St. Lawrence Seaway Management Corporation
Cdn Ship owners Association Friends of the St.
Lawrence Valley
St. Lawrence River Institute of Environmental Sciences The Nature
Conservancy
Great Lakes Cities Initiative
Municipal water intake plants
Ontario Power Generation
New York Power Authority
Hydro-Quebec
Cloverland Electric Co-op
Brookfield Renewable Energy
International Water Levels Coalition
Various Great Lakes Tours and Cruise Companies
Various Yacht Clubs
Niagara Parks Commission
Municipalities
Coastal Zone Managers
Various Property Owner Associations
Communication, Outreach and Engagement
Commercial Navigation
Coastal
Recreational Boating
Hydropower Circles of Influence
GLAM
18

Implementing Adaptive Management
¨ Administration ¤ Short and long term plans, budgets and practical
implementation guidelines ¤ Menu and schedule of reporting and engagement ¤ Quality management efforts, including peer review ¤ Information Management
19

Conclusion
¨ Adaptive management makes sense for addressing an uncertain world
¨ AM Requires: ¤ A long-term commitment ¤ Collaboration ¤ A measurable relationship between drivers
and outcomes (performance indicators) ¤ Institutional arrangements o Direct link from Outcomes to Decisions
o Revisit decisions through an Adaptive Management process and adjust as necessary
20

Acknowledgements: Daniel Ferreira, ECCC David Fay, IJC Bill Werick Debbie Lee, NOAA-GLERL Kyle McCune, USACE Mike Shantz, ECCC GLAM Committee
http://ijc.org/en_/GLAM
21