insights prime broker pressures - hfm.global · hfm insights breaks down these trends and examines...
TRANSCRIPT

P r o d u c t D i v e r s i f i c a t i o n
Identifying and alleviating the tensions in the manager-prime relationship
PRIME BROKER PRESSURES
INSIGHTS
September 2017

CONTENTS
Executive summary 3
Key findings 4
Methodology 6
Sources of tension 7
Revenue hurdles 14
Selection and oversight 21
Conclusion 28
Exhibits and citations 29

PB 3
The prime brokerage industry has under-
gone a significant transformation over
the last ten years, with little let up in
the regulatory and economic turmoil. This re-
port focuses primarily on the events of the last
five years and how they have shaped the way
prime brokers and their clients interact. Unu-
sually, the agents of change during this period
have been external forces rather than internal
policies, which may help to explain why the re-
lationship generally has not only become driv-
en by numbers, but also unapologetically more
formal.
In the first chapter, we provide the backdrop
against which these changes have taken place,
outlining the key events of the last five years
and identifying those primes winning business
in 2017 compared to 2012. This prompts an
exploration of the contemporary multi-prime
model, the uncomfortable reality for some
providers behind the rise in split mandates, as
well as the impact of various regulatory chang-
es, such as Basel III and Mifid II. Some primes, it
seems, are not doing as well as their numbers
on mandates and AuM might suggest.
We go on to analyse how prime brokers aim to
stay profitable, while also looking at which firms
have secured the best business, the size of man-
agers served and which strategies they employ.
Interviews with hedge fund and prime bro-
kerage professionals form the backbone for our
research, shining a light on behind-the-scenes
discussions. Contributors sat for research in-
terviews and, if a hedge fund, provided data
for our survey. We identify how the location of
a prime broker affects its trajectory and where
prime brokers, from differing locations, are like-
ly to be headed in the near future. HFM Insights
breaks down these trends and examines the
key drivers behind them.
Once the elephant in the room, revenue hur-
dles are now an explicit part of the conversa-
tion, as are fees. We provide ‘rules of thumb’
on the level of revenue primes expect and the
circumstances in which minimum hurdles are
imposed. At some primes, their bark is worse
than their bite. Several top tier providers are
showing interest in emerging managers again,
with at least one offering extended clemency
on hard targets.
The report’s final chapter explores the other
factors driving the selection and deselection of
primes, from a bank’s risk of default to the un-
dimmed importance of having one, if not two,
top tier providers. We identify those primes
holding ‘tier one’ status, an unsurprisingly
small group, albeit one with at least one nota-
ble absentee. Far from reducing their number
of tier one primes, many managers are aiming
for two ‘full’ relationships as a means to com-
pare, rank and squeeze their primes on fees.
External factors may be forcing primes to talk
tough with their clients, but managers, too, are
finding equally practical means to push back.
EXECUTIVE SUMMARY
At some primes, their bark is worse
than their bite. Several top tier providers
are showing interest in emerging
managers again, with at least one offering
extended clemency on hard targets
4 5
KEY FINDINGS
Rises in split mandates have papered over the cracks in some prime brokerage businesses
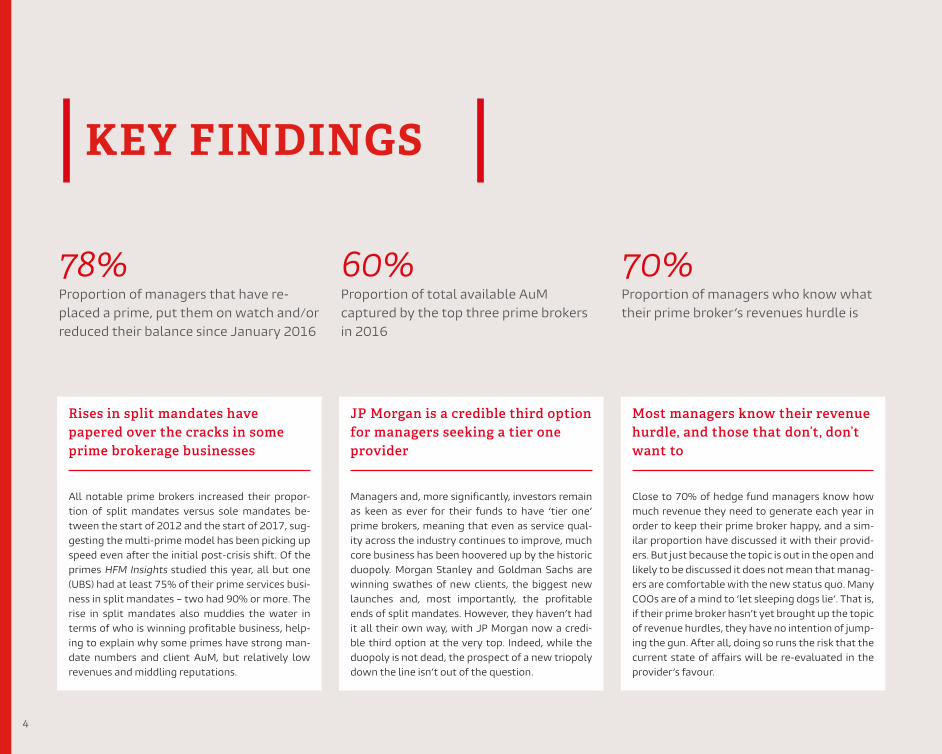
All notable prime brokers increased their propor-tion of split mandates versus sole mandates be-tween the start of 2012 and the start of 2017, sug-gesting the multi-prime model has been picking up speed even after the initial post-crisis shift. Of the primes HFM Insights studied this year, all but one (UBS) had at least 75% of their prime services busi-ness in split mandates – two had 90% or more. The rise in split mandates also muddies the water in terms of who is winning profitable business, help-ing to explain why some primes have strong man-date numbers and client AuM, but relatively low revenues and middling reputations.
JP Morgan is a credible third option for managers seeking a tier one provider
Managers and, more significantly, investors remain as keen as ever for their funds to have ‘tier one’ prime brokers, meaning that even as service qual-ity across the industry continues to improve, much core business has been hoovered up by the historic duopoly. Morgan Stanley and Goldman Sachs are winning swathes of new clients, the biggest new launches and, most importantly, the profitable ends of split mandates. However, they haven’t had it all their own way, with JP Morgan now a credi-ble third option at the very top. Indeed, while the duopoly is not dead, the prospect of a new triopoly down the line isn’t out of the question.
Most managers know their revenue hurdle, and those that don’t, don’t want to
Close to 70% of hedge fund managers know how much revenue they need to generate each year in order to keep their prime broker happy, and a sim-ilar proportion have discussed it with their provid-ers. But just because the topic is out in the open and likely to be discussed it does not mean that manag-ers are comfortable with the new status quo. Many COOs are of a mind to ‘let sleeping dogs lie’. That is, if their prime broker hasn’t yet brought up the topic of revenue hurdles, they have no intention of jump-ing the gun. After all, doing so runs the risk that the current state of affairs will be re-evaluated in the provider’s favour.
60%Proportion of total available AuM captured by the top three prime brokers in 2016
70%Proportion of managers who know what their prime broker’s revenues hurdle is
78%Proportion of managers that have re-placed a prime, put them on watch and/or reduced their balance since January 2016

4 5
Tier one primes expect at least $300-400k from their established prime services clients
Most brand-name prime brokers will expect their established clients to generate at least $300k a year in prime services revenue to maintain service levels, although tier one primes will be looking for closer to $400k. Clients failing to hit these targets will have their predicament flagged by their provider and, in some cases, be asked to write a cheque for the difference or dropped altogether. But even cli-ents generating such revenues will be looking over their shoulders. For a manager to be comfortable in its relationship with a tier one prime broker, they will need to generate at least $600-700k a year, ideally over $1m.
Managers are questioning the value of their primes’ cap intro and consulting teams
Teams providing ‘value add’ services at a prime bro-ker face an uncomfortable few years as new regu-lation and a cultural shift away from ‘relationship’ themed services threaten their relevance. Many European managers are nervous that their prime brokers are going to start allocating significant cost to the value of their value-add services, such as cap intro, as part of the unbundling of fees through Mifid II, promoting push back from all their investors. Managers are also questioning the value of consult-ing teams who, with fewer start-ups on the ground, will continue to thin out as resources are directed elsewhere.
‘Back-up’ status has seen Credit Suisse fall behind in the race for the top three
Credit Suisse has established itself as the top prime broker in Europe and, for a fair while, the third prime broker globally. However, its revenues in 2016 were behind those of several peers on both sides of the Atlantic, and its client AuM saw it slip back to fourth place in the US rankings. Many managers are using Credit Suisse as a ‘back up’ or ‘paper’ prime, a pro-vider hired primarily to offer geographical credit risk diversification, sitting alongside, typically, US primes providing the core services package. Market hearsay suggests the Swiss bank may be back on the up fol-lowing a successful reorganisation of its prime re-sources.
Managers are pushing back on fees by pitting their primes against each other
Those managers who can, are splitting their core prime business between two tier one providers who will then compete for the profitable ends of the book. This ‘full dual model’ is allowing managers to compare and rank their primes across a range of variables and drive down fees accordingly. Before a second tier one prime is added, a manager is likely to have one or two primes providing counterparty risk relief and/or additional niche services. Not every hedge fund firm has the asset class or AuM to imple-ment such a strategy. Among those well positioned are long/short equity managers with at least $150m in AuM.
Movement last year in Deutsche Bank’s CDS spread had adverse effects elsewhere
Goldman Sachs and Morgan Stanley may still be the ‘gold standard’ with regards to prime service and sta-tus, but the close correlation in their credit default swap (CDS) spread has prompted some managers to take an either-or approach. This follows the issues at Deutsche Bank last year. The uptick in the German bank‘s CDS price spread saw several prime clients move assets from close relationships, although its mandate total at the start of 2017 suggests any re-gression in client numbers has been clawed back. A bank’s CDS is still the most popular means managers have for checking the health of their prime services providers.
Start-up funds are back en vogue, but some primes are more forgiving than others
Most larger prime brokers have started looking at emerging managers again after a nervous post-Basel III period spent culling smaller clients. Several pro-viders have launched emerging manager platforms designed to cater for start-ups, each with premium services and minimal revenue requirements. How-ever, the goodwill lasts longer at some platforms than at others. Morgan Stanley has built itself a rep-utation for being particularly generous with smaller managers, imposing no revenue hurdle or time limit, and ensuring service levels – and perks – are main-tained when performance dips. Other primes will have notably less patience.

6 PB
The findings in this report were based
on three primary sources: research
interviews conducted in person and
over the telephone, a proprietary online sur-
vey, and analysis of in-house and third-party
data. Research was gathered between April
and June 2017. In total, more than 50 firms
contributed to our research. These were pri-
marily hedge funds represented by opera-
tions staff, as well as service providers and
investors.
Several of the exhibits in the report use
data from HFM’s annual prime brokerage sur-
veys, produced by Absolute Return for the US
(data as of April/May), EuroHedge for Europe
(data as of February/March), and AsiaHedge
for Asia (data as of as February/March).
The calculation method for the US survey
changed in 2017 to include additional AuM
data from firms listed in HFM’s ‘billion dollar
club’ rankings.
METHODOLOGY
Prime broker mandate AuM market share - US
Prime broker mandate AuM market share - Europe
Prime broker mandate AuM market share - Asia
160+160+130+110+60+60+50+50+40+20+160=
100+80+100+170+70+40+50+120+40+50+180=
160+10+170+130+90+60+40+100+10+30+200=
Goldman Sachs 17%
Goldman Sachs 10%
Goldman Sachs 17%
Morgan Stanley
13%
Morgan Stanley
10%
Morgan Stanley
17%
Deutsche Bank 6%
Deutsche Bank 7%
Deutsche Bank 9%
Citi5%
Citi5%
Citi4%
Barclays4%
Barclays4%
Barclays1%
Other16%
Other18%
Other22%
J.P. Morgan16%
J.P. Morgan8%
J.P. Morgan1%
Credit Suisse11%
Credit Suisse17%
Credit Suisse13%
BAML6%
BAML4%
BAML6%
UBS 5%
UBS 12%
UBS 10%
HSBC3%
BNP Paribas2%
HSBC5%

7
SECTION 1
SOURCES OF TENSION
Amidst global economic turmoil, regulatory upheaval and increasing competition, the relationship between hedge fund manager and prime broker has become as much a source of tension as it has one of revenue. Prime brokers are being squeezed by rising operational costs and a reduced ability to lend, with hedge funds feeling the after-effects. As a result, the context in which these tensions have developed is an important ingredient in any remedy for the ills in the relationship, and is the natural starting point for this report.

8 9
Drama and upheavalThe events of the past five years have been as
consequential as they have been dramatic (Ex-
hibit 1.1), altering the prime brokerage land-
scape significantly. The popular narrative has
been the disbandment of the historical duopoly,
replaced by a new order of half a dozen or so
prominent providers and a growing tail of mini-
prime and prime-of-prime brokers. In reality,
Goldman Sachs and Morgan Stanley remain well
ahead of the pack, with only JP Morgan chal-
lenging their dominance in any meaningful way.
But, for now at least, the prime brokerage busi-
ness remains comparatively less concentrated.
The shift to multi-prime The shift to multi-prime – an understandable
response to Bear Sterns, Lehman Brothers and
others leaving $65bn in frozen hedge fund as-
sets – remains among the industry’s most sig-
nificant recent developments, with more man-
dates up for grabs, but each one split between
a greater number of primes. An HFM Insights
survey of senior operations professionals at
hedge fund firms found that about a third of
respondents had added a prime brokerage rela-
tionship in the last 18 months. The mean num-
ber of prime brokerage relationships among
respondents was just under three (2.6 when
excluding platforms and other anomalies who
tend to have more than five relationships).
Several hedge fund COOs interviewed by
HFM Insights said the multi-prime model had
been advantageous beyond simply improving
counterparty risk, citing increased negotiat-
ing power over fees and service levels. Others
lamented the added complications of splitting
the wallet, as well as the added costs associat-
1.1 Timeline of key events in the prime brokerage industry, 2011-2017
Oct 2011 Industry shift – Eurozone crisis sees
CDS spreads of several large banks rise prompting prime brokerage clients to
shop around Apr 2012M&A – Wells Fargo revealed to be buying prime broker Merlin Securities
Jun 2013Regulation – Basel III leverage ratio proposals start period of confusion
and concern for prime brokerage units and their clients
Jun 2013Industry shift – One third of sub-$1bn managers fear “profits squeeze” could see them dropped as prime brokerage client, HFMWeek survey shows
May 2014M&A – Société Générale completes
full takeover of Newedge June 2014Regulation – MiFID II final text propos-es banks unbundle brokerage fees and European managers set research budgets in advance
Oct 2014Prime event – Credit Suisse to shrink
prime brokerage unit as part of plans to reduce leverage in investment
banking Early 2015Prime event – Reports suggest BAML and JP Morgan have been casting off hundreds of smaller, unprofitable prime brokerage clients
Jul 2015Prime event – Credit Suisse notifies
clients that it is shutting down FX prime brokerage service
Feb 2016Regulation – Rules for MiFID II delayed 12 months to January 2018 Apr 2016
M&A Cowen Group expands service offering with acquisition of brokerage
firm Convergex Sep 2016Prime event – Fears over Deutsche Bank creditworthiness prompt host of prime brokerage clients to reduce balances
May 2017Industry shift – Top five prime brokers
shed more than 300 clients in 12 months Q1 SEC data shows
May 2017Prime event – GPP moves offices after growth and partners with fintech firm to launch cap intro serviceAug 2017
Prime event – Standard Bank unveils plans to enter the prime brokerage
market
Source: HFM Insights
ed with layers of fees and multiple audits and
marketing documents. If a fund is large enough
to satisfy their many brokers, then all is well.
For many funds, the common trend is to con-
solidate services with one prime and have a
second on paper – a relationship on standby for
when a credit event occurs. The other option is
to use the secondary broker for secondary ac-
tivity, such as overlays and FX.
Among the biggest beneficiaries of this need
to diversify prime brokerage relationships have
been the raft of mini-prime and prime-of-prime
brokers to emerge over the past five years.
These firms, such as Global Prime Partners and
BTIG, have been targeting funds cut adrift by
larger brokers, adding clients by advertising a
cheaper and more transparent service. Tech-
nology platforms are a common means of de-
livery. Clients are also being offered access to
different forms of financing, including peer-to-
peer and corporate lending, as well as the bal-
ance sheets of big banks.
Unprofitable split mandatesUltimately, though, the effect of multi prime on
the industry has been an uptick in the number
of less profitable ‘split mandates’ on a prime
broker’s book (Exhibit 1.2). Credit Suisse is a no-
table component of this trend. Pre-crisis, the
Swiss bank was a prime brokerage bit-player.
Today it boasts the third most prime brokerage
mandates globally behind the historical duopoly.
But the bank’s strength is in its split mandates
– 451 split mandates out of 495 in the US and
677 out of 793 mandates overall in Q2 2017. It is
the third biggest prime broker by split mandates
globally, but the fifth biggest by sole mandates.
Bank of America Merrill Lynch (BAML) and Bar-

8 9
clays may have a higher percentage of split man-
dates than Credit Suisse – BAML’s percentage of
split mandates has grown from 68% in 2012 to
90% in 2017 – but the data and HFM Insights re-
search suggests the Swiss bank is the secondary
prime of choice, especially for funds looking for a
top tier broker to sit alongside Goldman Sachs or
Morgan Stanley. Credit Suisse is often chosen to
add geopolitical diversity from across the Atlan-
tic, as well as for the perceived strength of its bal-
ance sheet relative to other European providers.
As a result, the data can be misleading. Prime
brokerage business is not as spread out as it may
appear. Most of the COOs HFM Insights inter-
viewed suggested that all providers now offer
a similar level of service. But hidden in the mul-
ti-prime trend is the extent to which a prime is
winning the profitable end of a split mandate or
whether said mandate is a ‘paper mandate’. The
nature of the multi prime trend, as well as anec-
dotal evidence, suggests far fewer providers are
challenging Goldman Sachs and Morgan Stanley
for the profitable ends of mandates than the data
indicates.
Regulatory disruptionThe reams of new regulation affecting hedge
funds since 2008 has been clear to see –
but some of the most disruptive changes
have come indirectly via their impact on the
prime brokerage industry. Deemed system-
ically important financial institutions (SIFI)
under Basel and Dodd-Frank legislation, the
bulge-bracket banks have had to recalibrate
their businesses to comply with new capital
ratios and leverage limits, the effects trick-
ling down to prime brokerage units and their
clients (Exhibit 1.3).
1.2 Split and sole prime brokerage mandates, 2017 vs 2012 Source: HFM DataAnalyst Note: US data is as of May/June while Europe and Asia data is as of January/February.
0
200
400
600
800
1000
1200
MorganStanley
GoldmanSachs
CreditSuisse
JP Morgan UBS DeutscheBank
BAML Citigroup Barclays BNP Paribas
75%
77%
85%
78%
72%
84%
90%
83%
96%
76%
69%63%
73%
67%65%
75%
68%65%
85%
61%
Q2 2017 sole mandates Q2 2017 split mandates Q2 2012 sole mandates
Q2 2012 split mandates Q2 2017 split mandates (%) Q2 2012 split mandates (%)

10 11
In Europe, leniency on rehypothecation com-
pared to the hard 140% limit in the US has meant
that European business has often been used by
the banks to provide services that may breach
US policy. But if the US prime brokers had ap-
peared to be hit hardest, they were also the first
to react. Goldman Sachs, Morgan Stanley and
JP Morgan have been quick to strengthen their
capital reserves. For European banks, the uncer-
tainty surrounding their balance sheets has im-
pacted on the extent to which they can compete
for the profitable ends of fund mandates.
An uncertain futureThe future still holds many unknowns including
the fine detail surrounding regulations such as
Basel III and Mifid II. The greatest difficulty of
fee unbundling under Mifid II will not be the in-
creased fees, but the change from one to mul-
tiple lines being reported. As will be discussed
at greater length in the next chapter, investors
are likely to decide what they do and do not
want to pay for, leading to fees being trans-
ferred from the fund to the manager. Basel will
restrict liquidity through the NSFR and LCR and
the need to hold more capital. All of this will
contribute to higher operating costs and a con-
tinuation of the difficulties hedge funds face.
The other ‘known unknown’ is the Trump
administration’s desire to unwind much of the
regulation brought in by the previous adminis-
tration. The key areas that are likely to be af-
1.3 Sources of tension – selected regulations, 2017
Regulation Implementation Impact on primes Impact on managers Further implications
Mifid II (EU) 2018-2019 Prime services fees will be unbundled in a bid to give inves-tors greater transparency, forcing primes to assign worth and value to services previously considered 'value add' such as cap intro and consulting.
Managers face an itemised PB bill, parts of which they may no longer be able to justify as fund charges. Research budgets will also need to be set in advance, limiting what they can recieve from their primes.
Non-EU investors will see EU peers pushing back on fees and follow suit. Ultimately, fewer banks will offer full cap intro/consulting services, sending more business to certain tier one primes and specialist capital raisers.
GDPR (EU) 2016-2018 Primes with EU interests face new obligations on the securi-ty and storage of client data. Demands on tech and cyber crime insurance will increase costs, although there may be new opportunities in reporting services.
Managers will have to undertake gruelling new vendor assessments, and face the knock-on effects of increased costs for primes. More reports on data breaches may also incur investor scrutiny and reputational damage.
Time will be the main loss here, adding to the general operational burden for all parties. But, if implemented well, these measures should ultimately strengthen the relation-ship between prime and manager.
Basel III (Global) 2013-2019 New liquidity requirements, including the need to hold higher grade assets, have forced bulge-bracket banks to strengthen their balance sheets and revisit the viability of leverage-heavy services, such as prime brokerage.
Managers have seen certain prime services go up in price or, at some primes, suddenly disappear. Clients that are no longer profitable have been dropped or repriced, driving business to middle-tier and mini primes.
Costs will continue to rise with new ways of financing such as P2P or corporate lending filtering into the industry. Specialist and mini primes will grow in stature, filling the void left by the bulge bracket banks.
AIFMD (EU) 2013-2015 Primes servicing EU clients faced a raft of new rules, such as asset segregation, while custodians faced heightened liabilities. Depositaries must be in the same jurisdiction as the AIF and functionally and hierarchically separate.
Funds must make sure a prime satisfies the AIF rules, potentially limiting options. They must also appoint one depository only, creating some uncomfortable decisions for funds with multiple relationships.
Segregation of prime services and custodian restrictions will continue to increase costs for funds and drive business to a growing band of smaller specialists.
Dodd-Frank Act (US) 2010-2012 New rules on liquidity, balance sheet and funding introduced. Banks offering swaps faced new reporting obligations and, in some cases, higher capital requirements. The Volker Rule prompts prop desk spin outs.
Mandatory reporting for OTC derivatives introduced. Rules set by central clearing houses tougher and less flexible than those set by primes. Competition increased, initially, from prop desk spin-outs.
Dodd-Frank increased security, red tape and costs and set the prime-manager relationship on a path towards becom-ing more business-like, which even talk of repeal under the Trump administration would unlikely change.
Source: HFM Insights
fected are lending limits and the reintroduction
of prop trading which would reduce the num-
ber of hedge fund spinouts. Banks’ lower oper-
ating costs would see the largest prime broker-
age clients push for a reduction in fees, but the
majority of other changes would take longer
to return. Mindsets have changed with regards
the likes of rehypothecation. If such de-regu-
lation were to take place, even an extended
period of prosperity would be unlikely to bring
about the wholesale return of old practices.
The search for profitable mandates The largest prime brokers have started to con-
centrate on the real money makers. Funds of all
sizes buying leverage and borrowing securities

10 11
1.4 Average client RAUM of prime brokerage clients 2013-2017
0.1
0.2
0.3
0.4
0.5
0.6
0.7
0.8
Q4 2013
Q32014
Q42014
Q2 2014
Q1 2014
Q32015
Q42015
Q2 2015
Q1 2015
Q32016
Q42016
Q2 2016
Q1 2016
Q2 2017
Q1 2017
Barclays Citigroup Credit Suisse BAML BNP Paribas JP Morgan UBS Deutsche Bank HSBC Morgan Stanley Goldman Sachs SocGen/Newedge
Source: HFM Week
($bn
)

12 13
are key points of focus. Elsewhere, mandate size
matters. Hedge fund clients running smaller or
less profitable strategies have faced a drop off in
service levels, requests for more revenue and/or
the prospect of being dropped altogether.
According to HFM data that tracks the reg-
ulatory assets under management (RAuM) by
quarter of the average SEC-registered hedge
fund mandate, Goldman Sachs and Morgan
Stanley are among the most consistent when it
comes to client size, but sit in the bottom quar-
tile of the group (Exhibit 1.4). This echoes an-
ecdotal evidence that, despite the wider issues
affecting the prime brokerage industry, the two
banks have not been as quick to cull emerging
managers as some of their peers, keeping the
number of managers on their client list high
and the average fund size relatively low (al-
though it is again worth noting that this SEC-
sourced data will not include many European
and Asian clients, who, as statistically smaller
and less profitable, are more likely to have been
culled).
Smaller primes, bigger clientsEven though their respective figures are rel-
atively steady, Goldman Sachs and Morgan
Stanley still increased their averages between
2013 and 2015 – the period during which the
prime brokerage industry at large saw the
biggest efforts to cull clients and strengthen
balance sheets after Basel III was introduced.
The biggest changes can be seen in the middle
tiers as BNP Paribas increased its average client
RAuM from $230m to $530m between the end
of 2013 and the end of 2016. Deutsche Bank
and HSBC also saw an upward trend, albeit to
a lesser degree.
1.5 New launch prime brokerage business, 2016Source: HFM Data
0
1000
2000
3000
4000
5000
6000
WellsFargo
SEBUBSDeutscheBank
CitigroupCreditSuisse
BAMLJP MorganMorganStanley
GoldmanSachs
US AuM Europe AuM Total mandates
36
42
24
18
9
46
18
6
2
($m
)

12 13
The only prime broker not to follow this trend
was Société Générale. The French bank’s aver-
age client had an AuM close to $300m during
2014, the year it purchased CTA prime specialist
Newedge. At the start of 2016 the newly merged
provider saw its average client RAuM drop to
$180m, the lowest among the 12 firms noted.
This drop came despite an increase from 53 sole
mandates in 2015 to 57 in 2016 and a cumula-
tive fall in split mandates. By 2017, the firm’s av-
erage had climbed back up towards $300m.
Primes winning business in 2016The strength of the largest prime brokers is
their consistency in gaining new clients year-
on-year. But with start-up pickings increasingly
slim, the number of primes able to compete for
the profitable end of a large new mandate have
decreased. In 2014, the top five primes won 188
available mandates equalling just under $30bn
in initial AuM. In 2016 – after effects of Basel III
and the like had started to bite – the group won
$19bn across 129 firms (Exhibit 1.5).
The bias is even more pronounced at the
very top. Goldman Sachs and Morgan Stanley
still enjoy their pick of the largest US launches
(Exhibit 1.6). Along with JP Morgan, these three
took more than 60% of available AuM in 2016.
The middle and lower portions of the group,
meanwhile, was awash with smaller, European
mandates. Citigroup ranked sixth overall after
taking four sizable tickets in 2016. The year
previous it fell outside the top ten with two –
again sizable – mandates.
Elsewhere, the historical figures throw out
three other significant insights. First, winning
big in 2016 was not the same as wining big in
2014. Last year’s new business table topper,
Goldman Sachs, signed with 36 clients worth
almost $6bn. In 2014, Morgan Stanley won
out with almost $10bn across 62 mandates (it
should be noted that Goldman Sachs’s 2016
total was larger than Morgan Stanley’s ta-
ble-topping 2015 intake).
Regional differences Second is the shifting balance of power among
European providers. In 2014, HFM counted 12
mandates won by Deutsche Bank, all in the US.
These mandates cleared $2bn, a figure that
was almost halved in each of the next two
years. Last year, Swiss banks Credit Suisse and
UBS were first and third for new European cli-
ent AuM (Goldman Sachs being second), with
SEB emerging as a top-tier provider in Scandi-
navia, where several sole mandates have been
won. Despite its high-profile solvency issues
last year, Deutsche has retained most of its cli-
ents, even if balances have been reduced.
Thirdly, the data highlights the increasing
importance of winning US business. UBS, for
example, won 14 more mandates in 2016 than
Citigroup, 18 to 4, yet the US bank’s focus on
regional business ensured that the AuM at-
tached to those wins was larger.
The last 12-18 months have seen the larg-
est primes, the likes of Goldman Sachs, Morgan
Stanley and BAML, grow increasingly confident
and begin to speculate on smaller funds once
again, opening their doors to a select band
of start-ups. They have secured their balance
sheet, advanced their platforms and built up the
capital available for redeployment, allowing for
more risk to be taken than in the few years pre-
vious. One interviewee at a bulge-bracket prime
broker said this was a concerted, strategic shift,
very recently decided upon, within the bank.
However, prime brokerage clients of all sizes re-
main under considerable pressure to earn their
keep – as will be explored in the next chapter.
1.6 Notable recent hedge fund launches, 2015-2016
Name HQ Launched Launch AUM Recent AUM Strategy Prime brokers
Black-and-White Capital Los Angeles 2016 $300m $400m Equity l/s 2 Goldman, Morgan
Blockhouse Capital New York 2016 $160m $400m Equity l/s, credit 3 Goldman, JPM, Morgan
Castle Hook Partners New York 2016 $900m $1.2bn Equity l/s, credit, macro 3 BAML, Goldman, Morgan
Clearfield Capital New York 2015 $500m $800m Equity l/s, event driven 2 Goldman, Morgan
Eisler Capital London 2016 $1bn $1.3bn Macro 3 Credit Suisse, Goldman, Morgan
FinePoint Capital Boston 2015 $2bn $2.4bn Equity l/s 3 Credit Suisse, Goldman, Morgan
Key Square New York 2016 $4.5bn $4.2bn Macro 4 BAML, Citi, Goldman, Morgan
Rokos Capital London 2015 $3.5bn $7bn Macro 3 BAML, Citi, Deutsche
Thunderbird Partners London 2015 $1.5bn $900m Equity l/s 4 Citi, Deutsche, Morgan, UBS
Warlander Asset Management New York 2016 $1.1bn $1.9bn Credit 2 Goldman, JPM, Morgan
Source: HFM Insights
Exhibit 1.6Recent AuM is most recent available from HFM Data and online research

14 1514
SECTION 2
REVENUE HURDLES
In the years before the crisis, no-one talked about prime brokerage ‘revenue hurdles’ because there wasn’t any need. Managers were generating good numbers, primes had clients who were profitable already or going to be, and the only time the topic came close to being discussed was when a manager failed to make the cut for an exclusive cap intro event. Now, amidst a period of truncated margins and fierce competition, it is not just the elephant in the room, but part of the conversation.
14 15
Price hikes for unprofitable clients The impact of the new status quo is twofold:
prime brokers have not only been reassess-
ing smaller clients, but squeezing larger ones
trading less profitable strategies and encour-
aging them to use instruments not as heavy
on the balance sheet. That has meant more
OTC derivatives and fewer security loans. Re-
hypothecation issues have also had a knock-
on effect. The EU is yet to follow the US in in-
troducing rehypothecation limits, but activity
is relatively low, reflecting how politicised it
has become. Several bank-backed mini and
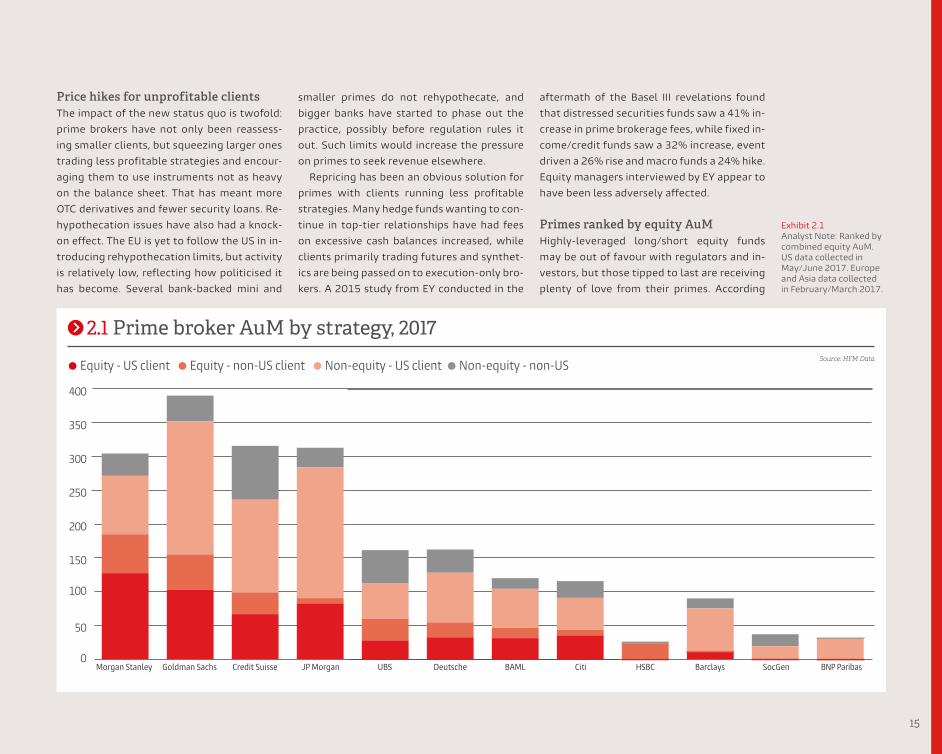
2.1 Prime broker AuM by strategy, 2017
0
50
100
150
200
250
300
350
400
Morgan Stanley Goldman Sachs Credit Suisse JP Morgan UBS Deutsche BAML Citi HSBC Barclays SocGen BNP Paribas
smaller primes do not rehypothecate, and
bigger banks have started to phase out the
practice, possibly before regulation rules it
out. Such limits would increase the pressure
on primes to seek revenue elsewhere.
Repricing has been an obvious solution for
primes with clients running less profitable
strategies. Many hedge funds wanting to con-
tinue in top-tier relationships have had fees
on excessive cash balances increased, while
clients primarily trading futures and synthet-
ics are being passed on to execution-only bro-
kers. A 2015 study from EY conducted in the
aftermath of the Basel III revelations found
that distressed securities funds saw a 41% in-
crease in prime brokerage fees, while fixed in-
come/credit funds saw a 32% increase, event
driven a 26% rise and macro funds a 24% hike.
Equity managers interviewed by EY appear to
have been less adversely affected.
Primes ranked by equity AuMHighly-leveraged long/short equity funds
may be out of favour with regulators and in-
vestors, but those tipped to last are receiving
plenty of love from their primes. According
Source: HFM Data
Exhibit 2.1Analyst Note: Ranked by combined equity AuM. US data collected in May/June 2017. Europe and Asia data collected in February/March 2017.
Equity - US client Equity - non-US client Non-equity - US client Non-equity - non-US

16 17
to HFM Data, Morgan Stanley leads Goldman
Sachs in terms of equity client AuM, although
both have significant leads on third-placed
Credit Suisse (Exhibit 2.1). The duo’s grip on
the industry may have loosened since 2008,
but their strength in profitable equity AuM is
evidence of their continuing influence. One
notable difference between the two is Gold-
man’s superior global AuM, which when com-
bined with respective mandate totals noted
in the previous chapter suggests the larger
average client of the two (Morgan Stanley’s
bigger average in Exhibit 1.5 is likely due to
the chart’s focus on Regulatory AuM and the
bank’s higher equity AuM). Morgan Stanley’s
leniency towards smaller managers will be
discussed later.
Below the top two, HFM Data suggests
that Credit Suisse, JP Morgan, UBS, Deutsche
Bank, BAML, Citi and Barclays are the only
prime brokers regularly competing for profit-
able US equity hedge fund mandates. Europe-
an primes are particularly well-represented in
the lower echelons. The four smallest primes
by client AuM in the group of 12 are all head-
quartered in Europe, while the bottom three
by overall client AuM have a clear majority
of clients running non-equity strategies out
of Europe. HSBC has significant equity AuM,
but all with non-US clients. By prime servic-
es client AuM, Credit Suisse is the European
standout, well ahead of its institutional com-
patriot, UBS, and sits second overall.
Primes ranked by revenuePrime services revenue rankings, however,
tell a different story. Although Credit Suisse
was the third biggest prime broker last year
by overall client mandates and equity client
AuM, it didn’t make the top six for revenue,
sitting below both UBS and Deutsche Bank in
a ranking compiled by Coalition (Exhibit 2.2).
The Swiss bank’s strong numbers in Europe-
an business and split mandates, combined
with its apparent status as ‘back-up prime’
of choice, is, it seems, proving costly. The
bottom three primes in the table of 12 are,
again, all headquartered in Europe. Morgan
Stanley has taken the top spot for each of
the last four years – HFM Data suggests the
US bank’s equity clients accounted for a sig-
nificantly higher proportion of prime broker-
age AuM than at any of its tier one and two
peers.
In terms of revenue, JP Morgan strikes a
sharp contrast with Credit Suisse. While the
US bank ranked fourth by mandate numbers
and fifth by equity AuM last year, it was the
second biggest prime services revenue gen-
erator. Its success has been built, in part, on
winning the profitable ends of US mandates.
Prime brokerage executives interviewed sug-
gested the largest US clients generate $10m
a year and more in revenue for their primes,
compared to $2-5m in Europe – and HFM Data
shows that JP Morgan had the second larg-
est AuM by US prime brokerage mandates in
2017. The bank’s success last year pushed
Goldman Sachs back into third place in Coali-
tion’s revenue rankings – after being usurped
in 2015 – despite HFM Data showing it had
about $100bn less in prime services AuM.
We need to talk about revenue In the past, the topic of revenue hurdles
would normally be raised indirectly, if at all.
2.2 Prime brokers ranked by global revenue, 2013-2016
Source: Coalition
Analyst Note: Joint rankings for second place in FY14 and third place in FY13. Individual rankings for positions 4-12 not available.
#1 #2 #3 #4-6 #7-9 #10-12
Prime Services Global Revenue Rankings
FY16 FY15 FY14 FY13
Morgan Stanley
JP Morgan
Goldman Sachs
BAML
Deutsche Bank
UBS
Barclays
Citi
Credit Suisse
BNP Paribas
HSBC
SocGen

16 17
Numbers and details tended not to be dis-
cussed, the prime more likely framing it in
terms of an indeterminable internal ranking
for a client to aim for or a cap intro event they
could no longer attend. Today, while the topic
remains awkward, primes are not only more
likely to broach the subject of revenues but to
mention an explicit target. About 70% of the
COOs HFM Insights surveyed said that they
knew the revenue hurdle expected by their
prime, while just over two thirds said it was
something they and their prime had openly
discussed (Exhibit 2.3).
Other managers HFM Insights interviewed
said they had a sense of their hurdle but pre-
ferred not to enquire further. “If they don’t
bring it up, we don’t,” the CCO of one sub-bil-
lion-dollar quantitative hedge fund manager
told HFM Insights. “That way the hurdle may
not be re-evaluated.” This was not an uncom-
mon response during interviews. Among sur-
vey respondents, a little under half of manag-
ers said they were ‘very confident’ that they
were keeping their prime brokers happy (Ex-
hibit 2.4). Firms with less than $1bn in AuM
were more likely to rate themselves as ‘some-
what confident’ than firms with more than
$1bn in AuM. Less than 10% of all respond-
ents said they were ‘not confident’.
Revenue hurdle rules of thumb Now that making a profit is harder, under-
standing your revenue hurdle has become
integral to running a hedge fund business.
But calculating it without the aid of a prime
broker – if such a conversation is to be avoid-
ed – is difficult. A prime’s expectations will be
dictated by its tier, as well as the size, strate-
gy and track record of the client (the relation-
ship less so for all but the largest and longest
running funds), but other factors, such as a
fund’s ‘vintage’, i.e. how it compares to funds
launched during the same year or economic
period, will also contribute. Below are a few
contemporary rules of thumb.
1) Top tier prime / established manager
HFM Insights research suggests the biggest
primes will expect to receive at least $300-
400k in revenue annually from their estab-
lished clients. Funds not reaching these
heights have been asked to write cheques for
the difference or risk being dropped. One Lon-
don-based COO of a sub-billion-dollar man-
ager said that he wanted to pay their top tier
primes at least $1m per year. “If you’re a sin-
gle vehicle paying $1-2m per year or above,
you are a top tier client,” he said. “$600-700k
would be borderline”. Before the crisis, top
tier primes had a host of larger clients gen-
erating at least $5m a year – failing to hit this
figure could have seen a manager miss the
cut for the industry’s biggest cap intro events.
2) Top tier prime / emerging manager
A significant shift in the past 12-18 months,
2.3 Managers who know how much revenue their prime brokers expect them to generate, 2017
Source: HFM Insights Operations Survey Q2 2017
300+700=
330+670=
Managers who know their prime broker’s revenue hurdles
Managers who have discussed revenue hurdles with their prime brokers
No Yes
30% 70%
33% 67%
Just over two thirds of the COOs
HFM Insights surveyed said revenue
hurdles were something they and their
prime had openly discussed

18 19
2.4 Manager confidence in meeting their prime brokerage revenue hurdles, 2017
0%
10%
20%
30%
40%
50%
Very con�dent Somewhat con�dent Not con�dent
Firm AuM >$1bn
Firm AuM <$1bn
Source: HFM Insights Operations Survey Q2 2017
Mifid II is introduced. Not only are affected
firms unsure what their itemised prime bro-
kerage bills will look like, but how their in-
vestors will react if significant numbers are
on the lines dedicated to so-called value add
services, such as cap intro, consulting and re-
search. Such outcomes would result in some
uncomfortable conversations between man-
ager and investor, and some similarly uncom-
fortable conversations between client and
prime. In the era of unbundled fees, should
the fund be expected to pay for all prime bro-
kerage services? HFM Insights expects the
top tier primes are taking more ‘bets’ on
emerging managers, with several launch-
ing dedicated platforms. Typically, clients
on such platforms are given three years to
prove themselves profitable, after which
modest minimum revenue targets dependent
on strategy and vintage will be introduced.
Several interviewees praised Morgan Stan-
ley as being particularly flexible with regards
smaller managers, with no talk of revenues
and, unlike its tier one peers, no tail-off in ser-
vice during less fruitful periods. The COO of a
London-based emerging equity manager said
one large European prime broker requested a
$100k minimum from the outset.
3) Middle tier and mini-primes
Much depends on asset class and the age of
the fund, but prime brokerage clients at the
smallest providers are expected to generate
at least $50-100k per year. Slip too far below
$50k and profitability becomes an issue for
even the nimblest of mini-primes. In terms of
fund AuM, there appears to be a cut-off point
of about $5m after which service levels plum-
met. One manager whose fund dipped below
$5m AuM only saw service at his tier three
prime resumed once they had received a top-
up from the vehicle’s main investor tipping
them back over $5m. Revenue hurdles “used
to be the elephant in the room, but now it’s
a frank discussion,” said an executive at one
mini-prime broker. COOs of even the larger
firms understand and appreciate an open ap-
proach, he added.
Unbundling fees The way managers who engage with Europe-
an investors or trading with European broker-
age desks are charged for prime brokerage is
also set to change, as fee unbundling under
Revenue hurdles used to be the
elephant in the room, but now it’s a
frank discussion. COOs of even the
larger firms understand and appreciate
an open approach

18 19
2.5 The most important prime broker attributes according to hedge fund managers, 2017
0%
10%
20%
30%
40%
50%
Clie
nt se
rvic
es
Secu
ritie
s len
ding
Stab
ility
of fi
nanc
ing
Exec
utio
n
Brea
dth
of se
rvic
e
Bran
d st
reng
th
Capi
tal i
ntro
duct
ions
Inve
stor
exp
ecta
tions
Tech
nolo
gy p
latf
orm
Cost
of fi
nanc
ing
Mar
ket a
cces
s
Cons
ultin
g
Rese
arch
Analyst Note: Respondents were asked to pick three attributes each. Source: HFM Insights Operations Survey Q2 2017
Core attributes
Value add services

20 PB
2.6 Managers willing to pay for value add prime brokerage services, 2017
developments in Europe to turn this question
into a central issue globally.
What is the value of value add? The knock-on effects of Mifid II are to be felt
first by prime brokers’ hedge fund consulting
teams, HFM Insights research suggests. Sur-
vey respondents asked to identify the most
important attributes of a prime brokerage
voted overwhelmingly for ‘Client Service’,
while ‘Consulting’ and ‘Research’ received
the fewest votes of all (Exhibit 2.5). Estab-
lished managers are particularly unconvinced
by the value of consulting, with one US-based
COO suggesting that the knowledge base of
most teams was too low to be of value to ex-
perienced hedge fund professionals. These
teams “wouldn’t be your first port of call”
for the types of questions they were creat-
ed to assist with, he said. With relatively few
chances still taken on emerging managers,
consulting teams face an uphill battle to stay
relevant.
Few managers HFM insights interviewed ex-
pected primes to start monetising value add
services, and yet, as fees are unbundled, mon-
etary values will need to be assigned. Certain-
ly, the value of cap intro is easier to calculate.
Managers, however, are split as to its worth
– less than half of operations professionals
surveyed said they would pay for the service
(Exhibit 2.6). The COO of one long-running US
manager with about half a billion dollars in
AuM said that he wasn’t convinced they were
receiving a good cap intro service “even when
he pushed for it”. He described the benefit as
a fifth investor meeting if the manager had al-
ready secured four and was struggling to gain
one more.
Home truths for cap introManagers know two uncomfortable truths
about cap intro:
1. It is generally given to funds that don’t
need it and not to those that do
2. It is self-serving insomuch that bigger cli-
ents mean bigger revenues
Primes know managers are aware of this, but
if primes are only providing the best cap intro
service to their best clients, and their best cli-
ents are best positioned to drive down fees,
how will they price the service for smaller
clients? The biggest effects of fee unbundling
on the prime-client relationship will, there-
fore, be to expose the disparities between
the two sides in the value they assign servic-
es such as cap intro, and to exacerbate the
frustrations of those managers feeling under-
served. Expect this issue to prove a key source
of tension in the years to come.
Product size - $10 AuM46+54+N 19+81+NCap Intro Consulting
Yes46%
No54%
No81%
Yes19%
Source: HFM Insights Operations Survey Q2 2017
Consulting teams
“wouldn’t be your first
port of call” for the types
of questions they were
created to assist with

SECTION 3
SELECTION AND OVERSIGHT
Throughout our interviews with hedge fund professionals, one observation in particular was oft repeated: the relationship between prime broker and client has become increasingly “business-like”. Certainly, the drivers behind the recent increases in fees – the result of external factors rather than internal policy – have given primes reason to be hard-headed, and managers have responded in similar fashion. But although the prime brokerage environment may resemble a meritocracy, it does not mean that primes are being selected, dropped and/or saved based purely on quality of service.

22 23
All changeAs has been discussed, the prime-client rela-
tionship has endured a rocky few years. Monog-
amy has long been dispensed with and both
sides are on the lookout for more attractive
opportunities. Among the hedge fund firms
surveyed for this report, more than 70% had in
the last 18 months either replaced a prime bro-
ker, placed one on watch and/or reduced their
balance (Exhibit 3.1). That a greater proportion
had added one or more prime brokerage rela-
tionship (37%) than severed one (30%) sug-
gests the multi prime model, if not the industry
at large, remains in good health.
The undimmed power of tier oneOne thing that hasn’t changed is the importance
of brand. Despite the break-up of the duopoly and
the improvement in service generally, hedge fund
managers of all sizes are as keen as ever to ensure
that at least one of their primes is considered ‘tier
one’. Why? The advantages are twofold. First-
ly, and perhaps most importantly, investors still
consider a prime’s brand and reputation during
the due diligence process. Funds may not need
all the ‘bells and whistles’ of a tier one prime, but
the perception is that investors still want to ‘tick a
box’ when it comes to service providers, said the
COO of one US-based sub-billion-dollar manager.
Another interviewee suggested investors were
being less flexible on this, not more. Tier one sim-
ply means fewer awkward questions.
Secondly, the primes at the very top are still
considered to have a materially better service of-
ferings than their peers. Managers HFM Insights
interviewed were split as to the extent this
was true. Most agreed that the very largest US
primes had the most advanced technology plat-
forms and best-quality staff. As one UK-based
COO put it, Goldman Sachs and Morgan Stan-
ley have been in the game the longest, spent
the most money and been particularly quick to
strengthen their balance sheets in the wake of
Basel III. They also offer the greatest range of
services and the biggest cap intro events. Many
managers will hire both in some capacity if pos-
sible – their combined star power and expertise
(including tips for investor pitches) are worth the
small risk of the two teams butting heads.
But HFM Insights also found a broad assump-
tion that everyone gets a comparable service.
Echoing the sentiments of several managers in-
terviewed, one former top tier prime brokerage
executive stated that the service had been com-
moditised, and the only difference was branding
and the quality of staff a manager deals with.
Mini primes, non-bulge bank primes and the
firms that started as FX brokers advertise nimble,
customisable services, and are no longer tied to
limited markets, but have access to tens of thou-
sands of assets across the globe. For many funds,
there are no practical disadvantages from part-
nering with a mini prime and their benefits can be
enjoyed in tandem with those of a tier one.
Exhibit 3.1Analyst Note: 18-month period in question is from January 2016 to June 2017.
3.1 Changes to prime brokerage relationships in the past 18 months, 2017
Source: HFM Insights Operations Survey Q2 2017
0%
5%
10%
15%
20%
25%
30%
35%
40%
Added one or more prime broker relationship
Severed one or more prime broker
relationship
Reduced assets at one or more prime broker
Placed one or more prime broker
‘on watch’
Did not place 'on watch', sever a relationship or
reduce assets

22 23
3.2 Perceived tier of notable prime brokers according to hedge fund managers, 2017Source: HFM Insights Operations Survey Q2 2017
Exhibit 3.2 Analyst Note: Respondents were asked to pick the tier (1-3) they thought best conveyed the status of a prime brokerage provider.
Who is in tier one?Exhibit 3.2 offers a flavour of how managers
perceive the industry’s main prime brokerage
providers. Unsurprisingly, Goldman Sachs and
Morgan Stanley occupy the top two spots.
But greater insights can be gleaned from the
spread below them. JP Morgan – currently the
second-largest prime broker in the US and sec-
ond-largest primes services revenue generator
globally – was regularly cited during research
interviews as a tier one prime and the only pro-
vider that could currently be considered in the
same bracket as the historical duopoly. The sur-
vey results bear this out: JP Morgan received
80% of its votes for tier one, and was the only
prime outside the top two not to receive any
votes for tier three.
Other notable providers may have to wait
before being admitted to the top table. Cred-
it Suisse, Bank of America Merrill Lynch, UBS,
Deutsche Bank and Citigroup all received tier
one voting percentages between 65% and
40%. For most of the providers in the list’s low-
er echelons the consensus erred towards tier
two, although all primes picked up votes across
multiple tiers (12 providers received votes in all
three). The survey’s results suggest only BTIG,
Cowen Group and Global Prime Partners can be
comfortably classed as tier three. Even then, all
three received a few votes each for tier two.
0%
20%
40%
60%
80%
100%
Mor
gan
Stan
ley
Gol
dman
Sac
hs
JP M
orga
n
Cred
it Su
isse
Bank
of A
mer
ica
Mer
rill L
ynch
UBS
Deu
tsch
e Ba
nk
Citig
roup
Barc
lays
HSB
C
BNP
Parib
as
BNY
Mel
lon/
Pers
hing
Nom
ura
Soci
été
Gén
éral
e / N
ewed
ge
SEB
Wel
ls F
argo
Jeffe
ries
Fide
lity
BTIG
Cow
en G
roup
Glo
bal P
rime
Part
ners
Tier 1 Tier 2 Tier 3

24 25
How funds are using tier one primesThis infatuation with ‘tier one’ has meant that,
even as the industry shifts towards the use of
cost-effective mini primes, managers of all siz-
es are doing their utmost to hold on to at least
one tier one relationship. A London-based ex-
ecutive at one mini prime broker said their cli-
ent roster was divided fairly evenly into three
groups:
1) The cost-cutter
Established managers that have dropped one
of their multiple tier one prime brokers and
added a mini prime for non-core services;
2) The go-getter
Emerging managers that start out with one tier
one prime and one mini prime to attract and
appease investors while benefiting from less
costly services; and
3) The no-choicer
Smaller managers – emerging and established
– who have decided or needed to sever their
top tier providers in favour of multiple mini
prime relationships.
Several smaller managers HFM Insights in-
terviewed stressed the importance of having
a tier one prime brokerage relationship early
on in their lifecycle if possible. The COO of one
sub-$100m US-based manager with one top-
tier prime, one mini prime and one clearing ac-
count said he planned to add a second tier one
prime as soon as it was economically viable.
This ‘dual model’ would not only provide the
firm with additional counterparty security –
perceived or otherwise – but, more important-
ly, greater negotiating power on fees. It would
become feasible to add a second tier one pro-
vider only once the firm hits AuM of $150m, he
suggested.
Understand your ‘snowflake’ There is paradox at the heart of contemporary
prime brokerage. On the surface, service quality
appears similar. But also, each prime broker has
a distinct style that needs to be understood in
order for an existing client to get the most from
the relationship or for a prospective client to be
taken on. One London-based COO at a multi-bil-
lion-dollar manager put it succinctly: “They’re
snowflakes.” Three notable ways this distinc-
tion can manifest itself are outlined below.
i) The blend of prime services that will gener-
ate revenue
If no two primes are alike, the same can be said
for hedge fund managers. Rules of thumb say
that most primes will fight for long/short eq-
uity mandates and be less enthused by credit
strategies and futures traders. But, with each
manager’s trading style slightly different and
each prime’s profit centre unique, mandates
will mean different things to different primes.
Understanding the combination of services, at
the right levels, that will grab a tier one prime’s
attention is vital to those funds on the cusp of
being accepted.
ii) The relationship a prime services team has
with its parent
Most apparent at the bulge bracket banks, sev-
eral managers HFM Insights interviewed had
experienced push-back on certain requests or a
squeeze on prices and service levels that were
3.3 Annual net new prime brokerage mandates at top three US providers, 2012-2016
Source: HFM Data
Analyst Note: Data combined from US (data as of May/June 2017), Europe and Asia (data both as of February/March 2017) in-house PB surveys.
-120
-60
0
60
120
180
2012 2013 2014 2015 2016
-120
-60
0
60
120
180
2012 2013 2014 2015 2016
-120
-60
0
60
120
180
2012 2013 2014 2015 2016
Goldman Sachs
-120
-60
0
60
120
180
2012 2013 2014 2015 2016
-120
-60
0
60
120
180
2012 2013 2014 2015 2016
-120
-60
0
60
120
180
2012 2013 2014 2015 2016
JP Morgan
-120
-60
0
60
120
180
2012 2013 2014 2015 2016
-120
-60
0
60
120
180
2012 2013 2014 2015 2016
-120
-60
0
60
120
180
2012 2013 2014 2015 2016
Morgan Stanley

24 25
a result of pressure from on high. Some man-
agers said they felt the prime broker was on
their side, others less so. One interviewee said
the prime services team at one US prime bro-
ker seemed to be in a constant battle with the
wider division.
iii) The prime broker’s client service culture
Before the credit crisis, the few primes winning
business did so with a grin on their faces. After
all, with every new fund expected to hit several
billion dollars in AuM, and generate according-
ly impressive revenues, it paid to keep clients of
all sizes sweet. Today, though the relationship
is generally more formal, the style of service
varies by provider. Some tier one primes have
a reputation for allowing service levels to drop
in line with a client’s revenues, others are more
forgiving.
Style drift – Goldman versus Morgan When it comes to service culture, the nota-
ble dichotomy is Goldman Sachs and Morgan
Stanley. Goldman’s reputation for being de-
tails orientated has helped establish the firm
as the number one prime broker in the US, if
not the world, but it has also had a knock-on
effect in this era of austerity. HFM Insights in-
terviewees bemoaned Goldman’s varying ser-
vice levels and ‘small print’ costs. The COO at
one UK-based sub-$100m manager said that
at Goldman Sachs the “wining and dining”
dries up when performance does, but not so at
Morgan Stanley. “When we speak with Morgan
Stanley it’s more about the relationship. When
we speak with Goldman Sachs it’s a much more
numbers-driven conversation.”
Goldman’s focus on the bottom line means
smaller/emerging managers will experience
the sharp end of this contrast. Both the prime
brokerage industry’s top two providers have
made a concerted effort to take on more emerg-
ing managers in the past 12-18 months, but
HFM Insights research suggests Morgan Stan-
ley is more “open-minded” when it comes to
new clients: an executive at one mini prime said
they were more likely to see Morgan Stanley
competing for mandates than Goldman Sachs.
There’s no suggestion of nepotism though. In-
deed, Goldman partners launching their own
fund are expected to generate revenues as
quickly as all clients, a former executive said.
Morgan Stanley’s increased appetite for
start-up funds – demonstrated by their lenient
approach to revenue hurdles outlined in the
last chapter – has coincided with rising man-
date numbers at the firm. It saw a net increase
of more than 100 prime brokerage mandates
last year, well ahead of its nearest rivals (Ex-
hibit 3.3). Between Q2 2014 and Q2 2017, Mor-
gan Stanley added net 338 mandates globally,
compared to 122 at Goldman Sachs and 73 at
JP Morgan. How far this ‘cast the net wide’ ap-
proach translates to revenues remains to be
seen, but those funds that do go on to become
the industry’s next titans will, almost certainly,
be on the bank’s books.
3.4 Annual net new prime brokerage mandates at top three European providers, 2012-2016
Source: HFM Data
Analyst Note: Data combined from US (data as of May/June 2017), Europe and Asia (data both as of February/March 2017) in-house PB surveys.
-120
-60
0
60
120
180
2012 2013 2014 2015 2016
-120
-60
0
60
120
180
2012 2013 2014 2015 2016
-120
-60
0
60
120
180
2012 2013 2014 2015 2016
Credit Suisse
-120
-60
0
60
120
180
2012 2013 2014 2015 2016
-120
-60
0
60
120
180
2012 2013 2014 2015 2016
-120
-60
0
60
120
180
2012 2013 2014 2015 2016
Deutsche Bank
-120
-60
0
60
120
180
2012 2013 2014 2015 2016
-120
-60
0
60
120
180
2012 2013 2014 2015 2016
-120
-60
0
60
120
180
2012 2013 2014 2015 2016
UBS
At Morgan Stanley
it’s more about the
relationship; Goldman is
more numbers-driven

26 27
3.5 CDS spread of selected bulge bracket investment banks with prime brokerage unitsAnalyst Note: Calculation method modified for European banks at the end of 2014. Credit Suisse data only available from late 2014. Source: Markit
0
100
200
300
400
500
600
Jan 2013 Jan 2014 Jan 2015 Jan 2016 Jan 2017Jan 2011 Jan 2012
Goldman Sachs Morgan Stanley JP Morgan Deutsche Bank UBS Credit Suisse

26 27
Monitoring your primesIn Europe, the spectre of credit risk loomed large
in 2016. But if, as media reports suggested,
Deutsche Bank lost nervous clients to rivals last
year, it made up the numbers elsewhere (Exhib-
it 3.4). One fund of hedge funds manager HFM
Insights interviewed said they were monitoring
all counterparties of all underlying funds dur-
ing that period such were the concerns about
the risks spreading. Some funds using Deutsche
Bank had closed relationships, others had re-
duced assets. According to HFM data, only UBS
among Europe’s top three providers saw a net
decline in mandate numbers last year. Deutsche
Bank saw net declines in 2015, the year primes
were reported to be dropping smaller clients;
and 2013, the year managers and investors re-
acted to Basel III.
A bank’s CDS spread, then, is an important
data point for managers monitoring their prime
brokers. COOs at some of the more sophisticat-
ed managers will have ‘hard limits’ – numerical
thresholds that when breached raise red flags –
but HFM Insights research suggests most COOs
take a ‘low touch’ approach, monitoring the CDS
spread of a prime’s parent bank manually and in-
tervening when it starts to deviate from the his-
torical norm. Exhibit 3.5 demonstrates just why
Deutsche Bank clients, and to a lesser extent
Credit Suisse clients, were so concerned during
2016, and why all managers were nervous dur-
ing the ‘Eurozone Crisis’ of 2011-2012.
There are two additional takeaways from Ex-
hibit 3.5 worth noting. Firstly, the strong corre-
lation in CDS spread between Morgan Stanley
and Goldman Sachs during 2016 – the primary
reason some managers are now taking a ‘one
but not both’ approach to the pair, choosing to
disperse counterparty credit risk by adding a
less correlated European prime brokerage pro-
vider, such as Credit Suisse, often as a back-up
or ‘paper’ prime. And secondly, the relatively
steady numbers for JP Morgan over the last
five years – likely a contributing factor to its re-
cent growth in prime brokerage business. CDS
spread, stock price, credit rating and – more
recently – a Bloomberg score combing several
factors, are all used by managers to monitor
the credit worthiness of their primes (Exhibit
3.6).
Ranking your primesThe data managers are using to monitor and
compare primes is also being used to rank them.
For example, many COOs at multi-billion-dollar
managers will have reams of data comparing
all their primes on a monthly or quarterly basis
on cost, accuracy, timing and client satisfaction,
giving them the ability to rank their primes over-
all and across multiple variables. These rankings
can then be used to negotiate fees and improve
service levels. This negotiating power is perhaps
the biggest benefit of the ‘multi’ and ‘dual’ prime
models for managers with several top-tier
primes providing comparable services.
Hedge fund firms running managed accounts
wishing to make use of such rankings for clear-
ing brokers must do so indirectly. Here, man-
agers disappointed in the performance of the
clearing broker cannot make a change as the
counterparty has been appointed by the in-
vestor. However, the concept of ranking still
applies, albeit with an additional level. In this
example, the rankings are presented to the in-
vestor who is then encouraged to replace the
broker or press them for improvements.
3.6 Prime brokerage provider stability matrix, 2017
Prime brokerage provider HQ
Bloomberg 1-year default rate,
11 August 2017 Credit score (S&P –
local currency LT) S&P Rating
CDS spread, 1 Aug 2017
(bps)
CDS spread 5-year high
(bps)
Stock price, 1 Aug 2017
(USD)
Stock price 5-year low
(USD)
Credit Suisse AG Swi 0.23% A (2-Jul-13) Stable 61.7 179.0 (22-Feb-16)*
15.5 10.46 (8-Jul-16)
Deutsche Bank AG Ger 0.30% A- (28-Mar-17) Negative 81.5 269.3 (11-Feb-13)
18.1 11.48 (29-Sep-16)
Goldman Sachs & Co. LLC US 0.05% A+ (16-Dec-16) Stable 65.9 156.4 (11-Feb-13)
227.0 97.81 (2-Aug-12)
JP Morgan & Co. US 0.01% A- (2-Dec-15) Stable 47.4 109.6 (11-Feb-13)
93.0 30.76 (2-Aug-12)
Morgan Stanley US 0.04% BBB+ (2-Dec-15) Stable 59.9 157.6 (11-Feb-13)
47.2 13.03 (2-Aug-12)
UBS AG Swi 0.07% A+ (6-Jun-16) Stable 26.0 99.9 (11-Feb-13)
17.6 12.23 (7-Jul-16)
Source: Various
Exhibit 3.6Analyst Note: *Credit Suisse data only available from late 2014.

28 PB
If the prime broker-hedge fund manager
relationship has always been a numbers
game, it is only recently that the players
have started talking openly about the rules.
Economic forces have seen subject matters
that were previously taboo – such as revenue
hurdles and fees – become formal discussion
points during meetings, giving client-prime
interaction a more ‘business-like’ feel. Prof-
its are king, and all but the most impressive
courtiers are feeling the pressure to perform.
But the new status quo is also working in
the client’s favour. Bank-owned primes may
be confident enough in their balance sheets
to take bets on smaller clients again, but they
are not in a position to shun profitable busi-
ness. As prime brokers ramp up their search
for the star clients of tomorrow, many hedge
funds are benefiting already. Funds trading
balance-sheet-friendly AuM are splitting
their core business between multiple ‘tier
one’ providers, winning fee concessions by
creating service rankings and applying pres-
sure accordingly. Fee transparency intro-
duced under Mifid II may actually give man-
agers more ammunition.
Mini primes may have enjoyed an uptick
in business, and the quality of prime servic-
es generally may have improved, but de-
velopments have by no means diminished
the importance of having a ‘tier one’ ven-
dor. And, here, JP Morgan is providing some
much-needed competition. The US bank is
succeeding where Credit Suisse has thus far
failed – eating into the revenue and US mar-
ket share of the historical duopoly in a mean-
ingful way, and offering a credible ‘tier one’
alternative for core services. This is good
news for managers. A genuine three-way
tussle at the top will mean more negotiating
power for funds looking to put pressure on
their top-tier primes.
If JP Morgan does establish itself as part
of a triopoly, it will help crystallise a new
industry hierarchy, one that is more forgiv-
ing of fund than prime. Lower-tier managers
may be welcomed by higher-tier primes, but,
with some of the sentiment drained from the
client-prime relationship, lower-tier primes
will struggle to attract higher-tier new clients
or prevent clients from leaving as they grow.
Ultimately, client perks are being replaced by
service transparency – and that is something
all serious managers can get on board with.
CONCLUSION

PB 29
Section 1Exhibit 1.1: Timeline of key events in prime brokerage industry, 2011-2017, HFM
Insights (Page 8)
Exhibit 1.2: Split and sole prime brokerage mandates, 2017 vs 2012, HFM Data
(Page 9)
Exhibit 1.3: Sources of tension – selected regulations, 2017, HFM Insight (Page 10)
Exhibit 1.4: Average client RAUM of prime brokerage clients, 2013-2017, HFMWeek,
Alphapipe (Page 11)
Exhibit 1.5: New launch prime brokerage business, 2016, HFM Data (Page 12)
Exhibit 1.6: Notable recent hedge fund launches, 2015-2016, HFM Insights (Page
13)
Section 2Citation: The evolving dynamics of the hedge fund industry – 2015 Global Hedge
Fund Investor Survey, EY (Page 15)
Exhibit 2.1: Prime broker AuM by strategy, 2017, HFM Data (Page 15)
Exhibit 2.2: Prime brokers ranked by global revenue, 2013-2016, Coalition (Page 16)
Exhibit 2.3: Managers who know how much revenue their prime brokers expect
them to generate, 2017, HFM Insights (Page 17)
Exhibit 2.4: Manager confidence in meeting their prime brokerage revenue hurdles,
2017, HFM Insights (Page 18)
Exhibit 2.5: The most important prime broker attributes according to hedge fund
managers, 2017, HFM Insights (Page 19)
Exhibit 2.6: Managers willing to pay for value add prime brokerage services, 2017,
HFM Insights (Page 20)
Section 3Exhibit 3.1: Changes to prime brokerage relationships in the past 18 months, 2017,
HFM Insights (Page 22)
Exhibit 3.2: Perceived tier of notable prime brokers according to hedge fund manag-
ers, 2017, HFM Insights (Page 23)
Exhibit 3.3: Annual net new prime brokerage mandates at top three US providers,
2012-2016, HFM Data (Page 24)
Exhibit 3.4: Annual net new prime brokerage mandates at top three European pro-
viders, 2012-2016, HFM Data (Page 25)
Exhibit 3.5: Bank CDS spreads of top 6 prime brokerage providers, 2011-2017,
Markit (Page 26)
Exhibit 3.6: Prime brokerage provider stability matrix, 2017, Various sources
(Page 27)
EXHIBITS AND CITATIONS

About HFM Insights HFM Insights is the new research and analysis service by Pageant Media,
sitting within the company’s hedge fund intelligence network, HFM. The
division produces research reports and analytical articles on a variety of
topics in the global hedge fund industry, including business operations,
investor relations, technology and regulation. Leveraging Pageant’s
wealth of data and news sources, and with access to the HFM network’s
vast membership, HFM Insights is uniquely positioned, offering exclusive
surveys and expert commentary.
Report Authors Tony Griffiths
Head of Research
+44 (0) 20 7832 6649
[email protected] www.hfm.global
Stuart M. Kinnaird
Research Analyst
+44 (0) 20 7832 6605