insights progress - strategic media
TRANSCRIPT
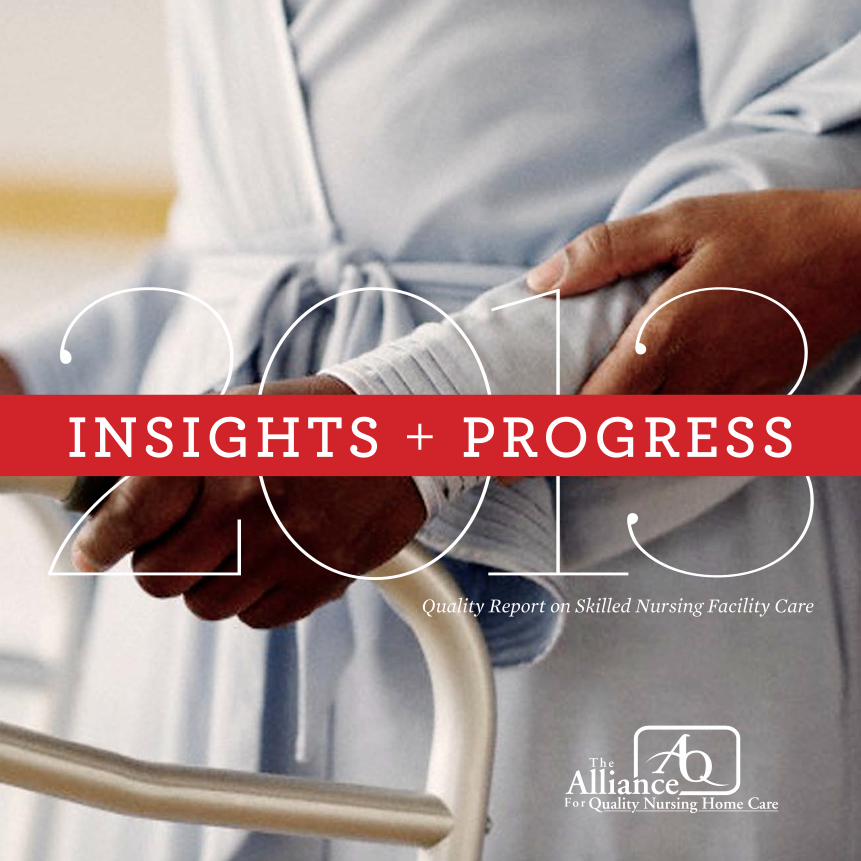
Quality Report on Skilled Nursing Facility Care
InsIghts + Progress

ContentsIntroduction ............................................................................................................................................................ 4
Alan Rosenbloom, President, Alliance for Quality Nursing Home Care
An Analysis of Quality in U.s. nursing homes ............................................................................................. 7
PointRight: Steven Littlehale, MS, GCNS-BC; Jane Niemi, MSN, RN, NHA; Cheryl Caswell, MBA, BA
John Gao, Ph.D., MS; Stanley Wang, MS, MA; Thomas Martin, MS
Continuity Assessment record and evaluation (CAre):
Developing standardized Assessment Items for Post-Acute Care ........................................................ 21
Barbara Gage, Ph.D., M.P.A.
Consumer and employee satisfaction: An Important Measure of Care and Caring ........................ 35
The data in this section of the report was provided by National Research Corporation, parent company of
My InnerView Products for Measuring Resident and Family Experience and Employee Engagement
Quality Initiatives: spotlights on success ................................................................................................... 45
Kindred Healthcare: Innovations in Reduced Lengths of Stay & Hospital Rehospitalizations ...................................... 48
HCR-ManorCare: Center-Based Medical Practice Model Nurse Practitioner Program .................................................. 52
Genesis: Focus on Short-Term, Post-Acute Rehabilitation ..................................................................................................... 58
Appendix A – Quality Measures: Changes from MDs 2.0 to MDs 3.0 ................................................. 64
Appendix B – Chapter 2 reference List ........................................................................................................ 66
3
Our goal in preparing this report is to provide
an objective national overview of Skilled Nursing
Facility (SNF) patient care quality, pertinent
quality trends, specific improvements, and areas
of care requiring continued attention. Further,
we seek to advance in the public arena the fun-
damental principle of transparency, and the
ongoing self-directed SNF sector trend towards
providing more data disclosure for consum-
ers to evaluate, more accountability for results,
and increased competition among facilities.
Overall, there has and always will be an immuta-
ble correlation among cumulative funding ade-
quacy, workforce stability and nursing home care
quality. If the federal budget and regulatory poli-
cies that have amassed more than $65 billion in
cumulative Medicare funding reductions over the
next ten years continue unabated – in lieu of sig-
nificant structural post-acute care (PAC) payment
reforms – the SNF sector will become unsustain-
able, to the detriment of elderly patients, the SNF
workforce, and the entire U.S. healthcare system.
As the 2013 health policy debate unfolds, qual-
ity must continue to be a focal point in helping
to transform the Medicare post-acute payment
system, which should be more closely tied to pa-
tient need. More broadly, an historic opportunity
for Medicare savings can be realized if the qual-
ity and cost advantages of SNFs are optimized
by federal legislative and regulatory policies.
In addition to reporting Quality Measure
Introduction
(QM) trends, this report examines rehos-
pitalization trends, facility survey perfor-
mance, and staffing patterns in U.S. SNFs.
The top line findings of this report include:
• Short-stay Quality Measures (QMs), including
pain and pressure ulcers, are steadily improving
(trending improvement since 2003);
• A majority of long-stay QMs are improving;
• Standardized patient assessment and quality
measurement across post-acute settings are
necessary to improving patient-centered coor-
dinated care and overall quality of care in our
nation’s healthcare delivery system.
Rigorous programs implemented over the past
decade have improved quality of care and quality
of life for SNF patients, and must continue in the
years and decades ahead. There remains room for
improvement. Today, however, there has never
been a broader recognition by the SNF commu-
nity about the seminal importance of quality in
advancing key Medicare payment reforms, nor a
broader commitment to work cooperatively with
government, regulators and consumers to help
drive ongoing, metrics-driven improvements.
Alan RosenbloomPresidentAlliance for Quality Nursing Home Care
5

An Analysis of Quality in U.s. nursing homes PointRight:Steven Littlehale, MS, GCNS-BC Jane Niemi, MSN, RN, NHA Cheryl Caswell, MBA, BA
John Gao, Ph.D., MS Stanley Wang, MS, MA Thomas Martin, MS
7
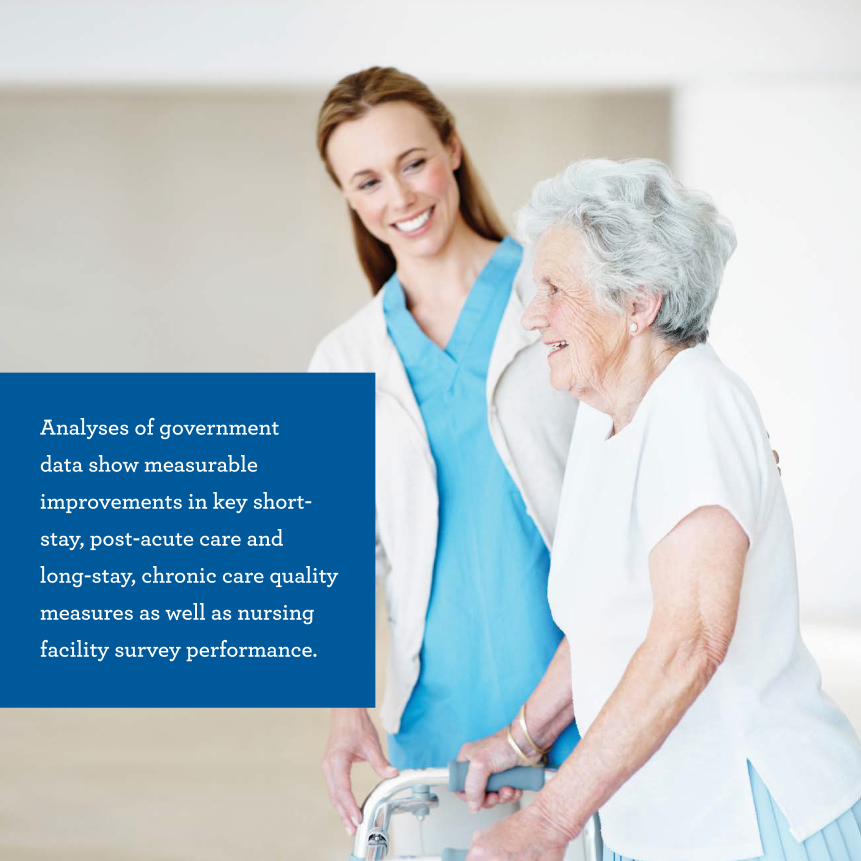
Analyses of government data show measurable improvements in key short-stay, post-acute care and long-stay, chronic care quality measures as well as nursing facility survey performance.
The Centers for Medicare & Medicaid
Services (CMS) publicly reports patient care
outcomes for the nation’s nursing facilities.
These Quality Measures (QMs) are based
on care items captured on the Minimum
Data Set (MDS), the assessment tool used
by nursing facility staff to assess individual
care needs and plans for interventions.
A new MDS assessment tool, referred to as
MDS 3.0, replaced the former 2.0 version
and was introduced in nursing facilities on
October 1, 2010. Substantial changes were
made in the new 3.0 version of the MDS,
which required development of new QMs.
Changes from the 2.0 to 3.0 QMs involved
revisions to the MDS items themselves as
well as coding instructions. Significant revi-
sions were also made to the methodology or
the selection of resident or patient samples
(long-stay residents vs. short-stay patients)
and to the types of MDS records used for
calculating performance on the QMs.
Due to the breadth of changes made, it
is impossible to directly compare the 2.0
QM rates to the 3.0 QM rates. Although
the names of measures may sound similar,
the 3.0 measures are not a continuation of
the 2.0 measures. Rather, the 3.0 measures
establish a new baseline for tracking and
trending quality performance. See Appendix
A for a table outlining differences between
the MDS 2.0 and MDS 3.0 QMs discussed in
this chapter.
nursing Facility Quality trends
9
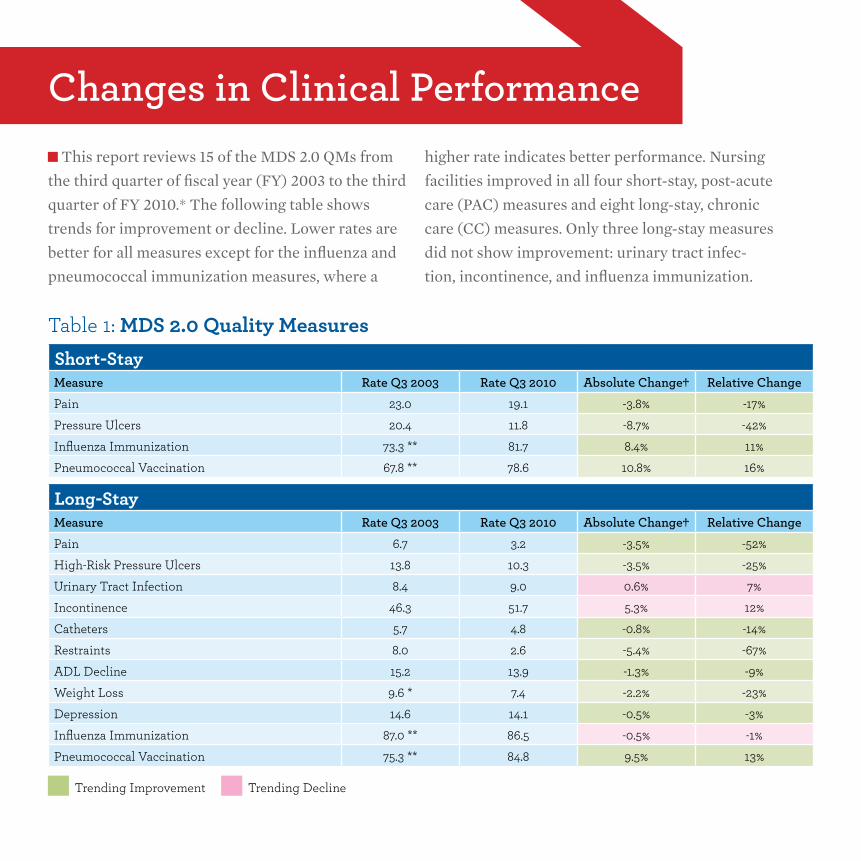
This report reviews 15 of the MDS 2.0 QMs from
the third quarter of fiscal year (FY) 2003 to the third
quarter of FY 2010.* The following table shows
trends for improvement or decline. Lower rates are
better for all measures except for the influenza and
pneumococcal immunization measures, where a
higher rate indicates better performance. Nursing
facilities improved in all four short-stay, post-acute
care (PAC) measures and eight long-stay, chronic
care (CC) measures. Only three long-stay measures
did not show improvement: urinary tract infec-
tion, incontinence, and influenza immunization.
Changes in Clinical Performance
Table 1: MDS 2.0 Quality MeasuresShort-StayMeasure rate Q3 2003 rate Q3 2010 Absolute Change† relative ChangePain 23.0 19.1 -3.8% -17%Pressure Ulcers 20.4 11.8 -8.7% -42%Influenza Immunization 73.3 ** 81.7 8.4% 11%Pneumococcal Vaccination 67.8 ** 78.6 10.8% 16%
Long-StayMeasure rate Q3 2003 rate Q3 2010 Absolute Change† relative ChangePain 6.7 3.2 -3.5% -52%High-Risk Pressure Ulcers 13.8 10.3 -3.5% -25%Urinary Tract Infection 8.4 9.0 0.6% 7%Incontinence 46.3 51.7 5.3% 12%Catheters 5.7 4.8 -0.8% -14%Restraints 8.0 2.6 -5.4% -67%ADL Decline 15.2 13.9 -1.3% -9%Weight Loss 9.6 * 7.4 -2.2% -23%Depression 14.6 14.1 -0.5% -3%Influenza Immunization 87.0 ** 86.5 -0.5% -1%Pneumococcal Vaccination 75.3 ** 84.8 9.5% 13%
Trending Improvement Trending Decline
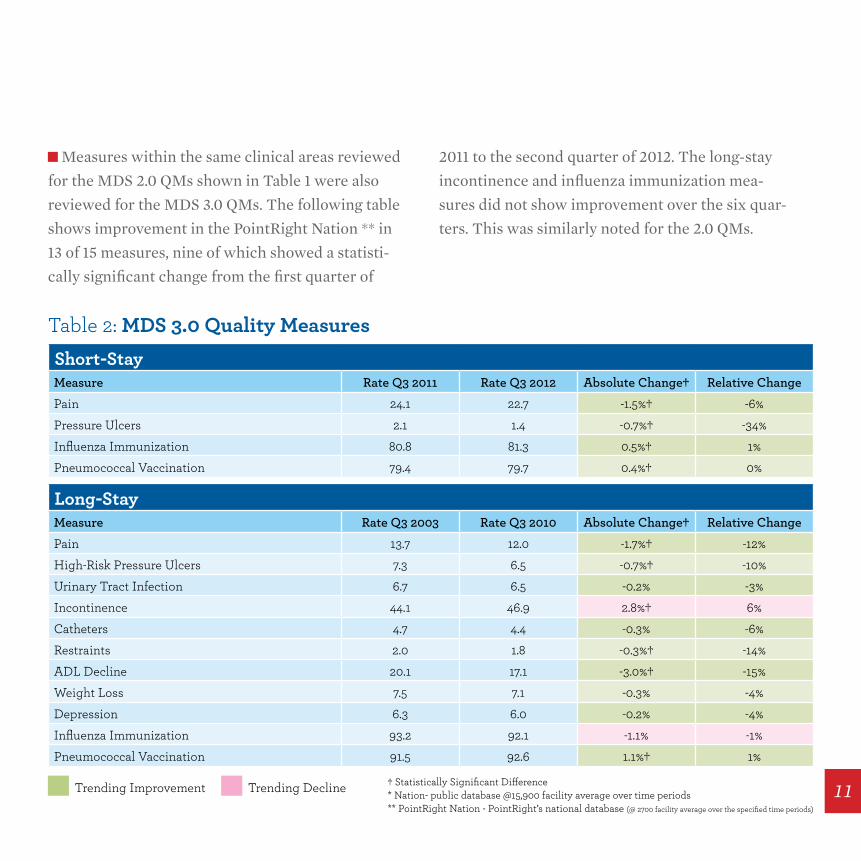
Measures within the same clinical areas reviewed
for the MDS 2.0 QMs shown in Table 1 were also
reviewed for the MDS 3.0 QMs. The following table
shows improvement in the PointRight Nation ** in
13 of 15 measures, nine of which showed a statisti-
cally significant change from the first quarter of
2011 to the second quarter of 2012. The long-stay
incontinence and influenza immunization mea-
sures did not show improvement over the six quar-
ters. This was similarly noted for the 2.0 QMs.
Table 2: MDS 3.0 Quality MeasuresShort-StayMeasure rate Q3 2011 rate Q3 2012 Absolute Change† relative ChangePain 24.1 22.7 -1.5%† -6%Pressure Ulcers 2.1 1.4 -0.7%† -34%Influenza Immunization 80.8 81.3 0.5%† 1%Pneumococcal Vaccination 79.4 79.7 0.4%† 0%
Long-StayMeasure rate Q3 2003 rate Q3 2010 Absolute Change† relative ChangePain 13.7 12.0 -1.7%† -12%High-Risk Pressure Ulcers 7.3 6.5 -0.7%† -10%Urinary Tract Infection 6.7 6.5 -0.2% -3%Incontinence 44.1 46.9 2.8%† 6%Catheters 4.7 4.4 -0.3% -6%Restraints 2.0 1.8 -0.3%† -14%ADL Decline 20.1 17.1 -3.0%† -15%Weight Loss 7.5 7.1 -0.3% -4%Depression 6.3 6.0 -0.2% -4%Influenza Immunization 93.2 92.1 -1.1% -1%Pneumococcal Vaccination 91.5 92.6 1.1%† 1%
Trending Improvement Trending Decline † Statistically Significant Difference * Nation- public database @15,900 facility average over time periods** PointRight Nation - PointRight’s national database (@ 2700 facility average over the specified time periods)
11
Q1 Q2 Q3 Q4 Q1 Q2
Rat
e (%
)
Trends in 3.0 QMShort-Stay Pain
23.0
22.5
22.0
2011 2012
24.0
24.5
23.5
PointRight Nation
Q1 Q2 Q3 Q4 Q1 Q2
Rat
e (%
)
Trends in 3.0 QMLong-Stay Pain
12.5
12.0
11.5
2011 2012
13.5
14.0
13.0
PointRight Nation
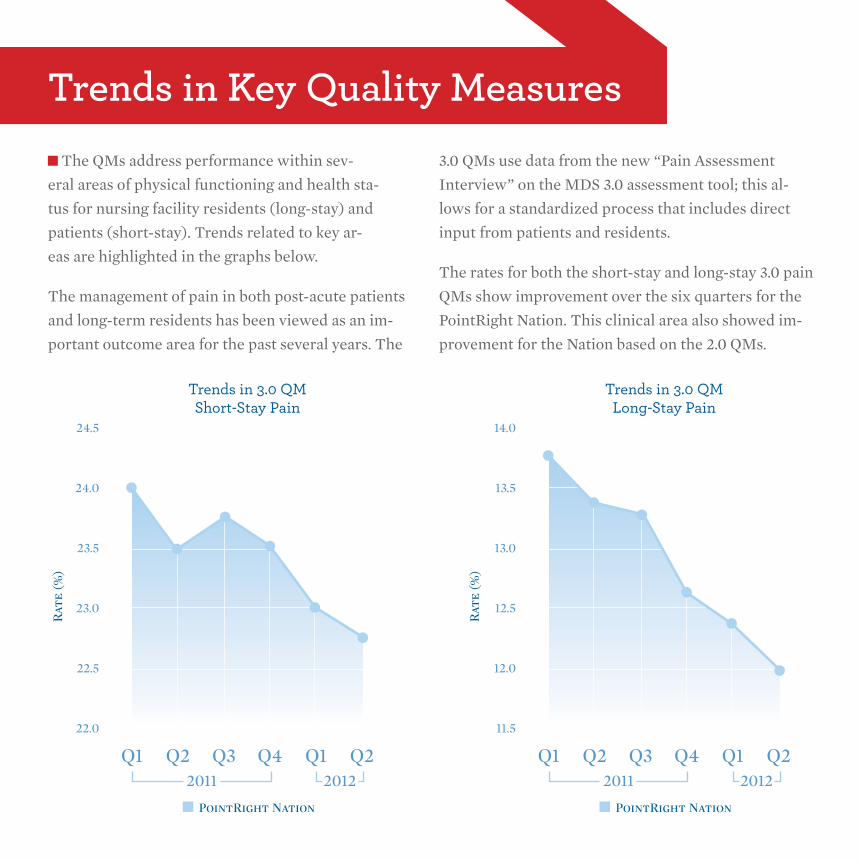
The QMs address performance within sev-
eral areas of physical functioning and health sta-
tus for nursing facility residents (long-stay) and
patients (short-stay). Trends related to key ar-
eas are highlighted in the graphs below.
The management of pain in both post-acute patients
and long-term residents has been viewed as an im-
portant outcome area for the past several years. The
3.0 QMs use data from the new “Pain Assessment
Interview” on the MDS 3.0 assessment tool; this al-
lows for a standardized process that includes direct
input from patients and residents.
The rates for both the short-stay and long-stay 3.0 pain
QMs show improvement over the six quarters for the
PointRight Nation. This clinical area also showed im-
provement for the Nation based on the 2.0 QMs.
trends in Key Quality Measures
Q1 Q2 Q3 Q4 Q1 Q2
Rat
e (%
)
Trends in 3.0 QMShort-Stay Pressure Ulcers
1.6
1.4
1.2
2011 2012
2.0
2.2
1.8
PointRight Nation
Q1 Q2 Q3 Q4 Q1 Q2
Rat
e (%
)
Trends in 3.0 QMLong-Stay High-Risk Pressure Ulcers
6.8
6.6
6.4
2011 2012
7.2
7.4
7.0
PointRight Nation
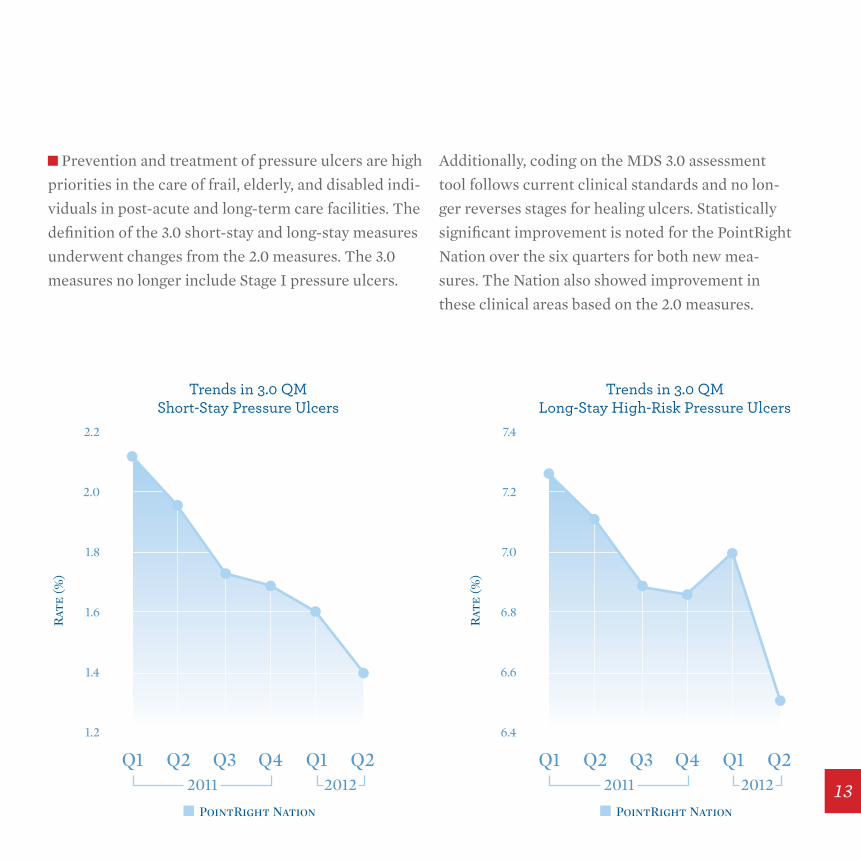
Prevention and treatment of pressure ulcers are high
priorities in the care of frail, elderly, and disabled indi-
viduals in post-acute and long-term care facilities. The
definition of the 3.0 short-stay and long-stay measures
underwent changes from the 2.0 measures. The 3.0
measures no longer include Stage I pressure ulcers.
Additionally, coding on the MDS 3.0 assessment
tool follows current clinical standards and no lon-
ger reverses stages for healing ulcers. Statistically
significant improvement is noted for the PointRight
Nation over the six quarters for both new mea-
sures. The Nation also showed improvement in
these clinical areas based on the 2.0 measures.
13
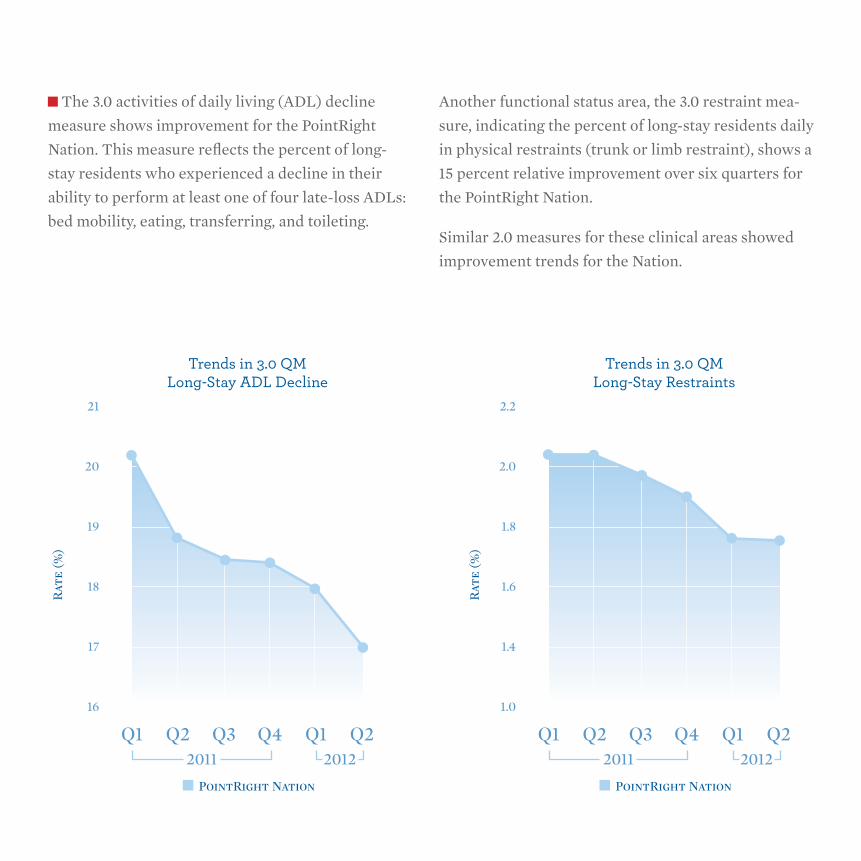
The 3.0 activities of daily living (ADL) decline
measure shows improvement for the PointRight
Nation. This measure reflects the percent of long-
stay residents who experienced a decline in their
ability to perform at least one of four late-loss ADLs:
bed mobility, eating, transferring, and toileting.
Another functional status area, the 3.0 restraint mea-
sure, indicating the percent of long-stay residents daily
in physical restraints (trunk or limb restraint), shows a
15 percent relative improvement over six quarters for
the PointRight Nation.
Similar 2.0 measures for these clinical areas showed
improvement trends for the Nation.
Q1 Q2 Q3 Q4 Q1 Q2
Rat
e (%
)
Trends in 3.0 QMLong-Stay ADL Decline
18
17
16
2011 2012
20
21
19
PointRight Nation
Q1 Q2 Q3 Q4 Q1 Q2
Rat
e (%
)
Trends in 3.0 QMLong-Stay Restraints
1.6
1.4
1.0
2011 2012
2.0
2.2
1.8
PointRight Nation
Q1 Q2 Q3 Q4 Q1 Q2
Rat
e (%
)
Trends in 3.0 QMLong-Stay Weight Loss
7.0
6.8
6.6
2011 2012
7.4
7.6
7.2
PointRight Nation
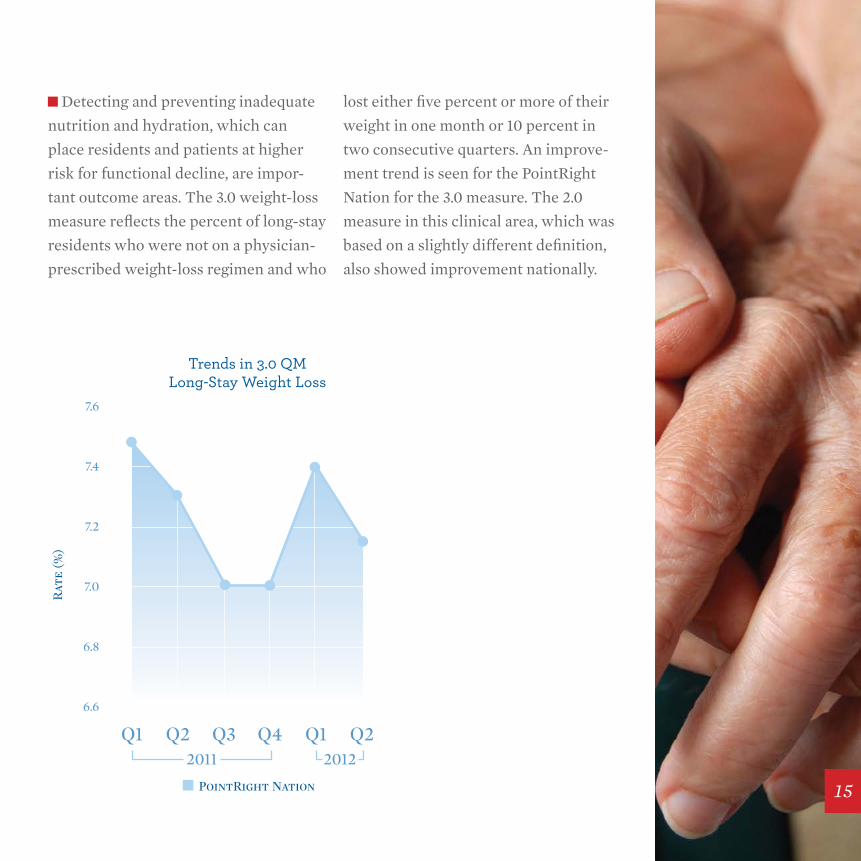
Detecting and preventing inadequate
nutrition and hydration, which can
place residents and patients at higher
risk for functional decline, are impor-
tant outcome areas. The 3.0 weight-loss
measure reflects the percent of long-stay
residents who were not on a physician-
prescribed weight-loss regimen and who
lost either five percent or more of their
weight in one month or 10 percent in
two consecutive quarters. An improve-
ment trend is seen for the PointRight
Nation for the 3.0 measure. The 2.0
measure in this clinical area, which was
based on a slightly different definition,
also showed improvement nationally.
15
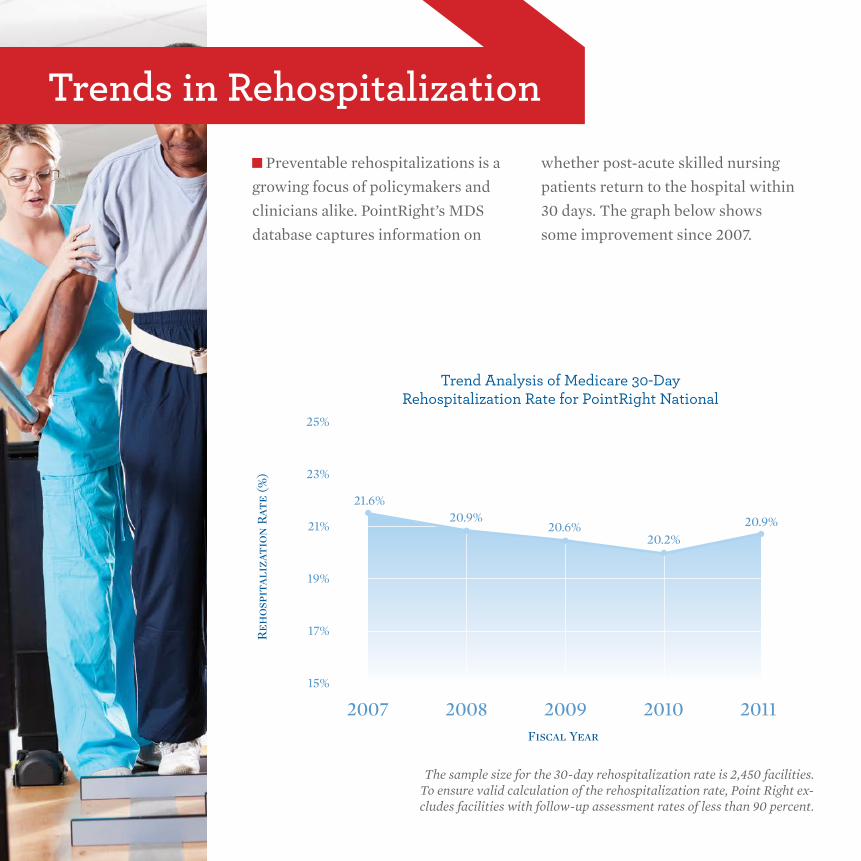
Reh
ospi
tali
zati
on R
ate
(%)
2007 2008 2009 2010 2011
Trend Analysis of Medicare 30-DayRehospitalization Rate for PointRight National
Fiscal Year
19%
17%
15%
23%
25%
21%
21.6%20.9%
20.6%20.2%
20.9%
trends in rehospitalization Preventable rehospitalizations is a
growing focus of policymakers and
clinicians alike. PointRight’s MDS
database captures information on
whether post-acute skilled nursing
patients return to the hospital within
30 days. The graph below shows
some improvement since 2007.
The sample size for the 30-day rehospitalization rate is 2,450 facilities. To ensure valid calculation of the rehospitalization rate, Point Right ex-cludes facilities with follow-up assessment rates of less than 90 percent.
8
3
4
5
6
7
10%
5%
4%
6%
7%
8%
9%
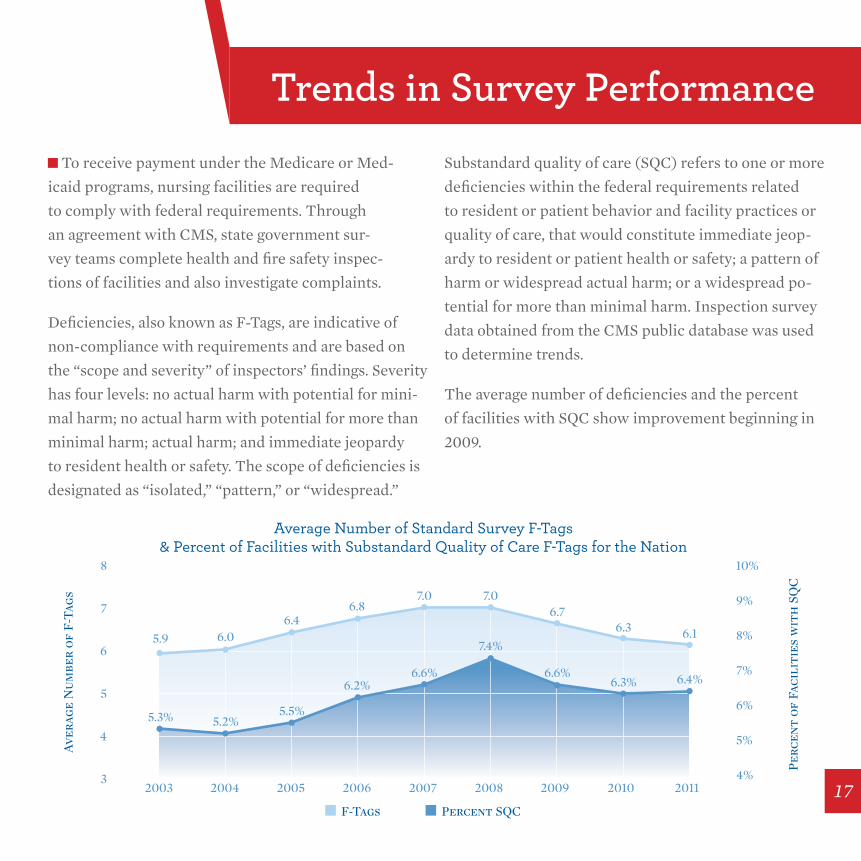
2003 20112010200920082007200620052004
F-Tags Percent SQC
Average Number of Standard Survey F-Tags& Percent of Facilities with Substandard Quality of Care F-Tags for the Nation
Aver
age
Nu
mbe
r of
F-T
ags
Per
cen
t of
Fac
ilit
ies
wit
h S
QC
5.9
5.3%
6.0
5.2%
6.4
5.5%
6.8
6.2%
7.0
6.6%
7.0
7.4%
6.7
6.6%
6.3
6.3%
6.1
6.4%
To receive payment under the Medicare or Med-
icaid programs, nursing facilities are required
to comply with federal requirements. Through
an agreement with CMS, state government sur-
vey teams complete health and fire safety inspec-
tions of facilities and also investigate complaints.
Deficiencies, also known as F-Tags, are indicative of
non-compliance with requirements and are based on
the “scope and severity” of inspectors’ findings. Severity
has four levels: no actual harm with potential for mini-
mal harm; no actual harm with potential for more than
minimal harm; actual harm; and immediate jeopardy
to resident health or safety. The scope of deficiencies is
designated as “isolated,” “pattern,” or “widespread.”
Substandard quality of care (SQC) refers to one or more
deficiencies within the federal requirements related
to resident or patient behavior and facility practices or
quality of care, that would constitute immediate jeop-
ardy to resident or patient health or safety; a pattern of
harm or widespread actual harm; or a widespread po-
tential for more than minimal harm. Inspection survey
data obtained from the CMS public database was used
to determine trends.
The average number of deficiencies and the percent
of facilities with SQC show improvement beginning in
2009.
trends in survey Performance
17
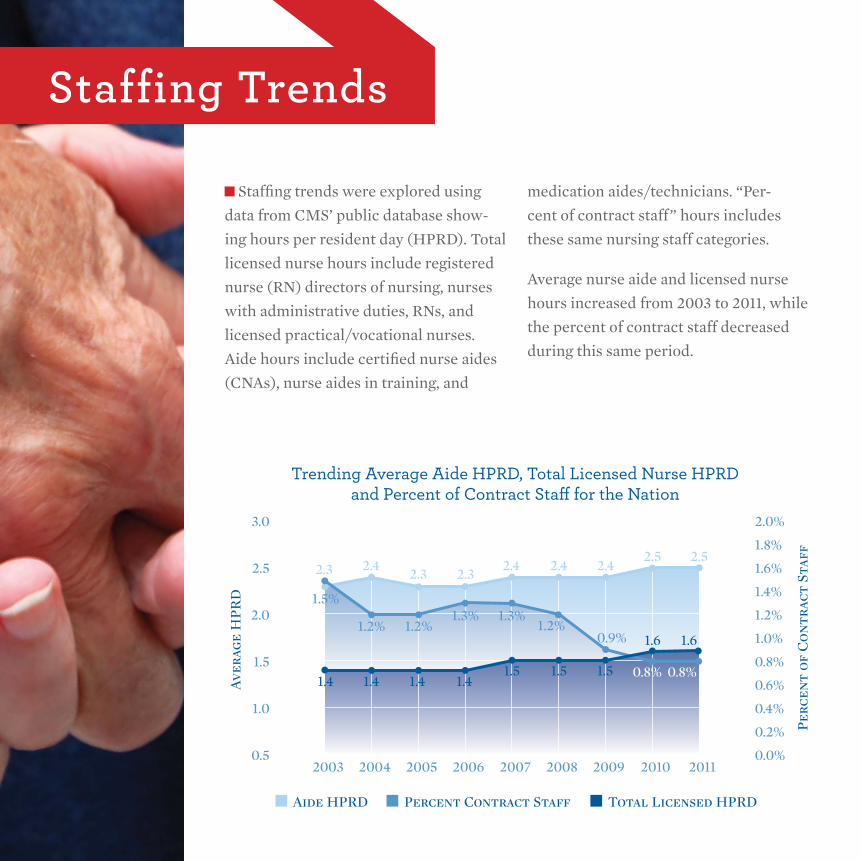
Staffing trends were explored using
data from CMS’ public database show-
ing hours per resident day (HPRD). Total
licensed nurse hours include registered
nurse (RN) directors of nursing, nurses
with administrative duties, RNs, and
licensed practical/vocational nurses.
Aide hours include certified nurse aides
(CNAs), nurse aides in training, and
medication aides/technicians. “Per-
cent of contract staff” hours includes
these same nursing staff categories.
Average nurse aide and licensed nurse
hours increased from 2003 to 2011, while
the percent of contract staff decreased
during this same period.
3.0
2.5
2.0
1.5
1.0
0.52003 2004
Aide HPRD
Aver
age
HP
RD
Per
cen
t of
Con
trac
t St
aff
2005 2006 2007 2008 2009 2010 2011
2.0%
1.6%
1.2%
0.8%
0.4%
0.0%
1.8%
1.4%
1.0%
0.6%
0.2%
Percent Contract Staff
Trending Average Aide HPRD, Total Licensed Nurse HPRDand Percent of Contract Sta� for the Nation
Total Licensed HPRD
1.5%
1.2% 1.2%1.3% 1.3%
1.2%0.9%
0.8% 0.8%1.4 1.4 1.4 1.4
1.51.5 1.5
1.6 1.6
2.52.52.42.4 2.4
2.32.32.3 2.4
staffing trends

19

“ this effort provides the foundation for uniform language across the continuum to describe the complexity of populations treated, regardless of setting. having a uniform language, independent of clinical training, will be important to improving coordination of care and understanding differences in complexity of patients and their outcomes across the healthcare spectrum.”
Continuity Assessment record and evaluation (CAre): Developing standardized Assessment Items for Post-Acute Care Barbara Gage, Ph.D., M.P.A.
21
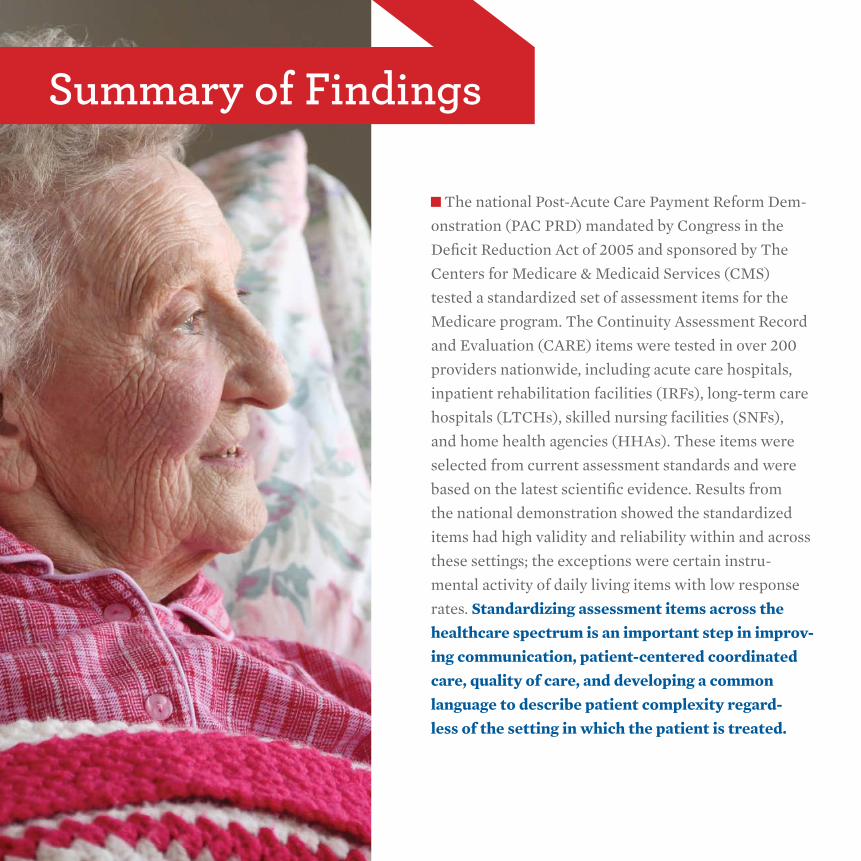
The national Post-Acute Care Payment Reform Dem-
onstration (PAC PRD) mandated by Congress in the
Deficit Reduction Act of 2005 and sponsored by The
Centers for Medicare & Medicaid Services (CMS)
tested a standardized set of assessment items for the
Medicare program. The Continuity Assessment Record
and Evaluation (CARE) items were tested in over 200
providers nationwide, including acute care hospitals,
inpatient rehabilitation facilities (IRFs), long-term care
hospitals (LTCHs), skilled nursing facilities (SNFs),
and home health agencies (HHAs). These items were
selected from current assessment standards and were
based on the latest scientific evidence. Results from
the national demonstration showed the standardized
items had high validity and reliability within and across
these settings; the exceptions were certain instru-
mental activity of daily living items with low response
rates. Standardizing assessment items across the healthcare spectrum is an important step in improv-ing communication, patient-centered coordinated care, quality of care, and developing a common language to describe patient complexity regard-less of the setting in which the patient is treated.
summary of Findings
About one in five Medicare beneficiaries is admitted to the hospital each year. Al-most 40 percent of these patients will be discharged to one of four Post-Acute Care (PAC) settings, including skilled nursing fa-
cilities (SNFs), inpatient rehabilitation facili-
ties (IRFs), long-term care hospitals (LTCHs),
and home health agencies (HHA) for addi-
tional nursing or therapy treatments (Gage et
al, 2012a). Skilled nursing facilities typically admit the largest share of these PAC cases
(Gage, 1999; Gage et al., 2005; Gage et al, 2009;
Gage et al, 2012 PAC PRD) followed by HHAs
(37 percent), IRFs (9 percent), ambulatory
therapy providers (such as hospital outpatient
departments, clinics, and therapists offices) (9
percent) and LTCHs (2 percent). And many of
these PAC patients are discharged to at least a
second PAC provider during their episode of
care, particularly those discharged from SNFs
and LTCHs (Gage et al, 2012a). About two-
thirds of the PAC cases discharged to SNFs
received additional services. Almost a quarter
of the SNF cases were transferred back to the
acute hospital in 2008 (23.1 percent). Another
third (32.7 percent) were discharged from
the SNF to a HHA. Among patients with the
acute-SNF-HHA pattern, another 20 percent
returned to the acute hospital within 30 days of
discharge from the HHA (Gage et al, 2012a).
In general, the four PAC settings are assumed
to differ in the type and intensity of services
provided, effectively providing a “continuum
of care.” But these providers’ services are not
mutually exclusive; each of the three inpatient
PAC settings (LTCHs, IRFs, and SNFs) provide
24-hour nursing, and all four settings provide
physical, occupational, and speech pathology
services to some extent. Past research has shown
that the types of patients treated in these set-
tings appear to overlap (Gage et al, 2009, Gage et
al, 1999). Communicating across settings in a consistent language is key to improving care coordination and patient outcomes.
Why standardize Items?
23
CMS awarded a contract to Dr. Gage and her team
at RTI, International to develop a standardized set
of items for use across acute and PAC settings.1 The
standardized CARE items were built on the current
state of the science in each of the medical com-
munities, the existing assessment tools which had
each been developed at different times and by dif-
ferent research teams, and stakeholder input. Input
was provided by representatives from each of the
five levels of care (acute hospitals and the four PAC
settings) and clinicians from each of the various
disciplinary areas, including nursing, therapy, case
management, and physicians. Collaborators includ-
ed practicing geriatricians and physiatrists, as well
as experts in the MDS, the IRF-PAI, and the OASIS
tools. Stakeholder input was collected through a
variety of mechanisms, including CMS-sponsored
Open Door Forums, Technical Expert Panels, pro-
fessional meetings, and on-going e-mail solicitation
of input. Over 25 associations were involved in identifying the assessment domains needed to differentiate health status complexity among Medicare beneficiary populations. Experts famil-
iar with the assessment items currently used in the
acute and PAC settings also participated to discuss
the implications of selecting items originally tested
in different settings.2 These provider associations
and the clinical and measurement experts provided
valuable input regarding the types of concepts need-
ed to measure differences in severity and the best
items to measure those concepts across all settings.
Development of the CAre Item set
1 The CARE team included collaborators from the University of Pennsylvania, the Rehabilitation Institute of Chicago, UCLA, Visiting Nurse Services of New York, Case Western, and several pilot site participants, including RML Hospital, Edward Hospital, Alexian Hospital, and the VNA of Fox Valley.
2 Stakeholder input was critical to the CARE development process. The conceptual domains and specific items were selected by the major stakeholders and subject matter experts including clinicians, policymakers, providers, and national professional and provider associations. Some of the participating associations included American Health Care Association, American Hospital Association, Acute Long-Term Hospital Association, the National Association of Long-Term Hospitals, the American Medical Rehabilitation Providers Association, Commission on the Accreditation of Rehabilitation Facilities, The Joint Commission, Leading Age (for-merly American Association of Homes and Services for the Aging), National Association for Home Care, and the Visiting Nurse Association of America. Additional input was provided throughout the process by several clinical communities, including the National Pressure Ulcer Advisory Panel, the Association of Rehabilitation Nurses, the American Physical Therapy Association, the American Occupational Therapy Association, the American Speech-Language-Hearing Association, the American Medical Directors Association, and the American Academy of Physical Medicine and Rehabilitation, among others.
the CAre Item set
The stakeholders identified four clinical domains
that were important in measuring patient complex-
ity and some of the factors affecting treatment op-
tions. These areas are all typically assessed today,
either formally with a standardized item within
a setting or informally in chart notes. These in-
clude the following (a complete set of standard-
ized items can be found at www.pacdemo.rti.org):
These four domains are typically collected in all of the
settings although the information may be collected
informally in some settings, as in chart notes, and the
item used and type of professional assessing each fac-
tor may vary by setting. For healthier patients, fewer
items are relevant. For the more complex patients,
the CARE items offer standardized versions of infor-
mation already typically collected on those types of
patients (Gage et al, 2012b).
the CAre tool Items
Medical Status/Clinical Complexity — These items measure patient medical status and define complexity in terms of medical diagnoses, comorbid conditions, major treatments received during stay (e.g., ventilator weaning, hemodialysis), medications, skin integrity (number and size of pressure ulcers and locations and presence of other wounds), and physiologic factors (e.g., vital signs, laboratory results, blood gases, pulmonary function). Some of these items may be irrelevant for a healthier patient but including them provides a standard measurement when needed.
Functional Status — These items include screening items on impairments (e.g., bladder, bowel, swallowing, vision, hearing, weight-bearing, grip strength, respiratory status, and endurance), as well as measures of self-care, mobility, and safety-related functions (medication management, phone management) and other independent activities of daily living items relevant to less impaired populations.
Cognitive Status — These items target memory/ recall ability; delirium/confusion (some of which may be short-term
related to current medications or longer term, which may complicate rehabilitation therapy); behavioral symptoms,
including those that are self-injurious (pulling IV lines) or directed toward others; signs of depression or sadness; and
presence of pain, which may affect patients’ engagement and outcomes.
Social Support Factors — These items target social support issues, including information on structural barriers
in the home, living situations, caregiver availability, and the need for assistance, as well as issues related to
discharge complications.
25
Final item selection was based on the input of
clinicians from each of the different levels of care
and the different clinical disciplines, including nurs-
ing, therapy, case management, psychology, and
physicians. Four workgroups were formed to pro-
vide appropriate clinical input for each of the four
domains. The three federally mandated assessment
tools were reviewed for items currently measuring
these concepts, as were items currently used in other
systems, such as in the acute and LTCH hospitals,
Veterans Administration, and past research efforts
(See Gage et al, 2012b for a complete discussion of
the item selection process.) The workgroups con-
sidered item applicability across all the populations
and took into account certain overriding consider-
ations, such as ceiling and floor effects, specificity/
granularity, and burden on clinicians to collect data.
A review of the three federally mandated tools used in 2006 showed they all measured similar concepts, but they used different clinical items,
timeframes for data collection, and measurement
scales (Gage and Greene, 2006).2 For example, each
of the three tools measured skin integrity, but the
IRF-PAI and OASIS used the PUSH tool items while
the MDS used a set of items more closely related to
the current recommendations of the National Pres-
sure Ulcer Advisory Panel. Measures of function also
differed across each of the tools. Each had measures
of activities of daily living and mobility. However, the item definitions and the measurement scales varied, making it difficult to compare the self care or mobility status of a patient in one setting with that of a patient in another setting. These
differences affected items in all the domains, includ-
ing even the identification of the medical condition
where most tools used ICD-9 codes but the MDS
used check-off boxes identifying broad groups of
conditions. Though these differences permit good
measurement within each setting, they fail to allow
patient-centered, cross-setting considerations of
quality and outcomes.
The selected items also needed to minimize floor
and ceiling effects. Certain items in the existing tools
were limited in their ability to measure acuity for
the very sickest (floor effects) and the very healthi-
est patients (ceiling effects) and thus in their ability
to explain variation across patients having a broad
range of severity across an episode of care as found
Item selection Considerations
in the PAC populations. CARE items and scales
were selected to reduce those limitations in the
current tools yet still have the granularity needed
to measure individual patients.
Assessment windows also varied across set-tings making it difficult to compare the pa-tients’ health status at the same point in time, such as at admission. Patients in the LTCH are
typically assessed throughout the stay, includ-
ing within the first 24 hours of admission; IRF
admissions data reflect the first 72 hours of the
stay; SNFs collect data reflecting the first five
days of the admission; and HHAs submit initial
assessment data related to the first visit, which is
tied to the physician’s ordered start date or with-
in the first 48 hours of referral or return home
although HHA staff have five days to complete
the comprehensive assessment. These differ-
ences make it difficult to compare patient sever-
ity at the same point in time across providers. A
standardized set of assessment items and rules is
needed to allow a common language for commu-
nicating across settings. Data collection burden
was another key consideration in selecting items.
Items were restricted to the type already being
collected in each setting, although not neces-
sarily in each assessment tool. Some items, such
as vision and hearing limitations, were noted in
charts and discharge summaries but not consis-
tently collected or measured. To avoid undue
burden, the standardized items were broken into
two types – a small subset of core items for col-
lection on all patients and a supplemental set of
items selectively used to define severity of a con-
dition when a condition was present. Few items apply to all patients, but the CARE items pro-vide standardized items to use when needed.
Item validity and reliability was another impor-
tant consideration. Items included in the federal
set needed to be valid measures of the concepts
they were intended to measure and be reliable
across assessors. Most CARE items had already
been tested in at least one population but it was
important to measure reliability in all the set-
tings in which the item would be used. Extensive
testing of the reliability and validity of the items
was conducted to determine whether the stan-
dardized version in the CARE tool was as reliable
and valid as the item in the original source.
2 The MDS 2.0 and OASIS-B were in use at the time of the CARE development. CARE items were coordinated with MDS 3.0 and, OASIS-C development.27
The CARE tool items were extensively
pilot-tested during the development process.
Reliability and validity were tested during the
demonstration. Practicing clinicians in each
setting were trained on the standardized item
set prior to their use. These clinicians were
asked to provide continuous feedback on the
uses of items with different types of patients
in their respective settings. This was helpful
for soliciting practicing clinicians’ input on
the applicability of each item to the types of
patient they were treating. Helpful comments
were provided, including requests for some of
the cognitive measures to be applied at both
admission and discharge, instead of just PAC
admission. Positive feedback from the train-
ings focused on two areas in particular: Nurs-
ing staff across the settings appreciated the
input of the leading scientific communities
in recommending standard approaches for
measuring pressure ulcers and other factors.
Second, SNF and HHA therapy staff appreci-
ated the more specific functional status mea-
sures included in the CARE tool. They felt
the items better reflected the complexity of
their cases and the improvements achieved
through their treatments Gage et al, 2012b).
More formal analysis of validity was also
conducted using statistical methods. Factor analysis was used to test domain identifica-tions by examining intercorrelations among variables within a common domain. For ex-
ample, the CARE item set included 34 function
items. However, the factor analysis illustrated
the presence of three subscales among them –
self-care (9 items), mobility (15 items), and in-
strumental activities of daily living (10 items).
The subscale identification is important for
grouping items into concise, conceptual mea-
sure areas. In addition, the validity of CARE
items was assessed relative to existing items in
the legacy tools (MDS, OASIS, and IRF-PAI).
Differences were expected in the rating of pa-
tients using the legacy and CARE items given
that the definitions of items and scales differed
across each tool (see Gage et al, 2012b for a
complete discussion).
Item Validity & reliability tests
Two formal types of reliability tests were con-
ducted. The first used a traditional inter-rater
reliability study approach to measure the reli-
ability of the standardized items when applied to
populations in settings other than those for whom
the items were originally validated. The second
type of test, where assessors in different settings
rated uniform “hypothetical” patients, examined
the degree of agreement when items were used by
different disciplines in different settings. Overall,
the results showed very good agreement on most
items. The reliability results were consistent with
those achieved in earlier tests of the MDS, OA-
SIS, and IRF-PAI (Gage et al, 2012b). This sug-
gests the standardized items can reliably replace
items in the current legacy tools. Across all 146
items tested, only 17 percent had a rating lower
than 0.60, including both the unweighted and
weighted kappas and in samples with and without
missing values included. These kappa values are
equal or exceeding the reliability of the current
tools (Ibid.).
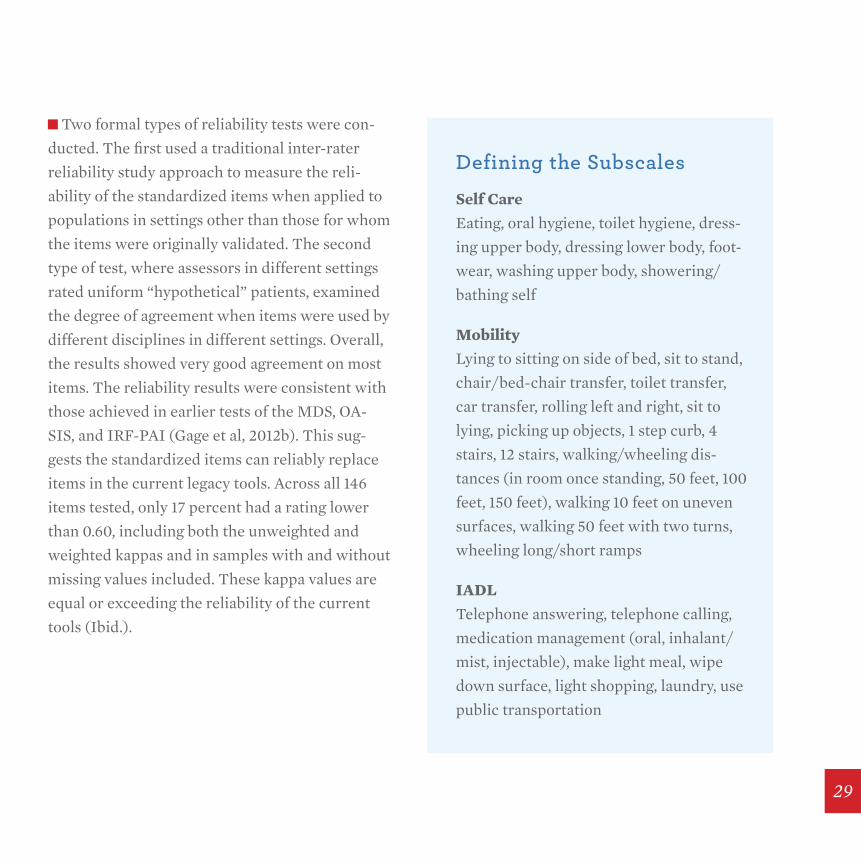
Self Care Eating, oral hygiene, toilet hygiene, dress-
ing upper body, dressing lower body, foot-
wear, washing upper body, showering/
bathing self
Mobility Lying to sitting on side of bed, sit to stand,
chair/bed-chair transfer, toilet transfer,
car transfer, rolling left and right, sit to
lying, picking up objects, 1 step curb, 4
stairs, 12 stairs, walking/wheeling dis-
tances (in room once standing, 50 feet, 100
feet, 150 feet), walking 10 feet on uneven
surfaces, walking 50 feet with two turns,
wheeling long/short ramps
IADL Telephone answering, telephone calling,
medication management (oral, inhalant/
mist, injectable), make light meal, wipe
down surface, light shopping, laundry, use
public transportation
Defining the subscales
29
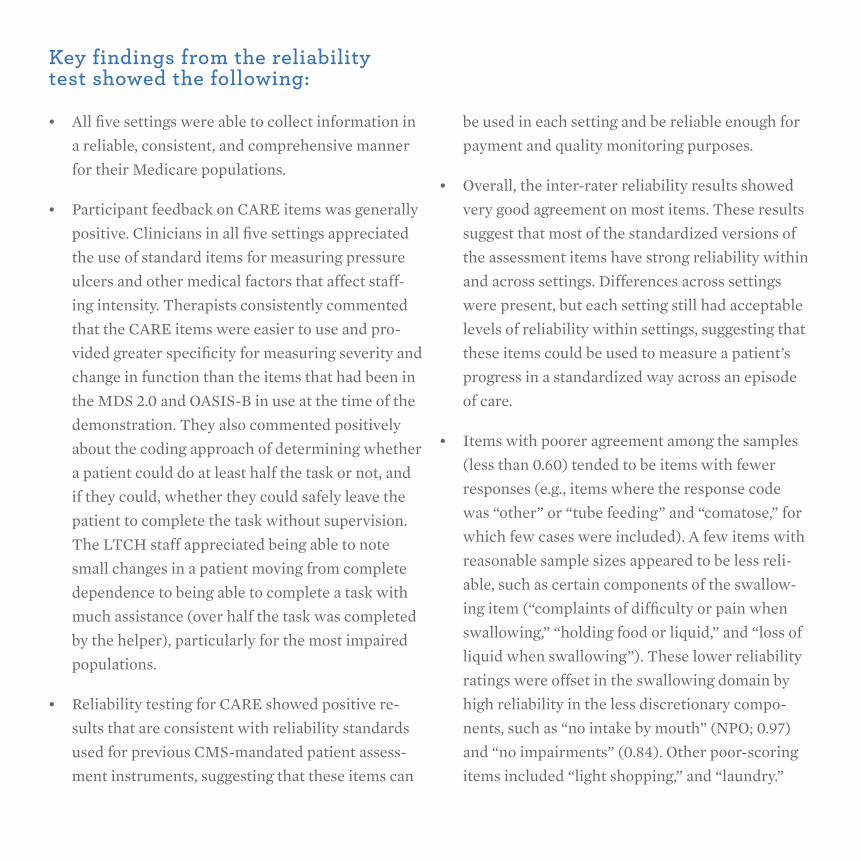
• All five settings were able to collect information in
a reliable, consistent, and comprehensive manner
for their Medicare populations.
• Participant feedback on CARE items was generally
positive. Clinicians in all five settings appreciated
the use of standard items for measuring pressure
ulcers and other medical factors that affect staff-
ing intensity. Therapists consistently commented
that the CARE items were easier to use and pro-
vided greater specificity for measuring severity and
change in function than the items that had been in
the MDS 2.0 and OASIS-B in use at the time of the
demonstration. They also commented positively
about the coding approach of determining whether
a patient could do at least half the task or not, and
if they could, whether they could safely leave the
patient to complete the task without supervision.
The LTCH staff appreciated being able to note
small changes in a patient moving from complete
dependence to being able to complete a task with
much assistance (over half the task was completed
by the helper), particularly for the most impaired
populations.
• Reliability testing for CARE showed positive re-
sults that are consistent with reliability standards
used for previous CMS-mandated patient assess-
ment instruments, suggesting that these items can
be used in each setting and be reliable enough for
payment and quality monitoring purposes.
• Overall, the inter-rater reliability results showed
very good agreement on most items. These results
suggest that most of the standardized versions of
the assessment items have strong reliability within
and across settings. Differences across settings
were present, but each setting still had acceptable
levels of reliability within settings, suggesting that
these items could be used to measure a patient’s
progress in a standardized way across an episode
of care.
• Items with poorer agreement among the samples
(less than 0.60) tended to be items with fewer
responses (e.g., items where the response code
was “other” or “tube feeding” and “comatose,” for
which few cases were included). A few items with
reasonable sample sizes appeared to be less reli-
able, such as certain components of the swallow-
ing item (“complaints of difficulty or pain when
swallowing,” “holding food or liquid,” and “loss of
liquid when swallowing”). These lower reliability
ratings were offset in the swallowing domain by
high reliability in the less discretionary compo-
nents, such as “no intake by mouth” (NPO; 0.97)
and “no impairments” (0.84). Other poor-scoring
items included “light shopping,” and “laundry.”
Key findings from the reliability test showed the following:

31
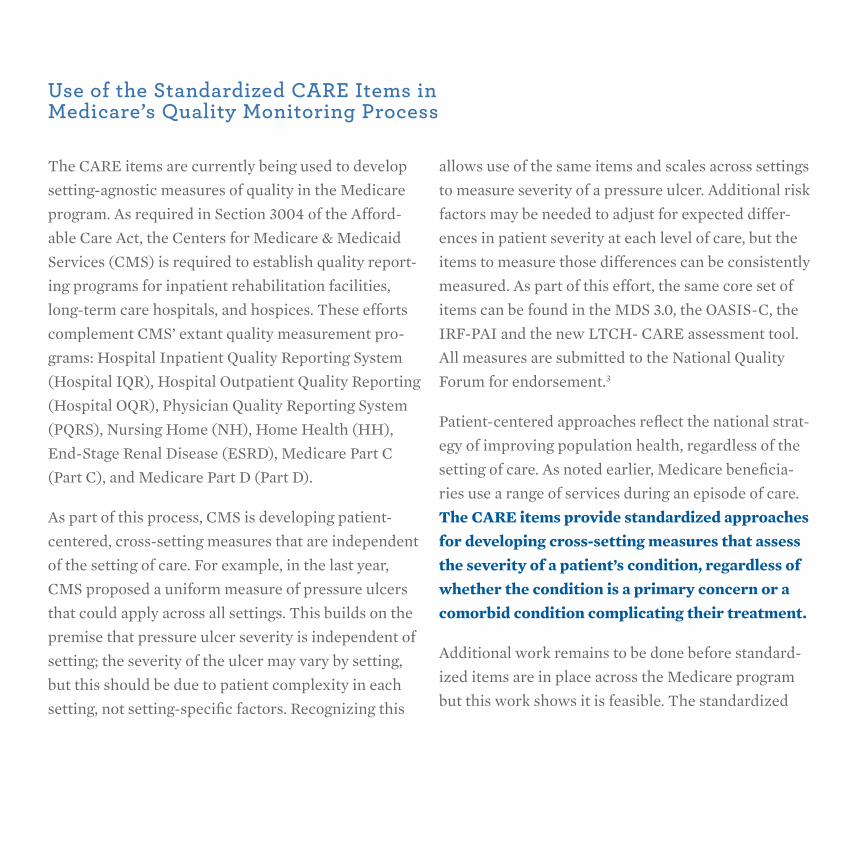
The CARE items are currently being used to develop
setting-agnostic measures of quality in the Medicare
program. As required in Section 3004 of the Afford-
able Care Act, the Centers for Medicare & Medicaid
Services (CMS) is required to establish quality report-
ing programs for inpatient rehabilitation facilities,
long-term care hospitals, and hospices. These efforts
complement CMS’ extant quality measurement pro-
grams: Hospital Inpatient Quality Reporting System
(Hospital IQR), Hospital Outpatient Quality Reporting
(Hospital OQR), Physician Quality Reporting System
(PQRS), Nursing Home (NH), Home Health (HH),
End-Stage Renal Disease (ESRD), Medicare Part C
(Part C), and Medicare Part D (Part D).
As part of this process, CMS is developing patient-
centered, cross-setting measures that are independent
of the setting of care. For example, in the last year,
CMS proposed a uniform measure of pressure ulcers
that could apply across all settings. This builds on the
premise that pressure ulcer severity is independent of
setting; the severity of the ulcer may vary by setting,
but this should be due to patient complexity in each
setting, not setting-specific factors. Recognizing this
allows use of the same items and scales across settings
to measure severity of a pressure ulcer. Additional risk
factors may be needed to adjust for expected differ-
ences in patient severity at each level of care, but the
items to measure those differences can be consistently
measured. As part of this effort, the same core set of
items can be found in the MDS 3.0, the OASIS-C, the
IRF-PAI and the new LTCH- CARE assessment tool.
All measures are submitted to the National Quality
Forum for endorsement.3
Patient-centered approaches reflect the national strat-
egy of improving population health, regardless of the
setting of care. As noted earlier, Medicare beneficia-
ries use a range of services during an episode of care.
The CARE items provide standardized approaches for developing cross-setting measures that assess the severity of a patient’s condition, regardless of whether the condition is a primary concern or a comorbid condition complicating their treatment.
Additional work remains to be done before standard-
ized items are in place across the Medicare program
but this work shows it is feasible. The standardized
Use of the standardized CAre Items in Medicare’s Quality Monitoring Process
Questions about this article can be di-
rected to Barbara Gage, Ph.D., Fellow and
Managing Director, The Engelberg Center
for Health Care Reform at the Brookings
Institution, [email protected] or 202-
238-3571.
3 CMS contracts with the National Quality Forum as the consensus -based entity responsible for convening multi-stakeholder groups (the Measures Application Partner-ship or MAP) to provide input to HHS on the identification of the best available performance measures and the selection of these measures for use in the programs listed in Section 1890(b)(7)(B)(i)(I) of the Act.
versions of the items are reliable when applied to
the acute and PAC populations. They are being
used in the Medicare program quality measures to
measure common conditions, such as pressure ul-
cers, and are being considered for functional status
outcomes. For additional information, see http://
www.cms.gov/Center/Special-Topic/ Quality-of-
Care-Center.html. These efforts will continue over
the next few years as CMS moves to more uniform
measurement approaches across an episode of
care.
This effort provides the foundation for uniform
language across the continuum to describe the
complexity of populations treated, regardless of
setting. Clinical staff in particular found this ap-
proach useful as patients are transferred across
settings into their care. Having a uniform lan-guage, independent of clinical training, will be important in improving coordination of care and understanding differences in complexity of patients and their outcomes across the health-care spectrum.
33

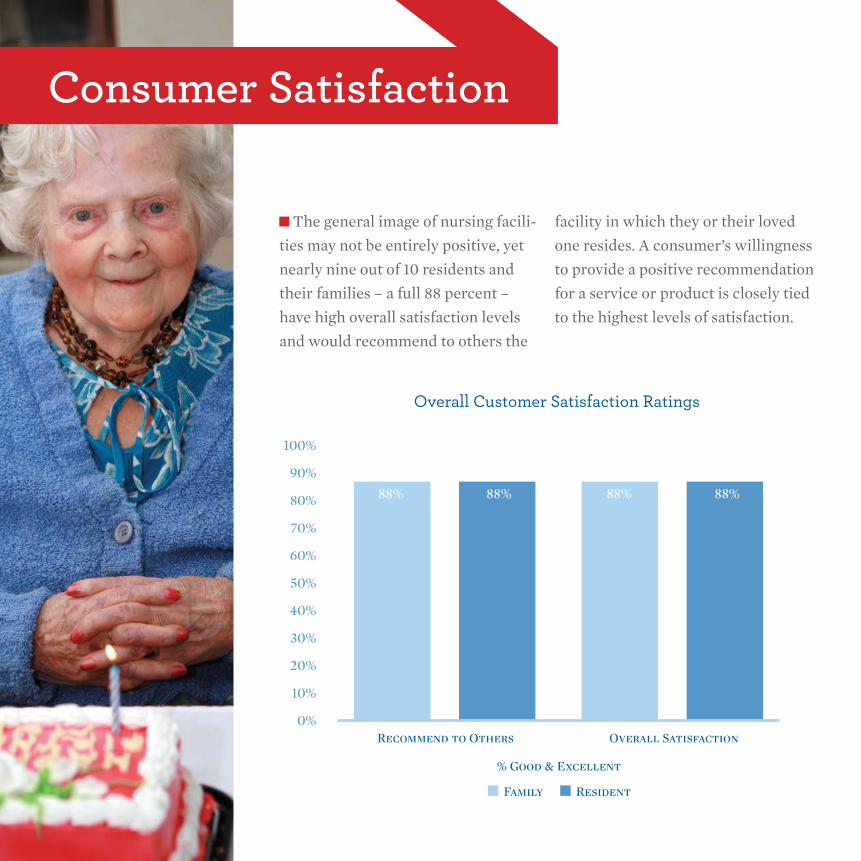
“ nearly nine out of 10 residents and their families – a full 88 percent – have high overall satisfaction levels and would recommend to others the facility in which they or their loved one resides.”
Consumer and employee satisfaction: An Important Measure of Care and CaringThe data in this report present insights gathered from residents, families, and employees in surveys administered by National Research Corporation through its My InnerView subsidiary. National Research Corporation maintains the largest database of experience, satisfaction, and commitment data across all long-term care settings, but this report is limited to data collected on skilled nursing facilities.
35
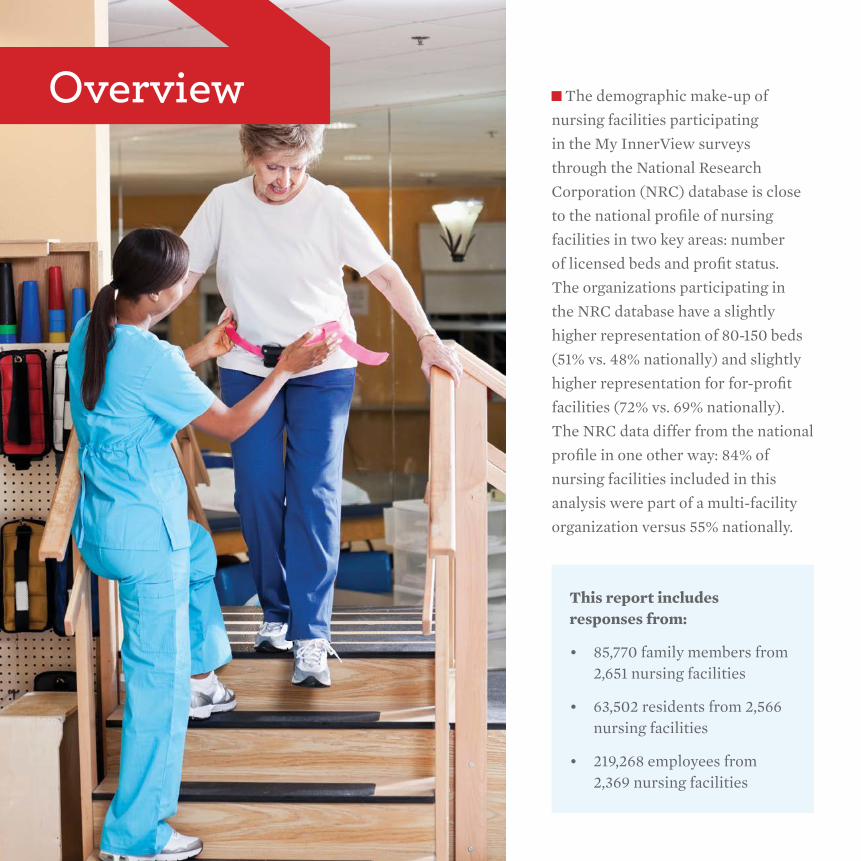
The demographic make-up of
nursing facilities participating
in the My InnerView surveys
through the National Research
Corporation (NRC) database is close
to the national profile of nursing
facilities in two key areas: number
of licensed beds and profit status.
The organizations participating in
the NRC database have a slightly
higher representation of 80-150 beds
(51% vs. 48% nationally) and slightly
higher representation for for-profit
facilities (72% vs. 69% nationally).
The NRC data differ from the national
profile in one other way: 84% of
nursing facilities included in this
analysis were part of a multi-facility
organization versus 55% nationally.
overview
This report includes responses from:
• 85,770 family members from 2,651 nursing facilities
• 63,502 residents from 2,566 nursing facilities
• 219,268 employees from 2,369 nursing facilities
Satisfaction surveys are designed to assess more
than basic levels of resident or patient satisfaction.
Surveys are designed to collect information to sup-
port important facility initiatives on quality assur-
ance, customer engagement, employee program
development, performance improvement, referral
source management, and community outreach. The
My InnerView Customer Survey, reported on in this
chapter, asked residents and families to review 22
nursing facility experiences across three broad areas:
1. Quality of life – How do residents and families rate
facility and staff performance on matters of safety,
privacy, dignity, choice, and other aspects of indi-
vidual well-being?
2. Quality of care – How do residents and families
rate staff and care practices, including competence
and caring attitude?
3. Quality of services – How satisfied are residents
and families with meals, laundry, facility mainte-
nance, and other core facility services?
Differences between the short-stay and long-
stay versions of the survey were designed to evalu-
ate issues that are more pertinent to each group.
For example, the short-stay patient survey includes
questions about the discharge process and progress
toward discharge goals. Because there is a high cor-
relation between consumer satisfaction and work-
force satisfaction, My InnerView launched the
Workforce Satisfaction and Commitment Surveys,
which measure staff experiences within the facil-
ity context – with the goal of providing mangers
and leaders perspective on three key questions:
1. Resources – Do employees have the tools, training,
equipment, feedback, and other necessary resources
to ensure successful caregiving?
2. Relationships – Do team members, supervisors,
and managers interact on a daily basis in ways that
support employees’ ability to provide quality care
and services?
3. Commitment – Does the employee feel aligned
with and effectively integrated into the facility staff?
the surveys
37
0%
10%
20%
30%
40%
50%
60%
70%
80%
90%
100%
88%
Overall Customer Satisfaction Ratings
Family Resident
Recommend to Others
% Good & Excellent
Overall Satisfaction
88% 88% 88%
Consumer satisfaction
The general image of nursing facili-
ties may not be entirely positive, yet
nearly nine out of 10 residents and
their families – a full 88 percent –
have high overall satisfaction levels
and would recommend to others the
facility in which they or their loved
one resides. A consumer’s willingness
to provide a positive recommendation
for a service or product is closely tied
to the highest levels of satisfaction.
80%82%84%86%88%90%92%94%
Five Highest Scoring Measures
Family Resident
Safety ofFacility
RN/LVN/LPNCare
Cleanlinessof Premises
Respectfulnessof Staff
Care (Concern)of Staff
Res-to-StaffFriendships
91%92%
91% 91%
84%
90%92%
89% 89%88%
90%
87%
90%
88%
86% 85% 85%
87%88% 88% 88%
88%
89%
83% 83%
85%86%
87% 87%
84%
82%
80%2006 2007 2008 2009 2010 2011 2011/12
Trends in Willingness to Recommend Facility
Family Resident
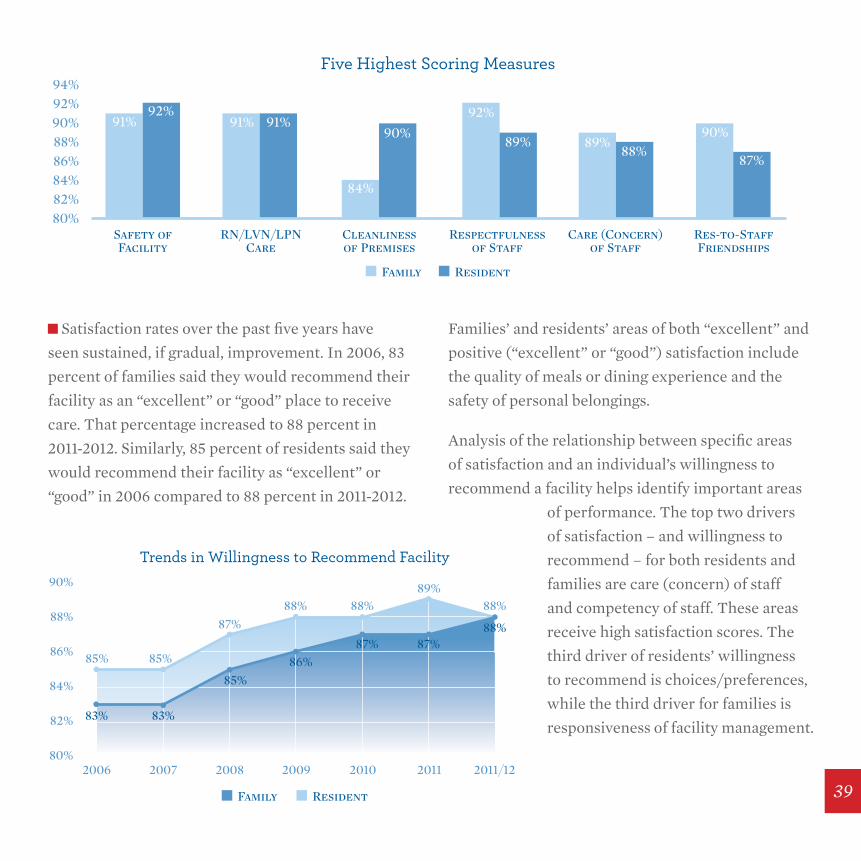
Satisfaction rates over the past five years have
seen sustained, if gradual, improvement. In 2006, 83
percent of families said they would recommend their
facility as an “excellent” or “good” place to receive
care. That percentage increased to 88 percent in
2011-2012. Similarly, 85 percent of residents said they
would recommend their facility as “excellent” or
“good” in 2006 compared to 88 percent in 2011-2012.
Families’ and residents’ areas of both “excellent” and
positive (“excellent” or “good”) satisfaction include
the quality of meals or dining experience and the
safety of personal belongings.
Analysis of the relationship between specific areas
of satisfaction and an individual’s willingness to
recommend a facility helps identify important areas
of performance. The top two drivers
of satisfaction – and willingness to
recommend – for both residents and
families are care (concern) of staff
and competency of staff. These areas
receive high satisfaction scores. The
third driver of residents’ willingness
to recommend is choices/preferences,
while the third driver for families is
responsiveness of facility management.
39
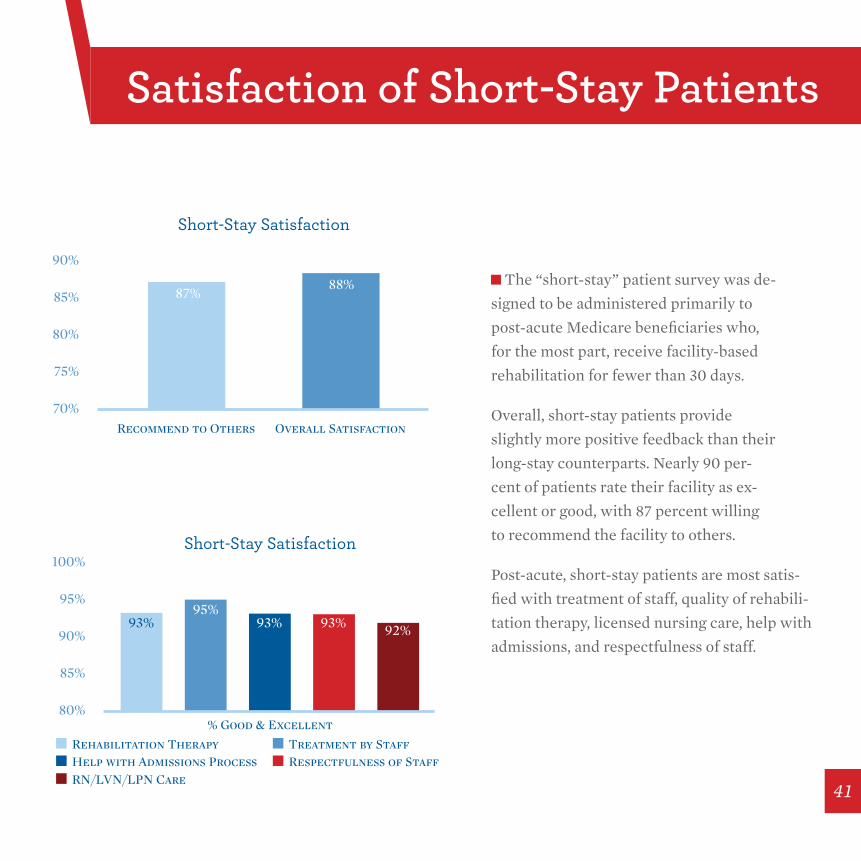
The “short-stay” patient survey was de-
signed to be administered primarily to
post-acute Medicare beneficiaries who,
for the most part, receive facility-based
rehabilitation for fewer than 30 days.
Overall, short-stay patients provide
slightly more positive feedback than their
long-stay counterparts. Nearly 90 per-
cent of patients rate their facility as ex-
cellent or good, with 87 percent willing
to recommend the facility to others.
Post-acute, short-stay patients are most satis-
fied with treatment of staff, quality of rehabili-
tation therapy, licensed nursing care, help with
admissions, and respectfulness of staff.
70%
75%
80%
85%
90%
Short-Stay Satisfaction
Family Resident
Recommend to Others Overall Satisfaction
87%88%
80%
85%
90%
95%
100%Short-Stay Satisfaction
Rehabilitation Therapy Treatment by StaffHelp with Admissions ProcessRN/LVN/LPN Care
Respectfulness of Staff
% Good & Excellent
93% 93% 93% 92%95%
satisfaction of short-stay Patients
41
employee satisfaction
60%
65%
50%
55%
70%
75%
80%
Employee Satisfaction
OverallSatisfaction
Recommendfor Job
Recommendfor Care
% Good & Excellent
67%68%
75%
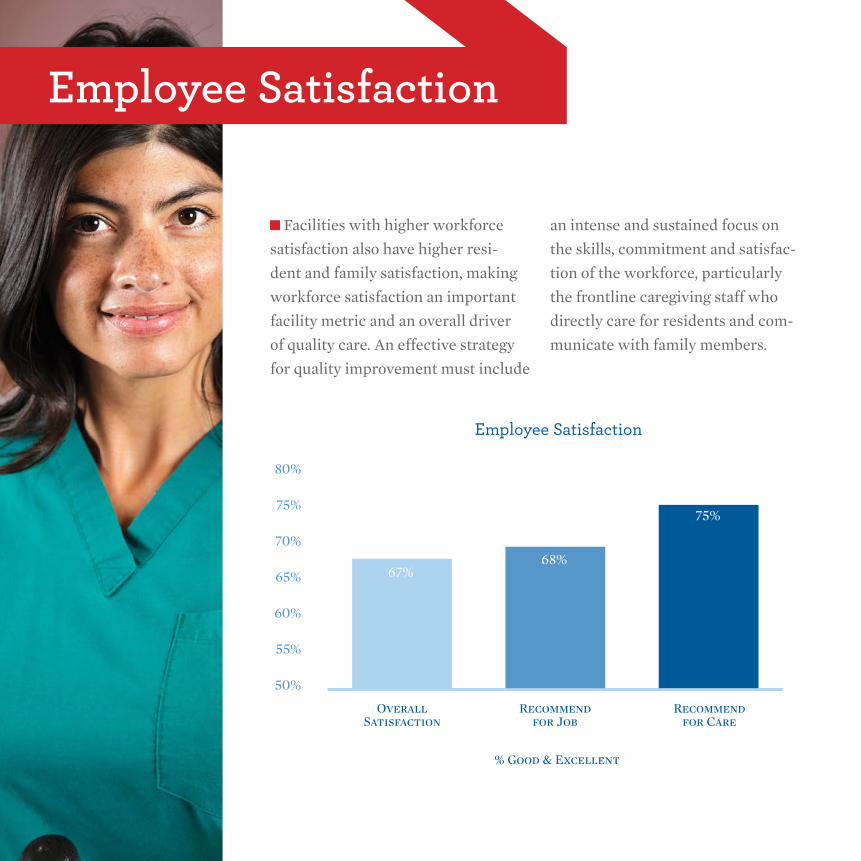
Facilities with higher workforce
satisfaction also have higher resi-
dent and family satisfaction, making
workforce satisfaction an important
facility metric and an overall driver
of quality care. An effective strategy
for quality improvement must include
an intense and sustained focus on
the skills, commitment and satisfac-
tion of the workforce, particularly
the frontline caregiving staff who
directly care for residents and com-
municate with family members.
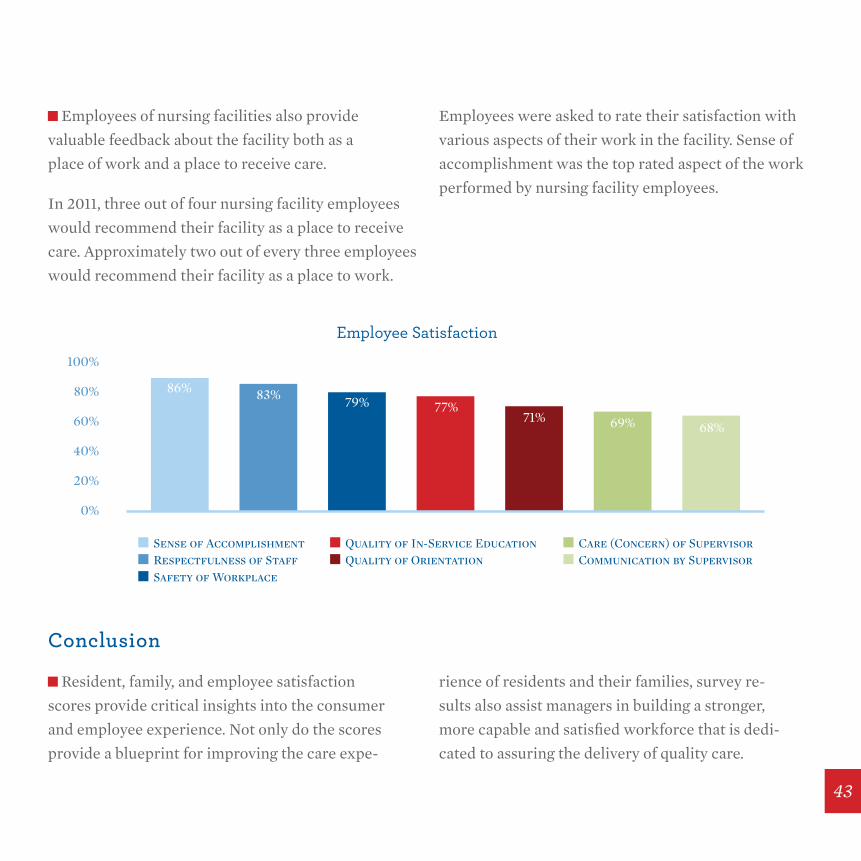
Employees of nursing facilities also provide
valuable feedback about the facility both as a
place of work and a place to receive care.
In 2011, three out of four nursing facility employees
would recommend their facility as a place to receive
care. Approximately two out of every three employees
would recommend their facility as a place to work.
Employees were asked to rate their satisfaction with
various aspects of their work in the facility. Sense of
accomplishment was the top rated aspect of the work
performed by nursing facility employees.
Resident, family, and employee satisfaction
scores provide critical insights into the consumer
and employee experience. Not only do the scores
provide a blueprint for improving the care expe-
rience of residents and their families, survey re-
sults also assist managers in building a stronger,
more capable and satisfied workforce that is dedi-
cated to assuring the delivery of quality care.
0%
40%
20%
60%
80%
100%
Employee Satisfaction
Sense of Accomplishment Quality of In-Service EducationRespectfulness of StaffSafety of Workplace
Quality of OrientationCare (Concern) of SupervisorCommunication by Supervisor
86% 83% 79% 77%71% 69% 68%
Conclusion
43
Quality Initiatives: spotlights on success
In 2002, the Alliance for Quality Nursing
Home Care and other leaders in the skilled
nursing facility (SNF) community launched
Quality First, a sector-wide initiative in
which providers promised to promote a
dynamic workplace for employees, advance
the development of key quality measures,
and publicly report the results of our qual-
ity performance. Since that time, SNF
providers have initiated successful quality
improvement efforts that have achieved
positive results in a variety of key areas.
With nine million people discharged from
acute care to post-acute care settings each
year, the role of the SNF sector has grown
considerably to meet the needs of this
patient population. The post-acute care pa-
tients that SNFs care for require specialized
medical and rehabilitative care in order to
recover and regain function for an inde-
pendent, active, and safe lifestyle. Programs
have been designed to help patients meet
the challenges of returning to community
life after discharge, while minimizing the
risk of the patient returning to the hospital.
Alliance member companies have em-
45
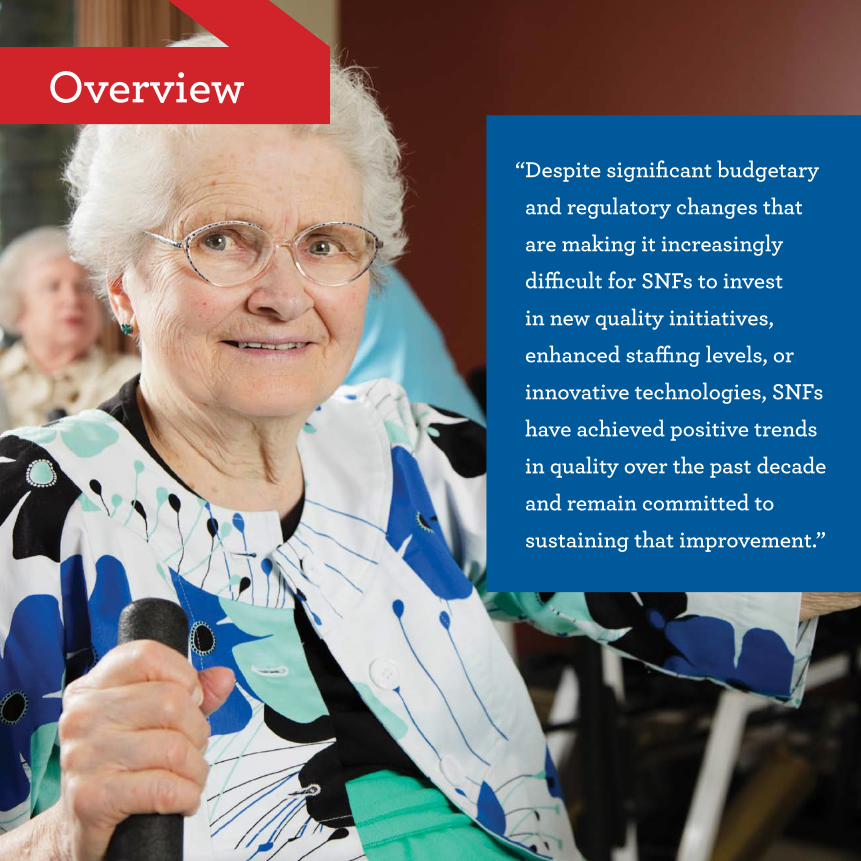
overview“ Despite significant budgetary and regulatory changes that are making it increasingly difficult for snFs to invest in new quality initiatives, enhanced staffing levels, or innovative technologies, snFs have achieved positive trends in quality over the past decade and remain committed to sustaining that improvement.”
braced their role in post-acute care as evi-
denced by the development of new clinical
specialty programs and best practice initiatives
to ensure the best possible care for patients.
While numerous successful quality initiatives
have been put in place involving staffing im-
provements, SNFs as a whole have experienced
a decline in workforce totals in recent years.
According the Bureau of Labor Statistics at the
U.S. Department of Labor, the number of nurs-
ing facility employees is on the decline due in
large part to significant funding reductions in
the Medicare and Medicaid programs, which
fund care for three out of every four patients.
Between September 2011 and September 2012,
the total number of SNF employees dropped
by 11,200 (1,671,400 in 2011 to 1,660,200 in
2012). The most significant contraction oc-
curred between October and November 2011,
immediately following an 11.1 percent re-
duction in Medicare payments to SNFs.
Despite significant budgetary and regulatory
changes that are making it increasingly difficult
for SNFs to invest in new quality initiatives,
enhanced staffing levels, or innovative tech-
nologies, SNFs have achieved positive trends in
quality over the past decade and remain com-
mitted to sustaining that improvement.
In this chapter, three Alliance member compa-
nies detail quality improvement programs that
have moved the needle and achieved measur-
able results in key quality improvement areas.
The results of these programs offer objective
evidence of SNF commitment to providing the
highest possible quality of care and quality of
life to patients in several important areas:
• Discharging more patients home
• Reducing average length of stay
• Reducing rehospitalization rates
• Expanding rehabilitation and therapy
services
Through the specialized programs discussed in
the following pages, and through similar pro-
grams throughout the country, SNFs reaffirm
their commitment to continuous quality im-
provement by putting quality first.
47
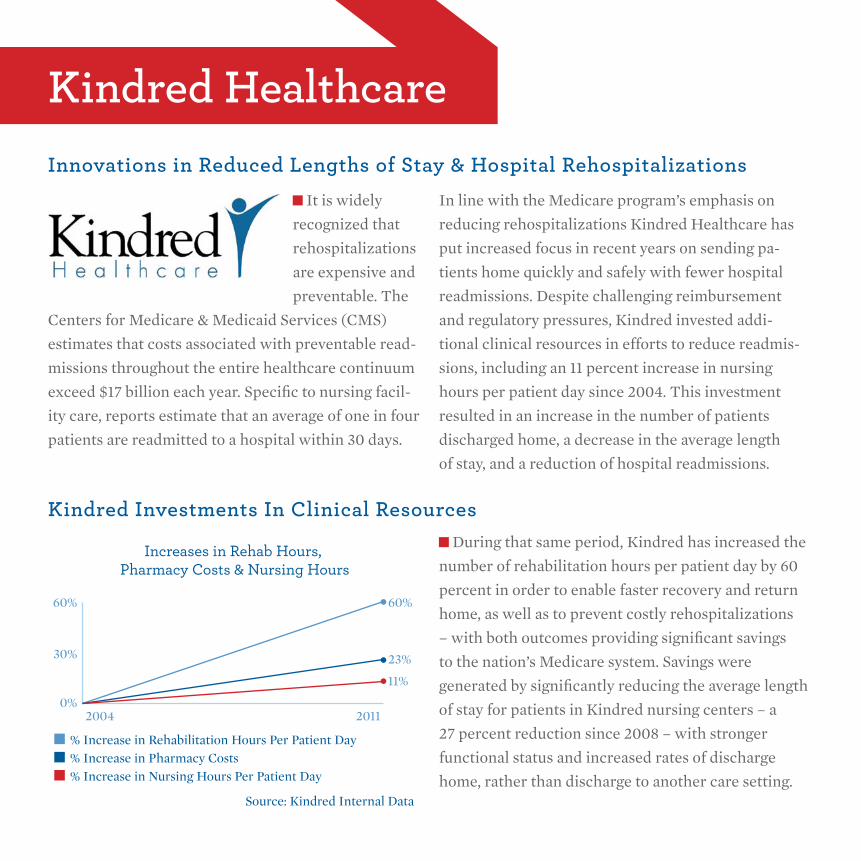
It is widely
recognized that
rehospitalizations
are expensive and
preventable. The
Centers for Medicare & Medicaid Services (CMS)
estimates that costs associated with preventable read-
missions throughout the entire healthcare continuum
exceed $17 billion each year. Specific to nursing facil-
ity care, reports estimate that an average of one in four
patients are readmitted to a hospital within 30 days.
In line with the Medicare program’s emphasis on
reducing rehospitalizations Kindred Healthcare has
put increased focus in recent years on sending pa-
tients home quickly and safely with fewer hospital
readmissions. Despite challenging reimbursement
and regulatory pressures, Kindred invested addi-
tional clinical resources in efforts to reduce readmis-
sions, including an 11 percent increase in nursing
hours per patient day since 2004. This investment
resulted in an increase in the number of patients
discharged home, a decrease in the average length
of stay, and a reduction of hospital readmissions.
Kindred healthcare
Kindred Investments In Clinical resources
Innovations in reduced Lengths of stay & hospital rehospitalizations
During that same period, Kindred has increased the
number of rehabilitation hours per patient day by 60
percent in order to enable faster recovery and return
home, as well as to prevent costly rehospitalizations
– with both outcomes providing significant savings
to the nation’s Medicare system. Savings were
generated by significantly reducing the average length
of stay for patients in Kindred nursing centers – a
27 percent reduction since 2008 – with stronger
functional status and increased rates of discharge
home, rather than discharge to another care setting.
60% 60%
23%
11%
30%
0%2004 2011
Increases in Rehab Hours, Pharmacy Costs & Nursing Hours
% Increase in Rehabilitation Hours Per Patient Day% Increase in Pharmacy Costs% Increase in Nursing Hours Per Patient Day
Source: Kindred Internal Data
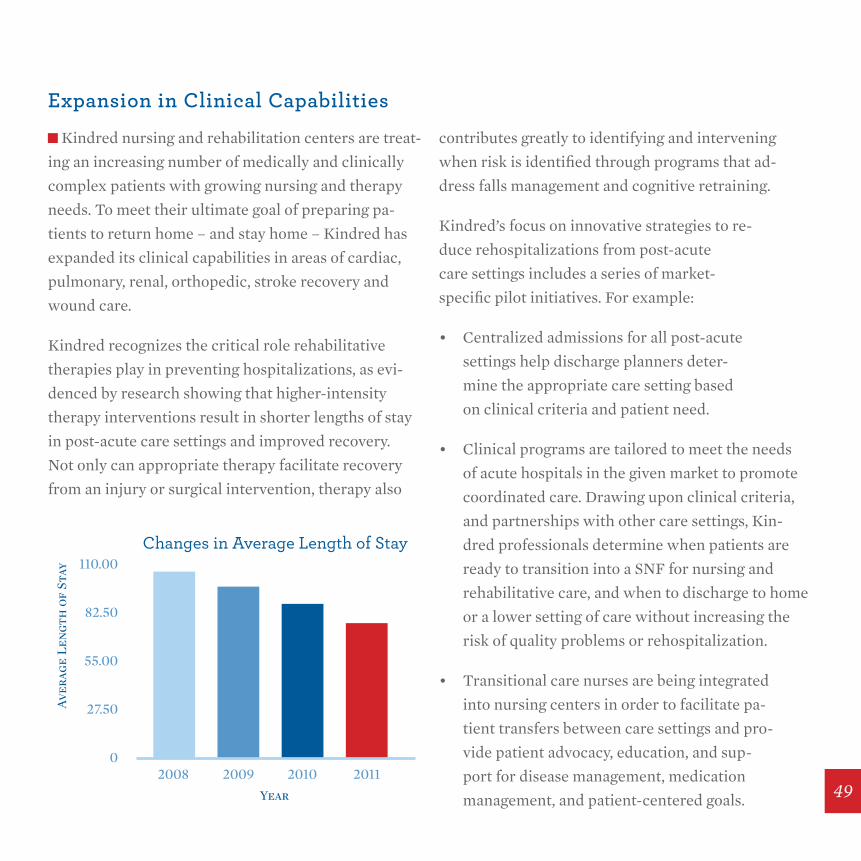
Kindred nursing and rehabilitation centers are treat-
ing an increasing number of medically and clinically
complex patients with growing nursing and therapy
needs. To meet their ultimate goal of preparing pa-
tients to return home – and stay home – Kindred has
expanded its clinical capabilities in areas of cardiac,
pulmonary, renal, orthopedic, stroke recovery and
wound care.
Kindred recognizes the critical role rehabilitative
therapies play in preventing hospitalizations, as evi-
denced by research showing that higher-intensity
therapy interventions result in shorter lengths of stay
in post-acute care settings and improved recovery.
Not only can appropriate therapy facilitate recovery
from an injury or surgical intervention, therapy also
contributes greatly to identifying and intervening
when risk is identified through programs that ad-
dress falls management and cognitive retraining.
Kindred’s focus on innovative strategies to re-
duce rehospitalizations from post-acute
care settings includes a series of market-
specific pilot initiatives. For example:
• Centralized admissions for all post-acute
settings help discharge planners deter-
mine the appropriate care setting based
on clinical criteria and patient need.
• Clinical programs are tailored to meet the needs
of acute hospitals in the given market to promote
coordinated care. Drawing upon clinical criteria,
and partnerships with other care settings, Kin-
dred professionals determine when patients are
ready to transition into a SNF for nursing and
rehabilitative care, and when to discharge to home
or a lower setting of care without increasing the
risk of quality problems or rehospitalization.
• Transitional care nurses are being integrated
into nursing centers in order to facilitate pa-
tient transfers between care settings and pro-
vide patient advocacy, education, and sup-
port for disease management, medication
management, and patient-centered goals.
expansion in Clinical Capabilities
0
27.50
2008 2009 2010 2011
55.00
82.50
110.00Changes in Average Length of Stay
Year
Aver
age
Len
gth
of
Stay
49
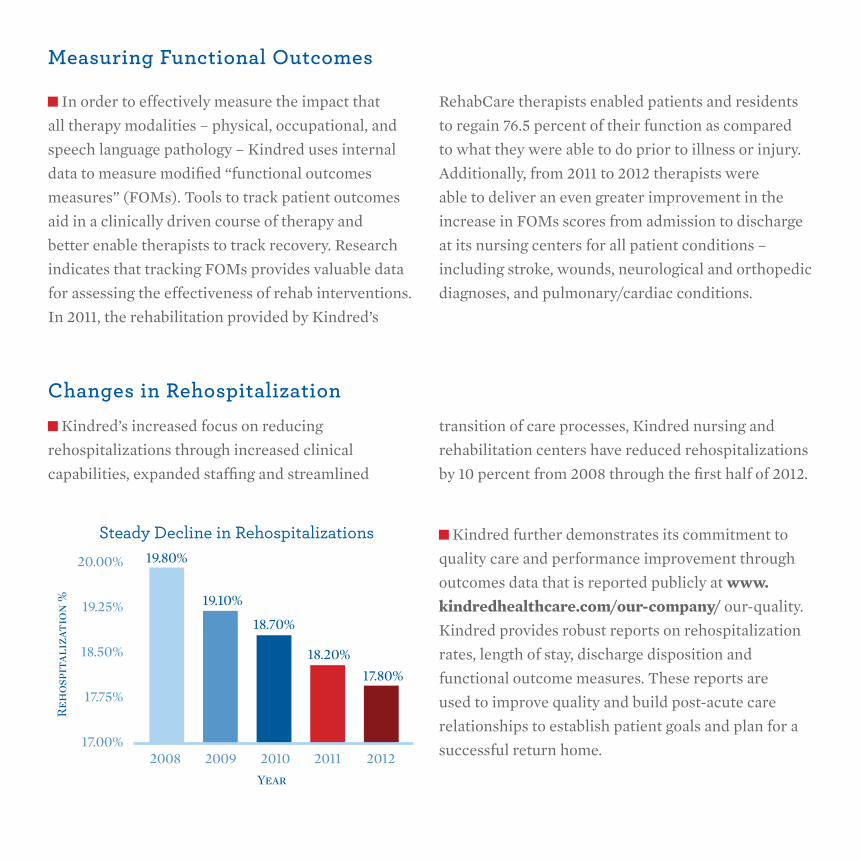
Measuring Functional outcomes
Changes in rehospitalization
In order to effectively measure the impact that
all therapy modalities – physical, occupational, and
speech language pathology – Kindred uses internal
data to measure modified “functional outcomes
measures” (FOMs). Tools to track patient outcomes
aid in a clinically driven course of therapy and
better enable therapists to track recovery. Research
indicates that tracking FOMs provides valuable data
for assessing the effectiveness of rehab interventions.
In 2011, the rehabilitation provided by Kindred’s
RehabCare therapists enabled patients and residents
to regain 76.5 percent of their function as compared
to what they were able to do prior to illness or injury.
Additionally, from 2011 to 2012 therapists were
able to deliver an even greater improvement in the
increase in FOMs scores from admission to discharge
at its nursing centers for all patient conditions –
including stroke, wounds, neurological and orthopedic
diagnoses, and pulmonary/cardiac conditions.
Kindred’s increased focus on reducing
rehospitalizations through increased clinical
capabilities, expanded staffing and streamlined
transition of care processes, Kindred nursing and
rehabilitation centers have reduced rehospitalizations
by 10 percent from 2008 through the first half of 2012.
Kindred further demonstrates its commitment to
quality care and performance improvement through
outcomes data that is reported publicly at www.kindredhealthcare.com/our-company/ our-quality.
Kindred provides robust reports on rehospitalization
rates, length of stay, discharge disposition and
functional outcome measures. These reports are
used to improve quality and build post-acute care
relationships to establish patient goals and plan for a
successful return home.17.00%
17.75%
2008 2009 2010 2011 2012
18.50%
19.25%
20.00%
Steady Decline in Rehospitalizations
Year
Reh
ospi
tali
zati
on %
19.80%
19.10%
18.70%
18.20%
17.80%

51
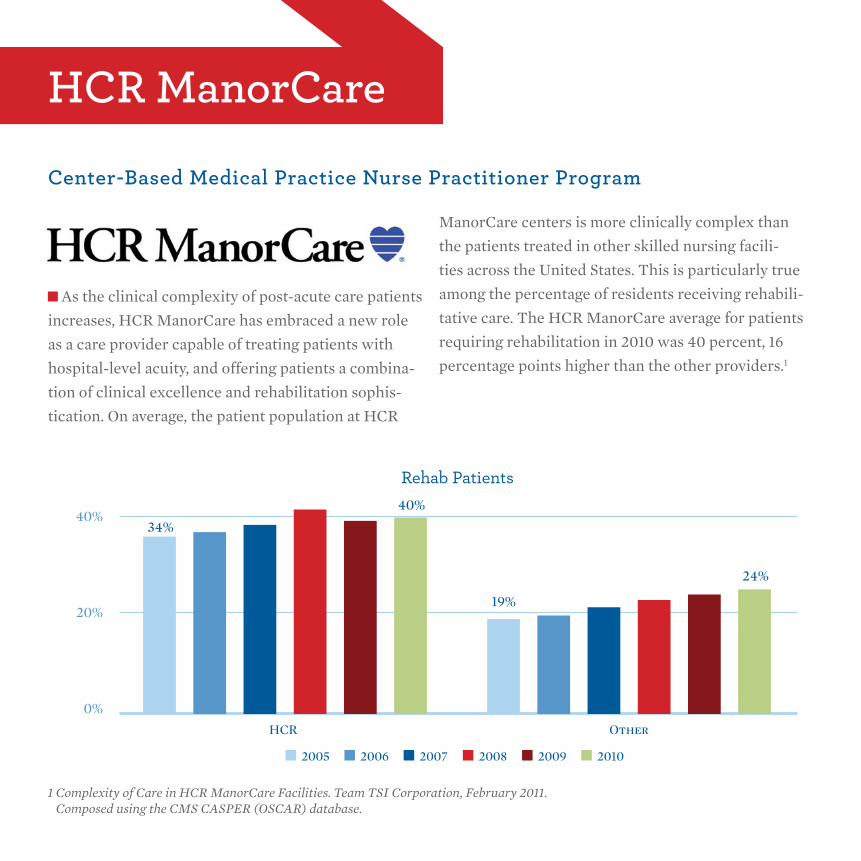
As the clinical complexity of post-acute care patients
increases, HCR ManorCare has embraced a new role
as a care provider capable of treating patients with
hospital-level acuity, and offering patients a combina-
tion of clinical excellence and rehabilitation sophis-
tication. On average, the patient population at HCR
ManorCare centers is more clinically complex than
the patients treated in other skilled nursing facili-
ties across the United States. This is particularly true
among the percentage of residents receiving rehabili-
tative care. The HCR ManorCare average for patients
requiring rehabilitation in 2010 was 40 percent, 16
percentage points higher than the other providers.1
hCr ManorCare
Center-Based Medical Practice nurse Practitioner Program
0%
20%
40%
Rehab Patients
HCR Other
34%
40%
19%
24%
2005 2006 2007 2008 2009 2010
1 Complexity of Care in HCR ManorCare Facilities. Team TSI Corporation, February 2011. Composed using the CMS CASPER (OSCAR) database.
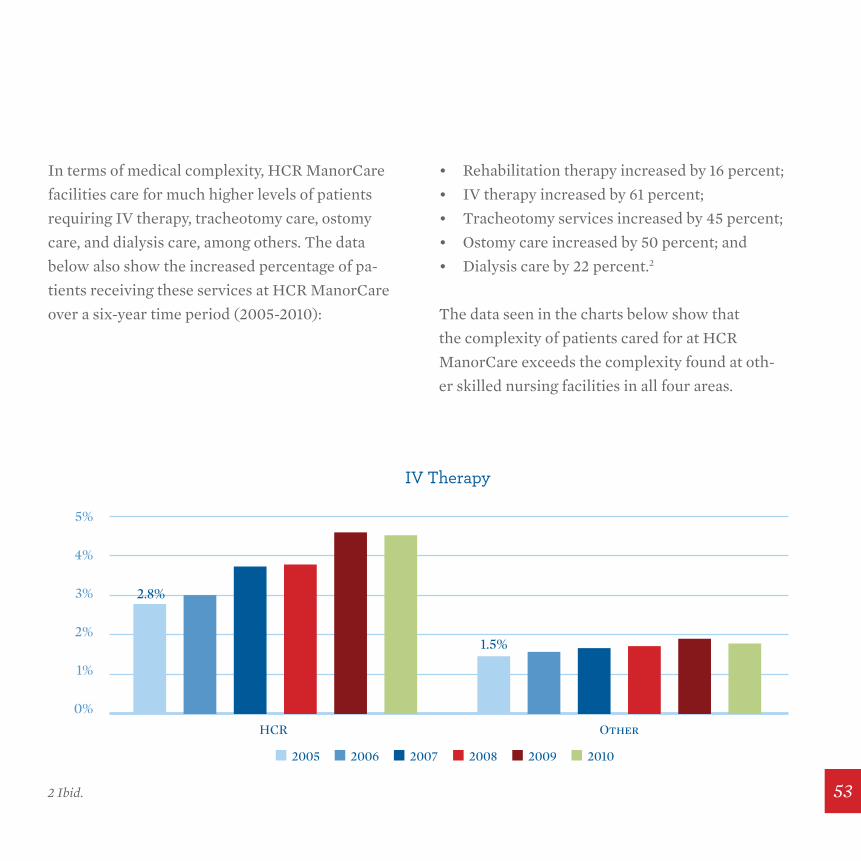
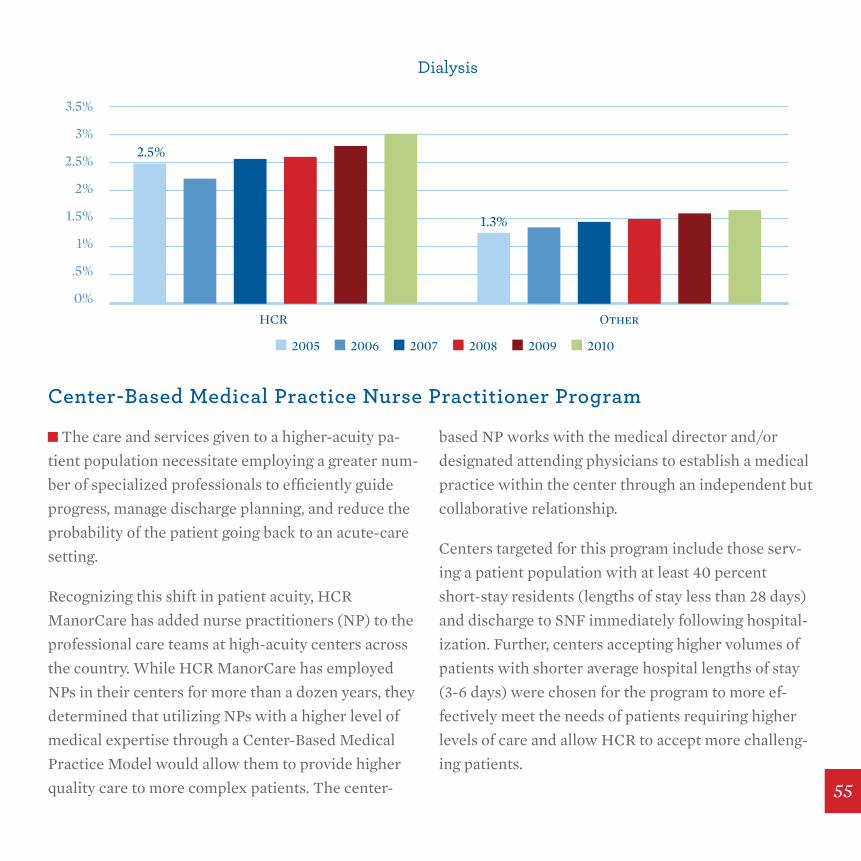
In terms of medical complexity, HCR ManorCare
facilities care for much higher levels of patients
requiring IV therapy, tracheotomy care, ostomy
care, and dialysis care, among others. The data
below also show the increased percentage of pa-
tients receiving these services at HCR ManorCare
over a six-year time period (2005-2010):
• Rehabilitation therapy increased by 16 percent;
• IV therapy increased by 61 percent;
• Tracheotomy services increased by 45 percent;
• Ostomy care increased by 50 percent; and
• Dialysis care by 22 percent.2
The data seen in the charts below show that
the complexity of patients cared for at HCR
ManorCare exceeds the complexity found at oth-
er skilled nursing facilities in all four areas.
0%
1%
2%
3%
4%
5%
IV Therapy
HCR Other
2.8%
1.5%
2005 2006 2007 2008 2009 2010
2 Ibid. 53
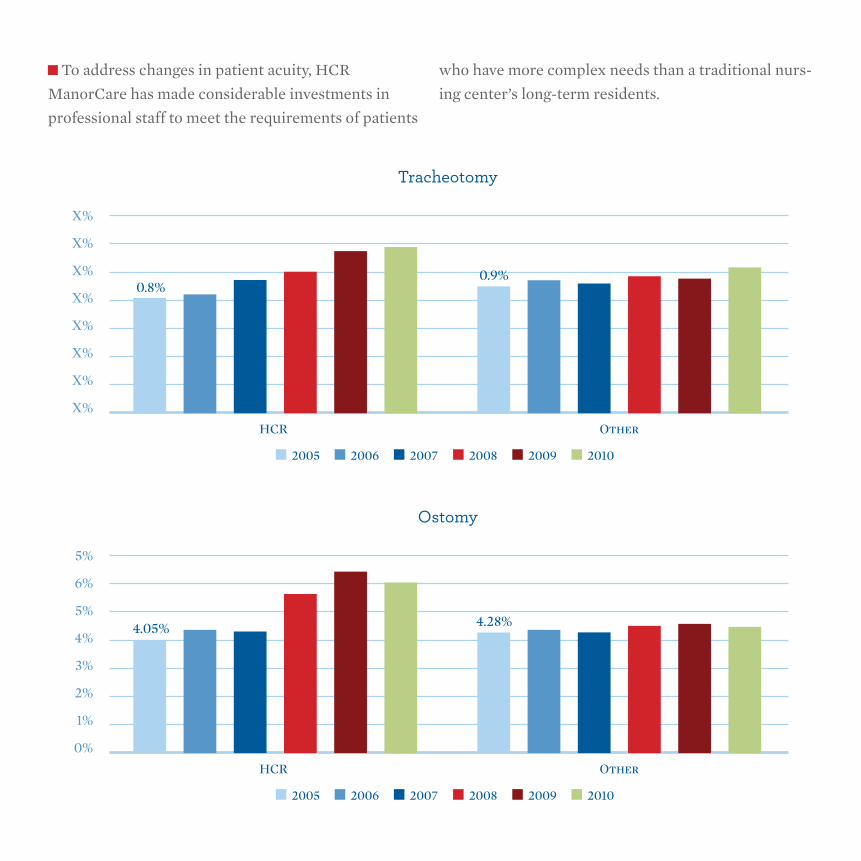
To address changes in patient acuity, HCR
ManorCare has made considerable investments in
professional staff to meet the requirements of patients
who have more complex needs than a traditional nurs-
ing center’s long-term residents.
X%
X%
X%
X%
X%
X%
X%
X%
Tracheotomy
HCR Other
0.8%0.9%
2005 2006 2007 2008 2009 2010
0%
1%
2%
4%
6%
5%
3%
5%
Ostomy
HCR Other
4.05% 4.28%
2005 2006 2007 2008 2009 2010
0%
.5%
1%
1.5%
2.5%
3.5%
3%
2%
Dialysis
HCR Other
2.5%
1.3%
2005 2006 2007 2008 2009 2010
Center-Based Medical Practice nurse Practitioner Program
The care and services given to a higher-acuity pa-
tient population necessitate employing a greater num-
ber of specialized professionals to efficiently guide
progress, manage discharge planning, and reduce the
probability of the patient going back to an acute-care
setting.
Recognizing this shift in patient acuity, HCR
ManorCare has added nurse practitioners (NP) to the
professional care teams at high-acuity centers across
the country. While HCR ManorCare has employed
NPs in their centers for more than a dozen years, they
determined that utilizing NPs with a higher level of
medical expertise through a Center-Based Medical
Practice Model would allow them to provide higher
quality care to more complex patients. The center-
based NP works with the medical director and/or
designated attending physicians to establish a medical
practice within the center through an independent but
collaborative relationship.
Centers targeted for this program include those serv-
ing a patient population with at least 40 percent
short-stay residents (lengths of stay less than 28 days)
and discharge to SNF immediately following hospital-
ization. Further, centers accepting higher volumes of
patients with shorter average hospital lengths of stay
(3-6 days) were chosen for the program to more ef-
fectively meet the needs of patients requiring higher
levels of care and allow HCR to accept more challeng-
ing patients.
55
the role of the nurse Practitioner
Measuring success of the Center-Based nurse Practitioner Program
NPs with an established medical practice are per-
mitted to provide comprehensive evaluations of new
admissions either prior to or following the initial as-
sessment by the patient’s attending physician, which
generally includes a brief examination of the patient’s
medical history and physical condition. The compre-
hensive evaluation completed by the NP is a thorough
review — taking an average of 45 minutes per patient.
To foster improved processes at their centers, HCR
ManorCare has established thresholds for medical
practice NPs to ensure timely assessment of new ad-
missions — at least 70 percent of new admissions must
be seen within 48 hours of admission — and further
follow up must be completed on days 3, 10 and 28 of
the patient’s SNF visit. Additionally, if a patient has a
primary diagnosis on admission of congestive heart
failure, acute myocardial infarction, or pneumonia,
they are seen daily for seven days and then a minimum
of weekly thereafter for the first 30 days.
As a preventative intervention program, success can
be difficult to measure. However, HCR ManorCare has
found that centers participating in the Center-Based
Medical Practice Nurse Practitioner Program have
improved medical, clinical, and administrative opera-
tions and significantly reduced rates for readmission
to the acute-care setting.
High-acuity centers with medical practice NPs are
successfully managing complex cases by reducing pre-
ventable and unnecessary readmissions to the hospital
and avoiding a gap in the continuum of medical care
provided when a patient transitions from the acute to
the post-acute care setting. The Center-Based Medical
Practice Nurse Practitioner program has been particu-
larly instrumental in reducing rehospitalization rates
within the critical 3-7 day admission window by 30 to
40 percent.
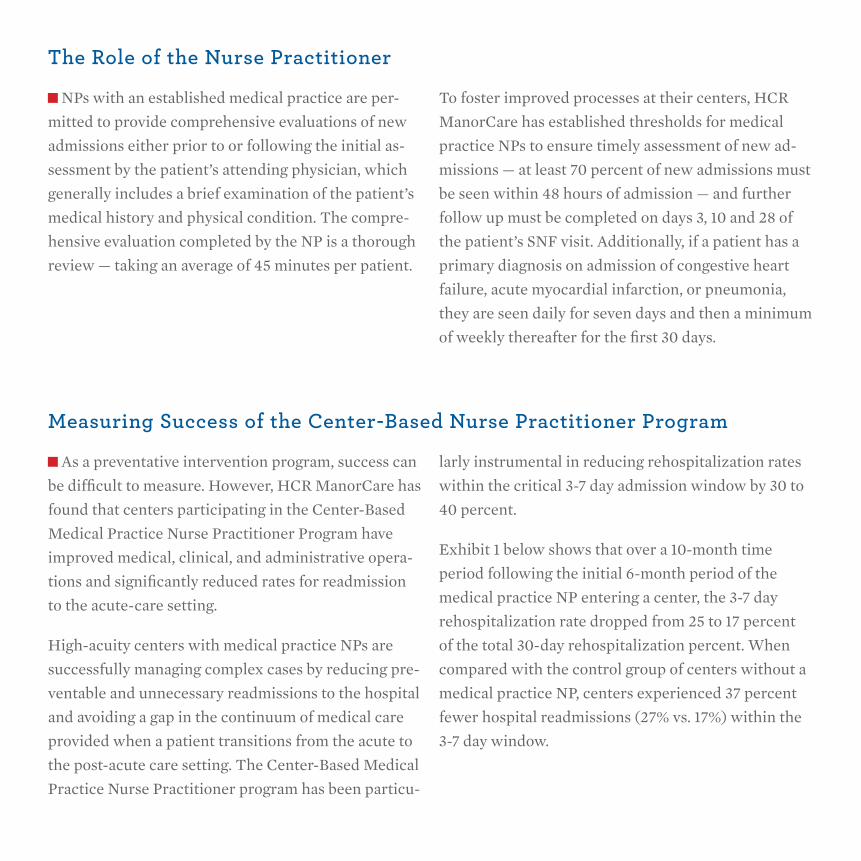
Exhibit 1 below shows that over a 10-month time
period following the initial 6-month period of the
medical practice NP entering a center, the 3-7 day
rehospitalization rate dropped from 25 to 17 percent
of the total 30-day rehospitalization percent. When
compared with the control group of centers without a
medical practice NP, centers experienced 37 percent
fewer hospital readmissions (27% vs. 17%) within the
3-7 day window.
HCR ManorCare currently has 82 full-time center-
based medical practice NPs in 86 of its skilled nursing
centers nationwide. Because of the success HCR has
seen in streamlining assessment processes and reduc-
ing rehospitalizations, the program is being gradually
extended.
eXhIBIt 1: Center-Based nurse Practitioner vs. Control group rehospitalization rates
15%
18%
20%
23%
25%
28%
30%
3-7 Day Rehospitalization RatesCenter-Based Nurse Practitioner Facilities vs. Control Facilities
Center-Based NP Control Threshold Linear (Center-Based NP)
OtherPre-NP
57
Skilled nursing facilities are an essential part of
the healthcare delivery system. Of the 40 percent of
Medicare hospital discharge patients requiring post-
acute care and rehabilitation services, nearly half are
now discharged to a skilled nursing facility (SNF).
In response to this increased demand for skilled nurs-
ing care among older Americans, Genesis introduced
a series of quality improvement efforts to offer in-
creased clinical capabilities for patients seeking short-
term skilled nursing and rehabilitative care in 2011.
Genesis short-stay centers throughout the country
provide new options for post-acute care and specialty
programs such as cardiac and pulmonary management
for all short-stay centers.
Clinical improvements and capital investments have
been made to increase capabilities for treating short-
stay patients with the goal of regaining their strength
for discharge home. From expert specialists in medi-
cal and therapeutic disciplines to the most advanced
technologies and equipment, Genesis’ clinical teams
develop highly personalized plans designed to get pa-
tients home quickly after a hospital stay.
While the environment is medically intensive, Genesis
skilled nursing centers are utilizing evidence-based
delivery care models, increased patient education
initiatives and specialized rehabilitation equipment
to improve patients’ outcomes. Further emphasis has
been placed on rapid recovery situations to help Gen-
esis patients optimize rehabilitation.
genesis healthCare
Focus on short-term, Post-Acute rehabilitation
the genesis PowerBack Program
Genesis introduced the PowerBack Rehabilita-
tion model in 2011. PowerBack Rehabilitation was
designed to intensify therapy and medical ser-
vices with the goal of allowing patients to move
through the rehabilitation process efficiently, safely,
and rapidly. The program also focuses on educat-
ing patients after discharge and following up with
them regarding appropriate post-acute care.
Measuring Powerback success
Genesis uses Functional Independence Measures
(FIM) to uniformly assess the severity of patient dis-
ability as well as the functional outcomes of medi-
cal rehabilitation. Since 1994, a version specific to
skilled nursing centers and sub-acute providers has
been available (FIM-PAI). The tool is composed
of 18 items: 13 motor tasks and 5 cognitive assess-
ments. These items are rated on a 7 point-ordinal
scale ranging from total assistance (or complete
dependence) to complete independence, result-
ing in a range of possible scores of 18 to 126.
Typically the FIM results are gathered at admission
and at discharge and the reporting compares a single
provider’s results to national averages. Additionally,
the reports define these gains in particular diagnostic
groups such as Orthopedic Disorders or Neurologic
Conditions. The average discharge FIM score will
reveal the average level of disability of patients dis-
charged after an episode of care in a post-acute setting.
The FIM reporting also provides the average change in
the FIM score, which defines the amount of functional
gain occurred during the episode of care. The FIM
scores gathered for Genesis PowerBack Rehabilitation
(PBR) patients at Brightwood Campus demonstrate
that :
• The average length of stay (LOS) of a PowerBack
patient declined by one day since March 2010,
from 15 days to 14 days, and is 8 days shorter than
the average LOS among all SNFs. The goal of effi-
cient rehabilitation is to maximize physical func-
tion in the shortest amount of time.
• The average discharge FIM score is 12 points
higher at Powerback Rehabilitation when com-
pared with the national average (higher Average
Discharge FIM scores are better). This means
that patients cared for at PowerBack exceeded the
national average in how much functional improve-
ment they attained during their stay.
• The average discharge to community scores for
PowerBack are 9 percentage points higher than
the national average. This rate reports the percent-
age of patients who left the facility and were dis-
charged to a location in the community.
Genesis now has seven PowerBack Rehabilitation loca-
tions in the eastern United States. The first PowerBack
Rehabilitation location, launched at Brightwood Cam-
pus in Lutherville, Timonium, Maryland, has achieved
measurable results in several quality areas. Since Janu-
ary 2012, PowerBack at Brightwood has increased its
volume of high-acuity patients from 100 admissions
per month to 150 admissions per month.
59
PowerBack Quality Measures Data
eXhIBIt 1: short-stay residents With new or Worsening Pressure Ulcers (PowerBack vs. national Average)
0.0%
0.2%
0.4%
0.6%
0.8%
1.0%
1.2%
1.4%
1.6%
1.8%
2.0%
1.3%
July-Dec 11 Jan-Jun 12
PowerBack Short-Stay PU Wors/New National Short-Stay PU Wors/New
1.3%
1.8%
1.6%
Short-Stay Worsening/New PU Quality Measures
Further, publicly reported Quality Mea-
sures (QM) data for PowerBack Rehabilitation
at Brightwood illustrates that, on average, pa-
tients within this program are performing better
when compared to national short-stay patients.
Apr 2009-Mar 2010 Apr 2011 – Mar 2012
Average LOS PBR 15 14
Average LOS US 18 22
Average Discharge FIM PBR 114.7 112
Average Discharge FIM US 102.6 100
Discharge to Community PBR 100% 95%
Discharge to Community US 87% 86%
Brightwood’s FIM Data
For example, as seen in Exhib-
it 1 at right, the percent of Pow-
erBack patients with pressure
ulcers that are new or worsened
(short-stay) remains below
the national average. While
the pre-PowerBack vs. Power-
Back QM rate remains steady,
the new and worsening pres-
sure ulcer rate at PowerBack,
Brightwood is 0.3 percent lower
than the national SNF average.
*FIM data not available April 2010 to March 2011
eXhIBIt 2: short-stay residents With Influenza Immunization and Pneumonia Vaccination (PowerBack vs. national Average)
70%
75%
80%
85%
90%
95%
July-Dec 11 Jan-Jun 12
PowerBack Short-StayFlu QM
PowerBack Short-StayPnue QM
National Short-StayFlu QM
National Short-StayPnue QM
84.5%
91.5%
78.5%
85.7%
90.0% 90.5%
80.4%
84.5%
Short-Stay Vaccination QMs
Data shown in Exhibit 2 below demonstrates that
PowerBack short-stay patients at Brightwood are far
exceeding national rates for both influenza immuni-
zations and pneumonia vaccinations. Furthermore,
Genesis has seen a considerable improvement in both
Short-stay QMs since the PowerBack program was
introduced at Brightwood in January 2012, experi-
encing an improvement of 7 percent in short-stay flu
immunizations and a .5 percent improvement in short-
stay pneumonia vaccinations from December 2011.
61
eXhIBIt 3: short-stay residents With Pain (PowerBack vs. national Average)
0%
5%
10%
15%
20%
25%
30%
35%
40%
33.4%
July-Dec 11 Jan-Jun 12
PowerBack Short-Stay Pain QM National Short-Stay Pain QM
26.7%
23.1%21.6%
Short-Stay Pain Quality Measure
Exhibit 3 shows the short-stay pain QM data for
PowerBack patients, for which Genesis has seen a 6.7
percent improvement since the program was intro-
duced at Brightwood, however the QM rate remains
slightly higher than the national average. While this
rate was expected to be higher than the national
average because the facility cares for a 100 percent
short-stay population with higher acuity patients, pain
among PowerBack patient is continuing to decline.

63
Appendix A – Quality Measures:Changes from MDs 2.0 to MDs 3.0
MDS 2.0 Quality Measures MDS 3.0 Quality Measures Differences
SS (PAC)measure used only 5 and 14 day PPS;
LS (CC)measures used OBRA assessments; 14-day look-back for most MDS items
*= used in Five-Star Quality Domain
Uses all PPS and OBRA assessments for both SS and LS measures including a Discharge Assessment which was not available with 2.0 QMs; based on resident episodes; 7-day look-back for most MDS items
MDS 2.0 and 3.0 QMs use completely different resident sample and assessment selection methodologies and cannot be directly compared; SS includes residents with episodes </= 100 days; LS includes residents with episodes >100 days
Pain SS
Percent of residents who had moderate to severe pain–PAC*
SS Measure (#0676): Percent of Resi-dents Who Self-Report Moderate to Severe Pain*
MDS 3.0 QM uses direct resident inter-view and industry standard pain scales.
Pressure Ulcers
SS
Percent of residents with pressure ulcers (sores)–PAC*
SS Measure (#0678): Percent of Resi-dents with New or Worsening Stage II-IV Pressure Ulcers*
MDS 3.0 QM does not capture Stage I PUs as did MDS 2.0 QM; MDS 3.0 no longer “reverse stages”
Flu Vaccine SS & LS
Percent of residents given influenza vaccination during the flu season–short-stay (PAC) and long-stay (CC)
SS Measure (#0680), LS Measure (#0681): Percent of Residents Who Were Assessed and Appropriately Given the Seasonal Influenza Vaccine
MDS 3.0 includes offered and declined the vaccine, and ineligible due to con-traindications
Pneumococcal Vaccine SS & LS
Percent of residents who were assessed and given pneumococcal vaccination–short-stay (PAC) and long-stay (CC)
SS Measure (#0682), LS Measure (#0683): Percent of Residents Assessed and Appropriately Given the Pneumo-coccal Vaccine
MDS 3.0 includes offered and declined the vaccine, and ineligible due to con-traindications
Pain LS
Percent of long-stay residents who have moderate to severe pain (CC)*
LS Measure (#0677): Percent of Resi-dents Who Self-Report Moderate to Severe Pain*
MDS 3.0 QM uses direct resident inter-view and industry standard pain scales
Pressure Ulcers
LS
Percent of long-stay high-risk residents who have pressure ulcers (CC)*
LS Measure (#0679): Percent of High-Risk Residents With Stage II- IV Pres-sure Ulcers*
MDS 3.0 QM does not capture Stage I PUs as did MDS 2.0 QM. MDS 3.0 no longer “reverse stages”
MDS 2.0 Quality Measures MDS 3.0 Quality Measures Differences
SS measure used only 5 and 14 day PPS
LS measures used OBRA assessments* = Used in Five-Star Quality Domain
Uses all PPS and OBRA assessments for both SS and LS measures including a Discharge Assessment which was not available with 2.0 QMs; based on resident episodes
MDS 2.0 and 3.0 QMs use completely different resident sample and assessment selection methodologies and cannot be directly compared
Infections LS
Percent of long-stay residents who had a urinary tract infection (CC)*
LS Measure (#0684): Percent of Resi-dents with a Urinary Tract Infection*
Item 12300 used in 3.0 QM has specific criteria to follow for coding UTI
Incontinence LS
Percent of long-stay residents who lose control of their bowels or bladder (CC)
LS Measure (#0685): Percent of Low Risk Residents Who Lose Control of Their Bowel or Bladder
3.0 QM uses the BIMS score to deter-mine severe cognitive impairment
CatheterLS
Percent of long-stay residents who have/had a catheter inserted and left in their bladder (CC)*
LS Measure (#0686): Percent of Residents Who Have/Had a Catheter Inserted and Left in Their Bladder*
3.0 QM adds exclusions for neurogenic bladder and obstructive uropathy
RestraintsLS
Percent of long-stay residents who were physically restrained (CC)*
LS Measure (#0687): Percent of Residents Who Were Physically Restrained*
Similar
ADLsLS
Percent of long-stay residents whose need for help with daily activities has increased (CC)*
LS Measure (#0688): Percent of Resi-dents Whose Need for Help with Ac-tivities of Daily Living Has Increased*
"MDS 3.0 measure interprets a code of "7" or "8" in section G- ADLs as a "4" for purposes of calculating the measure"
Weight LossLS
Percent of long-stay residents who lose too much weight (CC)
LS Measure (#0689): Percent of Resi-dents Who Lose Too much Weight
MDS 3.0 measure pertains to residents who were not on a physician pre-scribed weight-loss regimen
DepressionLS
Percent of long-stay residents who are more depressed or anxious (CC)
LS Measure (#0690): Percent of Resi-dents Who Have Depressive Symp-toms
MDS 3.0 measures uses standardized scales PHQ-9 © and PHQ-9OV© items + scores 65
Appendix B – Chapter 2 reference List
Gage, B., Deutsch, A., Smith, L., Schwartz, C., Ross, J.,
Reilly, K., Hazard Abbate, J., Shamsuddin, K.,
Silver, B., Murtaugh, C., Ross, J., & Stineman,
M. (2012a, September) The Development and
Testing of the Continuity Assessment Record
and Evaluation (CARE) Item Set: Final Report
on Reliability Testing. Tech. Vol. 3 of 3. RTI
International, Prepared for the Centers for
Medicare & Medicaid Services
Gage, B., Constantine, R., Aggarwal, J., Morley, M.,
Kurlantzick, V., Bernard, S., Munevar, D., Garrity,
D., Smith, L., Barch, D., Deutsch, A., Mallinson,
T., and Ehrlich-Jones, L. (2012a, June) The
Development and Testing of the Continuity
Assessment Record and Evaluation (CARE)
Item Set: Final Report on the Development
of the CARE Item Set. Tech. Vol. 1 of 3. RTI
International, Prepared for the Centers for
Medicare & Medicaid Services
Gage, B., Gage-Croll Z., Hazard Abbate, J., Reilly K.,
Shamsuddin, K., Kline, T., Smith L., Coots, L.,
Deutsch, A., Mallinson, T., & Ross, J. (2012a,
May) The Development and Testing of the
Continuity Assessment Record and Evaluation
(CARE) Item Set: Final Report on Reliability
Testing. Tech. Vol. 2 of 3. RTI International,
Prepared for the Centers for Medicare &
Medicaid Services
Gage, B., Morley, M., Smith, L., Ingber, M., Deutsch,
A., Kline, T., Denver, J., Abbate, J., Miller, R.,
Lyda-McDonald, B., Kelleher, C., Garfinkel,
D., Manning, J., Murtaugh, C. Stineman, M. &
Stineman, T. (2012b, March) Post-Acute Care
Payment Reform Demonstration: Final Report.
Tech. Vol. 1 of 4. RTI International, Prepared for
the Centers for Medicare & Medicaid Services
Gage, B., Morley, M., Ingber, M., & Smith, L. (2011).
Post-Acute Care Episodes Expanded Analytic
File. Research Triangle Park, NC: RTI
International. Retrieved from http://aspe.hhs.
gov/health/reports/2011/PACexpanded/index.
shtml
Gage, B. J., Morley, M. A., Spain, P. C., & Ingber, M.
J. (2009, February). Examining post-acute care
relationships in an integrated hospital system.
Prepared for ASPE.
Gage, B., Ingber, M., Drozd, E. M., & Morley, M.
(2008, January). Post-acute care payment
reform demonstration: Market area selection
report. Prepared for the Centers for Medicare &
Medicaid Services.
Gage, B., Green et al, J. (2006, January). The state of
the art: Current CMS PAC instruments, Chapter
2 in Uniform Patient Assessment for Post-Acute
Care. Final report (A. Kramer & D. Holthaus),
Division of Health Care Policy and Research,
University of Colorado at Denver and Health
Sciences Center. Prepared for the Centers
for Medicare & Medicaid Services under
subcontract to IFMC (Contract No. IFMC 500-
2IA03).
Gage, B., Pilkauskas, N., Bartosch, W., Leung, M.,
Hoover, S., & Green, J. (2005, October). Long-
term care hospital (LTCH) payment system
monitoring and evaluation. Phase II Report.
Prepared for the Centers for Medicare &
Medicaid Services (Contract No. 500-00-0024,
T.O. #20).
Gage, B. (1999, Summer). Impact of the BBA on post-
acute utilization. Health Care Financing Review,
20(4), 103–126.
67
W W W. A Q n h C . o r g