insights - s&p global
TRANSCRIPT

insightsDeDicateD to investment trenDs anD inDex innovation
FeaturesA Market of Stocks 04
Spotlight on Rate Guarantees and the 07 S&P Healthcare Claims Indices
Rethinking Risk: Are Managed Volatility 12 Equity Strategies the Answer?
A New Year for Commodities? 15 A Q&A with Jodie Gunzberg
news & columnsMarket 360° with Howard Silverblatt: 16 Your “Paycheck” Went up 10% Last Year— And 2014 Started off Strong
Global Index News Feed 18
Index Roundup: Spotlight on New Launches 21
Upcoming Events 22
From Our Blogs 23
What’s InsIde:
sprIng 2014

S&P DOW JONES INDICES
WEBINARS ON-DEMANDCatch up anytime
Covering current market trends and innovations in indexing
Over 75 complimentary webinars available
watch now ON SPDJI.COM
>
>

3
what’s insiDe | eDitor’s note
goodbye winter and hello to (possibly) warmer opportunities. spring is in the air.
Besides being viewed as a time to clean house, spring is also seen as a symbol of new beginnings. In that spirit, this might be the season for a temperature check as we seek out new opportunities in the pursuit of our goals. In this spring’s feature stories, we look at markets from a few different angles and assess where they may be ripe with opportunities.
there’s no arguing that equity markets generally posted strong returns in 2013. that said, recent history did teach us a potential lesson—bull markets are often followed by rising correlations between asset classes as well as heightened volatility. therefore, when it comes to portfolio risk management, investors may want to prepare for all types of volatility regimes. Rethinking Risk: Are Managed Volatility Equity Strategies the Answer? takes a look at some of these strategies and the use of indices such as the CBOe Volatility Index®—or VIX®—as a hedge for equity portfolios.
In A Market of Stocks, dispersion is used to determine whether the current environment provides opportunities for stock pickers. In this article, dispersion is used to demonstrate the difference, over a given period of time, between the “best” and the “worst” performers in a market index.
A New Year for Commodities? a case could be made that it’s commodities’ turn to shine. several factors present in global markets may signal an environment ready for commodities to rise to the surface.
not surprisingly, healthcare continues to be a big topic in the U.s. as the volume of issues and challenges facing U.s. healthcare continues to rise, it’s an opportune time to take a closer look at this sector. In Spotlight on Rate Guarantees and the S&P Healthcare Claims Indices, Michael taggart, Fsa (empyrean Benefits solutions) and timothy nimmer, Fsa, Maaa (aon hewitt) talk about the indices and their applications, particularly as a basis for setting rate guarantee agreements. Launched in October 2013, the s&p healthcare Claims Indices are the first series developed with actual healthcare claims data from approximately 60 million commercially insured lives from 33 contributing plans. the indices track the changes in the cost and utilization of private medical insurance programs, including self-insured health plans sponsored by large corporations. they’re also a valuable tool for analyzing changes in healthcare expenditures and provide data on generic and branded prescription pharmaceuticals. We’ve even created an infographic to highlight some interesting data points on healthcare claims.
We hope you enjoy reading this edition of InsIghts. as always, let us know what you think, and if you’d like to suggest a story, write to [email protected].
Cheers,
Carol Cameron
carol cameron, DIRECtOR, MARkEtING
A pessimist sees the difficulty in every opportunity; an optimist sees the opportunity in every difficulty
—Winston Churchill

4
“stock picker’s Market?”
Is there a way to measure the degree to which a market environment is more or less conducive to successful stock selection? We think that the answer lies in a concept we call dispersion. From a definitional standpoint, dispersion measures the average difference between the return of an index and the return of each of the index’s components.3 From a computational standpoint, dispersion is a (weighted) standard deviation of cross-sectional returns—for example, the standard deviation of returns for all 500 members of the s&p 500 in a given month. From a conceptual standpoint, we can think of dispersion as the difference, over a given period of time, between the “best” and the “worst” performers in a market index. If dispersion is low, the gap between “best” and “worst” is relatively small; if dispersion is high, the gap between “best” and the “worst” is relatively wide.
exhibit 1 shows the trends in dispersion for the s&p 500 since 1991.
Features
a market oF stocks craig J. lazzara, CFa, senIOr dIreCtOr, IndeX InVestMent strategy
We’ve all heard market commentators opine that “It’s not a stock market, it’s a market of stocks.”1 At one level, the sentence denotes an obvious truth—that stock market returns (as embodied in indices like the S&P 500® or Dow Jones Industrial AverageTM) are a consequence of the returns of the individual components within the indices. The connotation of a “market of stocks,” however, is that the path to investment success requires careful stock picking—i.e., that it’s a “stock-picker’s market.” A frequently-cited argument in favor of 2014 being a stock-picker’s market is based on the correlation of stocks within the U.S. equity market.2 Falling correlations, it’s said, mean that stock pickers have fertile ground to demonstrate their skill.
exhibit 1: DISPERSION FOR tHE S&P 500
Source: S&P Dow Jones Indices. Data from Dec. 31, 1990 through Jan. 31, 2014. Chart is for illustrative purposes only. Past performance is not an indication of future results.
1 For example, see http://www.marketwatch.com/story/a-stock-market-versus-a-market-of-stocks-2011-11-02. 2 See http://online.wsj.com/news/articles/SB10001424052702304856504579338800864733042. 3 See http://us.spindices.com/documents/research/research-dispersion-measuring-market-opportunity.pdf.
18%
16%
14%
12%
10%
8%
6%
4%
2%
0%‘91 ‘03‘94 ‘06‘97 ‘09‘00 ‘12‘92 ‘04‘95 ‘07‘98 ‘10‘01 ‘13‘93 ‘05‘96 ‘08‘99 ‘11‘02 ‘14
6.03%

5
the most important thing to observe from exhibit 1 is that dispersion is currently quite low. In fact, the average level of dispersion across the 12 months of 2013 (5.0%) was lower than for any other year since 1991.4
this has some important implications for our discussion of the notion of a “stock-picker’s market.” exhibit 2 combines dispersion data with some insights from our periodic spIVa® reports.5
spIVa (standard & poor’s Index Versus active) scorecards compare the results of actively-managed mutual funds to style-appropriate benchmarks. In exhibit 2, the bars represent the difference in performance between the top and bottom 25% of active managers in each year; the higher the bar, the bigger the spread between the top and bottom quartiles. although the relationship isn’t perfect, it’s apparent that in periods of high dispersion, the gap between the best-performing managers and the worst-performing managers is relatively wide; when dispersion is low, the performance gap narrows.
If dispersion is plotted against the fraction of managers who outperform the s&p 500, the resulting graph tells us nothing—in most years, most managers underperform, regardless of the level of dispersion. although dispersion says nothing about the level of a manager’s skill, it signifies something important about the value of that manager’s skill. the fact that today’s dispersion levels are quite low by historical standards implies that the rewards for successful stock picking are likely to be small by historical standards.
If that’s the case, then the current environment is not especially good for demonstrating stock selection skill. although the situation could change between now and the end of 2014, at current dispersion levels we are by no means in a “stock-picker’s market.”
dispersion, Correlation and Volatility
If dispersion shows that today’s environment is relatively unfavorable for stock pickers, what can be said about the view that current low correlations favor active stock selection? the premise of the argument—that correlations declined throughout 2013—is certainly correct. however, the assumption that low correlations mean improved opportunity for stock selection is flawed.
It’s not difficult to construct a simple example of two stocks with negative correlation and exactly the same return,6 or two stocks with perfect positive correlation and very different returns. Both examples contradict the argument that equates low correlation with stock selection opportunity. the difficulty is that correlation and dispersion measure two different things. Correlation is primarily a measure of timing. high correlations mean that things go up and down at the same time; negative correlations mean that they offset. dispersion is a measure of magnitude. It tells us by how much the return of the average stock differed from the market average. Correlation is an essential tool in understanding portfolio diversification, but as a measure of the potential value added of stock selection strategies—dispersion is the better metric.
4 The average dispersion between 1991-2012 was 7.2%. 5 See http://us.spindices.com/documents/spiva/spiva-us-mid-year-2012.pdf.
exhibit 2: INtERQUARtILE RANGE OF ACtIVE FUNDS VS. S&P 500 AVERAGE MONtHLY DISPERSION
Source: S&P Dow Jones Indices. Data for 2007 are to March end; all other years are full calendar years. Chart is for illustrative purposes only. Past performance is not an indication of future results.
10%
8%
6%
4%
2%
0%2003 2006 20092004 2007 2010 20122005 2008 2011
PERFORMANCE DIFFERENCE
DISPERSION

6
exhibit 3: DISPERSION, CORRELAtION AND VOLAtILItY
Source: S&P Dow Jones Indices. Chart is for illustrative purposes only. Past performance is not an indication of future results.
But dispersion and correlation together give us important insights into the volatility of the entire stock market, as shown conceptually in exhibit 3. Consider what happens when the average pairwise correlation of stocks rises. since correlation is a measure of timing, rising correlations mean that stocks will be more likely to go up and down at the same time. that reduces the likelihood that gains in one stock will offset losses elsewhere—which means that, other things being equal, the volatility of the market will go up. the same thing happens when the market’s dispersion rises.
since dispersion is a measure of magnitude, rising dispersion means that the gap between the best and worst performers is increasing—which means that other things being equal, the volatility of the market will go up. Of course, other things are not always equal—rising correlations can be offset by falling dispersion, for example—but the interaction between the two measures provides a convenient framework in which to think about market volatility. and with both dispersion and correlations at relatively low levels, the framework explains why the market’s volatility is well below its average historical levels.
6 See http://www.indexologyblog.com/2014/01/30/dispersion-and-correlation-which-is-better/
DISPERSION
CORR
ELAt
ION
LOWer VOLatILIty
hIgher VOLatILIty
blog with us!
CONNECt WItH US:
www.spdji.com/registration

7
insights: what are some of the applications for the s&P healthcare claims indices?
tim: the indices have core applications across all aspects of the healthcare space. as healthcare costs continue to increase and place significant pressure on company budgets, employers are demanding a shift in accountability related to healthcare spend. this shift flows through to health insurers and providers, with providers increasingly being asked to take on risk for healthcare
spend. In this framework, the base use of the index is often to provide a robust measurement tool. Once the risk is understood, the use of the indices shifts towards providing a unique tool for transferring risk between payers, insurers and providers.
michael: One core application is that the indices can be used as a tool to benchmark the financial results of a specific organization (such as a health plan, a large healthcare provider system or a
How does one measure changes in U.S. healthcare expenditures? What about tracking changes in the utilization of private medical insurance programs? Why does it even matter? Ever since the 1970s, trends in the total cost of U.S. healthcare have varied widely (annual increases have ranged from the low-single digits to the high-teens). This disparity—a growing concern among employers, health insurance carriers, government and other healthcare-related organizations—adds a layer of difficulty when managing financial liabilities. On top of that, the lack of a timely, comprehensive and objective benchmark to consistently gauge the changes in healthcare costs make it even more problematic—until now.
sPotlight on rate guarantees anD the s&P healthcare claims inDices InterVIeW By CarOL CaMerOn
Launched in October 2013, the s&p healthcare Claims Indices is the first index series developed with actual healthcare claims data from approximately 60 million commercially-insured lives (approximately 40% of the commercially insured fee-for-service population in the U.s.) from 33 contributing plans. the indices track the changes in the cost and utilization of private medical insurance programs (including self-insured health plans sponsored by large corporations). they’re a valuable tool for analyzing changes in healthcare expenditures and also provide data on generic and branded prescription pharmaceuticals.
the index series was developed based on medical and pharmaceutical claims data obtained from leading health insurance companies and other U.s. data providers. they can be segmented by geographic region, state as well as select U.s. metropolitan areas.
S&P DJI developed these new indices in conjunction with healthcare professionals at Health Index Advisors (HIA), a joint venture between the premier actuarial and consulting firms Aon Inc. and Milliman Inc.
as the volume surrounding the issues and challenges facing U.s. healthcare continues to rise, it’s an opportune time to take a closer look at these indices. Michael taggart, Fsa and tim nimmer, Fsa, Maaa, spoke with InsIghts on key aspects of the indices and their applications, including as a basis for setting rate guarantee agreements.
Michael and Tim are not affiliated with S&P Dow Jones Indices. Michael’s and Tim’s opinions and statements are their own or that of Empyrean Benefits and Aon Hewitt and may not necessarily represent the views of S&P Dow Jones Indices or any of its affiliates.
Timothy (Tim) Nimmer is a Senior Vice President and serves as the Chief Actuary and Broking Officer for Aon Hewitt, a partner in the development of the S&P Healthcare Claims Indices. Michael is the President of Empyrean Benefits Solutions in Houston, Texas.
michael taggart President, Empyrean Benefits Solutions
tim nimmer Chief Actuary and Broking Officer, Aon Hewitt

8
large employer) against the broader market results reflected by the index. For benchmarking purposes, that organization may decide to track a specific component of healthcare costs. For example, a hospital system that benchmarks against the s&p healthcare Claims national all Business FFs Inpatient Cost Index or the s&p healthcare Claims national all Business FFs Facility Cost Index (Inpatient and Outpatient facility charges).
a second and related use is as a basis for setting a risk sharing agreement or a rate guarantee agreement. In this case, at least two parties need to be involved (i.e. a large employer and a health plan) and agree to use a specific s&p dJI index as the basis for sharing or transferring financial risk.
insights: let’s focus on the indices usefulness as part of a rate guarantee. what is a rate guarantee and how does it work?
michael: a rate guarantee agreement is similar to an insurance or swap agreement and could work as follows: a large employer with a self-funded medical plan wants to protect itself against the risk of their medical costs accelerating faster than the overall market trend. In that case, the employer and their health carrier could agree that if the employer’s actual medical costs increase by more than a specific amount (i.e., 100 basis points over the increase of the specific s&p healthcare Claims Index), then the health carrier will pay the costs above that level. In effect, the employer is transferring the risk that their healthcare costs would increase faster than the overall market increase.
tim: rate guarantees in various forms are common in agreements between large employers and insurance companies. In most cases, large employers will be “self-insured”—meaning they pay for healthcare claims incurred on behalf of their employees and are ultimately at risk for adverse claims experience. employers in these situations will usually contract with an insurance company to administer their healthcare benefits. they usually also look to insurance companies and other third-parties to help manage plan costs. In order to ensure that insurer and employer interests are aligned, and that insurers are implementing programs that will effectively manage plan costs, employers typically demand rate guarantees in their contracts with insurers. these guarantees place some portion of insurer fees at risk if healthcare cost increases exceed certain benchmarks.
insights: would the risk that the insurer would take on be offset to some other third-party?
michael: yes. several types of organizations, such as reinsurance carriers or banks may accept some of the financial risk from a health carrier. healthcare provider organizations may also decide to act as counterparties, since their financial interests are generally counter to that of healthcare payers.
insights: how would a counterparty hedge the associated risk?
michael: they may try to find other indices or investments that offset the risk profile of the risk they have accepted. some counterparties, such as reinsurance carriers or possibly healthcare provider organizations, may be comfortable holding the risk without structuring an offsetting investment.
insights: who should be looking at these indices and why? who would the counterparties be in a rate guarantee structure?
michael: healthcare is a huge economic sector and there are a wide range of organizations that may participate—employers, health carriers, reinsurance carriers, pharmacy Benefit Managers (pBMs), medical device makers, healthcare provider organizations, pharmaceutical firms, banks, consulting firms and hedge funds.
insights: Does a rate guarantee need an index?
tim: the key to an effective rate guarantee is having an unbiased measure of underlying healthcare trends that both parties can agree to. the index serves this purpose. Further, the index, unlike most trend estimates, automatically adjusts for macro changes in healthcare trends. Instead of having to first guess at market performance, the use of an index provides a solid measure of underlying market trends. this in turn allows for rate guarantees that specifically measure plan performance relative to overall market performance, which leads to tighter trend guarantees.
michael: While an index is not technically required for a rate guarantee, by using an index both parties can link their exposure to an independent, unbiased measure. In the absence of an index, one or both parties will have to accept the use of an arbitrary measure that may not be a credible basis when it comes to sharing risk.
insights: You mentioned earlier that the rate guarantee agreement is similar to insurance or a swap agreement. why would one choose a rate guarantee over something like a swap contract?
michael: the s&p healthcare Claims Indices could be used to support a swap contract. In a situation like this, one party could agree to take the index rate and the other party would take the actual rate. a rate guarantee could also resemble an insurance contract in that it may provide for one party to transfer its risk to the other party based on the spread between the actual results and the index.
insights: can other healthcare indices or benchmarks, available in the market today, be used for rate guarantee products?
michael: We’re not aware of any other data sets that can meet the criteria needed to support rate guarantee products, which would include being an independent publisher of data, without any conflict of interests, providing monthly information updates from a consistent data source, the amount of data provided (in terms of volume of claims or membership) and the depth of data used.

9
tim: While there are several other measures of trend that are published regularly, the s&p healthcare Claims Indices are truly unique in the market. no other published trend measure combines the level of robustness, credibility, timeliness, and independence that these indices have. as a result, these indices are the optimal measure to use in rate guarantee products.
insights: are the s&P healthcare claims indices a better tool for products such as rate guarantees?
tim: yes. While the economic indices provided a reasonable measure for tracking trends on a national basis, there were two key limitations in using these for rate guarantees. First, since the indices were not based on actual claims there was the potential for the trends in the economic indices to diverge, at least temporarily, from actual underlying claims experience. second, the economic indices could only provide trends on a national basis, but healthcare trends show significant regional variation that needs to be taken into account when setting rate guarantees. the claims based indices solve for both of these items.
insights: how do the s&P healthcare claims indices stack up against other healthcare indices available in the marketplace today?
michael: there are no comparable indices in terms of the amount of claims data supporting the indices, the frequency of updating and the level of detail available in the indices (geographic, line of business, type of expense, etc.). the claims indices are based directly on actual insured membership and claims, so they’re a more credible and accurate measure of healthcare cost trends than the economic model used in the economic indices.
insights: we’re all aware that healthcare costs have skyrocketed in the u.s. and the pressure is on to bring those costs down. looking at the current environment, where do you see these indices having the biggest impact when it comes to measuring and tracking healthcare expenditures?
michael: For organizations connected to the commercial health insurance market (employers, public sector employers, health carriers, healthcare provider organizations, pharmacy benefit managers, pharmaceutical manufacturers), the indices are a new and long-needed set of tools to help structure financial risk agreements.
tim: We expect the indices to play a key role in tracking healthcare expenditures to influence both the employer/insurer and insurer/provider relationships. the indices will allow employers to demand a new level of accountability from insurers and will create an environment that will reward insurers that are best able to manage overall healthcare risk. From the provider perspective, the indices will facilitate payment structures and new risk sharing arrangements between providers and insurers.
insights: how do rate guarantees help manage the rising cost of healthcare?
michael: In the current market, virtually all economic incentives are aligned in favor of higher costs. In order for healthcare costs to be controlled, tools that can be applied to create counterbalancing incentives that reward efficiencies that lower costs. By using the indices to set realistic targets that reward organizations that deliver superior financial performance, the indices could be a powerful tool to help spur competitive healthcare markets and moderate the increase of healthcare costs.
tim: rate guarantees can help to align incentives across the healthcare spectrum. For example, from an employer’s perspective, guarantees provide a mechanism to encourage innovation in approaches to population health management by aligning vendor payments to plan performance.
insights: the affordable care act (aca) has seen its share of headlines over the past few years. since one of the goals of the indices is to serve as a tool to analyze changes in u.s. healthcare expenditures, how can these indices help in relation to the act?
michael: the indices will provide some valuable information to better understand the impact of the aCa. For example, by looking at the index trends for the individual health insurance market (where the changes from the aCa reforms are significant) and comparing them to the asO (administrative services Only) index measures (where the aCa reforms are relatively minor), we can get a better understanding of how the aCa is impacting the cost of insurance coverage.
insights: what geographic regions do the indices cover?
michael: all U.s. areas including alaska and hawaii.
We expect the indices to drive rate guarantees between health carriers and ASO-based employers. The indices provide a meth-od for establishing market trends in a specific region that follows an employer’s geographic footprint.
10
insights: can rate guarantee products be done at the lower geographic levels, or is this mainly a broad national index product?
michael: since the data is provided at the three-digit zip code level, the indices can support risk guarantees at the regional or even metropolitan (sMsa) levels. For healthcare provider organizations, which tend to be local or regional in scope, the ability of the indices to support sMsa level analysis is important.
tim: rate guarantees are inherently done at a local level. healthcare trends vary by region, and effective rate guarantees need to take this regional variation into account. the ability to use regional, local, or custom indices to account for geographic variations is a key reason why the claims based indices are uniquely positioned as a basis for rate guarantees.
insights: is it more difficult to hedge the risk of a rate guarantee at the lower geographic levels?
michael: not necessarily—as long as the appropriate regional index contains a statistically credible weight, the regional hedge can be supported.
insights: what data sources are used to calculate the indices?
Michael: the data is provided from multiple sources, including health carriers and healthcare data analytic firms.
insights: would these data providers be the same parties that are underwriting the rate guarantee contracts?
michael: In some situations, organizations that are contributing data could also be users of the final indices. In this regard, it’s important to note that the data contributed is simply the actual record of the claims paid during each month, so the data can be verified back to the financial statements of the organization.
insights: what are some of the key trends the indices show?
michael: the rate at which healthcare costs are changing, the variations in the rate of change by region, line of business, type of expense, etc. the utilization trends for inpatient days and prescription drugs will be important to any organization that analyzes the level at which the population accesses healthcare services.
insights: how do these trends affect the ability to underwrite rate guarantee products?
michael: We anticipate that underwriting processes for health insurance plans will remain consistent with current practices. however, the indices will open up new ways to structure risk—for example, multi-year guarantees.
insights: Do rate guarantee products become more difficult to underwrite as the change in healthcare costs become more volatile?
michael: possibly, although to the extent that there is greater volatility in the market, there is likely to be increased demand for rate guarantees. also, while I expect higher volatility would drive up the price of the guarantees, we should also consider the term of the guarantees also. there may well be short-term volatility cost, but less volatility anticipated for long-term contracts. therefore, a long-term contract may not show as much price change as a short-term contract would, or vice versa.
insights: insurers are able to use the healthcare claims indices to analyze past experience trends and help set future rates. these benefits would be particularly important to aso Plans. can the healthcare claims indices play any role in setting rate guarantees between the health carriers and aso-based employers?
tim: We expect the indices to drive rate guarantees between health carriers and asO-based employers. the indices provide a method for establishing market trends in a specific region that follows an employer’s geographic footprint. In turn, actual employer experience can be compared to these customized market trends to establish rate guarantees.
michael: the indices may be the best way for asO plans (typically those plans sponsored by large employers) to structure a rate guarantee—since asO plans tend to be large and have a relatively stable membership, they have a credible basis for setting claims guarantees, so having a market index measure applicable to these plans is ideal.
insights: are rate guarantees only beneficial to aso based employers, or can they be used for group business and individual lines of business as well?
michael: they could be applied to insured groups as well.
insights: lastly, who benefits from a rate guarantee written against a group line of business?
michael: Ideally, all parties may benefit. One of the most fundamental problems facing firms exposed to healthcare costs is the lack of tools to help them manage that risk. health carriers may want to use the indices to hedge some of their insured business in order to cover the risk that their projected estimates on the healthcare trend could be understated.

11
LARGEST HEALTHCARE SAMPLE SIZE AVAILABLE IN THE INDEX MARKET TODAY
INDICES PUBLISHED BY S&P DJI
CensusDivision
CensusRegion
S&PRegion State Level Sub State
G E O G R A P H I C C OV E R AG E
NO. 1RESULT
50 STATES
4 REGIONS
9 SUB-
REGIONS
49 MAJOR
METROPOLITAN AREAS
17,000
1Administrative Services Only2Per Member Per Month
65 MILLION COMMERCIALLY REPRESENTED BY THE DATA
4 LINES OF BUSINESS ASOs1, LARGE GROUP, SMALL GROUP, INDIVIDUAL
8 TYPES OF HEALTHCARE CATEGORIES MEDICAL, RX/DRUG, BRAND DRUG, GENERIC DRUG, FACILITY, PROFESSIONAL SERVICES, INPATIENT, OUTPATIENT
3 CATEGORIES OF INDICES OFFERED COST, UTILIZATION, UNIT COST
5 TYPES OF DATA REPORTED INDEX LEVEL, TOTAL INDEX CLAIMS DOLLARS, TOTAL INDEX ENROLLMENT, UTILIZATION AND PMPM2
CHECKING THE MARKET’S VITALS WITHTHE S&P HEALTHCARE CLAIMS INDICES

12
2013 was a terrific year for equity markets as many of the global equity markets posted strong returns. In the U.S, the S&P 500® returned a record-breaking 32.39%* and the average large-cap core manager, based on the Lipper category average, posted a 31.63% gain. Overseas, the international developed markets returned 21.44%, which was by no means a small feat. Is it possible that volatility and downside protection—on every investor’s mind following the 2008 financial crisis—may have taken a backseat after the higher returns seen in 2013?
rethinking risk: are manageD volatilitY equitY strategies the answer?
history has painfully taught us that roaring, secular bull markets are often followed by significant downturns, rising asset class correlations and heightened volatility. the truth: very few investors can predict when the storm is coming and by the time realization kicks in, it is often too late. therefore, when it comes to portfolio and risk management, it is important for investors to be proactive and prepare for all types of volatility regimes. In light of the recent turmoil across global financial markets, this seems to be an appropriate time for investors to reconsider and evaluate risk-mitigating mechanisms that meet their risk tolerance levels and budget.
since the 2008 financial crisis, managed volatility equity strategies have gained popularity and greater acceptance among investors. the common feature among the various types of risk management strategies is that they provide a degree of upside participation in the market while limiting downside exposure. the process by which each strategy achieves its objective differs as does its risk/return profile (see exhibits 1 and 2).
berlinDa liu CFA, Director, Index Research & Design S&P Dow Jones Indices
aYe m. soe CFA, Director, Index Research & Design S&P Dow Jones Indices
exhibit 1: CUMULAtIVE REtURN OF tHE MANAGED VOLAtILItY EQUItY StRAtEGIES VERSUS tHE MARkEt
Source: S&P Dow Jones Indices. Data from December 20, 2005 through February 28, 2014 based on the earliest date where index performance data is available for all examined indices. Charts and graphs are provided for illustrated purposes. Past performance is not a guarantee of future results.
300
250
200
150
100
50deC-05 deC-08 deC-11deC-06 deC-09 deC-12deC-07 deC-10 deC-13 deC-14
S&P 500
S&P 500 VEQtOR
S&P 500 Low Volatility
S&P 500 Daily Risk Control 15%
S&P 500 Daily Risk Control 12%
S&P 500 Daily Risk Control 10%
S&P 500 Daily Risk Control 5%
*All return numbers listed are total returns
13
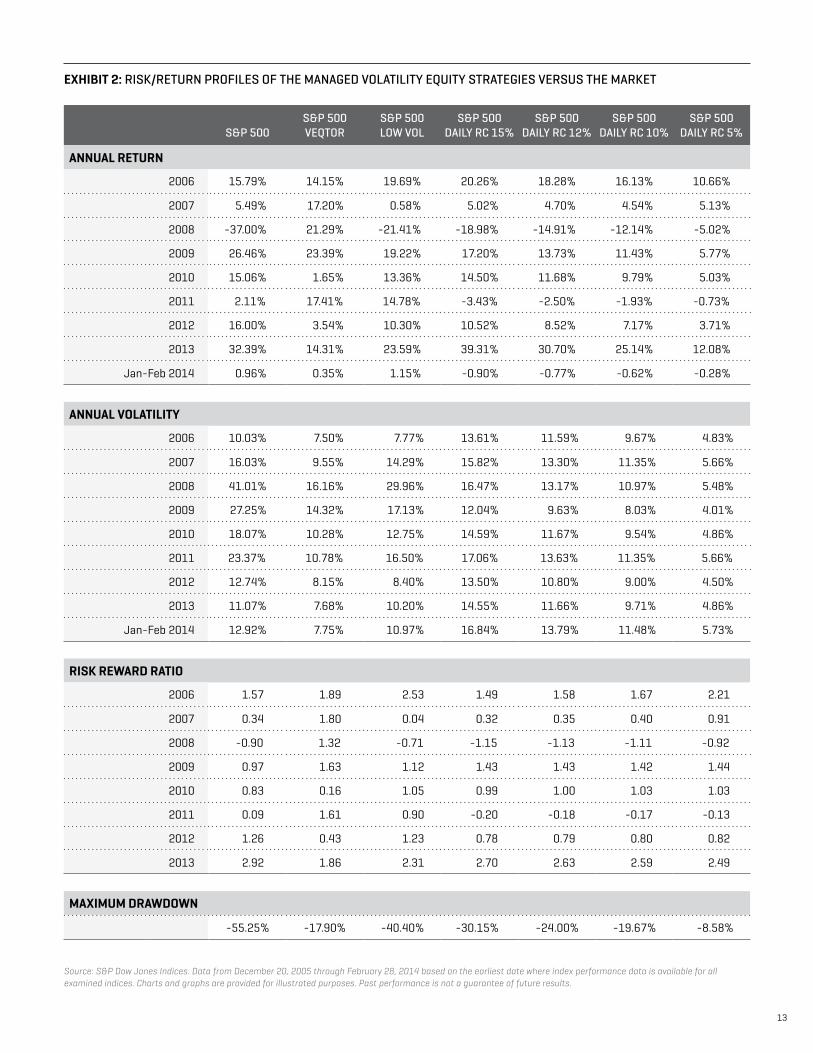
exhibit 2: RISk/REtURN PROFILES OF tHE MANAGED VOLAtILItY EQUItY StRAtEGIES VERSUS tHE MARkEt
Source: S&P Dow Jones Indices. Data from December 20, 2005 through February 28, 2014 based on the earliest date where index performance data is available for all examined indices. Charts and graphs are provided for illustrated purposes. Past performance is not a guarantee of future results.
S&P 500S&P 500 VEQtOR
S&P 500 LOW VOL
S&P 500 DAILY RC 15%
S&P 500 DAILY RC 12%
S&P 500 DAILY RC 10%
S&P 500 DAILY RC 5%
annual return
2006 15.79% 14.15% 19.69% 20.26% 18.28% 16.13% 10.66%
2007 5.49% 17.20% 0.58% 5.02% 4.70% 4.54% 5.13%
2008 -37.00% 21.29% -21.41% -18.98% -14.91% -12.14% -5.02%
2009 26.46% 23.39% 19.22% 17.20% 13.73% 11.43% 5.77%
2010 15.06% 1.65% 13.36% 14.50% 11.68% 9.79% 5.03%
2011 2.11% 17.41% 14.78% -3.43% -2.50% -1.93% -0.73%
2012 16.00% 3.54% 10.30% 10.52% 8.52% 7.17% 3.71%
2013 32.39% 14.31% 23.59% 39.31% 30.70% 25.14% 12.08%
Jan-Feb 2014 0.96% 0.35% 1.15% -0.90% -0.77% -0.62% -0.28%
annual volatilitY
2006 10.03% 7.50% 7.77% 13.61% 11.59% 9.67% 4.83%
2007 16.03% 9.55% 14.29% 15.82% 13.30% 11.35% 5.66%
2008 41.01% 16.16% 29.96% 16.47% 13.17% 10.97% 5.48%
2009 27.25% 14.32% 17.13% 12.04% 9.63% 8.03% 4.01%
2010 18.07% 10.28% 12.75% 14.59% 11.67% 9.54% 4.86%
2011 23.37% 10.78% 16.50% 17.06% 13.63% 11.35% 5.66%
2012 12.74% 8.15% 8.40% 13.50% 10.80% 9.00% 4.50%
2013 11.07% 7.68% 10.20% 14.55% 11.66% 9.71% 4.86%
Jan-Feb 2014 12.92% 7.75% 10.97% 16.84% 13.79% 11.48% 5.73%
risk rewarD ratio
2006 1.57 1.89 2.53 1.49 1.58 1.67 2.21
2007 0.34 1.80 0.04 0.32 0.35 0.40 0.91
2008 -0.90 1.32 -0.71 -1.15 -1.13 -1.11 -0.92
2009 0.97 1.63 1.12 1.43 1.43 1.42 1.44
2010 0.83 0.16 1.05 0.99 1.00 1.03 1.03
2011 0.09 1.61 0.90 -0.20 -0.18 -0.17 -0.13
2012 1.26 0.43 1.23 0.78 0.79 0.80 0.82
2013 2.92 1.86 2.31 2.70 2.63 2.59 2.49
maximum DrawDown
-55.25% -17.90% -40.40% -30.15% -24.00% -19.67% -8.58%
*All return numbers listed are total returns

14
risk-controlled or target volatility strategies set an explicit risk level for the portfolio. Most risk-controlled strategies employ dynamic allocation between a risky asset, or a portfolio of risky assets, and a risk-free asset. the amount of allocation to each asset depends on the market environment and the estimates of short- and longer-term realized volatility. during periods of relatively low volatility, allocation to the risky asset increases, sometimes over 100% if leverage is used. Conversely, when volatility rises, the strategy lessens the allocation to the risky asset and increases allocation to the risk-free asset. rebalancing can occur on a higher frequency basis such as daily, or on a lower frequency basis such as monthly to exploit changes in volatility. hocquard, ng, papageorgiou (2013) found that volatility timing through a constant volatility framework not only controls risk but also reduces it and improves returns. Managers can use the available risk budget effectively and ensure that drawdowns are consistent with volatility targets.
the past five years also saw the proliferation of low volatility or minimum volatility strategies that seek to lower total portfolio volatility. Often termed as smart beta or alternative beta, these strategies achieve their goals either by constructing a portfolio of stocks that exhibit low volatility, low beta or a portfolio based on mean-variance optimization which takes into consideration the correlation between stocks. Clark, de silva and thorley (2006) constructed minimum-variance portfolios that resulted in annualized realized volatility at three-fourths that of the broad market. Based on volatility-sorted decile portfolios, Blitz and Vliet (2007) showed that selecting the top-decile portfolio (the least volatile bucket) based on trailing volatility resulted in realized volatility about two-thirds of the market volatility. regardless of
how the portfolio is constructed, both strategies deliver lower total portfolio volatility than a market-cap weighted benchmark and are more risk efficient. Over the past 23 years (ending February 28, 2014), both the s&p 500 Minimum Volatility Index and the s&p 500 Low Volatility Index returned 10.01% and 10.64% (vs. 9.55% for the s&p 500), respectively, on an annualized basis with volatility of 12.08% and 11.16%, respectively (vs. 14.67% for the s&p 500).
Lastly, using a derivatives overlay presents another option for risk management. the potential benefits of using the CBOe Volatility Index®, or VIX®, as a hedge for equity portfolios have long been established in academic literature. since the spot VIX is not investable, managers with long exposure to an equity portfolio can use VIX futures and the VIX Futures Index-linked products to potentially hedge tail risk events. One example of using implied equity volatility to manage risk is the s&p 500 dynamic VeQtOr Index. the index dynamically allocates between the s&p 500, the s&p 500 VIX short-term VIX Futures Index and cash based on the realized volatility of the equity market and the implied volatility of s&p 500 options. Based on live performance data, the index returned 17.41% in 2011, a period marked by see-sawing volatility in the U.s. equity markets, with 10.78% annualized volatility. during the same period, the s&p 500 returned 2.11% with 23.37% volatility. It is worth noting that while the hedging properties of the VIX futures are well established, their potentially high carrying costs should be carefully evaluated by every manager considering this option.
the past year has been marked by low volatility and significant opportunities for capital appreciation. Financial history has shown us that while volatility levels can remain constant for long periods of time, spikes can occur very suddenly and sharp downturns develop rapidly as fears take hold. the strategies highlighted above are just examples of risk mitigation mechanisms managers can employ to protect large portfolio drawdowns. depending on the prevailing volatility levels, an investor’s risk budget and their assessment of the probability of an imminent tail event, any one or a combination of these strategies can be incorporated as part of risk management.
Managers can use the available risk budget effectively and ensure that drawdowns are consistent with volatility targets.

15
a new Year For commoDities? a q&a with Jodie gunzberg
Now that equities have had a good year of performance, it might be time for commodities to shine. Several factors present in the market today support the case for commodities including a shift from a world economy driven by expansion of supply to one where growth is driven by expansion of demand. The latter is typically characterized by inflation and rising interest rates.
Post-financial crisis, suppliers decreased production, which made inventories fall to levels where shortages have become a recurrent factor. As a result, commodities have been more sensitive to recent events like the abnormally cold weather and droughts in the U.S. and tensions in the Ukraine, all of which have put premiums on holding commodities and have lowered correlation to pre-crisis levels.
During a quick chat with Jodie, she explained why various economic and market factors may signal an environment ripe for a commodities comeback.
insights: when thinking about commodities, why does it matter that equities have performed well?
Jodie: historically equities and commodities have been negatively correlated where they alternate as performance leaders. equities typically lead the economic cycle from pricing in forward-looking estimates and by the time they are performing well, companies are using capital to consume more natural resources to produce more goods. this increases the prices of commodities, and as commodities become more expensive, it creates a negative impact on the profits derived from equities, switching the cycle.
insights: what indicators have you seen that signal a cycle switch?
Jodie: the s&p 500® has outperformed the s&p gsCI® for the past six consecutive years. however, the s&p gsCI is outperforming the s&p 500 to-date.* the longest streak in equity outperformance spanned seven years (from 1980 to 1987), so a switch may be overdue.
there has been a shift in the world economy from growth driven by expansion of supply to growth driven by expansion of demand. this new environment is characterized by many commodity catalysts such as rising inflation and interest rates, with increasing exports and consumption analogous to prior commodity bull markets.
insights: are all commodities impacted similarly in this environment, or is it more conducive for some?
Jodie: One of the most interesting things about the current environment is that inventories are low. this makes commodities more sensitive to supply shocks that lower correlation. What this means is that certain events that disrupt the supply, like the weather and war, impact commodities more now than they did in recent past (post-financial crisis). When events like the tension in the Ukraine
impact the price of oil, gold and wheat, or rust fungus destroys coffee, and the arctic freeze disrupts the entire food supply chain, it spikes commodities’ prices, creating more potential diversification opportunities using beta and also greater possible alpha plays.
insights: why are environments of rising inflation and interest rates good for commodities?
Jodie: Commodities like food and energy, which are in the Consumer price Index (CpI), make up a large portion of commodity indices like the s&p gsCI and dJ-UBs Commodity Index. therefore, and generally speaking, when commodity prices increase, the value of the indices also increases. so, when consumers pay more for food at the grocery store and gas at the pump, their losses may be offset with commodity investments. also, higher interest rates are included in the prices of commodity futures and in the total return calculations of the indices, which are both normally positive for the investor.
insights: how much inflation protection do investors get from commodity indices?
Jodie: again, not all commodities provide the same inflation protection. Commodities that are most economically sensitive are the most powerful as inflation hedges. naturally, from the makeup of the CpI, energy and agricultural commodities may be powerful as a protection from inflation. something that is less obvious is that economically sensitive metals like copper, as an industrial metal, have provided more inflation protection than the popular precious metal, gold. historically, from 1992, the dJ-UBs has increased 10.3% for every 1% increase in CpI and the s&p gsCI has increased 15.6%. the greater inflation protection provided by the s&p gsCI stems from its world-production weighting, which results in heavier energy, the most volatile component of the CpI.
JoDie gunzberg CFA, Global Head of Commodity Indices S&P Dow Jones Indices
* At the time of publication.

16
Currently 420 issues pay a dividend in the s&p 500, the largest number since november 1998 (in 1977, there were 473). Last year 330 issues increased their dividend rate 381 times, as actual payments (your “paycheck”) increased 10.8% from Usd 281.5 billion to Usd 311.8 billion. additionally, over 90% of that dividend is dividend qualified, meaning that it is generally taxed at a lower rate, so you get to keep more of what you are paid. In 2014 (through March 15, 2014), there have been 114 increases, with actual cash payments up 13.7% year-over-year (increasing your paycheck 3%). Based on the announced and actual dividend policies to-date (with 10 months left to go for the year), 335 of the s&p 500 issues are scheduled to pay more in 2014 than in 2013. their current indicated dividend rate is now (based on their schedule) 7.9% higher than the actual 2013 cash payment, meaning that unless they quickly and significantly reduce their payments, 2014 is on track to post another record payment. at this point, if there were no changes to the index (membership, weights or dividends) the actual mathematics calculate out to a 6.6% 2014 payment gain over 2013. part of the reason for this is that dividends have become a part of the culture surrounding s&p 500 issues. eighty-four percent of them pay a dividend, compared to the non-s&p 500 U.s. common domestic market’s 45.9% rate. One hundred and twenty-nine issues have increased at least five years in a row, with 83 increasing for at least 10 years. Fifty-four issues are members of the s&p 500 dividend aristocrats, meaning they’ve increased dividends for at least 25 years (and meet additional requirements), with 15 of those 54 already increasing in 2014. additionally, earnings have been increasing, with 2013 setting new operating and as reported records, and consensus estimates based on Capital IQ data pointing to another record year for 2014. Cash flow has also set a record, as has cash on hand. debt remains manageable (in aggregate) with low interest
rates and good coverage rates (using either earnings or cash flow). payout rates, however, remain very low; companies are not being generous. Last year they paid out 36% of what they made (dividends as a percentage of as reported gaap earnings), but historically the rate has been 52%.
the search for income is currently challenging, as artificially low rates still prevail. yields for the s&p 500, while historically low at 2.0% (the average is 3.7% from 1936), are relatively attractive compared to those of bank instruments and bonds. dividend investors are typically more conservative, trading faster potential growth for more secure income, as different sectors offer different trade-offs (risk versus reward). however, it’s important to realize that all investments can go south, and that there is always risk. In reviewing dividend issues, it may be important to note both the company’s earnings and cash flow, because they can offer different perspectives (and dividends are a cash flow item—i.e., if you write the check you have to have the money in the bank). It is also important to consider whether a company’s cash flow is sufficient from current operations to support the business, the dividend and have some left over for growth. also of importance may be the company’s approach and history when it comes to dividends, along with their record of payouts and increases. Further, it may be helpful to seek out companies with yields that approximate those of their competitors (if the company is yielding high it could be a sign of a depressed stock or limited future expectations). and lastly, if holding a security for a number of years, it may also be important to be comfortable with a company’s business line and management.
market 360°WIth hOWard sILVerBLatt
Your “PaYcheck” went uP 10% last Year— anD 2014 starteD oFF strong
howarD silverblatt, SENIOR INDUStRY ANALYSt, INDEx INVEStMENt StRAtEGY, S&P DOW JONES INDICES
Global dividends in the S&P Global BMI (containing 26 developed and 20 emerging markets) have surpassed USD 1 trillion, with a third of that coming from the S&P 500. Dividends are like paychecks; you expect them to be paid and you expect increases, typically on an annual basis.

17
exhibit 1: DIVIDENDS PAID OVER tIME
exhibit 2: WHO PAYS WHAt?
Source: S&P Dow Jones Indices. Data as of Feb. 28, 2014. Charts and graphs are provided for illustrative purposes. Past performance is not a guarantee of future results.
Source: S&P Dow Jones Indices. Data as of Feb. 28, 2014. Charts and graphs are provided for illustrative purposes. Past performance is not a guarantee of future results.
S&P DOW JONES INDICES
MARkEt VALUE $ BILLI0NS DIVIDEND INDICAtED $ BILLI0NS YIELD
S&P BROAD MARkEt INDEx $43,076 $1,023 2.46%
S&P 500 $16,612 $338 2.04%
S&P MidCap400 $1,567 $22 1.37%
S&P SmallCap600 $690 $8 1.18%
S&P 500 paid 2013 - Billions $311.82
S&P 500 paid 2012 - Billions $281.53
S&P 500 paid 2011 - Billions $240.38
S&P 500 paid 2010 - Billions $205.35
S&P 500 paid 2009 - Billions $196.22
S&P 500 paid 2008 - Billions $247.89
S&P 500 paid 2007 - Billions $246.58
S&P 500 SECtOR DIVIDEND DAtA, BASED ON INDICAtED DIVIDEND RAtE:
SECtORCONtRIBUtION
2004CONtRIBUtION
2009CONtRIBUtION
2013CONtRIBUtION
CURRENtYIELD 2004
YIELD 2009
YIELD 2013
YIELD CURRENt
PAYING ISSUES
2004
PAYING ISSUES
2009
PAYING ISSUES
2013
PAYING ISSUES
CURRENt
YIELD OF PAYERS
CURRENt
Consumer Discretionary 6.21% 7.10% 8.36% 9.11% 0.90% 1.44% 1.32% 1.48% 72 53 63 65 1.89%
Consumer Staples 12.32% 17.29% 13.28% 13.07% 2.02% 2.96% 2.70% 2.80% 34 39 38 38 2.84%
Energy 7.91% 12.09% 11.42% 11.48% 1.90% 2.05% 2.20% 2.32% 24 33 38 39 2.39%
Financials 29.11% 9.04% 13.75% 13.59% 2.42% 1.22% 1.68% 1.74% 80 66 76 76 1.92%
Health Care 11.09% 13.17% 11.42% 11.12% 1.50% 2.03% 1.75% 1.65% 31 22 33 33 2.27%
Industrials 11.79% 11.88% 11.23% 11.14% 1.72% 2.26% 2.04% 2.11% 50 54 60 60 2.15%
Information technology 5.14% 9.07% 15.35% 15.00% 0.55% 0.89% 1.63% 1.62% 22 29 44 44 2.20%
Materials 3.55% 3.26% 3.73% 3.68% 1.97% 1.76% 2.11% 2.12% 29 28 30 30 2.14%
telecommunication Services 6.63% 8.99% 5.52% 6.13% 3.48% 5.53% 4.76% 4.95% 8 6 5 5 5.27%
Utilities 6.24% 8.11% 5.94% 5.68% 3.64% 4.26% 4.02% 3.87% 27 33 31 30 3.87%
s&P 500 100.00% 100.00% 100.00% 100.00% 1.72% 1.95% 1.98% 2.03% 377 363 418 420 2.35%

18
global inDex news FeeDaLL eyes On LatIn aMerICa
s&p dJI’s efforts are in full swing as the company expands its footprint in key markets across the globe, including Latin america.
the Latin american marketplace is evolving and the region’s indexing landscape is moving in tandem. Contributing to this evolution are the changes taking place in the local regulatory environment, which include the release of a new resolution by the national Monetary Council at the Central Bank in Brazil. released in september 2013, the resolution sets the framework for the issuance of structured notes—known locally as certificates of structured transactions— by commercial, investment and savings banks. In addition, Mexico ramped up its efforts for financial reform, approving changes to about 34 financial and banking laws (published in January 2014) to strengthen their banking regulation and legal framework as they relate to guarantee collection, increase in competition and enhanced transparency. these as well as other changes are facilitating the design and creation of new index-based investment products for equities and fixed income in the region.
seekIng eQUIty VIa the andean Markets
Over the past several years, the global investment community has had their eyes on Chile, Colombia and peru (aka the andean markets) as these countries have experienced solid economic growth and deepening financial markets. recognizing the significance of these regions, in 2011 s&p dJI signed an agreement with Mercado Integrado Latino americano (“MILa”) exchange. MILa is an integrated trading venture formed by stock exchanges in Chile, Colombia and peru. the pact aims to develop the capital market through the integration of these three countries, to provide a greater supply of securities, issuers and also larger sources of funding.
since signing this agreement, s&p dJI has launched a number of indices including the s&p MILa 40. this unique index is designed to provide investors with an easily replicable snapshot of liquid and tradable MILa securities. Other s&p MILa indices include the s&p MILa Financials and the s&p MILa resources sector indices.
Last October, the s&p MILa 40 Index was licensed to horizon etFs group, making it the first Colombian etF focused on the andean region. the etF is listed on the Bolsa de Valores de Colombia and is the first andean equity-focused etF available in Latam.
the FIXed InCOMe perspeCtIVe a more liquid Latin american bond market is also taking shape, which is important for local economies, businesses and infrastructure as long-term borrowing is typically the funding source for many capital projects. From a demand perspective, a liquid bond market helps meet the needs of global investors seeking to access local investment opportunities that provide incremental yield over other investments.
also, the changing regulatory landscape is reshaping the fixed income indexing environment in Latin america. For example, IOsCO (International Organization of securities Commissions) recently published principles for financial benchmarks, which seek to provide a framework of standards across the index industry. IOsCO’s principles for Financial Benchmarks was triggered by the Libor scandal that created turmoil around the integrity of that important benchmark and captured headlines around the world. For fixed income indices, these principles create an opportunity for consistent practices, making for a more transparent market. as an independent index provider, s&p dJI is already well-positioned to align itself with many of these principles.
In addition, the separation of its analytic and commercial functions; long-established transparency policies; and sound index development, calculation, and distribution processes, to name a few, contribute to its position as a global leader in index management.
s&p dJI’s global indexing standards extend to all indices created by the firm, including its platform of fixed income indices developed to track the Mexican market. these indices provide some of the much-needed transparency to help investors better understand the fixed income market.
to meet the demand, s&p dJI partnered with Valuacion Operativa y referencias de Mercado, s.a. de C.V. (Valmer), and launched five fixed income indices earlier this year. Four index families have been launched covering government bonds, quasi-sovereign bonds, corporate bonds and money market. the s&p/Valmer Mexico government Bond Indices have been licensed to Blackrock, Inc. and are the basis of an etF currently available on the Mexican stock exchange.

19
grOWth OppOrtUnItIes In sOUth aFrICa
In the previous edition (Winter 2013), InsIghts highlighted the opening of s&p dJI’s first office in south africa, solidifying the firm’s strategic growth initiatives in africa. On the heels of its new local presence, s&p dJI launched a family of south africa Indices to bring greater index opportunities and transparency to the local market. the new family of indices offered is headlined by the s&p south africa Composite. the index covers equities listed on the Johannesburg stock exchange with float-adjusted market values of Usd 100 million or more and annual dollar value traded of at least Usd 50 million. the s&p south africa Composite is the basis for numerous subindices
which are broken down by different sectors including size, global Industry Classification standard (gICs®) and shariah compliance. the index tries to meet the demand of both domestic and international investors looking for an independent benchmark measuring the country. among the nine indices launched are the s&p south africa dividend aristocrats and the s&p south africa Low Volatility Index. these indices represent the first time south african investors will be able to measure the performance of long-time dividend payers and low volatility campanies. the complete list of indices can be found at www.spdji.com and is also listed in the “Index roundup” section of this edition. Over the next few months, s&p dJI looks forward to rolling out additional indices to complement the initial nine indices launched in the region.
here’s What eLse We’re sayIng mike on the Pacific alliance and mila Michael Orzano, CFa, director, global equity Indices
Mike is responsible for the design and creation of all s&p dow Jones global equity indices, focusing on creating new benchmarks for international equity markets and promoting their use among global investors.
MILa is a central part of the economic integration efforts among members of the pacific alliance (Chile, Colombia, Mexico and peru). Mexico is expected to formally join MILa later this year, at which point it will be included in our family of s&p MILa Indices. the addition of a market with the size and liquidity of Mexico will allow us to create further diversification for the region.
the integration of MILa is an important initiative with the potential to aid in the development of the region’s capital markets by promoting cross-border capital flows. More broadly, the countries of the pacific alliance are expected to further integrate their economic policies (e.g., broader free-trade agreements and other steps to boost growth).
the economies of the pacific alliance have generally performed well in recent years. In fact, there has been a significant divergence in growth trajectories in Latin america where the pacific alliance countries have performed well, are pursuing economic policies conducive to growth and are generally favorably viewed by the investment community. Comparatively, Brazil, argentina and Venezuela have been beset by varying degrees of economic issues affecting their market performance.
antonio on indexing strategies in latin americaantonio de azpiazu, Vice president, head of Client Coverage, Latin america
antonio is responsible for building and managing client relationships in Latin america. he is also an economist with an MBa from the University of hull in the Uk and aMp by Instituto de empresa (Ie) in Madrid, spain.
Index strategies—through the use of etFs or derivative products—have gained momentum as cost-effective ways to gain access to opportunities in Latin america. Index strategies also provide an easy access point to specific Latin america regions or sectors in a well-diversified liquid fashion. as index strategies gain popularity, it is important to distinguish between benchmark and strategy indices. Benchmark indices are market valuation tools. they are constructed to measure and compare various financial markets and segments of those markets. strategy indices are alternative methods for investing in the financial markets. strategy indices do not measure beta, nor are they used as a substitute for beta. rather, strategy indices are designed to intentionally capture a return path that differs from that of a benchmark index. these indices are engineered primarily as the basis for investment products. We look forward to potentially becoming the index provider of reference in Latin america for both benchmark and strategy indices.

20
J.r. on s&P DJi’s partnership with valmerJames “J.r.” rieger, global head of Fixed Income Indices
With over 30 years of fixed income experience, J.r. leads s&p dow Jones Indices’ effort to reach into capital markets beyond traditional equity.
In partnering with Valmer, s&p dJI is combining local market expertise with our global indexing standards. Valmer has long provided bond pricing and indices in the Mexican bond market and is one of the leading providers in this market today. the s&p/Valmer bond indices are unique in that they cover the majority of the Mexican bond market as benchmark indices but also because six of those indices have been designed for passive investing. In other words, those six indices are designed to reflect the most liquid segments of the market they track. these are currently the only investable bond indices in the Mexican bond market.
zack on the south african regionZack Bezuidenhoudt, regional head, south africa and sub-saharan africa
as the firm’s regional head covering the south african and sub-saharan african regions, Zack is responsible for expanding awareness and adoption of s&p dow Jones Indices targeted to those regions.
south africa is the largest economy in africa with about 80% of the market cap on the continent. It also forms part of the BrICs countries and represents approximately 8% of the s&p emerging Market BMI Index. as investors explore other options to meet their investment objectives, there is a growing appetite for index-tracking investing in the region. today, some investors are turning to etFs, etns and unit trusts linked to indices as a less expensive way to try to achieve more consistent returns.
s&p dJI has been servicing clients in south africa for many years and has seen first-hand the growing interest in index-linked investing. Many clients have expressed their need for a wider selection of indices with investability. as such, we are well-positioned to offer greater indexing choices to the growing number of product providers and african investors.
neW LICensIng partnershIps
JaPan: the s&p Business development Company (BdC) Index has been licensed to nikko asset Management to launch a tracker fund in Japan.
korea: Following the memorandum of understanding signed in October 15, 2013, s&p dow Jones Indices signed an agreement with the korea exchange (krX) to collaborate on global marketing and sales of krX indices. the two parties will leverage s&p dJI’s proven experience in global sales and marketing to license and further promote the krX indices to overseas investors based in north america, europe and hong kong. this includes kOspI200, the premier gauge of equity market performance in south korea. the agreement also paves the way for the two parties to build a joint team for effectively developing new indices and sharing knowledge.
south aFrica: s&p dJI has licensed the s&p south africa dividend aristocrats and the s&p south africa Low Volatility Index to grindrod Bank, a registered financial services and credit provider in south africa.
Best Index provider Website 2013 etF.com (formerly Index Universe)
reCent aWards
asia’s best etF index Provider – 2013 asia asset management
this marks the third consecutive year that s&p dJI has received this award.

21
inDex rounDuP spOtLIght On neW LaUnChes
ForwarD 6- anD 12-month versions oF the s&P gsci®
ForwarD 3-, 6- anD 12-month versions oF the s&P gsci single commoDities Asset Class: CommoditiesLaunch Date: February 28, 2014
the launch of these indices signals the expansion of the commodity index family. they are designed to measure commodity markets while seeking to reduce negative roll yield in times of contango. the 6- and 12-month forward versions of the s&p gsCI measure the s&p gsCI spot, excess return, and total return indices based on the first nearby contract expiration included in the index moved 6- and 12-months forward from the present date. each s&p gsCI Forward single Capped Component index is designed to have a 32% weight in one commodity with the remaining 68% equally distributed among the other commodities. the s&p gsCI single Commodities apply capped component rules which are intended to mirror those found in section XIII, 50 of the esMa guidelines on UCIts issues from december 18, 2012.
the s&p gsCI—the first major investable commodity index—includes 24 commodities, which form 18 components. three of the 18 components (petroleum, wheat and cattle) include more than one commodity.
s&P euroPe 350® equal weight inDexAsset Class: EquitiesLaunch Date: February 12, 2014
the s&p europe 350 equal Weight Index is designed to equally measure the performance of the 350 leading, blue-chip companies that comprise the widely followed s&p europe 350. this equity index draws its constituents from 17 major european markets and intends to provide investors with a tradable and easily replicable snapshot of investable europe.
the s&p europe 350 offers investors a benchmark that contains the largest and most liquid stocks from the european markets. the 350 stocks have been selected on the basis of their size, liquidity, sector representation and country representation.
s&P euroPe 350 low volatilitY high DiviDenD inDexAsset Class: EquityLaunch Date: February 4, 2014
this innovative index, which combines two well-known investment themes (low volatility and income), was developed in response to the market’s growing demand for non-market capitalization weighted versions of the s&p europe 350. the s&p europe 350 Low Volatility high dividend Index is designed to serve as a benchmark and measures the performance of 50 high-yielding companies within the s&p europe 350 that meet diversification, volatility and tradability requirements. the index uses price volatility to eliminate typical dividend traps. historically, it has been found that high price volatility is a good indicator of companies in stress.
For more information on these new data and licensing opportunities, email us at: [email protected]
launch oF 9 new inDices covering the south aFrican equitY marketAsset Class: EquitiesLaunch Date: February 11, 2014
s&p dJI significantly expanded its presence in south africa with the launch of a new family of indices. the s&p south africa Composite (the headline index) measures the performance of companies that are actively traded and listed on the Johannesburg stock exchange (Jse). the index, which covers both foreign domiciled and domestic domiciled companies listed on the Jse with float-adjusted market values of Usd 100 million or more and annual dollar value traded of at least Usd 50 million, serves as the basis for the additional eight indices launched:
• s&p south africa dividend aristocrats
• s&p south africa Low Volatility Index
• s&p south africa Composite Capped
• s&p south africa 50
• s&p south africa 50 equal Weight Index
• s&p south africa Completion Index
• s&p south africa Composite shariah
• s&p south africa Composite shariah Capped
s&P bDc inDexAsset Class: EquityLaunch Date: February 3, 2014
the index is made up of U.s.-listed private equity firms that invest equity and debt capital in small and mid-sized businesses. this allows investors to measure a growing industry specialty within the financial sector. drawn from the s&p U.s. BMI universe, the s&p BdC Index is modified float-adjusted market cap-weighted. Modifications are made to market cap weights, if required, to reflect available float, while applying a single stock cap of 10% to mitigate over-concentration in a few components. to qualify for membership in this index, a stock must be a publicly traded company with a business development company structure, as specified in seC filings, and listed on the nyse (including nyse arca), the nyse Mkt, the nasdaQ global select Market, the nasdaQ select Market or the nasdaQ Capital Market.
s&P emerging markets Domestic DemanD inDexAsset Class: EquityLaunch Date: January 30, 2014
the index is designed to measure the performance of companies that capture a major engine of growth within the emerging markets—domestic demand. the index consists of the following: common stocks listed on the primary exchanges of emerging markets, adrs listed on U.s. exchanges, and gdrs listed on european exchanges. Constituents consist of 50 emerging market securities from the following sectors as classified according to the global Industry Classification standard (gICs®): consumer staples, consumer discretionary, telecommunication services, healthcare and utilities.

22
uPcoming events
Complimentary eventsHere’s a list of some of our upcoming global events. For up-to-date information or to register, visit our events page at www.spdji.com (under Research & Education).
Our complimentary events and webinars are designed to bring you the latest information on trends, asset allocation strategies, indexing ideas and issues impacting today’s index universe. CE credits are offered for many events.
here’s a sampling of what’s available:
WHY PROVIDING StEADY INCOME REQUIRES ALtERNAtIVES Recorded: March 20, 2014As uncertainty continues over rising interest rates while low yields linger, financial advisors face an uphill battle juggling options for steady income. This webinar casts the spotlight on an array of indexed income alternatives such as senior bank loans, MLPs and high-quality equity dividends that have the potential to shine as income generators.
tHE VIx® FACtOR: ARE YOU READY tO tAkE VOLAtILItY BY tHE HORNS IN 2014? Recorded: February 20, 2014In 2013, the S&P 500® provided strong returns and volatility remained low. If market conditions change and volatility increases, how can financial advisors help their clients achieve their objectives in 2014?
COMMODItIES & INFRAStRUCtURE BOOM IN tHE NEW HOttESt PLACE ON EARtH Recorded October 10, 2013Energy technology is altering the face of the industry, opening up new opportunities across the spectrum from exploration to producers to infrastructure. This webinar looks at index-based strategies and approaches for taking advantage of the North American energy boom.
event recaP: Financial advisor Forum in Dallas
On February 12, s&p dJI kicked off its 2014 series of educational forums in dallas, texas. held in select cities across the U.s., “these forums —tailored exclusively for financial advisors—allow attendees to actively participate in the discussions and chat one-on-one with guest speakers. February’s event, Discovering New Ways to Improve Portfolio Construction focused on the potential applications for factor-based and alternatively-weighted approaches, multi-asset income strategies and their 2014 outlook.
as keynote speaker, sam stovall, Chief equity strategist at s&p Capital IQ, used his witty humor to share his outlook for 2014. sam used his assessment of the stock market’s history and its technical trends to explain his perspective.
sam’s speech was followed by three panel discussions: Factor-based approaches, a Multi-Cap Look at U.s. equities and Multi-asset Income. a short discussion on s&p dJI’s custom indices rounded out the event. panel speakers came from a broad spectrum of well-regarded firms such as Cougar global Investments, Invesco powershares, Lunt Capital Management, Merrill Lynch Wealth Management, Morningstar, revenueshares, state street global advisors, to name a few.
here’s what some of the attendees had to say following the event:
“ thoughtful yet powerful presentations from very credible speakers.”
“ I drove 250 miles for the meeting and the time was well spent—look forward to future gatherings.”
“ sam stovall’s presentation was useful—especially January barometer strategy.”
save the Date!
tHOUGHt LEADERSHIP SEMINAR Making the Most of Market Volatility in Directional Markets May 8 | hOng kOng, ChIna
FINANCIAL ADVISOR FORUM topics include: Factor-Based Indexing, etFs and etF strategies in retirement accountsMay 14 | BOstOn, Ma
FIxED INCOME SEMINARJUne 19 | aUstraLIa
Missed any of our previous webinars? View our webinars on-demand at www.spdji.com

23
no. 1 on inDexologY® Dispersion and correlation: which is “better?”By CraIg LaZZara, gLOBaL head OF IndeX InVestMent strategy,
s&p dJI
We recently introduced the concept of dispersion, which measures the average difference between the return of an index and the return of each of the index’s components. In times of high dispersion, the gap between the best performers and the worst performers is relatively wide; when dispersion is low, the performance gap narrows. today’s dispersion levels are quite low by historical standards, which implies that:
• the degree to which the average skillful (or lucky) manager should be expected to exceed index returns is below average, and
• the degree to which the average unskilled (or unlucky) manager should be expected to lag index returns is also below average.
One consequence of low dispersion, in other words, is that the gap between…
Read more at www.indexologyblog.com >>
From our blogs
Our top Blog posts this Quarter* Our blogs are forums for sharing ideas on a range of relevant indexing topics and investment themes.
no. 1 on housingviews® why bubbles aren’t as Dangerous todayBy daVId BLItZer, ChaIrMan OF the IndeX COMMIttee, s&p dJI
Both the surprisingly strong 2013 Us stock market performance and the surging rebound in Us home prices are sparking fears of another round of bursting bubbles among many investors and market pundits. While we don’t know the chances that either stocks or home prices will plunge in 2014, the collateral damage from either will be less than it was in 2008 because the underlying leverage in the economy is substantially smaller today than it was back then.
the financial crisis was a two-step (or double dive) event. First home prices collapsed, wiping out about a third of the value of american homes. second, a lot of the mortgage debt collateralized by those homes failed creating a cascade of defaults, foreclosures and worse. the higher the loan to value ratio on a home with a mortgage, the smaller the price drop needed to put the mortgage under water. the chart shows the loan to value ratio for all owner-occupied housing in the United states, including homes owned…
For more, visit www.housingviews.com >>
*Top blog posts are as of March 24, 2014.
blog with us!
CONNECt WItH US:
www.spdji.com/registration

www.spdji.com | www.djindexes.com© s&p dow Jones Indices LLC, a part of Mcgraw hill Financial 2014. all rights reserved. standard & poor’s, and s&p are registered trademarks of standard & poor’s Financial services LLC (“s&p”), a part of Mcgraw hill Financial. dow Jones is a registered trademark of dow Jones trademark holdings LLC (“dow Jones”). trademarks have been licensed to s&p dow Jones Indices LLC.
redistribution, reproduction and/or photocopying in whole or in part are prohibited without written permission. this document does not constitute an offer of services in jurisdictions where s&p dow Jones Indices LLC, dow Jones, s&p or their respective affiliates (collectively “s&p dow Jones Indices”) do not have the necessary licenses. all information provided by s&p dow Jones Indices is impersonal and not tailored to the needs of any person, entity or group of persons. s&p dow Jones Indices receives compensation in connection with licensing its indices to third parties. past performance of an index is not a guarantee of future results.
It is not possible to invest directly in an index. exposure to an asset class represented by an index is available through investable instruments based on that index. s&p dow Jones Indices does not sponsor, endorse, sell, promote or manage any investment fund or other investment vehicle that is offered by third parties and that seeks to provide an investment return based on the performance of any index. s&p dow Jones Indices makes no assurance that investment products based on the index will accurately track index performance or provide positive investment returns. s&p dow Jones Indices LLC is not an investment advisor, and s&p dow Jones Indices makes no representation regarding the advisability of investing in any such investment fund or other investment vehicle. a decision to invest in any such investment fund or other investment vehicle should not be made in reliance on any of the statements set forth in this document. prospective investors are advised to make an investment in any such fund or other vehicle only after carefully considering the risks associated with investing in such funds, as detailed in an offering memorandum or similar document that is prepared by or on behalf of the issuer of the investment fund or other vehicle. Inclusion of a security within an index is not a recommendation by s&p dow Jones Indices to buy, sell, or hold such security, nor is it considered to be investment advice.
these materials have been prepared solely for informational purposes based upon information generally available to the public from sources believed to be reliable. no content contained in these materials (including index data, ratings, credit-related analyses and data, model, software or other application or output therefrom) or any part thereof (Content) may be modified, reverse-engineered, reproduced or distributed in any form by any means, or stored in a database or retrieval system, without the prior written permission of s&p dow Jones Indices. the Content shall not be used for any unlawful or unauthorized purposes. s&p dow Jones Indices and its third-party data providers and licensors (collectively “s&p dow Jones Indices parties”) do not guarantee the accuracy, completeness, timeliness or availability of the Content. s&p dow Jones Indices parties are not respon-sible for any errors or omissions, regardless of the cause, for the results obtained from the use of the Content. the COntent Is prOVIded On an “as Is” BasIs. s&p dOW JOnes IndICes partIes dIsCLaIM any and aLL eXpress Or IMpLIed WarrantIes, InCLUdIng, BUt nOt LIMIted tO, any WarrantIes OF MerChantaBILIty Or FItness FOr a partICULar pUrpOse Or Use, FreedOM FrOM BUgs, sOFtWare errOrs Or deFeCts, that the COntent’s FUnCtIOnIng WILL Be UnInterrUpted Or that the COntent WILL Operate WIth any sOFtWare Or hardWare COnFIgUratIOn. In no event shall s&p dow Jones Indices parties be liable to any party for any direct, indirect, incidental, exemplary, compensatory, punitive, special or consequential damages, costs, expenses, legal fees, or losses (including, without limitation, lost income or lost profits and opportunity costs) in connection with any use of the Content even if advised of the possibility of such damages.
s&p dow Jones Indices keeps certain activities of its business units separate from each other in order to preserve the independence and objectivity of their respective activities. as a result, certain business units of s&p dow Jones Indices may have information that is not available to other business units. s&p dow Jones Indices has established policies and procedures to maintain the confidentiality of certain non-public information received in connection with each analytical process.
In addition, s&p dow Jones Indices provides a wide range of services to, or relating to, many organizations, including issuers of securities, investment advisers, broker-dealers, investment banks, other financial institutions and financial intermediaries, and accordingly may receive fees or other economic benefits from those organizations, including organizations whose securities or services they may recommend, rate, include in model portfo-lios, evaluate or otherwise address.
Performance Disclosurepast performance is not an indication of future results. prospective application of the methodology used to construct the Index may not result in performance commensurate with the back-test returns shown. the back- test period does not necessarily correspond to the entire available history of the Index. please refer to the methodology paper for the Index, available at www.spdji.com for more details about the index, including the manner in which it is rebalanced, the timing of such rebalancing, criteria for additions and deletions, as well as all index calculations. It is not possible to invest directly in an Index.
another limitation of back-tested hypothetical information is that generally the back-tested calculation is prepared with the benefit of hindsight. Back-tested data reflect the application of the index methodology and selection of index constituents in hindsight. no hypothetical record can completely account for the impact of financial risk in actual trading. For example, there are numerous factors related to the equities (or fixed income, or commodities) markets in general which cannot be, and have not been accounted for in the preparation of the index information set forth, all of which can affect actual performance.
the index returns shown do not represent the results of actual trading of investor assets. standard & poor’s maintains the indices and calculates the index levels and performance shown or discussed, but does not manage actual assets. Index returns do not reflect payment of any sales charges or fees an investor would pay to purchase the securities they represent. the imposition of these fees and charges would cause actual and back-tested performance to be lower than the performance shown. In a simple example, if an index returned 10% on a Us $100,000 investment for a 12-month period (or Us$ 10,000) and an actual asset-based fee of 1.5% were imposed at the end of the period on the investment plus accrued interest (or Us$ 1,650), the net return would be 8.35% (or Us$ 8,350) for the year. Over 3 years, an annual 1.5% fee taken at year end with an assumed 10% return per year would result in a cumulative gross return of 33.10%, a total fee of Us$ 5,375, and a cumulative net return of 27.2% (or Us$ 27,200).
s&p dow Jones Indices defines various dates to assist our clients in providing transparency on their products. the First Value date is the first day for which there is a calculated value (either live or back-tested) for a given index. the Base date is the date at which the Index is set at a fixed value for calculation purposes. the Launch date designates the date upon which the values of an index are first considered live; index values provided for any date or time period prior to the index’s Launch date are considered back-tested. s&p dow Jones Indices defines the Launch date as the date by which the values of an index are known to have been released to the public, for example via the company’s public Web site or its datafeed to external parties. For dow Jones-branded indices introduced prior to May 31, 2013, the Launch date (which prior to May 31, 2013, was termed “date of Introduc-tion”) is set at a date upon which no further changes were permitted to be made to the index methodology, but that may have been prior to the Index’s public release date.
InsIghts staffcarol [email protected]
emily [email protected]
theresa [email protected]
Paul [email protected]
andrea [email protected]