inspire 2015 - rentrak: automate to innovate 1000x faster
TRANSCRIPT
#inspire15
Automate to Innovate 1000x FasterDelivering Solutions in 30 Seconds or Less
Tuesday, May 19, 2015
Shaye Eller, Director of Analytical Solutions, Rentrak
#inspire15
AGENDA
• Rentrak Overview (5 mins)• Case Study: Producing Sample Data for County
Ratings (5 mins)• Evolution of the Solution (20 mins)• Gaining Support from Stakeholders (5 mins)• Q&A (10 mins)

#inspire15
Rentrak OverviewGranularity, Measurement Stability, and Advanced Targeting Capabilities
#inspire15
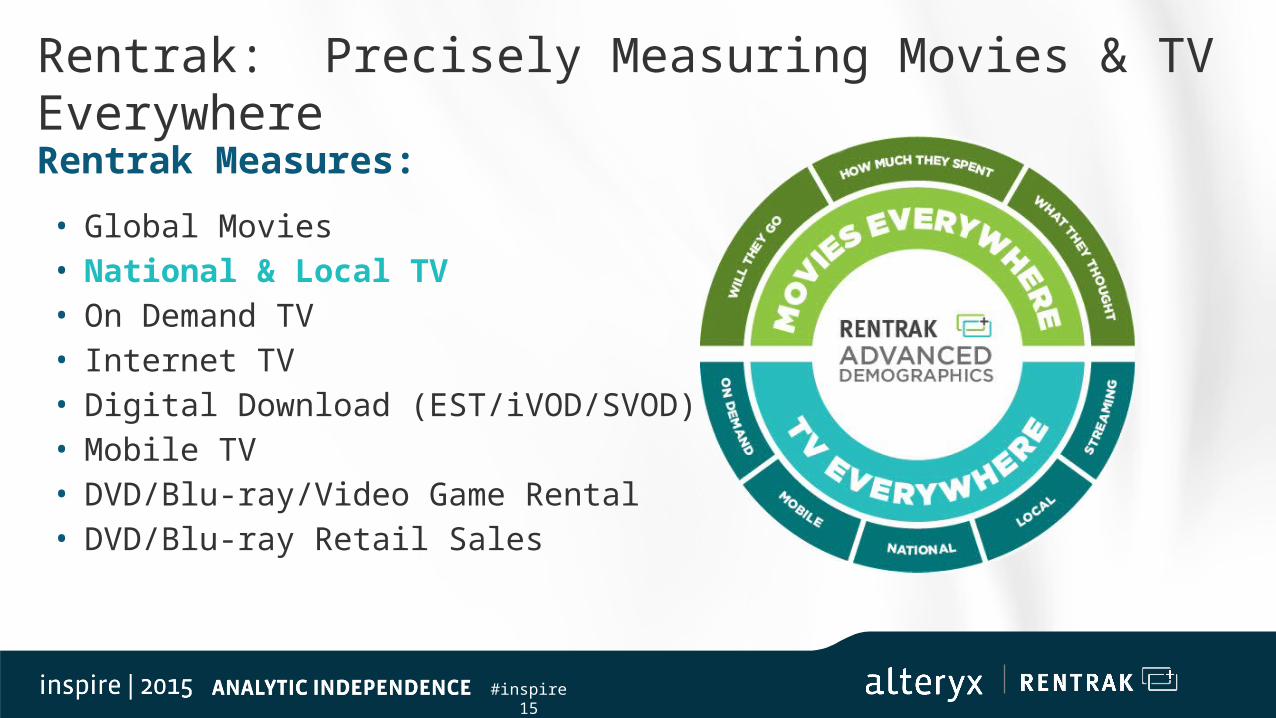
Rentrak Measures:
• Global Movies• National & Local TV• On Demand TV• Internet TV• Digital Download (EST/iVOD/SVOD)• Mobile TV• DVD/Blu-ray/Video Game Rental• DVD/Blu-ray Retail Sales
Rentrak: Precisely Measuring Movies & TV Everywhere
#inspire15
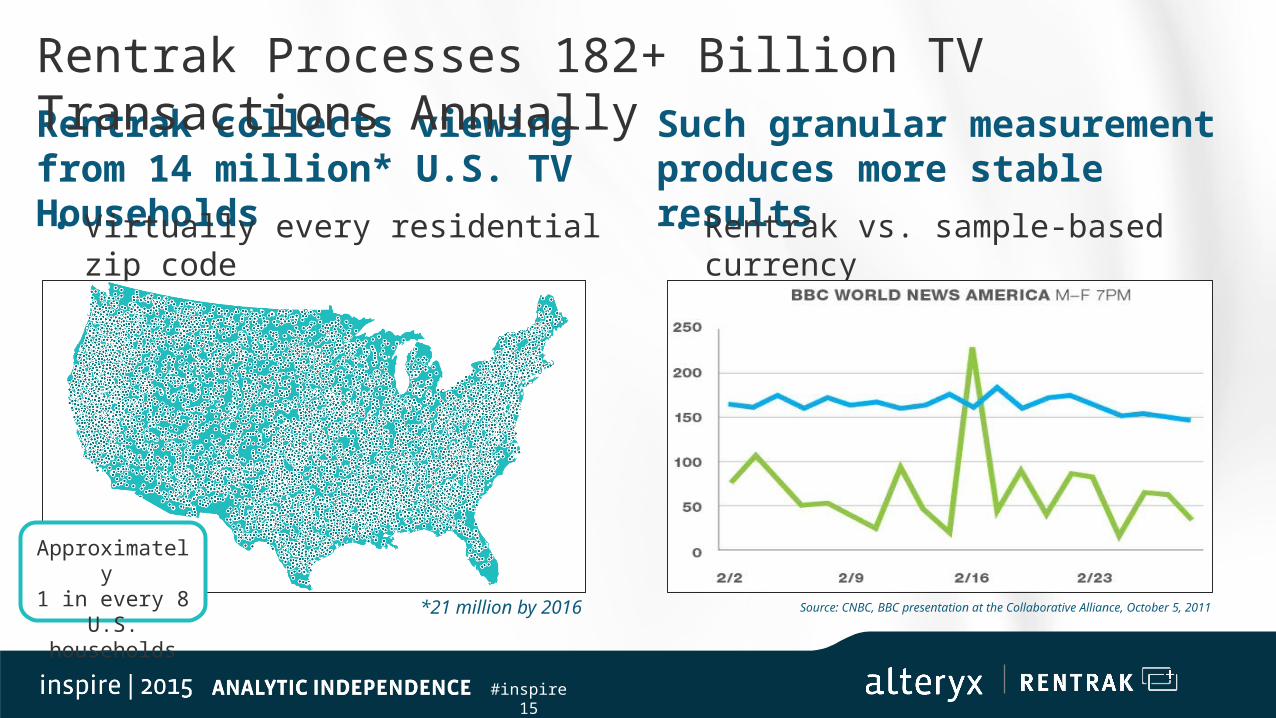
Rentrak collects viewing from 14 million* U.S. TV Households• Virtually every residential zip
code
Rentrak Processes 182+ Billion TV Transactions Annually Such granular
measurement produces more stable results• Rentrak vs. sample-based
currency
Source: CNBC, BBC presentation at the Collaborative Alliance, October 5, 2011*21 million by 2016
Approximately 1 in every 8
U.S. households
#inspire15
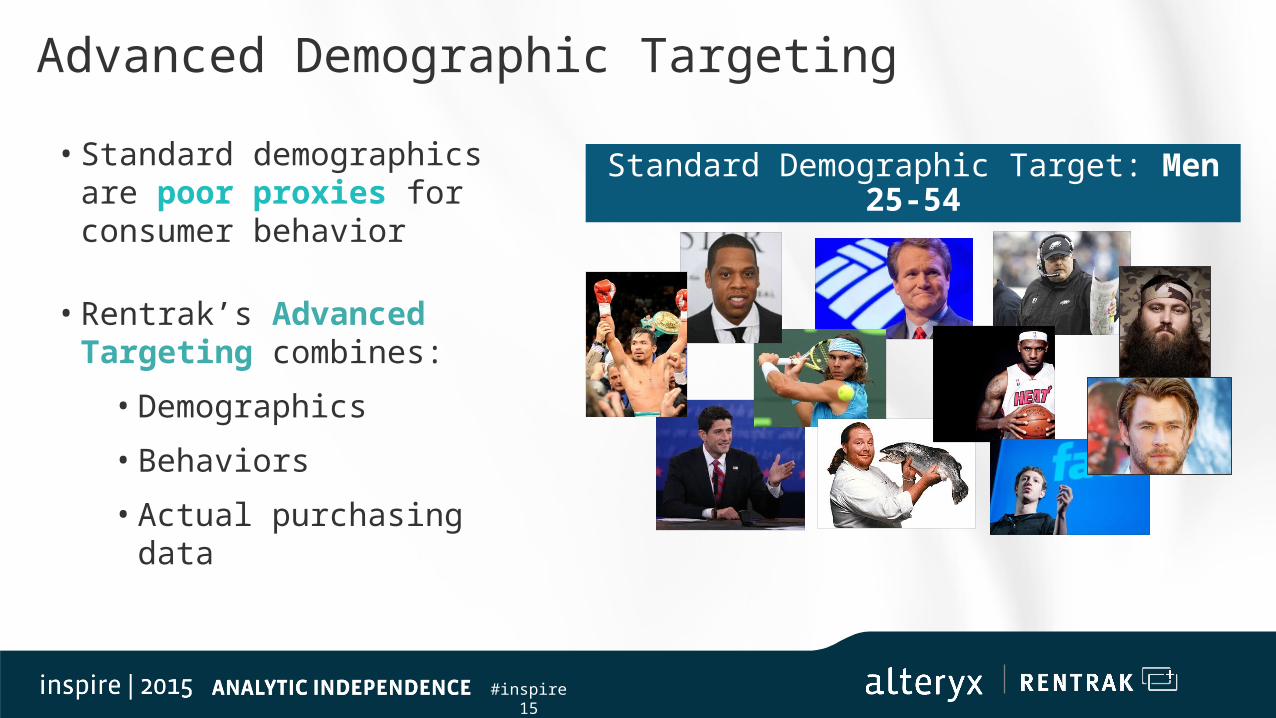
• Standard demographics are poor proxies for consumer behavior
• Rentrak’s Advanced Targeting combines:
• Demographics
• Behaviors
• Actual purchasing data
Advanced Demographic Targeting
Standard Demographic Target: Men 25-54
#inspire15
Advanced Demographics Data Provider Partners
Partial List

#inspire15
Women 35-64?
If you’re selling cat food, would you rather target… People who own cats!
- OR
-
#inspire15
Case Study: Producing Sample Data for County Ratings
#inspire15
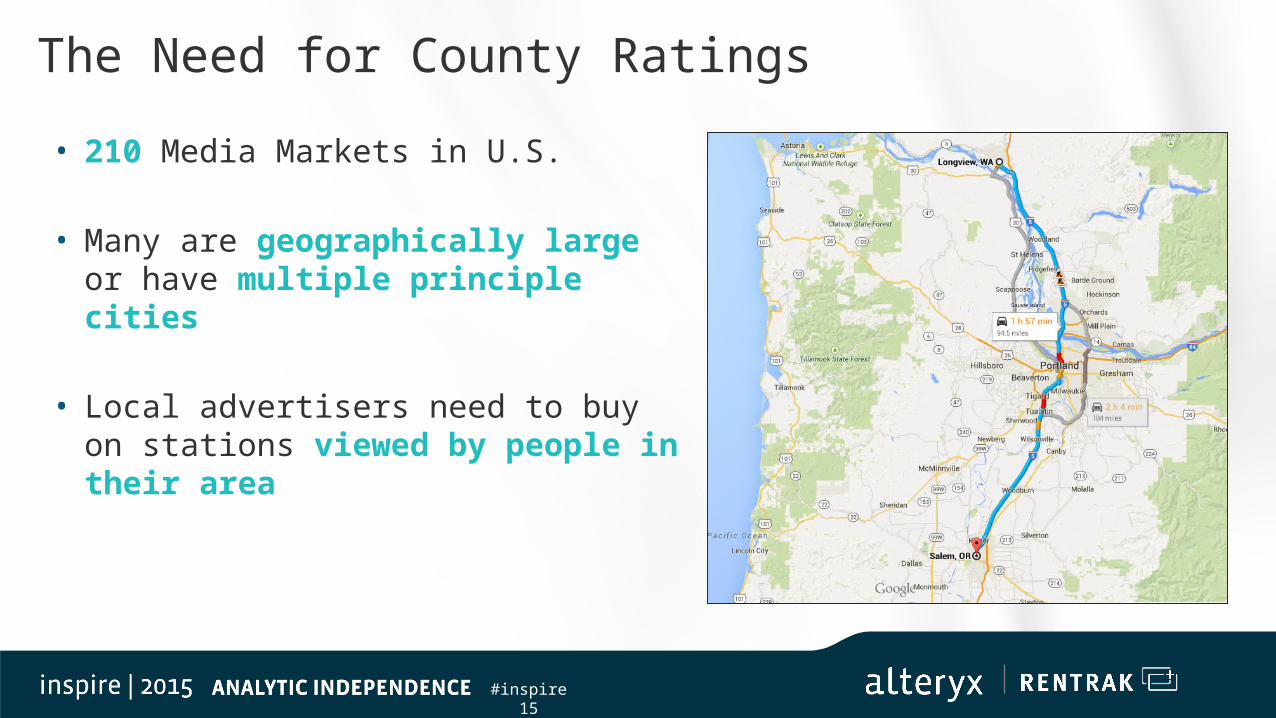
• 210 Media Markets in U.S.
• Many are geographically large or have multiple principle cities
• Local advertisers need to buy on stations viewed by people in their area
The Need for County Ratings
#inspire15
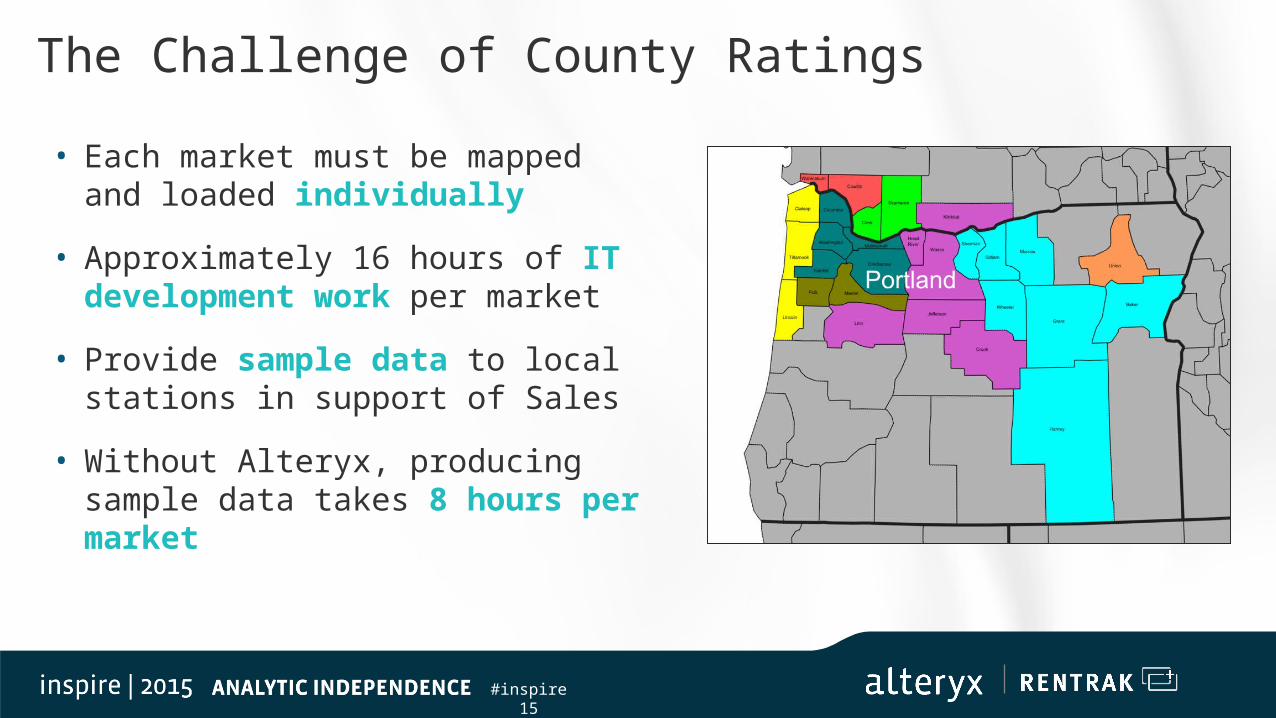
The Challenge of County Ratings
• Each market must be mapped and loaded individually
• Approximately 16 hours of IT development work per market
• Provide sample data to local stations in support of Sales
• Without Alteryx, producing sample data takes 8 hours per market
#inspire15
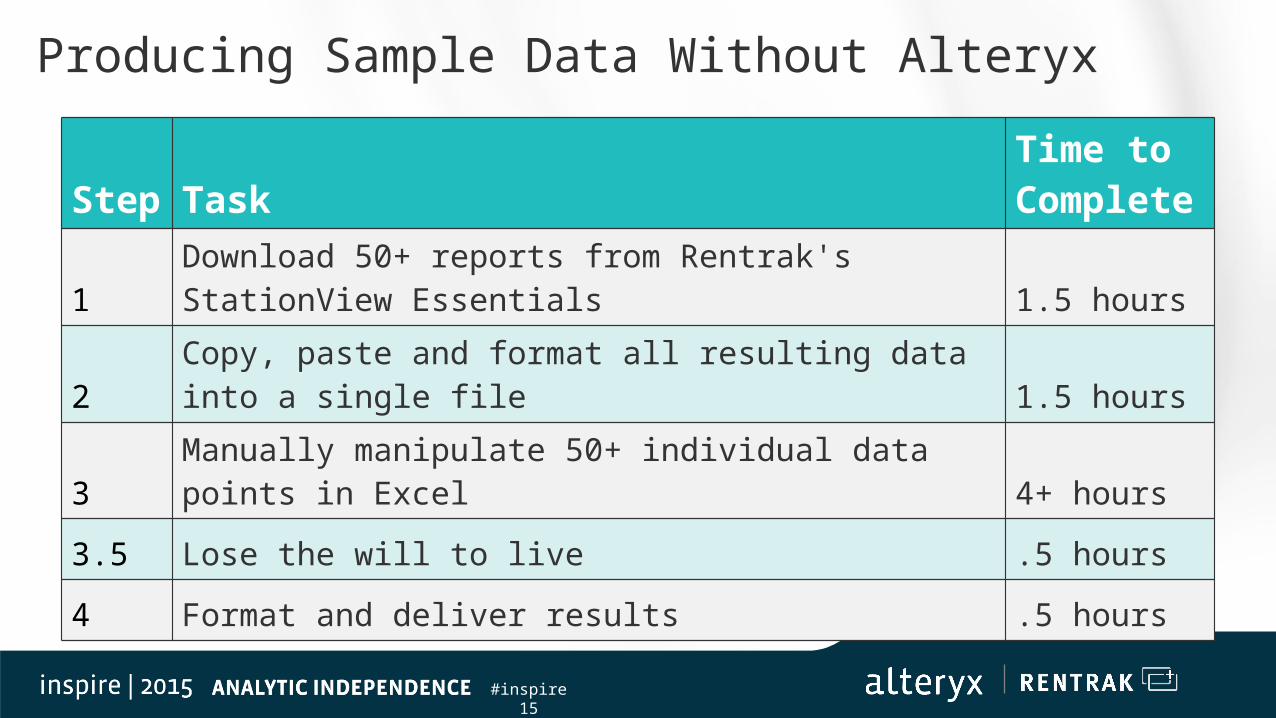
Producing Sample Data Without Alteryx
Step Task
Time to Complete
1Download 50+ reports from Rentrak's StationView Essentials 1.5 hours
2Copy, paste and format all resulting data into a single file 1.5 hours
3Manually manipulate 50+ individual data points in Excel 4+ hours
3.5 Lose the will to live .5 hours
4 Format and deliver results .5 hours
#inspire15
Evolution of the Solution
#inspire15
Phase One:Creating an Alteryx workflow to produce results
Reduces completion time to ~2 hours
#inspire15
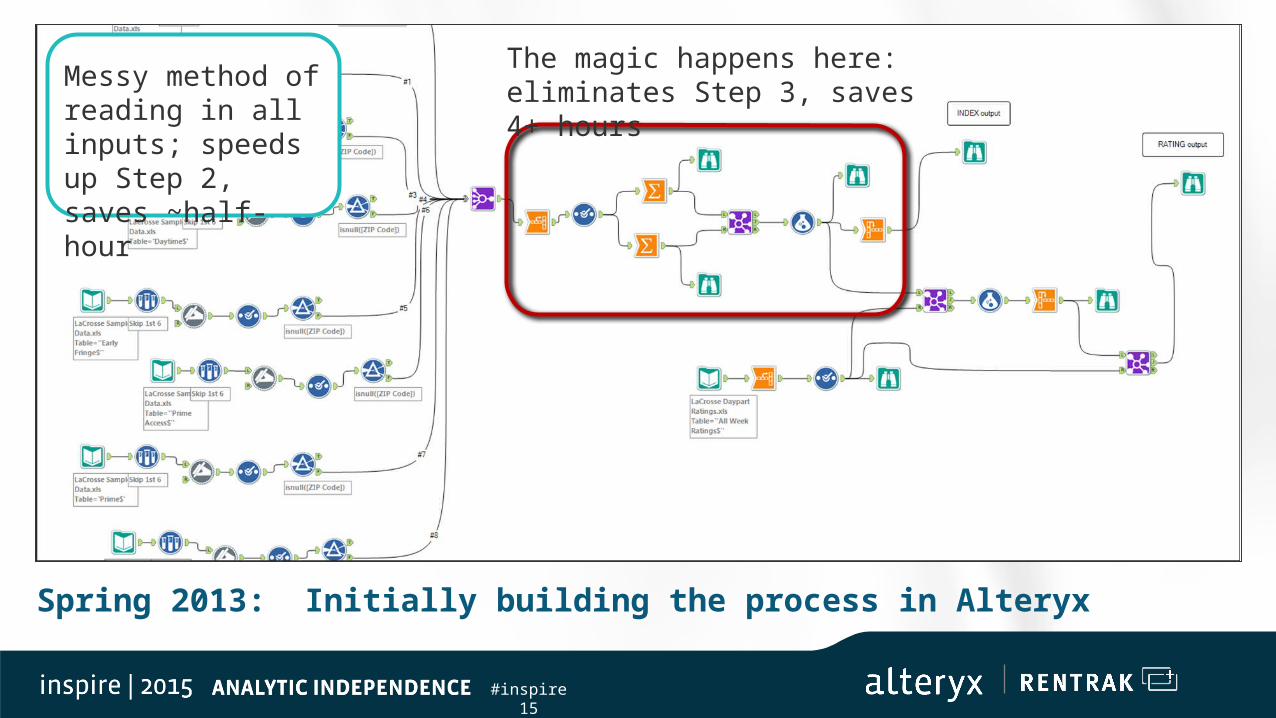
Spring 2013: Initially building the process in Alteryx
Messy method of reading in all inputs; speeds up Step 2, saves ~half-hour
The magic happens here: eliminates Step 3, saves 4 hours
Messy method of reading in all inputs; speeds up Step 2, saves ~half-hour
The magic happens here: eliminates Step 3, saves 4+ hours
#inspire15
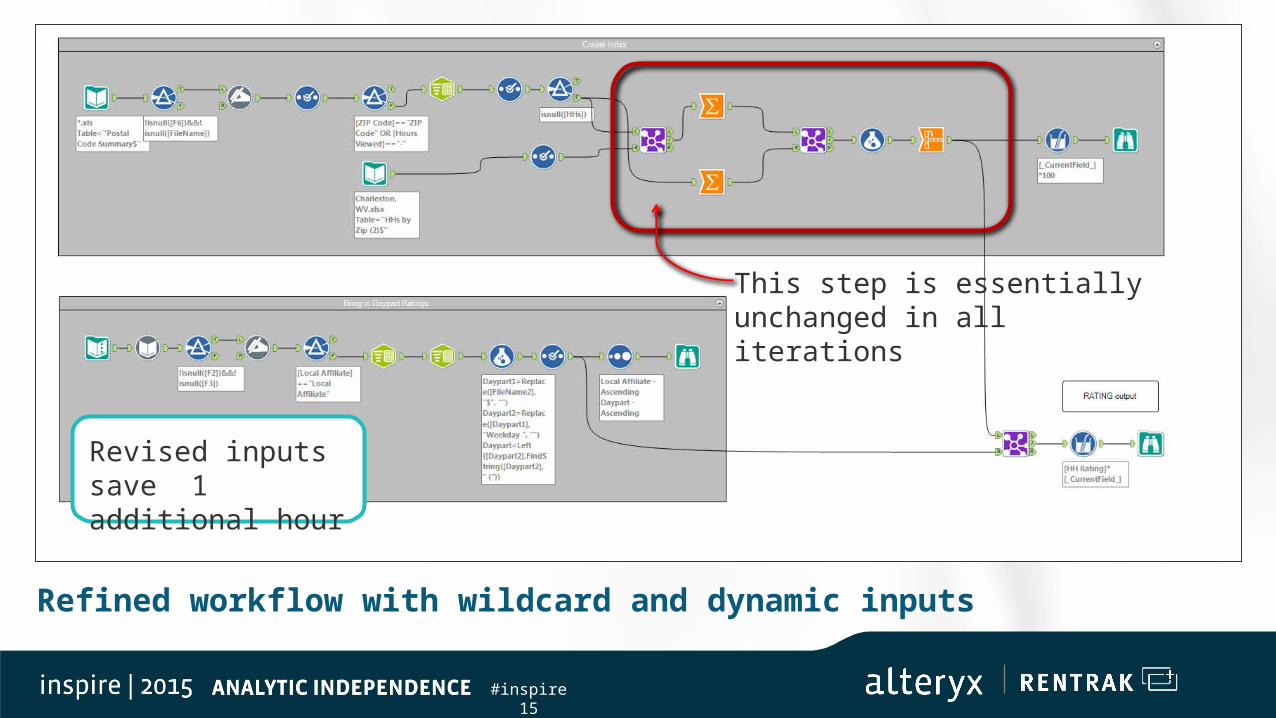
Refined workflow with wildcard and dynamic inputs
Messy method of reading in all inputs; speeds up Step 2, saves ~1 hour
The magic happens here: eliminates Step 3, saves 4 hours
This step is essentially unchanged in all iterations
Revised inputs save 1 additional hour
#inspire15
Phase Two:Leveraging direct database connections
Reduces completion time to 10-20 minutes
#inspire15
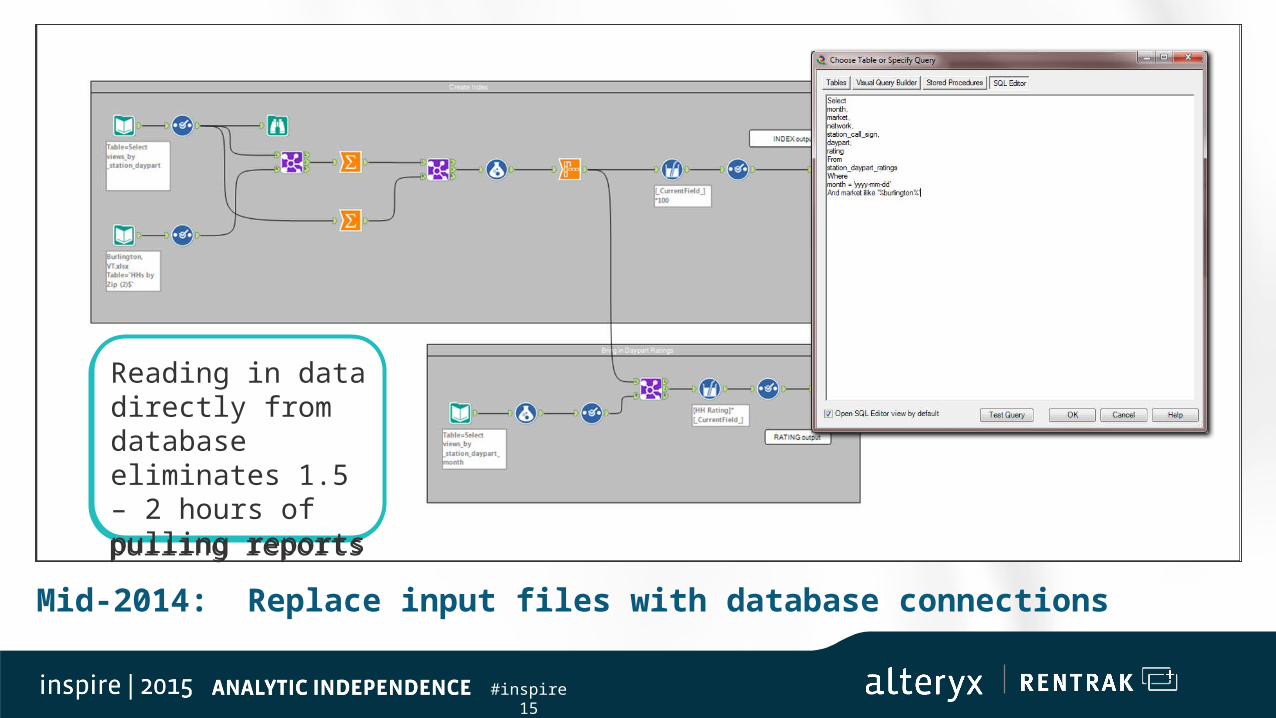
Mid-2014: Replace input files with database connections
Messy method of reading in all inputs; speeds up Step 2, saves ~1 hour
The magic happens here: eliminates Step 3, saves 4 hours
This step is essentially unchanged from previous iteration
Reading in data directly from database eliminates 1.5 – 2 hours of pulling reports
Reading in data directly from database eliminates 1.5 – 2 hours of pulling reports
#inspire15
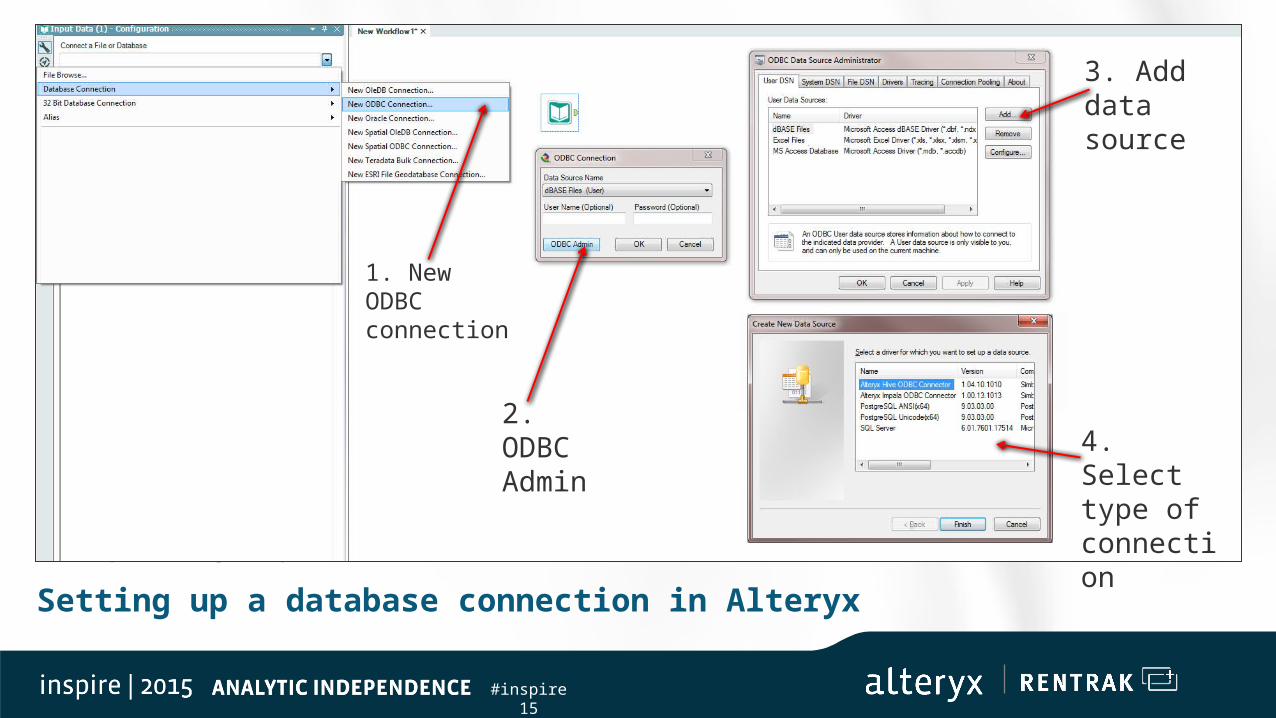
Setting up a database connection in Alteryx
Messy method of reading in all inputs; speeds up Step 2, saves ~1 hour
The magic happens here: eliminates Step 3, saves 4 hours
This step is essentially unchanged from previous iteration
Refined inputs save additional half-hour
Reading in data directly from database eliminates 1.5 – 2 hours of pulling reports
1. New ODBC connection
2. ODBC Admin
3. Add data source
4. Select type of connection
#inspire15
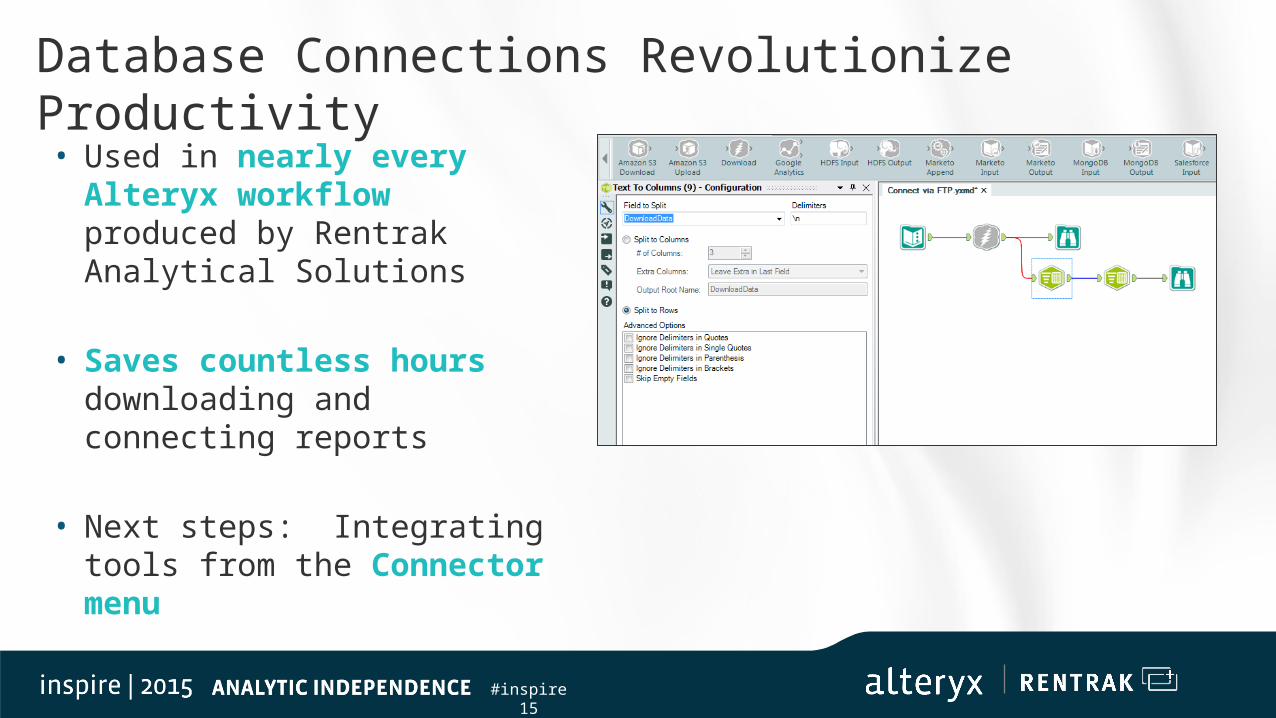
Database Connections Revolutionize Productivity
• Used in nearly every Alteryx workflow produced by Rentrak Analytical Solutions
• Saves countless hours downloading and connecting reports
• Next steps: Integrating tools from the Connector menu
#inspire15
Phase Three:Building an analytic app
Reduces completion time to 30 seconds or less
#inspire15
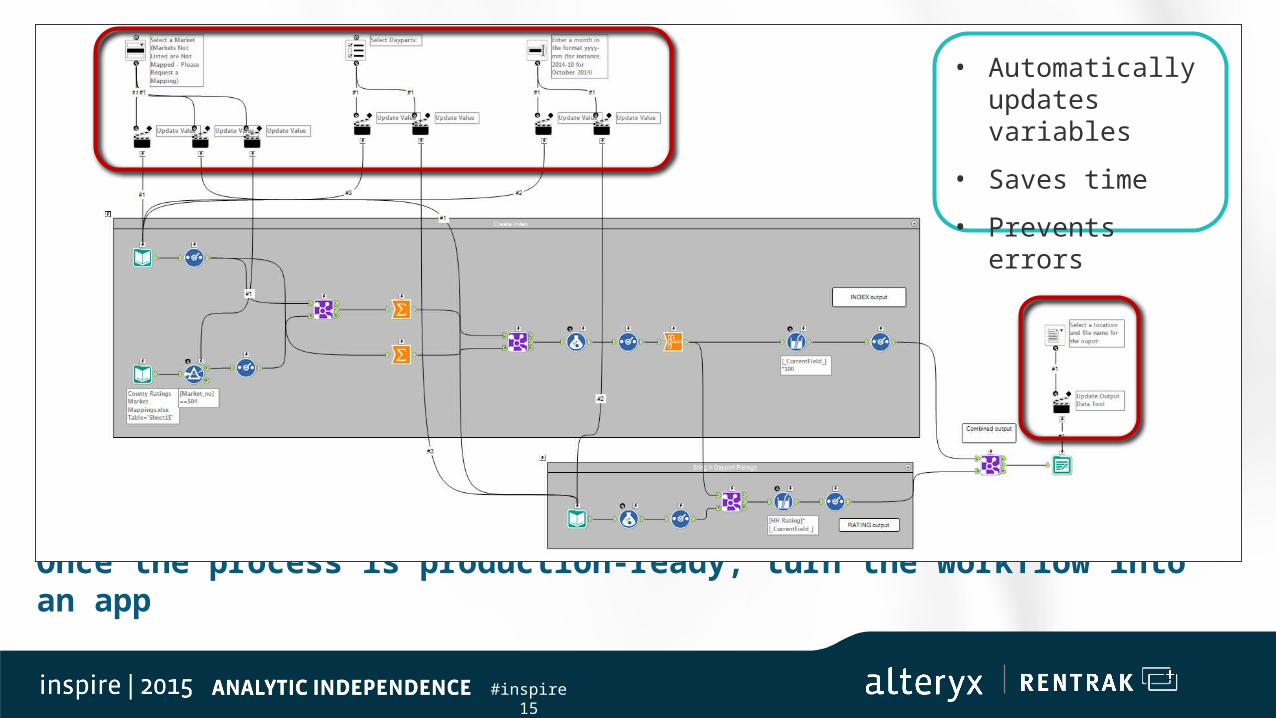
Once the process is production-ready, turn the workflow into an app
Messy method of reading in all inputs; speeds up Step 2, saves ~1 hour
The magic happens here: eliminates Step 3, saves 4 hours
This step is essentially unchanged from previous iteration
Refined inputs save additional half-hour
• Automatically updates variables
• Saves time
• Prevents errors
#inspire15
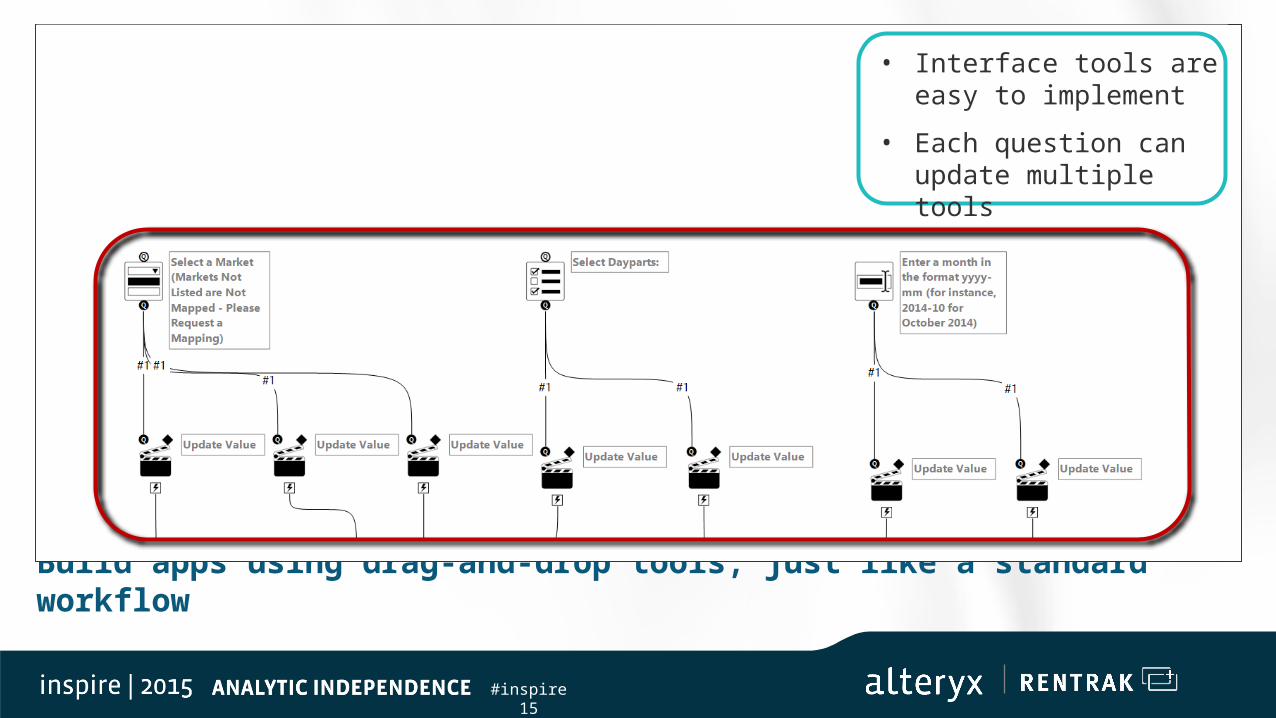
Build apps using drag-and-drop tools, just like a standard workflow
Messy method of reading in all inputs; speeds up Step 2, saves ~1 hour
The magic happens here: eliminates Step 3, saves 4 hours
This step is essentially unchanged from previous iteration
Refined inputs save additional half-hour
• Interface tools are easy to implement
• Each question can update multiple tools
#inspire15
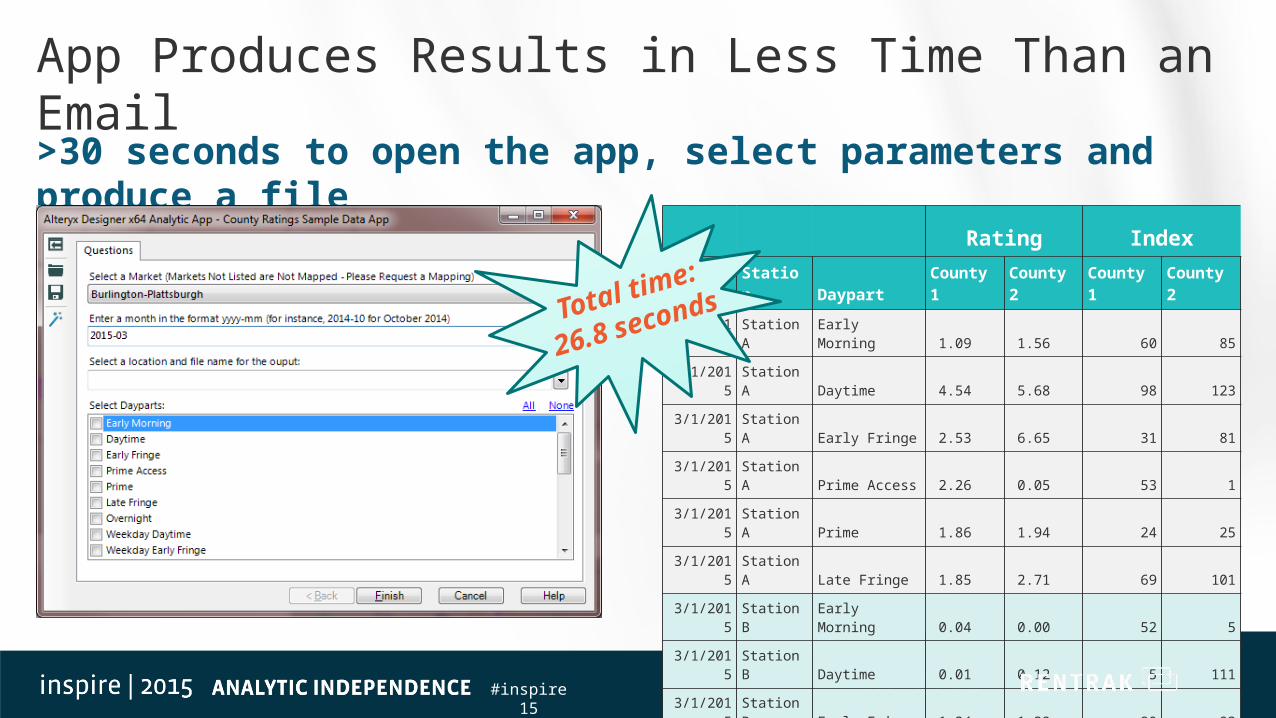
>30 seconds to open the app, select parameters and produce a file
App Produces Results in Less Time Than an Email
Rating Index
Month Station DaypartCounty 1
County 2
County 1
County 2
3/1/2015 Station A Early Morning 1.09
1.56 60 85
3/1/2015 Station A Daytime 4.54
5.68 98 123
3/1/2015 Station A Early Fringe 2.53
6.65 31 81
3/1/2015 Station A Prime Access 2.26
0.05 53 1
3/1/2015 Station A Prime 1.86
1.94 24 25
3/1/2015 Station A Late Fringe 1.85
2.71 69 101
3/1/2015 Station B Early Morning 0.04
0.00 52 5
3/1/2015 Station B Daytime 0.01
0.12 5 111
3/1/2015 Station B Early Fringe 1.34
1.39 90 93
3/1/2015 Station B Prime Access 0.78
0.53 79 53
3/1/2015 Station B Prime 0.29
0.03 39 3
3/1/2015 Station B Late Fringe 0.34
0.13 110 41
Total time:
26.8
seconds
#inspire15
Phase Four:Future enhancements
Put tools directly into the hands of stakeholders
#inspire15
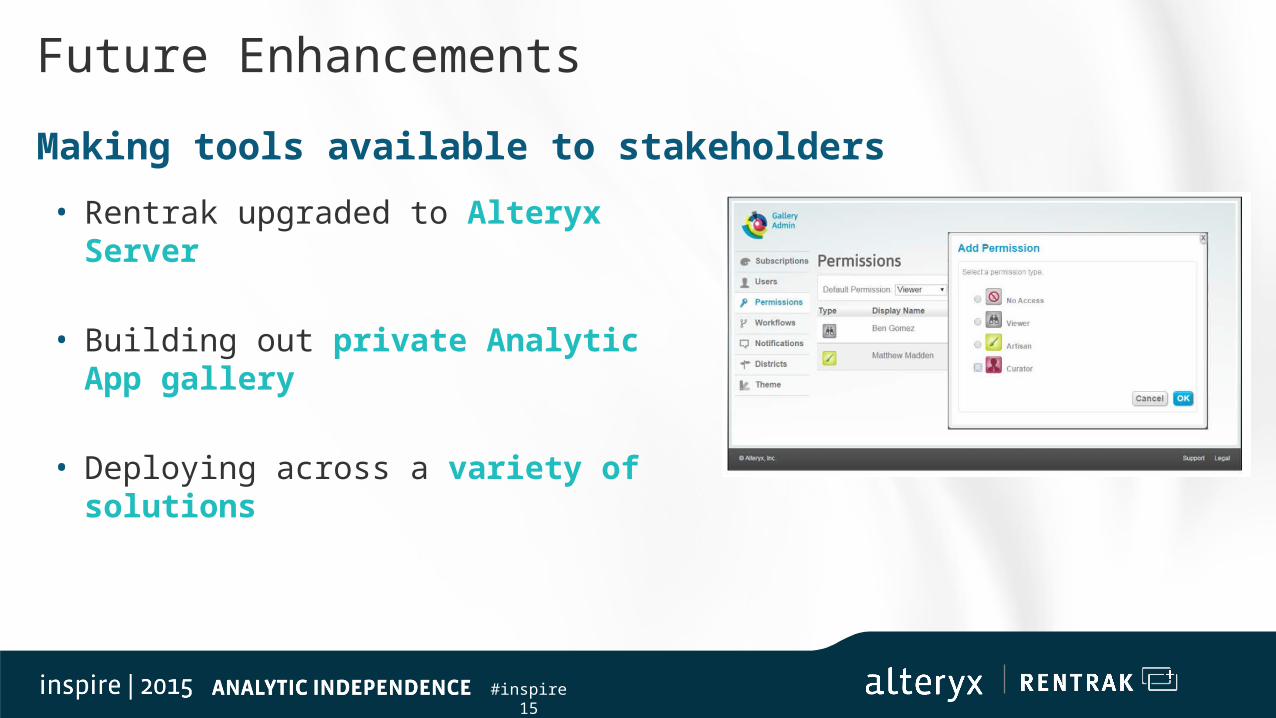
Making tools available to stakeholders
• Rentrak upgraded to Alteryx Server
• Building out private Analytic App gallery
• Deploying across a variety of solutions
Future Enhancements
#inspire15
Gaining Support From Stakeholders
#inspire15
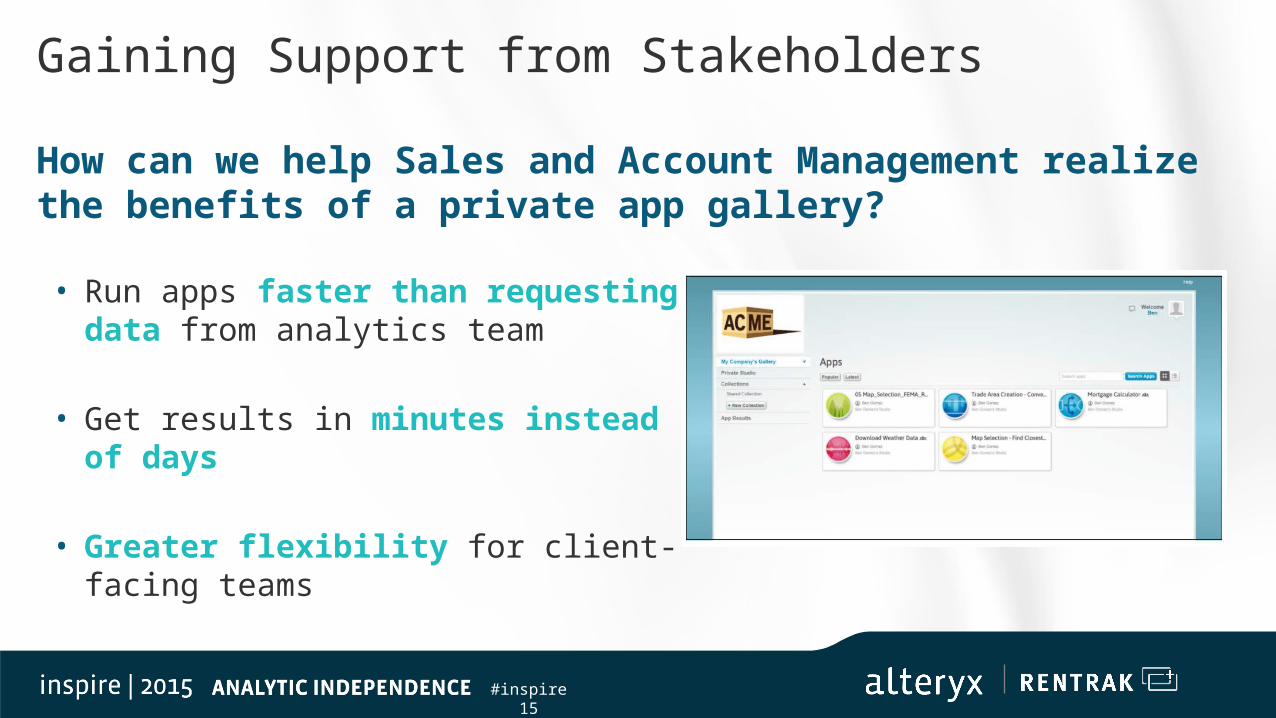
How can we help Sales and Account Management realize the benefits of a private app gallery?
• Run apps faster than requesting data from analytics team
• Get results in minutes instead of days
• Greater flexibility for client-facing teams
Gaining Support from Stakeholders
#inspire15
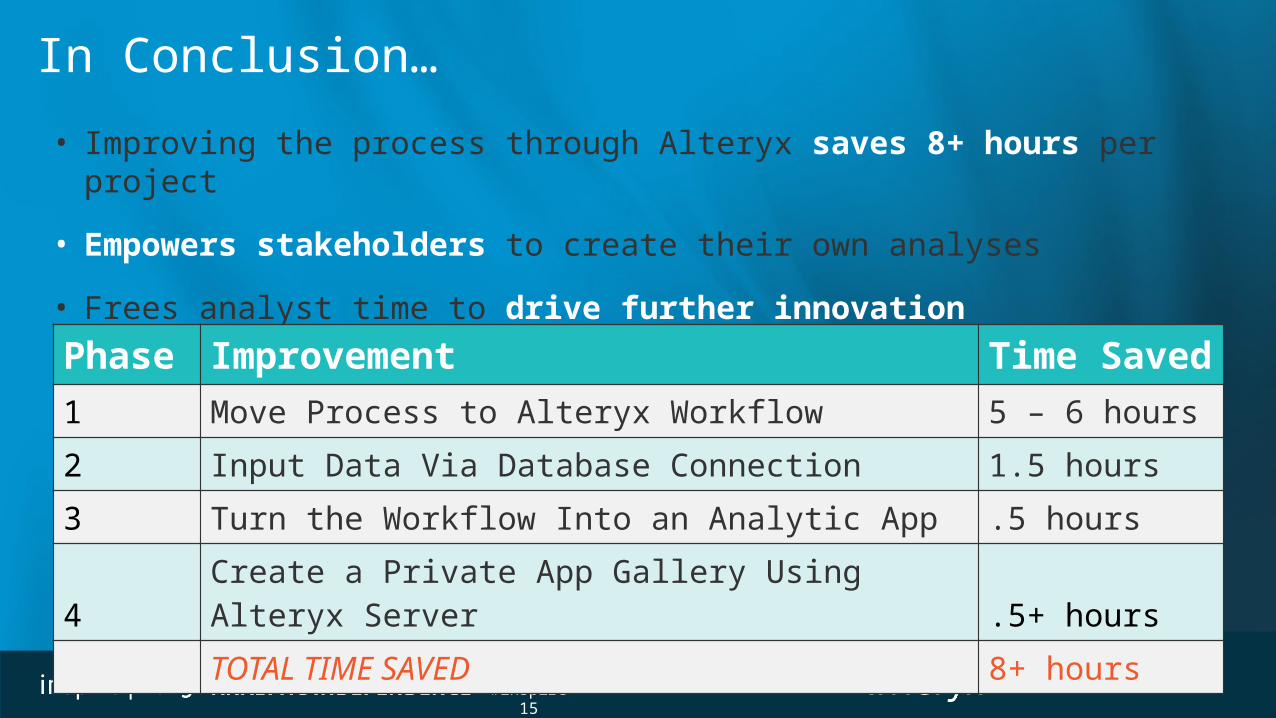
In Conclusion…
• Improving the process through Alteryx saves 8+ hours per project
• Empowers stakeholders to create their own analyses
• Frees analyst time to drive further innovation
Phase ImprovementTime Saved
1 Move Process to Alteryx Workflow 5 – 6 hours
2 Input Data Via Database Connection 1.5 hours
3 Turn the Workflow Into an Analytic App .5 hours
4Create a Private App Gallery Using Alteryx Server .5+ hours
TOTAL TIME SAVED 8+ hours
THANK YOU!
#inspire15