inspired by - s21.q4cdn.com · pdf file10 inspired by our employees ... our 8,100-plus...
TRANSCRIPT

YOU Inspired by
2017 Integrated Annual Report

TABLE OF CONTENTS
2 CEO Letter 6 Inspired by Our Consumers 8 Inspired by Our Communities10 Inspired by Our Employees12 Innovating on Innovation18 2020 Strategy36 2017 Scorecard42 Recognitions46 Financial Statements54 Corporate Governance57 Corporate Responsibility Priorities58 About This Report59 GRI and UNGC Indices69 Stockholder Information
Whether you're a Clorox employee, consumer or live in a community where we operate, we've grown our business for more than 100 years by working to understand how
to make your everyday life better, every day.
YOURneeds. aspirations. life.
YOUinspire our imagination.drive our innovation.fuel our growth.
1

FELLOW STAKEHOLDERS:
I believe that every company should remember their source of inspiration — what makes them tick, what sparks their creativity and what motivates them to make a difference. At Clorox, we’re continually focused on understanding the evolving needs and expectations of you, our stakeholders, because you serve as our source of inspiration in our mission to make everyday life better, every day. Benno DorerChairman and Chief Executive Officer
2 The Clorox Company 2017 Integrated Annual Report G4-1, G4-15, G4-DMA, G4-EC2, G4-LA10G4-1, G4-15, G4-DMA, G4-EC2, G4-LA10

FELLOW STAKEHOLDERS:
You — our consumers — inspire the imagination, hard work and passion that go into the superior experiences of our leading brands.
In fiscal year 2017, consumers were front and center of our 2020 Strategy. We continued our relentless focus on delivering products and brands that offer superior value through strong investments in our demand creation programs, including product innovation across our portfolio. Among many examples, we introduced Clorox® Scentiva® wipes and sprays, using fragrance to deliver a more delightful cleaning experience; we launched the Brita® Stream™ pitcher in response to millennials telling us they wanted a pitcher that filtered on demand; we launched Clorox Healthcare® Fuzion® cleaner disinfectant in healthcare settings to kill life-threatening pathogens; and we introduced a new oxygen bleach in Korea, which is now the brand leader in its category. We also continued to tap into the best technology partners — many of which are near our headquarters in the San Francisco Bay Area — to deliver the right message to the right consumer at the right time. And today, we’re investing about 45 percent of our media spend in digital marketing to continue leading the industry in technology-enabled, real-time consumer engagement.
Importantly, our demand creation programs were successful in introducing our family of brands to even more consumers. In fiscal year 2017, our brands were in over 1.4 million more U.S. households compared to fiscal year 2016, with Clorox-company products in 90 percent of households.1
You — those who live in our communities around the world — inspire our commitment to growing the right way: responsibly and guided by our values.
At Clorox, we continue to be focused on good growth — growth that’s profitable, sustainable and responsible. We’re very mindful of our environmental and social impacts because the long-term well-being of our communities and planet is as much a priority for us as it is for our stakeholders. That’s why we continued to drive
4%Sales growth, with sales increasing every quarter
3 ptsIncremental sales growth from
product innovation
$112MCost savings from productivity gains
$5.35Diluted EPS from
continuing operations
9%Diluted EPS increase, on top of an 8% increase in fiscal 2016
$871MNet cash from continuing
operations, a 13% increase
Our relentless focus on superior value contributed
to our strong results in fiscal year 2017.
3G4-1, G4-15, G4-DMA, G4-EC2, G4-LA10

our eco strategy, making sustainability improvements to 34 percent of our product portfolio since our baseline calendar year of 2011. Our progress puts us on track to hit our 50 percent goal by 2020.2 We’ve also lowered our greenhouse gas emissions by 18 percent , water usage by 21 percent , energy usage by 15 percent and waste-to-landfill by 41 percent since 2011. We continue to believe that vibrant and healthy communities play an important role in the health of our business. In fiscal year 2017, our total impact to support our communities came to more than $11 million in cash grants, product donations and cause marketing contributions.
As a signatory to the United Nations Global Compact, we reaffirm our commitment to its Ten Principles by driving our corporate responsibility strategy, a comprehensive set of commitments across our company — from human rights, labor and product safety to transparency, environmental sustainability and contributions to our communities. We value being a signatory to the UNGC as it provides an opportunity to continue learning from and sharing ideas with key sustainability influencers and other companies.
We’re proud that others are recognizing our corporate responsibility progress. Once again, the U.S. Environmental Protection Agency named Clorox a Safer Choice Partner of the Year, and Corporate Responsibility magazine included us among the top 100 companies on its Best Corporate Citizens list.
You — our employees — inspire our ongoing quest to make Clorox a dynamic workplace that attracts and develops the best and brightest people.
Our 8,100-plus employees around the world drove our strong results above and beyond financial performance this fiscal year.
With inclusion and diversity as a business imperative, we continued our focus on making sure Clorox benefits from the diverse minds, experiences and backgrounds of our employees, which mirror the diversity of our consumers around the world. It starts at the top. Notably, female leaders make up 36 percent of Clorox Executive Committee members . In addition, female and minority leaders each make up 33 percent of our board of directors .
I’m very proud the company has been recognized for our strong inclusion and diversity programs.
“We’re very mindful of our environmental and social impacts because the long-term well-being of our communities and planet is as much a priority for us as it is for our stakeholders.”
$11.1M in cash grants, product donations and cause
marketing contributions.
4 The Clorox Company 2017 Integrated Annual Report G4-1, G4-15, G4-DMA, G4-EC2, G4-LA10

We earned another 100 percent score from the Human Rights Campaign for our LGBT workplace practices — a recognition we’ve achieved since 2006 — and Diversity MBA magazine ranked Clorox No. 7 on its list of the 50 best employers for women and diverse managers, among other recognitions. It’s especially gratifying that all this has led to Clorox achieving high levels of employee engagement. Our current engagement score is 88 percent , higher than both the fast-moving consumer goods industry norm and the global high-performance norm.3 This matters a great deal to the Clorox management team since there’s a strong correlation between employee engagement and financial performance.
We also continued our commitment to you, our shareholders.
In fiscal year 2017, we returned $412 million in cash dividends to our shareholders. As we’ve done every year since 1977, we raised our annual cash dividend, announcing in the fourth quarter an increase of 5 percent. As of Aug. 15, 2017, Clorox’s dividend yield was 2.4 percent. Our total shareholder returns of 6 percent for the one-year period ending Aug. 15, 2017, ranked Clorox in the top tier of our peer group.
In fiscal year 2018, we’ll continue to be guided by our 2020 Strategy and draw on you, our stakeholders, for inspiration.
For consumers, that’s focusing on superior value through our differentiated products and brands. For our communities, that’s maintaining our strong commitment to our values and corporate responsibility. And for Clorox employees, it’s fostering a workplace where they can thrive and grow professionally and personally. For all our stakeholders, we’ll remain steadfastly committed to our values.
Sincerely,
Benno DorerChairman and Chief Executive OfficerAugust 15, 2017
1 IRI Panel Data, Total US All Outlet, NBD weighted, 52 weeks ending June 25, 2017.
2 For the calendar year ended Dec. 31, 2016. All sustainability metrics represent cumulative progress against CY 2011 baseline, and percentage is based on net customer sales. There are four types of sustainability improvement criteria that can be met either by fully meeting one or by partially meeting two or more: 1) a 5 percent or more reduction in product or packaging materials on a per-consumer-use basis; 2) an environmentally beneficial change to 10 percent or more of packaging or active ingredients on a per-consumer-use basis; 3) a 10 percent reduction in required usage of water or energy by consumer; or 4) an environmentally beneficial sourcing change to 20 percent or more of active ingredients or packaging on a per-consumer-use basis.
3 The Willis Towers Watson global high-performance companies norm is based on responses from 142,506 employees at 26 companies. Companies qualify for the norm by meeting two criteria: 1) superior financial performance, defined by a net profit margin and/or return on invested capital that exceeds industry averages; and 2) superior human resources practices, defined by employee opinion scores near the top among the most financially successful companies surveyed by Willis Towers Watson.
Reviewed by Ernst & Young LLP. Please refer to pages 52-53 for the Review Report.
$412M in cash dividends to
our shareholders.
Returned
5G4-1, G4-15, G4-DMA, G4-EC2, G4-LA10

Building our brands around you, the consumer, is nothing new for Clorox.
Lately, we’ve looked to technology to help accelerate brand growth. Through e-commerce, sense-and-respond marketing and insights gained through improved data, we’ve made progress. But the playing field has changed, as have your expectations. So we have, too.
More than ever, your needs are at the center of what we do. Through a consumer experience that addresses what’s important to you — reimagined and reinvented through the use of data and technology — our aim is to build deeper, longer-term connections between you and our brands.
ConsumerConnecting you
to your needs and what you value.
You, our consumers, inspire us to constant ly look for ways to make our brands better.
YOU INSPIRE US TO MAKE EVERYDAY LIFE BETTER, EVERY DAY
6 The Clorox Company 2017 Integrated Annual Report

Solving a consumer need through not only the function of a product, but also by delivering a superior consumer experience.
Allowing us to reimagine and reinvent the creation and delivery of experiences beyond advertising and our product, providing targeted, personalized, real-time interactions to consumers.
Uniting around common and easily understood objectives of helping consumers, tied to the brand purpose.
Brand
Plotting the Journey
Determining consumer needs, identifying consumer profiles and mapping how we would connect consumers to their needs.
Identifying pain points and opportunities, prioritizing and sequencing activities.
Reimagining the consumer experience, capabilities and organization.
Evaluating early performance to determine whether we’ve been successful at meeting consumers’ needs.
Supported By
INSIGHTS
PLANNING
DESIGN
MEASURE
Data and Technology
Clorox People
INSPIRE US TO MAKE EVERYDAY LIFE BETTER, EVERY DAY
7

25,000+Peruvians served
every year 100M+ liters of safe water
every year
Bleach dispensers provide safe drinking water in PeruAbout 16 million people in Peru don’t have access to safely managed drinking water*. Through the use of bleach dispensers — a low-cost, sustainable way to treat and disinfect water — our Clorox Safe Water Project, launched in 2012, is providing drinkable water to 21 rural communities in the Piura-Tambogrande region of northern Peru. The project also has supported education to help families understand the connection between invisible germs in their water and illness.
Health and wellness has been central to our mission since the founding of our company more than a hundred years ago. It all started with our namesake bleach, with disinfecting properties that kill germs that can cause infections and other health threats. Over time, our portfolio has expanded to include other products that support health and wellness, such as our Brita® filters and pitchers, Burt’s Bees® personal care and beauty lines, and RenewLife® digestive health aids.
This legacy has made us a natural fit to support clean water and sanitation efforts — one of 17 global goals for sustainable development the United Nations is seeking to achieve by 2030. The Clorox Safe Water Project and Brita Canada’s Filter for Good campaign are two initiatives that seek to address a problem that is a leading cause of illness, malnutrition and even death among children in developing countries.
INSPIRED BY OUR COMMUNITIES
350,000 liters of water
purified every day
2. Billionpeople worldwide don’t have access to safely managed drinking water*
* “Progress on Drinking Water, Sanitation and Hygiene: 2017 Update and SDG Baselines,” World Health Organization and United Nations Children’s Fund (UNICEF).
You, the people in our communities, inspire our company to give back, doing well while also doing good.
8 The Clorox Company 2017 Integrated Annual Report

40,000+ more Kenyans now
receive cleaner drinking water
every day
New well system brings water — and a better future for girls — to KenyaIn many rural villages in Kenya, the only water source can be more than 6 miles away. Responsibility for retrieving the water rests on young girls, who must make the trip balancing a 40-pound container on their backs. Through the creation of a borehole, a type of well that taps into a natural aquifer underground, our Brita® brand’s Filter for Good campaign is helping to bring safer drinking water directly to a remote community in Kenya’s Maasai Mara region — and keeping girls in school at the same time.
9

INSPIRED BY OUR EMPLOYEES
You, our employees, create a successful workplace and drive good growth.Clorox employees strive to create an environment where everyone feels a sense of belonging — respecting, valuing, supporting and recognizing each other as much for their uniqueness as for those things they have in common. They know this enables everyone to do their best work and positions us for growth.
88% Employee Engagement ( +8% vs. Peer Companies, +3% vs. High-Performing Companies)
10 The Clorox Company 2017 Integrated Annual Report

1The median employee participation rate for matching gift programs is 7 percent. Source: CECP Giving in Numbers Report: 2016 Edition
Seeking good ideas from everyoneRegardless of position, role or background, employees are encouraged to share their points of view and insights. More importantly, their perspectives are heard. One measure of their satisfaction is our employee engagement score, which is higher than that of our peers and among the best of the highest-performing global companies.
All in on innovationInitiatives spearheaded by employees have generated creative ideas from all corners. Innovent, our internal ideas contest, allows anyone to be an “intrapreneur.” An inaugural hackathon used technology tools to bring together a diverse group of employees to brainstorm new ways to expand direct-to-consumer sales. And employee resource groups — one of our original sources of business ideas grounded in cultural and multigenerational insights — continue to contribute to our innovation pipeline.
The GIFT of givingOur people love to give back to our communities. In the 2016 calendar year, almost half of eligible employees participated in GIFT, the company’s charitable giving program, contributing nearly $5 million to more than 3,500 nonprofits — well above typical involvement at similar company programs.1 They also volunteered more than 115,000 hours of their time — demonstrating that they live our company value of “doing the right thing.”
Through an inclusive approach to work, our employees inspire us, and each other, to draw on the contributions of individuals and teams to help achieve a higher collective purpose — both for our business and for society as a whole.
115,000 Employee Volunteer Hours in CY 2016
11

INNOVATING ON INNOVATION
Innovation takes many forms at Clorox — from developing a product that becomes a household name to advertising that creates buzz to an in-store display that grabs attention. Here are perspectives on how we’ve been evolving to meet consumers’ changing needs from four senior leaders who help shepherd innovation throughout our organization: Chief Innovation Officer Denise Garner, Chief Customer Officer Matt Laszlo, Chief Marketing Officer Eric Reynolds and Chief Information Officer Manjit Singh.
A Conversation About How It Happens
Q. How does the consumer inspire Clorox innovation? Denise Garner | In R&D the consumer is our muse. We pay attention to what
consumers tell us they want in a product as well as observe their pain points to identify unarticulated needs that present opportunities to innovate and delight. Consider the new Brita® Stream™ pitcher. Millennials wanted a high-capacity pitcher that was streamlined enough to fit inside the refrigerator door, delivered fast filtration “on demand” and allowed them to add ice to the pitcher. Their feedback inspired us to reinvent our filtration technology and pitcher design.
Manjit Singh | Consumers' embrace of technologies such as voice integration and in-home smart speakers has us asking how we can leverage them to make products even more practical, effective and easier to use. The Brita® Infinity pitcher, Clorox's first “internet of things” product, is an example of how IT partners with other groups inside Clorox to deliver a superior consumer experience, while we're using our voice integration skills to improve consumers' experiences with our products in their homes.
Q. How has Clorox innovation made a difference for our retail customers?
Matt Laszlo | It starts with putting the consumer first. Being able to meet consumer needs through innovation makes us an extremely valuable, effective partner to our retailers. We know that, for many consumers, scent can make a mundane experience more enjoyable. That approach has helped Clorox® Scentiva® cleaners get off to a good start with strong retailer support.
12 The Clorox Company 2017 Integrated Annual Report

Left to right:
Manjit Singh, Senior Vice President and Chief Information Officer
Eric Reynolds, Senior Vice President and Chief Marketing Officer
Matt Laszlo, Senior Vice President and Chief Customer Officer
Denise Garner, Senior Vice President and Chief Innovation Officer
13

Q. How has your approach to innovation changed? Matt Laszlo | We’re thinking about innovation more broadly than ever before. Not only
are we developing new products, but we’re also expanding our existing products to new spaces, places and faces — for instance, by placing Clorox® disinfecting wipes in the pharmacy section. Why is this important? Because consumers don’t make all of their purchases in one place anymore — or even two or three places. So we need to always look beyond traditional roles and rules to continue growing our business.
Denise Garner | We’ve enhanced our innovation processes from end to end so we can create bigger, more sustainable ideas while moving at a faster pace — and minimize needed resources and costs in the process. This positions us to meet ever-changing consumer and retailer needs much more effectively. And it gives us a much better chance of being first to market with an innovation. We’re already seeing results with a stronger innovation pipeline.
Q. What does the next phase of innovation look like at Clorox? Eric Reynolds | It’s about creating a seamless consumer experience. That
means unlocking what motivates someone to purchase our products and bring them home.
Take the Brita® Infinity pitcher. It’s not just a pitcher. It connects to the internet and can reorder filters. For all our brands, we need to bring together the physical and digital experience — because people want an experience rather than just products.
Matt Laszlo | We’ve got to be more and more digitally enabled. That could mean the product itself, the packaging or the online content, which educates, influences and tells the consumer a story.
For example, do you get a push notification from Hidden Valley® ranch suggesting a recipe to try when you’re walking down the dressings aisle? Or can we create packaging with more information on it for shoppers to engage with via their smartphones? More and more, our retailers want to play in the online world, even for the in-store experience. Our innovation
14 The Clorox Company 2017 Integrated Annual Report

needs to address the consumer desire for more education and interaction with our products.
Manjit Singh | It’s going to be all about speed. With IT involved from the start, we’ll be able to embed technology into our processes as well as our products to meet consumers’ ever-evolving needs.
Q. In a crowded media landscape, how does innovation strengthen your marketing efforts?
Eric Reynolds | The challenge for us is not the media landscape; it’s all the information and noise the average person gets today.
To penetrate through with clear product ideas and messages, we need to innovate everywhere, including media, because communication is a big piece of what we’re trying to do.
One area where we’re doing this is media planning. What’s worked well for decades — TV, print, digital — has started to fall. As media consumption continues to shift and fragment across multiple channels and environments, gaining consumers’ attention is challenging. There are too many messages and channels, and we need to break through this clutter. So we’re changing the way we approach the question. We’re trying to slide into their day-to-day lives at just the right moment with a piece of information they’re open to receiving at that particular time.
Q. How do you nurture the spirit of innovation? Denise Garner | We need to stay close to emerging trends with a laser focus
on our consumer, our categories and our competition as well as on the retail environment and overall global trends.
Then it is all about nurturing a sense of bold curiosity in our culture. Curiosity can help unlock insights about our consumers and technology, which can serve as the foundation for innovation breakthroughs, whether it’s adapting the technology or discovering a new consumer need that helps us focus our product development efforts.
Manjit Singh | Our curiosity has led us to establish relationships with organizations such as research boards, venture capital groups and investment firms, which expose us to early-stage innovations that can inspire new ideas and further improve our speed to market. We encourage our employees to tap these relationships to learn more about technology advances that will allow us to discover innovative ways to solve consumer needs.
15
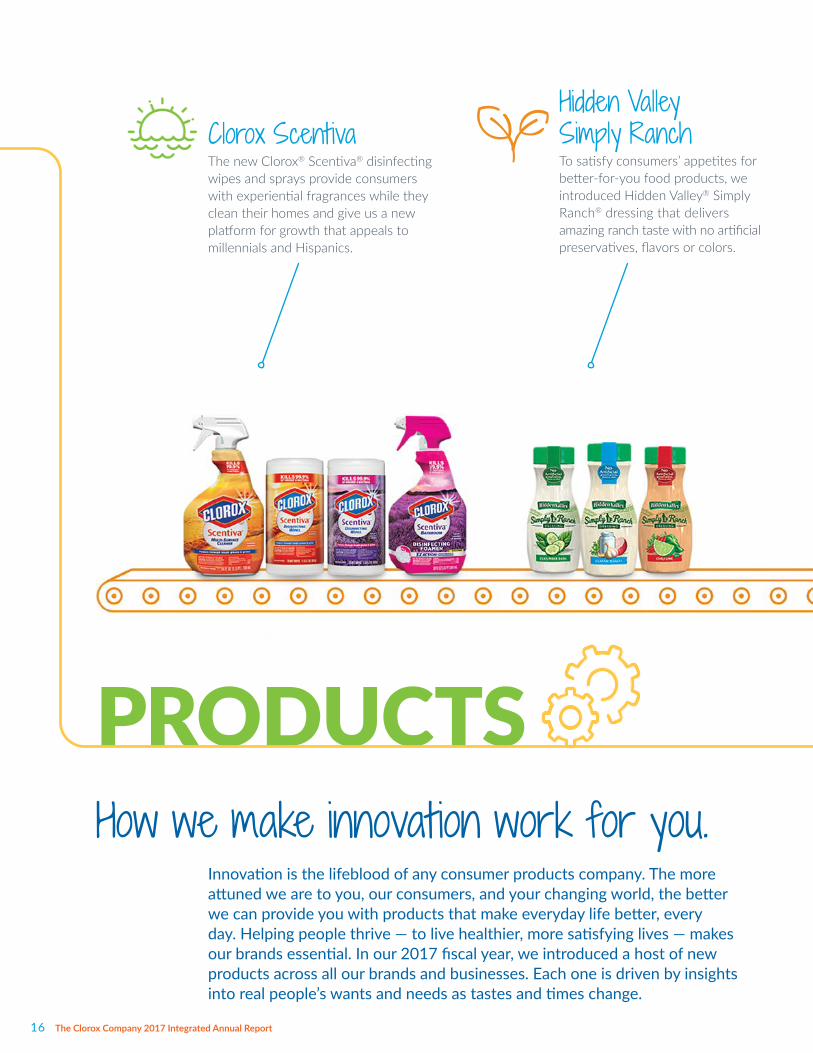
PRODUCTSHow we make innovation work for you.
Innovation is the lifeblood of any consumer products company. The more attuned we are to you, our consumers, and your changing world, the better we can provide you with products that make everyday life better, every day. Helping people thrive — to live healthier, more satisfying lives — makes our brands essential. In our 2017 fiscal year, we introduced a host of new products across all our brands and businesses. Each one is driven by insights into real people’s wants and needs as tastes and times change.
Clorox ScentivaThe new Clorox® Scentiva® disinfecting wipes and sprays provide consumers with experiential fragrances while they clean their homes and give us a new platform for growth that appeals to millennials and Hispanics.
Hidden Valley Simply RanchTo satisfy consumers’ appetites for better-for-you food products, we introduced Hidden Valley® Simply Ranch® dressing that delivers amazing ranch taste with no artificial preservatives, flavors or colors.
16 The Clorox Company 2017 Integrated Annual Report

Clorox Healthcare FuzionThe new Clorox Healthcare® Fuzion® cleaner disinfectant offers the healthcare industry a disinfecting solution with the power of bleach, providing the fastest kill time available against potentially life-threatening microorganisms like C. difficile spores, while leaving behind minimal odor or residue without damaging common surfaces.
Brita Stream Pitcher and Brita LongLast FilterThe new Brita® Stream™ pitcher with filter-as-you-pour technology fills quickly and pours immediately so consumers don’t need to wait for filtered water, while the new Brita LongLast® filter, which lasts three times longer than our legacy filter and removes lead, can be used with existing pitchers.
Kingsford Long-Burning BriquetsKingsford® long-burning briquets were intro-duced to capitalize on the growing interest in smoking and low-and-slow cooking. The product burns 25 percent longer, making pitmaster favorites like brisket and pulled pork easier for any backyard griller.
Burt’s Bees Strawberry Lip Balm and Tinted Lip OilsOur 100 percent natural moisturizing lip care line expanded further with the addition of Burt’s Bees® strawberry lip balm, a mainstream flavor that’s attractive to a broad range of consumers. Our Burt’s Bees® tinted lip oils exceeded retail sales projections in their FY17 launch year, driven by an integrated marketing campaign that leveraged digital platforms novel for the brand, and also resulted in media coverage by fashion and beauty publications.
17

Strategies
2020 STRATEGYEntering the fifth year of our 2020 Strategy, The Clorox Company remains focused on what we refer to as good growth — growth that is profitable, sustainable and achieved responsibly.
MISSION We make everyday life better, every day.
OBJECTIVEBe the best at building big-share brands in economically attractive, midsized categories.
COMMITMENT Leverage environmental, social and governance performance to help drive long-term, sustainable value creation.
Grow Net Customer Sales By
+3-5% Per Year
Deliver Free Cash Flow As % Of Sales
10-12% Per Year
Expand EBIT Margin
+25-50 Basis Points Per Year
Long-Term Aspirations
Business Corporate Responsibility
1Engage our people as business owners. Promote diversity, opportunity and
respectful treatment for all people who touch our business.
2Drive superior consumer value behind strong brand investment, innovation and technology transformation.
Make responsible products responsibly.
3Accelerate portfolio momentum in and around the core.
Safeguard families with Be Healthy, Be Smart and Be Safe initiatives.
4 Fund growth by reducing waste in our work, products and supply chain.
Shrink our environmental footprint while we grow.
18 The Clorox Company 2017 Integrated Annual Report G4-2

Operating ModelFactors Driving Our Business Success To achieve our business goals, we need to leverage the unique attributes of our company; maintain and build on our relationships with important partners such as our employees, retail customers and communities; and manage external factors that can influence our success.
External Influences
Global Economy
Natural Resources
Competition Raw Materials Cost
Laws and Regulations
Foundation
Our Values• Do the right thing• Stretch for results• Take personal ownership• Work together to win
Our Resources• Talented and engaged employees• Superior brand-building capabilities• Strong product portfolio• Financial discipline • Strong cash flow
Consumers Suppliers and Other Business
Partners
Communities Retail Customers
InvestorsEmployees
Our Relationships
Civil Society/ NGOs
19G4-2

ENGAGE OUR PEOPLE
Strategy 1Business HighlightsEngage our people as business owners.
Our annual employee engagement survey showed that 88 percent of Clorox employees feel engaged or highly engaged, far surpassing the norm for consumer goods companies (80 percent), and even for global high-performing companies (85 percent).1 Results improved by 1 point over last year, with increased survey participation (82 percent versus 79 percent), and more than 8,000 comments overall about the employee experience at Clorox.
Voluntary employee reviews contributed to the company’s No. 12 ranking on the list of Best Places to Work in the U.S. and our CEO Benno Dorer’s No. 1 ranking on the 2017 Highest-Rated CEOs list by job site Glassdoor.
Corporate Responsibility HighlightsPromote diversity, opportunity and respectful treatment for all people who touch our business.
Clorox Chairman and CEO Benno Dorer was one of more than 150 CEOs from across the globe who were original signatories to the CEO Action for Diversity & Inclusion™, reaffirming that our company is a place where diverse perspectives and experiences are accepted and encouraged.
We instituted “Plus One” initiatives through which individuals with different thinking styles or experience could be added to teams to make them stronger.
The company spent $140 million with diverse suppliers during the fiscal year, up from $20 million in 2008. Diverse suppliers include minority-, women-, service-disabled- and veteran-owned business enterprises, as well as gay, lesbian, bisexual and transgender business owners in the U.S. and Puerto Rico.
The company maintained a world-class recordable incident rate (<1.0) of 0.60, reflecting a slight reduction compared to the previous year.
1The Willis Towers Watson global high-performance companies norm is based on responses from 142,506 employees at 26 companies. Companies qualify for the norm by meeting two criteria: 1) superior financial performance, defined by a net profit margin and/or return on invested capital that exceeds industry averages; and 2) superior human resources practices, defined by employee opinion scores near the top among the most financially successful companies surveyed by Willis Towers Watson.
G4-2, G4-DMA, G4-LA6, G4-LA10 20 The Clorox Company 2017 Integrated Annual Report
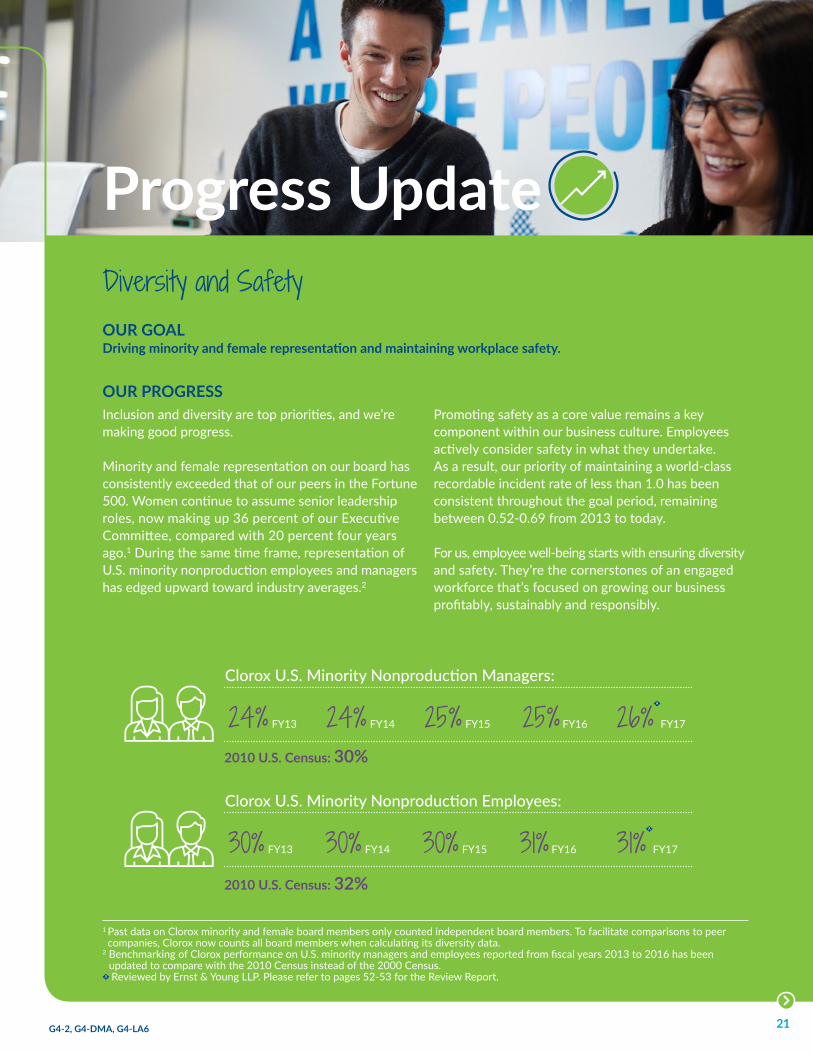
Diversity and SafetyOUR GOAL Driving minority and female representation and maintaining workplace safety.
OUR PROGRESSInclusion and diversity are top priorities, and we’re making good progress.
Minority and female representation on our board has consistently exceeded that of our peers in the Fortune 500. Women continue to assume senior leadership roles, now making up 36 percent of our Executive Committee, compared with 20 percent four years ago.1 During the same time frame, representation of U.S. minority nonproduction employees and managers has edged upward toward industry averages.2
Promoting safety as a core value remains a key component within our business culture. Employees actively consider safety in what they undertake. As a result, our priority of maintaining a world-class recordable incident rate of less than 1.0 has been consistent throughout the goal period, remaining between 0.52-0.69 from 2013 to today.
For us, employee well-being starts with ensuring diversity and safety. They’re the cornerstones of an engaged workforce that’s focused on growing our business profitably, sustainably and responsibly.
Progress Update
1 Past data on Clorox minority and female board members only counted independent board members. To facilitate comparisons to peer companies, Clorox now counts all board members when calculating its diversity data.
2 Benchmarking of Clorox performance on U.S. minority managers and employees reported from fiscal years 2013 to 2016 has been updated to compare with the 2010 Census instead of the 2000 Census. Reviewed by Ernst & Young LLP. Please refer to pages 52-53 for the Review Report.
24% FY14 25% FY16 25% FY15 26% FY17
Clorox U.S. Minority Nonproduction Managers:
24% FY13
2010 U.S. Census: 30%
Clorox U.S. Minority Nonproduction Employees:
30% FY13 30% FY14 31% FY16 30% FY15 31% FY17
2010 U.S. Census: 32%
G4-2, G4-DMA, G4-LA6 21

DRIVE SUPERIOR CONSUMER VALUE
Strategy 2
Our RenewLife® brand, acquired in May 2016, continues to grow, gaining distribution and market share in the food, drug and mass channels, in line with our expectations, while maintaining a strong presence in the natural channel.
Business HighlightsDrive superior consumer value behind strong brand investment, innovation and technology transformation.
We delivered 3 percent incremental sales growth from product innovation across our global portfolio during fiscal year 2017.
Our businesses tapped 360-degree video technology to showcase the global problem of safe water access along with solutions supported by the Clorox® brand in Peru and Brita Canada in Kenya.
We continued to lead the industry with 45 percent of our media spending focused on digital.
To win with the digital shopper, Clorox tapped technology partnerships to help deliver consumer experiences extending beyond product usage. In Canada, we launched geofencing — a feature that uses GPS or radio frequency identification technology to create a virtual geographical boundary — with Snapchat to target consumers in a specific neighborhood, inviting them to an experiential event for the launch of Burt’s Bees® lipsticks, and used virtual reality to showcase the Brita® brand’s clean-water initiatives.
The Fresh Step® brand has returned to market share growth by accelerating momentum behind last year’s Fresh Step with the power of Febreze® launch. Some of this year’s innovations included a Hawaiian Aloha™ scent; new, easier-to-use four-packs; and improved shelf presence. Expansion was fueled further by a 75 percent improvement in advertising effectiveness and increased merchandising compared to the previous fiscal year.
G4-2 22 The Clorox Company 2017 Integrated Annual Report

Corporate Responsibility HighlightsMake responsible products responsibly.
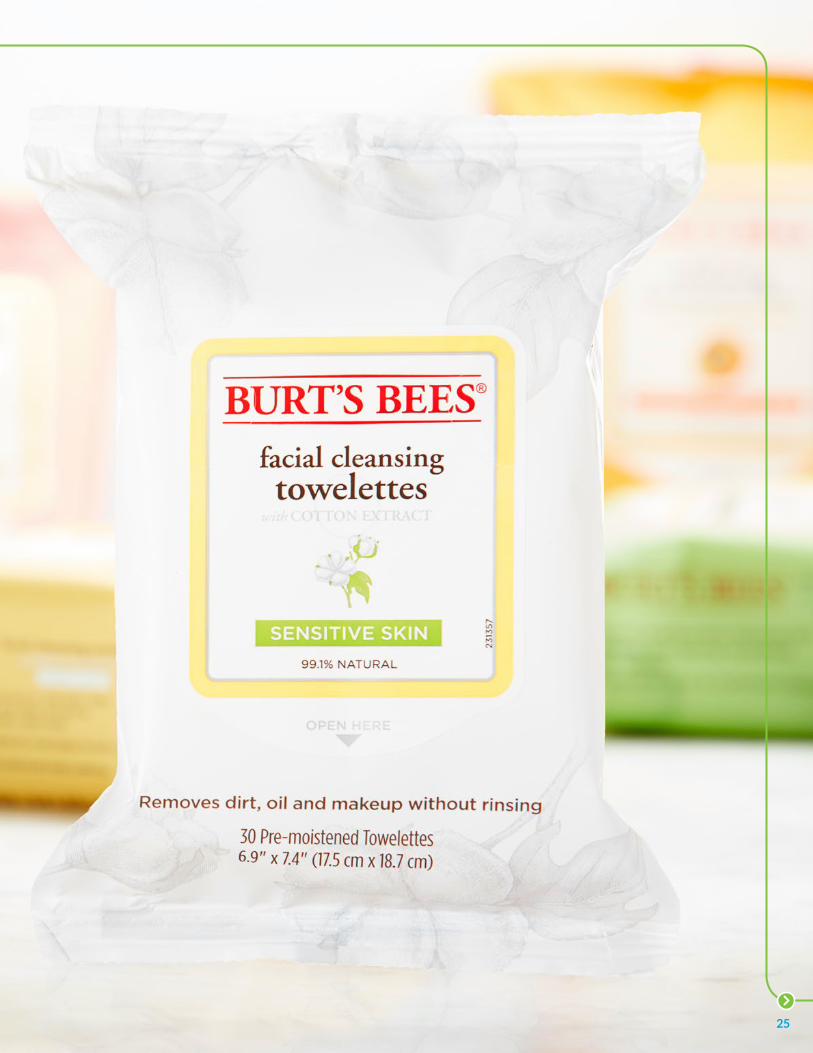
For its facial towelettes, the Burt’s Bees® brand replaced the hard plastic door with a sticker-like closure, eliminating approximately 108,000 pounds of hard plastic from production annually and keeping it out of waste streams. A redesigned cardboard display tray for the towelettes also uses 90,000 pounds less paperboard per year.
Packaging for the Burt’s Bees® facial moisturizer was converted from mixed resin material, which is not recyclable curbside, to single-material tubes made of high-density polyethylene, or HDPE, making it easier for consumers to recycle.
In support of our goal to eliminate all PVC packaging, we changed the material used for our Kingsford® charcoal lighter fluid packaging to more environmentally friendly PET.
The Brita® brand launched The Filtered Life marketing campaign featuring basketball superstar Stephen Curry to inspire people to filter out the bad and get to the good, in water and in life, starting with negativity and bullying online.
G4-2 23

Product Sustainability ImprovementsOUR GOAL Make sustainability improvements to 50 percent of the product portfolio by 2020.
OUR PROGRESSSince our 2011 baseline, the percentage of our product portfolio with sustainability improvements has increased steadily, from 7 percent in our first year to 34 percent in 2016 , our most recent available data.
To meet our 2020 goal, we have established four pathways for improving the sustainability of our products and packaging, allowing each brand to consider which approach makes the most sense while delivering superior consumer value. These options include 1) reducing materials; 2) using more sustainable materials; 3) reducing the amount of water or energy required by consumers; and 4) sourcing materials more sustainably.*
Most of our product sustainability improvements have been achieved through material reduction in the product or package, or both. By reducing materials in our designs, we eliminate the footprint associated with the materials saved and reduce the transportation footprint, as we can load more product onto fewer trucks for distribution.
We’re on track to meet the 2020 goal, with a defined pipeline and path for product sustainability improvements. Looking beyond 2020, we anticipate needing to shift more of our efforts beyond material reduction, as opportunities for further material efficiency gains become more limited.
Progress Update
Product Portfolio with Sustainability Improvements (cumulative progress since 2011 base year):
7% CY12 15% CY13 31% CY15 20% CY14 34% CY16 50% CY20 GOAL
ON TRACK TO MEET OUR GOAL2020 Goal
50%Results to Date
34%
*Refer to page 53 for a full description of the criteria.
G4-2, G4-DMA, G4-EN27 24 The Clorox Company 2017 Integrated Annual Report
25

ACCELERATE PORTFOLIO MOMENTUM
Business HighlightsAccelerate portfolio momentum in and around the core.
Sales in the e-commerce channel grew more than 30 percent in the 2017 fiscal year through partnerships with fast-growing online retailers and testing of novel shopping methods like Amazon Dash, which simplifies the reordering process for commonly used products.
Licensing partnerships that extended our brands into new categories and generated profitable revenue streams included Clorox® Fraganzia® air care, Brita® commercial filtration and softener systems, Clorox® pool salt for saltwater pools, Clorox® laundry accessories and Pine-Sol® cleaning tools.
Strategy 3
Seeing a market opportunity, we developed a powder oxygen bleach in Korea in just three months. We secured the No. 1 market position in key account channels, which represent 60 percent of the country’s oxygen bleach market, and also introduced a liquid line this year.
G4-2 26 The Clorox Company 2017 Integrated Annual Report

Corporate Responsibility HighlightsSafeguard families with our Be Healthy, Be Smart and Be Safe initiatives.
We continued to help communities around the world recover from natural disasters. Following historic flooding in Louisiana, we donated 10 truckloads of product, including over 8,600 cases of Clorox® liquid bleach and 18,700 cases of Glad® trash bags, through the American Red Cross Annual Disaster Responder Program. We also donated Clorox® bleach in Peru to aid survivors of floods there in early 2017.
We awarded six grants to urban farms in Oakland, California; Northwest Arkansas; and the Atlanta, Georgia, metro area. This is a new focus area for The Clorox Company Foundation and also a geographical expansion geared at fighting food insecurity in a number of the communities where our employees live and work.
Our brands continued to engage in cause marketing programs consistent with their purpose that are also meaningful to consumers. The Peru business empowered Peruvians to support our Clorox Safe Water Project and
provide more people in rural areas of the country with access to clean water. Through the help of consumers with the purchase of specially marked products, Brita
Canada helped provide cleaner drinking water for an entire community in Kenya — over 40,000 people this year — impacting not only their health, but also their education, since many young girls who had been responsible for retrieving water for their families are now able to attend school.
The Clorox® brand in the U.S. partnered with DonorsChoose.org to help teachers prepare for back-to-school.
The Burt’s Bees Bring Back the Bees campaign returned in 2017 to double its impact and plant 2 billion wildflowers.
The Fresh Step® Hot to Adopt™ program sent shelter cats down the catwalk at New York Fashion Week to help promote cat adoption.
In the wake of Hurricane Matthew, we donated nine truckloads of product — over 5,400 cases of Clorox® liquid bleach and nearly 17,000 cases of Glad® trash bags to support people in the Southeast U.S. and Haiti through partnerships with the American Red Cross and Americares.
G4-2, G4-DMA, G4-SO1 27

Community SupportOUR GOAL Safeguard families with our Be Healthy, Be Smart and Be Safe initiatives.
OUR PROGRESSEvery year, we contribute in a meaningful way to support the communities where we live and do business. It’s not about achieving a certain level of activity but about meeting the needs they face from year to year.
Four years into our strategy, we’ve made substantial contributions to the well-being of our neighbors and our planet. From our 2013 to 2017 fiscal years, we’ve given a total of $23 million in grants to support youth education, cultural and civic organizations, health initiatives and more through our nonprofit foundations. During the same time frame, the company made $44.4 million in product donations, much of which helped in the recovery from natural disasters such as floods in the U.S., an earthquake in Ecuador and
disease outbreaks such as Ebola in West Africa, while our brands invested $4.3 million in cause marketing campaigns to make a difference in safe drinking water, childhood obesity and pet adoption, to name a few projects aligned with their purposes. During a corresponding period from the 2012 to 2016 calendar years, our employees volunteered 543,383 hours of their time to improve their local communities, effort that is valued at $11 million.
Consistent with our values as a company, we will continue to be committed to our communities, helping them remain healthy and safe, as well as supporting educational and cultural initiatives.
Progress Update
G4-2, G4-SO1 28 The Clorox Company 2017 Integrated Annual Report

$23MIn Grants to Support Our Communities Since FY13
29

FUND GROWTH
Business HighlightsFund growth by reducing waste in our work, products and supply chain.
Our Hidden Valley® Simply Ranch® dressing went from concept to shelf in just 10 months — more than 50 percent faster than our average development timeline of 24 months for large product innovation projects — thanks to adoption of agile, or more efficient, business practices.
The company’s Research and Development division saved $400,000 by designing a lab testing process to deliver higher-quality data in a shorter amount of time. This initiative enables us to move faster in product development and create backup labs for product testing, while still providing necessary data and validation.
Enterprisewide initiatives, including identification of alternative dedusting agents for our litter formula, improvements to our namesake bleach with polyelectrolyte complexes, or PECs — technology that makes it easier to clean hard surfaces and improves the whitening performance in laundry — and a number of other administrative improvements, contributed to $111.6 million in cost savings.
Our European cat litter business developed a new, locally sourced base formula and consolidated manufacturing in a central location, increasing distribution efficiency and providing $640,000 in cost savings in less than a year, leading to a double-digit increase in margins for our Ever Clean® brand.
Progress made in our Go Lean strategy in International yielded strong cost savings and productivity gains throughout the fiscal year, enabling us to invest selectively in higher-growth businesses.
Strategy 4
Taking the first step to becoming zero-waste-to-landfill facilities, our Jacksonville, Florida, and Costa Rica sites held dumpster dives to evaluate their existing recycling programs and determine how to reduce volumes of waste.
G4-2 30 The Clorox Company 2017 Integrated Annual Report

Corporate Responsibility HighlightsShrink our environmental footprint while we grow.
Our Glad® brand’s Rogers, Arkansas, plant — our largest manufacturing facility by number of employees — reached zero-waste-to-landfill status, becoming our third site to achieve this designation.
A partnership with a nonprofit is helping the Burt’s Bees® brand achieve its sustainability goals while also helping adults with disabilities gain self esteem through meaningful work. By separating unsellable product from its packaging — for example, squeezing all the lotion out of a tube or twisting a lip balm out of its stick — the brand’s nonprofit partner was able to turn product waste into compostable or recyclable material, reducing waste to energy by 90 percent compared with past practices.
Based on a supplier survey that received a 100 percent response rate, more than 99 percent of the fiber we source directly was determined to be recycled or certified virgin fiber.
Our Kingsford® brand’s Summer Shade, Kentucky, manufacturing facility installed a fabric superstructure — slightly larger than a football field and nine stories tall — over its woodpile to prevent the material from being exposed to the elements. With the woodpile protected, less energy is required to dry it before it’s used to make char, a key ingredient for manufacturing charcoal briquets.
A superstructure designed to keep woodpiles dry is expected to reduce one Kingsford manufacturing facility’s annual energy consumption by
10 percent.
As part of our ongoing commitment to responsible sourcing of palm oil, we targeted our top suppliers, tracing more than 70 percent of the palm ingredients we source from them back to the mill. This figure is based on information collected by TFT, which is conducting our palm oil mapping work. The suppliers engaged represent 95 percent of our direct, domestically sourced palm-derivative ingredients.
G4-2 31

EnergyOUR GOAL Reduce energy use by 20 percent per case of product sold versus a 2011 calendar year baseline.
OUR PROGRESSWith the exception of a slight setback in 2014, we’ve made steady progress to reduce our energy use during this goal period. Based on our current data, we have now cut our energy use by 15 percent and are three-quarters of the way toward our 20 percent reduction goal by 2020. Some of the recent reductions in energy use on an intensity basis are due to an increase in product volume and the resulting efficiencies of scale.
To achieve our progress, we’ve focused on identifying potential efficiencies in some of our most energy-intensive processes. One area of focus has been the
process of converting wood scrap to char, a key ingredient for manufacturing Kingsford® charcoal briquets. The team came up with two ideas to approach our operations differently in order to significantly reduce our footprint: to keep our inventory of wood scrap dry and to reduce the frequency of shutdowns and furnace restarts.
In addition to the newer initiatives, we continue to focus on site-specific efficiency improvements — such as installing LED lighting — identified through our Energy Audit Action Plan created a few years ago.
Corporate Responsibility Priorities: Operational Footprint ReductionReduce the environmental impact of our operations and improve the sustainability of our upstream supply chain.
As the fifth year of our footprint reduction goal period comes to a close, we have already exceeded our 2020 goals to reduce solid-waste-to-landfill and water use and remain on target to reach our 2020 goals to lower energy use and greenhouse gas emissions. Our facilities are not energy-intensive or water-intensive, making ongoing progress challenging now that we have already reduced energy and water use by 23 percent and 33 percent, respectively, per case of product sold, since establishing our first sustainability strategy in 2008. Nevertheless, we continue to seek innovative ways to reduce our overall operational footprint.
15% CY16
Energy Use (annual progress versus 2011 base year):
10% CY12 10% CY13 14% CY15 6% CY14
Progress Update
20% CY20 GOAL
ON TRACK TO DELIVER 2020 GOAL2020 Goal
20%Results to Date
1 5%
G4-2, G4-DMA, G4-EN6, G4-EN19 32 The Clorox Company 2017 Integrated Annual Report

Greenhouse Gas EmissionsOUR GOAL Reduce greenhouse gas emissions by 20 percent per case of product sold versus a 2011 calendar year baseline.
OUR PROGRESSWe’ve made steady progress to reduce our greenhouse gas emissions during this goal period, with the exception of a slight setback in 2014 due to the increased energy needed to offset the effects of extreme weather. We have now cut our greenhouse gas emissions by 18 percent and have nearly reached our 2020 goal of 20 percent.
We’ve begun use of renewable energy, with solar panels activated at our Fairfield, California, plant and our regional distribution center in Aberdeen, Maryland. Both solar panel arrays were built with a third-party provider as power purchase agreements, or PPAs. That means we didn’t spend company money to build these projects, and the facilities buy the solar-produced power from the third party instead of from the utility.
While both arrays reduce overall greenhouse gas emissions, we do not include those of the Aberdeen RDC in the calculation of our greenhouse gas footprint because the third party retains the renewable energy credit rights in the PPA. The benefits from the Fairfield project will be included in next year’s data, as it came online in early 2017, after our current reporting period closed.
As with our energy use, some of the recent reductions in greenhouse gas emissions on an intensity basis are due to our increase in product volume and the resulting efficiencies of scale. Greenhouse gas emissions are also reduced through facility-based initiatives to install energy-efficient LED lighting.
GHG Emissions (annual progress versus 2011 base year):
10% CY12 12% CY13 17% CY15 11% CY14 18% CY16 20% CY20 GOAL
ON TRACK TO DELIVER 2020 GOAL2020 Goal
20%Results to Date
1 8%
G4-2, G4-DMA, G4-EN6, G4-EN19 33

WasteOUR GOAL Reduce solid waste-to-landfill by 20 percent per case of product sold versus a 2011 calendar year baseline.
OUR PROGRESSOur path to reducing solid waste-to-landfill has been up and down. We’re currently at a 41 percent reduction, more than double our 2020 goal. While we exceeded our goal just two years into the goal period, in the two subsequent years our progress slowed. After an analysis, we determined that a significant contributor was the periodic replacement and disposal of bricks used to line furnaces that turn wood chips into char at our Kingsford plants. We resolved this issue by repurposing the brick to build the base of an onsite access road rather than sending it to a landfill and have targeted similar beneficial reuse opportunities for brick in future years.
Throughout the goal period, we have also identified additional opportunities to reduce waste.
Although we’ve already significantly surpassed our 2020 goal, we’re continuing to identify additional ways to reduce solid waste-to-landfill. Three of our facilities have achieved zero-waste-to-landfill status — our plants in Fairfield, California; Orangeville, Ontario; and, most recently, Rogers, Arkansas — and we remain on target to reach our goal of 10 sites by the end of the goal period.
Solid Waste to Landfill (annual progress versus 2011 base year):
1% CY12 34% CY13 25% CY15 30% CY14 41% CY16 20% CY20 GOAL
MORE THAN DOUBLED OUR GOAL2020 Goal
20%Results to Date
41%
G4-2, G4-DMA, G4-EN23 34 The Clorox Company 2017 Integrated Annual Report
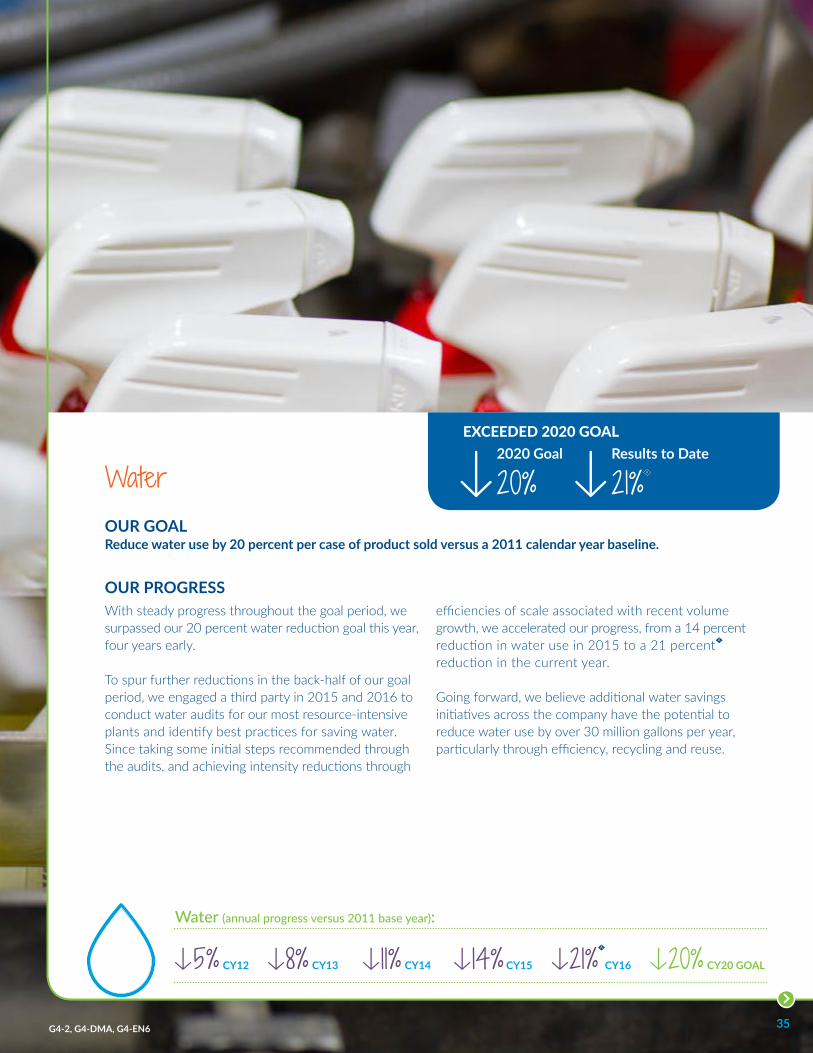
Water (annual progress versus 2011 base year):
5% CY12 8% CY13 14% CY15 11% CY14 21% CY16 20% CY20 GOAL
EXCEEDED 2020 GOAL2020 Goal
20%Results to Date
21%WaterOUR GOAL Reduce water use by 20 percent per case of product sold versus a 2011 calendar year baseline.
OUR PROGRESSWith steady progress throughout the goal period, we surpassed our 20 percent water reduction goal this year, four years early. To spur further reductions in the back-half of our goal period, we engaged a third party in 2015 and 2016 to conduct water audits for our most resource-intensive plants and identify best practices for saving water. Since taking some initial steps recommended through the audits, and achieving intensity reductions through
efficiencies of scale associated with recent volume growth, we accelerated our progress, from a 14 percent reduction in water use in 2015 to a 21 percent reduction in the current year. Going forward, we believe additional water savings initiatives across the company have the potential to reduce water use by over 30 million gallons per year, particularly through efficiency, recycling and reuse.
G4-2, G4-DMA, G4-EN6 35

2017 SCORECARDOur Global Footprint
EgyptKenyaSouth Africa
AFRICA
United StatesCanadaMexicoDominican RepublicPuerto RicoPanamaCosta Rica
NORTH AMERICA
Saudi ArabiaUnited Arab EmiratesChinaSouth KoreaHong KongPhilippinesMalaysia
ASIA
AUSTRALIA
NEW ZEALAND
United Kingdom
EUROPE
ColombiaEcuadorPeruUruguayArgentinaChile
SOUTH AMERICA
PLANTGLOBAL HEADQUARTERS
ADMINISTRATIVE/ SALES OFFICE
JOINT VENTURE
RESEARCH & DEVELOPMENT
G4-4, G4-5, G4-6, G4-8, G4-9, G4-10, G4-DMA, G4-LA12 36 The Clorox Company 2017 Integrated Annual Report

25+Country/Territory Operations
100+Markets Around the World
8,100+Employees
$6.0BNet Sales
NEW ZEALAND
Sales by Segment and Category*
34% Cleaning19% HOME CAREClorox® Pine-Sol® Tilex®
409®
Liquid-Plumr® Green Works®
9% LAUNDRY Clorox® Clorox2®
6% PROFESSIONAL PRODUCTSClorox Healthcare® Clorox Commercial Solutions®
33% Household14% BAGS, WRAPS & CONTAINERS Glad®
10% CHARCOAL Kingsford®
Match Light®
7% CAT LITTERFresh Step®
Scoop Away®
2% DIGESTIVE HEALTHRenewLife®
17% International9% LATIN AMERICA3% CANADA
2% AUSTRALIA/ NEW ZEALAND
3% REST OF WORLD
16% Lifestyle9% FOOD PRODUCTSHidden Valley®
Soy Vay®
KC Masterpiece®
4% NATURAL PERSONAL CAREBurt's Bees®
3% WATER FILTRATIONBrita®
* All percentages represent rounded numbers.
37G4-4, G4-5, G4-6, G4-8, G4-9, G4-10, G4-DMA, G4-EC1, G4-LA8, G4-LA12

See footnotes below for descriptions of these non-generally accepted accounting principles, or non-GAAP, measures, the reasons management believes they are useful to investors, and reconciliations to the most directly comparable financial measures calculated and presented in accordance with U.S. GAAP.
1. Reconciliation of EBIT
Dollars in millions FY15 FY16 FY17
Earnings from continuing operations before income taxes $ 921 $ 983 $ 1,033Interest income -4 -5 -4Interest expense 100 88 88
EBIT(i) — non-GAAP $ 1,017 $ 1,066 $ 1,117EBITmargin(i) — non-GAAP 18.0% 18.5% 18.7%Net sales $ 5,655 $ 5,761 $ 5,973
(i) EBIT represents earnings from continuing operations before income taxes, interest income and interest expense. EBIT margin is the ratio of EBIT to net sales. The company’s management believes these measures provide useful additional information to investors about trends in the company’s operations and are useful for period-over-period comparisons.
2. Reconciliation of Economic Profit (i)
Dollars in millions and all calculations based on rounded numbers FY15 FY16 FY17
Earnings from continuing operations before income taxes $ 921 $ 983 $ 1,033Add back: Noncash U.S. GAAP restructuring and intangible asset impairment charges 1 9 4Interest expense 100 88 88
Earnings from continuing operations before income taxes, noncash U.S. GAAP restructuring, intangible asset impairment charges and interest expense $ 1,022 $ 1,080 $ 1,125Less: Income taxes on earnings from continuing operations before income taxes, noncash U.S. GAAP restructuring, intangible asset impairment charges and interest expense (ii) 350 368 359Adjusted after-tax profit $ 672 $ 712 $ 766Average capital employed (iii) $ 2,385 $ 2,463 $ 2,680Less: Capital charge (iv) $ 214 $ 222 $ 241Economic profit (i) (adjusted after-tax profit less capital charge) $ 458 $ 490 $ 525
Performance
Net Sales($ Millions)
$5,973
FY17FY15
$5,655$5,761
FY16
$703
FY17FY15
$606
$648
FY16 FY17
$525
FY15
$458
$490
FY16
18.7%
FY17FY15
18.0%
18.5%
FY16
$871
FY17FY15
$858
$768
FY16
$640
FY17FY15
$733
$596
FY16
FY17
$5.35
FY15
$4.57
$4.92
FY16
$5,973
FY17FY15
$5,655$5,761
FY16
$703
FY17FY15
$606
$648
FY16 FY17
$525
FY15
$458
$490
FY16
18.7%
FY17FY15
18.0%
18.5%
FY16
$871
FY17FY15
$858
$768
FY16
$640
FY17FY15
$733
$596
FY16
FY17
$5.35
FY15
$4.57
$4.92
FY16Earnings From Continuing Operations Before Interest and Taxes Margin1
(as a % of Net Sales) (non-GAAP)
Achieving financial success while investing
for the long term.
38 The Clorox Company 2017 Integrated Annual Report G4-4, G4-5, G4-6, G4-8, G4-9, G4-10, G4-DMA, G4-EC1, G4-EN19

(i) Economic profit (EP) is defined by the Company as earnings from continuing operations before income taxes, excluding noncash U.S. GAAP restructuring and intangible asset impairment charges, and interest expense; less income taxes (calculated utilizing the Company’s effective tax rate), and less a capital charge (calculated as average capital employed multiplied by a cost of capital rate). EP is a key financial metric that the Company’s management uses to evaluate business performance and allocate resources, and is a component in determining employee incentive compensation. The Company’s management believes EP provides additional perspective to investors about financial returns generated by the business and represents profit generated over and above the cost of capital used by the business to generate that profit.
(ii) The tax rate applied is the effective tax rate on earnings from continuing operations, which was 34.2%, 34.1% and 31.9% in fiscal years 2015, 2016 and 2017, respectively.
(iii) Total capital employed represents total assets less noninterest-bearing liabilities. Adjusted capital employed represents total capital employed adjusted to add back current year after tax noncash U.S. GAAP restructuring and intangible asset impairment charges. Average capital employed is the average of adjusted capital employed for the current year and total capital employed for the prior year, based on year-end balances. See below for details of the average capital employed calculation:
Dollars in millions FY15 FY16 FY17
Total assets(v) $ 4,154 $ 4,510 $ 4,573Less: Accounts payable and accrued liabilities(vi) 976 1,032 1,002 Income taxes payable 31 — — Other liabilities(vi) 745 784 770 Deferred income taxes 61 82 95 Noninterest bearing liabilities 1,847 1,898 1,833Total capital employed 2,307 2,612 2,740After tax noncash U.S. GAAP restructuring and intangible asset impairment charges 1 6 2Adjusted capital employed $ 2,308 $ 2,618 $ 2,742Average capital employed $ 2,385 $ 2,463 $ 2,680
(iv) Capital charge represents average capital employed multiplied by a cost of capital rate, which was 9 percent for all fiscal years presented. The calculation of capital charge includes the impact of rounding numbers.
(v) Prior year amounts have been retrospectively adjusted to conform to the current year presentation of debt issuance costs required by ASU No. 2015-03, "Simplifying the Presentation of Debt Issuance Costs."
(vi) Accounts payable and accrued liabilities were combined into one financial statement line as of June 30, 2016. The change has been retrospectively applied to all periods presented. Accounts payable and accrued liabilities and Other Liabilities are adjusted to exclude interest-bearing liabilities.
3. Free cash flow is calculated as net cash provided by continuing operations less capital expenditures related to continuing operations and was $733 million, $596 million and $640 million for fiscal years 2015, 2016 and 2017, respectively. For fiscal years 2015, 2016 and 2017, net cash provided by continuing operations was $858 million, $768 million and $871 million, respectively, and capital expenditures were $125 million, $172 million and $231 million, respectively. The company’s management uses free cash flow and free cash flow as a percent of sales to help assess the cash generation ability of the business and funds available for investing activities, such as acquisitions, investing in the business to drive growth, and financing activities, including debt payments, dividend payments and share repurchases. Free cash flow does not represent cash available only for discretionary expenditures, since the Company has mandatory debt service requirements and other contractual and non-discretionary expenditures. In addition, free cash flow may not be the same as similar measures provided by other companies due to potential differences in methods of calculation and items being excluded.
Economic Profit2
(non-GAAP) ($ Millions)
Diluted Net Earnings Per Share From Continuing Operations
Earnings From Continuing Operations($ Millions)
$5,973
FY17FY15
$5,655$5,761
FY16
$703
FY17FY15
$606
$648
FY16 FY17
$525
FY15
$458
$490
FY16
18.7%
FY17FY15
18.0%
18.5%
FY16
$871
FY17FY15
$858
$768
FY16
$640
FY17FY15
$733
$596
FY16
FY17
$5.35
FY15
$4.57
$4.92
FY16
$5,973
FY17FY15
$5,655$5,761
FY16
$703
FY17FY15
$606
$648
FY16 FY17
$525
FY15
$458
$490
FY16
18.7%
FY17FY15
18.0%
18.5%
FY16
$871
FY17FY15
$858
$768
FY16
$640
FY17FY15
$733
$596
FY16
FY17
$5.35
FY15
$4.57
$4.92
FY16
$5,973
FY17FY15
$5,655$5,761
FY16
$703
FY17FY15
$606
$648
FY16 FY17
$525
FY15
$458
$490
FY16
18.7%
FY17FY15
18.0%
18.5%
FY16
$871
FY17FY15
$858
$768
FY16
$640
FY17FY15
$733
$596
FY16
FY17
$5.35
FY15
$4.57
$4.92
FY16
$5,973
FY17FY15
$5,655$5,761
FY16
$703
FY17FY15
$606
$648
FY16 FY17
$525
FY15
$458
$490
FY16
18.7%
FY17FY15
18.0%
18.5%
FY16
$871
FY17FY15
$858
$768
FY16
$640
FY17FY15
$733
$596
FY16
FY17
$5.35
FY15
$4.57
$4.92
FY16
$5,973
FY17FY15
$5,655$5,761
FY16
$703
FY17FY15
$606
$648
FY16 FY17
$525
FY15
$458
$490
FY16
18.7%
FY17FY15
18.0%
18.5%
FY16
$871
FY17FY15
$858
$768
FY16
$640
FY17FY15
$733
$596
FY16
FY17
$5.35
FY15
$4.57
$4.92
FY16
Net Cash Provided by Continuing Operations($ Millions)
Free Cash Flow3
(non-GAAP) ($ Millions)
39G4-4, G4-5, G4-6, G4-8, G4-9, G4-10, G4-DMA, G4-EC1, G4-EN19

1 The Willis Towers Watson global high-performance companies norm is based on responses from 142,506 employees at 26 companies. Companies qualify for the norm by meeting two criteria: 1) superior financial performance, defined by a net profit margin and/or return on invested capital that exceeds industry averages; and 2) superior human resources practices, defined by employee opinion scores near the top among the most financially successful companies surveyed by Willis Towers Watson.
2 Based on corporate benchmarking by Clorox, we consider a recordable incident rate of 1.0 or less to be world-class. Our FY17 RIR of .60 means that for every 100 Clorox employees, we averaged less than one reportable incident during the past year. According to the latest available data from the U.S. Bureau of Labor Statistics, the average RIR for goods-producing manufacturing companies is 3.7. The criteria used to determine RIR follows the U.S. Department of Labor’s Occupational Safety and Health Administration guidelines and is applied globally.
3 Benchmarking of Clorox performance on U.S. minority managers and employees is calculated using data from the 2010 Census.4 Past data on Clorox minority and female board members only counted independent board members. To facilitate comparisons to peer companies, Clorox now counts all board members when calculating its diversity data.5 “Missing Pieces Report: The 2016 Board Diversity Census of Women and Minorities on Fortune 500 Boards,” Deloitte and the Alliance for Board Diversity, 2017.6 For the calendar year ended Dec. 31, 2016. All sustainability metrics represent cumulative progress against CY 2011 baseline, with percentage based on net fiscal year customer sales. There are four types of sustainability improvement
criteria that can be met either by fully meeting one or partially meeting two or more: 1) a 5 percent or more reduction in product or packaging materials on a per-consumer-use basis; 2) an environmentally beneficial change to 10 percent or more of packaging or active ingredients on a per-consumer-use basis; 3) a 10 percent reduction in required usage of water or energy by consumer; or 4) an environmentally beneficial sourcing change to 20 percent or more of active ingredients or packaging on a per-consumer-use basis.
7 Financial equivalent of 115,000 volunteer hours, calculated at $24.14 per hour, based on the 2016 U.S. value of volunteer time from IndependentSector.org. Less than 5 percent of these hours are by employees outside the U.S., but all are calculated using the U.S. average rate. Reviewed by Ernst & Young LLP. Please refer to pages 52-53 for the Review Report.
Best-In-Class Employee Engagement1
88%Employee Engagement (vs. 80% for Peers, 85% for High-Performing Companies)
Diversity as a Business Strength
33%Minority Board Members (vs. 14% Fortune 500 Average)5
33%Female Board Members (vs. 20% Fortune 500 Average)5
36%Female Clorox Executive Committee Members
IN CORPORATE GOVERNANCE4
IN THE WORKFORCE
41%Global Female Nonproduction Managers
31%Ethnic Minorities Among U.S. Nonproduction Employees (vs. 32% U.S. Census Bureau)3
26%Ethnic Minorities Among U.S. Nonproduction Managers (vs. 30% U.S. Census Bureau)3
50%Global Female Nonproduction Employees
3%Incremental Sales From Product Innovation
34%Product Portfolio With Sustainability Improvements6
GOAL
50%By 2020
World-Class Workplace Safety2
.60Recordable Incident Rate (vs. World-Class Level <1.0)
ProductsInnovating and making responsible products,
responsibly.
PeopleEngaging our people as
business owners and promoting diversity and inclusion, opportunity
and respectful treatment.
40 The Clorox Company 2017 Integrated Annual Report G4-4, G4-5, G4-6, G4-8, G4-9, G4-10, G4-DMA, G4-EC1, G4-EN23, G4-LA12
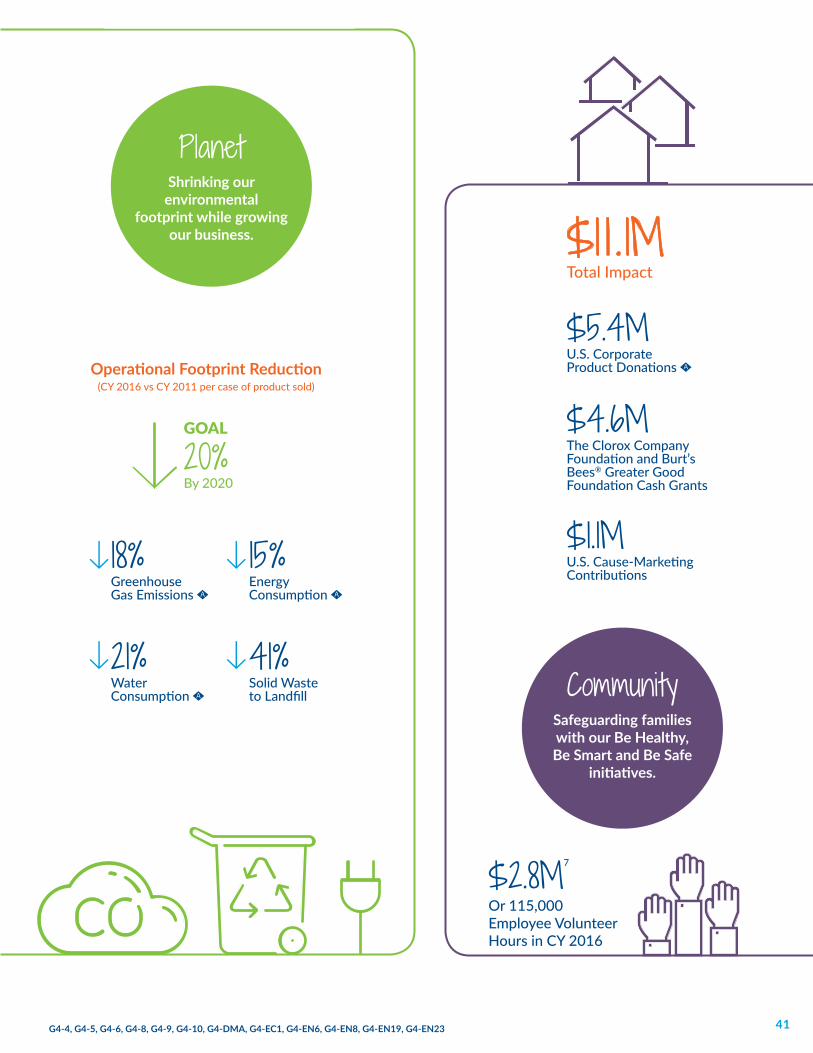
$4.6MThe Clorox Company Foundation and Burt’s Bees® Greater Good Foundation Cash Grants
$1.1MU.S. Cause-Marketing Contributions
$5.4MU.S. Corporate Product Donations
$1 1 .1MTotal Impact
18%Greenhouse Gas Emissions
15%EnergyConsumption
21%Water Consumption
41%Solid Wasteto Landfill
GOAL
20%By 2020
Operational Footprint Reduction (CY 2016 vs CY 2011 per case of product sold)
PlanetShrinking our
environmental footprint while growing
our business.
CommunitySafeguarding families with our Be Healthy, Be Smart and Be Safe
initiatives.
$2.8M7
Or 115,000 Employee Volunteer Hours in CY 2016
41G4-4, G4-5, G4-6, G4-8, G4-9, G4-10, G4-DMA, G4-EC1, G4-EN6, G4-EN8, G4-EN19, G4-EN23

COMPANY RECOGNITIONS
No. 1 Ranking No. 12 Ranking
Perfect Scores Since 2006
Inaugural Thomson Reuters Diversity and Inclusion Index:
Top 25 Publicly Traded Companies Globally
2017 Best Legal Departments
—Corporate Counsel Magazine
2017 All-America Executive Team (Investor Relations
Department)No. 1 Ranking, Beverage, Household and Personal
Care Sector—Institutional Investor
Best Campaign Award 2016 (Social Responsibility
Campaign, Clorox Puerto Rico)
42 The Clorox Company 2017 Integrated Annual Report

No. 7 Ranking: Best Places for Women &
Diverse Managers to Work
Talent Payback of the Year—SCM World
2017 Supply Chainnovator Award
for Consumer Products —Gartner Inc.
No. 12 Ranking—CR Magazine
2017100 Best Corporate
Citizens
CR’s
ILSA General Counsel Award for Best USA Legal Department:
Consumer Goods & Retail
Bay Area CFO of the Year Award, Large Public Company
Category (Steve Robb, Chief Financial Officer)—Larkin Street Youth Services
Top 100 Most Creative People in Business 2017
(Denise Garner, Chief Innovation Officer)
—Fast Company
43

BRAND RECOGNITIONS
Clorox:Family Circle Magazine’s Best of Cleaning Awards (Clorox Scentiva Multi-Surface Cleaner in Hawaiian Sunshine, U.S.)L2 Digital Report, No. 3 Ranking, Digitally Gifted (U.S.) CADEM Research Insight Innovation, Citizen Brand Studio 2017 and Relevant Brand 2017 (Chile)
RenewLife:Vitamin Retailer, 2017 Vity Award for Excellence, Specialty & Herbal Supplement — Fiber/Internal Cleanser Supplement (Total Body Cleanse, U.S.)Delicious Living Magazine, 2017 Delicious Living Supplement Award, Best Cleanse/Detox Category (3-Day Cleanse Total-Body Reset, U.S.) Taste for Life Magazine, 2016 Essentials Award, Gluten-Free Category (RenewLife Organic Clear Fiber™, U.S.)Better Nutrition Magazine, 2016 Best of Supplements Award — Detox & Cleansing (U.S.)
Better Nutrition 2016 BEST OF SUPPLEMENTS
WINNER!
44 The Clorox Company 2017 Integrated Annual Report

Soy Vay:Tumblr 9th Annual Shorty Award Finalist (U.S.)
Burt’s Bees:
Allure Best of Beauty Award 2016 Winner, (Best Natural Wonder — Burt’s Bees lipsticks; Best Sensitive Cleanser — Burt’s Bees sensitive cleanser, U.S.)L2 Digital Report, No. 19 Ranking of 63, Fast-Moving Consumer Goods Companies (U.K.)2017 Sunday Times Style Awards (Best Natural Beauty Brand, U.K.)2017 CEW Awards, Best New Make-Up product for lips (MASS) (Burt’s Bees lipsticks, U.K.)Seventeen 2017 Haul of Fame Award, Best Lip Balm (Burt’s Bees flavor crystals lip balm, U.S.) 2017 SELF Approved Beauty Awards, Best Eye Makeup Remover (Burt’s Bees Eye Makeup Remover Pads, U.S.) BrandSpark International’s Best New Product Awards, Lip Colour Category (Burt’s Bees lipsticks, Canada)The 2017 Elle Green Awards, (Burt’s Bees 100% Natural Lipstick, Australia)Natural Beauty Awards 2017, Best Face Exfoliant (Burt’s Bees Peach and Willowbark Deep Pore Scrub, Australia)InStyle Best Beauty Buys 2017, Lips (Burt’s Bees Lip Crayon, ANZ) and Reader’s Choice (Burt’s Bees Beeswax Lip Balm, Australia)
Clorinda:GFK Adimarc, Brand of Excellence 2017 (Chile)
Poett: Golden Pencil Advertising Award (Poett Fraganza — Spot: “Home,” Argentina)
45
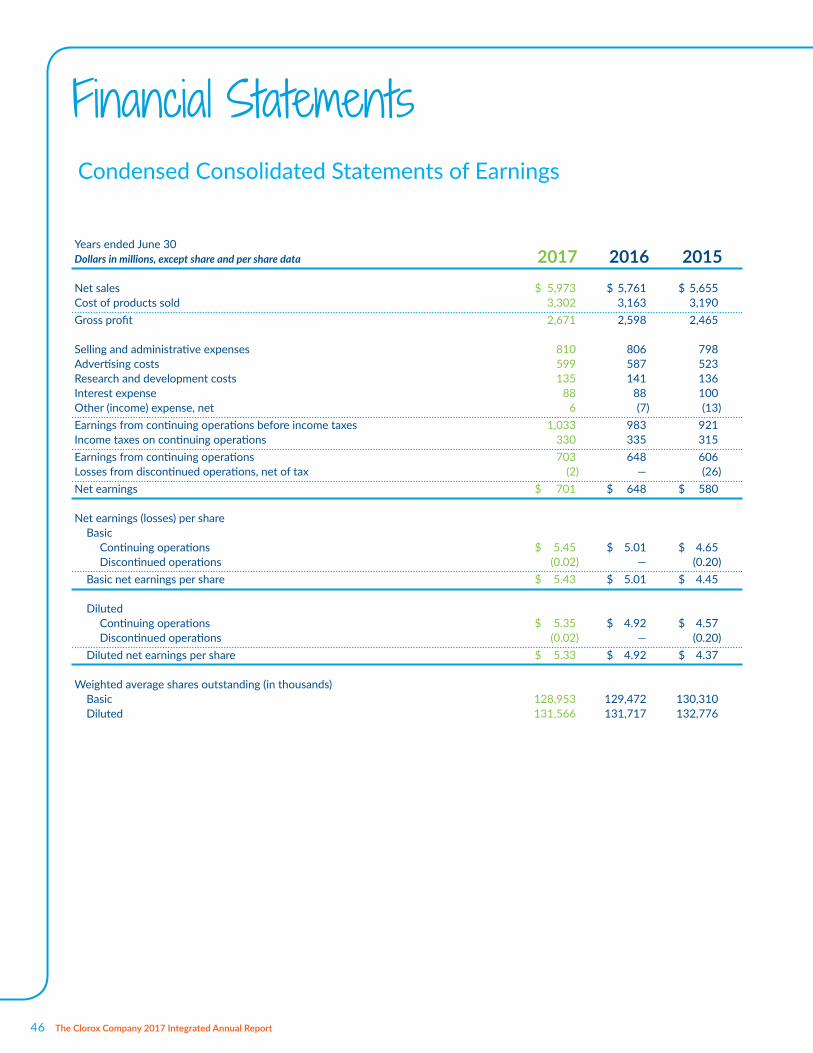
Years ended June 30Dollars in millions, except share and per share data 2017 2016 2015Net sales $ 5,973 $ 5,761 $ 5,655Cost of products sold 3,302 3,163 3,190 Gross profit 2,671 2,598 2,465
Selling and administrative expenses 810 806 798Advertising costs 599 587 523Research and development costs 135 141 136Interest expense 88 88 100 Other (income) expense, net 6 (7) (13)Earnings from continuing operations before income taxes 1,033 983 921Income taxes on continuing operations 330 335 315 Earnings from continuing operations 703 648 606Losses from discontinued operations, net of tax (2) — (26)Net earnings $ 701 $ 648 $ 580
Net earnings (losses) per share Basic Continuing operations $ 5.45 $ 5.01 $ 4.65 Discontinued operations (0.02) — (0.20) Basic net earnings per share $ 5.43 $ 5.01 $ 4.45
Diluted Continuing operations $ 5.35 $ 4.92 $ 4.57 Discontinued operations (0.02) — (0.20) Diluted net earnings per share $ 5.33 $ 4.92 $ 4.37
Weighted average shares outstanding (in thousands) Basic 128,953 129,472 130,310 Diluted 131,566 131,717 132,776
Condensed Consolidated Statements of Earnings
Financial Statements
46 The Clorox Company 2017 Integrated Annual Report

Years ended June 30Dollars in millions 2017 2016 2015Earnings from continuing operations $ 703 $ 648 $ 606Losses from discontinued operations, net of tax (2) — (26)Net earnings 701 648 580Other comprehensive income (losses): Foreign currency adjustments, net of tax (3) (53) (54) Net unrealized gains (losses) on derivatives, net of tax 7 9 (14) Pension and postretirement benefit adjustments, net of tax 23 (24) (17)Total other comprehensive income (losses), net of tax 27 (68) (85)Comprehensive income $ 728 $ 580 $ 495
Condensed Consolidated Statements of Comprehensive Income
Financial Statements
47

Years ended June 30Dollars in millions, except share and per share data 2017 2016ASSETS Current assets Cash and cash equivalents $ 418 $ 401 Receivables, net 565 569 Inventories, net 459 443 Prepaid expenses and other current assets 72 72 Total current assets 1,514 1,485
Property, plant and equipment, net 931 906Goodwill 1,196 1,197Trademarks, net 654 657Other intangible assets, net 68 78Other assets 210 187Total assets $ 4,573 $ 4,510
LIABILITIES AND STOCKHOLDERS’ EQUITY Current liabilities Notes and loans payable $ 404 $ 523 Current maturities of long-term debt 400 — Accounts payable and accrued liabilities 1,005 1,035 Income taxes payable — — Total current liabilities 1,809 1,558Long-term debt 1,391 1,789Other liabilities 770 784Deferred income taxes 61 82 Total liabilities 4,031 4,213Commitments and contingenciesStockholders’ equityPreferred stock: $1.00 par value; 5,000,000 shares authorized; none issued or outstanding — —Common stock: $1.00 par value; 750,000,000 shares authorized; 158,741,461 shares issued as of June 30, 2017 and 2016; and 129,014,172 and 129,355,263 shares outstanding as of June 30, 2017 and 2016, respectively 159 159Additional paid-in capital 928 868Retained earnings 2,440 2,163Treasury shares, at cost: 29,727,289 and 29,386,198 shares as of June 30, 2017 and 2016, respectively (2,442) (2,323)Accumulated other comprehensive net (losses) income (543) (570)Stockholders’ equity 542 297Total liabilities and stockholders’ equity $ 4,573 $ 4,510
Condensed Consolidated Balance Sheets
Financial Statements
48 The Clorox Company 2017 Integrated Annual Report

Condensed Consolidated Statements of Stockholders’ Equity
Financial Statements
Accumulated Other Common Stock Additional Treasury Shares Comprehensive Shares Paid-in Retained Shares Net (Losses) Dollars in millions (000) Amount Capital Earnings (000) Amount Income Total
Balance as of June 30, 2014 158,741 $159 $709 $1,739 (29,945) $(2,036) $(417) $ 154Net earnings 580 580Other comprehensive (loss) income (85) (85)Accrued dividends (391) (391)Stock-based compensation 32 32Other employee stock plan activities 34 (5) (4,198) 233 262Treasury stock purchased 4,016 (434) (434)
Balance as of June 30, 2015 158,741 159 775 1,923 (30,127) (2,237) (502) 118Net earnings 648 648Other comprehensive (loss) income (68) (68)Accrued dividends (406) (406)Stock-based compensation 45 45Other employee stock plan activities 48 (2) 2,892 168 214Treasury stock purchased (2,151) (254) (254)
Balance as of June 30, 2016 158,741 159 868 2,163 (29,386) (2,323) (570) 297Net earnings 701 701Other comprehensive income (loss) 27 27Accrued dividends (421) (421)Stock-based compensation 51 51Other employee stock plan activities 9 (3) 1,164 70 76Treasury stock purchased (1,505) (189) (189)
Balance as of June 30, 2017 158,741 $159 $928 $2,440 (29,727) $(2,442) $(543) $542
49
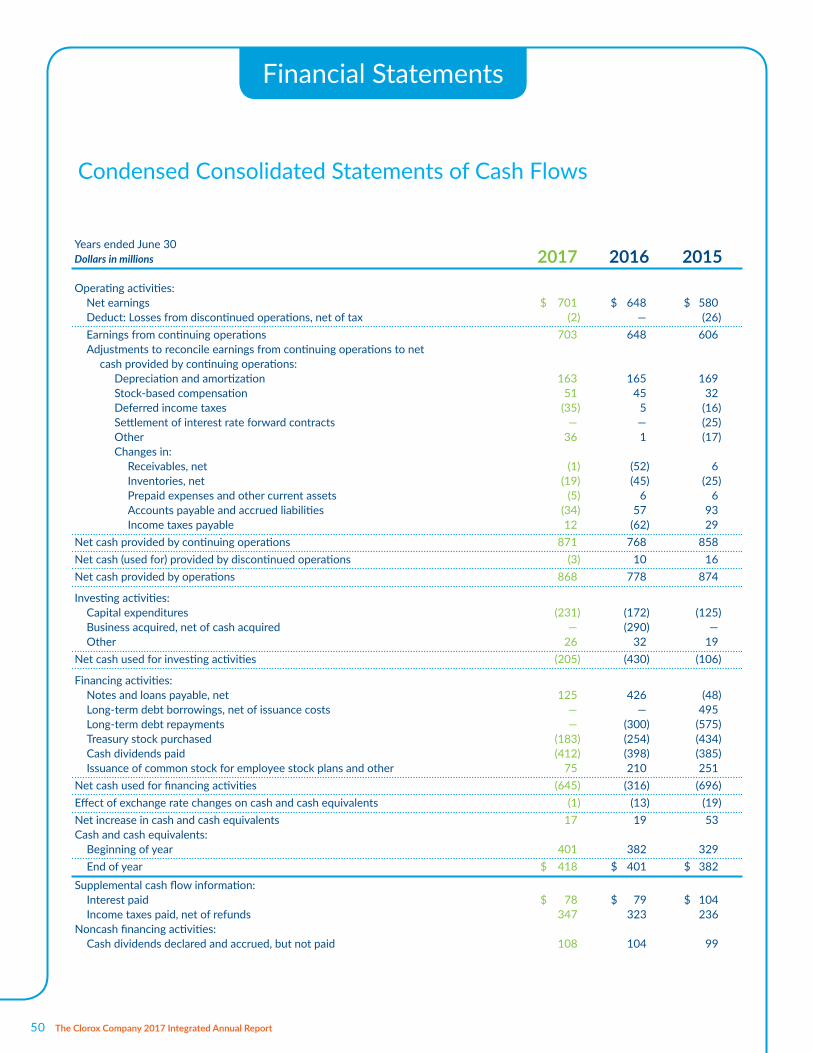
Years ended June 30Dollars in millions 2017 2016 2015Operating activities: Net earnings $ 701 $ 648 $ 580 Deduct: Losses from discontinued operations, net of tax (2) — (26) Earnings from continuing operations 703 648 606 Adjustments to reconcile earnings from continuing operations to net cash provided by continuing operations: Depreciation and amortization 163 165 169 Stock-based compensation 51 45 32 Deferred income taxes (35) 5 (16) Settlement of interest rate forward contracts — — (25) Other 36 1 (17) Changes in: Receivables, net (1) (52) 6 Inventories, net (19) (45) (25) Prepaid expenses and other current assets (5) 6 6 Accounts payable and accrued liabilities (34) 57 93 Income taxes payable 12 (62) 29Net cash provided by continuing operations 871 768 858Net cash (used for) provided by discontinued operations (3) 10 16Net cash provided by operations 868 778 874
Investing activities: Capital expenditures (231) (172) (125) Business acquired, net of cash acquired — (290) — Other 26 32 19Net cash used for investing activities (205) (430) (106)
Financing activities: Notes and loans payable, net 125 426 (48) Long-term debt borrowings, net of issuance costs — — 495 Long-term debt repayments — (300) (575) Treasury stock purchased (183) (254) (434) Cash dividends paid (412) (398) (385) Issuance of common stock for employee stock plans and other 75 210 251Net cash used for financing activities (645) (316) (696)Effect of exchange rate changes on cash and cash equivalents (1) (13) (19)Net increase in cash and cash equivalents 17 19 53Cash and cash equivalents: Beginning of year 401 382 329 End of year $ 418 $ 401 $ 382Supplemental cash flow information: Interest paid $ 78 $ 79 $ 104 Income taxes paid, net of refunds 347 323 236Noncash financing activities: Cash dividends declared and accrued, but not paid 108 104 99
Condensed Consolidated Statements of Cash Flows
Financial Statements
50 The Clorox Company 2017 Integrated Annual Report

Report of Independent Registered Public Accounting Firm on Condensed Financial Statements
THE BOARD OF DIRECTORS AND STOCKHOLDERS OF THE CLOROX COMPANY
We have audited, in accordance with the standards of the Public Company Accounting Oversight Board (United States), the consolidated balance sheets of The Clorox Company at June 30, 2017 and 2016 and the related consolidated statements of earnings, comprehensive income , stockholders’ equity and cash flows for each of the three years in the period ended June 30, 2017 (not presented separately herein) and in our report dated August 15, 2017, we expressed an unqualified opinion on those consolidated financial statements. In our opinion, the information set forth in the accompanying condensed consolidated financial statements as of June 30, 2017 and 2016 and for each of the three years in the period ended June 30, 2017 (presented on pages 46 through 50) is fairly stated, in all material respects, in relation to the consolidated financial statements from which it has been derived. We also have audited, in accordance with the standards of the Public Company Accounting Oversight Board (United States), the effectiveness of The Clorox Company’s internal control over financial reporting as of June 30, 2017, based on criteria established in Internal Control — Integrated Framework issued by the Committee of Sponsoring Organizations of the Treadway Commission (2013 framework), and our report dated August 15, 2017 (not presented separately herein).
San Francisco, CAAugust 15, 2017
51G4-33

Report of Independent Accountants on Review of Nonfinancial Information
THE BOARD OF DIRECTORS AND STOCKHOLDERS OF THE CLOROX COMPANY
We have reviewed selected quantitative performance indicators (the “Subject Matter”) included in Exhibit A and as identified by the “ ” symbol presented in The Clorox Company’s (“Clorox” or “the Company”) Annual Report and Executive Summary (the “Reports”) for the year ended June 30, 2017 or otherwise noted, in accordance with the criteria also set forth in Exhibit A (the “Criteria”). We did not review all information included in the Reports. We did not review the narrative sections of the Reports, except where they incorporated the Subject Matter. Clorox’s management is responsible for the Subject Matter included in Exhibit A and as also presented in the Reports, in accordance with the Criteria. Our responsibility is to express a conclusion on the Subject Matter based on our review.
Our review was conducted in accordance with attestation standards established by the American Institute of Certified Public Accountants. Those standards require that we plan and perform our review to obtain limited assurance about whether any material modifications should be made to the Subject Matter in order for it to be in accordance with the Criteria. A review consists principally of applying analytical procedures, making inquiries of persons responsible for the subject matter, obtaining an understanding of the data management systems and processes used to generate, aggregate and report the Subject Matter and performing such other procedures as we considered necessary in the circumstances. A review is substantially less in scope than an examination, the objective of which is to obtain reasonable assurance about whether the Subject Matter, is in accordance with the Criteria, in all material respects, in order to express an opinion. Accordingly, we do not express such an opinion. A review also does not provide assurance that we became aware of all significant matters that would be disclosed in an examination. We believe that our review provides a reasonable basis for our conclusion.
As described in Exhibit A, the Subject Matter is subject to measurement uncertainties resulting from limitations inherent in the nature and the methods used for determining such data. The selection of different but acceptable measurement techniques can result in materially different measurements. The precision of different measurement techniques may also vary.
Based on our review, we are not aware of any material modifications that should be made to the selected quantitative performance indicators for the year ended June 30, 2017 or otherwise noted, in order for it to be in accordance with the Criteria.
San Francisco, CASeptember 22, 2017
52 The Clorox Company 2017 Integrated Annual Report G4-33

Exhibit A: Schedule of Selected Quantitative Performance Indicators — The Clorox Company
Indicator Name Scope Unit Value 1 Criteria
Scope 1, 2, and 3 greenhouse gas (GHG) emissions2, 3, 4, 5, 6
Global Percentage reduction of tCO2e per stat case sold over baseline year (2011)7
-18% The World Resources Institute (“WRI”) / World Business Council for Sustainable Development’s (“WBCSD”) Greenhouse Gas (“GHG”) Protocol Corporate Accounting and Reporting Standard, the GHG Protocol Scope 2 Guidance and the GHG Protocol Corporate Value Chain (Scope 3) Standard
Energy consumption, Scope 1 and 22, 3, 4, 5
Global Percentage reduction of MWh per stat case sold over baseline year (2011)7
-15% WRI/WBCSD’s GHG Protocol Corporate Accounting and Reporting Standard, the GHG Protocol Scope 2 Guidance
Water consumption2, 4
Global Percentage reduction of gallons of water consumed per stat case sold over baseline year (2011)7
-21% Management’s criteria as follows: Water consumption includes water at all global manufacturing sites, offices and research development centers used in 1) products sold to customers, 2) the manufacturing process, 3) irrigation and 4) water consumed by employees during office hours for personal needs (e.g., restrooms, break rooms). Water sources include city/municipal, well, lake, river and stormwater.
Sustainability improvements to product portfolio since January 20128
Global Percentage of product portfolio 34% Management’s criteria as follows: There are four types of sustainability improvement criteria that can be met either by fully meeting one or by partially meeting two or more: 1) a 5 percent or more reduction in product or packaging materials on a per-consumer-use basis; 2) an environmentally beneficial change to 10 percent or more of packaging or active ingredients on a per-consumer-use basis; 3) a 10 percent reduction in required usage of water or energy by consumer; or 4) an environmentally beneficial sourcing change to 20 percent or more of active ingredients or packaging on a per-consumer-use basis.
Workforce demographics/diversity metrics9
See right for metric scope
Percentage minority nonproduction employees in U.S. 31% OSHA Regulation 1920.2(d) defines “Employee” as an individual who is employed in a business of his employer which affects commerce. The Equal Employment Opportunity Commission defines “Minority” as any race that is not white (Asian; Black; Latino; Native American; Native Hawaiian; or Two or More).
Management’s criteria as follows: “Manager” is defined as an “employee” at Grade 27 or above for U.S. employees and Grade 26 or above for international employees with regards to Clorox’s Human Resources (HR) compensation structure. “Production Employee” is defined as an employee at Grade 19 or below with regards to Clorox’s HR compensation structure (international and U.S.). “Nonproduction Employee” is defined as an employee at Grade 20 or above with regards to Clorox’s HR compensation structure (international and U.S.). In certain circumstances, nonproduction employees may be classified below Grade 20 based on type of work performed.
Percentage minority nonproduction managers in U.S. 26%
Percentage female nonproduction employees globally 50%
Percentage female nonproduction managers globally 41%
Percentage female Board of Directors 33%
Percentage minority Board of Directors 33%
Percentage female Executive Committee members 36%
U.S. product donations10
U.S. only
Fair market value of products donated in U.S. dollars $5.4 million
Management’s criteria as follows: U.S. product donations refer to those donations used to aid in disaster relief or to support schools, food banks, and other nonprofit organizations. Fair market value is derived from current year average truckload price of the product donated. Truckload prices are based on volume ordered and shipped.
Total recordable inci-dent rate11
Global Recordable incident rate (RIR) 0.60 Occupational Health and Safety Administration (OSHA) Regulation (Standards – 29 CFR) Part 1904 “Recording and Reporting Occupational Injuries and Illness”
Employee engagement score12
Global Percentage of employee engagement 88% Management’s criteria as follows: Engagement is defined as the intensity of employees’ connection to Clorox, marked by committed effort to achieve work goals (‘being engaged’) in environments that support productivity (‘being enabled’) and maintain personal well-being (‘feeling energized’).
Note 1: Nonfinancial information is subject to measurement uncertainties resulting from limitations inherent in the nature and the methods used for determining such data. The selection of different but acceptable measurement techniques can result in materially different measurements. The precision of different measurement techniques may also vary.
1 All percentages are rounded to the nearest whole number in the annual report. 2 For all locations where Clorox maintains operational control and for the calendar year ended Dec. 31, 2016. 3 Scope 1 emissions include direct energy used by Clorox in its operations, categorized by stationary combustion, mobile combustion, refrigerant use, direct VOC loss and direct wood pyrolysis. The last two
sources relate mainly to Clorox’s Kingsford business unit, and wood pyrolysis is considered to be a mostly carbon neutral process; therefore, CO2 emissions from wood pyrolysis are not included in total tCO2e, but CO2 equivalent emissions from CH4 and N2O are included. Natural gas emissions, the largest Scope 1 emission source, are calculated using factors from EPA Mandatory GHG Reporting for Stationary Fuel Sources (June 2017) and Global Warming Potential (GWP) rates from the Intergovernmental Panel on Climate Change’s (IPCC) Fourth Assessment Report.
4 Clorox’s natural gas, electricity and municipal water consumption data for U.S. sites are tracked by Clorox’s third-party utility management company. Other sources of energy and water consumption in the U.S. are tracked manually on a site-by-site basis and reported to Clorox’s corporate team on an annual basis. For international sites, all energy and water consumption data is tracked manually and reported annually to Clorox’s corporate team.
5 Scope 2 includes indirect emissions resulting from Clorox’s purchased electricity use. It is calculated following the GHG Protocol’s location-based method using the Environmental Protection Agency’s (EPA) 2014 eGRID emission factors for U.S. locations and the Energy Information Administration’s (EIA) Foreign Electricity Emission Factors published in 2007 for international locations. Clorox applies GWPs from the IPCC’s Fourth Assessment Report.
6 Scope 3 includes finished goods transportation in the U.S. only and global employee business travel. Employee business travel includes emissions from commercial air flights and rental car use by Clorox’s employees. Commercial air flights are limited to business travel booked in the United States, United Kingdom, Hong Kong, Chile, Mexico, Peru and Canada. Mobile emission sources are calculated using emission factors from the EPA Climate Leaders Greenhouse Gas Inventory Protocol Core Module Guidance, published in 2008.
7 A stat case is the number of cases sold or produced multiplied by a stat factor which normalizes case value between brands and provides a common denominator of the revenue generated by cases across various brands.
8 Once a product meets the sustainability improvement criteria, it is reported to the Clorox Eco Team by each business unit and the sustainability improvement percentage is calculated for that product using its fiscal year net customer sales as a percentage of Clorox’s total fiscal year net customer sales. The total sustainability improvements percentage represents the summation of all sustainability improvement percentages for products that met the criteria between Jan. 1, 2012, and Dec. 31, 2016.
9 For the fiscal year ended June 30, 2017. 10 For the fiscal year ended June 30, 2017. U.S. product donations include donations made by any U.S. business unit. 11 Recordable incident rate was determined as of July 20, 2017, for the fiscal year ended June 30, 2017. The recordable incident rate includes all reportable incidents that occurred at Clorox facilities
globally. It does not include labor hours associated with nine remote facilities that have fewer than 30 employees. 12 Clorox adopts Willis Towers Watson’s definition of employee engagement in terms of “sustainable” engagement. Employee engagement is measured by a survey administered March 13, 2017, through
March 31, 2017. 6,219 Clorox employees responded to the survey.
53

Corporate GovernanceGuided by our core value of doing the right thing, Clorox maintains rigorous corporate governance practices and internal controls, with oversight from the company’s board of directors as well as the chairman and chief executive officer, general counsel, chief financial officer and other members of the Clorox Executive Committee.
The Clorox Code of Conduct details the ethical and legal standards of behavior and business practices that are required of all our directors, executives and employees around the world. All 8,100+ individuals must complete training and/or certify compliance with the code.
We expect any organization that works with Clorox to mirror our values and business practices regarding legal and regulatory compliance, product quality, safety, human rights and treatment of employees. Before contracting with new business partners, we conduct a comprehensive assessment of capabilities, quality and safety standards, ethics and alignment with our strategy and core values to ensure they meet the ideals we’ve established for ourselves as a company.
On an ongoing basis, we also require key business partners to adhere to our Business Partner Code of Conduct. This code outlines expected practices of direct suppliers of goods, service providers, consultants, distributors, licensees, joint ventures, contractors and temporary workers in the areas of human rights and labor, health and safety, the environment, and business conduct and ethics.
All data as of June 30, 2017.
33%Of Board AreWOMEN
33%Of Board AreMINORITIES
36%Of Clorox Executive Committee AreWOMEN
Reviewed by Ernst & Young LLP. Please refer to pages 52-53 for the Review Report.
54 The Clorox Company 2017 Integrated Annual Report G4-34, G4-35, G4-36, G4-39, G4-SO4

Corporate Governance Board of Directors
Benno Dorer1
Chairman and Chief Executive Officer, The Clorox Company
Amy Banse3
Managing Director and Head of Funds, Comcast Ventures
Richard H. Carmona, M.D., M.P.H., F.A.C.S.Vice Chairman, Canyon Ranch; former U.S. Surgeon General
Spencer C. FleischerManaging Partner, FFL Partners
Jeffrey NoddleRetired Executive Chairman, SuperValu Inc.
Pamela Thomas-Graham2
Lead Director of the Board; Former Chief Marketing and Talent Officer, Credit Suisse Group AG
Carolyn M. TicknorRetired President, Imaging & Printing Systems, Hewlett-Packard Company
Christopher J. WilliamsChairman and Chief Executive Officer, The Williams Capital Group L.P. and Williams Capital Management LLC
Esther LeeExecutive Vice President — Global Chief Marketing Officer, MetLife Inc.
David Mackay4
Retired President and Chief Executive Officer, Kellogg Company
Robert W. MatschullatRetired Vice Chairman and Chief Financial Officer, The Seagram Company Ltd.
Russell J. Weiner5
President, Domino’s USA
The 2017 fiscal year brought changes to board leadership and membership. Along with the appoint-ment of Clorox CEO Benno Dorer to the role of chairman, Pamela Thomas-Graham was named the new independent lead director, making her one of only a select few minority women — approximately 1 percent overall — serving as lead directors on Fortune 500 boards nationwide. We also added
three new directors over the course of the year: Dave Mackay, who brings deep operational and strategic experience in the consumer packaged goods industry; Amy Banse, who has an extensive background in media, digital and telecommunica-tions; and Russell Weiner, an innovator in the digi-tal consumer experience.
1 Mr. Dorer became chairman of the board of directors effective Aug. 15, 2016.2 Ms. Thomas-Graham was appointed lead director of the board effective Aug. 15, 2016.3 Ms. Banse joined the board of directors effective Sept. 15, 2016.4 Mr. Mackay joined the board of directors effective Aug. 15, 2016.5 Mr. Weiner joined the board of directors effective Feb. 6, 2017.
G4-34, G4-35, G4-36, G4-39, G4-SO4 55

Clorox Executive CommitteeThe Clorox Executive Committee expanded at the onset of the 2017 fiscal year with the appointment of two new people to senior leadership. Now at 14 members, the management team brings a diverse set of experiences and backgrounds to Clorox — some promoted from within the Clorox ranks, others with valuable consumer packaged goods industry experience, and still others with deep experience in their area of expertise from the financial services, hospitality and tech sectors. Additionally, women make up 36 percent of the CEC, serving in the key roles of chief operating officer, general counsel, chief innovation officer and chief people officer. This leadership mix enables the company to provide the strategic direction necessary to succeed in a challenging business environment.
Kirsten MarrinerSenior Vice President and Chief People Officer
Eric ReynoldsSenior Vice President and Chief Marketing Officer
Manjit Singh Senior Vice President and Chief Information Officer
Benno DorerChairman and Chief Executive Officer
Linda Rendle Senior Vice President and General Manager — Cleaning Division
William S. BaileySenior Vice President — Corporate Business Development
James FosterExecutive Vice President — Product Supply, Enterprise Performance and IT
Denise A. GarnerSenior Vice President and Chief Innovation Officer
Michael CostelloSenior Vice President — International Division
Jon BalousekSenior Vice President and General Manager — Specialty Division
Matt LaszloSenior Vice President and Chief Customer Officer
Laura SteinExecutive Vice President — General Counsel and Corporate Affairs
Dawn WilloughbyExecutive Vice President and Chief Operating Officer
Steve RobbExecutive Vice President and Chief Financial Officer
Standing from left to right: Seated from left to right:
56 The Clorox Company 2017 Integrated Annual Report G4-34, G4-35, G4-36, G4-39, G4-SO4

Priorities and MatrixOur corporate responsibility priorities are based on an exercise conducted in fiscal year 2016 to help us focus our attention on the company’s most important issues. We are using the term “corporate responsibility priorities” instead of “materiality topics” to avoid confusion with the term as it relates to key information that can impact financial statements.
The priorities and accompanying matrix were developed with support from a third party, capturing key inputs from the company’s 2020 Strategy, which includes corporate responsibility commitments, as well as feedback from employees and numerous external stakeholders.
Transparency
Product Innovation
Governance and AccountabilityProduct Impacts
Packaging
Water
Stakeholder Engagement
Operational Environmental
Impact
Employee Well-Being and Development
Supplier Operations
Risk and Resilience
Material SourcingResponsible Marketing and Consumer Engagement
Climate ChangeInclusion and Diversity
Product Benefits
Philanthropy/Cause Programs
Corporate Responsibility Priorities*
IMPORTANCE TO BUSINESS HIGHERHIGH
HIG
HIM
PORT
AN
CE T
O E
XTER
NA
L ST
AKE
HO
LDER
SH
IGH
ER
*Demonstrates relative importance of topics with respect to each other and not a reflection of overall importance of topics.
Corporate Responsibility PrioritiesClorox Executive Committee
57G4-19, G4-20, G4-21, G4-24, G4-27, G4-28, G4-29, G4-30, G4-31, G4-32, G4-33

About This ReportCorporate Responsibility Priorities The Clorox Company’s integrated annual report presents the company’s financial and corporate responsibility performance for fiscal year 2017 as well as our goals for 2020. It highlights fiscal year financial performance in accordance with Generally Accepted Accounting Principles in the U.S., which include principles for determining materiality related to financial reporting. Also presented in this report is information about performance related to the company’s corporate responsibility priorities. Key corporate responsibility priorities may include, but are not limited to, topics that could have a significant financial impact on the organization.
Review of Nonfinancial Information We believe voluntary assurance strengthens our reporting process and enhances the credibility of our nonfinancial information. We engage a third party to review the following nonfinancial key performance indicators: U.S. greenhouse gas emissions, U.S. energy consumption, global water consumption, product sustainability improvements, workforce demographics, recordable incident rate, employee engagement and U.S. product donations. Items undergoing assurance are indicated with an throughout the report. We will continue to look for opportunities to provide external review of metrics that provide further insight into how we create value for all our stakeholders.
Using the Global Reporting Initiative Framework This year’s report has been developed according to the Global Reporting Initiative’s G4 guidelines, in accordance with the “core” option, which provide a recommended framework and key performance indicators for sustainability reporting. More information on the G4 guidelines is available at globalreporting.org. The full list of GRI disclosures we address can be found on pages 59-68 of this report and on our corporate website, TheCloroxCompany.com.
Reporting Against the UNGC PrinciplesIncorporated into the GRI G4 Content Index is the Communication on Progress, an annual report describing the company’s actions in implementing the Ten Principles of the United Nations Global Compact.
Reporting Period and Boundary Most data in this report covers wholly and majority-owned operations for July 1, 2016, through June 30, 2017. In some instances, we have included data for a multiyear period to show year-over-year comparisons. Data in this report for environmental sustainability and volunteer hours is for the period of Jan. 1, 2016, through Dec. 31, 2016, and is global unless otherwise stated.
58 The Clorox Company 2017 Integrated Annual Report G4-18, G4-23, G4-29, G4-30, G4-32, G4-33

GRI G4 Content IndexGENERAL STANDARD DISCLOSURES PAGE
EXTERNAL ASSURANCE
UNGC PRINCIPLES DESCRIPTION
STRATEGY AND ANALYSIS
G4-1 CEO Letter, pages 2-5 CEO Letter reinforces Clorox's commitment to the UN Global Compact Ten Principles.
CEO statement on sustainability
G4-2 2020 Strategy Overview and Progress, pages 18-35; 10-K: Item 1.A. Risk Factors, pages 6-17
See pages 52-53 Key impacts, risks, and opportunities
ORGANIZATIONAL PROFILE
G4-3 The Clorox Company Name of organization
G4-4 2017 Scorecard, pages 36-41; 10-K: Item: Overview of Business, pages 1-2
See pages 52-53 Primary brands, products and services
G4-5 2017 Scorecard, pages 36-41 See pages 52-53 Location of organization’s headquarters
G4-6 2017 Scorecard, pages 36-41 See pages 52-53 Number of countries where the organization operates, and countries with major operations or relevant to sustainability issues
G4-7 Form 10-K Cover Nature of ownership and legal form
G4-8 2017 Scorecard, pages 36-41 See pages 52-53 Markets served
G4-9 2017 Scorecard, pages 36-41 See pages 52-53 Scale of reporting organization
G4-10 2017 Scorecard, pages 36-41
Clorox Website: Inclusion & Diversity
See pages 52-53 Employees by employment contract and gender
G4-11 U.S.: 2%, International: 22.7%, Total Company: 9.1%
Principle 3 Percentage of employees covered by collective bargaining agreements
G4-12 Clorox’s supply chain reflects the company as a formulator (not a chemical company) with a broad portfolio of products. Raw material inputs are quite varied. For more information go to: Clorox Website: Sustainability in Our Supply Chain
UNGC Ten Principles — The Clorox Company Business Partner Code of Conduct includes our expectations of suppliers on business ethics, human rights, labor and environmental compli-ance and sustainability.
Description of supply chain
G4-13 There are no significant changes to size, structure and ownership during the reporting period.
Significant changes to size, structure, or ownership
G4-14 Clorox Website: What We’re Made Of
Principle 7 Whether and how the precautionary approach or principle is addressed
G4-15 CDP, UNGC — See CEO Letter, pages 2-5, IIRC, AIM Progress
UNGC Ten Principles Externally developed economic, environmental and social charters, principles, or initiatives the organization subscribes or endorses
G4-16 Clorox Website: Stakeholder Engagement
UNGC Principles 7-9 (See Responsible Sourcing Information)
Association memberships
General Standard Disclosures
59

GRI G4 Content Index
GENERAL STANDARD DISCLOSURES PAGE
EXTERNAL ASSURANCE
UNGC PRINCIPLES DESCRIPTION
IDENTIFIED MATERIAL ASPECTS AND BOUNDARIES
G4-17 10-K, Part I, pages 1-3 Entities included in consolidated financial statements and if any are not in report
G4-18 About This Report, page 58 Process to define report content and aspect boundaries. How implemented Defining Report Content principles
G4-19 Corporate Responsibility Priorities, page 57
UNGC Principles 1-10 Material aspects
G4-20 Corporate Responsibility Priorities, page 57
Material aspects within the organization
G4-21 Corporate Responsibility Priorities, page 57
Material aspects outside the organization
G4-22 No restatements occurred Effect of restatements
G4-23 About This Report, page 58 Significant changes from previous reporting period
STAKEHOLDER ENGAGEMENT
G4-24 Corporate Responsibility Priorities, page 57
Clorox Website: Stakeholder Engagement
Stakeholder groups engaged by the organization
G4-25 Clorox Website: Stakeholder Engagement
How stakeholders are identified and selected
G4-26 Clorox Website: Stakeholder Engagement
Approaches to stakeholder engagement, including frequency of engagement by type and by stakeholder group
G4-27 Corporate Responsibility Priorities, page 57
Clorox Website: Stakeholder Engagement
Key concerns raised through stakeholder engagement, and how the organization responded
REPORT PROFILE
G4-28 About This Report, page 58 Reporting period
G4-29 About This Report, page 58 Date of most recent report
G4-30 About This Report, page 58 Reporting cycle
G4-31 [email protected]
Contact for sustainability report
G4-32 About This Report, page 58 GRI content index
G4-33 About This Report, page 58
Report of Independent Registered Accounting Firm, pages 51-52
Assurance
General Standard Disclosures
60 The Clorox Company 2017 Integrated Annual Report

GENERAL STANDARD DISCLOSURES PAGE
EXTERNAL ASSURANCE
UNGC PRINCIPLES DESCRIPTION
GOVERNANCE
G4-34 Corporate Governance, pages 54-56Clorox Website: Governance Guidelines
UNGC Ten Principles Governance structure
G4-35 Corporate Governance, pages 54-56Clorox Website: Eco Governance
Principles 7-9 Process for delegating authority
G4-36 Corporate Governance, pages 54-56
Whether organization appointed executive level position(s) with responsibility for economic, environmental and social topics and whether post holders report directly to the highest governance body
G4-37 Clorox Website: Board of Directors
Consultation between stakeholders and the highest governance body on sustainability issues
G4-38 Clorox Website: Corporate Governance
Details on composition of highest governance body and its committees
G4-39 Corporate Governance, pages 54-56
Whether Chair of highest governance body is also an executive officer
G4-40 Clorox Website: NGCRC Charter May 2017
Nomination and selection processes for highest governance body and its committees
G4-41 Clorox Website: Governance Guidelines
Principle 10 Process for highest governance body to avoid and manage conflicts of interest
G4-42 Clorox Website: Governance Guidelines
UNGC Ten Principles Highest governance body’s role in setting purpose, values and strategy
G4-43 Clorox Website: Governance Guidelines
UNGC Ten Principles Process for enhancing highest governance body’s competencies on economic, environmental, and social issues
G4-44 Clorox Website: Governance Guidelines
UNGC Ten Principles Process for evaluating highest governance body’s performance on economic, environmental, social topics
G4-45 Clorox Website: Governance Guidelines
UNGC Ten Principles Highest governance body’s role in risk management
G4-46 Clorox Website: Governance Guidelines
UNGC Ten Principles Highest governance body’s role in the identification and management of economic, environmental and social impacts, risks and opportunities
G4-47 The Clorox board of directors meets at least quarterly to review key issues/opportunities impacting the company.
UNGC Ten Principles Frequency of the highest governance body’s review of economic, environmental and social impacts, risks and opportunities
G4-48 Clorox's CEO, CFO and General Counsel approve our integrated report.
Highest committee or position that formally reviews and approves the organization’s sustainability report
G4-49 Clorox Website: Governance Guidelines
Process for communicating critical concerns to the highest governance body
GRI G4 Content Index
General Standard Disclosures
61
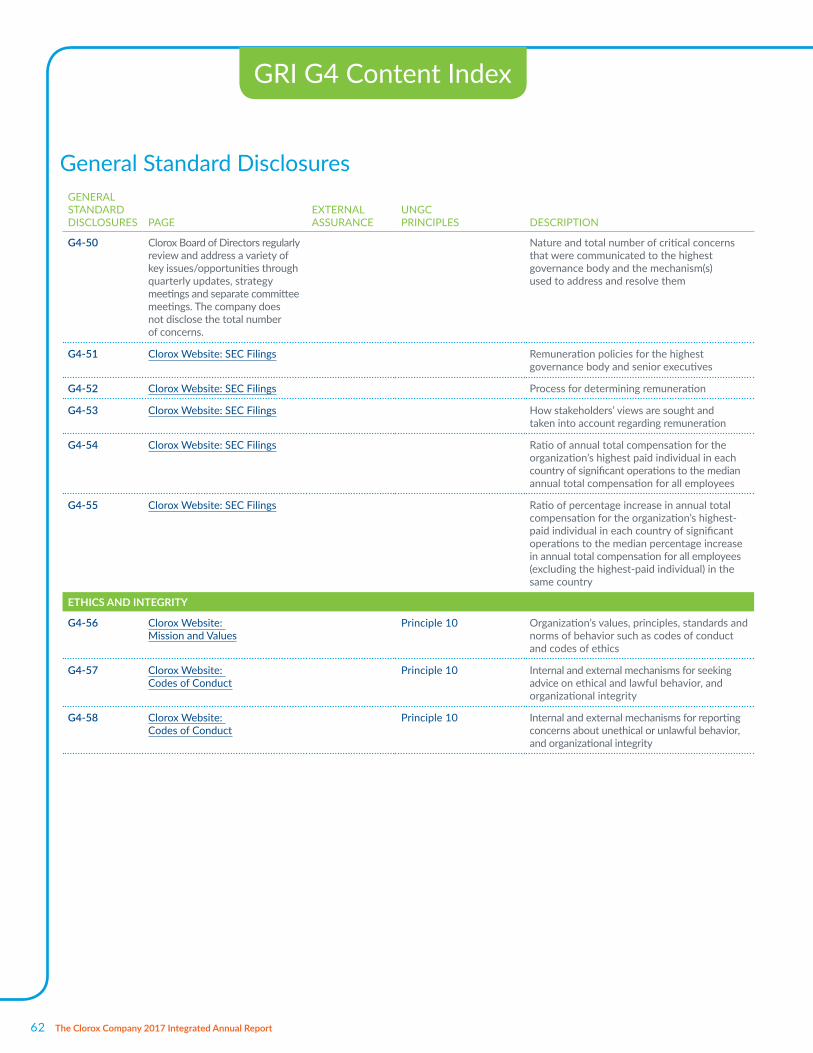
GENERAL STANDARD DISCLOSURES PAGE
EXTERNAL ASSURANCE
UNGC PRINCIPLES DESCRIPTION
G4-50 Clorox Board of Directors regularly review and address a variety of key issues/opportunities through quarterly updates, strategy meetings and separate committee meetings. The company does not disclose the total number of concerns.
Nature and total number of critical concerns that were communicated to the highest governance body and the mechanism(s) used to address and resolve them
G4-51 Clorox Website: SEC Filings Remuneration policies for the highest governance body and senior executives
G4-52 Clorox Website: SEC Filings Process for determining remuneration
G4-53 Clorox Website: SEC Filings How stakeholders’ views are sought and taken into account regarding remuneration
G4-54 Clorox Website: SEC Filings Ratio of annual total compensation for the organization’s highest paid individual in each country of significant operations to the median annual total compensation for all employees
G4-55 Clorox Website: SEC Filings Ratio of percentage increase in annual total compensation for the organization’s highest- paid individual in each country of significant operations to the median percentage increase in annual total compensation for all employees (excluding the highest-paid individual) in the same country
ETHICS AND INTEGRITY
G4-56 Clorox Website: Mission and Values
Principle 10 Organization’s values, principles, standards and norms of behavior such as codes of conduct and codes of ethics
G4-57 Clorox Website: Codes of Conduct
Principle 10 Internal and external mechanisms for seeking advice on ethical and lawful behavior, and organizational integrity
G4-58 Clorox Website: Codes of Conduct
Principle 10 Internal and external mechanisms for reporting concerns about unethical or unlawful behavior, and organizational integrity
General Standard Disclosures
GRI G4 Content Index
62 The Clorox Company 2017 Integrated Annual Report

SPECIFIC STANDARD DISCLOSURES PAGE OMISSIONS
EXTERNAL ASSURANCE
UNGC PRINCIPLES DESCRIPTION
CATEGORY: ECONOMIC
Material Aspect: Economic Performance
G4-DMA CEO Letter, pages 2-5 2020 Strategy, pages 18-352017 Scorecard, pages 37-41
See pages 52-53
G4-EC1 2017 Scorecard, pages 37-41 See pages 52-53
Principles 7-9 Direct economic value generated and distributed
G4-EC2 Clorox Website: CEO Message — Sustainability Commitment
Financial implications and other risks and opportunities for the organization’s activities due to climate change
G4-EC3 Clorox Website: Employee Benefits
Coverage of the organization’s defined benefit plan obligations
CATEGORY: ENVIRONMENTAL
Material Aspect: Materials
G4-DMA 2020 Strategy Overview (Good Growth), page 18
Strategy 4, Fund Growth, CR Highlights — Shrink our environmental footprint while we grow, pages 30-35
Clorox Website: CEO Message — Sustainability Commitment
G4-EN2 We do not currently report a total percentage of materials used that are recycled input materials.
Principles 7-9 Percentage of materials used that are recycled input materials
Material Aspect: Energy
G4-DMA Strategy 4, Fund Growth, CR Highlights — Shrink our environmental footprint while we grow, page 32
Clorox Website: CEO Message — Sustainability Commitment
See pages 52-53
G4-EN6 2017 Scorecard, page 41; Progress Update — Energy, page 32
Clorox Website: Energy
Clorox Website: CEO Message — Sustainability Commitment
See pages 52-53
Reduction of energy consumption
Specific Standard Disclosures
GRI G4 Content Index
63

SPECIFIC STANDARD DISCLOSURES PAGE OMISSIONS
EXTERNAL ASSURANCE
UNGC PRINCIPLES DESCRIPTION
Material Aspect: Water
G4-DMA Water, page 35;Clorox Website: Footprint Reduction: Conserving Water
See pages 52-53
Principles 7-9
G4-EN8 Clorox Website: Footprint Reduction: Conserving Water
Water, page 35
2017 Scorecard, page 41
See pages 52-53
Total water withdrawal by source
Material Aspect: Emissions
G4-DMA Greenhouse Gas Emissions, page 33;
Clorox Website: Operations — Reducing GHG Emissions
Clorox Website: CEO Message — Sustainability Commitment
See pages 52-53
Habitats in areas affected by operations, by level of extinction risk
G4-EN15 Clorox Website: Operations — Reducing GHG Emissions
See pages 52-53
Direct greenhouse gas (GHG) emissions (scope 1)
G4-EN19 GHG Emissions, page 33
2017 Scorecard, page 41
Clorox Website: Operations — Reducing GHG Emissions
See pages 52-53
Reduction of greenhouse gas (GHG) emissions
Material Aspect: Effluents and Waste
G4-DMA Waste, page 34
Clorox Website: Footprint Reduction Summary — Waste
Clorox Website: CEO Message — Sustainability Commitment
See pages 52-53
G4-EN23 Clorox Website: Footprint Reduction Summary — Waste
Waste, page 34
2017 Scorecard, page 41
We report solid waste disposal, not hazardous waste disposal. The waste disposal method has been determined based on information provided by the waste disposal contractor. Each site reports its annual reuse, recycling, and disposal tonnages using informa-tion obtained from its recycling or waste disposal contractor to our corporate office, where it is reviewed and compiled.
Materials Reuse Recycle CompostEnergy
Recovery IncinerationDeep Well Landfill
On-Site Storage Other
Facility Tons Tons Tons Tons Tons Tons Tons Tons Tons
17,765 23,963 467 410 25 — 7,703 — —
See pages 52-53
Total weight of waste by type and disposal method
Specific Standard Disclosures
GRI G4 Content Index
64 The Clorox Company 2017 Integrated Annual Report

SPECIFIC STANDARD DISCLOSURES PAGE OMISSIONS
EXTERNAL ASSURANCE
UNGC PRINCIPLES DESCRIPTION
Material Aspect: Products and Services
G4-DMA Product Sustainability Improvements, page 24
Clorox Website: Environmental Sustainability
See pages 52-53
Principles 7-9
G4-EN27 Product Sustainability Improvements, page 24
Clorox Website: Environmental Sustainability
We do not track energy reductions achieved as a direct result of conservation and efficiency initiatives. We only track our overall reductions in energy use.
See pages 52-53
Extent of impact mitigation of environmental impacts of products and services
Material Aspect: Compliance
G4-DMA 10-K, Risk Factors, page 14
G4-EN29 10-K, Risk Factors, page 14 Monetary value of significant fines and total number of non-monetary sanctions for non-compliance with environ-mental laws and regulations
Material Aspect: Supplier Environmental Assessment
G4-DMA Clorox Website: Sustainability in Our Supply Chain
G4-EN32 Clorox does not track percentage of new suppliers screened using environmental data. The vast majority of new suppliers are informed/expected to adhere to our environ-mental commitments/practices in our business partner code of conduct. Clorox has a scorecard tracking the environ-mental practices of our top 100 suppliers (by spend).
Principles 7-9 Percentage of new suppliers that were screened using environmental criteria
G4-EN33 The company assesses the sustainability performance of its top 100 suppliers, which represents approximately 70 percent of total suppliers. 100 percent of new suppliers must adhere to the company's business partner code of conduct, which addresses sustainability expectations.
Clorox Website: Supplier Environmental Footprint Scorecard
Significant actual and potential negative environmental impacts in the supply chain and actions taken
Specific Standard Disclosures
GRI G4 Content Index
65

Specific Standard Disclosures SPECIFIC STANDARD DISCLOSURES PAGE OMISSIONS
EXTERNAL ASSURANCE
UNGC PRINCIPLES DESCRIPTION
CATEGORY: SOCIAL
Sub-Category: Labor Practices and Decent Work
Material Aspect: Employment
G4-DMA Engage Our People, page 20
Clorox Website: Codes of Conduct
G4-LA2 Clorox Website: Employee Benefits Overview — 2017
Benefits provided to full-time employees that are not provided to temporary or part-time employees, by significant locations of operation
Material Aspect: Occupational Health and Safety
G4-DMA Engage Our People — Workplace Safety, page 20; 2017 Scorecard, pages 36-41
Clorox Website: Workplace Safety
See pages 52-53
G4-LA6 Workplace Safety, pages 20-21
Clorox Website: Workplace Safety
We track the RIR & LTIR* (lost time incident rate) for Clorox employees plus supervised workers. LTIR is reported internally on a monthly basis.
We follow OSHA 1904 Rules for defining injuries as “reportable” and labor hours to track. The rate calculation is that used by the Bureau of Labor Statistics (BLS) and OSHA for comparison across industries.
See pages 52-53
Type of injury and rates of injury, occupational diseases, lost days, and absenteeism, and total number of work-related fatalities, by region and by gender
Material Aspect: Training and Education
G4-DMA Clorox Website: Codes of Conduct
G4-LA10 The company’s MyLearnings Program offers extensive internal and external courses to support professional development, capability- and leadership-building needs; CEO Letter, pages 2-5; Engage Our People, page 20
Programs for skills management and lifelong learning that support the continued employability of employees and assist them in managing career endings
GRI G4 Content Index
66 The Clorox Company 2017 Integrated Annual Report

SPECIFIC STANDARD DISCLOSURES PAGE OMISSIONS
EXTERNAL ASSURANCE
UNGC PRINCIPLES DESCRIPTION
Material Aspect: Diversity and Equal Opportunity
G4-DMA Engage Our People — Diversity, pages 20-21
2017 Scorecard, pages 36-41
Clorox Website: Inclusion and Diversity
See pages 52-53
Principle 6
G4-LA12 2017 Scorecard, pages 37, 40 See pages 52-53
Composition of governance bodies and breakdown of employees per employee category according to gender, age group, minority group membership, and other indicators of diversity
Material Aspect: Supplier Assessment for Labor Practices
G4-DMA Clorox Website: Sustainability in Our Supply Chain
Business Partner Code of Conduct
Principles 1-6
G4-LA14 100 percent of all suppliers must adhere to our business partner code of conduct, which addresses labor practices:
Business Partner Code of Conduct
Supply Chains Act Disclosure
We do not track percentage of new suppliers screened using labor practices criteria. The vast majority of new suppliers are informed and expected to adhere to our Human Rights and Labor commitments through contract language requiring adherence to our BP Code of Conduct. In the absence of a contract, there are other mechanisms to ensure compliance with labor practices criteria for significant purchases.
Percentage of new suppliers that were screened using labor practices criteria
Sub-Category: Human Rights
Material Aspect: Non-Discrimination
G4-DMA Clorox Website: Inclusion and Diversity
Principle 6
G4-HR3 Clorox Website: Codes of Conduct Total number of incidents of discrimination and corrective actions taken
Specific Standard Disclosures
GRI G4 Content Index
67

SPECIFIC STANDARD DISCLOSURES PAGE OMISSIONS
EXTERNAL ASSURANCE
UNGC PRINCIPLES DESCRIPTION
Material Aspect: Child Labor
G4-DMA Clorox Website: Codes of Conduct Principles 1-5
G4-HR5 Suppliers must comply with Clorox’s policy on employment of young persons where the minimum age of employment shall not be less than the greater of: (a) the age of completion of compulsory school-ing or (b) 15 years of age (or 14, where the local law of the country permits). Additionally, workers under the age of 18 should not perform any hazardous work.
Principles 1-5 Operations and suppliers identified as having significant risk for incidents of child labor, and measures taken to contribute to the effective abolition of child labor
Material Aspect: Forced or Compulsory Labor
G4-DMA Clorox Website: Codes of Conduct
G4-HR6 Clorox Website: Codes of Conduct
Suppliers are engaged through our Business Partner Code of Conduct and must not use forced, bonded, or indentured labor or prison labor. Clorox has started a review of its supply base to have the majority of suppliers again either self-certify to the Clorox Business Partner Code of Conduct, or it will evaluate the supplier’s own code of conduct and public commitments to ensure alignment with the commitments of the Clorox code, including elimination of all forms of forced or compulsory labor. The company’s Global Strategic Sourcing organization has prioritized an objective of implementing a full supplier risk assessment and mitigation tool during fiscal year 2017. This would be expected to consider manufacturing type of operation and countries/geographies of operation when considering and scoring supplier risk level.
Operations and suppliers identified as having significant risk for incidents of forced or compulsory labor, and measures to contribute to the elimination of all forms of forced or compulsory labor
Material Aspect: Assessment
G4-DMA Clorox Website: Codes of Conduct
G4-HR9 None of our operations have been subject to human rights reviews/assessments.
Total number and percentage of operations that have been subject to human rights reviews or impact assessments
Specific Standard Disclosures
GRI G4 Content Index
68 The Clorox Company 2017 Integrated Annual Report

SPECIFIC STANDARD DISCLOSURES PAGE OMISSIONS
EXTERNAL ASSURANCE
UNGC PRINCIPLES DESCRIPTION
Sub-Category: Society
Material Aspect: Local Communities
G4-DMA 2017 Scorecard, pages 36-41
Clorox Website: Social Impact
See pages 52-53
G4-SO1 Safeguard Families With Our Be Healthy, Be Smart and Be Safe Initiatives Community Support, pages 27-28
Clorox Website: Social Impact
Percentage of operations with implemented local community engagement, impact assessments, and development programs
Material Aspect: Anti-Corruption
G4-DMA Clorox Website: Codes of Conduct
G4-SO4 100 percent of the company’s leaders and employees must go through anti-corruption training. 100 percent of the company’s suppliers must adhere to the Business Partner Code of Conduct, which addresses ethical business practices.
Corporate Governance, page 54
Currently Unavailable:The Company does not disclose incidents in its current report.
See pages 52-53
Principle 10 Communication and training on anti-corruption policies and procedures
Sub-Category: Product Responsibility
Material Aspect: Customer Health & Safety
G4-DMA Clorox Website: What We’re Made Of
Principles 7-9
G4-PR1 Clorox Website: What We’re Made Of
The company assesses 100 percent of its products for human and environmental safety.
Principles 7-9 Percentage of significant product and service categories for which health and safety impacts are assessed for improvement
Material Aspect: Product and Service Labeling
G4-DMA All company products have the required labeling for safety and usage. The company also voluntarily discloses the product ingredients used in its cleaning and disinfecting products in the U.S. and Canada.
www.IngredientsInside.com
G4-PR3 100 percent of company products are subject to safety, caution and usage labeling.
www.IngredientsInside.com
Product Safety at Clorox
Type of product and service information required by the organization’s procedures for product and service information and labeling, and percentage of significant product and service categories subject to such information requirements
Specific Standard Disclosures
GRI G4 Content Index
69

Specific Standard Disclosures SPECIFIC STANDARD DISCLOSURES PAGE OMISSIONS
EXTERNAL ASSURANCE
UNGC PRINCIPLES DESCRIPTION
G4-PR5 Clorox is consistently ranked high for customer satisfaction by the American Customer Satisfaction Index
Results of surveys measuring customer satisfaction
Material Aspect: Marketing Communications
G4-DMA Clorox Website: Innovation and Marketing
G4-PR6 The company does not sell products that are banned in certain markets. Clorox regularly responds to questions about its products — either via email, in-person meetings or by phone.
Sale of banned or disputed products
G4-PR7 Clorox Website: All About Innovation
We did not have any incidents of noncompliance with regulations or voluntary codes with respect to marketing communications.
Total number of incidents of non-compliance with regulations and voluntary codes concerning marketing communications, including advertising, promotion, and sponsorship, by type of outcomes
Material Aspect: Customer Privacy
G4-DMA Clorox Website: Privacy Policy
G4-PR8 The company has not identified any complaints related to this matter.
Principles 7-9 Total number of substantiated complaints regarding breaches of customer privacy and losses of customer data
Material Aspect: Compliance
G4-DMA Clorox Website: What We’re Made Of
G4-PR9 We stand by Dispatch® hospital cleaner disinfectant with bleach’s effectiveness against disease-causing pathogens when used as directed. While we strongly disagree with EPA’s findings related to the effectiveness claim against the Mycobacterium bovis pathogen (tuberculosis bacteria), we decided to settle the matter versus spending additional resources on disputing this issue.
Monetary value of significant fines for non-compliance with laws and regulations concerning the provision and use of products and services
GRI G4 Content Index
70 The Clorox Company 2017 Integrated Annual Report

Stockholder InformationStock Listing and Number of Record HoldersThe Clorox Company’s common stock is listed on the New York Stock Exchange, identified by the symbol CLX. As of July 28, 2017, the number of record holders of Clorox’s common stock was 10,736.
Transfer Agent, Registrar and Dividend Disbursing AgentInquiries relating to stockholder records, change of ownership, change of address and the dividend reinvestment/direct stock purchase plan should be sent to:
Computershare P.O. Box 30170College Station, TX 77842-3170
Overnight correspondence should be sent to:Computershare211 Quality Circle, Suite 210College Station, TX 77845
877-373-6374 or 781-575-2726TDD 800-952-9245 or 312-588-4110 for hearing impairedcomputershare.com/investor
Stockholder Information ServiceThe latest company news is available at TheCloroxCompany.com.
Dividend Reinvestment/ Direct Stock Purchase PlanClorox has authorized Computershare to offer a dividend reinvestment/direct stock purchase plan. Registered stockholders can purchase additional shares. Nonstockholders may join the plan with an initial investment, lump sum or bank debit. Most fees are paid by Clorox.
For more information or plan materials, visit TheCloroxCompany.com > Investors > Investor Resources > Online Document Library or contact Computershare (see above).
Management Report on Internal Control Over Financial Reporting Clorox management, under the supervision and with the participation of the chief executive officer and chief financial officer, has assessed the effectiveness of the company’s internal control over financial reporting as of June 30, 2017, and concluded that it is effective. For more information, see Item 9.A. of the company’s Form 10-K for the fiscal year ended June 30, 2017.
2017 Financial InformationFull financial statements are provided in the company’s 2017 proxy statement. Detailed financial information is available without charge through the following sources:
• The company’s proxy statement is available at TheCloroxCompany.com.
• The company’s annual report on Form 10-K for the fiscal year ended June 30, 2017, is available at TheCloroxCompany.com and through the SEC’s EDGAR database.
Forward-Looking StatementsExcept for historical information, matters discussed in the annual report are forward-looking statements and are based on management’s estimates, assumptions and projections. Actual results could vary materially. Please review the “Risk Factors” and “Management’s Discussion and Analysis of Financial Condition and Results of Operations” sections in the company’s annual report on Form 10-K for the fiscal year ended June 30, 2017, and subsequent SEC filings, for factors that could affect the company’s performance and cause results to differ materially from management’s expectations. The information in this report reflected management’s estimates, assumptions and projections as of Aug.15, 2017. Clorox has not made updates since then and makes no representation, express or implied, that the information is still current or complete. The company is under no obligation to update any part of this document.
Comparative Stock PerformanceThe graph below compares the cumulative total stockholder return of the Common Stock for the last five fiscal years with the cumulative total return of the Standard & Poor’s 500 Stock Index and a composite index composed of the Standard & Poor’s Household Products Index and the Standard & Poor’s Housewares & Specialties Index (referred to below as the Peer Group) for a five-year period ending June 30, 2017.
The composite index is weighted based on market capitalization as of the end of each quarter during each of the last five years. The graph lines merely connect the prices on the dates indicated and do not reflect fluctuations between those dates.
0
50
100
150
200
250
201720162015201420132012
COMPARISON OF FIVE-YEAR CUMULATIVE TOTAL RETURN*Among The Clorox Company, the S&P 500 Index and a Peer Group
S&P 500: $197.92Peer Group: $173.84
Clorox: $212.51
* $100 invested on 6/30/12 in stock or index, including reinvestment of dividends. Fiscal year ending June 30. Copyright© 2017 Standard & Poor’s, a division of S&P Global. All rights reserved.

The Clorox Company1221 Broadway, Oakland, CA 94612
thecloroxcompany.comRead the 2017 Integrated Annual Report:
annualreport.thecloroxcompany.com