instability and relative growth trend analysis of area...
TRANSCRIPT

International Journal of Agricultural Economics and Management. ISSN 2277-3215 Volume 3, Number 2 (2013), pp. 35-42 © Research India Publications http://www.ripublication.com
Instability and Relative Growth Trend Analysis of Area, Production and Productivity of Cotton Crop in
India
Monali Mal1 and Amarkant Pandey2
1Senior Lecturer, Department of Management,
Rungta College of Engineering and Technology, Bhilai (Chhattisgarh) E-mail: [email protected]
2Professor, School of Studies in Economics, Pandit Ravishankar Shukla University, Raipur (Chhattisgarh)
E-mail: [email protected]
Abstract
Cotton is utilized more than any other fiber in the world. Cotton is an essential cash crop in India. Business activities for cotton textile and many other industries largely depend on cotton throughout the country. This industry is a major contributor to the GDP, employment to rural population and to the less privileged, and as a major contributor to industrial production and export. The demand for cotton textile is rising progressively all over the world. Being the second largest area in cotton India has an immense opportunity in the growth of the cotton industry and strengthening Indian economy in upcoming years. India can play a crucial role by contributing in the global cotton and textile markets. But cotton productivity lags far behind the major cotton producing countries. There is a fluctuation in the area, production and yield of cotton crop time to time. The paper aims at showing the instability and growth trends of area, production and yield that India has experienced over a period of time. Coefficient of variation (CV) and compound growth rate (CGR) are the two different statistical tools used for instability and growth trend analysis respectively. These tools will help to understand the fluctuation and growth trend in area, production and productivity of cotton at different period in India. Two different models have been used for calculating compound growth rate. Key words: Cotton, India, area, production, productivity, instability, growth trend, coefficient of variation, Compound growth rate
36 Monali Mal and Amarkant Pandey
Introduction India is an agriculture based country. Cotton is one of the leading and important cash crops in Indian economy. Cotton cultivation provides livelihood to millions of farmers. Their economic welfare heavily relies on cotton productivity. Cotton yarn, fabric, garment etc. are dependent on the availability of cotton. Export of raw cotton and cotton products can earn foreign exchange for India. But India is not able to come up with satisfactory performance in cotton productivity inspite of having varieties of cotton and availability of technology. Its productivity is far below the major cotton producing countries. Demand for cotton textile is rising progressively all over the world. Being the second largest cotton producing area, India has an immense opportunity in the growth of the cotton textile industry and strengthening of Indian economy in the coming years. Cotton is very important and thus should be promoted as a cash crop (Kumar, 1997). India is in the competitive position for producing the widest range of cotton fiber quality appropriate for spinning 6’s to 120’s counts yarn. So cotton is important for the largest agro-based national industry of the country (Santhanam and Sundaram, 1997). In India majority of the farmers are having fragmented land. It is difficult to implement technology and practice crop management on small and resource-constrained farms. (Ramasundaram and Gajbhiye, 2001). According to Mohanty et al. (2003), there is instability in cotton yield during different periods of time. Although cotton is an essential cash crop in Indian economy but due importance has not given to it. Except for certain areas, cotton is not cultivated commercially. They used Policy Analysis Matrix to study the different aspects influencing cotton yield. Hegde et al. (2004) stated that cotton as personal care items are preferred compared to those containing synthetic fibers by most of the consumers. World textile fiber consumption in 1998 was approximately 45 million tons. According to Agarwal (2007-08), productivity and consequently production show unusual trend for different region for the same period in India. Factors influencing the production of cotton act differently in different regions. Total factor productivity explains the influence of factors on cotton yield for different regions. Cotton accounts for 40% of the total global fibre production and is the most important fibre in the World. India is a major player with World Cotton Market in terms of area and production. In recent years India become the second largest cotton producer after surpassing USA in 2007-08. It has also emerged as the largest exporter in recent years with its surplus output. Cotton covers about 7% of the total kharif [rainy season from June to September] crop acreage and is second to rice in India (Barik, 2009). India holds a very remarkable position in the world cotton market. The area under cotton is the highest in India having 30.7% of the world’s total cotton acreage in 2008-09, compared to 20.5% for China and 9.9% for the United States. However, China is the highest cotton producer in the world followed by India. India’s production in 2008-09 was 29.0 million bales compared to 33.5 million bales of China. India’s cotton yield, at 523 kilograms per hectare (kg/ha), lags significantly behind both the Chinese yield of 1, 331 kg/ha and the world average of 766 kg/ha (Agrawal, 2010). Though, India ranks second in the world in cotton production after China, even its best productivity of 566 kg/ha, places it at 24th rank in the list of 80
Instability and Relative Growth Trend Analysis 37
cotton producing countries. (Kranthi, 2011). Comparison of primary data of Bt and non Bt cotton in progressive states of India through stochastic frontier approach and the Environmental Impact Quotient (EIQ) indicate that average technical efficiency is higher in Bt cotton farming and it causes less damage to the environment (Mal et al., 2011). Scarcity of water resources leads to deficient irrigation which affects any agricultural production including cotton. Therefore, in water deficient region, increase in cropped area is not a viable solution to augment the productivity. There is a gap between the research findings and policy implementation. It leads to problem in structural adjustment of different factors. Decomposition and compound growth rate methods were used for analyzing these factors (Rehman et al., 2011). Analysis of Cobb Douglas production function for cotton crop in Pakistan demonstrates that over the time input cost has increased at an increasing rate but return is low from cotton crop. It has forced the farmers to search for an alternative crop (Ali et al., 2012). India produced a record of 5.82 million tons of cotton in the 2011-12 marketing year. Very high market price of cotton influenced the increase of cotton area in 2011. This has helped to improve the predictability and stability of cotton in recent years. It is estimated that without further significant increase in price or technology transfer India’s cotton area will stabilize within a range of 10-12 million hectares (Textile Magazine, 2012). Export share of agriculture sector including cotton to national exports has decreased over time. For a number of years cotton textile contributed a major share of total export earnings of the country. Unfavourable government policy has been responsible for the decline of capital investment in agricultural sector. Agricultural development is imperative for overall economic development of a nation. Government should take appropriate steps to encourage production of commercial crops including cotton to promote economic development. Trend equation shows that there is a fluctuation in the production and export share of agricultural crops (Mallika, 2012). India’s 2013-14 cotton production is forecasted at 34.5 million tons from 12 million hectares, the second highest area and production on record. Farmers have shown a strong preference for cotton in recent years. Relative drought tolerance nature of cotton gives it an advantage over the competing crops (Sood, 2013). Research Methodology The present study is based on the secondary data. The entire study is based on the data shown in table -1. The study period is from 1980-81 to 2010-11. For analysis purpose four periods are taken. The first, second and third periods are considered from 1980-81 to 1989-90, 1990-91 to 1999-00, and 2000-01 to 2010-11 respectively. The entire period taken together from 1980-81 to 2010-11 is considered under period 4. Through this study an analysis is made regarding the fluctuation and growth rate in the area, productivity and production of cotton during the different periods in India. The paper deals with the analytical study using coefficient of variation and compound growth rate (using two models) of the above factors.
38 Monali Mal and Amarkant Pandey
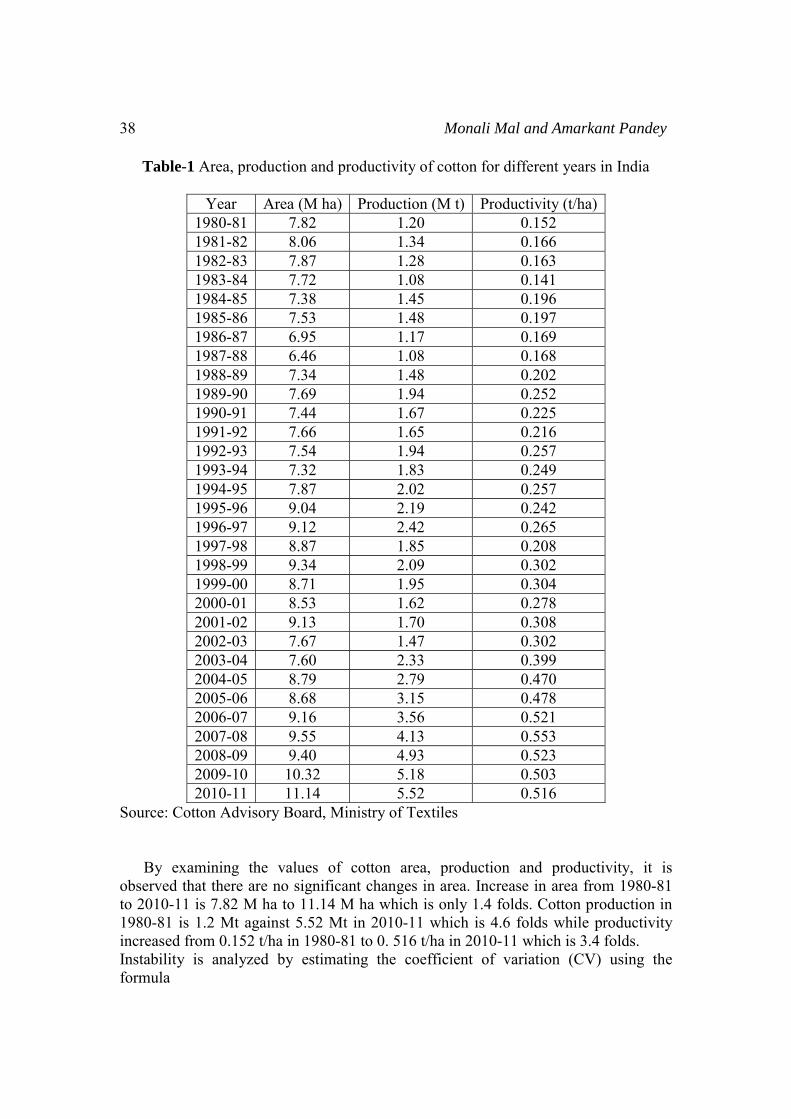
Table-1 Area, production and productivity of cotton for different years in India
Year Area (M ha) Production (M t) Productivity (t/ha) 1980-81 7.82 1.20 0.152 1981-82 8.06 1.34 0.166 1982-83 7.87 1.28 0.163 1983-84 7.72 1.08 0.141 1984-85 7.38 1.45 0.196 1985-86 7.53 1.48 0.197 1986-87 6.95 1.17 0.169 1987-88 6.46 1.08 0.168 1988-89 7.34 1.48 0.202 1989-90 7.69 1.94 0.252 1990-91 7.44 1.67 0.225 1991-92 7.66 1.65 0.216 1992-93 7.54 1.94 0.257 1993-94 7.32 1.83 0.249 1994-95 7.87 2.02 0.257 1995-96 9.04 2.19 0.242 1996-97 9.12 2.42 0.265 1997-98 8.87 1.85 0.208 1998-99 9.34 2.09 0.302 1999-00 8.71 1.95 0.304 2000-01 8.53 1.62 0.278 2001-02 9.13 1.70 0.308 2002-03 7.67 1.47 0.302 2003-04 7.60 2.33 0.399 2004-05 8.79 2.79 0.470 2005-06 8.68 3.15 0.478 2006-07 9.16 3.56 0.521 2007-08 9.55 4.13 0.553 2008-09 9.40 4.93 0.523 2009-10 10.32 5.18 0.503 2010-11 11.14 5.52 0.516
Source: Cotton Advisory Board, Ministry of Textiles By examining the values of cotton area, production and productivity, it is observed that there are no significant changes in area. Increase in area from 1980-81 to 2010-11 is 7.82 M ha to 11.14 M ha which is only 1.4 folds. Cotton production in 1980-81 is 1.2 Mt against 5.52 Mt in 2010-11 which is 4.6 folds while productivity increased from 0.152 t/ha in 1980-81 to 0. 516 t/ha in 2010-11 which is 3.4 folds. Instability is analyzed by estimating the coefficient of variation (CV) using the formula

Instability and Relative Growth Trend Analysis 39
CV = σ/μ × 100 Where σ = standard deviation and μ = mean. By fitting exponential function, compound growth rate is calculated and shown below. For this purpose, two different models are considered. Model- I Zt= a + bT
Where Zt = area, production or productivity, a = parameter, b = regression coefficient and T = time element. Model- II Xa = mna
Log Xa = Log m + a log n n = 1 + r /100 Where Xa = area, production and productivity, a = time element, m = intercept and r = regression coefficient. CGR (r) = (antilog n - 1) × 100 Where n = 1 + r/ 100 Student’s t test is used to test the significance of the CGR. Test statistics can be calculated by using t-test as:
t = r 212
rn−−
Where (n - 2) is the degree of freedom and r is the correlation coefficient. Results and discussions Instability for area, production and productivity of cotton for different periods in India in terms of CV is presented in Table-2. Table-2 Coefficient of variation (CV) for area, production and productivity of cotton for different periods in India
Period Year Area Production Productivity 1 1980-81 to 1989-90 5.78 18.07 17.8 2 1990-91 to 1999-00 9.08 10.76 13.1 3 2000-01 to 2010-11 8.87 41.47 23.0 4 1980-81 to 2010-11 10.95 49.27 43.8
From the analysis of the data presented in table -2 it can be observed that instability in area is less compared to the production and productivity for cotton in
40 Monali Mal and Amarkant Pandey
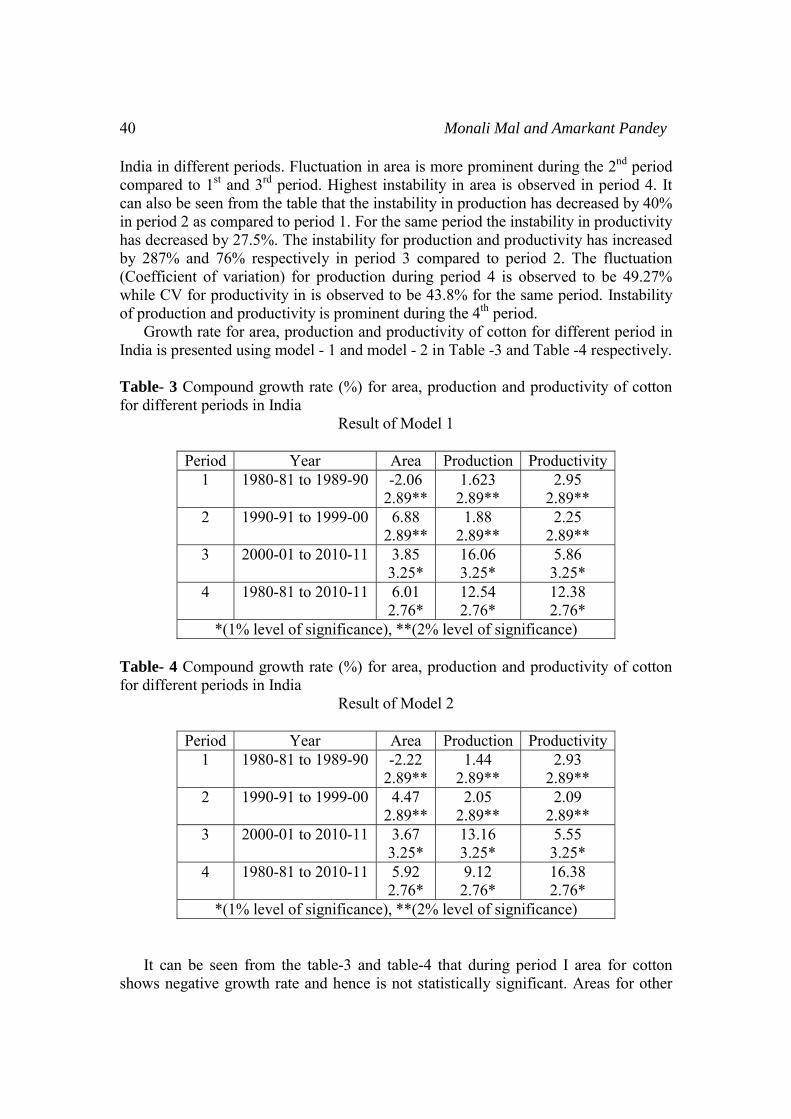
India in different periods. Fluctuation in area is more prominent during the 2nd period compared to 1st and 3rd period. Highest instability in area is observed in period 4. It can also be seen from the table that the instability in production has decreased by 40% in period 2 as compared to period 1. For the same period the instability in productivity has decreased by 27.5%. The instability for production and productivity has increased by 287% and 76% respectively in period 3 compared to period 2. The fluctuation (Coefficient of variation) for production during period 4 is observed to be 49.27% while CV for productivity in is observed to be 43.8% for the same period. Instability of production and productivity is prominent during the 4th period. Growth rate for area, production and productivity of cotton for different period in India is presented using model - 1 and model - 2 in Table -3 and Table -4 respectively. Table- 3 Compound growth rate (%) for area, production and productivity of cotton for different periods in India
Result of Model 1
Period Year Area Production Productivity 1 1980-81 to 1989-90 -2.06
2.89**1.623 2.89**
2.95 2.89**
2 1990-91 to 1999-00 6.88 2.89**
1.88 2.89**
2.25 2.89**
3 2000-01 to 2010-11 3.85 3.25*
16.06 3.25*
5.86 3.25*
4 1980-81 to 2010-11 6.01 2.76*
12.54 2.76*
12.38 2.76*
*(1% level of significance), **(2% level of significance) Table- 4 Compound growth rate (%) for area, production and productivity of cotton for different periods in India
Result of Model 2
Period Year Area Production Productivity 1 1980-81 to 1989-90 -2.22
2.89**1.44
2.89** 2.93
2.89** 2 1990-91 to 1999-00 4.47
2.89**2.05
2.89** 2.09
2.89** 3 2000-01 to 2010-11 3.67
3.25* 13.16 3.25*
5.55 3.25*
4 1980-81 to 2010-11 5.92 2.76*
9.12 2.76*
16.38 2.76*
*(1% level of significance), **(2% level of significance) It can be seen from the table-3 and table-4 that during period I area for cotton shows negative growth rate and hence is not statistically significant. Areas for other
Instability and Relative Growth Trend Analysis 41
periods are statistically significant. This explains that there is increase in area during 2nd, 3rd and 4th period. The growth rate in area for period 2 is more compared to period 3. The highest growth rate in area is attained in period 2 for model 1 and period 4 for model 2. Cotton production for period 1 and period 2 is not statistically significant for both the models. For the other two periods there is considerable increase in production rate. Overall increase of production in period 4 is less compared to period 3. It reveals that growth rate in production is the highest in period 3. Cotton productivity during period 2 is not statistically significant. Productivity for other periods is statistically significant. But there is no striking increase in productivity during period 1. There is remarkable increase in productivity in Period 3. As a result overall productivity taken together in period 4 shows the highest growth rate. Production has a positive relation with both area and productivity. In period 1 no growth rate in production is found due to negative growth rate in area and a slight increase in productivity. Although there is high growth rate in cotton area in period 2 but it has not significantly contributed in the increase in cotton production as productivity has decreased. Increase in area and remarkable increase in productivity in period 3 leads to the tremendous increase in production. For the entire study (period 4) remarkable increase in area and highest growth rate in productivity contributed to remarkable increase in production. The noteworthy boost in production and productivity during period 3 is attributed to the introduction of Bt cotton in India during 2002. Increased area and yield have boosted the cotton production time to time. But the position achieved by other major countries in raising yield is quite higher compared to India. Area, yield, and production trends have varied sharply across each of India's distinctly different cotton-producing regions. After 2007-08 there is decrease in productivity and so it has affected the overall production of cotton. There are an estimated 5.5 million cotton farmers with an average farm size of 1.5 hectares which limits their ability to adopt capital intensive production technologies and infrastructure. Conclusion Cotton production has grown significantly since the mid-1980s due to improvements in both area and yield, but growth slowed in the 1990s because of a sharp reduction in yield. During the mid-2000s, rising yields have again restored stronger growth in production. But cotton productivity during the late 2000 was disappointing. Although India is a major cotton producer but it is not certain whether domestic productivity will be able to keep pace with the demand of global textile and apparel industry. Cotton farmers have to grab the opportunities by making significant investments in production technologies to boost yields above the current levels. It is now high time for India to bring a breakthrough in cotton industry by indulging into commercialization. The country has to improve its competitive strength by satisfying the cotton demand in order to survive in the global cotton market.

42 Monali Mal and Amarkant Pandey
References
[1] Ali, H., Aslam, M. and Ali, H., 2012, “Economic Analysis of Input Trend in Cotton Production Process in Pakistan, ” Asian Economic and Financial Review 2(4), pp. 553-561.
[2] Agarwal, I., 2008, “Total Factor Productivity of Cotton in India, ” ICAR, code no.TMC/MMI/5.1, 68-70 .
[3] Agrawal O. P. ed., 2010, “Cotton Statistics and News, ” Cotton Association of India, No. 48.
[4] Barik A., 2009, “Revolution in Indian cotton, ” Directorate of Cotton Development, Ministry of Agriculture, 1-59.
[5] Hegde, R. R., Dahiya, A., Kamath M. G., Gao, X., Jangala, P. K., 2004, “Cotton Fibres, ” www.scribd.com
[6] Kranthi K. R., M. V. Venugopalan, M. Sabesh, Yadav M. S., 2011, “Vision 2030, ” Central Institute of Cotton Research
[7] Kumar D., 1997, an article in Asian Agri-History, Vol. 1, No. 2. [8] Mal, P., Manjunatha A.V., Bauer, S., Ahmed, M. N., 2011, “Technical
Efficiency and Environmental Impact of Bt Cotton and Non-Bt Cotton in North India, ” The Journal of Agrobiotechnology Manangement & Economics, 14(3), pp. 164-170.
[9] Mallika, V., 2012, “Agrarian Crisis in India: It’s Impact on Production and Export, ” an article/report in indiastat.com, socio-economic voices, 1-8.
[10] Mohanty, S., Fang, C. and Chaudhary, J., 2003, “Assessing the Competitiveness of Indian Cotton Production: A Policy Analysis Matrix Approach, ” The Journal of Cotton Science, 7, pp. 65–74.
[11] Santhanam V. and Sundaram V., 1997, “an overview ‘Agri-History of Cotton in India’, Asian agri-History, ” Vol No. 4, pp. 235-251
[12] The Textile Magazine, 2012, “USDA predicts fall in India’s 2012-13 cotton production, ” url http://www.indiantextilemagazine.in /uncategorized/usda-predicts-fall-in-indias-2012-13-cotton-production/
[13] Ramasundaram P. and Gajbhiye H., 2001, “Constraints to cotton production in India, ” CICR technical bulletin no: 19.
[14] Rehman, F. U., Saeed I. and Salam, A., 2011, “Estimating Growth Rates and Decomposition Analysis of Agriculture Production in Pakistan: pre and post sap analysis, ” Sarhad J. Agric. Vol. 27, No.1, pp. 125-131.
[15] Sood D., 2013, “India cotton and products Annual, ” a report by Global Agricultural Information Network (GAIN), USDA Number: IN3028.

IJPSS Volume 4, Issue 9 ISSN: 2249-5894 ___________________________________________________________
A Monthly Double-Blind Peer Reviewed Refereed Open Access International e-Journal - Included in the International Serial Directories Indexed & Listed at: Ulrich's Periodicals Directory ©, U.S.A., Open J-Gage, India as well as in Cabell’s Directories of Publishing Opportunities, U.S.A.
International Journal of Physical and Social Sciences http://www.ijmra.us
232
September
2014
Assessment of Cotton Availability for
Domestic Demand in India for Generating
value Addition
Monali Mal*
Amarkant Pandey**
Abstract
Export is undoubtedly essential for any nation to strengthen economy. It leads to healthy
competition in the market and maintains BOP (balance of payment). Agricultural exports
contribute around 13% to India‟s total export earnings. Export of cotton can earn foreign
exchange for India. But the other side of reality is that there is high demand for raw cotton in
domestic industries. India should therefore emphasize on increasing cotton production for
fulfilling cotton requirement to facilitate boost in value added product. Export of yarn, fabric,
garment, home furnishing and other value added product from cotton will earn more revenue
than raw cotton. It is imperative and advisable that raw cotton should be exported only after
fulfilling domestic demand. An attempt has been made to analyze the relationship between
different variables by using Karl Pearson‟s correlation coefficient and multiple correlation
coefficient. For this purpose t and F tests have been used for correlation coefficient and multiple
correlation coefficient respectively to examine the level of significance among the variables.
Key word cotton production, cotton consumption, cotton export value added product
* Senior Lecturer, Department of Management, Rungta College of Engineering and Technology,
Bhilai (Chhattisgarh)
** Professor and head, School of Studies in Economics, Pandit Ravishankar Shukla University,
Raipur (Chhattisgarh)
IJPSS Volume 4, Issue 9 ISSN: 2249-5894 ___________________________________________________________
A Monthly Double-Blind Peer Reviewed Refereed Open Access International e-Journal - Included in the International Serial Directories Indexed & Listed at: Ulrich's Periodicals Directory ©, U.S.A., Open J-Gage, India as well as in Cabell’s Directories of Publishing Opportunities, U.S.A.
International Journal of Physical and Social Sciences http://www.ijmra.us
233
September
2014
Introduction
Cotton is an essential agricultural commodity, both globally as well as domestically. India is the
world‟s 2nd
largest producer, 2nd
largest exporter and 2nd
largest consumer in cotton. Availability
of raw cotton for domestic industries and its export is crucial for Indian economy. Production has
been increasing at 6 percent year on year while consumption has been increasing at 8 percent
year on year. Cotton is used as a raw material in different industries of national importance. In
many developing and underdeveloped countries, cotton exports are not only a source of vital
foreign exchange earnings, but also account for a substantial proportion of their GDP and tax
income, leading to significant economic and social development. Besides providing cloth, one of
the basic necessities of nation, it generates employment, provides saving, contributes to market
of industrial goods and earns foreign exchange. Cotton is the only crop in India having genuine
export surplus after meeting domestic needs. Significant contribution has been made by cotton
and the textile industry to the Indian economy. The total consumption of cotton in India has
increased by almost 46 percent from 2000-01 to 2010-11.
Cotton consumption has been increasing in India and since 2000 consumption of cotton has
become more significant. The share is also further expected to increase with increase in the
demand for value added product. India is the only country producing all four species of cotton.
This gives India a comparative advantage over other countries in terms of domestic production,
consumption and export for earning foreign exchange. The introduction of Bt cotton from the
year 2002 has brought about a significant change in the productivity levels of cotton in some
states. Production in 2011-12 cotton season touched an all time high of 6 million tons with 2.4
million tons of exports and 4.7 million tons of consumption. Our raw material policy has been
determined by the need to meet the needs of domestic industry and have an adequate closing
stock with the surplus quantities being available for exports. India‟s cotton exports touched an all
time high in 2011-12 cotton season and the prospects of large trade volumes look good in the
2012-13 cotton season.
There is no doubt in it that India has increased production and export of value added product
over the year but this quantity and quality is far below when it is compared to its major
competitors. At this juncture India should come up with increase in cotton production and quality
to survive in the global cotton textile market.
IJPSS Volume 4, Issue 9 ISSN: 2249-5894 ___________________________________________________________
A Monthly Double-Blind Peer Reviewed Refereed Open Access International e-Journal - Included in the International Serial Directories Indexed & Listed at: Ulrich's Periodicals Directory ©, U.S.A., Open J-Gage, India as well as in Cabell’s Directories of Publishing Opportunities, U.S.A.
International Journal of Physical and Social Sciences http://www.ijmra.us
234
September
2014
In this paper, the dynamics of changes have been measured in the export of raw cotton from
India to different export markets. The study is carried out with the aim of emphasize on
production and export of high valued cotton products rather than exporting raw cotton
availability and fulfilling the demand of raw cotton for domestic industries at low prices
export surplus cotton
Review of Literature
Cotton is very important and thus should be promoted as a cash crop (Kumar, 1997). India
produces the widest range of cotton fiber quality suitable for spinning 6‟s to 120‟s counts yarn.
So cotton is favourable for the largest agro-based national industry of the country (Santhanam
and Sundaram, 1997). (Bigman et al., 2004) mentioned that restructuring of the entire textile
industry worldwide during the post-WTO it was expected in the reduction of the costs of textile
products and increase in the demand of raw cotton and thereby changing the directions of the
trade in cotton. In India as a result of changes in the production which showed a significant
increase, it was able to meet its domestic demand. (Mac Donald and Vollrath, 2005) stated that
termination of the Multi Fibre Agreement (MFA) in 2004 has opened up the world market for the
Indian textile industry and also affected the structure of the world trade in cotton. (Mahadevaiah
et al., 2005) using Markov Chain – model explained the dimensions of cotton export. Export is
not steady and reveals high deviation in volume and revenue earnings. Although China being the
largest producer of cotton in the world it imports medium and long staple cotton from India for
readymade garments and exports its low quality cotton to other countries maintaining its
competitiveness. (Chacko and Toor, 2007) found that the cotton export elasticity co-efficient
with respect to total production of cotton in India was positive. One per cent increase in the total
production of cotton in India would raise the cotton export by 0.22 per cent. When production
exceeds the domestic demand there exist an exportable surplus and it enhanced the export. The
risk in exchange rate was a major factor in the world trade. (Ratna, 2009) declared that inspite of
producing almost comparable quality of cotton by India and USA in 2007; cotton exported by
India is approximately half of USA showing cotton goes for value addition.
Cotton production in India is sufficient to meet the demand originating from the domestic textile
industry (Cotton Corporation of India, 2010). The average cotton yield in India is only 0.49 tons
IJPSS Volume 4, Issue 9 ISSN: 2249-5894 ___________________________________________________________
A Monthly Double-Blind Peer Reviewed Refereed Open Access International e-Journal - Included in the International Serial Directories Indexed & Listed at: Ulrich's Periodicals Directory ©, U.S.A., Open J-Gage, India as well as in Cabell’s Directories of Publishing Opportunities, U.S.A.
International Journal of Physical and Social Sciences http://www.ijmra.us
235
September
2014
per hectare compared to a world average of 0.73 tons per hectare (ICAC, 2010). (The Indian
Textile Journal, 2010) declared that India has been rapidly gaining cotton export market share. It
has been estimated that India would continue to expand its share of the global export market.
Beside becoming self sufficient for own cotton requirement it also became a leading exporter of
cotton globally. Devaraja (2011) explains the diversity and complexity of Indian textile industry.
Now the textile has its wider application in industry as well as in household. Thus demand of
more and more value added product increases day by day. (Kranthi et al., 2011) says though,
India ranks second in the world in cotton production after China, even its best productivity of
566 kg/ha, places it at 24th rank in the list of 80 cotton producing countries. Despite the good
progress made by public and private sector research and development, it is a matter of concern
that productivity started to decline from 566 kg/ha in 2007 to 522 kg/ha in 2008, 486 kg/ha in
2009 and 475 kg/ha in 2010. According to (Kumari, 2012) textile has shown a steady rise in
exports. Though India has shown a considerable rising trend in exports and has moved up in the
list of world exports, yet its real growth is showing a very slow pace. During April- December
2011 cotton fabrics made ups and readymade garments showed a growth rate of 13 % and 23.7%
respectively in export sector. (Textile Magazine, 2012) mentioned On cotton yields, USDA said
that there is some concern within the industry as the yields had stagnated over the past few years
even though crop productivity increased from an estimated 300 kg to 500 kg per hectare since
the introduction of biotech cotton. India‟s cotton yields continue to be significantly lower than
the global average of 740 kg per hectare. There is increasingly widespread opinion within the
cotton industry that India‟s cotton area will stabilize within a range of 10-12 million hectares
until there is another significant price or technology shift when the area is likely to change.
(WWF report and Yes bank, 2012) says there is persistent increase in cotton consumption since
2003-04 onwards due to growing demand for Indian textiles and considerable expansion and
modernisation of the textile mills where cotton value chain starts with fibre production and
terminates in varieties of textile and garment products. (Mal and Pandey, 2013) by using
coefficient of variation has shown that instability in area is less compared to production and
productivity of cotton for the period 1980-2011. Study of compound growth rate reveals that
during 1980-2000 there is no significant change in cotton production and from 1990-2000 no
significant increase in productivity has been observed. (Sood, 2013) stated that cotton‟s relative
drought tolerance gives it an edge over competing crops as 65 percent of India‟s cotton area is

IJPSS Volume 4, Issue 9 ISSN: 2249-5894 ___________________________________________________________
A Monthly Double-Blind Peer Reviewed Refereed Open Access International e-Journal - Included in the International Serial Directories Indexed & Listed at: Ulrich's Periodicals Directory ©, U.S.A., Open J-Gage, India as well as in Cabell’s Directories of Publishing Opportunities, U.S.A.
International Journal of Physical and Social Sciences http://www.ijmra.us
236
September
2014
rainfed. According to (Srinivas, 2013) fulfillment of domestic cotton demand and export of
cotton is imperative.
Research Methodology
The present study is analytical in nature. The entire study is based on the data shown in table -1.
The data is secondary and period covered is from 1980-81 to 2010-11. For analysis purpose four
periods are taken. The first, second and third periods are considered from 1980-81 to 1990-91,
1991-92 to 2000-01, and 2001-02 to 2010-11 respectively. The entire period taken together from
1991-92 to 2010-11 is considered under period 4. Correlation coefficient and multiple correlation
coefficient are used as a statistical tool to assess the impact of one economic variable due to the
change in other. To show the relationship between two variables Karl Pearson‟s correlation
coefficient is used. Multiple correlation is used to analyze the relation between the dependent
variable and those independent variables which has the highest correlation.
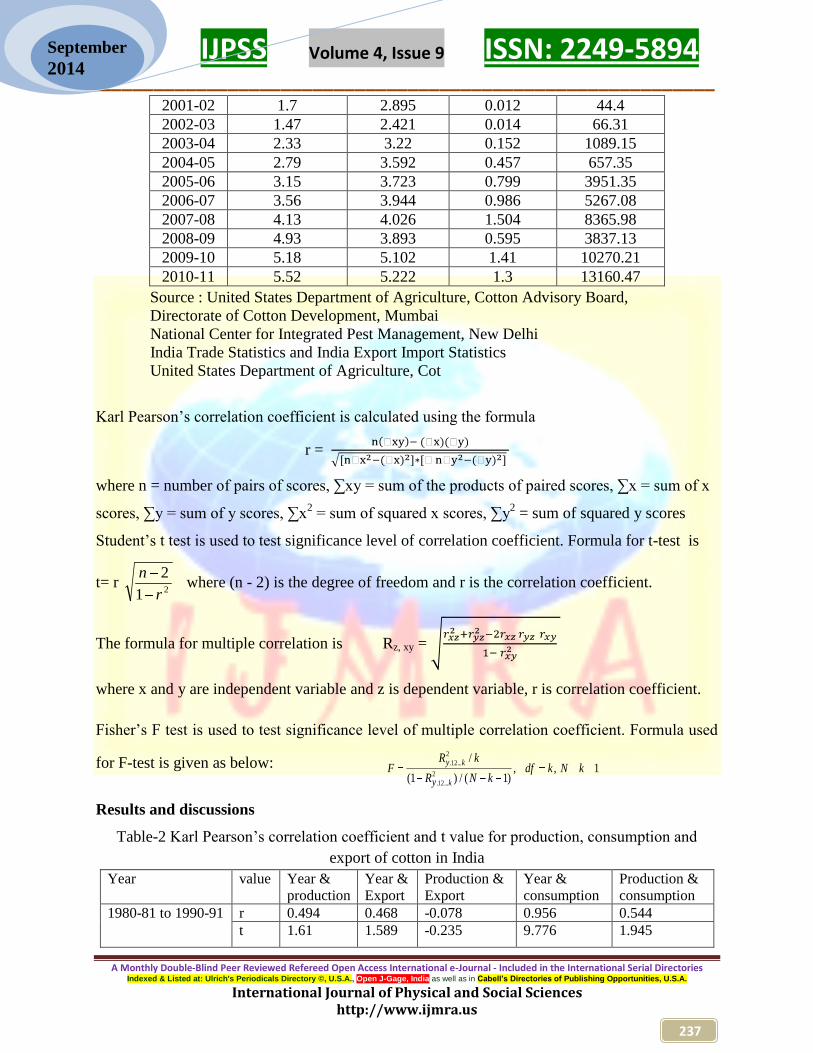
Table-1 Cotton production, consumption, Quantity exported and export value in India
Year Production (Mt) Consumption
(Mt)
Export
Quantity (M t) Value (Rs. In
crores)
1980-81 1.2 1.18 0.073 150.7
1981-82 1.34 1.356 0.109 91.1
1982-83 1.28 1.453 0.065 157
1983-84 1.08 1.544 0.033 103.6
1984-85 1.45 1.558 0.073 66.1
1985-86 1.48 1.716 0.221 102.5
1986-87 1.17 1.73 0.004 246.6
1987-88 1.08 1.767 0.032 21.7
1988-89 1.48 1.881 0.234 71.6
1989-90 1.94 1.951 0.154 610.5
1990-91 1.67 1.828 0.202 620.5
1991-92 1.64 2.135 0.215 38.7
1992-93 1.94 2.142 0.08 725.3
1993-94 1.83 2.295 0.022 238.2
1994-95 2.02 2.607 0.123 83.39
1995-96 2.19 2.856 0.258 961.16
1996-97 2.42 2.759 0.067 1655
1997-98 1.85 2.747 0.042 313.6
1998-99 2.09 2.474 0.017 86.72
1999-00 1.95 2.55 0.011 52.15
2000-01 1.62 2.539 0.01 51.43
IJPSS Volume 4, Issue 9 ISSN: 2249-5894 ___________________________________________________________
A Monthly Double-Blind Peer Reviewed Refereed Open Access International e-Journal - Included in the International Serial Directories Indexed & Listed at: Ulrich's Periodicals Directory ©, U.S.A., Open J-Gage, India as well as in Cabell’s Directories of Publishing Opportunities, U.S.A.
International Journal of Physical and Social Sciences http://www.ijmra.us
237
September
2014
2001-02 1.7 2.895 0.012 44.4
2002-03 1.47 2.421 0.014 66.31
2003-04 2.33 3.22 0.152 1089.15
2004-05 2.79 3.592 0.457 657.35
2005-06 3.15 3.723 0.799 3951.35
2006-07 3.56 3.944 0.986 5267.08
2007-08 4.13 4.026 1.504 8365.98
2008-09 4.93 3.893 0.595 3837.13
2009-10 5.18 5.102 1.41 10270.21
2010-11 5.52 5.222 1.3 13160.47
Source : United States Department of Agriculture, Cotton Advisory Board,
Directorate of Cotton Development, Mumbai
National Center for Integrated Pest Management, New Delhi
India Trade Statistics and India Export Import Statistics
United States Department of Agriculture, Cot
Karl Pearson‟s correlation coefficient is calculated using the formula
r =
where n = number of pairs of scores, ∑xy = sum of the products of paired scores, ∑x = sum of x
scores, ∑y = sum of y scores, ∑x2 = sum of squared x scores, ∑y
2 = sum of squared y scores
Student‟s t test is used to test significance level of correlation coefficient. Formula for t-test is
t= r 21
2
r
nwhere (n - 2) is the degree of freedom and r is the correlation coefficient.
The formula for multiple correlation is Rz, xy =
where x and y are independent variable and z is dependent variable, r is correlation coefficient.
Fisher‟s F test is used to test significance level of multiple correlation coefficient. Formula used
for F-test is given as below: FR k
R N kdf k N k
y k
ky
. ...
. ...
/
( ) / ( ), ,
12
2
12
21 11
Results and discussions
Table-2 Karl Pearson‟s correlation coefficient and t value for production, consumption and
export of cotton in India
Year value Year &
production
Year &
Export
Production &
Export
Year &
consumption
Production &
consumption
1980-81 to 1990-91
r 0.494 0.468 -0.078 0.956 0.544
t 1.61 1.589 -0.235 9.776 1.945
IJPSS Volume 4, Issue 9 ISSN: 2249-5894 ___________________________________________________________
A Monthly Double-Blind Peer Reviewed Refereed Open Access International e-Journal - Included in the International Serial Directories Indexed & Listed at: Ulrich's Periodicals Directory ©, U.S.A., Open J-Gage, India as well as in Cabell’s Directories of Publishing Opportunities, U.S.A.
International Journal of Physical and Social Sciences http://www.ijmra.us
238
September
2014
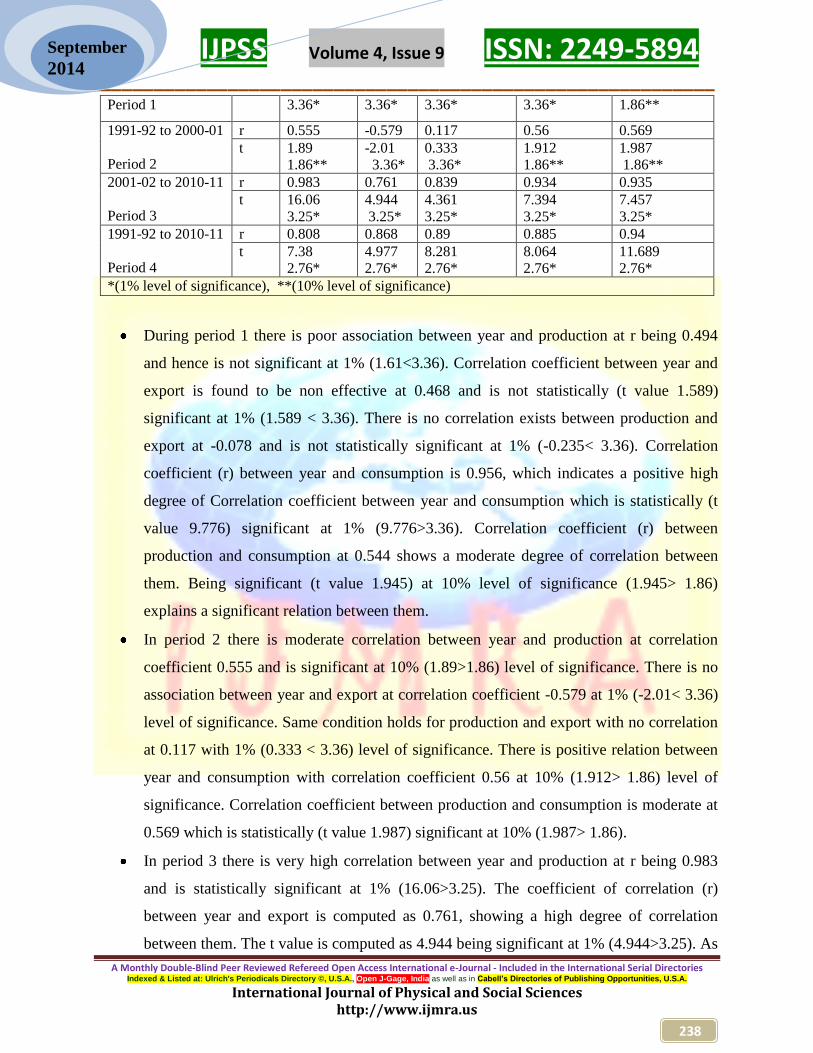
Period 1 3.36* 3.36* 3.36* 3.36* 1.86**
1991-92 to 2000-01
Period 2
r 0.555 -0.579 0.117 0.56 0.569
t 1.89
1.86**
-2.01
3.36*
0.333
3.36*
1.912
1.86**
1.987
1.86**
2001-02 to 2010-11
Period 3
r 0.983 0.761 0.839 0.934 0.935
t 16.06
3.25*
4.944
3.25*
4.361
3.25*
7.394
3.25*
7.457
3.25*
1991-92 to 2010-11
Period 4
r 0.808 0.868 0.89 0.885 0.94
t 7.38
2.76*
4.977
2.76*
8.281
2.76*
8.064
2.76*
11.689
2.76*
*(1% level of significance), **(10% level of significance)
During period 1 there is poor association between year and production at r being 0.494
and hence is not significant at 1% (1.61<3.36). Correlation coefficient between year and
export is found to be non effective at 0.468 and is not statistically (t value 1.589)
significant at 1% (1.589 < 3.36). There is no correlation exists between production and
export at -0.078 and is not statistically significant at 1% (-0.235< 3.36). Correlation
coefficient (r) between year and consumption is 0.956, which indicates a positive high
degree of Correlation coefficient between year and consumption which is statistically (t
value 9.776) significant at 1% (9.776>3.36). Correlation coefficient (r) between
production and consumption at 0.544 shows a moderate degree of correlation between
them. Being significant (t value 1.945) at 10% level of significance (1.945> 1.86)
explains a significant relation between them.
In period 2 there is moderate correlation between year and production at correlation
coefficient 0.555 and is significant at 10% (1.89>1.86) level of significance. There is no
association between year and export at correlation coefficient -0.579 at 1% (-2.01< 3.36)
level of significance. Same condition holds for production and export with no correlation
at 0.117 with 1% (0.333 < 3.36) level of significance. There is positive relation between
year and consumption with correlation coefficient 0.56 at 10% (1.912> 1.86) level of
significance. Correlation coefficient between production and consumption is moderate at
0.569 which is statistically (t value 1.987) significant at 10% (1.987> 1.86).
In period 3 there is very high correlation between year and production at r being 0.983
and is statistically significant at 1% (16.06>3.25). The coefficient of correlation (r)
between year and export is computed as 0.761, showing a high degree of correlation
between them. The t value is computed as 4.944 being significant at 1% (4.944>3.25). As

IJPSS Volume 4, Issue 9 ISSN: 2249-5894 ___________________________________________________________
A Monthly Double-Blind Peer Reviewed Refereed Open Access International e-Journal - Included in the International Serial Directories Indexed & Listed at: Ulrich's Periodicals Directory ©, U.S.A., Open J-Gage, India as well as in Cabell’s Directories of Publishing Opportunities, U.S.A.
International Journal of Physical and Social Sciences http://www.ijmra.us
239
September
2014
observed the correlation coefficient (r) between production and export is 0.839 which
says that a high degree of correlation exists between them. Value of t being 4.361 is
significant at 1% (4.361>3.25) level of significance, which says that a significant
association exists between them. The coefficient of correlation (r) between year and
consumption is computed as 0.934, showing a very high degree of correlation between
them. The t value is computed as 7.394 being significant at 1% (7.394>3.25) level of
significance explaining a significant level of relation between export and consumption.
The coefficient of correlation (r) between production and consumption is 0.935
explaining a high degree of correlation which is statistically (t value 7.457) significant at
1% (7.457>3.25) level of significance showing a significant association between the
variables during the period of study.
Period 4 is largely influenced by period 3. From the table it is clear that correlation
coefficient between the variables is highly correlated.
Table- 3 Multiple-correlation coefficient and F value for different variables of cotton in India
Period Value RY.EV RY.PE RY.PC
1980-81 to 1990-91
Period 1
R2
0.439 0.344 0.920
F 3.13
4.74*
2.097
4.74*
45.38
4.74*
1991-92 to 2000-01
Period 2
R2 0.681 0.125 0.410
F 7.472
4.74*
0.5
4.74*
2.422
4.74*
2001-02 to 2010-11
Period 3
R2 0.833 0.966 0.976
F 17.521
4.46*
99.44
4.46*
142.33
4.46*
1991-92 to 2010-11
Period 4
R2 0.496 0.441 0.781
F 8.35
3.36*
6.706
3.36*
30.313
3.36*
*(5% level of significance)
Y –year, E- export, V- value of export, P- production and C- consumption
For period 1 multiple correlation among year, export quantity and export value is not
relevant at 0.439. The F value is calculated as 3.13 which is not statistically significant at
5% (3.13<4.74) level of significance. Same case is observed for multiple correlations
among year, production and export quantity where the variables are not statistically (F
value 2.097) significant at 5 % (2.097 < 4.74) level of significance. There is a very high
IJPSS Volume 4, Issue 9 ISSN: 2249-5894 ___________________________________________________________
A Monthly Double-Blind Peer Reviewed Refereed Open Access International e-Journal - Included in the International Serial Directories Indexed & Listed at: Ulrich's Periodicals Directory ©, U.S.A., Open J-Gage, India as well as in Cabell’s Directories of Publishing Opportunities, U.S.A.
International Journal of Physical and Social Sciences http://www.ijmra.us
240
September
2014
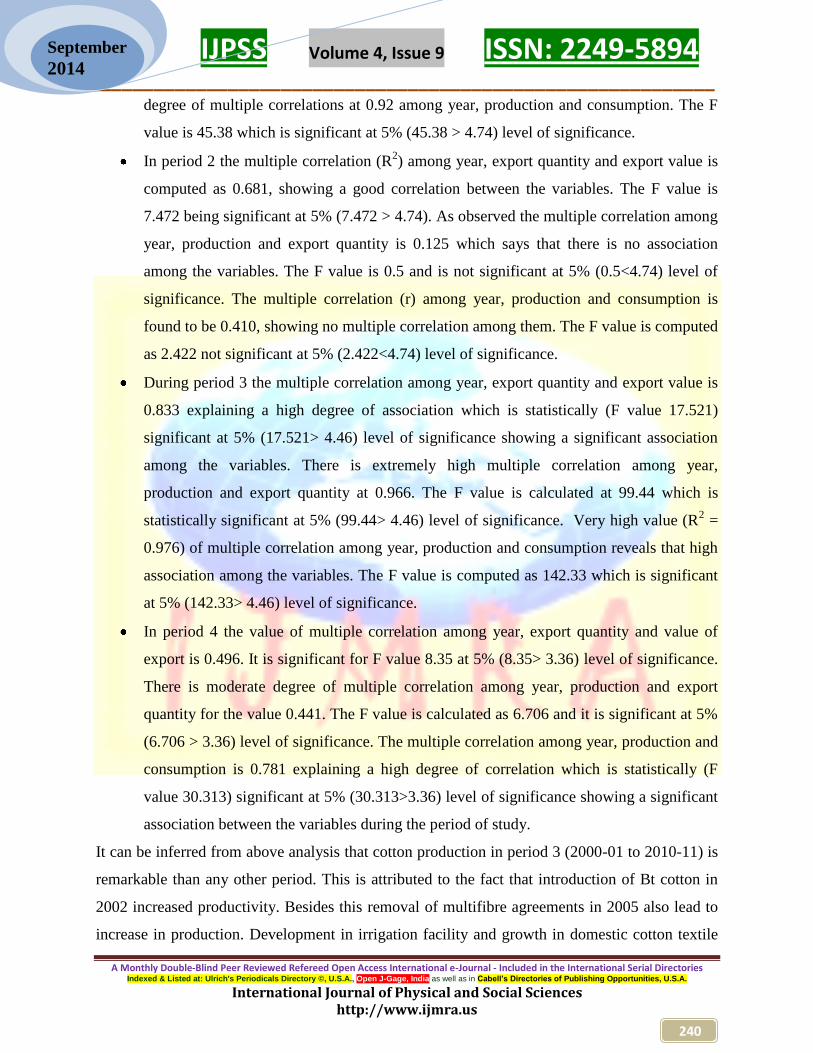
degree of multiple correlations at 0.92 among year, production and consumption. The F
value is 45.38 which is significant at 5% (45.38 > 4.74) level of significance.
In period 2 the multiple correlation (R2) among year, export quantity and export value is
computed as 0.681, showing a good correlation between the variables. The F value is
7.472 being significant at 5% (7.472 > 4.74). As observed the multiple correlation among
year, production and export quantity is 0.125 which says that there is no association
among the variables. The F value is 0.5 and is not significant at 5% (0.5<4.74) level of
significance. The multiple correlation (r) among year, production and consumption is
found to be 0.410, showing no multiple correlation among them. The F value is computed
as 2.422 not significant at 5% (2.422<4.74) level of significance.
During period 3 the multiple correlation among year, export quantity and export value is
0.833 explaining a high degree of association which is statistically (F value 17.521)
significant at 5% (17.521> 4.46) level of significance showing a significant association
among the variables. There is extremely high multiple correlation among year,
production and export quantity at 0.966. The F value is calculated at 99.44 which is
statistically significant at 5% (99.44> 4.46) level of significance. Very high value (R2 =
0.976) of multiple correlation among year, production and consumption reveals that high
association among the variables. The F value is computed as 142.33 which is significant
at 5% (142.33> 4.46) level of significance.
In period 4 the value of multiple correlation among year, export quantity and value of
export is 0.496. It is significant for F value 8.35 at 5% (8.35> 3.36) level of significance.
There is moderate degree of multiple correlation among year, production and export
quantity for the value 0.441. The F value is calculated as 6.706 and it is significant at 5%
(6.706 > 3.36) level of significance. The multiple correlation among year, production and
consumption is 0.781 explaining a high degree of correlation which is statistically (F
value 30.313) significant at 5% (30.313>3.36) level of significance showing a significant
association between the variables during the period of study.
It can be inferred from above analysis that cotton production in period 3 (2000-01 to 2010-11) is
remarkable than any other period. This is attributed to the fact that introduction of Bt cotton in
2002 increased productivity. Besides this removal of multifibre agreements in 2005 also lead to
increase in production. Development in irrigation facility and growth in domestic cotton textile

IJPSS Volume 4, Issue 9 ISSN: 2249-5894 ___________________________________________________________
A Monthly Double-Blind Peer Reviewed Refereed Open Access International e-Journal - Included in the International Serial Directories Indexed & Listed at: Ulrich's Periodicals Directory ©, U.S.A., Open J-Gage, India as well as in Cabell’s Directories of Publishing Opportunities, U.S.A.
International Journal of Physical and Social Sciences http://www.ijmra.us
241
September
2014
industry also forced to augment cotton production in India. With increase in production for the
same period cotton was consumed in domestic industries for value addition and surplus was
exported and valuable foreign exchange was earned. It is worth for India that it is exporting less
cotton. It signifies that most of the cotton produced is consumed domestically in spinning
industries and later stages for producing varieties of higher value added product. But the rate at
which market for textile increases this production of cotton will not be sufficient for fulfilling the
domestic demand. At this point India will not be able to compete with its competitors and it will
be tough to survive in this competitive market. With increase in population, increase in income,
change in life style demand of cloth increases at an exponential rate. India has to keep pace with
the market trend so that it keeps on enhancing production and supplying it to the domestic
market.
Conclusion
The globalisation of Indian trade has provided new and wider opportunities. Although there is
increase in consumption of raw cotton in domestic industries but India is not able to keep pace
with the existing as well as increasing textile demand in the market. The finding of the analysis
reveals that existence of high instability in cotton production has an adverse effect on Indian
consumption which should be controlled by policymakers to retain its position in the
international market. Government‟s unsupportive policy and inappropriate pricing strategies
have made the farmers reluctant from cotton production and hence productivity has not increased
to the level when compared to its competitor and put the country at stake. Indian economists and
policymakers need considerable participation to accelerate the cotton productivity in order to
fulfill increasing domestic consumption. To meet the current demand as well as address the
demand growth in the future, India has to keep pace with the market trend so that by increasing
cotton production the value chain of cotton can be improved.

IJPSS Volume 4, Issue 9 ISSN: 2249-5894 ___________________________________________________________
A Monthly Double-Blind Peer Reviewed Refereed Open Access International e-Journal - Included in the International Serial Directories Indexed & Listed at: Ulrich's Periodicals Directory ©, U.S.A., Open J-Gage, India as well as in Cabell’s Directories of Publishing Opportunities, U.S.A.
International Journal of Physical and Social Sciences http://www.ijmra.us
242
September
2014
References
[1] Bigman. D., Suleiman. A., Bader., 2004, The Role and constraints of WTO in conflict
Resolution: The Lessons from WTO Rulings in Sugar and Cotton Trade Subsidies, paper
presented at a workshop on “Agricultural Trade Liberalisation and the Least Developed
Countries”, Wagenningen.
[2] Chacko. S., and Toor. M.S., 2007, “Changing scenario of cotton production and trade in
India”, J. Agri. Develop. Policy, 17 (1 & 2), pp 58-69.
[3] Cotton Corporation of India. 2014, http://www.cotcorp.gov.in/statistics.asp. accessed in Jan
2014.
[4] Devaraja. T. S., 2011, a working paper “Indian Textile and Garment Industry - An Overview”
[5] International Cotton Advisory Committee ICAC., 2010, “Outlook for World Cotton Supply
and Use,” Eurocotton, 49th
General Assembly, June 2010, Paris, France.
[6] Kranthi. K. R., Venugopalan. M. V., Sabesh. M., Yadav. M. S., 2011, “Vision 2030”, Central
Institute of Cotton Research
[7] Kumar. D., 1997, an article in Asian Agri-History, Vol. 1, No. 2
[8] Kumari. N., 2012, “Effect of Economic Indicators on Export Performance of India: Pre and
post Liberalisation period”, European Journal of Business and Management, Vol 4, No.16
[9] Macdonald. S. and Thomas Vollrath, 2005, The Forces Shaping World Cotton Consumption
After the Multifiber Arrangement, CWS-05c-01, U.S. Department of Agriculture, Economic
Research Service, April 2005, 30 pp,http://www.ers.usda.gov
[10] Mahadevaiah. G.S., Ravi. P. C. and Chengappa. P.G., 2005, “Stability Analysis of Raw
Cotton Export Markets of India – Markov Chain Approach” Agricultural Economics Research
Review Vol. 18, pp 253-259
[11] Mal. M. and Pandey, A. K., 2013, “Instability and Relative Growth Trend Analysis of Area,
Production and Productivity of Cotton Crop in India” International Journal of Agricultural
Economics and Management, ISSN 2277-3215 Volume 3, Number 2 (2013), pp 35-42
[12] Ratna. R. S., 2009, “Cotton Production, Exports and Price: A Comparative Analysis of India
and USA”,discussion paper No. 2, Centre for WTO Studies
[13] Santhanam. V. and Sundaram V., 1997, an overview „Agri-History of Cotton in India‟,
Asian agri-History, Vol No. 4, pp 235-251
IJPSS Volume 4, Issue 9 ISSN: 2249-5894 ___________________________________________________________
A Monthly Double-Blind Peer Reviewed Refereed Open Access International e-Journal - Included in the International Serial Directories Indexed & Listed at: Ulrich's Periodicals Directory ©, U.S.A., Open J-Gage, India as well as in Cabell’s Directories of Publishing Opportunities, U.S.A.
International Journal of Physical and Social Sciences http://www.ijmra.us
243
September
2014
[14] Sood. D., 2013, a report by Global Agricultural Information Network (GAIN), USDA
“India cotton and products Annual”, GAIN Report Number: IN3028
[15] A speech by Srinivas. V., 2013, Cotton distribution Policy, Global Cotton Conference,
Mumbai
[16] The Textile Magazine. 2012, “USDA predicts fall in India‟s 2012-13 cotton production”,
[17] The Indian Textile Journal. 2010, “Indian cotton production: Current scenario”, an article,
www.indiantextilejournal.com
[18] WWF and Yes Bank. 2012, “Cotton market and sustainability in India- a report”, published
by WWF – India