instant gratification: taking the fast track to visual analysis
TRANSCRIPT

Grab some coffee and enjoy the pre-show banter before the top of the hour!

The Briefing Room
Instant Gratification: Taking the Fast Track to Visual Analysis


Twitter Tag: #briefr
The Briefing Room
! Reveal the essential characteristics of enterprise software, good and bad
! Provide a forum for detailed analysis of today’s innovative technologies
! Give vendors a chance to explain their product to savvy analysts
! Allow audience members to pose serious questions... and get answers!
Mission

Twitter Tag: #briefr
The Briefing Room
Topics
This month: DATA DISCOVERY & VISUALIZATION
December: INNOVATORS
2014 Editorial Calendar at www.insideanalysis.com/webcasts/the-briefing-room

Twitter Tag: #briefr
The Briefing Room
Data Discovery & Visualization

Twitter Tag: #briefr
The Briefing Room
Analyst: Robin Bloor
Robin Bloor is Chief Analyst at The Bloor Group

Twitter Tag: #briefr
The Briefing Room
Acunu
! Acunu offers a Cassandra-based real-time operational intelligence and analytics platform
! Its platform allows Cassandra users to build and extend business applications without being a database expert
! Acunu Analytics provides the ability to leverage customizable and re-usable analytic apps and widgets on top of its analytics layer, and it automatically recommends the most appropriate visualization

Twitter Tag: #briefr
The Briefing Room
Guest: Tim Moreton
Tim is an expert in distributed file systems. He was previously a senior member of the technical team at Tideway (now BMC), where he led the creation of solutions for managing data centers at Fortune 500 clients. Previously he was CEO of a consultancy delivering data solutions for the aviation sector. He holds a Ph.D. in Computer Science from Cambridge University.

Tim Moreton CTO @timmoreton
Instant Gratification: Taking the Fast Track to Visual Analytics

Big Data: Haystack or FastTrack
11
Discovery Analytics
Unstructured���Warehouses
Data ���Mining
Machine Learning
Operational Intelligence
Dashboards Real-time Decisions
Alerting
Complex, long-running Total lack of structure
Low latency, fresh data Some structure to exploit
11

Metrics dashboards��� and business intelligence
Trending and alerting OPERATIONAL ���INTELLIGENCE
Data-driven features
Embedded dashboards
RICHER���APPLICATIONS
Location Data
Clickstream
Application logs
Infrastructure
Fast Datasets
12

Analytics turns events and SQL-like queries into C* operations
Events
Cassandra stores raw events and intermediate results
Acunu Dashboards: embeddable, in-browser visualizations
Alerts
13
Acunu Analytics: BI for Fast Datasets

14
Ø Scalable. No single point of {failure, bottleneck}
Ø Fast. Especially for writes
Ø Available. Effortless Multi-DC support
Ø Dependable. Widespread mission-critical use
Ø Counters. Building block of analytics!
WE
14
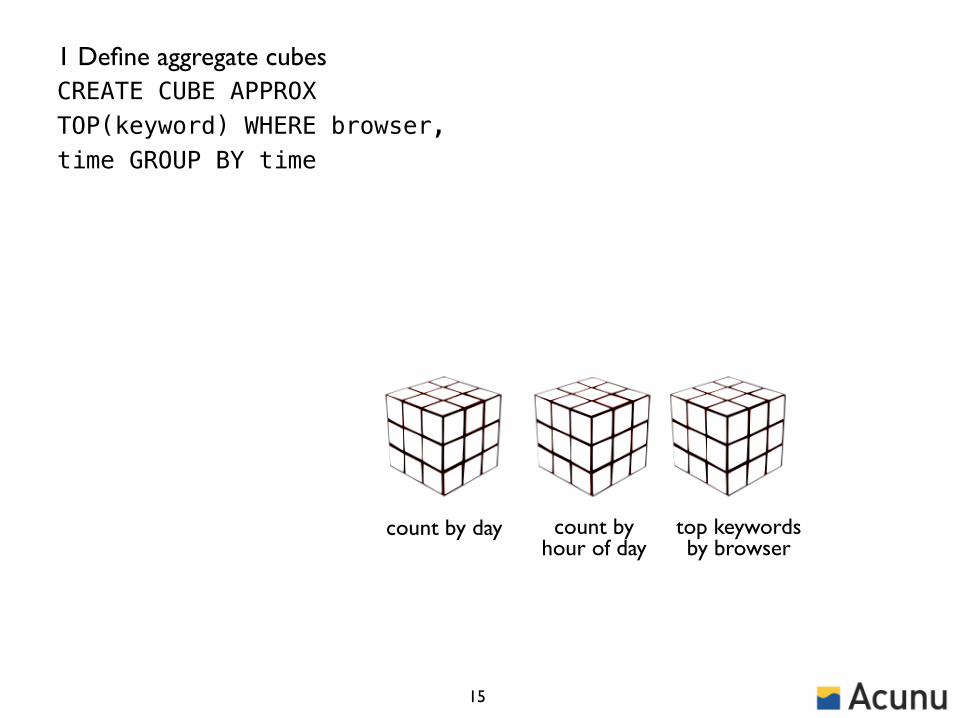
count by day count by hour of day
top keywords by browser
1 Define aggregate cubes CREATE CUBE APPROX TOP(keyword) WHERE browser, time GROUP BY time !
15

2 New events update cubes
count by day count by hour of day
top keywords by browser raw events
1 Define aggregate cubes CREATE CUBE APPROX TOP(keyword) WHERE browser, time GROUP BY time !
16

count by day count by hour of day
top keywords by browser raw events
3 Rich instant queries over cubes SELECT TOP(keyword) FROM table WHERE browser = ‘chrome’ AND time BETWEEN.. !GROUP BY d1, d2, ... !JOIN ... HAVING.. ORDER BY .. !
+
17
1 Define aggregate cubes CREATE CUBE APPROX TOP(keyword) WHERE browser, time GROUP BY time !2 New events update cubes

count by day count by hour of day
top keywords by browser raw events
3 Rich instant queries over cubes SELECT TOP(keyword) FROM table WHERE browser = ‘chrome’ AND time BETWEEN.. !GROUP BY d1, d2, ... !JOIN ... HAVING.. ORDER BY .. !
+
18
1 Define aggregate cubes CREATE CUBE APPROX TOP(keyword) WHERE browser, time GROUP BY time !2 New events update cubes
4 Drilldown to raw events

count by day count by hour of day
top keywords by browser raw events
3 Rich instant queries over cubes SELECT TOP(keyword) FROM table WHERE browser = ‘chrome’ AND time BETWEEN.. !GROUP BY d1, d2, ... !JOIN ... HAVING.. ORDER BY .. !
+
19
1 Define aggregate cubes CREATE CUBE APPROX TOP(keyword) WHERE browser, time GROUP BY time !2 New events update cubes
5 Populate new cubes from historic data
2020
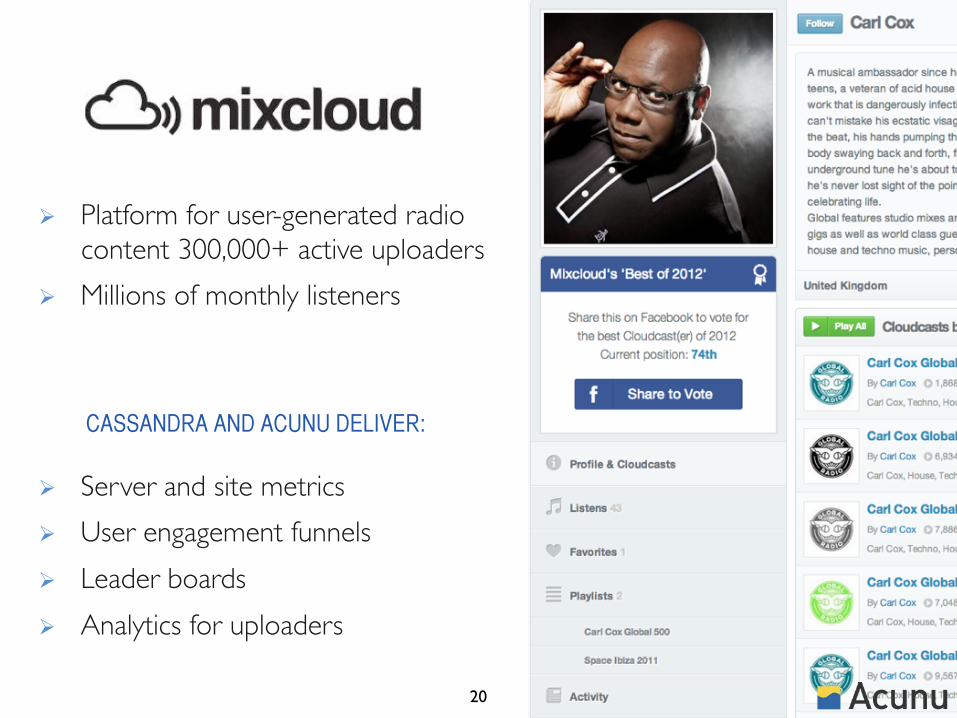
Ø Platform for user-generated radio content 300,000+ active uploaders
Ø Millions of monthly listeners
Ø Server and site metrics Ø User engagement funnels Ø Leader boards Ø Analytics for uploaders
CASSANDRA AND ACUNU DELIVER:

Ø World’s top-rated taxi app Ø Serving 15 cities globally Ø 500,000 registered users Ø Clusters in 3 AWS regions
CASSANDRA AND ACUNU DELIVER:
Ø Instant driver, user metrics Ø Real-time A/B testing Ø In-app location analytics
21

Install 1 Create tables 2 Define
cubes 3 Turn on data feed 4 5 Refine
cubes 6
Dev Dev Dev Dev Business Dev
5
With Acunu Analytics 4.3
22
Six steps to enlightenment
Build widgets

With Acunu Analytics 5.0
23
Enlightenment for mere mortals
Install 1 2 Turn on data feed 4 3
Dev Dev Business Business Business
3 2 Upload events
Build widgets 5 Refine
widgets

With Acunu Analytics 5.0
24
Enlightenment for mere mortals
Install 1 2 Turn on data feed 4 3 5
Dev Dev Business Business Business
3 2 5 Upload events
Build widgets
Refine widgets
Automatically infer tables and schema from sample events

With Acunu Analytics 5.0
25
Enlightenment for mere mortals
Install 1 2 Turn on data feed 4 3 5
Dev Dev Business Business Business
3 2 5 Upload events
Build widgets
Refine widgets
Drag-and-drop Explore view infers the cubes needed to build the widget you want

With Acunu Analytics 5.0
26
Enlightenment for mere mortals
Install 1 2 Turn on data feed 4 3 5
Dev Dev Business Business Business
3 2 5 Upload events
Build widgets
Refine widgets
Widgets can be refined and repopulated with historic data automatically

With Acunu Analytics 5.0
27
Enlightenment for mere mortals
Install 1 2 Turn on data feed 4 3 5
Dev Dev Business Business Business
3 2 5 Upload events
Build widgets
Refine widgets
Out-of-the-box HTTP, Flume, Kafka and MQ integrations, ���plus new API to build your own
Tim Moreton CTO @timmoreton @acunu
Thanks!
Twitter Tag: #briefr
The Briefing Room
Perceptions & Questions
Analyst: Robin Bloor


A Maturing Analogy
Exaggerated comparisons between computer systems and the biological nervous system have been made for decades
Maybe such comparisons are no longer so exaggerated

The Human System
u The body is controlled via the autonomic nervous system: • Enteric (gastrointestinal
system) • Sympathetic (fight or flight,
homeostasis) • Parasympathetic (rest-and
digest, feed-and-breed) u This constitutes the fast
human response system – the operational system

The Human Brain
u The human brain complements the autonomic nervous system
u In general, it is much slower, even when working at its highest speed (about 0.1 secs response)
It interprets sensory
impressions
It reasons and learns
It thinks associatively

Enterprise Information Processing
Pursuing the analogy, there is a slow and a fast enterprise control system/nervous system:
u SLOW: This equates to normal BI and embraces everything from data analysis/data science to BI reporting
u FAST: This equates to Operational Intelligence – those BI systems which provide information to enable immediate response by people or software

Real Time is What?
We define a real-time latency to be one where there is operational urgency. Operational Intelligence can be thought of as real-time.
u Data analysis may yield knowledge that can be implemented as OI
u OI should be served to software as data
u OI should be served to users in context and in its most easily digested form: alerts, visualization
u It demands fast infrastructure
THE CONTEXT DETERMINES THE INFORMATION SERVICE, AND ITS CHARACTER AND REQUIRED SPEED

Going Forward
Ultimately, SOFTWARE
ARCHITECTURE will be determined by these differing
latencies.

u What is the role of Cassandra?
u Typically what latencies does Acunu need to satisfy?
u There are many varieties of data visualization; which techniques and UI features does Acunu regard as being most important and why?
u OI systems can take considerable time to build. What does a normal Acunu implementation involve and how long does it take?

u Which industry sectors do you see as early adopters of BI?
u What is Acunu’s Hadoop story? Is Hadoop relevant to Acunu?
u What is your view of the OI market? Who do you see as competitive and who do you see as complementary?

Twitter Tag: #briefr
The Briefing Room

Twitter Tag: #briefr
The Briefing Room
Upcoming Topics
www.insideanalysis.com
November: DATA DISCOVERY & VISUALIZATION
December: INNOVATORS
2014 Editorial Calendar at www.insideanalysis.com/webcasts/the-briefing-room

Twitter Tag: #briefr
The Briefing Room
Thank You for Your
Attention