institute - british geological survey
TRANSCRIPT

Natural Environment Research Council
Institute
Mineral
A report prepared for the Department of Industry

This report relates to work carried out by the Institute of Geological
Sciences on behalf of the Department of Industry. The information
contained herein must not be published without reference to the
Director, Institute of Geological Sciences
D. Ostle
Programme Manager
Institute of Geological Sciences
Keyworth
Nottingham NG12 5GG
No. 24
Geophysical investigations along parts of the Dent and Augill Faults
I I I I I
1 I
1
INSTITUTE OF GEOLOGICAL SCIENCES
Natural Environment Research Council
Mineral Reconnaissance Programme
Report No. 24 Geophysical investigations along parts of the Dent and Augill Faults
Geophysics
J. D. Cornwell, MSc, PhD
D. J. Patrick, BSc, PhD, MIMM
Geology
J. M. Hudson, BSc
0 Crown copyright 1978
London 1978 A report prepared for the Department of Industry

Mineral Reconnaissance Programme Reports
1
2
3
4
5
6
7
8
9
10
11
12
13
14
15
16
17
18
19
20
21
22
23
24
The concealed granite roof in south-west Cornwall
Geochemical and geophysical investigations around Garras Mine, near Truro, Cornwall
Molybdenite mineralisation in Precambrian rocks near Lairg, Scotland
Investigation of copper mineralisation at Vidlin, Shetland
Preliminary mineral reconnaissance of Central Wales
Report on geophysical surveys at Struy, Inverness- shire
Investigation of tungsten and other mineralisation associated with the Skiddaw Granite near Carrock Mine, Cumbria
Investigation of stratiform sulphide mineralisation in parts of central Perthshire
Investigation of disseminated copper mineralisation near Kimelford, Argyllshire, Scotland
Geophysical surveys around Talnotry mine, Kirkcudbrightshire, Scotland
A study of the space form of the Cornubian granite batholith and its application to detailed gravity surveys in Cornwall
Mineral investigations in the Teign Valley, Devon. Part 1 -Barytes
Investigation of stratiform sulphide mineralisation at McPhun’s Cairn, Argyllshire
Mineral investigations at Woodhall and Longlands in north Cumbria
Investigation of stratiform sulphide mineralisation at Meall Mor, South Knapdale, Argyll
Report on geophysical and geological surveys at Blackmount, Argyllshire
Lead, zinc and copper mineralisation in basal Carboniferous rocks at Westwater, south Scotland
A mineral reconnaissance survey of the Doon-Glenkens area, south-west Scotland
A reconnaissance geochemical drainage survey of the Criffel-Dalbeattie granodiorite complex and its environs
Geophysical field techniques for mineral exploration
A geochemical drainage survey of the Fleet granitic complex and its environs
Geochemical and geophysical investigations north- west of Llanrwst, North Wales
Disseminated sulphide mineralisation at Garbh Achadh, Argyllshire, Scotland
Geophysical investigations along parts of the Dent and Augill Faults
The Institute of Geological Sciences was formed by the incorporation of the Geological Survey of Great Britain and the Geological Museum with Overseas Geological Surveys and is a constituent body of the Natural Environment Research Council
Bibliographical reference Cornwell, J. D. and others. 1978. Geophysical investigations along parts of the Dent and Augill Faults * Miner. Reconnaissance Programme Rep. Inst. Geof. Sci., No. 24
Printed in England for the Institute of Geological Sciences by Ashford Press Ltd.

1
CONTENTS
Summary
INTRODUCTION
GEOLOGY
FORMER MINING
MINERAL POTENTIAL
REGIONAL GRAVITY SURVEYS
AIRBORNE GEOPHYSICAL SURVEYS
DETAILED GEOLOGICAL AND GROUND GEOPHYSICAL SURVEYS
Windmore End
Augill Head
Dummah Hill
North Stainmore
Greenhow Rigg
Leonards Crag
Long Rigg
Dowgill
Little Longrigg Scar
Fell House
Birkett Common
Kitchen Gill
CONCLUSIONS
Page
2
3
3
8
9
10
15
16
16
19
19
19
19
21
21
21
21
21
21
23
26
Fig. 1
Fig. 2a
Fig. 2b
Fig. 3
Fig. 4
Fig. 5
Fig. 6
Fig. 7
ILLUSTRATIONS
Locality map and topography of the Dent and Augill Faults area 4
Generalised geological map of the Dent and Augill Faults area 5
Generalised vertical section of the Carboniferous rocks 6
Bouguer anomaly map with contours at 1 mGa1 (= 10 gravity units) intervals
Bouguer anomaly profiles, topographical sections and geology along three traverses shown on Fig. 3.
Detailed geology of part of the Augill Fault
Detailed geology of part of the Dent Fault
Results of detailed geophysical surveys south of Kirkby Stephen and near the main faults.
11
13
18
20
22

2
Summary
The mineral investigations described in this report consisted of an
airborne electromagnetic (AEM), radiometric and magnetic survey over
selected parts of the Dent and Augill Faults, followed by ground studies
of the most promising anomalies. The follow-up work consisted of
electromagnetic surveys, using VLF, Turam and Slingram methods, and
detailed geological mapping. A gravity survey was undertaken to provide
Bouguer anomaly data typical of the margins of the Lower Carboniferous
blocks in the northern Pennines.
The value of the airbornesurvey was limited by electricity power line
interference in some parts of the area. Twelve AEM anomalies were
investigated on the ground but five of these proved to be due to buried
metal water pipes. Another five were associated with conductive shale or
mudstone horizons in the Carboniferous
produced anomalies at Kitchen Gill and
both faults and mudstone outcrops. In
are close to disused mine workings and
sequence. The VLF and Turam methods
Birkett Common which correlate with
the former area the AEM anomalies
may be due in part to
mineralisation, but the targets were not sufficiently promising to justify
boreholes. Anomalies at Long Rigg and Dowgill are thought to be due to
conductive boulder clay.
The regional gravity survey indicated that the main faults are
characterised by weak Bouguer anomaly highs. Other anomalies are not
readily accounted for by the distribution of near-surface rocks and
therefore probably reflect variations in the basement. Such changes may
be generally useful in defining the boundaries of uplifted blocks of basement
rocks.
Copies of the data and maps for the airborne and ground geophysical
surveys are deposited with the Applied Geophysics Unit of IGS, London.

3
INTRODUCTION
The areas covered in the present investigation lie near the towns of
Brough and Kirkby Stephen. They include parts of the Dent and Augill
Faults, which form the western margins of the Askrigg and Alston Blocks
respectively.
I The higher ground is open moorland used for sheep-grazing and is diffi-
cult of access except to cross-country vehicles, but the lower ground is in
I agriculturai use , generally as pasture, and is well served by roads and tracks.
I
The airborne electromagnetic (AEM) survey was restricted to the areas
of known mineral veins (Fig. 1) along the Dent and Augill faults. NO
geochemical exploration was undertaken because of widespread contamination
from the numerous mine dumps.
GEOLOGY
The northern part of the area shown in Fig. 1 was re-surveyed between
1958 and 1967 (Burgess and Holliday, in press) following the 19th-century
primary survey. The southern part has not been completely re-surveyed,
although parts of it were revised for the 1 inch to 1 mile scale geological
map (Kirkby Stephen sheet 40) published in 1972 and detailed mapping of
selected areas has formed part of the present investigations.
The area is mainly underlain by Carboniferous rocks (Fig. 2) and details
of the successions are given in Figs. 2, 5 and 6. Permo-Triassic deposits are
present to the west, j ust beyond the areas of detailed work (Fig. 2).
The oldest Carboniferous rocks exposed are the Orton Group, comprising
marine limestones with sandstones and shales. The lower part of the overlying
Alston Group consists of the massively bedded Great Scar Limestone, about 100 m
thick. The succeeding beds comprise alternating limestones, mudstones,
siltstones and sandstones deposited in a sequence of cyclothems. These are
internally very variable and any one cyclothem is rarely fully developed.

Fig. 1. Locality map and topography of the Dent and Augill Faults area
Brough /
AUGI LL AREA DOWgTil
//-
Kirkby Stephen m
.y.>:.s.> h
I , .
...... .. . . . . . .y.. .. C ........
.~~.~:.:.:.:...:.:.:.:.: , .... ,.x,
>:.>:.~~.y.~:
...... .......................................... .5, . . . ................
.:...:.:.:.:&..< 2.. .. .... ... .... .......... .... :.:.:.~:.:.:.:.:.:.:.:.~.:.:.:.:.:.:.:~.:.:.:.:
. ......... . . . . . .... .., ......... f.. . ... . :.s
...... ..........
..A.. ....
.......... . A. ................... 0. -.
......................................................................................
.:.:.:.:.:.:.:.:.:~.:.:.:.:.:.:~...:.:.:.:.:.:.:.:.:.:.:.:.:.:.:::.:.:.:.:.:.:.:.:.:.:.:.:.: .:.
.................
..y..:.:.:.:<+): .a .......... >. ........... ........... ...... . . .......... ... . . ... ... ... .* ..................
............................ ..A v * . . ... .
.
. . .... . .
............. . ............................................ .
. . ..... . . . . . . .
...... . .....................
>i” ., . .
i.
0.. ...............
...... ................
. .
# .,......,
>. ..................................................................... ..........
.............
. . . . . . . . . . . . . . ........... <.
...................... ,
. . . . . . . . . . . . . . ..A.. . :.:s+:.:+:+:.:~: ...... ..V>.!...~ ................
)AREA/ (.
Above 1500 Feet
t1 : llm-mwFi#t
El Below IWO Feet
0 1 2 Miles 1 I I
I I I 0 1 2 3 Km.
4

5
Fig. Za. Generalised geological map of the Dent and Augill Faults area.

Fig. Zb. GENERALISED VERTICAL SECTION
:. ..:: :: .. .;: ::::. . :::;. ......................
............. . ..........
.:. .........
‘.:.‘.‘.‘.’ .... ....
Peasah Wood Limestone
Upper Felltop Limestone
Upper Stonedale Limertone
LxtHo*le
Crow Limostone (CrL)
. .._.‘.’
.::.: . . . . . .
. . . . *_.:::: . .._ ::..::....._
*... ::... ::..... ..<. . . . . . . 1 Little Limestone . .:. ... . :: .:: .:*:.. : : . . . . ::. -:: . . . . . 1::: .:::;::. . ..* *.::._. .1-c . . .:.; ..*. ::. . . . . . .
Great Limestone (GL)
Iron Post Limestone
Four Fathom Limestone (4FLI
Three Ya$ytjmestone
Five Yar$vLyestone
Scar kiSrnn;tone ........
R
................ ....... ...........
Cockleshell Limestone
Single Post Limestone
Tynebottom Limestone
L/yLytone
Lower Lij$Lymestone
R
Smidd,yL&yestone
Great Scarar~L;)ostone
Metres Feet
o-o
-100
!50-
-200
-300
lOO-
_-400
‘a--500
-600
200-
-700
-800 250-
--%I0
300- -loo0
-1100
3!50-
- 1200
&loo_-1300
-1400
450-
-1500

7
Pale grey limestones predominate in the lower part of the sequence and
darker limestones are more common higher in the group. Both types of
limestone are biomicrites and are commonly pseudo-brecciated. On the
Alston Block the group is about 300m thick, thickening to about 600m in
the Stainmore Trough. On the Askrigg Block the group is generally about
400m thick, but it thickens to about 700m along the western margin.
The base of the Namurian is taken on palaeontological grounds at the
base of the Great Limestone, although this is the last limestone in the
succession with characteristics similar to those of the Alston Group. The
other Namurian limestones are muddy, often siliceous.and thinner. The
Namurian sequence is cyclic with alternations of mudstones, siltstones and
sandstones which vary laterally.
Coal Measures of Westphalian age are exposed in the Stainmore outlier
where over 300m of strata dip steeply and are much faulted against the
Augill and Argill faults (Owens and Burgess, 1965). ’
The main structure of the area consists of the Alston Block in the north
and the Askrigg Block to the south, separated by the Stainmore Trough. The
southern part of the Vale of Eden Syncline lies west of the faults bounding
these blocks. Movements on the boundary faults were complex, with the
initial movements taking place in end-Silurian times. During the Armorican
earth movements, compressional forces produced an easterly-facing monocline
along these fault-lines which was succeeded by westerly down-faulting under
later tensional movements. Similar tensional forces during the Alpine earth
movements also produced westerly down-throws of between 300 and 500m in the
northern part of the area. These various stresses and associated movements
produced steeply dipping or overturned strata, together with a belt of tight
folds along the major faults (Burgess and Holliday, in press). Between
Brough and the area north of Kirkby Stephen, where the Dent and Augill Faults
meet, the local structural pattern is even more complex.

FORMER MINING
Veins were mined in the area as early as the beginning of the 19th
century, if not earlier, but production was small compared with that of other
mines in the Pennines and by the 1880s the local industry was in rapid
decline. The mines produced mostly lead with a small amount of zinc.
Several mines produced barytes but copper was rarely present and then only
in very small quantities. Generally in the Pennines the principal ore-
bearing horizons are the Great Limestone and the highest limestones of the
Alston Group. In the present area, however, mining was confined to the
I Lower Alston Group , particularly the Great Scar and Robinson Limestones
adjacent to the Argill and Augill Faults. Mineralisation generally took the
form of both veins and flats associated with shearing on these faults and
developed in the broken ground of the adjacent country rocks.
The Augill mine [823 1553 p ro d uced galena and barytes from ankeritised
Great Scar Limestone. This deposit is unusual for the area, being a low-
grade disseminated orebody. Both surface and underground working were
carried out but the extent of the mine and the tonnage extracted are unknown
(Burgess and Holliday, in press). Cabbish Mine [841 1603 produced galena
and barytes, mainly from the Great Limestone, with minor amounts from
adjacent sandstones and shales. The workings are fairly extensive and the
deposit was not exhausted when the mine closed in 1920 (Wilson and othersJ922).
East of Kirby Stephen [797 075 and 802 0805 and at Great Bell 2787 0461,
galena, barytes and fluorspar were obtained, at times in appreciable
quantities, from the Great Scar Limestone. At the workings east of Kirby
Stephen, small shows of copper were found during the early mining operations.

9 a 1 1 1 I
MINERAL POTENTIAL
The geology of the Dent-Augill area suggests certain similarities to the
geological setting of the Irish base-metal deposits. The Irish deposits
occur in carbonate rocks , generally of Courceyan age, lying near the base
of a thick Lower Carboniferous succession and commonly faulted against Lower
Palaeozoic rocks. The origin of the Irish deposits is not fully understood,
the ores having characteristics of both syngenetic mineralisation and
epigenetic mineralisation from brines (Evans, 1976; Skevington, 1971). In
both Ireland and the Pennines, mineralisation is associated with rigid
blocks and sedimentary basins separated by major faults, which in some cases
were growth-faults during Lower Carboniferous sedimentation. In the Dent-
Augill area, there are two lines of this type bounding the eastward-trending
Stainmore Trough - the Lunedale Fault and the Stockdale Monocline (Cornwell
and Wadge, in preparation Fig. 2). Analogy with Ireland suggests that the
lowest carbonates in the sequence are favourable horizons for mineralisation,
but these beds are generally covered by younger rocks and are accessible
only where brought to the surface by the Dent and Augill Faults. The potential
for mineralisation seems greatest, therefore, where these faults intersect
the margins of the Stainmore Trough.
The mainly limestone succession in the Lower Alston Group seems the most
promising host-rock for sulphide mineralisation and the mudstones higher in
the group provide potential cap rocks. Thus zones of mineralisation may be
expected over a range of depths at times too great for location by surface
mapping or geochemical sampling. In addition, it is possible that the known
mineralisation along the Dent and Augill Faults was formed by upward
leakage from deeper mineralisation. Much of the present work was aimed at
locating near-surface occurrences so that these could be tested at greater
depths for larger deposits.

a a t I I 1 I I 1 I I 1 a c 1 I P t I 1
10
REGIONAL GRAVITY SURVEYS
The Dent and Augill Faults area was included in routine regional
gravity surveys carried out by the Applied Geophysics Unit and the general
results were published on a 1:250,000 scale Bouguer anomaly map (Institute
of Geological Sciences, 1977 - 1:250,000 Bouguer Gravity Anomaly Map.
Lake District, Sheet 54' N - 04'W). The Bouguer anomaly map of the Alston
Block was described by Bott and Masson Smith (1957), who included some of
the few published interpretations of Bouguer anomalies associated with
block margins. They pointed out that the decrease in Bouguer anomaly
values across the Stublick Fault and the Ninety Fathom Dyke, forming the
northern margin of the Alston Block, could be due to thickening of the
Lower Carboniferous sediments into the Northumberland Trough. Similarly
they described a decrease in Bouguer anomaly_ values across the Lunedale
Fault, at the southern edge of the Alston Block, and ascribed this to
thickening of the Lower Carboniferous rocks in the Stainmore Trough.
Since the station density of the original survey of the Dent-Augill
Faults area was inadequate to define the anomalies associated with the main
structural features, additional gravity observations were made. It was not
possible to establish new stations in the large tracts of moorland lacking
elevation control and, in the north-west, on the Warcop firing range, but
2 249 stations were occupied, giving an average cover of 1 station per km .
After standard corrections, the data were plotted as Bouguer anomalies
(Fig. 3). -3
A uniform density of 2.70 g cm was assumed for the Bouguer
correction, so that anomalies over rocks of markedly different density
(e.g. Permo-Triassic at 2.40 g cmM3> are distorted and may correlate with
topography. Individual profiles were selected (Fig. 4) over anomalies of
interest and reduced to an arbitrary datum level using densities appropriate
to the underlying beds, whose thicknesses were estimated from the geological
maps.

11 I t 1 1 t 1 I t t I I 1 t t 1 t t t t 1
Fig. 3. Bouguer anomaly map with contours at 1 mGa1 (= 10 gravity units) intervals.
l Gravity Station
1 a a a a 1
12
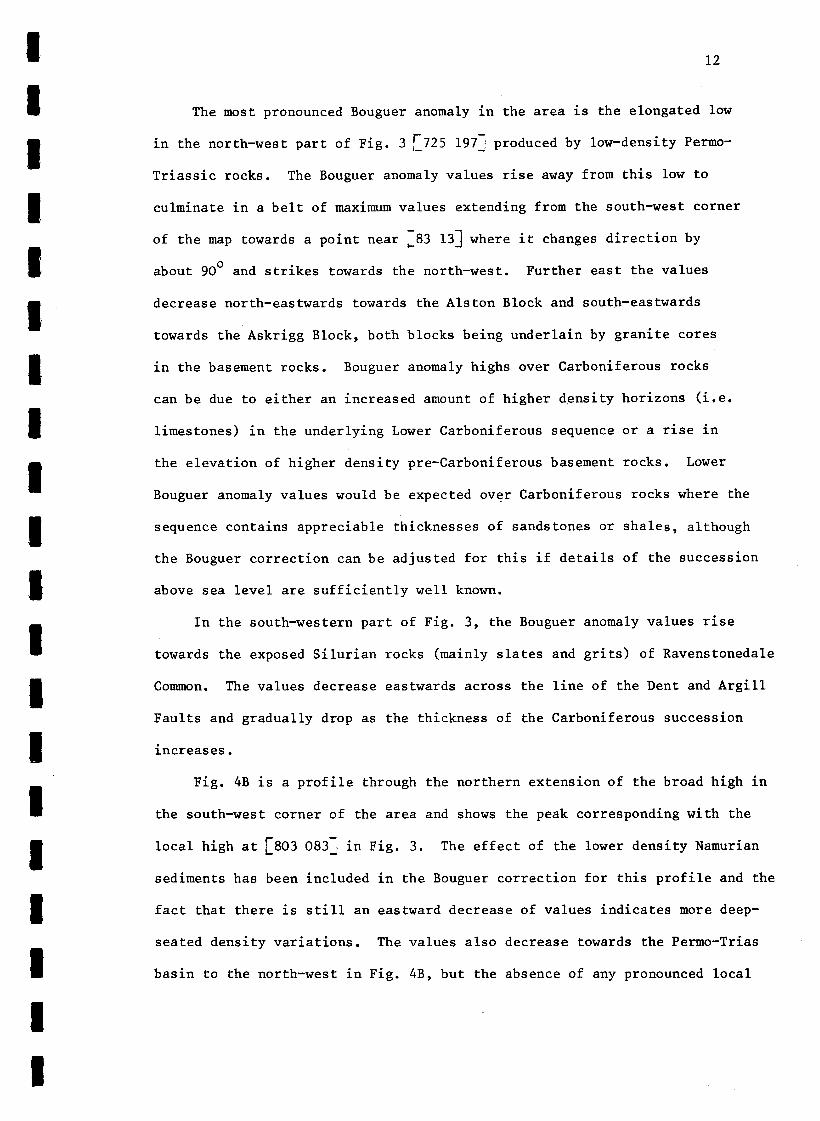
The most pronounced Bouguer anomaly in the area is the elongated 10~
in the north-west part of Fig. 3 [725 1971 produced by low-density Permo-
Triassic rocks. The Bouguer anomaly values rise away from this low to
culminate in a belt of maximum values extending from the south-west corner
of the map towards a point near i83 131 where it changes direction by
about 90' and strikes towards the north-west. Further east the values
decrease north-eastwards towards the Alston Block and south-eastwards
towards the Askrigg Block, both blocks being underlain by granite cores
in the basement rocks. Bouguer anomaly highs over Carboniferous rocks
can be due to either an increased amount of higher density horizons (i.e.
limestones) in the underlying Lower Carboniferous sequence or a rise in
the elevation of higher density pre-Carboniferous basement rocks. Lower
Bouguer anomaly values would be expected over Carboniferous rocks where the
sequence contains appreciable thicknesses of sandstones or shales, although
the Bouguer correction can be adjusted for this if details of the succession
above sea level are sufficiently well known.
In the south-western part of Fig. 3, the Bouguer anomaly values rise
towards the exposed Silurian rocks (mainly slates and grits) of Ravenstonedale
Common. The values decrease eastwards across the line of the Dent and Argill
Faults and gradually drop as the thickness of the Carboniferous succession
increases.
Fig. 4B is a profile through the northern extension of the broad high in
the south-west corner of the area and shows the peak corresponding with the
local high at [803 0831 in Fig. 3. The effect of the lower density Namurian
sediments has been included in the Bouguer correction for this profile and the
fact that there is still an eastward decrease of values indicates more deep-
seated density variations. The values also decrease towards the Permo-Trias
basin to the north-west in Fig. 4B, but the absence of any pronounced local

Fig. 4. Bouguer anomaly profiles, topographical sections and geology along three traverses shown on Fig. 3. SW NE
\ . A’
\
A
/ l -. .
. .c\./ l -L.
I \._*-
.
\
.
. /
. /
600 - N
400-
I AO@O I
650210
B SE NW
I
LOO2O I 1 773126
C SW NE C
1 PEWO-TRlAs
N NAMURIAN
D DINANTIAN
Odb
13

14
I’ I 1 B I
Bouguer anomaly west of Kirkby Stephen (Fig. 3) is due to the thin
Permo-Trias sequence in this area.
One feature which interrupts the general anomaly pattern in the
south-eastern part of the area is shown in profile form in Fig. 4C. A
3 mGa1 northward decrease in values occurs near the faults in Birk Dale
;I830 0243 but there is no obvious explanation for its existence in the
surface geology, since the observed throw of the faults here is only about
80 m. It is likely, therefore, that the Bouguer anomaly map is showing
the gravity effect of a change in basement lithology.
The Bouguer anomaly contours in the southern part of the map tend to
run parallel with the NNE-striking Dent Fault but north of National Grid
line 513N they swing round to the north-west, parallel with the Augill Fault.
Local highs at 11840 110; and [834 1503 1 ie on the upthrow sides of the
Argill and Augill Faults and are due perhaps to the local uplift of basement
rocks along these structures. The high shown in profile AA' (Fig. 4A)
straddles the Barnarm Fault which lies at an angle of about 45' to the profile.
The south-western part of this profile crosses Triassic rocks which are
largely responsible for the Bouguer anomaly low hereabouts. The high in
AA' (Fig. 4A) can be regarded as a 'residual' feature at the margin of this
broad low.
The Bouguer anomaly map of the area generally shows a pattern conforming
with the known major structures of the area or related deeper basement
features, although the effect of topographic variation must be considered
when interpretations are made. The significance of features such as that seen
in Fig. 4A cannot be assessed without further information. Although not of
more than general application to mineral exploration in the Dent-Augill area,
the Bouguer anomaly data obtained, particularly the presence of local highs
along the main faults, suggest that the method might be of use where block
margins are less well defined at the surface.

I 15
AIRBORNE GEOPHYSICAL SURVEYS
The two airborne surveys across parts of the Dent and Augill Faults
are small in area (6 km 2 and 12 km2 respectively) and cover ground
occupied by scattered farm buildings, roads and power lines. The exact
areas covered by the airborne survey were defined by the following full
National Grid references:
Dent 379.63 509.4N, 381.53 508.6N, 378.83 503,lN and 377.03 504.ON.
Augill 384.03: 513.ON, 385.03 514.ON, 382.03 517.ON and 381.OE 516.ON
Electromagnetic (AEM), magnetic and radiometric data were recorded at nominal
heights of 100 ft. (30m), 150 ft. (46m) and 200 ft. (61m), respectively, and
the first two sets of data were compiled into maps at a scale of 1:10,560.
Copies of these maps, together with the original flight records, are deposited
with the Applied Geophysics Unit of IGS. Further details of instrumentation
and procedure are given by Burley and others (1978).
Flight lines were aligned north-east to south-west in the Augill Fault
area and east to west in the Dent Fault area, all at 100 m intervals.
Locations of the survey areas are shown in Fig. 1, together with the
locations of the ground follow-up surveys.
The AEM maps of both the Dent and the Augill Fault areas fail to show any
overall recognisable contour pattern, the in-phase variation typically being
about 50 ppm. One of the few places where a pattern extends over more than
two flight lines is in the western corner of the Augill area, where a broad
zone of in-phase anomalies of 25-50 ppm continues for about 1 km. Although
this zone can be reasonably explained by thick Namurian shales on the downthrow
side of the Augill Fault, it is not clear why the zone does not continue further
to the south-east. Stronger linear anomalies do occur (250 ppm) and are
particularly noticeable in the Augill Fault area, but these are due to overhead
power lines. The anomalies for ground follow-up were largely selected by exam-
ining individual flight-line records and priority was given to large in-phase to
out-of-phase ratio anomalies on more than one flight line. Several of the

1 I I I I I . I I 1 I I I I I I I 1 I 1
16
in-phase anomalies subsequently turned out to be due to buried metal water
pipes.
Variations in background levels of 100 to 200 cps can be detected in
the total count radiometric profiles for both areas but tend to be more
pronounced in the Dent Fault area. Most of the higher values occur along
the line of the Dent Fault and probably originate in shale horizons
immediately above the Great Scar Limestone, the fault being parallel to the
strike of the sediments in this area. A few patchy radiometric anomalies
occur over the main outcrop of the Great Scar Limestone west of the Dent and
Argill Faults but to the east the radiometric values-are particularly low
where Namurian sandstones are covered by thick drift. There are a few
anomalies over the Augill Fault but the highest readings mark the outcrop
of the shales above the Four Fathom Limestone (Fig. 5).
DETAILED GEOLOGICAL AND GROUND GEOPHYSICAL SURVEYS
The AEM flight records and 1:10,560 scale maps were examined and anomalies
selected for ground follow-up surveys on the basis of amplitude, particularly
of the in-phase component, and location. Anomalies due to man-made sources
(power-lines, buildings and pipes) were ignored as far as possible although the
recognition of buried conductors, such as pipes, is often difficult. The areas
covered by ground surveys are shown in Fig. 1 and listed in Table 1. The main
follow-up method used was Turam, with a straight cable grounded at the ends
and 15 or 30 m staff separation although Very Low Frequency (VLF) and Slingram
EM methods were used in places. The stratigraphical horizons referred to in
the following descriptions of individual surveys are shown in Figs. 2b,5 and 6.
Windmore End
The area is underlain by alternating limestones, mudstones and sandstones
of the Upper Alston Group and lower Namurian sequences. AEM anomalies occur at

Name OS map
AUGILL FAULT
Windmore End
Augill Head
Dummah Hill
North Stainmore
Greenhow Rigg
Leonards Crag
Long Rigg
Dowgill
DENT FAULT
AREA
81 NW
81 NW
81 NW
81 NW
81 SW
81 SW
81 SW
81 SW
GEOPHYSICAL DATA ORIGIN OF ANOMALIES
Method
Turam
0
Vf + VLF
11
11
VLF
VLF
Little Longrigg Scar
Fell House
Birkett Common
Kitchen Gill
8oNw
70 NE
70 SE
70 NE, SE
VLF
VLF
VLF + Slingram
Turam + Slingram
+ VLF
Line km
2.4 Pipe + stratigraphic conductor
1.7 Pipe
3.2 + 0.8 Mudstone
1.9 Pipes
1.8 Mudstone
2.2 Shale + pipe
1.0 Boulder Clay
1.0 Boulder Clay
1.0 _ Shale
’ 0.5 Pipe
3.0 + 1.5 Fault + shale
15.2 + 0.5 Faults, possibly mineralised
+ 1.5 + shales
Table 1. Detailed geophysical survey areas.

18
Fig. 5. Detailed geology of part of the Augill Fault.
liza I . . . . . . ::f . . . . . . . . . . . . . ..*..... ::.. El .::. : : : : : : :. ::::::::::::
Mudstone
i \\ \ \\ \ \\ I \\ I I\ I I\ \ II \ ‘!
Mctrcs 0 500 1000 1500
1 I I I 1 1 1 I I I I 1 1 1 1 I I I I
0 500 1000 1500 mm 2500 3ooo 3m 4000 4500 5ooo
Feet
INDEX AND EXPLANATION
& Inclined strati. dip in degrees ------------ Geological boundmy, Drift
---- Gwlogical boundary. Solid.
23 Dvaiturned strata, dip in degrees - A _ ~$~~~w~ho~wss~‘~
--- Coal-crop
Broken lines denote uncmhty.

19
the extreme ends of the flight lines and a Turam ground follpw-up survey
located one strong anomaly, caused by a buried pipe, and several weak
anomalies at the south end of the area. The latter anomalies follow the
base of the Great Limestone and their configuration suggests that they are
not caused by
Augill Head
The area
mineralisation.
lies immediately to the south of Windmore End and the Turam
results are dominated by very strong anomalies, again due to a buried metal
pipe.
Dummah Hill
The area
succession of
Coal Measures
is cut by the deep gorge of Augill Beck, which exposes a
the lower part of the Lower Alston Group thrown against Lower
by the Augill Fault.
fault have been worked for lead in
Scattered AEM anomalies of up
Near-vertical limestones close to the
the past.
to 70 ppm of the normal field were
investigated on the ground with the Turam and VLF methods. A series of weak
Turam anomalies (reduced ratio (RR) 1.14, phase difference (PD) -9.5')
coincides with mudstones containing the Swinstone Bottom Marine Band. The
Augill Fault is
two lines. The
North Stainmore
Results of
possibly reflected by weak anomalies (RR 1.17, PD -4.0') on
VLF method also responded to conductive stratigraphic horizons.
a Turam survey to the immediate south of Dummah Hill were
dominated by large, sharp anomalies caused by buried metal pipes.
Greenhow Rigg
In this area the sediments occur at a similar stratigraphic position to
those at Windmore End and dip steeply to the east-north-east. AEM anomalies
occurred at the ends of the flight records, and ground surveys indicated two
weak, but apparently continuous, conductors following the geological strike.

a a a a a a a a a a a a a a a a a I a a
20
Fig. 6. Detailed geology of part of the Dent Fault.
Feet Metres
O- -0
300-
500.
Mctrcs 0 ml-l 1000 1500
1 0 500 1000 1500 2000 25Oa 3000 3500 4Ooa 4500 5Ow
Fcrt
-35
-70
-105
.140
.175
.210
.245
Boulder Clay
INDEX AND EXPLANATION
p Inclined strata. dip in degrees / Fault at surface, crossmark
/ indicates downthrow side Hustles
GENERALIZED VERTICAL SECTION
Little Limestone (LtLI
Great Limestone IGL)
Four Fathom Limestone f4FL)
Three Yard Limestone (3YLl
Simonstone Limestone (SiL)
Smiddy Limestone (SmL)
Peghorn Limestone IPgL)
Robinson Limestone WhL)
Great Scar
Limestone (GSL)

21
One coincides with a mudstone underlying the Great Limestone and the other
marks the outcrop of a mudstone above the Lower Little Limestone.
Leonards Crag
Anomalies due to a buried pipe are clearly indicated over a distance of
200 m at the northern end of the area and are distinguishable from weaker
anomalies to the east. These weak anomalies coincide with lower Namurian
shales.
Long Rigg
An isolated AEM anomaly marks the position of the Augill Fault beneath a
large drumlin. The anomaly
anomalies coincide with the
conductive overburden.
Dowgill
was investigated with the VLF method. Broad VLF
maximum AEM anomaly and are typical of thick
The area is underlain by rocks of the Upper Alston Group. The Augill
Fault has a down-throw of 40 to 60 m to the south-west and its trace coincides
with several small (25 ppm) AEM anomalies. VLF investigations of these
anomalies were restricted by crops and topography; however, only one weak
anomaly was located over thickening drift on the east side of the fault.
Little Longrigg Scar
The Argill Fault crosses the area and causes local steepening of beds
belonging to the Lower Alston Group. AEM anomalies of up to 75 ppm were
investigated on the ground with the VLF method which revealed strong anomalies .
coincident with shales lying between the Robinson and Smiddy Limestone.
Fell House
A reconnaissance VLF traverse over an isolated AEM anomaly identified a
buried metal pipe.
Birkett Common
Nearly the
Birkett Common.
full thickness of the Great Scar Limestone is well exposed on
Thickly bedded limestones are interbedded with thin mudstones

I 70
000 TURAM ANOMALIES 0 Scale
500 m I I I 1
VLF-EM TRAVERSES WITH \
CONTOURS OF FILTERED IN-PHASE N \
t
\
/
\
ff
f FAULTS /
/ /
/
/
81 RKETT COMMON /
/
/
Y /
\
\ 04
20 \
KITCHEN GILL \ F
A
\
\
\ \

and minor sandstones.
23
In places they are marked by closely-spaced jointing
and evidence of movement along bedding planes commonly associated with
secondary calcite veins. The rocks between the Great Scar Limestone and the
Lower Little Limestone also crop out. Much of the lower ground is covered by
boulder clay, but it is not very thick and the rocks are exposed in the
adjacent river bed. The beds dip steadily to the south-east or east at 30' to
60'. The area is traversed by a number of faults, trending north-west to south-
A scatter of small AEM anomalies (25 ppm) occurring over Birkett Common
was investigated on the ground with VLF and Slingram methods. The VLF results
are ambiguous; anomalies coincide with two faults (A-A and B-B on Fig. 7),
but maximum filtered values also occur at drift/limestone interfaces e.g.
anomalies 1, 2, 3 and 4, Fig. 7. Fault C-C, which is a continuation of the
western part of B-B, is not indicated by VLF. The strongest VLF anomaly (5
on Fig. 7) coincides with the westernmost mapped part of B-B. However the in-
phase and out-of-phase profiles have the same sign, a feature which has been
shown elsewhere in the Pennines to characterise the edges of some shale
outcrops. Slingram anomalies found to be coincident with the VLF anomalies
were very weak (in-phase<lO%, out-of-phase zero to -5%). It is considered
that the EM anomalies are caused by either stratigraphical conductors or fault
crush material; no metallic conductors are indicated and no economic significance
is attached to these anomalies.
Kitchen Gill
The area is composed of rocks lying between the Great Scar Limestone
and the Little Limestone (Fig. 6). The lowest beds here are the upper parts
of the Great Scar Limestone, consisting of grey, fine to medium-grained,
thickly bedded carbonates, about 100 m thick. Thin shales above the Great
Scar Limestone are overlain by 50 m of grey, fine to medium-grained limestones,
marked by thin bands and lenses of chert and minor recrystallisation close to
the Argill Fault. The overlying beds are less well-exposed up the hillside to

t
t
I t t t I t t t t t
t t t
t t t t
t
24
the east. Close to the Argill Fault, dips are near-vertical, but they
decrease rapidly eastwards to the low inclinations typical of the Askrigg
block. There is little superficial cover. There are minor old workings on
lead veins [785 0441.
Small AEM anomalies were investigated on the ground with the Turam
method using a straight 1.6-km cable. The northern part of the area was
undisturbed but a significant anomaly (RR 1.22, PD -14').to,the south-west
was investigated further with a second cable layout. Anomalies discovered
in this area were weaker but linear trends were established and confirmed by
two subsequent surveys. Fig. 7 shows a plot of major.anomalies established
by the ground survey, together with mapped faults. Two main anomaly trends
are indicated, a weaker north to south direction parallel with the geological
strike (1, 2, 3, and 4, Fig. 7) and a south-easterly direction (5, 6, 7, 8, and
9) parallel with one of the fault trends. The former anomalies are considered
to be caused by weakly conductive lithologies such as mudstones, notably
those below the Three Yard Limestone. No surface indications of mineralisation
were found within the anomalous horizons.
The strongest anomaly located in the survey (number 5 in Fig. 7) has a
maximum reduced ratio of 1.60 and phase difference of -13.5' at 660 Hz. The
profile of the anomaly was compared with model curves presented by Bosschart
(1966), the closest fit being the curve for a steep, thin conductor dipping
slightly to the east. The resistivity/thickness ratios, estimated from the
complex components of the secondary field, are of the order of 10, indicating
a moderately good conductor. The depth to the top of the conductor appears to
be 30 to 40 m. Anomaly 5 marks a possible north-west continuation of fault
F-F on Fig. 7 but has possibly been accentuated by the grounding position of
the cable near the fault. The south-east continuation of the anomaly is much
weaker and is not quite coincident at surface with the mapped position of the

25
fault, but the interpreted dip and depth of the anomalous body indicate
that the fault is conductive at depth. Anomalies 6, 7, 8 and 9 are weaker
(maximum RR 1.30, PD -11') and may mark the position of unmapped fractures.
It is evident from Fig. 7 that not all mapped fractures produce a Turam
response and if some of the anomalies are caused by metallic minerals, the
distribution of the mineralisation is sporadic and of no great lateral
extent.
Slingram traverses across anomaly 5 produced only very weak anomalies
of the order 7% (in-phase), 10% (out-of-phase) and it is obvious that the
ground penetration of this method is less than that with Turam. A VLF survey
revealed strong shale-type anomalies (in-phase 60%, out-of-phase 9%) over
Turam anomalies 3 and 4 and only a weak anomaly over Turam anomaly 5.
The results of ground surveys at Kitchen-Gill are therefore not considered
to indicate extensive mineralisation either near the surface or at depth.
Much of the EM response is due to conductive shale horizons, the remainder
of the anomalies being attributed to fractures, beneath drift, which may carry
some metallic mineralisation.

CONCLUSIONS
Airborne geophysical surveys were carried out over parts of the Dent
and Augill Faults and magnetic, EM and radiometric data recorded along
211 km of traverses. The EM data were affected in many places by power
lines but twelve anomalies were selected for more detailed investigations
by geological and geophysical observations on the ground. Five of these
anomalies proved to be due to buried pipes but ground surveys over another
three showed that the shale members of the cyclic Carboniferous
sedimentary sequence are commonly conductive, although of no economic
mineralisation significance. Conductive overburden was responsible for two
anomalies and at another two sites the anomalies appear to be due to faults.
The most promising area for investigation on the ground appeared to be
around the old mine workings at Kitchen Gill where Turam surveys identified
anomalies due to shale horizons and previously unmapped faults. The faults
could contain mineralisation in veins but as these are likely to be of
limited extent no further work was justified.
Geochemical prospecting could not be justified because of contamination
from the old workings.
The airborne magnetic surveys detected no anomalies and the radiometric
data showed small variations related only to lithological changes in the bedrock.
A trial regionaLgravity survey showed small Bouguer anomalies to be
associated with the Dent and Augill Faults. A more detailed investigation,
including drilling, would be needed, however, for the results to be fully
assessed or used to guide exploration at deeper structural levels.
No further work is envisaged in the area in this programme, although
exploration for possible mineral deposits at depth in this apparently favourable
geological environment would be worthwhile in the future with the further
developments of detection and interpretation techniques.

II 1 I I I I 1 I I 1 I 1 I 1 I B I I I .
I
27
REFERENCES
Bosschart, R.A. 1966. Analytical interpretation of fixed source
electromagnetic prospecting data. Uitgevery Waltman, Delft.
Bott, M.H.P. and Masson Smith, D. 1957. The geological interpretation of
a gravity survey of the Alston Block and the Durham Coalfield.
J. Geol. Sot. Lond, 113, 93-117
Burley, A.J., Cornwell, J.D. and Tombs, J. 1978. Geophysical field techniques
for mineral exploration. Mineral Reconnaissance Programme.
Rep. Inst. Geol. Sci., No. 20.
Burgess, I.C. and Holliday, D.W. in press. Geology of the Country around
Brough-under-Stainmore. Mem. Geol. Surv. Gt. Br.
Cornwell, J.D. and Wadge, A.J. in preparation. Geophysical Investigations
in the Closehouse - Lunedale Area. Mineral Reconnaissance Programme.
Rep. Inst. Geol. Sci.
Evans, A.M. 1976. Genesis of Irish Base-Metal Deposits. pp.'231-56 in
Wolf, K.H. Handbook of Strata-Bound and Stratiform Ore Deposits.
2, pt. 6.
Johnson, G.A.L. and Dunham, K.C. 1963. The Geology of Moor House. Monographs
of the Nature Conservancy, No. 2
Moore, D. 1958. The Yoredale Series of Upper Wensleydale and adjacent parts
of north-west Yorkshire. Proc. Yorks. Geol. Sot., 31, 91-148.
Owens, B. and Burgess, I.C. 1965. The stratigraphy and palynology of the Upper
Carboniferous outlier of Stainmore, Westmorland. Bull. Geol. Surv. Gt. Br.
23, 17-44.
Skevington, D. (Editor). 1971. The Genesis of Base Metal Deposits in Ireland.
Irish Geol. Assoc., Proc. Galway Symp.
Wilson, G.V., Eastwood, T.,Pocock, R.W., Wray, D.A. and Robertson, T. 1922.
Barytes and Witherite. 3rd ed. Mem. Geol. Surv. Spec. Rep. Miner.
Resour. Gt. Br., 2.