institute for economic forecasting 10. c … of balance scorecard model romanian journal of economic...
TRANSCRIPT

Institute for Economic Forecasting
Romanian Journal of Economic Forecasting – 3/2011178
CONTRIBUTION OF BALANCESCORECARD MODEL IN EFFICIENCY OF MANAGERIAL CONTROL
Ionel BOSTAN1
Veronica GROSU2
Abstract
In order to observe some leading objectives, an entity needs a strategic management able to guarantee the performance that creates a value superior to that of the competitors, so that this might be sustainable in time. For such an improvement of the performance and of the competitiveness in a dynamic and complex environment we can reveal as fundamental the implementation of the most efficient and most participative management audit systems, able to clarify its objectives and necessary methods in order to attain the objectives, as well as the connection between the defining processes of the strategies and the current operational activities. These controlling systems must be able to assess the performance, not only as regards the quantity but also the quality, based on the evolution of these results, as well. Thus, the 21st century companies, currently undergoing the market globalization process, need strategies that would allow them to face the continuous transformations of the world economy in order to succeed. Therefore, in order to take advantage of positive trends, markets need to be confronted with winning strategies, with instruments that create a valid orientation in the implementation of long-term objectives. The new economic reality is highly complex, thus triggering an equal development of the management techniques and control practices not to lose sight of a significant feature of the monitoring of the economic evolution and management decisions of companies. This is why the second part of the paper focuses on creating a BSC model for the Alfa Group in order to underline the applicative use of the new instrument for measuring the economic-financial performance, as well as to highlight its importance as means of communication with all categories of stakeholders.
Keywords: Balance Scorecard, Key Performance Indicators, decisional processes, managerial control, efficient method
JEL Classification: G39
1 Alexandru Ioan Cuza University of Iasi, Bd. Carol Street, No. 22, Phone: 0232-201000, Romania,
E-mail: [email protected] 2 Stefan cel Mare University of Suceava, Universitatii Street, No. 13, Phone: 0230-520263,
Romania, E-mail: [email protected]
10.
Contribution of Balance Scorecard Model
Romanian Journal of Economic Forecasting – 3/2011 179
1. Introduction
The studies that have been done so far have shown that no indicator can offer the possibility to have a clear vision of the performance, to identify and administrate the most critical fields and have the greatest impact on the business. These assumptions have been the basis of this work; the authors have suggested a study of the Balance Scorecard (BS) and of the Key Performance Indicators (KIPs), as non-financial instruments for measuring performance. The BS model and its principles, its objectives and its four perspectives are analyzed in the second part of the paper.
Considering the basic model of BS that is described by Norton and Kaplan, the authors tried to show how such an instrument, built according to the size of each entity, can bring advantage to the strategic management of the entities, having effects in the four fundamental moments of a strategic management. The paper ends with a short panorama on the diffusion of BS and of the difficulties that certain entities have been confronted with in implementing it.
The purpose of the paper is to offer a general view on the evaluation of the performance and the management audit system, but especially to develop an innovative instrument of strategic management such as BS, trying to underline and to explain the reason why an entity should implement this method, showing how the process of creating this can produce changes and lead to results, as well as the way an entity can create a sustainable competitive advantage.
2. A Few Elements of the Economic Context Concerning the BS&KIPs Approach
Balance Scorecard (BS) is an efficient method for the managers and administrators, used in observing the reports and analyses using KIPs (key performance indicators), in order to determine whether the operational activities are in line with the strategies and global vision of the entity. Kaplan et al. (2000) argue that the BS methodology represents the management technique that is projected in order to structure a “scorecard” and to visualize all the financial data, data that concern the processes and the customers.
The BS term refers to the planning and objective management, initiated by Norton and Kaplan (1992). This model is based on achieving the success of the company, on its capacity to translate the economic strategies that must be in compliance with the four perspectives focusing on the following questions:
Economic-financial: How are we perceived by our stakeholders?
Customers/Market: How are we perceived by the market and generally how are we seen by different stakeholders?
Competences/Growth: What are the domains where we must prevail in order to develop our ability to improve and change?
The answers to these questions will identify critical success factors (FCS) which the entity must analyze, and the key performance indicators (KPI) are thus defined, able to measure and explain how each factor contributes to observing the strategic

Institute for Economic Forecasting
Romanian Journal of Economic Forecasting – 3/2011180
objectives of the entity. An important role in applying these non-financial instruments is played by the existing corporative governance pattern. An integrated pattern of corporate governance will be influenced first by the national and international context.
The context factors, among which the accounting fraud against shareholders, the financial scandals, the economic and the mistrust crises on the financial markets have led to more transparency and accountability of the entity (especially of the quoted ones). Muras Smith et al. (2008) show that the proliferation of the norms, the orientation lines, the rules, the governance codes have led to excessive focus on compliance.
The related risks of these dynamics are represented by: the compliance cost – which has negative effects on the performance, the rigidity and the management constraint; the effective benefits for shareholders and investors. Terzani (1999) believes that the presence of the rules is not sufficient to guarantee the good management of the company, and this leads to the necessity to go beyond the target compliance. Beyond compliance, integrated governance first requires the warranty of better economic governance and to be fully accountable, the following being necessary:
mechanisms for checking that the rules are observed (Compliance);
the management objectives should be oriented towards the observance of the stakeholders’ interests (Performance);
the observance of the rules as common patrimony (Knowledge).
Corporate Governance focuses on the conformity of the norms, codes and external and internal regulations. Brusa (2000) considers that this aspect of the corporate governance is important for an attitude to be partially in agreement or non-compliant, as it damages the image or the reputation of the entity and, as a consequence, the performance as well.
Measurement-Based-Management focuses on aligning the processes and activities of the strategies to the strategies for maximizing the economic performance and creation of value. Knowledge-Based-Governance manages the process of acknowledging and dissemination of the information. A highly important aspect, underlying the Knowledge-Based-Governance, is the guiding and connection of the values and individual behaviours to the objectives, culture, mission and strategies of the entity.
Brusa (2000) shows that the mechanisms concerning the governance operation refer to:
the relevance of the management actions and economic-financial communication, oriented towards the external environment (financial reports);
the management and monitoring of the internal audit systems and the elimination of the risks occurring in the key economic processes;
the projection of the organization structures and the choice of internal coordination;
the definition of the economic governance and of the ethical codes regarding different management professions, the individualization of the value created for the stakeholders and Corporate Social Responsibility (triple bottom).
Bocchino (2000) analyzes the introduction of the instruments and measurement methodology for the economic performance with the purpose of identifying the real

Contribution of Balance Scorecard Model
Romanian Journal of Economic Forecasting – 3/2011 181
“value-drive” of the business:
the development of the analysis capability of the “reports” and the critical interpretation of the business risks/opportunities;
the common analysis of the strategies, budgets and obtained performance;
the evaluation of the performance and incentives of obtaining it, the interpretation and monitoring of the processes and projects in an activity-based (budgeting management) manner;
the analysis of the dynamics and financial risks to which the entity is exposed;
re-engineering the production and administrative processes (Six Sigma Methodology).
The use of the information technologies for improving the efficiency and integration of the economic processes first requires:
the analysis and evaluation of the human capital competence;
the existence of a common language in the leadership activity, internal consulting, coaching;
the management of the innovative processes;
the identification, presentation and evaluation of the capital;
the identification, representation and elimination of the intangible capital.
A synthetic analysis of the concepts presented above can be represented as follows:
controllership ensures the “financial reporting compliance” and of the governance mechanisms among the interested users (existing or potential), through the dissemination of specific or economic ethics (the spirit & the letter of our commitment);
monitoring and improving the obtained performance (in relation to the identified financial/ operational risks);
the measurement (the Six-Sigma Initiative) through assessing and insurance, the monitoring and improvement of the manufacturing processes (and administrative, perceived as critical element customers - critical quality) especially because:
a) it must present a specific direct economic culture and integrate the technical-operative aspects (number of defaults, the delay of orders) and of their economic-financial consequences (cost saving and financial benefit);
b) a rigid application (compliance) of a rigorous methodology named D-MAIC (define, measure, analyze, improve, control).
The communication (the initiative “Wearing the hat of finance”) represented by an economic common culture “sustained by an organizational language, shared (the expert system) in such a measure as to disseminate the contents/values of different economic functions and through specific measure of the performance obtained (the use of symbol token - as cash contribution margins, etc.)”; a rigid compliance with the
GAAP standards (http://www.revenuerecognition.com/content/articles/9010.asp/).
On the level of an Integrated Corporate Governance Scorecard (IGS), its dimensions can be presented as follows:

Institute for Economic Forecasting
Romanian Journal of Economic Forecasting – 3/2011182
Table 1
The level of an Integrated Corporate Governance Scorecard (IGS)
IntegratedGovernanceDimensions
MechanismsChecking
the progress Future
initiatives
Initiatives Yes/ Required One/ More
Programs Yes/ Required One/ More CorporateGovernance
Systems Yes/ Required One/ More
Initiatives Yes/ Required One/ More
Programs Yes/ Required One/ More Management Based Governance
Systems Yes/ Required One/ More
Initiatives Yes/ Required One/ More
Programs Yes/ Required One/ More Knowledge Based Governance
Systems Yes/ Required One/ More Source: Adapted from Angelo Riccaboni, “Il ruolo del controllo nella Governance Integrate”, 2010, http://www.disas.unisi.it/mat_did/riccaboni/330/04_Governance_Integrata.pdf.
At the level of the business unit, the IGS can be represented as follows:
Table 2
IGS at a business unit level
IntegratedGovernanceDimensions
ObjectivesKey
performanceobjectives
Targets Actuals Future
initiatives
CG1 KCG1 TCG1 ACG1 Fi CG1
CG2 KCG2 TCG2 ACG2 Fi CG2
CorporateGovernance
CG3 KCG3 TCG3 ACG3 Fi CG3
MB1 KMB1 TMB1 AMB1 Fi MB1
MB2 KMB2 TMB2 AMB2 Fi MB2
Measurement BasedGovernance MB3 KMB3 TMB3 AMB3 Fi MB3
KBG1 KBG1 TBG1 ABG1 Fi BG1
KBG2 KBG2 TBG2 ABG2 Fi BG2
KnowledgeBasedGovernance KBG3 KBG3 TBG3 ABG3 Fi BG3
Source: Adapted from Angelo Riccaboni, “Il ruolo del controllo nella Governance Integrate”, 2010, http://www.disas.unisi.it/mat_did/riccaboni/330/04_Governance_Integrata.pdf.
Within the economic area, the performance indicators, or better said the integrated system of indicators, are used with the main purpose of “keeping the economic performance under control”. These indicators must be oriented by the entity towards the implementation of the strategies (explained in the Strategic Plan of the Entity), and this is the reason why all the steps of the Planning and Control process during the significant time must be checked through the indicators, their role and progress within the entity, and to clearly allow the checking of their progress within the entity, in relation to the objectives set and to allow the initiation of corrective actions in case of digression.

Contribution of Balance Scorecard Model
Romanian Journal of Economic Forecasting – 3/2011 183
Within the actual economic scenario, the economic growth is the main concern of the top managers that manage an entity as Chief Executive Officer (CEO). Strernini (2005) shows that, when there are interesting values of the profit and some developing markets, the priority is clearly to fill the available market segments, before they have become saturated by other competitors; the best way to follow the growth is the innovation in processes.
The Key Performance Indicators (KIPs) are units of financial measure and not only, which are used by the entity to control and assess performance. KPIs align to the measurement of the performance, being confronted with strategic objectives of the entity; they vary from one entity to another, being usually defined by the stakeholders. While the business developed in order to attain the strategic objectives, the progress will be measured through the KIP variations.
The KIP may be:
specific - that is correlated with the objectives of the entity;
measurable - in order to enable the entities to check progress;
they must be established depending on the type of business they refer to;
to be relevant – with direct reference to business and to “measurement”;
to be correlated with the period that is allocated to the objectives within a certain time span.
KIPs are used by the directors, analysts, IT specialists and associates in order to control the economic activity, to measure performance and to update any form of managerial performance. Apart from being aligned to the strategic objectives of the entity, they are connected to the activity of the entities.
The current attitude of the entities is to meet the exigencies of the stakeholders: Why did ROE increase? Why are the sales revenues important? Why is efficiency important? Why does a good turnover of the invested capital represent the warranty of a future lasting success? The answer is: certainly not!
Very often, the economic parameters lead to a short-term orientation and to a lack of interest in efficiency.
3. The Balance Scorecard Model and KIPs (Key Performance Indicators)
Kaplan et al. (2000) show that the BS model (Balance Scorecard) is based on a precise and punctual description of the following “subjects”, with an answer to specifically formulated questions:
1. Mission (Why are we here…?) 2. Vision (Where are we going?) 3. Strategic themes (How do we get where we want?) 4. Operational objectives (What do we have to do for this?) 5. Measures (How do we check whether we are going in the right direction?) 6. Actions (What do we have to do in order to correct them?)
The perspectives – the way in which we see the development of the activity in the future - represent the dimensions that allow for the creation of value for the entity

Institute for Economic Forecasting
Romanian Journal of Economic Forecasting – 3/2011184
(more exactly the value creation imperatives) and the control of the business. Correlated with the strategic themes and therefore with the strategic vision, they allow for efficient individualization of those operational objectives (critical success factors), which represent the conducting line of operation and allow for a unitary action.
The measures are extremely important (you get what you measure) - meaning that you have to know exactly what you want to measure; the BSC model, unlike the modern management auditing systems that tend to measure everything, determines the focus of the attention only on what really allows the checking and attaining of the set objectives.
The evaluation according to BS represents the performance indicators that have to be:
Balanced – in order to be able to reflect all the dimensions that create value;
Vital – in order to focus on them;
In line with the strategies. Thus, the correct implementation of the BS methodology means:
translating the strategy into operational terms;
aligning the organization of the activity to strategies, in order to create synergy;
motivating the entity, making out of the strategies the responsibility of each and every one;
adapting the strategies to the changes that occur in a continuous process;
activating the changes through management leadership. Peroni (2010) considers that the planning and controlling solution for the development of the activity of the entity refers especially to the management through BS, which consists essentially in setting the strategic objectives and in the individualization of the key operational performance indicators (KPIs), of the specific and responsible parameters, which objective, if reached, ensures a correct execution and a specific updating of the strategic plan.
The BS functions and objectives are represented by:
The application in the entity of a BS model which is assisted by consultants and which allows the definition of a strategy and the quantification of strategic objectives through certain KPIs (Key Performance Indicators);
The updating of the analysis of the digressions on the budgets, by urging the entity to use the communication graphic as soon and as simply as possible;
The efficiency of the on-line (visual) control and of the analysis for each responsibility of the specific objectives through the online Board Table;
The correct selection of KPIs, choosing a wide database, which is at the same time tested, referring to each sector, activity and business model (diagnosis capacity);
The establishing of correct reference tendencies for each KPI;
The import/export activity, which has the role of facilitating the collection of data from/to the internal system and which allows the configuration of an optimum Table Board (the KPI number, their re-grouping, the relations among them);
Greater understanding by the management and each person responsible in the context of high economic complexity;
The name of the “aggregation logic” of all the indicators (scorecard tree);
Contribution of Balance Scorecard Model
Romanian Journal of Economic Forecasting – 3/2011 185
The vertical recording of each indicator (drill-down), for a better understanding of the cause-effect relation among the economic phenomena;
The structuring of a web interface for maximizing the financial communication process and the performance within the organization;
The proliferation of the members, for the successful implementation of a respondent vision on the level of economic responsibility;
Short terms for initiating the “Table Board”;
The activation of an “alert” system, automatic for each KIP and for each person responsible.
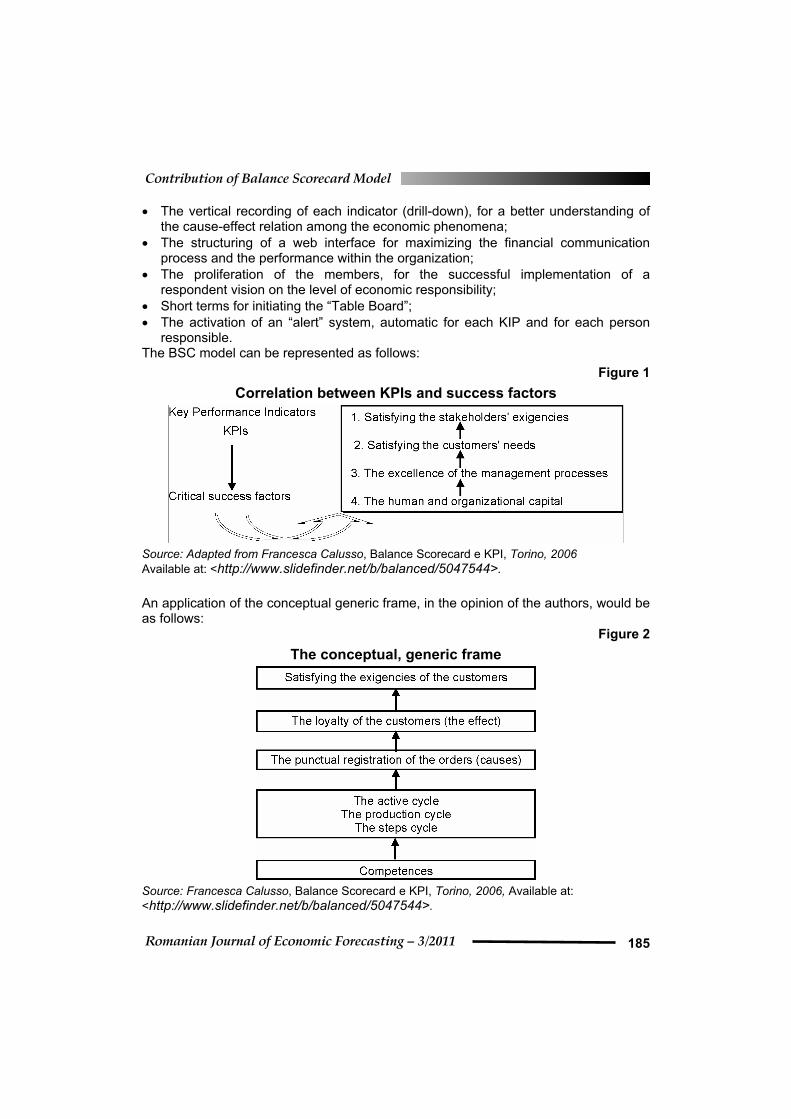
The BSC model can be represented as follows:
Figure 1
Correlation between KPIs and success factors
Source: Adapted from Francesca Calusso, Balance Scorecard e KPI, Torino, 2006 Available at: <http://www.slidefinder.net/b/balanced/5047544>.
An application of the conceptual generic frame, in the opinion of the authors, would be as follows:
Figure 2
The conceptual, generic frame
Source: Francesca Calusso, Balance Scorecard e KPI, Torino, 2006, Available at:
<http://www.slidefinder.net/b/balanced/5047544>.

Institute for Economic Forecasting
Romanian Journal of Economic Forecasting – 3/2011186
The KPI indicators that should define this conceptual approach considered to be optimum by the authors would look like this: Which KPI? Calusso (2006) analyzes the KPIs presented in the above picture, referring to the non-economic indicators regarding those phenomena or future economic activities. Within the BS model, the most suitable KPIs are identified for the four perspectives and they are correlated with the cause-effect relation, in a catena of “means-purposes”, these indicators being attributed to different managers in the company in order to make them responsible; these indicators will be communicated at an operational level for the orientation of the actions.
Figure 3
The KPIs that should underline this conceptual approach, considered to
be optimum
Source: Francesca Calusso, Balance Scorecard e KPI, Torino, 2006, Available at:
<http://www.slidefinder.net/b/balanced/5047544>.
4. The Major Obstacles in the Dissemination of the BSC Model
The BS implementation difficulties consist in the individualization of the causes of future performance and of its quantitative “testing”; the complexity of the analytic definition of the indicators; the disagreement among the multitude of indicators.
It is a well-known fact that the BS concept is in the course of dissemination, its use in the national entities results in being more limited towards the national realities.
Contribution of Balance Scorecard Model
Romanian Journal of Economic Forecasting – 3/2011 187
The main factors impeding the dissemination of the BS are represented by:
The confusion existing among the users of the economic-financial information, related to the manner of understanding BSC as a performance control and monitoring instrument, as BSC is often mistaken for the economic-financial reporting or the control panel, etc.
Difficulties in identifying the few but relevant indicators able to explain the impact of the operations on the strategies of the company;
The diminishing application of the BS on different organizational levels and the tendency to maintain it not only within the management area.
The fear and the prejudice regarding the competitiveness imposed by the accomplishment of the instruments and their successive use.
In the opinion of the authors, the fact that there is no clear structure that defines BSC and the possibility to assess the results of the entity by it does not always mirror performance from a qualitative and quantitative standpoint, refers to the fact that BS is often seen by the entity as a cluster of indicators in search and control of other instruments of managerial audit. What distinguishes BS from other managerial instruments is the drawing up of programming and planning, which takes place through the formation, the implication and strategic communication of the entity, with the help of other factors:
1. The formalization of the objectives and strategic dossier; 2. The defining of the indicators and of the objective values; 3. The identification of the necessary actions in order to follow these objectives;
The measurement of the impact on the economic results of the entity, of the actions already deployed or which are in progress, evaluating the differences between the value of the relevant indicators and the value of the fixed objectives. The assessment of the values assumed by the economic-financial factors (focused on a short period of time) and of the market indicators, of the processes, of growth and innovation (all focusing on a medium or long period of time), explains how the current specific events from one sector, influence other perspectives, this effect leading to other economic results. The importance of the correlated KPI identification may explain (according to the cause-effect relation) the impact of the actions on the economic strategies, these being essential conditions for achieving success, as well as the difficulty the companies are often confronted with in implementing the BS model. The close correspondence between the performance indicators and the critical economic processes in the BS model allow different economic areas to identify and to measure the contribution of their own actions to the improvement of the results in other areas and the sequence of the economic results. Thus, unlike other instruments, BS creates understanding, integration and alignment within the entity of the economic strategies to the interests of the company and the corresponding responsibilities for each person, irrespective of the area where they work. The potential of the BS model can express in an absolute manner the obtained contributions within the sectors that are considered to be supportive, such as the functioning of the human resources department, a fact that can be proved by resorting to the patterns used in each area or sector, according to the four fundamental perspectives of the BS.

Institute for Economic Forecasting
Romanian Journal of Economic Forecasting – 3/2011188
To conclude with, in order to express a more largely accepted opinion, we underline the fact that the development of BS in a company does not necessarily mean that it must make massive investments in technology and resources.
Apart from this approach, this instrument has also been introduced within the entity, becoming reachable or even functional in its simplest form, through the financial instruments of common use, making use of indicators based on data that are traceable in the entity and involving the persons that have the necessary information.
5. Developing a BSC Model at Alfa Group
The second part of the paper focuses on the development of a BSC model using the data of the Alfa Group, resulting from the strategic plan that the company draws up every three years. After a very brief presentation of the group, based on the upper structure of the financial reporting, we’ll focus on the main areas of interest that can accommodate the BSC model. The data are real, collected from the website of the group, hereinafter known under the alias of Alfa Group, in order to avoid any controversial aspects related to the company image.
This company operates in the field of fixed and mobile telecommunications, Internet and media, reputed among other similar companies for its competence, trust and trademark recognition.
The internal control system and the organizational model of the group The system, the organization and the functioning of the internal control are crucial and significant elements for the prevention and management of accounting fraud. This is the reason why it seemed an interesting endeavor to analyze the appropriate internal control model for the Alfa Group. The figure below is intended to demonstrate the values underlying the adopted control system.
Figure 4
The Internal Control System at the Alfa Group
Source: The scheme developed by the authors on the information concerning the Alfa Group internal control system.

Contribution of Balance Scorecard Model
Romanian Journal of Economic Forecasting – 3/2011 189
The system under analysis aims at ensuring trust in the accounting data, according to the current rules and regulations, ensuring the efficiency, knowledge and validity of the data provided by the management, as well as at preventing fraud against society and financial markets, holding the following as reference values :
substantial and procedural fairness;
transparency;
accountability. In order to acquire such results, the reference structure relies upon rules such as:
the separation of the solutions while performing the main activities related to each operational process;
the assignment and the constant visibility of the tasks in order to immediately identify the responsibilities and the reasons that have lead to such decisions.
The objectivity of decisional processes are intended to provide a standard framework, with familiar procedures that simplify the decisional processes and neutralize them by means of objective evaluations.
At the core of all activities performed by the Alfa Group there is a portfolio that includes a wide range of convergent communication services to consumers, of advanced ITC solutions for the business world, increasingly oriented towards satisfying the needs of any type of clients. The company has defined its own «mission» and its own «fundamental strategic orientation» by taking into consideration the suggestions of its shareholders and the expectations of its stakeholders and by developing its own strategic plan that would enable it to function efficiently.
Therefore, this will be the purpose of illustrating the structure of the upper part of the financial reporting (the group of 1
st and 2
nd level indicators). This group of indicators is
based on the practices described by BSC, 4 areas plus 1.
1. financial perspective
2. customer perspective
3. internal perspective
4. learning & innovation perspective
5. social responsibility
Table 3
The main areas of BSC at the Alfa Group
Financial perspective EBIT; EBT; the net financial debt
Customer perspective Customer satisfaction (depending on the type of customers: consumers and business units)
Internal perspective Turnover; value added
Research & Innovation perspective
-
Social responsibility Paid taxes, VAT Source: The table developed by the authors on the information concerning the main areas of BSC at Alfa Group.

Institute for Economic Forecasting
Romanian Journal of Economic Forecasting – 3/2011190
A) The Economic-financial Area
The economic objective of these indicators consists in increasing the basic economic activity of the Alfa Group.This area presents the indicators that reflect the economic-financial outcome that can also be found in the quarterly or annual financial statements of the Alfa Group. The most relevant of these indicators are:
Total operating income
Operating result or EBIT
Result of the financial year before amortization or EBITDA
otal liabilities of the Alfa Group 1) The total operating income is an indicator that measures the results at the macroeconomic level and stands for the volume of cash-flow from their own activities during a certain period of time, calculated at market price. The turnover includes all the cash-flow from commercial activities: sales of goods, provision of services, deposits with banks and financial institutions, granting loans and stock market operations.
Table 4
The main economic-financial indicators of the Alfa Group
during 2004-2010 (Euros)
The main economic-financial indicators
(million euros) 2004 2005 2006 2007 2008 2009 2010
Total operating income 28,292 29,919 31,275 31,013 30,158 26,894 27,571
EBITDA 12,864 12,517 12,850 11,668 11,367 11,115 11,412
EBIT 7,603 7,499 7,437 5,955 5,463 5,493 5,813
Result before taxation, derived from the developing activity
5,606 5,535 5,515 4,324 2,897 2456 4,610
Total financial debt 32,862 39,858 37,301 35,701 34,039 38,785 (rectified)
35,540 (evaluated at the just value)
Debt ratio (Total debts/Total invested capital)
61.2% 59.6% 57.9% 57.0% 55.9% 55.6% 49.1%
Source: Alfa Group Financial Reporting.
The turnover is also known as “sales” or “gross revenues” in the financial-accounting language. This indicator measures the economic performance of companies and is used as a criterion in the classification of these companies by their economic importance.
2) The operating result or EBIT (Earnings Before Interests and Taxes) In order to allow for a better evaluation of the economic-financial management of the group and of the parent company, for the financial operations during 2004-2010, apart from the conventional financial indicators established by the IAS/IFRS international standards, the management report has also introduced a few other alternative performance indicators that should not be viewed as replacing the conventional ones, validated by the IAS/IFRS standards.
Contribution of Balance Scorecard Model
Romanian Journal of Economic Forecasting – 3/2011 191
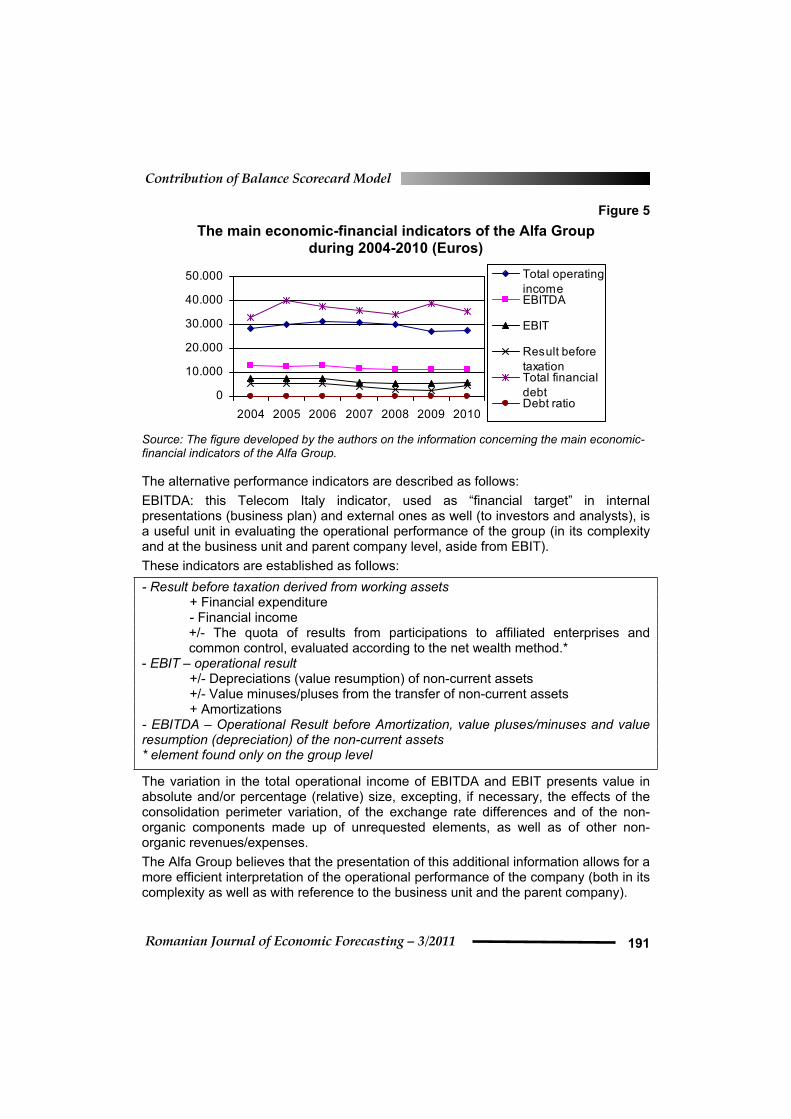
Figure 5
The main economic-financial indicators of the Alfa Group
during 2004-2010 (Euros)
0
10.000
20.000
30.000
40.000
50.000
2004 2005 2006 2007 2008 2009 2010
Total operating
incomeEBITDA
EBIT
Result before
taxationTotal financial
debtDebt ratio
Source: The figure developed by the authors on the information concerning the main economic-financial indicators of the Alfa Group.
The alternative performance indicators are described as follows:
EBITDA: this Telecom Italy indicator, used as “financial target” in internal presentations (business plan) and external ones as well (to investors and analysts), is a useful unit in evaluating the operational performance of the group (in its complexity and at the business unit and parent company level, aside from EBIT).
These indicators are established as follows:
- Result before taxation derived from working assets + Financial expenditure - Financial income +/- The quota of results from participations to affiliated enterprises and
common control, evaluated according to the net wealth method.* - EBIT – operational result +/- Depreciations (value resumption) of non-current assets +/- Value minuses/pluses from the transfer of non-current assets + Amortizations - EBITDA – Operational Result before Amortization, value pluses/minuses and value resumption (depreciation) of the non-current assets * element found only on the group level
The variation in the total operational income of EBITDA and EBIT presents value in absolute and/or percentage (relative) size, excepting, if necessary, the effects of the consolidation perimeter variation, of the exchange rate differences and of the non-organic components made up of unrequested elements, as well as of other non-organic revenues/expenses.
The Alfa Group believes that the presentation of this additional information allows for a more efficient interpretation of the operational performance of the company (both in its complexity as well as with reference to the business unit and the parent company).

Institute for Economic Forecasting
Romanian Journal of Economic Forecasting – 3/2011192
3) The result of the financial year before amortization or EBITDA The organic variation in the total operating income EBITDA and EBIT is also used in the presentations of analysts and investors. The presentation of the indicators in the management report provides a series of details, as well as a graphic evolution of the economic values used in the development of the organic variation, beside an analysis of the main non-organic components for the 2004, 2005, 2006, 2007, 2008, 2009 and 2010 financial periods.
4) Total financial debts of the Alfa Group The Alfa Group believes that the net financial debt is a corporation indicator that defines the degree to which the company manages to meet its financial expectations; the indicator is defined as the difference between the gross financial debt and cash or other equivalent liquidities, as well as other financial assets. The presentation of this debt in the annual report of the group aims to highlight the patrimonial values used to calculate the net financial debt of the group and of the parent company.
B) Customer Perspective
The economic objective of this indicator is the enhancement of the customer satisfaction degree for the two types of customers of the Alfa group The Alfa Group encourages the adoption of the concept by as many stakeholders as possible, since they believe sustainability is “the path towards the highest possible balance among the interests of the stakeholders”.
The parts dedicated to sustainability in the balance sheet and the sustainability plan of the group focus on the stakeholder. The “stakeholder engagement” principles vary depending on each stakeholder taken into account.
The role played by the stakeholders in the decisional processes of the group is one of the aspects that define a reliable company and is included in the sustainability strategy of the group.
Table 5
Customer satisfaction at the Alfa Group during 2004-2010
Operational data (depending on the types of
customers) 2004* 2005** 2006** 2007** 2008*** 2009*** 2010***
Consumers 87.5 77.9 71.35 86.85 16.32 15.00 15.72
Business 76.1 69.1 64.95 84.4 15.69 13.06 13.19 *This percentage illustrates the sum of “satisfied and very satisfied” customers, on a 5-level satisfaction scale that includes: very satisfied, satisfied, partially satisfied, little satisfied, very unsatisfied. **The satisfaction degree of the customers is evaluated on a 5-level satisfaction scale: very satisfied, satisfied, partially satisfied, little satisfied, unsatisfied. ***The average satisfaction degree is measured on a satisfaction scale 1 to 10, where 1 is “unsatisfied” and 10 is “completely satisfied”. Source: Financial Reporting of the Alfa Group.
As far as the customers are concerned, since they are one of the most important category of stakeholders, there is collaboration with the Consumer Association that

Contribution of Balance Scorecard Model
Romanian Journal of Economic Forecasting – 3/2011 193
sometimes requires the direct involvement of the management in meetings that emphasize the protection of the customers’ rights as concerns the goods and services provided by the Alfa Group and also inform the associations on the organizational changes that may affect the customers.
Figure 6
Customer satisfaction at the Alfa Group during 2004-2010
0
20
40
60
80
100
2004 2005 2006 2007 2008 2009 2010
Consumers
Busines Unit
Linear (Busines Unit)
Source: The figure developed by the authors on the information concerning the customer satisfaction at the Alfa Group.
The examination of the customer satisfaction degree is of two types:
a) The “cold” examination, based on the complex perception of the customer, without being correlated with a specific customer experience event and thus allowing for the analysis of the cause-effect relation that determines the customer satisfaction.
b) The “warm” examination is performed at a certain moment, very close to the event under investigation. The questioned parties are asked to express, based on the recent memory of the service provided by the Alfa company, a very complex evaluation of the service supplied – overall satisfaction – and a separate evaluation for each aspect defining this experience, such as: staff hospitability, competencies, waiting period, etc.
C) Internal Perspective
The economic objective of this indicator is the augmentation of the turnover and of the value added by the Alfa group, a safety margin for internal stakeholders. As concerns the turnover, this indicator has already been studied in the first area of the BSC model, and that is the reason why we only focus on the value added.
Services with value added provide a higher functionality degree as opposed to traditional services (as we can see in the graph below, the strong growth starting in 2007 as a result of the development of Internet and mobile telephony services provided by the Alfa Group); these services with value added guarantee higher quality, as they are provided according to customers’ preferences.

Institute for Economic Forecasting
Romanian Journal of Economic Forecasting – 3/2011194
Table 6
Value added obtained by the Alfa Group during 2004-2010
VASValue
2004 2005 2006 2007 2008 2009 2010
Value Added Services - VAS* (euros)
19.914 19.385 20.558 2.024.612 2.270.075 1.986.766 1.973.853
*It also includes the VAS provided by foreign customers. Source: Financial Reporting of the Alfa Group.
Figure 7
Value added obtained by the Alfa Group during 2004-2010
0
500.000
1.000.000
1.500.000
2.000.000
2.500.000
2004 2005 2006 2007 2008 2009 2010
Value added
Source: The figure developed by the authors on the information concerning the value added obtained by the Alfa Group.
D) Learning & Innovation Perspective
The objective of this area focuses on the development of technological competences and on the enhancement of the ability potential that define the types of activities performed by the Alfa Group, as well as on the management training as concerns the organization of the innovation and decision-making topics. This area includes the indicators that describe the capability of the group to handle human resources, to develop individual competences and the necessary economic knowledge.
An extended project has been developed by the group, in partnership with the marketing structures, in order to involve the staff in suggesting ideas and opinions on the topics the company takes interest in and also in experiencing the new products and services provided by the company.
The training categories, divided by professional profiles (managers, employees with a higher education degree, employees with secondary education), include: specialty training, management training, institutional training, and training for future employment, linguistic training; the training sessions take various forms: in the lecture hall, online, on the job.Over 1.2 million training hours were performed at the group in 2010 only (the lowest number for the period under analysis), but at the highest costs, thus reflecting the advanced level of the classes and the training degree of the trainers.

Contribution of Balance Scorecard Model
Romanian Journal of Economic Forecasting – 3/2011 195
Table 7
The number of learning hours, the value of the related costs and of the
staff involved at the Alfa Group during 2004-2010
Hours and participants/ training categories
2004
2005200
62007 2008 2009 2010
Number of training hours (in the lecture hall, online, training on the job) (mil. Euros)
1.9 2.0 1.9 1,9 2.0 1.8 1.241
Costs related to the training sessions (mil. Euros)
33 32 21.8 31 25 19.8 36
Coverage (number of employees from the total personnel of the group, attending the training classes)
- 70.3% 83% 84.3% 71.5% 80.1% 81.3%
Source: Financial Reporting of the Alfa Group.
Figure 8
The number of learning hours and the value of the related costs of the
training sessions at the Alfa Group during 2004-2010
0
10.000.000
20.000.000
30.000.000
40.000.000
2004 2005 2006 2007 2008 2009 2010
Number of hours
of training
Costs related tothe trainingsessions
Source: The figure developed by the authors on the information concerning the number of learning hours and the value of the related costs of the training sessions at the Alfa Group.
Figure 9
The number of employees in the total staff who have attended training
courses at the Alfa Group during 2004-2010
60
65
70
75
80
85
90
2004 2005 2006 2007 2008 2009 2010
Coverage (numberof employees fromthe total staff, who
Source: The figure developed by the authors on the information concerning the number of employees in the total staff who have attended training courses at the Alfa Group.

Institute for Economic Forecasting
Romanian Journal of Economic Forecasting – 3/2011196
E) Social Responsibility
The objective of this indicator is to contribute to the development of the local community and to the drawing up of the state budget.
Table 8
Value of direct and indirect taxes at the Alfa Group
during 2004-2010 – (Euros)
Direct and
indirecttaxes
2004 2005 2006 2007 2008 2009 2010
Company tax
145.000.000 141.000.000 141.000.000 155.000.000 139.000.000 200.000.000 128.000.000
Indirecttaxes and othertaxes
2.654.000 922.788 2.105.968 1.643.931 674.329 1.121.000 5.480.000*
*This rise is caused by the fact that one of the subsidiaries of the group, operating in South America (more specifically, Brazil) has confirmed that part of the balance sheet assets are taxable, thus favoring the recovery of the fiscal losses reported in the previous years. Source: Financial Reporting of the Alfa Group.
This indicator shows the evolution of the economic activity of the company and, as we can see in the graph below, the value of the company tax recorded in 2010 had an unfortunate impact on the net profit obtained by the group (as a consequence, on the dividends received by shareholders, on the self-financing potential of the group and on the economic investment, etc.).
Figure 10
The company tax at the Alfa Group during 2004-2010 – (Euros)
0
200.000.000
400.000.000
2004 2005 2006 2007 2008 2009 2010
Company tax
Source: The figure developed by the authors on the information concerning the company tax at the Alfa Group.
A managerial level BSC, resembling the one developed by the Alfa Group, must be considered as a whole in order to get a complete and global picture of the economic-financial performance.

Contribution of Balance Scorecard Model
Romanian Journal of Economic Forecasting – 3/2011 197
Figure 11
The indirect taxes and other taxes at the Alfa Group during 2004-2010 (Euros)
0
1.000.000
2.000.000
3.000.000
4.000.000
5.000.000
6.000.000
2004 2005 2006 2007 2008 2009 2010
Indirect taxes
and other
taxes
Source: The figure developed by the authors on the information concerning the indirect taxes and other taxes at the Alfa Group.
During the period under analysis (2004-2010), the Alfa Group achieved positive economic-financial results, as its economic performance was constantly growing (given the impact of the financial crisis, as well as the companies that entered or exited the consolidation perimeter during this interval), a fact proved by the favorable evolution of the turnover, of the EBIT, EBITDA and by the decreasing indebtedness of the group. When referring to the client portfolio (consumers or Business Unit) and to their satisfaction degree, one can observe a reduction in these indicators, mostly reflected by a reduced market share of the group as well as a decreasing impact of the financial crisis. Moreover, one must not overlook the fact that the scale used for measuring the degree of satisfaction had 5 levels during 2004-2007 and it included five more levels since 2008, thus allowing for a more profound awareness of the customers’ needs.
The assessment of the products and services provided by the Alfa Group is reflected by the customers’ satisfaction, which is still growing.
6. Conclusions
The need to understand the economic-financial context of the entity represents an essential requirement, but it often happens that the management does not have the right information to make decisions. BS and especially the managerial performance systems overcome this obstacle, through the strategic orientation of the management audit using the KPIs, the achievement of the economic performance and the fulfillment of the objectives set.
As a proof, we present the successful cases of Boehringer Ingelhim, Sutter Industries, Monnalisa, Edipower-Gruppo Edison and Davines, which have underlined the costs,

Institute for Economic Forecasting
Romanian Journal of Economic Forecasting – 3/2011198
the benefits, the problems and the solutions connected to the introduction by the company of the methods and systems of registration and performance monitoring.
In order to meet certain objectives, an entity needs a strategic management able to guarantee the performance that will create value, superior to that of its competitors and sustainable in time.
To conclude, the Balance Scorecard fills the gap existing in most management systems, created by the lack of a systematic process that could receive in time the warning signals that would help carry out the strategies of the entity. Management processes built on a balanced structure ensure a coherent development of the economic activities of the organization, in agreement with long-term strategies and focused on implementation.
Thus used, the BSC becomes the essence of management structures of new economy entities, especially of those that assume higher responsibility in providing services in developed countries. BSC is more than a modern system of evaluating the economic-financial performance, it is a central structure for all management processes; its effectiveness is apparent when a measuring system turns into a management system, thus becoming a benchmark in the management of international portfolio.
Acknowledgements
This work was supported by the project "Post-Doctoral Studies in Economics: Training program for elite researchers - SPODE" co-funded from the European Social Fund through the Development of Human Resources Operational Programme 2007-2013, contract no. POSDRU/89/1.5/S/61755.
References
Muras, A. Smith, Th. and Meyers, D., 2008. Simple, effective performance management: A top-down and bottom-up approach. The Journal of Corporate Accounting & Finance, 20(1), pp.65-73.
Bocchino, U., 2000. Manuale di controllo di gestione, Il Sole 24 Ore, p. 317.
Brusa, L., 2000. Sistemi manageriali di programmazione e controllo, Milano: Giuffrè Editore, p. 2.
Josey, Ch. and Kim, Il, 2008. Implementation of the balanced scorecard at Barberton citizens hospital. The Journal of Corporate Accounting & Finance, 19(3), pp.57-63.
Cannon, D. Godwin, J.H. and Goldberg, St., 2007. Balanced scorecard and IS auditing.), The Journal of Corporate Accounting & Finance, 18(6),pp.85-87.
Norreklit, H. Jacobsen, M. and Mitchell, F., 2008. Pitfalls in using the balanced scorecard. The Journal of Corporate Accounting & Finance, pp.65-68.
Kaplan, R.S. and Norton, D.P., 2000. Having Trouble with your Strategy? Then Map It. Harvard Business Review, Sett-Ottobre.

Contribution of Balance Scorecard Model
Romanian Journal of Economic Forecasting – 3/2011 199
Kaplan, R.S. and Norton, D.P., 1993. Putting the Balanced Scorecard to Work.Harvard Business Review, Sett-Ottobre.
Kaplan, R.S. and Norton, D.P., 1996. The Balanced Scorecard, translating strategy into action, Harvard Business School Press. Translated by Alberto Bubbio, 2004. Balanced Scorecard, tradurre la strategia in azione,ISEDI.
Kaplan, R.S. and Norton, D.P., 2001. The Strategy Focused Organization. How Balanced Scorecard companies thrive in the new business environment. Harvard Business School Press.
Kaplan, R.S. and Norton, D.P., 1996. Using the Balanced Scorecard as a Strategic Management System. Harvard Business Review.
Strernini, C., 2005. Dal Tableau de Bord alla Balanced Scorecard, l’evoluzione dei sistemi di controllo. Amministrazione & Finanza, 11, pp.23-25.
Terzani, S., 1999. Lineamenti di pianificazione e controllo. Cedam, Padova, p. 6.
Francesca Calusso, 2006. Balance Scorecard e KPI. Available at: < http://www.slidefinder.net/b/balanced/5047544>.
Riccaboni, A., 2010. Il ruolo del contollo nella Governence Integrate., Available at: <http://www.disas.unisi.it/mat_did/riccaboni/693/03)_Governance_integrata_e_controllo.pdf> and <http://www.revenuerecognition.com/content/articles/9010.asp>.