institute for policy & social researchipsr.ku.edu/ksdata/kcced/profiles/pdf/20027.pdf ·...
TRANSCRIPT

Clay County

Foreword
The Kansas County Profile Report is published by the Institute for Policy & Social Research(IPSR) at the University of Kansas with support from the KU University Center project.* Specialthanks to Xanthippe Wedel, senior research data engineer, who compiles and updates thecounty profiles and Genna Hurd, associate researcher, who provides editorial review.
County reports can be generated for any county in Kansas by simply clicking on the county fromthe web site:
http://ipsr.ku.edu/ksdata/kcced/profiles/
The Kansas County Profile Report contains 12 categories of information: Population, VitalStatistics and Health, Housing, Education, Social Environment, Business, Employment, Income,Banking, Government, Crime, and Agriculture. For more information about Kansas, please referto the Kansas Statistical Abstract, available online at:
http://ipsr.ku.edu/ksdata/ksah/
We are always looking for ways to improve the Kansas County Profile Report and we welcomeyour suggestions and comments. Please address any correspondence to the Institute forPolicy & Social Research, The University of Kansas, 607 Blake Hall, 1541 Lilac Lane,Lawrence, Kansas 66045-3129, e-mail [email protected] or call 785-864-3701.
*The KU University Center is a collaborative effort between the KU Center for Entrepreneurshipin the School of Business and the Institute for Policy & Social Research at the University ofKansas. This project is supported by the Economic Development Administration, U.S.Department of Commerce, through its University Center Program.
The mission of EDA is to lead the federal economic development agenda by promotinginnovation and competitiveness, preparing American regions for growth and success in theworldwide economy.

i
Kansas County Profiles Table of Contents
Population
Total Population (Decennial Census) 1Estimated Population (Current Population Reports) 1Urban Population 2Rural Population 2
Net Migration (Decade Ending...) 2Median Age 2
Population (Age Groups)
Population Under 18 (Decennial Census) 3Population Age 18 and Over (Decennial Census) 3Population Age 65 and Over (Decennial Census) 3Population Age 85 and Over (Decennial Census) 3
Vital Statistics and Health
Live Births 4Deaths 4Marriages 5Divorces and Annulments 5
Physicians: M.D. Physicians 6Physicians: D.O. Physicians 6Dentists 6Number of Hospitals 7
Number of Hospital Beds 7
Housing
Housing Units (Decennial Census) 7Housing Units (Estimated) 8Occupied Housing Units 8Owner Occupied Housing Units 8
Renter Occupied Housing Units 8Vacant Housing Units 9Median Value ($): Owner Occupied Housing Units 9Median Contract Rent ($) 9
Fair Market Rent: 2 Bedrooms 10
Education
Population Age 25 and Over 10Percent of Population 25+ with High School or Higher Education 10Percent of Population 25+ with Bachelors Degree or Higher Education 11Public School Enrollment (FTE- School Year Beginning...) 11
Pupil/Teacher Ratio (School Year Beginning...) 12

ii
Kansas County Profiles Table of Contents
Social Environment
Total Child Care Facilities 12Preschools 12Food Stamp Beneficiaries 13Percent of Population Receiving Food Stamps 13
Estimated Number of People in Poverty 14Estimated Percent of People in Poverty 14Estimated Number of Related Children Age 5 to 17 in Families in Poverty 15Estimated Percent of Related Children Age 5 to 17 in Families in Poverty 15
Estimated Number Under 18 in Poverty 16Estimated Percent Under 18 in Poverty 16
Business
Establishments: Total 17Establishments: 1-19 Employees 17Establishments: 20-99 Employees 18Establishments: 100-499 Employees 18
Establishments: 500 or More Employees 19Establishments: Forestry, Fishing, Hunting, and Ag Support 19Establishments: Mining 20Establishments: Utilities 20
Establishments: Construction 21Establishments: Manufacturing 21Establishments: Wholesale Trade 22Establishments: Retail Trade 22
Establishments: Transportation and Warehousing 23Establishments: Information 23Establishments: Finance and Insurance 24Establishments: Real Estate, Rental, and Leasing 24
Establishments: Professional, Scientific, and Technical Services 25Establishments: Management of Companies and Enterprises 25Establishments: Admin, Support, Waste Management, and Remediation 26Establishments: Educational Services 26
Establishments: Health Care and Social Assistance 27Establishments: Arts, Entertainment, and Recreation 27Establishments: Accommodation and Food Services 28Establishments: Other Services 28

iii
Kansas County Profiles Table of Contents
Business
Total Annual Payroll ($000) 29Total Annual Payroll ($000): Forestry, Fishing, Hunting, and Ag Support 29Total Annual Payroll ($000): Mining 30Total Annual Payroll ($000): Utilities 30
Total Annual Payroll ($000): Construction 31Total Annual Payroll ($000): Manufacturing 31Total Annual Payroll ($000): Wholesale Trade 32Total Annual Payroll ($000): Retail Trade 32
Total Annual Payroll ($000): Transportation and Warehousing 33Total Annual Payroll ($000): Information 33Total Annual Payroll ($000): Finance and Insurance 34Total Annual Payroll ($000): Real Estate, Rental, and Leasing 34
Total Annual Payroll ($000): Professional, Scientific, and Technical Services 35Total Annual Payroll ($000): Management of Companies and Enterprises 35Total Annual Payroll ($000): Admin, Support, Waste Management, and Remediation 36Total Annual Payroll ($000): Educational Services 36
Total Annual Payroll ($000): Health Care and Social Assistance 37Total Annual Payroll ($000): Arts, Entertainment, and Recreation 37Total Annual Payroll ($000): Accommodation and Food Services 38Total Annual Payroll ($000): Other Services 38
Nominal Taxable Retail Sales (Million$) 39Retail Pull Factor 39
Employment
Civilian Labor Force (BLS - Place of Residence) 40Employed (BLS - Place of Residence) 41Unemployed (BLS - Place of Residence) 42Unemployment Rate (BLS - Place of Residence) 43
BEA Employment: Total (Place of Work) 44BEA Employment: Farm 45BEA Employment: Non-Farm 46Average Wage per Job ($) 47
BEA Employment: Forestry, Fishing, Hunting, and Ag Support 47BEA Employment: Mining 48BEA Employment: Utilities 48BEA Employment: Construction 49
BEA Employment: Manufacturing 49BEA Employment: Wholesale Trade 50BEA Employment: Retail Trade 50BEA Employment: Transportation and Warehousing 51
BEA Employment: Information 51BEA Employment: Finance and Insurance 52BEA Employment: Real Estate, Rental, and Leasing 52BEA Employment: Professional and Technical Services 53
BEA Employment: Management of Companies and Enterprises 53BEA Employment: Administrative and Waste Services 54BEA Employment: Educational Services 54BEA Employment: Health Care and Social Assistance 55
BEA Employment: Arts, Entertainment, and Recreation 55BEA Employment: Government and Government Enterprises 56BEA Employment: Accommodation and Food Services 56BEA Employment: Other Services, Except Public Administration 57

iiii
Kansas County Profiles Table of Contents
Income
BEA Per Capita Personal Income ($) 57Sources of Personal Income: Total Personal Income ($000) 58Sources of Personal Income: Wages And Salaries ($000) 59Sources of Personal Income: Proprietors-Farm ($000) 60
Sources of Personal Income: Proprietors-Nonfarm ($000) 61Sources of Personal Income: Dividends, Interest, Rent ($000) 62Sources of Personal Income: Transfer Payments ($000) 63Sources of Personal Income: Less Social Insurance ($000) 64
HUD Median Family Income 64HUD 30% Low-To-Medium Income (LMI) Limit - 4 Persons 64HUD 50% Low-To-Medium Income (LMI) Limit - 4 Persons 65HUD 80% Low-To-Medium Income (LMI) Limit - 4 Persons 65
Banking
Bank Deposits ($000) 65Number of Banks 66Number of Banking Offices 66
Government
Tangible Assessed Valuation (million$) 67Sales Tax Collections 67
Crime
Crime Index Offenses 68Property Crimes 68Violent Crimes 68
Agriculture
Number of Farms 69Total Acres Harvested 69Value: Livestock and Poultry ($000) 69Value: Field Crops ($000) Excluding Government Program Payments 70

Institute for Policy & Social Research, The University of Kansas, Lawrence, KS 66045 (email: [email protected]) 12/21/2017
County: county value. Kansas: state value. County Rank: highest county value ranked #1. ($000): thousands of dollars. Nonmetro Kansas: Kansas total lessMetropolitan Areas as defined by the Office of Management and Budget (OMB; released 2/28/2013). Per 1000: For nonmoney amounts, Per 1000=(countyvalue / county population for the same year as the data) x 1000. $ Per capita=(county value / county population for the same year as the data). Value= . indicatesmissing or suppressed data or value not calculated.
Kansas County Profile Clay County, Kansas Page 1 of 70
Population
1900 1950 2000
DECENNIAL CENSUS:TOTALPOPULATION
U.S. Census Bureau
Year CountyState ofKansas
NonMetro
KansasCountyRank
Per 1000or $ PerCapita
1890 16,146 1,427,096 967,013 38 .
1900 15,833 1,470,495 981,287 42 .
1910 15,251 1,690,949 1,137,589 43 .
1920 14,365 1,769,257 1,154,858 44 .
1930 14,556 1,880,999 1,182,748 42 .
1940 13,281 1,801,028 1,100,437 44 .
1950 11,697 1,905,299 1,058,170 45 .
1960 10,675 2,178,611 1,040,331 47 .
1970 9,890 2,246,578 977,329 45 .
1980 9,802 2,363,679 1,000,977 45 .
1990 9,158 2,477,574 961,577 45 .
2000 8,822 2,688,418 978,781 47 .
2010 8,535 2,853,118 956,485 47 .
1990 2000 2010
ESTIMATED POPULATION
U.S. Census Bureau
Year CountyState ofKansas
NonMetro
KansasCountyRank
Per 1000or $ PerCapita
1990 9,126 2,481,349 960,864 45 .
1991 9,040 2,498,722 960,509 45 .
1992 9,222 2,532,394 968,355 45 .
1993 9,147 2,556,547 971,429 45 .
1994 9,125 2,580,513 976,527 45 .
1995 9,156 2,601,007 981,095 45 .
1996 9,164 2,614,554 979,387 45 .
1997 9,005 2,635,292 979,375 46 .
1998 8,905 2,660,598 980,217 46 .
1999 8,829 2,678,338 980,235 47 .
2000 8,827 2,693,681 978,390 47 .
2001 8,730 2,702,162 971,831 47 .
2002 8,607 2,713,535 965,192 47 .
2003 8,493 2,723,004 960,462 48 .
2004 8,447 2,734,373 956,333 47 .
2005 8,444 2,745,299 951,702 47 .
2006 8,458 2,762,931 948,398 47 .
2007 8,527 2,783,785 947,583 47 .
2008 8,618 2,808,076 948,632 46 .
2009 8,500 2,832,704 950,407 47 .
2010 8,541 2,858,850 957,598 47 .
2011 8,513 2,869,503 955,577 47 .
2012 8,508 2,885,262 956,240 46 .
2013 8,401 2,892,821 952,451 47 .
2014 8,338 2,899,360 947,365 47 .
2015 8,340 2,906,721 942,608 47 .
2016 8,143 2,907,289 934,433 47 .

Institute for Policy & Social Research, The University of Kansas, Lawrence, KS 66045 (email: [email protected]) 12/21/2017
County: county value. Kansas: state value. County Rank: highest county value ranked #1. ($000): thousands of dollars. Nonmetro Kansas: Kansas total lessMetropolitan Areas as defined by the Office of Management and Budget (OMB; released 2/28/2013). Per 1000: For nonmoney amounts, Per 1000=(countyvalue / county population for the same year as the data) x 1000. $ Per capita=(county value / county population for the same year as the data). Value= . indicatesmissing or suppressed data or value not calculated.
Kansas County Profile Clay County, Kansas Page 2 of 70
Population
1940 2000
URBAN POPULATION
U.S. Census Bureau: Decennial Census
Year CountyState ofKansas
NonMetro
KansasCountyRank
Per 1000or $ PerCapita
1930 4,386 729,834 341,321 36 .
1940 4,518 753,941 354,522 36 .
1950 4,528 993,220 409,185 39 .
1960 4,613 1,328,741 472,565 38 .
1970 4,963 1,484,870 470,446 38 .
1980 4,948 1,575,899 492,167 39 .
1990 4,613 1,712,564 482,296 40 .
2000 4,454 1,920,081 508,836 40 .
2010 4,307 2,116,961 513,153 40 .
1940 2000
RURAL POPULATION
U.S. Census Bureau
Year CountyState ofKansas
NonMetro
KansasCountyRank
Per 1000or $ PerCapita
1930 10,170 1,151,165 841,427 55 .
1940 8,763 1,047,087 745,915 59 .
1950 7,169 912,079 648,985 61 .
1960 6,062 849,870 567,766 59 .
1970 4,927 761,708 509,294 61 .
1980 4,854 787,780 509,367 62 .
1990 4,545 765,010 479,281 60 .
2000 4,368 768,337 470,349 62 .
2010 4,228 736,157 443,332 58 .
1940 2000
NET MIGRATION: DECADEENDING…
calculated by the Institute for Policy andSocial Research, The University ofKansas
Year CountyState ofKansas
NonMetro
KansasCountyRank
Per 1000or $ PerCapita
1930 -1,244 -66,132 -100,271 61 -85.5
1940 -2,084 -192,649 -165,617 67 -156.9
1950 -2,949 -84,329 -153,613 79 -252.1
1960 -1,844 -38,999 -146,885 70 -172.7
1970 -646 -119,662 -112,585 43 -65.3
1980 -33 -21,983 -14,022 45 -3.4
1990 -583 -61,835 -87,905 47 -63.7
2000 -93 68,960 -4,841 60 -10.5
2010 -197 5,578 -48,626 40 -23.1
1960 1980 2000
MEDIAN AGE
U.S. Census Bureau: Decennial Census
Year CountyState ofKansas
NonMetro
KansasCountyRank
Per 1000or $ PerCapita
1960 38.7 26.9 . 9 .
1970 40.3 28.7 . 25 .
1980 37.2 30.1 . 30 .
1990 39.2 32.9 . 24 .
2000 41.3 35.2 . 32 .
2010 43.3 36.0 . 43 .

Institute for Policy & Social Research, The University of Kansas, Lawrence, KS 66045 (email: [email protected]) 12/21/2017
County: county value. Kansas: state value. County Rank: highest county value ranked #1. ($000): thousands of dollars. Nonmetro Kansas: Kansas total lessMetropolitan Areas as defined by the Office of Management and Budget (OMB; released 2/28/2013). Per 1000: For nonmoney amounts, Per 1000=(countyvalue / county population for the same year as the data) x 1000. $ Per capita=(county value / county population for the same year as the data). Value= . indicatesmissing or suppressed data or value not calculated.
Kansas County Profile Clay County, Kansas Page 3 of 70
Population
1970 1990 2010
POPULATION UNDER 18(DECENNIAL CENSUS)
U.S. Census Bureau: Decennial Census
Year CountyState ofKansas
NonMetro
KansasCountyRank
Per 1000or $ PerCapita
1970 2,942 746,354 311,386 48 .
1980 2,527 649,035 270,128 46 .
1990 2,340 661,614 256,807 46 .
2000 2,200 712,993 256,660 49 .
2010 2,021 726,939 237,930 49 .
1970 1990 2010
POPULATION AGE 18 AND OVER(DECENNIAL CENSUS)
U.S. Census Bureau: Decennial Census
Year CountyState ofKansas
NonMetro
KansasCountyRank
Per 1000or $ PerCapita
1970 6,948 1,500,224 668,354 44 .
1980 7,260 1,714,282 731,286 45 .
1990 6,818 1,815,960 704,770 45 .
2000 6,622 1,975,425 722,525 46 .
2010 6,514 2,126,179 718,555 47 .
1970 1990 2010
POPULATION AGE 65 AND OVER(DECENNIAL CENSUS)
U.S. Census Bureau: Decennial Census
Year CountyState ofKansas
NonMetro
KansasCountyRank
Per 1000or $ PerCapita
1970 2,011 266,201 149,407 37 .
1980 2,085 306,263 165,380 41 .
1990 2,100 342,571 169,275 42 .
2000 1,831 356,229 162,706 45 .
2010 1,744 376,116 155,272 46 .
1970 1990 2010
POPULATION AGE 85 AND OVER(DECENNIAL CENSUS)
U.S. Census Bureau: Decennial Census
Year CountyState ofKansas
NonMetro
KansasCountyRank
Per 1000or $ PerCapita
1970 205 23,899 13,734 37 .
1980 267 33,455 18,831 37 .
1990 356 42,241 22,993 35 .
2000 303 51,770 26,654 43 .
2010 339 59,318 26,250 39 .

Institute for Policy & Social Research, The University of Kansas, Lawrence, KS 66045 (email: [email protected]) 12/21/2017
County: county value. Kansas: state value. County Rank: highest county value ranked #1. ($000): thousands of dollars. Nonmetro Kansas: Kansas total lessMetropolitan Areas as defined by the Office of Management and Budget (OMB; released 2/28/2013). Per 1000: For nonmoney amounts, Per 1000=(countyvalue / county population for the same year as the data) x 1000. $ Per capita=(county value / county population for the same year as the data). Value= . indicatesmissing or suppressed data or value not calculated.
Kansas County Profile Clay County, Kansas Page 4 of 70
Vital Statisticsand Health
2000 2010
BIRTHS (LIVE)
Kansas Department of Health andEnvironment
Year CountyState ofKansas
NonMetro
KansasCountyRank
Per 1000or $ PerCapita
2000 97 39,654 13,444 53 11.0
2001 87 38,832 13,042 53 10.0
2002 97 39,338 12,961 50 11.3
2003 81 39,353 12,873 54 9.5
2004 91 39,553 12,817 51 10.8
2005 99 39,701 12,837 49 11.7
2006 130 40,896 13,272 41 15.4
2007 108 41,951 13,671 49 12.7
2008 100 41,815 13,682 49 11.6
2009 113 41,388 13,743 44 13.3
2010 107 40,439 13,172 47 12.5
2011 106 39,628 12,957 47 12.5
2012 97 40,304 13,197 49 11.4
2013 113 38,805 12,816 43 13.5
2014 108 39,193 13,031 47 13.0
2015 89 39,126 12,856 51 10.7
2016 117 38,048 12,360 42 14.4
2000 2010
DEATHS
Kansas Department of Health andEnvironment
Year CountyState ofKansas
NonMetro
KansasCountyRank
Per 1000or $ PerCapita
2000 107 24,676 11,273 51 12.1
2001 99 24,590 10,897 52 11.3
2002 126 24,968 11,166 44 14.6
2003 84 24,417 10,701 60 9.9
2004 103 23,720 10,430 49 12.2
2005 120 24,632 10,674 46 14.2
2006 110 24,489 10,636 48 13.0
2007 119 24,413 10,651 44 14.0
2008 123 24,896 10,712 43 14.3
2009 111 23,997 10,051 44 13.1
2010 108 24,428 10,228 46 12.7
2011 106 25,114 10,626 48 12.5
2012 89 25,084 10,349 53 10.5
2013 115 25,347 10,349 45 13.7
2014 110 25,731 10,360 45 13.2
2015 112 26,611 10,662 44 13.4
2016 103 26,129 10,359 47 12.6

Institute for Policy & Social Research, The University of Kansas, Lawrence, KS 66045 (email: [email protected]) 12/21/2017
County: county value. Kansas: state value. County Rank: highest county value ranked #1. ($000): thousands of dollars. Nonmetro Kansas: Kansas total lessMetropolitan Areas as defined by the Office of Management and Budget (OMB; released 2/28/2013). Per 1000: For nonmoney amounts, Per 1000=(countyvalue / county population for the same year as the data) x 1000. $ Per capita=(county value / county population for the same year as the data). Value= . indicatesmissing or suppressed data or value not calculated.
Kansas County Profile Clay County, Kansas Page 5 of 70
Vital Statisticsand Health
2000 2010
MARRIAGES
Kansas Department of Health andEnvironment
Year CountyState ofKansas
NonMetro
KansasCountyRank
Per 1000or $ PerCapita
2000 71 20,426 7,726 46 8.0
2001 52 20,457 7,897 57 6.0
2002 74 19,783 7,256 40 8.6
2003 67 18,722 6,918 42 7.9
2004 73 19,174 7,215 41 8.6
2005 66 18,745 6,914 41 7.8
2006 62 18,836 6,964 45 7.3
2007 60 18,910 6,982 44 7.0
2008 65 18,717 6,858 41 7.5
2009 56 18,268 6,619 45 6.6
2010 67 18,150 6,569 41 7.9
2011 90 17,897 6,484 32 10.6
2012 59 18,154 6,396 41 6.9
2013 53 17,328 6,095 46 6.3
2014 46 17,655 6,021 48 5.5
2015 45 17,595 5,886 48 5.4
2016 58 17,948 5,797 41 7.1
2000 2010
DIVORCES AND ANNULMENTS
Kansas Department of Health andEnvironment
Year CountyState ofKansas
NonMetro
KansasCountyRank
Per 1000or $ PerCapita
2000 40 10,105 4,198 41 4.5
2001 30 9,885 4,022 53 3.4
2002 31 9,645 3,924 48 3.6
2003 28 8,644 3,637 50 3.3
2004 31 8,759 3,682 46 3.7
2005 27 8,476 3,434 50 3.2
2006 26 9,145 3,551 53 3.1
2007 22 9,347 3,663 57 2.6
2008 27 9,818 4,030 54 3.1
2009 17 10,333 3,801 67 2.0
2010 18 10,579 3,885 63 2.1
2011 21 10,445 3,696 58 2.5
2012 17 9,782 3,389 65 2.0
2013 25 9,085 3,305 49 3.0
2014 13 8,441 2,958 70 1.6
2015 26 8,036 3,026 45 3.1
2016 19 7,198 2,763 51 2.3

Institute for Policy & Social Research, The University of Kansas, Lawrence, KS 66045 (email: [email protected]) 12/21/2017
County: county value. Kansas: state value. County Rank: highest county value ranked #1. ($000): thousands of dollars. Nonmetro Kansas: Kansas total lessMetropolitan Areas as defined by the Office of Management and Budget (OMB; released 2/28/2013). Per 1000: For nonmoney amounts, Per 1000=(countyvalue / county population for the same year as the data) x 1000. $ Per capita=(county value / county population for the same year as the data). Value= . indicatesmissing or suppressed data or value not calculated.
Kansas County Profile Clay County, Kansas Page 6 of 70
Vital Statisticsand Health
2006 2010 2014
PHYSICIANS: M.D. PHYSICIANS
Kansas Department of Health andEnvironment (1981-2005,2010-);Kansas Health Policy Authority(2006-2009)
Year CountyState ofKansas
NonMetro
KansasCountyRank
Per 1000or $ PerCapita
2005 8 4,241 923 42 0.9
2006 7 4,310 968 43 0.8
2007 8 5,309 1,060 41 0.9
2008 7 5,110 1,033 42 0.8
2009 6 5,249 1,011 49 0.7
2010 8 5,192 995 42 0.9
2011 8 5,243 1,009 39 0.9
2012 7 5,693 1,056 45 0.8
2013 7 6,106 1,096 44 0.8
2014 7 5,839 968 43 0.8
2015 7 5,703 871 38 0.8
2006 2010 2014
PHYSICIANS: D.O. PHYSICIANS
Kansas Department of Health andEnvironment (1981-2005,2010-);Kansas Health Policy Authority(2006-2009)
Year CountyState ofKansas
NonMetro
KansasCountyRank
Per 1000or $ PerCapita
2005 0 553 173 105 0.0
2006 0 508 170 105 0.0
2007 0 569 169 105 0.0
2008 0 558 165 105 0.0
2009 0 564 159 105 0.0
2010 0 583 167 105 0.0
2011 0 502 149 105 0.0
2012 0 718 200 105 0.0
2013 0 829 208 105 0.0
2014 0 817 190 105 0.0
2015 0 819 191 105 0.0
2006 2010 2014
DENTISTS
Kansas Department of Health andEnvironment (1981-2006,2010-);Kansas Health Policy Authority(2007-2009)
Year CountyState ofKansas
NonMetro
KansasCountyRank
Per 1000or $ PerCapita
2005 2 1,347 377 69 0.2
2006 2 1,381 377 68 0.2
2007 3 1,335 366 48 0.4
2008 2 1,392 370 67 0.2
2009 2 1,353 367 67 0.2
2010 3 1,401 380 53 0.4
2011 3 1,338 359 50 0.4
2012 4 1,434 413 46 0.5
2013 4 1,212 337 40 0.5
2015 4 1,240 336 40 0.5

Institute for Policy & Social Research, The University of Kansas, Lawrence, KS 66045 (email: [email protected]) 12/21/2017
County: county value. Kansas: state value. County Rank: highest county value ranked #1. ($000): thousands of dollars. Nonmetro Kansas: Kansas total lessMetropolitan Areas as defined by the Office of Management and Budget (OMB; released 2/28/2013). Per 1000: For nonmoney amounts, Per 1000=(countyvalue / county population for the same year as the data) x 1000. $ Per capita=(county value / county population for the same year as the data). Value= . indicatesmissing or suppressed data or value not calculated.
Kansas County Profile Clay County, Kansas Page 7 of 70
Vital Statisticsand Health
2006 2010 2014
NUMBER OF HOSPITALS
American Hospital Association,American Hospital Association Guide tothe Health Care Field
Year CountyState ofKansas
NonMetro
KansasCountyRank
Per 1000or $ PerCapita
2005 1 158 106 96 .
2006 1 158 106 96 .
2007 1 159 105 95 .
2008 1 159 105 95 .
2009 1 158 106 96 .
2010 1 158 105 96 .
2011 1 158 104 96 .
2012 1 157 104 96 .
2014 1 156 . 96 .
2015 1 155 104 96 .
2006 2010 2014
NUMBER OF HOSPITAL BEDS
Kansas Department of Health andEnvironment
Year CountyState ofKansas
NonMetro
KansasCountyRank
Per 1000or $ PerCapita
2005 25 12,389 5,749 85 3.0
2006 25 11,992 5,593 85 3.0
2007 25 12,171 5,725 84 2.9
2008 25 12,332 5,788 85 2.9
2009 25 12,283 5,740 86 2.9
2010 25 12,218 5,605 86 2.9
2011 25 12,182 5,419 85 2.9
2012 25 12,002 5,439 85 2.9
2014 25 12,034 . 84 3.0
2015 25 11,926 5,407 85 3.0
Housing
1960 1980 2000
HOUSING UNITS (DECENNIAL)
U.S. Census Bureau: Decennial Census
Year CountyState ofKansas
NonMetro
KansasCountyRank
Per 1000or $ PerCapita
1950 3,914 586,650 331,125 43 334.6
1960 3,708 672,899 334,084 44 347.4
1970 4,004 789,735 369,247 45 404.9
1980 4,247 955,207 424,284 46 433.3
1990 4,138 1,044,112 425,369 47 451.8
2000 4,084 1,131,395 430,325 47 462.9
2010 4,042 1,233,215 434,749 47 473.6

Institute for Policy & Social Research, The University of Kansas, Lawrence, KS 66045 (email: [email protected]) 12/21/2017
County: county value. Kansas: state value. County Rank: highest county value ranked #1. ($000): thousands of dollars. Nonmetro Kansas: Kansas total lessMetropolitan Areas as defined by the Office of Management and Budget (OMB; released 2/28/2013). Per 1000: For nonmoney amounts, Per 1000=(countyvalue / county population for the same year as the data) x 1000. $ Per capita=(county value / county population for the same year as the data). Value= . indicatesmissing or suppressed data or value not calculated.
Kansas County Profile Clay County, Kansas Page 8 of 70
Housing
2000 2010
HOUSING UNITS (ESTIMATED)
U.S. Census Bureau
Year CountyState ofKansas
NonMetro
KansasCountyRank
Per 1000or $ PerCapita
2000 4,085 1,134,529 430,630 47 463.0
2001 4,089 1,146,858 431,936 47 468.4
2002 4,083 1,160,129 433,107 47 474.4
2003 4,077 1,171,620 433,904 47 480.0
2004 4,084 1,184,702 434,529 47 483.5
2005 4,085 1,195,791 434,871 47 483.8
2006 4,085 1,206,692 434,600 47 483.0
2007 4,083 1,217,608 435,429 47 478.8
2008 4,071 1,225,625 435,999 47 472.4
2009 4,058 1,230,552 435,276 47 477.4
2010 4,041 1,234,216 434,867 47 473.5
2011 4,037 1,236,668 434,924 47 474.2
2012 4,036 1,239,534 435,145 47 474.4
2013 4,040 1,243,225 435,353 47 480.9
2014 4,044 1,248,944 435,597 46 485.0
2015 4,055 1,253,831 435,843 46 486.2
2016 4,053 1,259,864 436,102 46 497.7
1970 1990 2010
OCCUPIED HOUSING UNITS
U.S. Census Bureau: Decennial Census
Year CountyState ofKansas
NonMetro
KansasCountyRank
Per 1000or $ PerCapita
1970 3,589 727,364 331,872 44 362.9
1980 3,830 872,239 378,404 45 390.7
1990 3,641 944,726 373,402 45 397.6
2000 3,617 1,037,891 382,400 46 410.0
2010 3,559 1,112,096 379,732 46 417.0
1970 1990 2010
OWNER OCCUPIED HOUSING UNITS
U.S. Census Bureau: Decennial Census
Year CountyState ofKansas
NonMetro
KansasCountyRank
Per 1000or $ PerCapita
1970 2,668 502,585 238,292 44 269.8
1980 2,921 612,433 279,387 45 298.0
1990 2,674 641,762 265,553 45 292.0
2000 2,776 718,703 274,004 46 314.7
2010 2,678 753,532 265,198 47 313.8
1970 1990 2010
RENTER OCCUPIED HOUSINGUNITS
U.S. Census Bureau: Decennial Census
Year CountyState ofKansas
NonMetro
KansasCountyRank
Per 1000or $ PerCapita
1970 921 224,779 93,580 41 93.1
1980 909 259,806 99,017 42 92.7
1990 967 302,964 107,849 42 105.6
2000 841 319,188 108,396 46 95.3
2010 881 358,564 114,534 46 103.2

Institute for Policy & Social Research, The University of Kansas, Lawrence, KS 66045 (email: [email protected]) 12/21/2017
County: county value. Kansas: state value. County Rank: highest county value ranked #1. ($000): thousands of dollars. Nonmetro Kansas: Kansas total lessMetropolitan Areas as defined by the Office of Management and Budget (OMB; released 2/28/2013). Per 1000: For nonmoney amounts, Per 1000=(countyvalue / county population for the same year as the data) x 1000. $ Per capita=(county value / county population for the same year as the data). Value= . indicatesmissing or suppressed data or value not calculated.
Kansas County Profile Clay County, Kansas Page 9 of 70
Housing
1970 1990 2010
VACANT HOUSING UNITS
U.S. Census Bureau: Decennial Census
Year CountyState ofKansas
NonMetro
KansasCountyRank
Per 1000or $ PerCapita
1970 414 60,058 36,002 47 41.9
1980 408 77,912 42,286 48 41.6
1990 497 99,386 51,967 55 54.3
2000 467 93,309 47,924 56 52.9
2010 483 121,119 55,017 63 56.6
1980 1990 2000 2010
MEDIAN VALUE ($): OWNEROCCUPIED HOUSING UNITS
U.S. Census Bureau, Decennial Census(- 2000), (2009 -) American CommunitySurvey five-year average ending in yearshown. Please see source for samplingvariability.
Year CountyState ofKansas
NonMetro
KansasCountyRank
Per 1000or $ PerCapita
1980 28,300 37,800 . 49 .
1990 33,800 52,200 . 49 .
2000 52,900 83,500 . 56 .
2009 82,200 118,500 . 39 .
2010 86,500 122,600 . 32 .
2011 84,000 125,500 . 39 .
2012 87,200 127,400 . 39 .
2013 85,700 128,400 . 42 .
2014 93,100 129,400 . 32 .
2015 96,500 132,000 . 32 .
2016 99,400 135,300 . 33 .
1980 1990 2000 2010
MEDIAN CONTRACT RENT ($)
U.S. Census Bureau, Decennial Census(- 2000), (2009 -) American CommunitySurvey five-year average ending in yearshown. Please see source for samplingvariability.
Year CountyState ofKansas
NonMetro
KansasCountyRank
Per 1000or $ PerCapita
1980 148 219 . 80 .
1990 231 372 . 94 .
2000 333 498 . 80 .
2009 362 491 . 40 .
2010 410 507 . 28 .
2011 623 699 . 21 .
2012 649 715 . 25 .
2013 676 732 . 21 .
2014 674 748 . 23 .
2015 613 757 . 46 .
2016 641 775 . 40 .

Institute for Policy & Social Research, The University of Kansas, Lawrence, KS 66045 (email: [email protected]) 12/21/2017
County: county value. Kansas: state value. County Rank: highest county value ranked #1. ($000): thousands of dollars. Nonmetro Kansas: Kansas total lessMetropolitan Areas as defined by the Office of Management and Budget (OMB; released 2/28/2013). Per 1000: For nonmoney amounts, Per 1000=(countyvalue / county population for the same year as the data) x 1000. $ Per capita=(county value / county population for the same year as the data). Value= . indicatesmissing or suppressed data or value not calculated.
Kansas County Profile Clay County, Kansas Page 10 of 70
Housing
2005 2010 2015
FAIR MARKET RENT: 2 BEDROOMS
U.S. Department of Housing and UrbanDevelopment (HUD)
Year CountyState ofKansas
NonMetro
KansasCountyRank
Per 1000or $ PerCapita
2005 509 . . 42 .
2006 520 . . 44 .
2007 536 . . 44 .
2008 550 628 . 45 .
2009 573 653 . 44 .
2010 596 678 . 46 .
2011 605 684 . 46 .
2012 632 660 . 25 .
2013 687 712 . 21 .
2014 719 746 . 17 .
2015 747 756 . 12 .
2016 749 781 . 14 .
2017 777 811 . 15 .
Education
1980 1990 2000 2010
POPULATION AGE 25+
U.S. Census Bureau, Decennial Census(- 2000), (2009 -) American CommunitySurvey five-year average ending in yearshown. Please see source for samplingvariability.
Year CountyState ofKansas
NonMetro
KansasCountyRank
Per 1000or $ PerCapita
1980 6,380 1,388,102 605,087 . .
1990 6,309 1,565,936 619,414 . .
2000 6,026 1,701,207 628,066 . .
2009 6,015 1,775,427 611,454 . .
2010 6,001 1,802,904 620,506 . .
2011 5,988 1,822,400 623,005 . .
2012 5,944 1,838,079 624,655 . .
2013 5,941 1,850,010 624,322 . .
2014 5,922 1,861,894 623,875 . .
2015 5,854 1,869,698 621,194 . .
2016 5,792 1,878,495 618,736 . .
1980 1990 2000 2010
PERCENT HS GRADUATE ORHIGHER AGE 25+
U.S. Census Bureau, Decennial Census(- 2000), (2009 -) American CommunitySurvey five-year average ending in yearshown. Please see source for samplingvariability.
Year CountyState ofKansas
NonMetro
KansasCountyRank
Per 1000or $ PerCapita
1980 70.4 73.3 . 47 .
1990 77.8 81.3 . 50 .
2000 87.0 86.0 . 23 .
2009 89.4 89.0 . 40 .
2010 91.2 89.2 . 22 .
2011 92.4 89.5 . 11 .
2012 94.3 89.7 . 6 .
2013 95.2 89.8 . 4 .
2014 96.1 90.0 . 1 .
2015 96.3 90.2 . 1 .
2016 93.8 90.3 . 18 .

Institute for Policy & Social Research, The University of Kansas, Lawrence, KS 66045 (email: [email protected]) 12/21/2017
County: county value. Kansas: state value. County Rank: highest county value ranked #1. ($000): thousands of dollars. Nonmetro Kansas: Kansas total lessMetropolitan Areas as defined by the Office of Management and Budget (OMB; released 2/28/2013). Per 1000: For nonmoney amounts, Per 1000=(countyvalue / county population for the same year as the data) x 1000. $ Per capita=(county value / county population for the same year as the data). Value= . indicatesmissing or suppressed data or value not calculated.
Kansas County Profile Clay County, Kansas Page 11 of 70
Education
1980 1990 2000 2010
PERCENT BACHELORS DEGREE ORHIGHER AGE 25+
U.S. Census Bureau, Decennial Census(- 2000), (2009 -) American CommunitySurvey five-year average ending in yearshown. Please see source for samplingvariability.
Year CountyState ofKansas
NonMetro
KansasCountyRank
Per 1000or $ PerCapita
1980 10.2 17.0 . 79 .
1990 13.3 21.1 . 57 .
2000 16.5 25.8 . 58 .
2009 18.9 28.8 . 56 .
2010 18.9 29.3 . 55 .
2011 17.3 29.7 . 78 .
2012 20.0 30.0 . 46 .
2013 20.7 30.3 . 45 .
2014 22.3 30.7 . 31 .
2015 23.7 31.0 . 29 .
2016 25.0 31.6 . 25 .
2000 2010
PUBLIC SCHOOL ENROLLMENT(FTE) SCHOOL YEAR BEGINNING...
Kansas State Department of Education
Year CountyState ofKansas
NonMetro
KansasCountyRank
Per 1000or $ PerCapita
2000 1,526.0 448,150.8 171,372.6 48 173.0
2001 1,506.7 447,047.1 168,923.6 48 172.6
2002 1,500.2 444,860.3 166,214.9 48 174.3
2003 1,422.8 443,620.6 163,731.2 48 167.5
2004 1,371.3 441,957.2 161,296.7 48 162.3
2005 1,327.2 442,708.4 159,830.5 49 157.2
2006 1,344.5 444,878.7 159,058.4 49 159.0
2007 1,354.7 446,831.3 158,114.1 48 158.9
2008 1,358.4 447,730.0 156,605.8 48 157.6
2009 1,359.3 453,202.5 157,585.3 48 159.9
2010 1,333.2 455,405.0 157,244.1 48 156.2
2011 1,329.1 456,000.5 157,329.8 48 156.1
2012 1,334.7 458,496.4 156,971.7 47 156.9
2013 1,357.6 461,950.0 157,164.3 47 161.6
2014 1,337.4 464,395.4 157,711.1 47 160.4
2015 1,324.5 463,504.0 155,778.7 47 158.8
2016 1,298.9 459,920.3 153,506.2 47 159.5

Institute for Policy & Social Research, The University of Kansas, Lawrence, KS 66045 (email: [email protected]) 12/21/2017
County: county value. Kansas: state value. County Rank: highest county value ranked #1. ($000): thousands of dollars. Nonmetro Kansas: Kansas total lessMetropolitan Areas as defined by the Office of Management and Budget (OMB; released 2/28/2013). Per 1000: For nonmoney amounts, Per 1000=(countyvalue / county population for the same year as the data) x 1000. $ Per capita=(county value / county population for the same year as the data). Value= . indicatesmissing or suppressed data or value not calculated.
Kansas County Profile Clay County, Kansas Page 12 of 70
Education
2000 2010
PUPIL/TEACHER RATIO SCHOOLYEAR BEGINNING...
Kansas State Department of Education
Year CountyState ofKansas
NonMetro
KansasCountyRank
Per 1000or $ PerCapita
2000 13.7 15.4 14.0 46 .
2001 13.4 15.3 13.9 47 .
2002 13.9 15.4 14.0 36 .
2003 13.6 15.5 13.9 40 .
2004 13.5 15.3 13.7 39 .
2005 13.6 15.0 13.5 35 .
2006 13.9 14.7 13.3 28 .
2007 13.7 14.6 13.2 29 .
2008 13.2 14.4 13.0 30 .
2009 13.9 14.8 13.4 29 .
2010 14.8 15.2 13.7 23 .
2011 13.7 15.1 13.6 40 .
2012 13.4 15.1 13.6 40 .
2013 13.6 15.1 13.6 36 .
2014 13.4 15.0 13.7 40 .
2015 13.6 15.2 13.9 41 .
2016 13.6 15.1 13.8 36 .
SocialEnvironment
2006 2010 2014
CHILD CARE FACILITIES: TOTALCHILD CARE FACILITIES
Kansas Department of Health andEnvironment, Bureau of Adult and ChildCare
Year CountyState ofKansas
NonMetro
KansasCountyRank
Per 1000or $ PerCapita
2005 42 8,258 3,421 37 5.0
2006 41 8,442 3,475 39 4.8
2007 46 8,241 3,377 37 5.4
2008 42 8,011 3,202 38 4.9
2009 38 7,853 3,110 42 4.5
2010 39 7,354 2,892 39 4.6
2011 36 6,835 2,670 39 4.2
2012 27 6,346 2,454 44 3.2
2013 26 5,754 2,218 43 3.1
2015 29 5,289 2,180 39 3.5
2006 2010 2014
CHILD CARE FACILITIES:PRESCHOOLS
Kansas Department of Health andEnvironment, Bureau of Adult and ChildCare
Year CountyState ofKansas
NonMetro
KansasCountyRank
Per 1000or $ PerCapita
2005 4 243 138 22 0.5
2006 4 221 125 17 0.5
2007 4 208 117 16 0.5
2008 4 204 112 16 0.5
2009 3 194 105 27 0.4
2010 3 194 109 27 0.4
2011 4 209 121 17 0.5
2012 4 201 120 14 0.5
2013 3 140 83 16 0.4
2015 3 185 114 25 0.4
Institute for Policy & Social Research, The University of Kansas, Lawrence, KS 66045 (email: [email protected]) 12/21/2017
County: county value. Kansas: state value. County Rank: highest county value ranked #1. ($000): thousands of dollars. Nonmetro Kansas: Kansas total lessMetropolitan Areas as defined by the Office of Management and Budget (OMB; released 2/28/2013). Per 1000: For nonmoney amounts, Per 1000=(countyvalue / county population for the same year as the data) x 1000. $ Per capita=(county value / county population for the same year as the data). Value= . indicatesmissing or suppressed data or value not calculated.
Kansas County Profile Clay County, Kansas Page 13 of 70
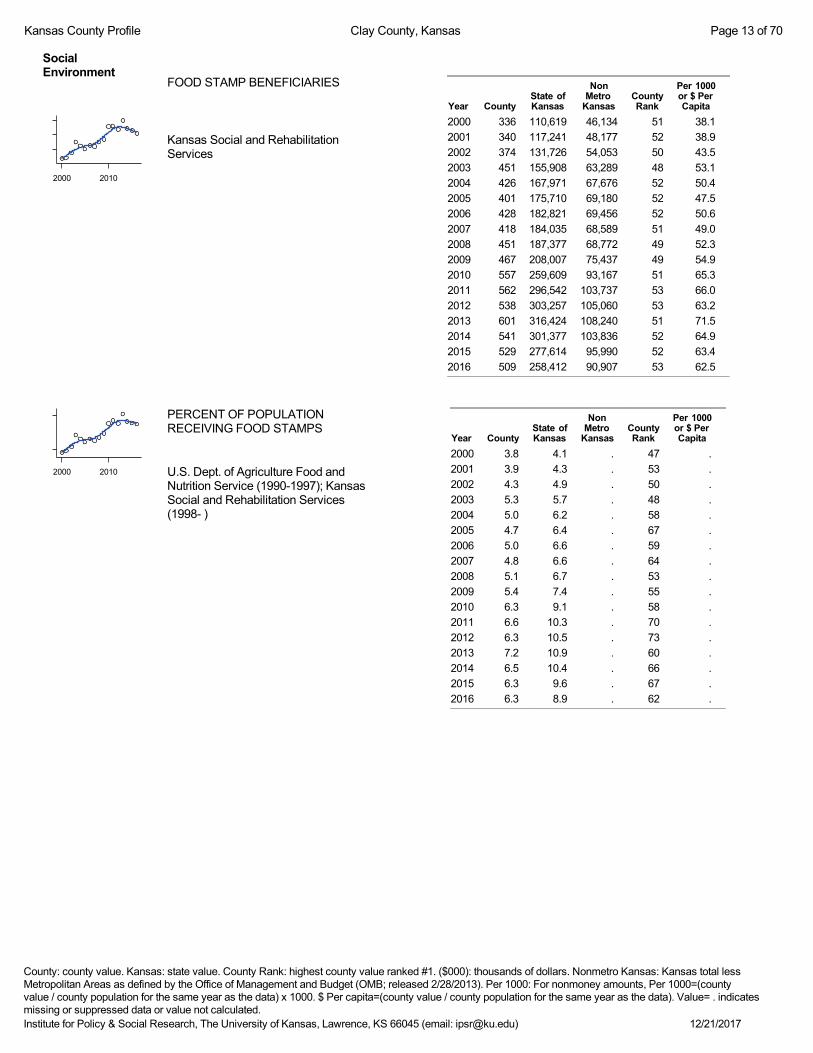
SocialEnvironment
2000 2010
FOOD STAMP BENEFICIARIES
Kansas Social and RehabilitationServices
Year CountyState ofKansas
NonMetro
KansasCountyRank
Per 1000or $ PerCapita
2000 336 110,619 46,134 51 38.1
2001 340 117,241 48,177 52 38.9
2002 374 131,726 54,053 50 43.5
2003 451 155,908 63,289 48 53.1
2004 426 167,971 67,676 52 50.4
2005 401 175,710 69,180 52 47.5
2006 428 182,821 69,456 52 50.6
2007 418 184,035 68,589 51 49.0
2008 451 187,377 68,772 49 52.3
2009 467 208,007 75,437 49 54.9
2010 557 259,609 93,167 51 65.3
2011 562 296,542 103,737 53 66.0
2012 538 303,257 105,060 53 63.2
2013 601 316,424 108,240 51 71.5
2014 541 301,377 103,836 52 64.9
2015 529 277,614 95,990 52 63.4
2016 509 258,412 90,907 53 62.5
2000 2010
PERCENT OF POPULATIONRECEIVING FOOD STAMPS
U.S. Dept. of Agriculture Food andNutrition Service (1990-1997); KansasSocial and Rehabilitation Services(1998- )
Year CountyState ofKansas
NonMetro
KansasCountyRank
Per 1000or $ PerCapita
2000 3.8 4.1 . 47 .
2001 3.9 4.3 . 53 .
2002 4.3 4.9 . 50 .
2003 5.3 5.7 . 48 .
2004 5.0 6.2 . 58 .
2005 4.7 6.4 . 67 .
2006 5.0 6.6 . 59 .
2007 4.8 6.6 . 64 .
2008 5.1 6.7 . 53 .
2009 5.4 7.4 . 55 .
2010 6.3 9.1 . 58 .
2011 6.6 10.3 . 70 .
2012 6.3 10.5 . 73 .
2013 7.2 10.9 . 60 .
2014 6.5 10.4 . 66 .
2015 6.3 9.6 . 67 .
2016 6.3 8.9 . 62 .

Institute for Policy & Social Research, The University of Kansas, Lawrence, KS 66045 (email: [email protected]) 12/21/2017
County: county value. Kansas: state value. County Rank: highest county value ranked #1. ($000): thousands of dollars. Nonmetro Kansas: Kansas total lessMetropolitan Areas as defined by the Office of Management and Budget (OMB; released 2/28/2013). Per 1000: For nonmoney amounts, Per 1000=(countyvalue / county population for the same year as the data) x 1000. $ Per capita=(county value / county population for the same year as the data). Value= . indicatesmissing or suppressed data or value not calculated.
Kansas County Profile Clay County, Kansas Page 14 of 70
SocialEnvironment
2000 2010
ESTIMATED NUMBER OF PEOPLE INPOVERTY
U.S. Census Bureau, Small AreaIncome and Poverty Estimates
Year CountyState ofKansas
NonMetro
KansasCountyRank
Per 1000or $ PerCapita
2000 814 235,087 101,119 50 92.3
2001 875 252,134 108,152 50 100.2
2002 867 265,673 109,391 50 100.7
2003 874 278,163 109,636 49 102.9
2004 896 297,733 113,822 48 106.1
2005 905 310,667 120,984 51 107.2
2006 964 327,102 125,616 49 114.0
2007 801 301,828 113,972 51 93.9
2008 962 307,804 115,439 47 111.6
2009 976 359,692 126,159 48 114.8
2010 970 374,677 134,695 51 113.6
2011 1,028 383,859 139,420 48 120.8
2012 935 392,095 137,670 51 109.9
2013 976 391,718 138,892 49 116.2
2014 887 381,506 134,343 52 106.4
2015 910 366,069 126,517 50 109.1
2016 819 343,773 124,567 54 100.6
2000 2010
ESTIMATED % OF PEOPLE INPOVERTY
U.S. Census Bureau, Small AreaIncome and Poverty Estimates
Year CountyState ofKansas
NonMetro
KansasCountyRank
Per 1000or $ PerCapita
2000 9.5 8.9 . 71 .
2001 10.3 9.5 . 67 .
2002 10.3 10.0 . 71 .
2003 10.3 10.4 . 68 .
2004 10.5 11.1 . 64 .
2005 10.8 11.7 . 76 .
2006 11.4 12.2 . 74 .
2007 9.5 11.2 . 88 .
2008 11.1 11.3 . 62 .
2009 11.5 13.2 . 69 .
2010 11.6 13.5 . 69 .
2011 12.2 13.8 . 66 .
2012 11.2 14.0 . 73 .
2013 11.9 13.9 . 68 .
2014 10.9 13.5 . 83 .
2015 11.1 12.9 . 70 .
2016 10.3 12.2 . 87 .

Institute for Policy & Social Research, The University of Kansas, Lawrence, KS 66045 (email: [email protected]) 12/21/2017
County: county value. Kansas: state value. County Rank: highest county value ranked #1. ($000): thousands of dollars. Nonmetro Kansas: Kansas total lessMetropolitan Areas as defined by the Office of Management and Budget (OMB; released 2/28/2013). Per 1000: For nonmoney amounts, Per 1000=(countyvalue / county population for the same year as the data) x 1000. $ Per capita=(county value / county population for the same year as the data). Value= . indicatesmissing or suppressed data or value not calculated.
Kansas County Profile Clay County, Kansas Page 15 of 70
SocialEnvironment
2000 2010
EST. NUMBER OF RELATEDCHILDREN AGE 5 TO 17 IN FAMILIESIN POVERTY
U.S. Census Bureau, Small AreaIncome and Poverty Estimates
Year CountyState ofKansas
NonMetro
KansasCountyRank
Per 1000or $ PerCapita
2000 192 50,388 22,492 48 21.8
2001 203 53,755 23,775 46 23.3
2002 169 52,453 22,047 51 19.6
2003 178 55,419 22,351 49 21.0
2004 173 59,392 22,864 52 20.5
2005 186 60,203 24,754 51 22.0
2006 205 64,427 25,910 46 24.2
2007 176 61,149 24,225 50 20.6
2008 204 59,842 23,283 42 23.7
2009 216 71,850 26,851 48 25.4
2010 227 81,077 30,633 47 26.6
2011 226 82,311 30,957 47 26.5
2012 223 87,594 31,448 48 26.2
2013 230 84,325 30,757 45 27.4
2014 209 83,873 30,672 50 25.1
2015 216 78,192 28,814 48 25.9
2016 199 67,810 26,003 47 24.4
2000 2010
EST. % OF RELATED CHILDRENAGE 5 TO 17 IN FAMILIES INPOVERTY
U.S. Census Bureau, Small AreaIncome and Poverty Estimates
Year CountyState ofKansas
NonMetro
KansasCountyRank
Per 1000or $ PerCapita
2000 12.0 10.0 . 61 .
2001 13.1 10.8 . 56 .
2002 11.2 10.5 . 63 .
2003 12.3 11.3 . 56 .
2004 12.6 12.5 . 55 .
2005 13.7 12.8 . 58 .
2006 14.9 13.2 . 51 .
2007 13.2 12.6 . 69 .
2008 15.4 12.3 . 40 .
2009 14.7 14.7 . 64 .
2010 16.1 15.9 . 57 .
2011 16.1 16.2 . 55 .
2012 15.9 17.2 . 58 .
2013 16.9 16.5 . 47 .
2014 15.4 16.4 . 64 .
2015 15.7 15.3 . 48 .
2016 14.5 13.2 . 62 .

Institute for Policy & Social Research, The University of Kansas, Lawrence, KS 66045 (email: [email protected]) 12/21/2017
County: county value. Kansas: state value. County Rank: highest county value ranked #1. ($000): thousands of dollars. Nonmetro Kansas: Kansas total lessMetropolitan Areas as defined by the Office of Management and Budget (OMB; released 2/28/2013). Per 1000: For nonmoney amounts, Per 1000=(countyvalue / county population for the same year as the data) x 1000. $ Per capita=(county value / county population for the same year as the data). Value= . indicatesmissing or suppressed data or value not calculated.
Kansas County Profile Clay County, Kansas Page 16 of 70
SocialEnvironment
2000 2010
ESTIMATED NUMBER UNDER 18 INPOVERTY
U.S. Census Bureau, Small AreaIncome and Poverty Estimates
Year CountyState ofKansas
NonMetro
KansasCountyRank
Per 1000or $ PerCapita
2000 289 82,619 35,953 51 32.8
2001 313 87,487 37,913 46 35.9
2002 258 84,181 33,951 50 30.0
2003 282 93,896 37,037 49 33.2
2004 272 98,641 37,311 52 32.2
2005 288 100,254 40,073 51 34.1
2006 311 105,193 41,941 48 36.8
2007 269 100,242 38,947 49 31.5
2008 323 100,146 38,623 43 37.5
2009 338 118,187 43,748 48 39.8
2010 344 129,009 47,784 48 40.3
2011 353 133,478 49,317 47 41.5
2012 329 135,261 48,749 49 38.7
2013 333 131,251 47,405 48 39.6
2014 305 125,562 45,887 50 36.6
2015 329 119,994 43,755 47 39.4
2016 288 100,996 38,861 48 35.4
2000 2010
ESTIMATED PERCENT UNDER 18 INPOVERTY
U.S. Census Bureau, Small AreaIncome and Poverty Estimates
Year CountyState ofKansas
NonMetro
KansasCountyRank
Per 1000or $ PerCapita
2000 13.9 11.9 . 63 .
2001 15.6 12.7 . 51 .
2002 13.1 12.1 . 57 .
2003 14.7 13.8 . 53 .
2004 15.0 14.6 . 53 .
2005 16.2 15.2 . 59 .
2006 17.1 15.4 . 52 .
2007 14.7 14.7 . 76 .
2008 17.3 14.6 . 47 .
2009 16.6 17.1 . 66 .
2010 17.3 18.1 . 63 .
2011 18.0 18.8 . 58 .
2012 16.7 19.0 . 66 .
2013 17.4 18.4 . 60 .
2014 16.1 17.6 . 66 .
2015 16.9 16.9 . 56 .
2016 15.2 14.3 . 67 .

Institute for Policy & Social Research, The University of Kansas, Lawrence, KS 66045 (email: [email protected]) 12/21/2017
County: county value. Kansas: state value. County Rank: highest county value ranked #1. ($000): thousands of dollars. Nonmetro Kansas: Kansas total lessMetropolitan Areas as defined by the Office of Management and Budget (OMB; released 2/28/2013). Per 1000: For nonmoney amounts, Per 1000=(countyvalue / county population for the same year as the data) x 1000. $ Per capita=(county value / county population for the same year as the data). Value= . indicatesmissing or suppressed data or value not calculated.
Kansas County Profile Clay County, Kansas Page 17 of 70
Business
1990 2000 2010
ESTABLISHMENTS TOTAL COUNTYBUSINESS PATTERNS
U.S. Census Bureau, County BusinessPatterns
Year CountyState ofKansas
NonMetro
KansasCountyRank
Per 1000or $ PerCapita
1990 249 65,858 27,195 48 27.2
1991 254 65,941 27,141 47 28.1
1992 268 67,630 27,632 45 29.1
1993 281 68,930 28,051 43 30.7
1994 288 69,822 28,143 44 31.6
1995 286 70,894 28,487 44 31.2
1996 300 72,017 28,720 43 32.7
1997 303 73,924 29,262 43 33.6
1998 304 74,019 29,104 43 34.1
1999 296 74,486 28,897 43 33.5
2000 285 74,939 28,844 45 32.3
2001 289 74,565 28,646 43 33.1
2002 285 75,077 28,460 43 33.1
2003 282 74,972 28,279 44 33.2
2004 297 75,827 28,311 42 35.2
2005 288 76,173 28,140 42 34.1
2006 294 76,446 27,987 41 34.8
2007 306 77,157 28,114 41 35.9
2008 291 76,096 27,691 41 33.8
2009 280 74,698 27,220 42 32.9
2010 276 74,301 27,117 43 32.3
2011 265 73,598 26,944 44 31.1
2012 263 73,944 26,909 44 30.9
2013 264 73,816 26,759 45 31.4
2014 260 74,055 26,655 45 31.2
2015 263 74,526 26,704 43 31.5
2000.0 2007.5 2015.0
ESTABLISHMENTS: 1-19EMPLOYEES
U.S. Census Bureau, County BusinessPatterns
Year CountyState ofKansas
NonMetro
KansasCountyRank
Per 1000or $ PerCapita
2000 248 64,527 25,688 47 28.1
2001 258 64,176 25,552 44 29.6
2002 255 64,886 25,440 45 29.6
2003 253 64,714 25,250 45 29.8
2004 270 65,554 25,241 42 32.0
2005 259 65,796 25,098 43 30.7
2006 266 65,764 24,867 43 31.4
2007 278 66,446 25,020 41 32.6
2008 268 65,322 24,574 41 31.1
2009 254 64,128 24,173 42 29.9
2010 248 64,015 24,175 45 29.1
2011 237 63,251 23,905 46 27.8
2012 236 63,519 23,884 46 27.7
2013 237 63,197 23,698 45 28.2
2014 233 63,113 23,533 45 27.9
2015 238 63,280 23,516 43 28.5

Institute for Policy & Social Research, The University of Kansas, Lawrence, KS 66045 (email: [email protected]) 12/21/2017
County: county value. Kansas: state value. County Rank: highest county value ranked #1. ($000): thousands of dollars. Nonmetro Kansas: Kansas total lessMetropolitan Areas as defined by the Office of Management and Budget (OMB; released 2/28/2013). Per 1000: For nonmoney amounts, Per 1000=(countyvalue / county population for the same year as the data) x 1000. $ Per capita=(county value / county population for the same year as the data). Value= . indicatesmissing or suppressed data or value not calculated.
Kansas County Profile Clay County, Kansas Page 18 of 70
Business
2000.0 2007.5 2015.0
ESTABLISHMENTS: 20-99EMPLOYEES
U.S. Census Bureau, County BusinessPatterns
Year CountyState ofKansas
NonMetro
KansasCountyRank
Per 1000or $ PerCapita
2000 33 8,714 2,704 35 3.7
2001 27 8,692 2,642 40 3.1
2002 26 8,582 2,597 41 3.0
2003 26 8,642 2,616 40 3.1
2004 24 8,658 2,641 42 2.8
2005 26 8,685 2,600 39 3.1
2006 24 8,922 2,664 43 2.8
2007 26 8,938 2,624 40 3.0
2008 20 8,939 2,637 51 2.3
2009 23 8,848 2,602 43 2.7
2010 26 8,612 2,508 41 3.0
2011 26 8,668 2,588 41 3.1
2012 25 8,700 2,561 40 2.9
2013 25 8,870 2,598 41 3.0
2014 25 9,121 2,641 41 3.0
2015 23 9,374 2,716 43 2.8
2000.0 2007.5 2015.0
ESTABLISHMENTS: 100-499EMPLOYEES
U.S. Census Bureau, County BusinessPatterns
Year CountyState ofKansas
NonMetro
KansasCountyRank
Per 1000or $ PerCapita
2000 4 1,555 419 40 0.5
2001 4 1,555 416 40 0.5
2002 4 1,464 388 39 0.5
2003 3 1,470 381 46 0.4
2004 3 1,463 393 47 0.4
2005 3 1,537 404 46 0.4
2006 4 1,598 411 42 0.5
2007 2 1,602 424 63 0.2
2008 3 1,653 429 48 0.3
2009 3 1,551 401 48 0.4
2010 2 1,513 387 58 0.2
2011 2 1,523 401 58 0.2
2012 2 1,567 413 56 0.2
2013 2 1,581 412 59 0.2
2014 2 1,641 427 62 0.2
2015 2 1,693 420 61 0.2

Institute for Policy & Social Research, The University of Kansas, Lawrence, KS 66045 (email: [email protected]) 12/21/2017
County: county value. Kansas: state value. County Rank: highest county value ranked #1. ($000): thousands of dollars. Nonmetro Kansas: Kansas total lessMetropolitan Areas as defined by the Office of Management and Budget (OMB; released 2/28/2013). Per 1000: For nonmoney amounts, Per 1000=(countyvalue / county population for the same year as the data) x 1000. $ Per capita=(county value / county population for the same year as the data). Value= . indicatesmissing or suppressed data or value not calculated.
Kansas County Profile Clay County, Kansas Page 19 of 70
Business
2000.0 2007.5 2015.0
ESTABLISHMENTS: 500 OR MOREEMPLOYEES
U.S. Census Bureau, County BusinessPatterns
Year CountyState ofKansas
NonMetro
KansasCountyRank
Per 1000or $ PerCapita
2000 0 143 33 105 0.0
2001 0 142 36 105 0.0
2002 0 145 35 105 0.0
2003 0 146 32 105 0.0
2004 0 152 36 105 0.0
2005 0 155 38 105 0.0
2006 0 162 45 105 0.0
2007 0 171 46 105 0.0
2008 0 182 51 105 0.0
2009 0 171 44 105 0.0
2010 0 161 47 105 0.0
2011 0 156 50 105 0.0
2012 0 158 51 105 0.0
2013 0 168 51 105 0.0
2014 0 180 54 105 0.0
2015 0 179 52 105 0.0
2000.0 2007.5 2015.0
ESTABLISHMENTS: FORESTRY,FISHING, HUNTING, AND AGSUPPORT
U.S. Census Bureau, County BusinessPatterns
Year CountyState ofKansas
NonMetro
KansasCountyRank
Per 1000or $ PerCapita
2000 0 190 148 105 0.0
2001 2 217 168 48 0.2
2002 1 224 174 84 0.1
2003 1 217 172 84 0.1
2004 1 211 163 77 0.1
2005 1 188 146 76 0.1
2006 1 193 155 76 0.1
2007 1 212 167 78 0.1
2008 1 197 155 81 0.1
2009 1 191 152 79 0.1
2010 1 192 158 79 0.1
2011 1 193 155 77 0.1
2012 2 204 161 50 0.2
2013 2 208 163 54 0.2
2014 1 194 150 83 0.1
2015 1 192 148 81 0.1

Institute for Policy & Social Research, The University of Kansas, Lawrence, KS 66045 (email: [email protected]) 12/21/2017
County: county value. Kansas: state value. County Rank: highest county value ranked #1. ($000): thousands of dollars. Nonmetro Kansas: Kansas total lessMetropolitan Areas as defined by the Office of Management and Budget (OMB; released 2/28/2013). Per 1000: For nonmoney amounts, Per 1000=(countyvalue / county population for the same year as the data) x 1000. $ Per capita=(county value / county population for the same year as the data). Value= . indicatesmissing or suppressed data or value not calculated.
Kansas County Profile Clay County, Kansas Page 20 of 70
Business
2000.0 2007.5 2015.0
ESTABLISHMENTS: MINING
U.S. Census Bureau, County BusinessPatterns
Year CountyState ofKansas
NonMetro
KansasCountyRank
Per 1000or $ PerCapita
2000 1 868 609 88 0.1
2001 1 878 613 88 0.1
2002 1 847 606 89 0.1
2003 2 864 627 66 0.2
2004 2 880 638 67 0.2
2005 1 941 687 88 0.1
2006 0 991 723 105 0.0
2007 0 1,000 746 105 0.0
2008 0 1,047 785 105 0.0
2009 0 1,016 759 105 0.0
2010 0 1,009 750 105 0.0
2011 0 1,013 748 105 0.0
2012 0 1,048 772 105 0.0
2013 0 1,060 784 105 0.0
2014 0 1,102 808 105 0.0
2015 0 1,069 791 105 0.0
2000.0 2007.5 2015.0
ESTABLISHMENTS: UTILITIES
U.S. Census Bureau, County BusinessPatterns
Year CountyState ofKansas
NonMetro
KansasCountyRank
Per 1000or $ PerCapita
2000 3 274 195 37 0.3
2001 4 290 207 27 0.5
2002 4 278 199 25 0.5
2003 3 268 184 36 0.4
2004 3 247 168 32 0.4
2005 3 254 175 34 0.4
2006 3 248 172 32 0.4
2007 3 222 160 33 0.4
2008 2 244 169 61 0.2
2009 2 222 155 57 0.2
2010 2 197 130 49 0.2
2011 2 230 158 57 0.2
2012 2 232 158 57 0.2
2013 2 234 161 58 0.2
2014 2 232 162 58 0.2
2015 2 237 167 59 0.2

Institute for Policy & Social Research, The University of Kansas, Lawrence, KS 66045 (email: [email protected]) 12/21/2017
County: county value. Kansas: state value. County Rank: highest county value ranked #1. ($000): thousands of dollars. Nonmetro Kansas: Kansas total lessMetropolitan Areas as defined by the Office of Management and Budget (OMB; released 2/28/2013). Per 1000: For nonmoney amounts, Per 1000=(countyvalue / county population for the same year as the data) x 1000. $ Per capita=(county value / county population for the same year as the data). Value= . indicatesmissing or suppressed data or value not calculated.
Kansas County Profile Clay County, Kansas Page 21 of 70
Business
2000.0 2007.5 2015.0
ESTABLISHMENTS: CONSTRUCTION
U.S. Census Bureau, County BusinessPatterns
Year CountyState ofKansas
NonMetro
KansasCountyRank
Per 1000or $ PerCapita
2000 37 7,703 2,643 32 4.2
2001 39 7,449 2,548 30 4.5
2002 33 7,519 2,486 40 3.8
2003 30 7,722 2,535 43 3.5
2004 37 7,887 2,531 35 4.4
2005 38 8,032 2,534 32 4.5
2006 41 8,031 2,519 32 4.8
2007 48 8,057 2,578 29 5.6
2008 41 7,831 2,553 33 4.8
2009 39 7,342 2,480 33 4.6
2010 38 7,064 2,417 32 4.5
2011 32 6,774 2,377 39 3.8
2012 31 6,741 2,403 38 3.6
2013 31 6,802 2,403 40 3.7
2014 29 6,920 2,394 40 3.5
2015 32 7,014 2,382 34 3.8
2000.0 2007.5 2015.0
ESTABLISHMENTS:MANUFACTURING
U.S. Census Bureau, County BusinessPatterns
Year CountyState ofKansas
NonMetro
KansasCountyRank
Per 1000or $ PerCapita
2000 15 3,229 1,314 38 1.7
2001 16 3,240 1,322 38 1.8
2002 17 3,181 1,290 37 2.0
2003 18 3,159 1,291 36 2.1
2004 17 3,179 1,313 37 2.0
2005 19 3,128 1,276 36 2.3
2006 18 3,165 1,288 37 2.1
2007 18 3,184 1,316 38 2.1
2008 16 3,171 1,294 38 1.9
2009 15 3,026 1,240 39 1.8
2010 13 2,955 1,221 41 1.5
2011 11 2,877 1,193 44 1.3
2012 11 2,889 1,195 43 1.3
2013 11 2,836 1,163 44 1.3
2014 11 2,831 1,165 44 1.3
2015 11 2,817 1,159 46 1.3

Institute for Policy & Social Research, The University of Kansas, Lawrence, KS 66045 (email: [email protected]) 12/21/2017
County: county value. Kansas: state value. County Rank: highest county value ranked #1. ($000): thousands of dollars. Nonmetro Kansas: Kansas total lessMetropolitan Areas as defined by the Office of Management and Budget (OMB; released 2/28/2013). Per 1000: For nonmoney amounts, Per 1000=(countyvalue / county population for the same year as the data) x 1000. $ Per capita=(county value / county population for the same year as the data). Value= . indicatesmissing or suppressed data or value not calculated.
Kansas County Profile Clay County, Kansas Page 22 of 70
Business
2000.0 2007.5 2015.0
ESTABLISHMENTS: WHOLESALETRADE
U.S. Census Bureau, County BusinessPatterns
Year CountyState ofKansas
NonMetro
KansasCountyRank
Per 1000or $ PerCapita
2000 15 4,876 1,781 57 1.7
2001 14 4,811 1,775 58 1.6
2002 15 4,719 1,743 58 1.7
2003 13 4,590 1,626 61 1.5
2004 14 4,553 1,627 57 1.7
2005 11 4,541 1,613 72 1.3
2006 12 4,517 1,591 58 1.4
2007 14 4,555 1,619 55 1.6
2008 16 4,501 1,611 48 1.9
2009 15 4,437 1,603 51 1.8
2010 15 4,432 1,598 50 1.8
2011 14 4,400 1,647 56 1.6
2012 15 4,563 1,740 58 1.8
2013 15 4,501 1,726 54 1.8
2014 16 4,497 1,733 49 1.9
2015 17 4,459 1,740 48 2.0
2000.0 2007.5 2015.0
ESTABLISHMENTS: RETAIL TRADE
U.S. Census Bureau, County BusinessPatterns
Year CountyState ofKansas
NonMetro
KansasCountyRank
Per 1000or $ PerCapita
2000 54 12,261 5,305 45 6.1
2001 53 12,206 5,273 45 6.1
2002 47 11,980 5,148 48 5.5
2003 44 11,834 5,115 47 5.2
2004 46 11,748 5,036 45 5.4
2005 48 11,562 4,903 46 5.7
2006 46 11,367 4,770 45 5.4
2007 45 11,306 4,718 46 5.3
2008 40 10,978 4,556 50 4.6
2009 37 10,760 4,436 53 4.4
2010 37 10,727 4,410 52 4.3
2011 36 10,655 4,359 54 4.2
2012 39 10,585 4,272 48 4.6
2013 41 10,433 4,212 44 4.9
2014 39 10,391 4,139 46 4.7
2015 40 10,327 4,130 45 4.8

Institute for Policy & Social Research, The University of Kansas, Lawrence, KS 66045 (email: [email protected]) 12/21/2017
County: county value. Kansas: state value. County Rank: highest county value ranked #1. ($000): thousands of dollars. Nonmetro Kansas: Kansas total lessMetropolitan Areas as defined by the Office of Management and Budget (OMB; released 2/28/2013). Per 1000: For nonmoney amounts, Per 1000=(countyvalue / county population for the same year as the data) x 1000. $ Per capita=(county value / county population for the same year as the data). Value= . indicatesmissing or suppressed data or value not calculated.
Kansas County Profile Clay County, Kansas Page 23 of 70
Business
2000.0 2007.5 2015.0
ESTABLISHMENTS:TRANSPORTATION &WAREHOUSING
U.S. Census Bureau, County BusinessPatterns
Year CountyState ofKansas
NonMetro
KansasCountyRank
Per 1000or $ PerCapita
2000 18 2,474 1,298 37 2.0
2001 18 2,463 1,303 32 2.1
2002 16 2,461 1,290 40 1.9
2003 18 2,576 1,310 33 2.1
2004 21 2,651 1,340 28 2.5
2005 18 2,632 1,345 34 2.1
2006 17 2,626 1,321 38 2.0
2007 19 2,664 1,334 38 2.2
2008 24 2,675 1,353 29 2.8
2009 21 2,635 1,336 30 2.5
2010 21 2,615 1,335 31 2.5
2011 20 2,579 1,308 34 2.3
2012 20 2,519 1,271 32 2.4
2013 20 2,492 1,252 32 2.4
2014 17 2,518 1,261 37 2.0
2015 21 2,554 1,278 29 2.5
2000.0 2007.5 2015.0
ESTABLISHMENTS: INFORMATION
U.S. Census Bureau, County BusinessPatterns
Year CountyState ofKansas
NonMetro
KansasCountyRank
Per 1000or $ PerCapita
2000 6 1,542 587 58 0.7
2001 7 1,556 572 49 0.8
2002 5 1,517 555 59 0.6
2003 5 1,516 566 58 0.6
2004 6 1,518 560 52 0.7
2005 6 1,519 542 46 0.7
2006 6 1,549 563 50 0.7
2007 5 1,504 533 52 0.6
2008 5 1,468 527 51 0.6
2009 5 1,420 515 50 0.6
2010 4 1,437 534 61 0.5
2011 5 1,428 546 53 0.6
2012 4 1,387 522 61 0.5
2013 4 1,337 494 61 0.5
2014 4 1,335 504 61 0.5
2015 4 1,359 519 61 0.5

Institute for Policy & Social Research, The University of Kansas, Lawrence, KS 66045 (email: [email protected]) 12/21/2017
County: county value. Kansas: state value. County Rank: highest county value ranked #1. ($000): thousands of dollars. Nonmetro Kansas: Kansas total lessMetropolitan Areas as defined by the Office of Management and Budget (OMB; released 2/28/2013). Per 1000: For nonmoney amounts, Per 1000=(countyvalue / county population for the same year as the data) x 1000. $ Per capita=(county value / county population for the same year as the data). Value= . indicatesmissing or suppressed data or value not calculated.
Kansas County Profile Clay County, Kansas Page 24 of 70
Business
2000.0 2007.5 2015.0
ESTABLISHMENTS:FINANCE & INSURANCE
U.S. Census Bureau, County BusinessPatterns
Year CountyState ofKansas
NonMetro
KansasCountyRank
Per 1000or $ PerCapita
2000 21 5,209 1,871 46 2.4
2001 21 5,178 1,848 43 2.4
2002 25 5,496 1,929 38 2.9
2003 24 5,569 1,926 39 2.8
2004 24 5,572 1,932 36 2.8
2005 24 5,708 1,983 36 2.8
2006 24 5,877 2,000 37 2.8
2007 28 6,017 2,062 34 3.3
2008 28 6,010 2,059 33 3.2
2009 26 5,933 2,026 34 3.1
2010 26 5,872 2,009 35 3.0
2011 24 5,854 2,018 38 2.8
2012 22 5,993 2,056 43 2.6
2013 23 5,903 2,021 39 2.7
2014 22 5,894 2,025 43 2.6
2015 23 5,932 2,022 39 2.8
2000.0 2007.5 2015.0
ESTABLISHMENTS: REAL ESTATE,RENTAL, AND LEASING
U.S. Census Bureau, County BusinessPatterns
Year CountyState ofKansas
NonMetro
KansasCountyRank
Per 1000or $ PerCapita
2000 6 2,733 715 46 0.7
2001 7 2,849 748 45 0.8
2002 6 2,952 753 45 0.7
2003 4 3,007 745 56 0.5
2004 4 3,108 730 56 0.5
2005 3 3,203 743 61 0.4
2006 3 3,268 764 62 0.4
2007 3 3,286 754 60 0.4
2008 3 3,239 770 61 0.3
2009 3 3,122 754 58 0.4
2010 2 3,050 737 75 0.2
2011 3 3,002 723 58 0.4
2012 3 2,981 723 63 0.4
2013 2 3,046 752 76 0.2
2014 3 3,135 775 65 0.4
2015 3 3,179 784 65 0.4

Institute for Policy & Social Research, The University of Kansas, Lawrence, KS 66045 (email: [email protected]) 12/21/2017
County: county value. Kansas: state value. County Rank: highest county value ranked #1. ($000): thousands of dollars. Nonmetro Kansas: Kansas total lessMetropolitan Areas as defined by the Office of Management and Budget (OMB; released 2/28/2013). Per 1000: For nonmoney amounts, Per 1000=(countyvalue / county population for the same year as the data) x 1000. $ Per capita=(county value / county population for the same year as the data). Value= . indicatesmissing or suppressed data or value not calculated.
Kansas County Profile Clay County, Kansas Page 25 of 70
Business
2000.0 2007.5 2015.0
ESTABLISHMENTS:PROFESSIONAL, SCIENTIFIC, ANDTECHNICAL SERVICES
U.S. Census Bureau, County BusinessPatterns
Year CountyState ofKansas
NonMetro
KansasCountyRank
Per 1000or $ PerCapita
2000 17 6,424 1,716 44 1.9
2001 14 6,492 1,694 55 1.6
2002 18 6,719 1,716 43 2.1
2003 20 6,793 1,748 39 2.4
2004 20 7,025 1,742 39 2.4
2005 15 7,087 1,729 55 1.8
2006 15 7,231 1,760 55 1.8
2007 15 7,329 1,761 54 1.8
2008 14 7,133 1,702 55 1.6
2009 16 7,122 1,719 46 1.9
2010 14 7,172 1,719 51 1.6
2011 15 7,115 1,706 50 1.8
2012 15 7,122 1,707 48 1.8
2013 15 7,129 1,727 50 1.8
2014 15 7,206 1,715 51 1.8
2015 16 7,184 1,710 47 1.9
2000.0 2007.5 2015.0
ESTABLISHMENTS: MANAGEMENTOF COMPANIES AND ENTERPRISES
U.S. Census Bureau, County BusinessPatterns
Year CountyState ofKansas
NonMetro
KansasCountyRank
Per 1000or $ PerCapita
2000 1 622 154 68 0.1
2001 2 593 150 38 0.2
2002 2 597 153 41 0.2
2003 1 561 135 59 0.1
2004 1 569 150 57 0.1
2005 1 543 144 56 0.1
2006 1 542 137 57 0.1
2007 1 550 140 60 0.1
2008 0 553 150 105 0.0
2009 0 575 149 105 0.0
2010 0 567 144 105 0.0
2011 0 552 147 105 0.0
2012 0 593 147 105 0.0
2013 0 590 147 105 0.0
2014 0 603 149 105 0.0
2015 0 613 154 105 0.0

Institute for Policy & Social Research, The University of Kansas, Lawrence, KS 66045 (email: [email protected]) 12/21/2017
County: county value. Kansas: state value. County Rank: highest county value ranked #1. ($000): thousands of dollars. Nonmetro Kansas: Kansas total lessMetropolitan Areas as defined by the Office of Management and Budget (OMB; released 2/28/2013). Per 1000: For nonmoney amounts, Per 1000=(countyvalue / county population for the same year as the data) x 1000. $ Per capita=(county value / county population for the same year as the data). Value= . indicatesmissing or suppressed data or value not calculated.
Kansas County Profile Clay County, Kansas Page 26 of 70
Business
2000.0 2007.5 2015.0
ESTABLISHMENTS: ADMIN,SUPPORT, WASTE MGMT., ANDREMEDIATION
U.S. Census Bureau, County BusinessPatterns
Year CountyState ofKansas
NonMetro
KansasCountyRank
Per 1000or $ PerCapita
2000 7 3,307 903 49 0.8
2001 5 3,421 947 64 0.6
2002 7 3,232 902 53 0.8
2003 6 3,189 877 54 0.7
2004 6 3,301 907 53 0.7
2005 6 3,342 911 53 0.7
2006 6 3,395 909 54 0.7
2007 8 3,522 948 45 0.9
2008 9 3,587 966 41 1.0
2009 7 3,505 927 47 0.8
2010 7 3,494 926 51 0.8
2011 8 3,447 933 42 0.9
2012 9 3,462 925 38 1.1
2013 8 3,489 930 42 1.0
2014 9 3,569 964 40 1.1
2015 9 3,630 992 40 1.1
2000.0 2007.5 2015.0
ESTABLISHMENTS: EDUCATIONALSERVICES
U.S. Census Bureau, County BusinessPatterns
Year CountyState ofKansas
NonMetro
KansasCountyRank
Per 1000or $ PerCapita
2000 1 604 157 70 0.1
2001 1 625 171 71 0.1
2002 0 666 168 105 0.0
2003 0 663 175 105 0.0
2004 0 690 175 105 0.0
2005 1 699 171 69 0.1
2006 0 698 178 105 0.0
2007 0 691 168 105 0.0
2008 0 692 160 105 0.0
2009 0 690 153 105 0.0
2010 0 700 151 105 0.0
2011 0 711 152 105 0.0
2012 1 724 148 67 0.1
2013 1 735 156 68 0.1
2014 1 722 155 66 0.1
2015 1 754 155 66 0.1
Institute for Policy & Social Research, The University of Kansas, Lawrence, KS 66045 (email: [email protected]) 12/21/2017
County: county value. Kansas: state value. County Rank: highest county value ranked #1. ($000): thousands of dollars. Nonmetro Kansas: Kansas total lessMetropolitan Areas as defined by the Office of Management and Budget (OMB; released 2/28/2013). Per 1000: For nonmoney amounts, Per 1000=(countyvalue / county population for the same year as the data) x 1000. $ Per capita=(county value / county population for the same year as the data). Value= . indicatesmissing or suppressed data or value not calculated.
Kansas County Profile Clay County, Kansas Page 27 of 70
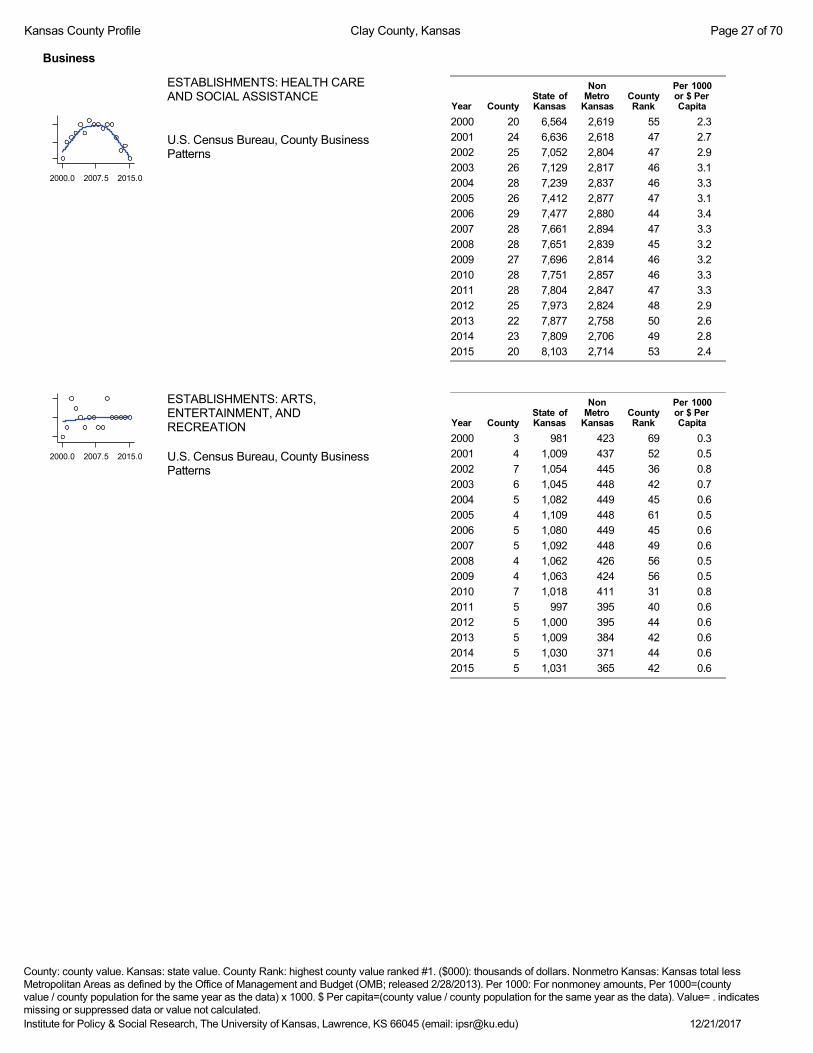
Business
2000.0 2007.5 2015.0
ESTABLISHMENTS: HEALTH CAREAND SOCIAL ASSISTANCE
U.S. Census Bureau, County BusinessPatterns
Year CountyState ofKansas
NonMetro
KansasCountyRank
Per 1000or $ PerCapita
2000 20 6,564 2,619 55 2.3
2001 24 6,636 2,618 47 2.7
2002 25 7,052 2,804 47 2.9
2003 26 7,129 2,817 46 3.1
2004 28 7,239 2,837 46 3.3
2005 26 7,412 2,877 47 3.1
2006 29 7,477 2,880 44 3.4
2007 28 7,661 2,894 47 3.3
2008 28 7,651 2,839 45 3.2
2009 27 7,696 2,814 46 3.2
2010 28 7,751 2,857 46 3.3
2011 28 7,804 2,847 47 3.3
2012 25 7,973 2,824 48 2.9
2013 22 7,877 2,758 50 2.6
2014 23 7,809 2,706 49 2.8
2015 20 8,103 2,714 53 2.4
2000.0 2007.5 2015.0
ESTABLISHMENTS: ARTS,ENTERTAINMENT, ANDRECREATION
U.S. Census Bureau, County BusinessPatterns
Year CountyState ofKansas
NonMetro
KansasCountyRank
Per 1000or $ PerCapita
2000 3 981 423 69 0.3
2001 4 1,009 437 52 0.5
2002 7 1,054 445 36 0.8
2003 6 1,045 448 42 0.7
2004 5 1,082 449 45 0.6
2005 4 1,109 448 61 0.5
2006 5 1,080 449 45 0.6
2007 5 1,092 448 49 0.6
2008 4 1,062 426 56 0.5
2009 4 1,063 424 56 0.5
2010 7 1,018 411 31 0.8
2011 5 997 395 40 0.6
2012 5 1,000 395 44 0.6
2013 5 1,009 384 42 0.6
2014 5 1,030 371 44 0.6
2015 5 1,031 365 42 0.6

Institute for Policy & Social Research, The University of Kansas, Lawrence, KS 66045 (email: [email protected]) 12/21/2017
County: county value. Kansas: state value. County Rank: highest county value ranked #1. ($000): thousands of dollars. Nonmetro Kansas: Kansas total lessMetropolitan Areas as defined by the Office of Management and Budget (OMB; released 2/28/2013). Per 1000: For nonmoney amounts, Per 1000=(countyvalue / county population for the same year as the data) x 1000. $ Per capita=(county value / county population for the same year as the data). Value= . indicatesmissing or suppressed data or value not calculated.
Kansas County Profile Clay County, Kansas Page 28 of 70
Business
2000.0 2007.5 2015.0
ESTABLISHMENTS:ACCOMMODATION AND FOODSERVICES
U.S. Census Bureau, County BusinessPatterns
Year CountyState ofKansas
NonMetro
KansasCountyRank
Per 1000or $ PerCapita
2000 17 5,536 2,259 57 1.9
2001 17 5,551 2,222 56 1.9
2002 17 5,610 2,229 54 2.0
2003 19 5,635 2,241 51 2.2
2004 18 5,681 2,214 52 2.1
2005 20 5,776 2,224 44 2.4
2006 23 5,745 2,186 40 2.7
2007 19 5,877 2,155 46 2.2
2008 16 5,843 2,114 54 1.9
2009 18 5,794 2,093 51 2.1
2010 17 5,898 2,108 52 2.0
2011 19 5,958 2,131 48 2.2
2012 18 5,951 2,116 51 2.1
2013 22 6,061 2,142 44 2.6
2014 19 5,985 2,099 47 2.3
2015 15 6,034 2,126 56 1.8
2000.0 2007.5 2015.0
ESTABLISHMENTS: OTHERSERVICES
U.S. Census Bureau, County BusinessPatterns
Year CountyState ofKansas
NonMetro
KansasCountyRank
Per 1000or $ PerCapita
2000 41 8,423 3,700 43 4.6
2001 37 8,310 3,672 48 4.2
2002 39 8,552 3,706 45 4.5
2003 41 8,411 3,651 42 4.8
2004 41 8,343 3,644 42 4.9
2005 42 8,321 3,616 41 5.0
2006 42 8,225 3,534 41 5.0
2007 46 8,355 3,584 40 5.4
2008 44 8,104 3,450 39 5.1
2009 44 8,040 3,452 38 5.2
2010 44 7,998 3,428 36 5.2
2011 42 7,883 3,342 39 4.9
2012 41 7,913 3,349 40 4.8
2013 40 7,947 3,344 41 4.8
2014 43 7,943 3,330 41 5.2
2015 42 7,869 3,308 40 5.0

Institute for Policy & Social Research, The University of Kansas, Lawrence, KS 66045 (email: [email protected]) 12/21/2017
County: county value. Kansas: state value. County Rank: highest county value ranked #1. ($000): thousands of dollars. Nonmetro Kansas: Kansas total lessMetropolitan Areas as defined by the Office of Management and Budget (OMB; released 2/28/2013). Per 1000: For nonmoney amounts, Per 1000=(countyvalue / county population for the same year as the data) x 1000. $ Per capita=(county value / county population for the same year as the data). Value= . indicatesmissing or suppressed data or value not calculated.
Kansas County Profile Clay County, Kansas Page 29 of 70
Business
1990 2000 2010
TOTAL ANNUAL PAYROLL ($000)COUNTY BUSINESS PATTERNS
U.S. Census Bureau, County BusinessPatterns
Year CountyState ofKansas
NonMetro
KansasCountyRank
Per 1000or $ PerCapita
1990 23,060 17,487,316 4,503,687 53 2,518.0
1991 23,502 18,162,326 4,675,388 55 2,599.8
1992 25,476 19,244,346 4,958,980 56 2,762.5
1993 30,761 20,087,190 5,264,730 50 3,363.0
1994 32,162 21,201,652 5,625,804 49 3,524.6
1995 34,899 22,825,920 5,960,882 49 3,811.6
1996 39,485 24,613,884 6,292,593 49 4,308.7
1997 43,508 26,787,098 6,698,110 45 4,831.5
1998 43,731 28,747,576 6,972,782 49 4,910.8
1999 44,848 30,600,434 7,227,524 49 5,079.6
2000 46,238 31,990,762 7,644,608 50 5,241.2
2001 50,770 33,303,992 7,726,358 48 5,815.6
2002 48,246 33,152,962 7,641,537 48 5,605.4
2003 46,168 34,040,944 7,801,877 49 5,436.0
2004 48,536 35,725,812 8,401,594 49 5,745.9
2005 52,420 36,646,064 8,689,983 49 6,208.0
2006 55,651 39,251,388 9,298,540 48 6,579.7
2007 59,127 42,022,753 . 49 6,934.1
2008 63,312 43,984,689 . 47 7,346.5
2009 63,375 42,146,866 . 47 7,455.9
2010 65,626 42,686,303 10,452,586 47 7,689.0
2011 70,594 43,733,944 . 46 8,292.5
2012 70,335 45,608,072 11,384,354 46 8,266.9
2013 69,506 47,715,601 11,622,361 47 8,273.5
2014 72,764 49,712,832 12,135,725 47 8,726.8
2015 73,695 51,259,676 12,164,775 49 8,836.3
2000.0 2007.5 2015.0
TOTAL ANNUAL PAYROLL($000):FORESTRY, FISHING, HUNTING, ANDAG SUPPORT
U.S. Census Bureau, County BusinessPatterns
Year CountyState ofKansas
NonMetro
KansasCountyRank
Per 1000or $ PerCapita
2000 0 13,551 . . 0.0
2001 . . . . .
2002 . 16,528 . . .
2003 . 17,247 . . .
2004 . 17,552 . . .
2005 . 16,298 . . .
2006 . 17,908 . . .
2007 . 22,199 . . .
2008 . 21,359 . . .
2009 . 22,466 . . .
2010 . 22,753 . . .
2011 . 23,320 . . .
2012 . 27,492 . . .
2013 . 30,360 . . .
2014 . 34,862 . . .
2015 . 35,980 . . .

Institute for Policy & Social Research, The University of Kansas, Lawrence, KS 66045 (email: [email protected]) 12/21/2017
County: county value. Kansas: state value. County Rank: highest county value ranked #1. ($000): thousands of dollars. Nonmetro Kansas: Kansas total lessMetropolitan Areas as defined by the Office of Management and Budget (OMB; released 2/28/2013). Per 1000: For nonmoney amounts, Per 1000=(countyvalue / county population for the same year as the data) x 1000. $ Per capita=(county value / county population for the same year as the data). Value= . indicatesmissing or suppressed data or value not calculated.
Kansas County Profile Clay County, Kansas Page 30 of 70
Business
2000.0 2007.5 2015.0
TOTAL ANNUAL PAYROLL($000):MINING
U.S. Census Bureau, County BusinessPatterns
Year CountyState ofKansas
NonMetro
KansasCountyRank
Per 1000or $ PerCapita
2000 . 240,079 . . .
2001 . 273,838 . . .
2002 . 262,277 . . .
2003 . 290,652 . . .
2004 . 326,997 . . .
2005 . 381,069 . . .
2006 0 482,102 . . 0.0
2007 0 551,751 . . 0.0
2008 0 620,446 . . 0.0
2009 0 465,070 . . 0.0
2010 0 485,841 . . 0.0
2011 0 541,536 . . 0.0
2012 0 600,402 . . 0.0
2013 0 599,788 . . 0.0
2014 0 678,673 . . 0.0
2015 0 552,658 . . 0.0
TOTAL ANNUAL PAYROLL($000):UTILITIES
U.S. Census Bureau, County BusinessPatterns
Year CountyState ofKansas
NonMetro
KansasCountyRank
Per 1000or $ PerCapita
2000 . 410,313 . . .
2001 . 452,057 . . .
2002 . 377,559 . . .
2003 . 378,157 . . .
2004 . 377,809 . . .
2005 . 429,864 . . .
2006 . 443,999 . . .
2007 . 480,068 . . .
2008 . 541,066 . . .
2009 . 563,373 . . .
2010 . 512,628 . . .
2011 . 653,229 . . .
2012 . 625,451 . . .
2013 . 625,347 . . .
2014 . 610,960 . . .
2015 . 668,559 . . .

Institute for Policy & Social Research, The University of Kansas, Lawrence, KS 66045 (email: [email protected]) 12/21/2017
County: county value. Kansas: state value. County Rank: highest county value ranked #1. ($000): thousands of dollars. Nonmetro Kansas: Kansas total lessMetropolitan Areas as defined by the Office of Management and Budget (OMB; released 2/28/2013). Per 1000: For nonmoney amounts, Per 1000=(countyvalue / county population for the same year as the data) x 1000. $ Per capita=(county value / county population for the same year as the data). Value= . indicatesmissing or suppressed data or value not calculated.
Kansas County Profile Clay County, Kansas Page 31 of 70
Business
2000.0 2007.5 2015.0
TOTAL ANNUAL PAYROLL($000):CONSTRUCTION
U.S. Census Bureau, County BusinessPatterns
Year CountyState ofKansas
NonMetro
KansasCountyRank
Per 1000or $ PerCapita
2000 6,300 2,256,057 . . 714.1
2001 6,708 2,320,652 . . 768.4
2002 5,479 2,302,229 . . 636.6
2003 5,303 2,282,021 . . 624.4
2004 5,478 2,302,854 . . 648.5
2005 5,753 2,465,977 . . 681.3
2006 7,273 2,700,351 . . 859.9
2007 6,535 2,772,168 . . 766.4
2008 5,682 2,950,073 . . 659.3
2009 4,867 2,709,864 . . 572.6
2010 4,813 2,553,555 . . 563.9
2011 4,629 2,550,355 . . 543.8
2012 4,493 2,733,284 . . 528.1
2013 4,562 2,866,801 . . 543.0
2014 4,411 3,135,814 . . 529.0
2015 4,536 3,270,952 . . 543.9
2000.0 2007.5 2015.0
TOTAL ANNUAL PAYROLL($000):MANUFACTURING
U.S. Census Bureau, County BusinessPatterns
Year CountyState ofKansas
NonMetro
KansasCountyRank
Per 1000or $ PerCapita
2000 8,511 7,015,414 . . 964.7
2001 11,602 7,301,706 . . 1,329.0
2002 7,508 6,802,605 . . 872.3
2003 7,066 6,691,611 . . 832.0
2004 8,144 6,985,656 . . 964.1
2005 9,155 7,221,614 . . 1,084.2
2006 8,568 7,621,873 . . 1,013.0
2007 . 7,873,359 . . .
2008 . 8,441,541 . . .
2009 . 7,477,838 . . .
2010 . 7,556,955 . . .
2011 . 7,747,934 . . .
2012 . 7,704,851 . . .
2013 . 8,365,542 . . .
2014 . 8,787,306 . . .
2015 15,858 9,052,105 . . 1,901.4

Institute for Policy & Social Research, The University of Kansas, Lawrence, KS 66045 (email: [email protected]) 12/21/2017
County: county value. Kansas: state value. County Rank: highest county value ranked #1. ($000): thousands of dollars. Nonmetro Kansas: Kansas total lessMetropolitan Areas as defined by the Office of Management and Budget (OMB; released 2/28/2013). Per 1000: For nonmoney amounts, Per 1000=(countyvalue / county population for the same year as the data) x 1000. $ Per capita=(county value / county population for the same year as the data). Value= . indicatesmissing or suppressed data or value not calculated.
Kansas County Profile Clay County, Kansas Page 32 of 70
Business
2000.0 2007.5 2015.0
TOTAL ANNUAL PAYROLL($000):WHOLESALE TRADE
U.S. Census Bureau, County BusinessPatterns
Year CountyState ofKansas
NonMetro
KansasCountyRank
Per 1000or $ PerCapita
2000 2,725 2,332,755 . . 308.9
2001 2,654 2,283,169 . . 304.0
2002 2,955 2,107,653 . . 343.3
2003 3,154 2,622,701 . . 371.4
2004 3,194 2,663,196 . . 378.1
2005 3,526 2,345,990 . . 417.6
2006 3,618 2,592,211 . . 427.8
2007 4,693 2,682,542 . . 550.4
2008 6,539 3,078,655 . . 758.8
2009 7,321 2,940,949 . . 861.3
2010 7,819 3,097,628 . . 916.1
2011 11,549 3,305,811 . . 1,356.6
2012 10,181 3,339,997 . . 1,196.6
2013 10,387 3,460,512 . . 1,236.4
2014 12,088 3,712,075 . . 1,449.7
2015 11,697 3,760,189 . . 1,402.5
2000.0 2007.5 2015.0
TOTAL ANNUAL PAYROLL($000):RETAIL TRADE
U.S. Census Bureau, County BusinessPatterns
Year CountyState ofKansas
NonMetro
KansasCountyRank
Per 1000or $ PerCapita
2000 7,284 2,747,001 . . 825.7
2001 7,274 2,813,226 . . 833.2
2002 6,898 2,854,231 . . 801.4
2003 6,724 2,773,674 . . 791.7
2004 7,052 2,847,826 . . 834.9
2005 7,725 2,952,196 . . 914.9
2006 8,095 3,126,495 . . 957.1
2007 6,399 3,201,169 . . 750.4
2008 6,822 3,261,054 . . 791.6
2009 7,092 3,232,246 . . 834.4
2010 7,268 3,321,838 . . 851.6
2011 7,393 3,384,607 . . 868.4
2012 7,884 3,409,755 . . 926.7
2013 7,982 3,483,752 . . 950.1
2014 8,110 3,617,933 . . 972.7
2015 8,498 3,712,165 . . 1,018.9
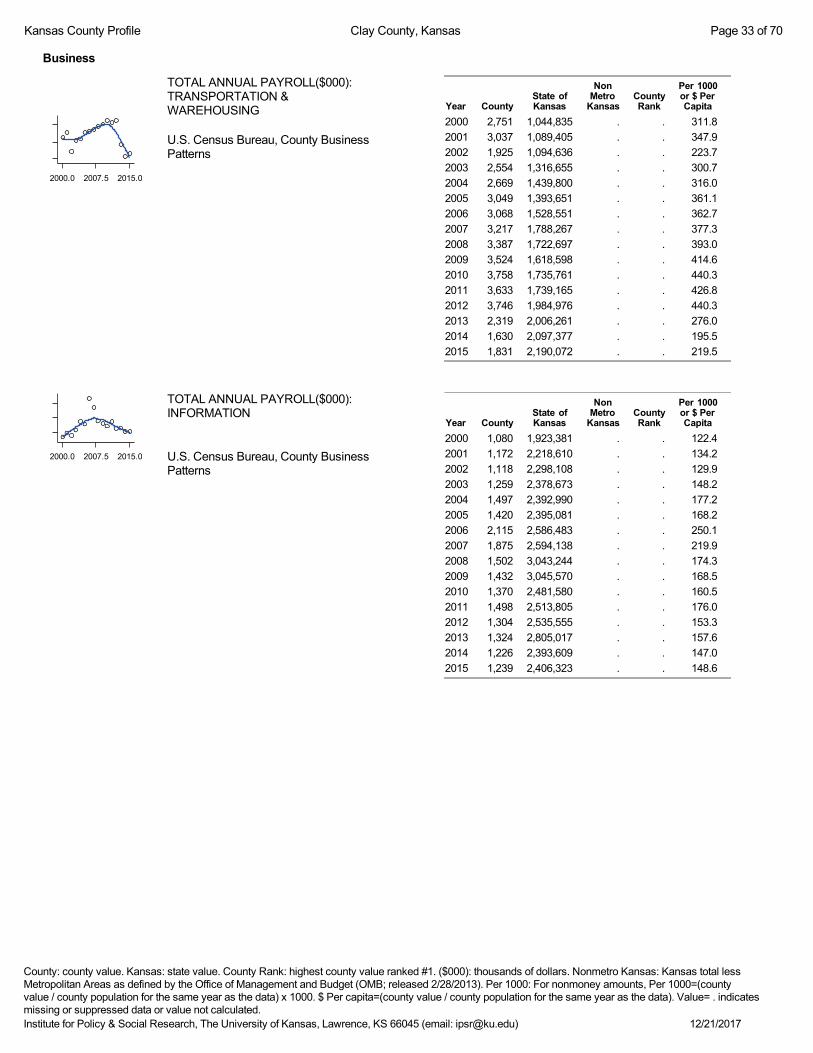
Institute for Policy & Social Research, The University of Kansas, Lawrence, KS 66045 (email: [email protected]) 12/21/2017
County: county value. Kansas: state value. County Rank: highest county value ranked #1. ($000): thousands of dollars. Nonmetro Kansas: Kansas total lessMetropolitan Areas as defined by the Office of Management and Budget (OMB; released 2/28/2013). Per 1000: For nonmoney amounts, Per 1000=(countyvalue / county population for the same year as the data) x 1000. $ Per capita=(county value / county population for the same year as the data). Value= . indicatesmissing or suppressed data or value not calculated.
Kansas County Profile Clay County, Kansas Page 33 of 70
Business
2000.0 2007.5 2015.0
TOTAL ANNUAL PAYROLL($000):TRANSPORTATION &WAREHOUSING
U.S. Census Bureau, County BusinessPatterns
Year CountyState ofKansas
NonMetro
KansasCountyRank
Per 1000or $ PerCapita
2000 2,751 1,044,835 . . 311.8
2001 3,037 1,089,405 . . 347.9
2002 1,925 1,094,636 . . 223.7
2003 2,554 1,316,655 . . 300.7
2004 2,669 1,439,800 . . 316.0
2005 3,049 1,393,651 . . 361.1
2006 3,068 1,528,551 . . 362.7
2007 3,217 1,788,267 . . 377.3
2008 3,387 1,722,697 . . 393.0
2009 3,524 1,618,598 . . 414.6
2010 3,758 1,735,761 . . 440.3
2011 3,633 1,739,165 . . 426.8
2012 3,746 1,984,976 . . 440.3
2013 2,319 2,006,261 . . 276.0
2014 1,630 2,097,377 . . 195.5
2015 1,831 2,190,072 . . 219.5
2000.0 2007.5 2015.0
TOTAL ANNUAL PAYROLL($000):INFORMATION
U.S. Census Bureau, County BusinessPatterns
Year CountyState ofKansas
NonMetro
KansasCountyRank
Per 1000or $ PerCapita
2000 1,080 1,923,381 . . 122.4
2001 1,172 2,218,610 . . 134.2
2002 1,118 2,298,108 . . 129.9
2003 1,259 2,378,673 . . 148.2
2004 1,497 2,392,990 . . 177.2
2005 1,420 2,395,081 . . 168.2
2006 2,115 2,586,483 . . 250.1
2007 1,875 2,594,138 . . 219.9
2008 1,502 3,043,244 . . 174.3
2009 1,432 3,045,570 . . 168.5
2010 1,370 2,481,580 . . 160.5
2011 1,498 2,513,805 . . 176.0
2012 1,304 2,535,555 . . 153.3
2013 1,324 2,805,017 . . 157.6
2014 1,226 2,393,609 . . 147.0
2015 1,239 2,406,323 . . 148.6

Institute for Policy & Social Research, The University of Kansas, Lawrence, KS 66045 (email: [email protected]) 12/21/2017
County: county value. Kansas: state value. County Rank: highest county value ranked #1. ($000): thousands of dollars. Nonmetro Kansas: Kansas total lessMetropolitan Areas as defined by the Office of Management and Budget (OMB; released 2/28/2013). Per 1000: For nonmoney amounts, Per 1000=(countyvalue / county population for the same year as the data) x 1000. $ Per capita=(county value / county population for the same year as the data). Value= . indicatesmissing or suppressed data or value not calculated.
Kansas County Profile Clay County, Kansas Page 34 of 70
Business
2000.0 2007.5 2015.0
TOTAL ANNUAL PAYROLL($000):FINANCE & INSURANCE
U.S. Census Bureau, County BusinessPatterns
Year CountyState ofKansas
NonMetro
KansasCountyRank
Per 1000or $ PerCapita
2000 3,275 2,083,565 . . 371.2
2001 2,450 2,129,587 . . 280.6
2002 3,123 2,414,120 . . 362.8
2003 2,776 2,608,579 . . 326.9
2004 2,431 2,676,910 . . 287.8
2005 2,481 2,786,136 . . 293.8
2006 2,741 2,928,931 . . 324.1
2007 3,046 3,096,017 . . 357.2
2008 3,251 3,322,977 . . 377.2
2009 3,262 3,206,839 . . 383.8
2010 3,142 3,211,300 . . 368.1
2011 3,194 3,404,633 . . 375.2
2012 3,435 3,611,165 . . 403.7
2013 3,381 3,896,051 . . 402.5
2014 3,563 4,044,315 . . 427.3
2015 3,785 4,113,060 . . 453.8
2000.0 2007.5 2015.0
TOTAL ANNUAL PAYROLL($000):REAL ESTATE, RENTAL, ANDLEASING
U.S. Census Bureau, County BusinessPatterns
Year CountyState ofKansas
NonMetro
KansasCountyRank
Per 1000or $ PerCapita
2000 276 360,637 . . 31.3
2001 . 397,371 . . .
2002 . 403,695 . . .
2003 77 437,786 . . 9.1
2004 74 430,719 . . 8.8
2005 . 465,149 . . .
2006 . 478,811 . . .
2007 . 452,969 . . .
2008 . 484,149 . . .
2009 . 450,884 . . .
2010 . 487,255 . . .
2011 . 535,120 . . .
2012 . 531,039 . . .
2013 . 538,796 . . .
2014 . 542,307 . . .
2015 255 595,030 . . 30.6

Institute for Policy & Social Research, The University of Kansas, Lawrence, KS 66045 (email: [email protected]) 12/21/2017
County: county value. Kansas: state value. County Rank: highest county value ranked #1. ($000): thousands of dollars. Nonmetro Kansas: Kansas total lessMetropolitan Areas as defined by the Office of Management and Budget (OMB; released 2/28/2013). Per 1000: For nonmoney amounts, Per 1000=(countyvalue / county population for the same year as the data) x 1000. $ Per capita=(county value / county population for the same year as the data). Value= . indicatesmissing or suppressed data or value not calculated.
Kansas County Profile Clay County, Kansas Page 35 of 70
Business
2000.0 2007.5 2015.0
TOTAL ANNUAL PAYROLL($000):PROFESSIONAL, SCIENTIFIC, ANDTECHNICAL SERVICES
U.S. Census Bureau, County BusinessPatterns
Year CountyState ofKansas
NonMetro
KansasCountyRank
Per 1000or $ PerCapita
2000 1,021 2,057,313 . . 115.7
2001 901 2,152,937 . . 103.2
2002 1,160 2,150,085 . . 134.8
2003 1,231 2,052,712 . . 144.9
2004 1,356 2,531,457 . . 160.5
2005 1,397 2,418,500 . . 165.4
2006 1,568 2,655,690 . . 185.4
2007 1,927 2,901,544 . . 226.0
2008 1,775 2,903,802 . . 206.0
2009 1,817 3,071,611 . . 213.8
2010 1,739 3,037,182 . . 203.7
2011 1,758 3,132,082 . . 206.5
2012 1,824 3,455,548 . . 214.4
2013 1,901 3,777,729 . . 226.3
2014 1,927 3,981,580 . . 231.1
2015 2,073 4,039,074 . . 248.6
2000.0 2007.5 2015.0
TOTAL ANNUAL PAYROLL($000):MANAGEMENT OF COMPANIES ANDENTERPRISES
U.S. Census Bureau, County BusinessPatterns
Year CountyState ofKansas
NonMetro
KansasCountyRank
Per 1000or $ PerCapita
2000 . 1,362,735 . . .
2001 . 1,279,253 . . .
2002 . 1,311,368 . . .
2003 . 1,352,119 . . .
2004 . 1,378,891 . . .
2005 . 1,510,876 . . .
2006 . 1,626,320 . . .
2007 . 2,233,654 . . .
2008 0 1,848,656 . . 0.0
2009 0 1,601,158 . . 0.0
2010 0 2,003,048 . . 0.0
2011 0 1,677,619 . . 0.0
2012 0 1,834,430 . . 0.0
2013 0 1,938,100 . . 0.0
2014 0 2,117,232 . . 0.0
2015 0 2,451,126 . . 0.0

Institute for Policy & Social Research, The University of Kansas, Lawrence, KS 66045 (email: [email protected]) 12/21/2017
County: county value. Kansas: state value. County Rank: highest county value ranked #1. ($000): thousands of dollars. Nonmetro Kansas: Kansas total lessMetropolitan Areas as defined by the Office of Management and Budget (OMB; released 2/28/2013). Per 1000: For nonmoney amounts, Per 1000=(countyvalue / county population for the same year as the data) x 1000. $ Per capita=(county value / county population for the same year as the data). Value= . indicatesmissing or suppressed data or value not calculated.
Kansas County Profile Clay County, Kansas Page 36 of 70
Business
2000.0 2007.5 2015.0
TOTAL ANNUAL PAYROLL($000):ADMIN, SUPPORT, WASTE MGMT.,AND REMEDIATION
U.S. Census Bureau, County BusinessPatterns
Year CountyState ofKansas
NonMetro
KansasCountyRank
Per 1000or $ PerCapita
2000 146 1,388,712 . . 16.5
2001 . 1,416,480 . . .
2002 . 1,378,905 . . .
2003 62 1,387,061 . . 7.3
2004 . 1,544,442 . . .
2005 . 1,694,687 . . .
2006 . 1,800,846 . . .
2007 169 1,978,025 . . 19.8
2008 308 2,096,864 . . 35.7
2009 . 1,832,540 . . .
2010 235 2,117,325 . . 27.5
2011 . 2,114,970 . . .
2012 . 2,230,250 . . .
2013 . 2,214,320 . . .
2014 . 2,444,170 . . .
2015 458 2,577,592 . . 54.9
2000.0 2007.5 2015.0
TOTAL ANNUAL PAYROLL($000):EDUCATIONAL SERVICES
U.S. Census Bureau, County BusinessPatterns
Year CountyState ofKansas
NonMetro
KansasCountyRank
Per 1000or $ PerCapita
2000 . 299,843 . . .
2001 . 320,606 . . .
2002 0 353,531 . . 0.0
2003 0 350,814 . . 0.0
2004 0 361,644 . . 0.0
2005 . 375,781 . . .
2006 0 400,565 . . 0.0
2007 0 414,233 . . 0.0
2008 0 463,210 . . 0.0
2009 0 468,856 . . 0.0
2010 0 487,670 . . 0.0
2011 0 504,964 . . 0.0
2012 . 508,448 . . .
2013 . 553,995 . . .
2014 . 612,073 . . .
2015 . 579,794 . . .

Institute for Policy & Social Research, The University of Kansas, Lawrence, KS 66045 (email: [email protected]) 12/21/2017
County: county value. Kansas: state value. County Rank: highest county value ranked #1. ($000): thousands of dollars. Nonmetro Kansas: Kansas total lessMetropolitan Areas as defined by the Office of Management and Budget (OMB; released 2/28/2013). Per 1000: For nonmoney amounts, Per 1000=(countyvalue / county population for the same year as the data) x 1000. $ Per capita=(county value / county population for the same year as the data). Value= . indicatesmissing or suppressed data or value not calculated.
Kansas County Profile Clay County, Kansas Page 37 of 70
Business
2000.0 2007.5 2015.0
TOTAL ANNUAL PAYROLL($000):HEALTH CARE AND SOCIALASSISTANCE
U.S. Census Bureau, County BusinessPatterns
Year CountyState ofKansas
NonMetro
KansasCountyRank
Per 1000or $ PerCapita
2000 8,491 4,120,595 . . 962.5
2001 9,517 4,445,027 . . 1,090.1
2002 12,247 4,705,220 . . 1,422.9
2003 11,517 4,939,323 . . 1,356.1
2004 12,015 5,232,394 . . 1,422.4
2005 13,067 5,487,089 . . 1,547.5
2006 13,752 5,814,218 . . 1,625.9
2007 14,467 6,186,471 . . 1,696.6
2008 15,349 6,490,627 . . 1,781.0
2009 16,253 6,749,962 . . 1,912.1
2010 16,598 6,871,727 . . 1,944.7
2011 17,197 7,129,655 . . 2,020.1
2012 17,227 7,614,853 . . 2,024.8
2013 17,254 7,541,515 . . 2,053.8
2014 17,997 7,733,621 . . 2,158.4
2015 17,821 7,969,650 . . 2,136.8
2000.0 2007.5 2015.0
TOTAL ANNUAL PAYROLL($000):ARTS, ENTERTAINMENT, ANDRECREATION
U.S. Census Bureau, County BusinessPatterns
Year CountyState ofKansas
NonMetro
KansasCountyRank
Per 1000or $ PerCapita
2000 . 195,784 . . .
2001 182 203,511 . . 20.8
2002 223 206,204 . . 25.9
2003 238 185,049 . . 28.0
2004 209 190,742 . . 24.7
2005 . 196,594 . . .
2006 . 201,049 . . .
2007 . 220,435 . . .
2008 . 236,986 . . .
2009 . 237,116 . . .
2010 . 233,285 . . .
2011 . 234,351 . . .
2012 . 254,169 . . .
2013 . 278,474 . . .
2014 . 289,103 . . .
2015 276 300,253 . . 33.1

Institute for Policy & Social Research, The University of Kansas, Lawrence, KS 66045 (email: [email protected]) 12/21/2017
County: county value. Kansas: state value. County Rank: highest county value ranked #1. ($000): thousands of dollars. Nonmetro Kansas: Kansas total lessMetropolitan Areas as defined by the Office of Management and Budget (OMB; released 2/28/2013). Per 1000: For nonmoney amounts, Per 1000=(countyvalue / county population for the same year as the data) x 1000. $ Per capita=(county value / county population for the same year as the data). Value= . indicatesmissing or suppressed data or value not calculated.
Kansas County Profile Clay County, Kansas Page 38 of 70
Business
2000.0 2007.5 2015.0
TOTAL ANNUAL PAYROLL($000):ACCOMMODATION AND FOODSERVICES
U.S. Census Bureau, County BusinessPatterns
Year CountyState ofKansas
NonMetro
KansasCountyRank
Per 1000or $ PerCapita
2000 1,709 926,831 . . 193.7
2001 1,821 960,196 . . 208.6
2002 . 930,510 . . .
2003 1,089 992,313 . . 128.2
2004 1,045 1,046,901 . . 123.7
2005 1,165 1,101,854 . . 138.0
2006 1,372 1,185,280 . . 162.2
2007 1,270 1,431,100 . . 148.9
2008 1,448 1,271,594 . . 168.0
2009 1,580 1,283,065 . . 185.9
2010 1,640 1,296,556 . . 192.1
2011 1,486 1,364,281 . . 174.6
2012 1,876 1,388,337 . . 220.5
2013 1,835 1,476,335 . . 218.4
2014 1,877 1,572,021 . . 225.1
2015 1,741 1,640,144 . . 208.8
2000.0 2007.5 2015.0
TOTAL ANNUAL PAYROLL($000):OTHER SERVICES
U.S. Census Bureau, County BusinessPatterns
Year CountyState ofKansas
NonMetro
KansasCountyRank
Per 1000or $ PerCapita
2000 1,347 965,540 . . 152.7
2001 1,415 996,716 . . 162.1
2002 1,533 1,007,464 . . 178.1
2003 1,604 979,466 . . 188.9
2004 1,654 970,383 . . 195.8
2005 1,908 1,005,537 . . 226.0
2006 1,730 1,055,932 . . 204.5
2007 2,056 1,141,551 . . 241.1
2008 2,121 1,184,016 . . 246.1
2009 2,220 1,167,154 . . 261.2
2010 2,206 1,170,201 . . 258.5
2011 2,290 1,173,775 . . 269.0
2012 2,350 1,217,210 . . 276.2
2013 2,268 1,254,933 . . 270.0
2014 2,401 1,305,563 . . 288.0
2015 2,581 1,341,075 . . 309.5

Institute for Policy & Social Research, The University of Kansas, Lawrence, KS 66045 (email: [email protected]) 12/21/2017
County: county value. Kansas: state value. County Rank: highest county value ranked #1. ($000): thousands of dollars. Nonmetro Kansas: Kansas total lessMetropolitan Areas as defined by the Office of Management and Budget (OMB; released 2/28/2013). Per 1000: For nonmoney amounts, Per 1000=(countyvalue / county population for the same year as the data) x 1000. $ Per capita=(county value / county population for the same year as the data). Value= . indicatesmissing or suppressed data or value not calculated.
Kansas County Profile Clay County, Kansas Page 39 of 70
Business
2000 2010
NOMINAL TAXABLE RETAIL SALES(million$)
Kansas Department of Revenue
Year CountyState ofKansas
NonMetro
KansasCountyRank
Per 1000or $ PerCapita
2000 63.3 30,119.0 9,011.1 47 7.2
2001 59.5 30,202.2 8,874.9 47 6.8
2002 56.9 29,380.8 8,413.5 46 6.6
2003 59.8 30,694.0 8,899.5 48 7.0
2004 66.6 31,922.6 9,275.5 48 7.9
2005 63.6 32,924.2 9,599.7 50 7.5
2006 69.8 34,937.6 10,320.7 49 8.3
2007 74.7 36,180.1 10,848.1 49 8.8
2008 78.8 37,559.5 11,439.6 49 9.1
2009 74.6 35,211.8 10,669.3 49 8.8
2010 75.8 35,655.7 10,946.7 50 8.9
2011 76.8 37,257.0 11,485.4 51 9.0
2012 85.2 38,988.8 12,091.4 49 10.0
2013 80.5 40,009.0 12,338.6 54 9.6
2014 83.8 41,299.0 12,693.3 55 10.1
2015 81.5 41,635.8 12,092.2 50 9.8
2016 84.9 42,040.2 11,851.3 47 10.4
2000 2010
RETAIL PULL FACTOR
Kansas Direct Program, Kansas StateUniversity Cooperative ExtensionService (1980-1999);KansasDepartment of Revenue (2000- )
Year CountyState ofKansas
NonMetro
KansasCountyRank
Per 1000or $ PerCapita
2000 0.64 . . 47 .
2001 0.61 . . 49 .
2002 0.62 . . 51 .
2003 0.62 . . 56 .
2004 0.67 . . 49 .
2005 0.62 . . 61 .
2006 0.64 . . 60 .
2007 0.64 . . 63 .
2008 0.67 . . 60 .
2009 0.68 . . 68 .
2010 0.68 . . 68 .
2011 0.71 . . 59 .
2012 0.72 . . 63 .
2013 0.71 . . 67 .
2014 0.69 . . 66 .
2015 0.69 . . 65 .
2016 0.69 . . 59 .
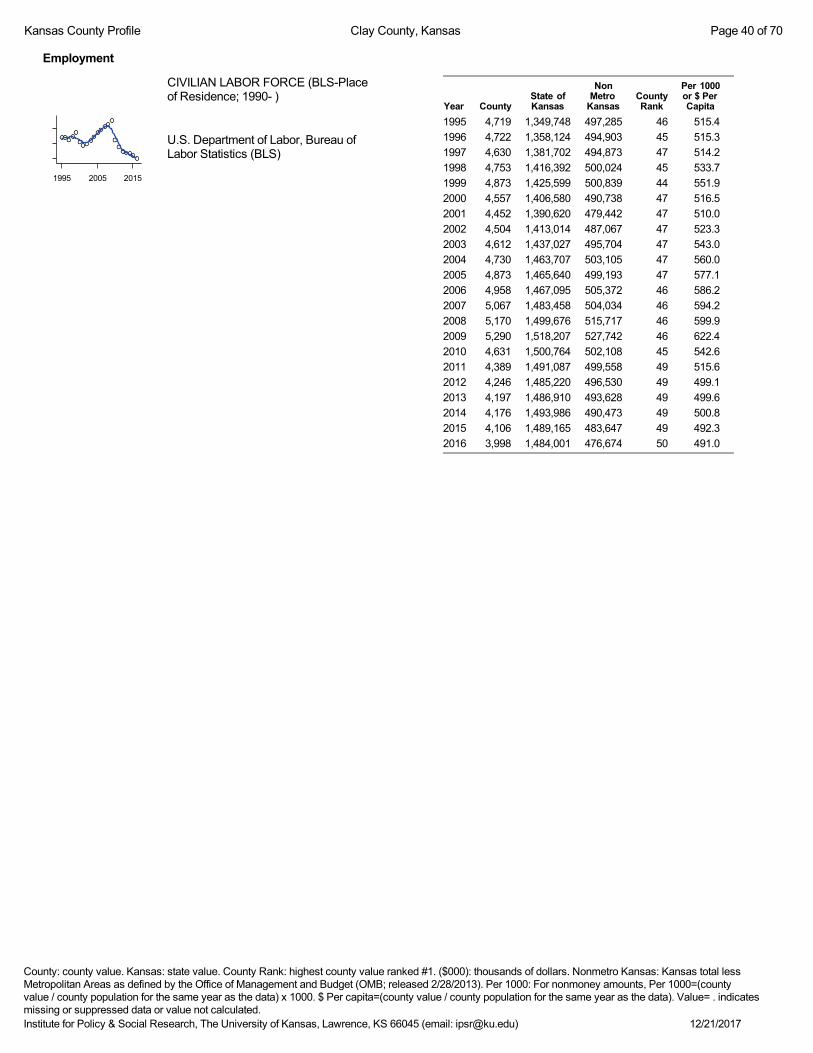
Institute for Policy & Social Research, The University of Kansas, Lawrence, KS 66045 (email: [email protected]) 12/21/2017
County: county value. Kansas: state value. County Rank: highest county value ranked #1. ($000): thousands of dollars. Nonmetro Kansas: Kansas total lessMetropolitan Areas as defined by the Office of Management and Budget (OMB; released 2/28/2013). Per 1000: For nonmoney amounts, Per 1000=(countyvalue / county population for the same year as the data) x 1000. $ Per capita=(county value / county population for the same year as the data). Value= . indicatesmissing or suppressed data or value not calculated.
Kansas County Profile Clay County, Kansas Page 40 of 70
Employment
1995 2005 2015
CIVILIAN LABOR FORCE (BLS-Placeof Residence; 1990- )
U.S. Department of Labor, Bureau ofLabor Statistics (BLS)
Year CountyState ofKansas
NonMetro
KansasCountyRank
Per 1000or $ PerCapita
1995 4,719 1,349,748 497,285 46 515.4
1996 4,722 1,358,124 494,903 45 515.3
1997 4,630 1,381,702 494,873 47 514.2
1998 4,753 1,416,392 500,024 45 533.7
1999 4,873 1,425,599 500,839 44 551.9
2000 4,557 1,406,580 490,738 47 516.5
2001 4,452 1,390,620 479,442 47 510.0
2002 4,504 1,413,014 487,067 47 523.3
2003 4,612 1,437,027 495,704 47 543.0
2004 4,730 1,463,707 503,105 47 560.0
2005 4,873 1,465,640 499,193 47 577.1
2006 4,958 1,467,095 505,372 46 586.2
2007 5,067 1,483,458 504,034 46 594.2
2008 5,170 1,499,676 515,717 46 599.9
2009 5,290 1,518,207 527,742 46 622.4
2010 4,631 1,500,764 502,108 45 542.6
2011 4,389 1,491,087 499,558 49 515.6
2012 4,246 1,485,220 496,530 49 499.1
2013 4,197 1,486,910 493,628 49 499.6
2014 4,176 1,493,986 490,473 49 500.8
2015 4,106 1,489,165 483,647 49 492.3
2016 3,998 1,484,001 476,674 50 491.0

Institute for Policy & Social Research, The University of Kansas, Lawrence, KS 66045 (email: [email protected]) 12/21/2017
County: county value. Kansas: state value. County Rank: highest county value ranked #1. ($000): thousands of dollars. Nonmetro Kansas: Kansas total lessMetropolitan Areas as defined by the Office of Management and Budget (OMB; released 2/28/2013). Per 1000: For nonmoney amounts, Per 1000=(countyvalue / county population for the same year as the data) x 1000. $ Per capita=(county value / county population for the same year as the data). Value= . indicatesmissing or suppressed data or value not calculated.
Kansas County Profile Clay County, Kansas Page 41 of 70
Employment
1995 2005 2015
EMPLOYED (BLS-Place of Residence;1990- )
U.S. Department of Labor, Bureau ofLabor Statistics (BLS)
Year CountyState ofKansas
NonMetro
KansasCountyRank
Per 1000or $ PerCapita
1995 4,566 1,290,159 476,321 46 498.7
1996 4,577 1,300,384 474,096 45 499.5
1997 4,494 1,329,751 476,144 45 499.1
1998 4,618 1,366,403 482,268 45 518.6
1999 4,728 1,378,867 484,569 44 535.5
2000 4,410 1,356,147 473,849 47 499.9
2001 4,270 1,332,034 459,255 47 489.1
2002 4,315 1,341,603 465,642 47 501.3
2003 4,411 1,357,867 472,933 46 519.4
2004 4,523 1,383,867 478,628 46 535.5
2005 4,674 1,392,024 476,544 46 553.5
2006 4,789 1,402,796 485,609 46 566.2
2007 4,897 1,420,449 484,682 45 574.3
2008 4,993 1,430,628 494,557 46 579.4
2009 5,054 1,413,873 496,476 45 594.6
2010 4,374 1,394,958 469,774 45 512.5
2011 4,141 1,394,082 469,427 47 486.4
2012 4,027 1,400,122 469,717 47 473.3
2013 3,985 1,407,987 468,655 48 474.3
2014 3,991 1,426,194 469,555 48 478.7
2015 3,929 1,426,764 463,365 48 471.1
2016 3,818 1,422,122 456,300 50 468.9

Institute for Policy & Social Research, The University of Kansas, Lawrence, KS 66045 (email: [email protected]) 12/21/2017
County: county value. Kansas: state value. County Rank: highest county value ranked #1. ($000): thousands of dollars. Nonmetro Kansas: Kansas total lessMetropolitan Areas as defined by the Office of Management and Budget (OMB; released 2/28/2013). Per 1000: For nonmoney amounts, Per 1000=(countyvalue / county population for the same year as the data) x 1000. $ Per capita=(county value / county population for the same year as the data). Value= . indicatesmissing or suppressed data or value not calculated.
Kansas County Profile Clay County, Kansas Page 42 of 70
Employment
1995 2005 2015
UNEMPLOYED (BLS-Place ofResidence; 1990- )
U.S. Department of Labor, Bureau ofLabor Statistics (BLS)
Year CountyState ofKansas
NonMetro
KansasCountyRank
Per 1000or $ PerCapita
1995 153 59,589 20,964 50 16.7
1996 145 57,740 20,807 53 15.8
1997 136 51,951 18,729 52 15.1
1998 135 49,989 17,756 51 15.2
1999 145 46,732 16,270 50 16.4
2000 147 50,433 16,889 50 16.7
2001 182 58,586 20,187 47 20.8
2002 189 71,411 21,425 49 22.0
2003 201 79,160 22,771 49 23.7
2004 207 79,840 24,477 48 24.5
2005 199 73,616 22,649 47 23.6
2006 169 64,299 19,763 48 20.0
2007 170 63,009 19,352 49 19.9
2008 177 69,048 21,160 50 20.5
2009 236 104,334 31,266 52 27.8
2010 257 105,806 32,334 50 30.1
2011 248 97,005 30,131 48 29.1
2012 219 85,098 26,813 49 25.7
2013 212 78,923 24,973 47 25.2
2014 185 67,792 20,918 47 22.2
2015 177 62,401 20,282 46 21.2
2016 180 61,879 20,374 46 22.1

Institute for Policy & Social Research, The University of Kansas, Lawrence, KS 66045 (email: [email protected]) 12/21/2017
County: county value. Kansas: state value. County Rank: highest county value ranked #1. ($000): thousands of dollars. Nonmetro Kansas: Kansas total lessMetropolitan Areas as defined by the Office of Management and Budget (OMB; released 2/28/2013). Per 1000: For nonmoney amounts, Per 1000=(countyvalue / county population for the same year as the data) x 1000. $ Per capita=(county value / county population for the same year as the data). Value= . indicatesmissing or suppressed data or value not calculated.
Kansas County Profile Clay County, Kansas Page 43 of 70
Employment
1995 2005 2015
UNEMPLOYMENT RATE (BLS-Placeof Residence; 1990- )
U.S. Department of Labor, Bureau ofLabor Statistics (BLS)
Year CountyState ofKansas
NonMetro
KansasCountyRank
Per 1000or $ PerCapita
1995 3.2 4.4 4.2 61 .
1996 3.1 4.3 4.2 70 .
1997 2.9 3.8 3.8 64 .
1998 2.8 3.5 3.6 61 .
1999 3.0 3.3 3.2 50 .
2000 3.2 3.6 3.4 51 .
2001 4.1 4.2 4.2 35 .
2002 4.2 5.1 4.4 43 .
2003 4.4 5.5 4.6 45 .
2004 4.4 5.5 4.9 57 .
2005 4.1 5.0 4.5 53 .
2006 3.4 4.4 3.9 65 .
2007 3.4 4.2 3.8 67 .
2008 3.4 4.6 4.1 71 .
2009 4.5 6.9 5.9 65 .
2010 5.5 7.1 6.4 53 .
2011 5.7 6.5 6.0 44 .
2012 5.2 5.7 5.4 43 .
2013 5.1 5.3 5.1 37 .
2014 4.4 4.5 4.3 34 .
2015 4.3 4.2 4.2 38 .
2016 4.5 4.2 4.3 32 .

Institute for Policy & Social Research, The University of Kansas, Lawrence, KS 66045 (email: [email protected]) 12/21/2017
County: county value. Kansas: state value. County Rank: highest county value ranked #1. ($000): thousands of dollars. Nonmetro Kansas: Kansas total lessMetropolitan Areas as defined by the Office of Management and Budget (OMB; released 2/28/2013). Per 1000: For nonmoney amounts, Per 1000=(countyvalue / county population for the same year as the data) x 1000. $ Per capita=(county value / county population for the same year as the data). Value= . indicatesmissing or suppressed data or value not calculated.
Kansas County Profile Clay County, Kansas Page 44 of 70
Employment
1995 2005 2015
BEA EMPLOYMENT: TOTAL (Place ofWork)
U.S. Bureau of Economic Analysis,Regional Economic Information System(REIS)
Year CountyState ofKansas
NonMetro
KansasCountyRank
Per 1000or $ PerCapita
1995 5,099 1,600,063 596,945 47 556.9
1996 5,154 1,632,161 603,159 47 562.4
1997 5,292 1,676,805 612,370 47 587.7
1998 6,098 1,723,460 621,685 42 684.8
1999 6,283 1,740,764 623,211 40 711.6
2000 6,261 1,760,325 624,455 42 709.7
2001 4,922 1,767,574 612,521 47 563.8
2002 4,789 1,751,676 606,296 48 556.4
2003 4,789 1,739,382 599,096 48 563.9
2004 4,876 1,752,529 599,904 48 577.2
2005 5,003 1,767,517 598,129 47 592.5
2006 5,067 1,797,453 606,427 47 599.1
2007 5,209 1,847,146 619,228 47 610.9
2008 5,311 1,861,559 623,253 47 616.3
2009 5,059 1,818,445 611,967 48 595.2
2010 4,968 1,802,671 611,765 49 582.1
2011 4,918 1,820,268 615,929 51 577.7
2012 4,859 1,841,656 622,333 51 571.1
2013 4,932 1,869,343 626,287 50 587.1
2014 5,006 1,896,838 630,729 51 600.4
2015 4,881 1,911,712 628,096 51 585.3
2016 4,822 1,918,877 622,547 51 592.2

Institute for Policy & Social Research, The University of Kansas, Lawrence, KS 66045 (email: [email protected]) 12/21/2017
County: county value. Kansas: state value. County Rank: highest county value ranked #1. ($000): thousands of dollars. Nonmetro Kansas: Kansas total lessMetropolitan Areas as defined by the Office of Management and Budget (OMB; released 2/28/2013). Per 1000: For nonmoney amounts, Per 1000=(countyvalue / county population for the same year as the data) x 1000. $ Per capita=(county value / county population for the same year as the data). Value= . indicatesmissing or suppressed data or value not calculated.
Kansas County Profile Clay County, Kansas Page 45 of 70
Employment
1995 2005 2015
BEA EMPLOYMENT: FARM
U.S. Bureau of Economic Analysis,Regional Economic Information System(REIS)
Year CountyState ofKansas
NonMetro
KansasCountyRank
Per 1000or $ PerCapita
1995 705 78,471 59,461 46 77.0
1996 707 79,523 60,456 51 77.1
1997 702 79,543 60,311 50 78.0
1998 703 80,282 60,686 49 78.9
1999 701 80,286 60,709 49 79.4
2000 677 77,477 58,434 46 76.7
2001 681 78,133 58,952 47 78.0
2002 615 70,506 53,275 46 71.5
2003 592 68,516 51,521 48 69.7
2004 579 67,587 50,669 49 68.5
2005 570 66,814 49,788 47 67.5
2006 553 64,910 48,148 47 65.4
2007 559 65,718 48,496 47 65.6
2008 547 63,808 47,083 47 63.5
2009 542 62,786 46,372 47 63.8
2010 553 63,882 47,405 47 64.8
2011 572 65,761 49,124 49 67.2
2012 558 63,694 47,555 48 65.6
2013 552 62,750 46,714 48 65.7
2014 566 64,656 48,433 50 67.9
2015 569 64,987 48,841 50 68.2
2016 565 64,698 48,689 50 69.4

Institute for Policy & Social Research, The University of Kansas, Lawrence, KS 66045 (email: [email protected]) 12/21/2017
County: county value. Kansas: state value. County Rank: highest county value ranked #1. ($000): thousands of dollars. Nonmetro Kansas: Kansas total lessMetropolitan Areas as defined by the Office of Management and Budget (OMB; released 2/28/2013). Per 1000: For nonmoney amounts, Per 1000=(countyvalue / county population for the same year as the data) x 1000. $ Per capita=(county value / county population for the same year as the data). Value= . indicatesmissing or suppressed data or value not calculated.
Kansas County Profile Clay County, Kansas Page 46 of 70
Employment
1995 2005 2015
BEA EMPLOYMENT: NON-FARM
U.S. Bureau of Economic Analysis,Regional Economic Information System(REIS)
Year CountyState ofKansas
NonMetro
KansasCountyRank
Per 1000or $ PerCapita
1995 4,394 1,521,592 537,484 48 479.9
1996 4,447 1,552,638 542,703 48 485.3
1997 4,590 1,597,262 552,059 48 509.7
1998 5,395 1,643,178 560,999 42 605.8
1999 5,582 1,660,478 562,502 40 632.2
2000 5,584 1,682,848 566,021 41 633.0
2001 4,241 1,689,441 553,569 49 485.8
2002 4,174 1,681,170 553,021 49 485.0
2003 4,197 1,670,866 547,575 49 494.2
2004 4,297 1,684,942 549,235 48 508.7
2005 4,433 1,700,703 548,341 48 525.0
2006 4,514 1,732,543 558,279 47 533.7
2007 4,650 1,781,428 570,732 47 545.3
2008 4,764 1,797,751 576,170 47 552.8
2009 4,517 1,755,659 565,595 49 531.4
2010 4,415 1,738,789 564,360 50 517.3
2011 4,346 1,754,507 566,805 49 510.5
2012 4,301 1,777,962 574,778 51 505.5
2013 4,380 1,806,593 579,573 50 521.4
2014 4,440 1,832,182 582,296 49 532.5
2015 4,312 1,846,725 579,255 50 517.0
2016 4,257 1,854,179 573,858 50 522.8

Institute for Policy & Social Research, The University of Kansas, Lawrence, KS 66045 (email: [email protected]) 12/21/2017
County: county value. Kansas: state value. County Rank: highest county value ranked #1. ($000): thousands of dollars. Nonmetro Kansas: Kansas total lessMetropolitan Areas as defined by the Office of Management and Budget (OMB; released 2/28/2013). Per 1000: For nonmoney amounts, Per 1000=(countyvalue / county population for the same year as the data) x 1000. $ Per capita=(county value / county population for the same year as the data). Value= . indicatesmissing or suppressed data or value not calculated.
Kansas County Profile Clay County, Kansas Page 47 of 70
Employment
1995 2005 2015
AVERAGE WAGE PER JOB ($)
U.S. Bureau of Economic Analysis,Regional Economic Information System(REIS)
Year CountyState ofKansas
NonMetro
KansasCountyRank
Per 1000or $ PerCapita
1995 15,712 23,681 19,596 86 .
1996 16,367 24,534 20,021 80 .
1997 17,024 25,617 20,724 82 .
1998 17,422 26,810 21,483 83 .
1999 17,845 27,977 22,126 83 .
2000 18,409 29,375 23,209 89 .
2001 18,785 30,265 24,051 95 .
2002 19,624 31,007 24,611 89 .
2003 20,252 31,846 25,516 90 .
2004 21,070 33,222 26,489 90 .
2005 21,739 34,395 27,430 92 .
2006 22,216 36,289 28,909 94 .
2007 23,545 37,739 30,612 94 .
2008 25,319 38,978 32,084 95 .
2009 26,243 38,933 32,194 89 .
2010 27,362 39,824 33,052 84 .
2011 28,556 40,981 33,968 81 .
2012 29,673 42,272 34,987 85 .
2013 29,874 42,725 35,640 84 .
2014 30,853 43,779 36,584 83 .
2015 31,701 44,986 37,109 81 .
2016 31,620 45,343 37,593 88 .
BEA EMPLOYMENT: FORESTRY,FISHING, HUNTING, AND AGSUPPORT
U.S. Bureau of Economic Analysis,Regional Economic Information System(REIS)
Year CountyState ofKansas
NonMetro
KansasCountyRank
Per 1000or $ PerCapita
2001 . 7,059 . . .
2002 . 7,982 . . .
2003 . 7,260 . . .
2004 . 7,572 . . .
2005 . 7,904 . . .
2006 . 7,706 . . .
2007 . 8,200 . . .
2008 . 8,623 . . .
2009 . 9,051 . . .
2010 . 9,269 . . .
2011 . 9,431 . . .
2012 . 9,697 . . .
2013 . 10,027 . . .
2014 . 10,725 . . .
2015 . 10,020 . . .
2016 . 9,840 . . .
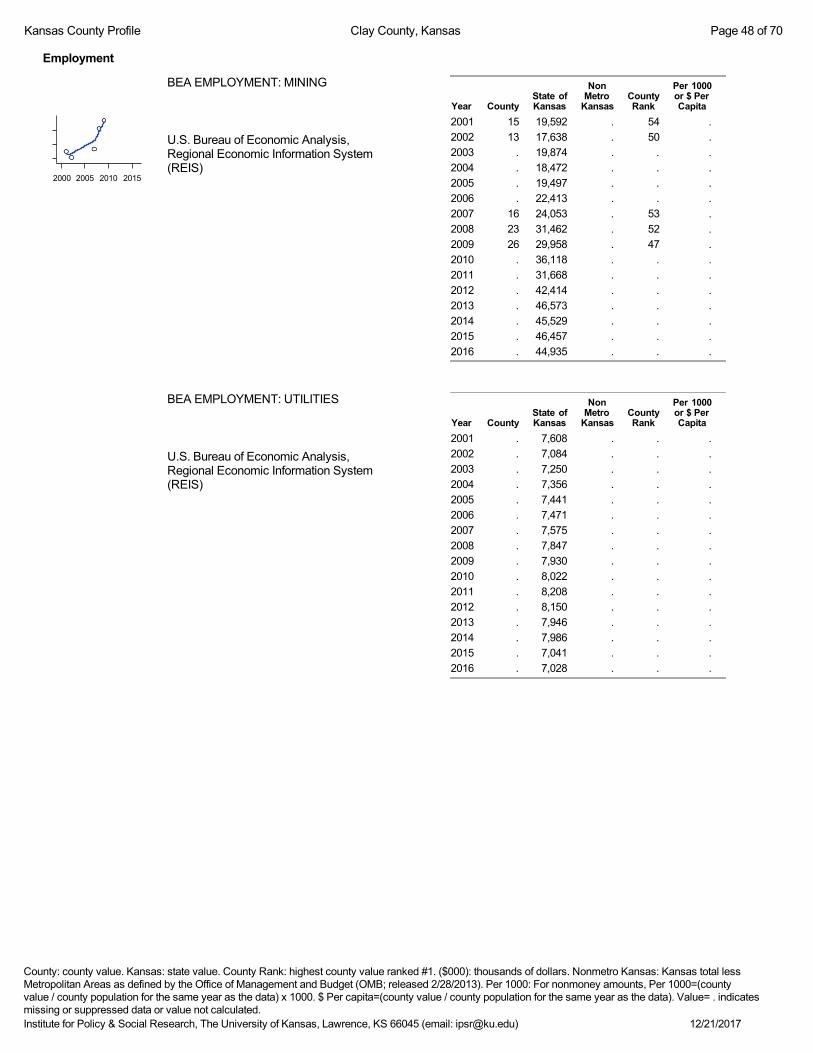
Institute for Policy & Social Research, The University of Kansas, Lawrence, KS 66045 (email: [email protected]) 12/21/2017
County: county value. Kansas: state value. County Rank: highest county value ranked #1. ($000): thousands of dollars. Nonmetro Kansas: Kansas total lessMetropolitan Areas as defined by the Office of Management and Budget (OMB; released 2/28/2013). Per 1000: For nonmoney amounts, Per 1000=(countyvalue / county population for the same year as the data) x 1000. $ Per capita=(county value / county population for the same year as the data). Value= . indicatesmissing or suppressed data or value not calculated.
Kansas County Profile Clay County, Kansas Page 48 of 70
Employment
2000 2005 2010 2015
BEA EMPLOYMENT: MINING
U.S. Bureau of Economic Analysis,Regional Economic Information System(REIS)
Year CountyState ofKansas
NonMetro
KansasCountyRank
Per 1000or $ PerCapita
2001 15 19,592 . 54 .
2002 13 17,638 . 50 .
2003 . 19,874 . . .
2004 . 18,472 . . .
2005 . 19,497 . . .
2006 . 22,413 . . .
2007 16 24,053 . 53 .
2008 23 31,462 . 52 .
2009 26 29,958 . 47 .
2010 . 36,118 . . .
2011 . 31,668 . . .
2012 . 42,414 . . .
2013 . 46,573 . . .
2014 . 45,529 . . .
2015 . 46,457 . . .
2016 . 44,935 . . .
BEA EMPLOYMENT: UTILITIES
U.S. Bureau of Economic Analysis,Regional Economic Information System(REIS)
Year CountyState ofKansas
NonMetro
KansasCountyRank
Per 1000or $ PerCapita
2001 . 7,608 . . .
2002 . 7,084 . . .
2003 . 7,250 . . .
2004 . 7,356 . . .
2005 . 7,441 . . .
2006 . 7,471 . . .
2007 . 7,575 . . .
2008 . 7,847 . . .
2009 . 7,930 . . .
2010 . 8,022 . . .
2011 . 8,208 . . .
2012 . 8,150 . . .
2013 . 7,946 . . .
2014 . 7,986 . . .
2015 . 7,041 . . .
2016 . 7,028 . . .

Institute for Policy & Social Research, The University of Kansas, Lawrence, KS 66045 (email: [email protected]) 12/21/2017
County: county value. Kansas: state value. County Rank: highest county value ranked #1. ($000): thousands of dollars. Nonmetro Kansas: Kansas total lessMetropolitan Areas as defined by the Office of Management and Budget (OMB; released 2/28/2013). Per 1000: For nonmoney amounts, Per 1000=(countyvalue / county population for the same year as the data) x 1000. $ Per capita=(county value / county population for the same year as the data). Value= . indicatesmissing or suppressed data or value not calculated.
Kansas County Profile Clay County, Kansas Page 49 of 70
Employment
2000 2005 2010 2015
BEA EMPLOYMENT:CONSTRUCTION
U.S. Bureau of Economic Analysis,Regional Economic Information System(REIS)
Year CountyState ofKansas
NonMetro
KansasCountyRank
Per 1000or $ PerCapita
2001 294 92,647 28,158 43 .
2002 296 90,463 . 41 .
2003 259 91,911 27,035 46 .
2004 261 93,545 . 45 .
2005 265 95,170 . 44 .
2006 303 97,848 . 43 .
2007 315 99,656 29,878 44 .
2008 338 98,456 . 43 .
2009 290 91,194 29,019 46 .
2010 296 84,939 27,295 43 .
2011 273 83,624 26,714 46 .
2012 277 86,076 . 48 .
2013 282 88,234 . 48 .
2014 266 91,341 . 51 .
2015 277 91,613 27,712 47 .
2016 271 91,561 26,647 47 .
2000 2005 2010 2015
BEA EMPLOYMENT:MANUFACTURING
U.S. Bureau of Economic Analysis,Regional Economic Information System(REIS)
Year CountyState ofKansas
NonMetro
KansasCountyRank
Per 1000or $ PerCapita
2001 487 199,966 73,589 38 .
2002 437 188,911 70,994 37 .
2003 407 179,003 68,650 39 .
2004 430 181,763 70,003 40 .
2005 430 185,478 71,394 40 .
2006 428 188,080 71,917 40 .
2007 449 192,983 73,656 40 .
2008 484 193,137 72,262 41 .
2009 431 173,914 65,318 40 .
2010 446 166,029 63,306 38 .
2011 432 167,322 64,795 40 .
2012 420 169,327 66,061 39 .
2013 434 170,113 67,364 41 .
2014 458 169,310 68,230 40 .
2015 445 168,315 67,039 39 .
2016 383 167,371 66,109 42 .

Institute for Policy & Social Research, The University of Kansas, Lawrence, KS 66045 (email: [email protected]) 12/21/2017
County: county value. Kansas: state value. County Rank: highest county value ranked #1. ($000): thousands of dollars. Nonmetro Kansas: Kansas total lessMetropolitan Areas as defined by the Office of Management and Budget (OMB; released 2/28/2013). Per 1000: For nonmoney amounts, Per 1000=(countyvalue / county population for the same year as the data) x 1000. $ Per capita=(county value / county population for the same year as the data). Value= . indicatesmissing or suppressed data or value not calculated.
Kansas County Profile Clay County, Kansas Page 50 of 70
Employment
2000 2005 2010 2015
BEA EMPLOYMENT: WHOLESALETRADE
U.S. Bureau of Economic Analysis,Regional Economic Information System(REIS)
Year CountyState ofKansas
NonMetro
KansasCountyRank
Per 1000or $ PerCapita
2001 166 65,665 . 42 .
2002 169 65,419 . 39 .
2003 170 63,536 . 35 .
2004 176 64,489 . 38 .
2005 194 64,651 . 33 .
2006 184 64,827 . 36 .
2007 198 66,107 . 33 .
2008 227 67,831 . 31 .
2009 231 66,163 . 30 .
2010 229 64,418 . 30 .
2011 254 64,772 . 32 .
2012 . 64,000 . . .
2013 . 65,016 . . .
2014 . 69,328 . . .
2015 . 68,452 . . .
2016 200 69,082 . 39 .
2000 2005 2010 2015
BEA EMPLOYMENT: RETAIL TRADE
U.S. Bureau of Economic Analysis,Regional Economic Information System(REIS)
Year CountyState ofKansas
NonMetro
KansasCountyRank
Per 1000or $ PerCapita
2001 672 198,069 . 39 .
2002 657 196,169 . 40 .
2003 651 194,672 65,622 42 .
2004 684 193,190 64,754 42 .
2005 714 191,941 64,083 40 .
2006 737 190,767 63,853 37 .
2007 788 191,129 63,474 35 .
2008 772 186,541 61,536 35 .
2009 582 182,121 60,582 43 .
2010 564 178,031 59,109 44 .
2011 522 180,787 59,462 46 .
2012 528 180,700 58,678 46 .
2013 533 183,368 58,835 46 .
2014 522 186,041 59,227 47 .
2015 530 188,540 59,854 46 .
2016 537 191,169 60,442 47 .

Institute for Policy & Social Research, The University of Kansas, Lawrence, KS 66045 (email: [email protected]) 12/21/2017
County: county value. Kansas: state value. County Rank: highest county value ranked #1. ($000): thousands of dollars. Nonmetro Kansas: Kansas total lessMetropolitan Areas as defined by the Office of Management and Budget (OMB; released 2/28/2013). Per 1000: For nonmoney amounts, Per 1000=(countyvalue / county population for the same year as the data) x 1000. $ Per capita=(county value / county population for the same year as the data). Value= . indicatesmissing or suppressed data or value not calculated.
Kansas County Profile Clay County, Kansas Page 51 of 70
Employment
2000 2005 2010 2015
BEA EMPLOYMENT:TRANSPORTATION ANDWAREHOUSING
U.S. Bureau of Economic Analysis,Regional Economic Information System(REIS)
Year CountyState ofKansas
NonMetro
KansasCountyRank
Per 1000or $ PerCapita
2001 . 56,302 . . .
2002 . 55,349 . . .
2003 . 55,529 . . .
2004 . 55,503 . . .
2005 . 56,240 . . .
2006 . 57,443 . . .
2007 . 59,190 . . .
2008 . 58,604 . . .
2009 . 56,214 . . .
2010 . 54,798 . . .
2011 . 57,079 . . .
2012 225 59,284 . 18 .
2013 216 59,532 . 21 .
2014 226 60,328 . 23 .
2015 207 63,029 . 23 .
2016 . 65,449 . . .
2000 2005 2010 2015
BEA EMPLOYMENT: INFORMATION
U.S. Bureau of Economic Analysis,Regional Economic Information System(REIS)
Year CountyState ofKansas
NonMetro
KansasCountyRank
Per 1000or $ PerCapita
2001 58 54,876 . 42 .
2002 59 50,728 . 40 .
2003 61 48,333 6,984 42 .
2004 62 45,614 . 41 .
2005 65 43,840 . 37 .
2006 62 43,929 . 37 .
2007 54 45,120 . 42 .
2008 54 42,987 . 40 .
2009 56 38,693 . 40 .
2010 52 33,429 . 39 .
2011 53 32,165 . 40 .
2012 48 31,829 . 43 .
2013 46 31,737 . 42 .
2014 48 32,314 . 40 .
2015 43 25,282 . 42 .
2016 44 24,905 . 41 .
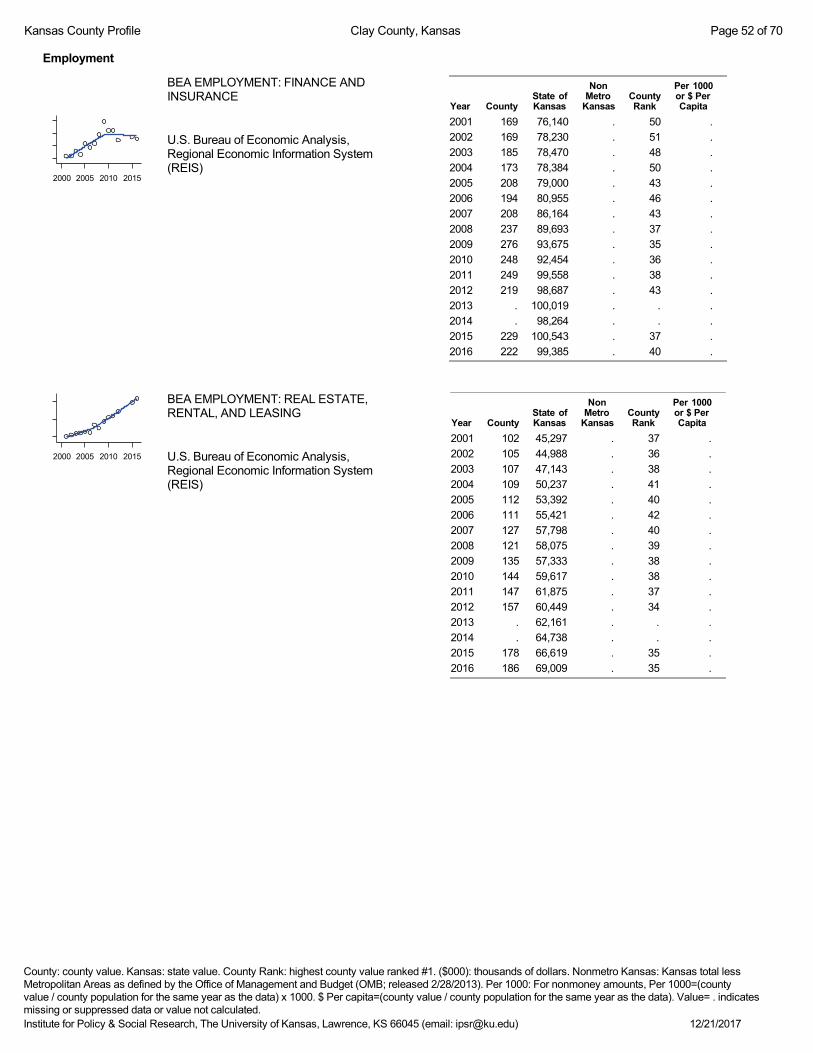
Institute for Policy & Social Research, The University of Kansas, Lawrence, KS 66045 (email: [email protected]) 12/21/2017
County: county value. Kansas: state value. County Rank: highest county value ranked #1. ($000): thousands of dollars. Nonmetro Kansas: Kansas total lessMetropolitan Areas as defined by the Office of Management and Budget (OMB; released 2/28/2013). Per 1000: For nonmoney amounts, Per 1000=(countyvalue / county population for the same year as the data) x 1000. $ Per capita=(county value / county population for the same year as the data). Value= . indicatesmissing or suppressed data or value not calculated.
Kansas County Profile Clay County, Kansas Page 52 of 70
Employment
2000 2005 2010 2015
BEA EMPLOYMENT: FINANCE ANDINSURANCE
U.S. Bureau of Economic Analysis,Regional Economic Information System(REIS)
Year CountyState ofKansas
NonMetro
KansasCountyRank
Per 1000or $ PerCapita
2001 169 76,140 . 50 .
2002 169 78,230 . 51 .
2003 185 78,470 . 48 .
2004 173 78,384 . 50 .
2005 208 79,000 . 43 .
2006 194 80,955 . 46 .
2007 208 86,164 . 43 .
2008 237 89,693 . 37 .
2009 276 93,675 . 35 .
2010 248 92,454 . 36 .
2011 249 99,558 . 38 .
2012 219 98,687 . 43 .
2013 . 100,019 . . .
2014 . 98,264 . . .
2015 229 100,543 . 37 .
2016 222 99,385 . 40 .
2000 2005 2010 2015
BEA EMPLOYMENT: REAL ESTATE,RENTAL, AND LEASING
U.S. Bureau of Economic Analysis,Regional Economic Information System(REIS)
Year CountyState ofKansas
NonMetro
KansasCountyRank
Per 1000or $ PerCapita
2001 102 45,297 . 37 .
2002 105 44,988 . 36 .
2003 107 47,143 . 38 .
2004 109 50,237 . 41 .
2005 112 53,392 . 40 .
2006 111 55,421 . 42 .
2007 127 57,798 . 40 .
2008 121 58,075 . 39 .
2009 135 57,333 . 38 .
2010 144 59,617 . 38 .
2011 147 61,875 . 37 .
2012 157 60,449 . 34 .
2013 . 62,161 . . .
2014 . 64,738 . . .
2015 178 66,619 . 35 .
2016 186 69,009 . 35 .

Institute for Policy & Social Research, The University of Kansas, Lawrence, KS 66045 (email: [email protected]) 12/21/2017
County: county value. Kansas: state value. County Rank: highest county value ranked #1. ($000): thousands of dollars. Nonmetro Kansas: Kansas total lessMetropolitan Areas as defined by the Office of Management and Budget (OMB; released 2/28/2013). Per 1000: For nonmoney amounts, Per 1000=(countyvalue / county population for the same year as the data) x 1000. $ Per capita=(county value / county population for the same year as the data). Value= . indicatesmissing or suppressed data or value not calculated.
Kansas County Profile Clay County, Kansas Page 53 of 70
Employment
2000 2005 2010 2015
BEA EMPLOYMENT: PROFESSIONALAND TECHNICAL SERVICES
U.S. Bureau of Economic Analysis,Regional Economic Information System(REIS)
Year CountyState ofKansas
NonMetro
KansasCountyRank
Per 1000or $ PerCapita
2001 105 81,396 . 44 .
2002 114 80,725 . 40 .
2003 130 80,376 . 32 .
2004 123 85,697 . 36 .
2005 118 85,164 . 41 .
2006 120 87,579 . 41 .
2007 131 92,935 . 39 .
2008 119 95,660 . 45 .
2009 137 93,647 . 39 .
2010 125 93,122 . 42 .
2011 143 93,374 . 40 .
2012 144 95,412 . 41 .
2013 143 100,834 . 41 .
2014 138 102,277 . 44 .
2015 133 105,661 . 44 .
2016 136 110,201 . 43 .
BEA EMPLOYMENT: MANAGEMENTOF COMPANIES AND ENTERPRISES
U.S. Bureau of Economic Analysis,Regional Economic Information System(REIS)
Year CountyState ofKansas
NonMetro
KansasCountyRank
Per 1000or $ PerCapita
2001 . 13,832 . . .
2002 . 12,588 . . .
2003 . 11,142 . . .
2004 . 10,611 . . .
2005 . 11,819 . . .
2006 . 13,060 . . .
2007 . 13,398 . . .
2008 . 15,241 . . .
2009 . 14,855 . . .
2010 . 16,586 . . .
2011 . 15,342 . . .
2012 . 15,082 . . .
2013 . 16,668 . . .
2014 . 20,437 . . .
2015 . 29,607 . . .
2016 . 26,750 . . .

Institute for Policy & Social Research, The University of Kansas, Lawrence, KS 66045 (email: [email protected]) 12/21/2017
County: county value. Kansas: state value. County Rank: highest county value ranked #1. ($000): thousands of dollars. Nonmetro Kansas: Kansas total lessMetropolitan Areas as defined by the Office of Management and Budget (OMB; released 2/28/2013). Per 1000: For nonmoney amounts, Per 1000=(countyvalue / county population for the same year as the data) x 1000. $ Per capita=(county value / county population for the same year as the data). Value= . indicatesmissing or suppressed data or value not calculated.
Kansas County Profile Clay County, Kansas Page 54 of 70
Employment
BEA EMPLOYMENT:ADMINISTRATIVE AND WASTESERVICES
U.S. Bureau of Economic Analysis,Regional Economic Information System(REIS)
Year CountyState ofKansas
NonMetro
KansasCountyRank
Per 1000or $ PerCapita
2001 . 81,573 . . .
2002 . 83,017 . . .
2003 . 81,346 . . .
2004 . 85,787 . . .
2005 . 90,038 . . .
2006 . 93,810 . . .
2007 . 99,022 . . .
2008 . 97,654 . . .
2009 . 92,750 . . .
2010 . 93,730 . . .
2011 . 98,057 . . .
2012 . 100,511 . . .
2013 . 104,729 . . .
2014 . 107,265 . . .
2015 . 103,484 . . .
2016 . 102,252 . . .
2000 2005 2010 2015
BEA EMPLOYMENT: EDUCATIONALSERVICES
U.S. Bureau of Economic Analysis,Regional Economic Information System(REIS)
Year CountyState ofKansas
NonMetro
KansasCountyRank
Per 1000or $ PerCapita
2001 . 21,169 . . .
2002 . 22,240 . . .
2003 . 22,657 . . .
2004 . 21,746 . . .
2005 10 22,191 . 36 .
2006 10 22,511 . 35 .
2007 . 23,717 . . .
2008 . 24,658 . . .
2009 . 25,134 . . .
2010 . 26,073 . . .
2011 . 26,089 . . .
2012 . 26,624 . . .
2013 . 27,450 . . .
2014 . 28,811 . . .
2015 . 28,899 . . .
2016 . 29,233 . . .

Institute for Policy & Social Research, The University of Kansas, Lawrence, KS 66045 (email: [email protected]) 12/21/2017
County: county value. Kansas: state value. County Rank: highest county value ranked #1. ($000): thousands of dollars. Nonmetro Kansas: Kansas total lessMetropolitan Areas as defined by the Office of Management and Budget (OMB; released 2/28/2013). Per 1000: For nonmoney amounts, Per 1000=(countyvalue / county population for the same year as the data) x 1000. $ Per capita=(county value / county population for the same year as the data). Value= . indicatesmissing or suppressed data or value not calculated.
Kansas County Profile Clay County, Kansas Page 55 of 70
Employment
2000 2005 2010 2015
BEA EMPLOYMENT: HEALTH CAREAND SOCIAL ASSISTANCE
U.S. Bureau of Economic Analysis,Regional Economic Information System(REIS)
Year CountyState ofKansas
NonMetro
KansasCountyRank
Per 1000or $ PerCapita
2001 401 165,415 . 25 .
2002 402 168,345 . 26 .
2003 469 169,842 . 28 .
2004 489 172,987 . 28 .
2005 486 174,222 . 24 .
2006 516 177,097 . 22 .
2007 521 182,432 . 22 .
2008 . 186,496 . . .
2009 . 189,034 . . .
2010 . 188,582 . . .
2011 . 190,957 . . .
2012 . 193,154 . . .
2013 . 193,744 . . .
2014 . 194,924 . . .
2015 . 200,001 . . .
2016 . 202,627 . . .
2000 2005 2010 2015
BEA EMPLOYMENT: ARTS,ENTERTAINMENT, ANDRECREATION
U.S. Bureau of Economic Analysis,Regional Economic Information System(REIS)
Year CountyState ofKansas
NonMetro
KansasCountyRank
Per 1000or $ PerCapita
2001 . 25,012 . . .
2002 . 25,672 . . .
2003 . 24,124 . . .
2004 46 25,367 . 39 .
2005 43 26,092 . 40 .
2006 . 26,525 . . .
2007 . 27,528 . . .
2008 45 27,542 . 38 .
2009 41 27,258 . 40 .
2010 38 27,491 . 42 .
2011 36 28,500 . 42 .
2012 40 30,746 . 42 .
2013 . 31,079 . . .
2014 . 32,153 . . .
2015 41 31,173 . 39 .
2016 40 31,762 . 39 .

Institute for Policy & Social Research, The University of Kansas, Lawrence, KS 66045 (email: [email protected]) 12/21/2017
County: county value. Kansas: state value. County Rank: highest county value ranked #1. ($000): thousands of dollars. Nonmetro Kansas: Kansas total lessMetropolitan Areas as defined by the Office of Management and Budget (OMB; released 2/28/2013). Per 1000: For nonmoney amounts, Per 1000=(countyvalue / county population for the same year as the data) x 1000. $ Per capita=(county value / county population for the same year as the data). Value= . indicatesmissing or suppressed data or value not calculated.
Kansas County Profile Clay County, Kansas Page 56 of 70
Employment
2000 2005 2010 2015
BEA EMPLOYMENT: GOVERNMENTAND GOVERNMENT ENTERPRISES
U.S. Bureau of Economic Analysis,Regional Economic Information System(REIS)
Year CountyState ofKansas
NonMetro
KansasCountyRank
Per 1000or $ PerCapita
2001 931 282,293 116,967 50 .
2002 931 286,402 118,539 50 .
2003 932 287,078 118,640 51 .
2004 941 283,826 118,630 50 .
2005 980 282,756 117,233 47 .
2006 981 288,273 120,371 49 .
2007 1,003 294,369 123,890 47 .
2008 1,040 298,468 125,363 45 .
2009 1,040 300,412 126,045 45 .
2010 1,006 303,741 127,669 47 .
2011 999 299,801 126,058 46 .
2012 972 297,919 125,633 47 .
2013 973 297,588 124,398 47 .
2014 987 296,592 123,301 44 .
2015 961 295,266 122,084 47 .
2016 987 292,109 119,664 46 .
2000 2005 2010 2015
BEA EMPLOYMENT:ACCOMMODATION AND FOODSERVICES
U.S. Bureau of Economic Analysis,Regional Economic Information System(REIS)
Year CountyState ofKansas
NonMetro
KansasCountyRank
Per 1000or $ PerCapita
2001 . 103,353 . . .
2002 . 103,743 . . .
2003 . 105,238 . . .
2004 177 106,838 . 48 .
2005 194 107,483 . 46 .
2006 . 110,109 . . .
2007 . 111,150 . . .
2008 176 111,457 . 45 .
2009 189 109,861 . 44 .
2010 166 108,738 . 40 .
2011 144 110,653 . 46 .
2012 161 112,631 . 43 .
2013 . 114,162 . . .
2014 . 115,840 . . .
2015 154 118,569 . 41 .
2016 148 120,111 . 44 .

Institute for Policy & Social Research, The University of Kansas, Lawrence, KS 66045 (email: [email protected]) 12/21/2017
County: county value. Kansas: state value. County Rank: highest county value ranked #1. ($000): thousands of dollars. Nonmetro Kansas: Kansas total lessMetropolitan Areas as defined by the Office of Management and Budget (OMB; released 2/28/2013). Per 1000: For nonmoney amounts, Per 1000=(countyvalue / county population for the same year as the data) x 1000. $ Per capita=(county value / county population for the same year as the data). Value= . indicatesmissing or suppressed data or value not calculated.
Kansas County Profile Clay County, Kansas Page 57 of 70
Employment
2000 2005 2010 2015
BEA EMPLOYMENT: OTHERSERVICES, EXCEPT PUBLICADMINISTRATION
U.S. Bureau of Economic Analysis,Regional Economic Information System(REIS)
Year CountyState ofKansas
NonMetro
KansasCountyRank
Per 1000or $ PerCapita
2001 261 92,177 . 49 .
2002 279 95,477 . 47 .
2003 266 96,082 33,030 50 .
2004 273 95,958 . 48 .
2005 263 96,384 33,352 50 .
2006 263 96,719 . 48 .
2007 263 98,902 . 47 .
2008 261 97,319 . 48 .
2009 248 96,462 . 49 .
2010 236 93,602 . 49 .
2011 250 95,245 . 45 .
2012 242 95,270 . 48 .
2013 251 95,613 . 50 .
2014 258 97,979 . 49 .
2015 268 98,154 . 44 .
2016 271 99,400 . 44 .
Income
1995 2005 2015
BEA PER CAPITA PERSONALINCOME ($)
U.S. Bureau of Economic Analysis,Regional Economic Information System(REIS)
Year CountyState ofKansas
NonMetro
KansasCountyRank
Per 1000or $ PerCapita
1995 20,312 22,358 19,117 29 .
1996 22,987 23,703 20,477 21 .
1997 23,556 24,986 21,462 24 .
1998 24,006 26,321 22,298 37 .
1999 24,285 27,032 22,686 40 .
2000 25,155 28,404 23,371 33 .
2001 24,457 29,268 24,685 71 .
2002 24,360 29,385 24,459 55 .
2003 26,995 30,147 26,013 48 .
2004 29,657 30,669 26,610 17 .
2005 30,822 32,268 28,123 29 .
2006 32,934 35,353 29,580 17 .
2007 35,947 37,865 32,030 25 .
2008 41,489 41,179 35,372 20 .
2009 41,027 39,204 34,057 14 .
2010 43,807 39,206 35,437 18 .
2011 46,219 42,521 39,255 32 .
2012 46,247 44,811 39,779 36 .
2013 48,852 45,867 42,114 35 .
2014 47,245 46,568 41,334 31 .
2015 46,854 46,994 41,236 27 .
2016 48,449 47,228 41,625 25 .

Institute for Policy & Social Research, The University of Kansas, Lawrence, KS 66045 (email: [email protected]) 12/21/2017
County: county value. Kansas: state value. County Rank: highest county value ranked #1. ($000): thousands of dollars. Nonmetro Kansas: Kansas total lessMetropolitan Areas as defined by the Office of Management and Budget (OMB; released 2/28/2013). Per 1000: For nonmoney amounts, Per 1000=(countyvalue / county population for the same year as the data) x 1000. $ Per capita=(county value / county population for the same year as the data). Value= . indicatesmissing or suppressed data or value not calculated.
Kansas County Profile Clay County, Kansas Page 58 of 70
Income
1995 2005 2015
SOURCES OF PERSONAL INCOME:TOTAL PERSONAL INCOME ($000)
U.S. Bureau of Economic Analysis,Regional Economic Information System(REIS)
Year CountyState ofKansas
NonMetro
KansasCountyRank
Per 1000or $ PerCapita
1995 185,979 58,154,336 18,755,990 43 20,312.3
1996 210,657 61,972,792 20,054,601 43 22,987.5
1997 212,124 65,844,794 21,019,340 43 23,556.2
1998 213,776 70,029,330 21,856,818 43 24,006.3
1999 214,409 72,401,435 22,237,595 45 24,284.6
2000 222,040 76,512,050 22,865,596 44 25,168.9
2001 213,512 79,087,763 23,989,732 48 24,457.3
2002 209,666 79,737,565 23,607,546 47 24,359.9
2003 229,265 82,089,882 24,984,699 45 26,994.6
2004 250,509 83,860,092 25,447,910 44 29,656.6
2005 260,265 88,583,966 26,764,476 44 30,822.5
2006 278,559 97,677,245 28,053,520 44 32,934.4
2007 306,521 105,406,658 30,351,454 42 35,947.1
2008 357,556 115,633,816 33,554,554 41 41,489.4
2009 348,726 111,052,352 32,368,154 41 41,026.6
2010 374,159 112,083,904 33,934,322 39 43,838.2
2011 393,464 122,014,751 37,511,290 43 46,219.2
2012 393,466 129,292,297 38,038,692 44 46,246.6
2013 410,409 132,683,659 40,111,396 45 48,852.4
2014 393,929 135,017,710 39,158,074 45 47,245.0
2015 390,759 136,598,008 38,869,160 45 46,853.6
2016 394,520 137,305,437 38,895,971 45 48,449.0

Institute for Policy & Social Research, The University of Kansas, Lawrence, KS 66045 (email: [email protected]) 12/21/2017
County: county value. Kansas: state value. County Rank: highest county value ranked #1. ($000): thousands of dollars. Nonmetro Kansas: Kansas total lessMetropolitan Areas as defined by the Office of Management and Budget (OMB; released 2/28/2013). Per 1000: For nonmoney amounts, Per 1000=(countyvalue / county population for the same year as the data) x 1000. $ Per capita=(county value / county population for the same year as the data). Value= . indicatesmissing or suppressed data or value not calculated.
Kansas County Profile Clay County, Kansas Page 59 of 70
Income
1995 2005 2015
SOURCES OF PERSONAL INCOME:WAGES AND SALARIES ($000)
U.S. Bureau of Economic Analysis,Regional Economic Information System(REIS)
Year CountyState ofKansas
NonMetro
KansasCountyRank
Per 1000or $ PerCapita
1995 51,990 30,336,720 8,739,176 51 5,678.2
1996 55,747 32,161,729 9,060,749 51 6,083.3
1997 59,534 34,582,641 9,518,034 51 6,611.2
1998 61,170 37,317,819 10,010,388 52 6,869.2
1999 63,493 39,438,463 10,325,791 51 7,191.4
2000 63,973 41,766,878 10,813,169 52 7,251.5
2001 64,696 43,269,734 11,092,551 51 7,410.8
2002 66,603 43,922,702 11,320,242 50 7,738.2
2003 68,916 44,528,950 11,569,173 50 8,114.4
2004 73,322 46,698,084 12,058,954 50 8,680.2
2005 77,479 48,529,288 12,382,842 50 9,175.6
2006 80,820 52,067,815 13,249,441 50 9,555.5
2007 87,329 55,404,970 14,279,950 50 10,241.5
2008 96,008 57,582,460 15,015,148 49 11,140.4
2009 92,062 55,603,680 14,645,336 50 10,830.8
2010 95,495 56,102,260 14,954,099 49 11,188.6
2011 96,518 58,121,170 15,500,154 50 11,337.7
2012 98,900 60,590,986 16,046,735 54 11,624.4
2013 99,629 61,872,549 16,287,765 54 11,859.2
2014 104,746 64,442,235 16,883,226 53 12,562.5
2015 104,612 66,672,484 16,973,483 51 12,543.4
2016 101,974 67,216,593 16,919,039 51 12,522.9

Institute for Policy & Social Research, The University of Kansas, Lawrence, KS 66045 (email: [email protected]) 12/21/2017
County: county value. Kansas: state value. County Rank: highest county value ranked #1. ($000): thousands of dollars. Nonmetro Kansas: Kansas total lessMetropolitan Areas as defined by the Office of Management and Budget (OMB; released 2/28/2013). Per 1000: For nonmoney amounts, Per 1000=(countyvalue / county population for the same year as the data) x 1000. $ Per capita=(county value / county population for the same year as the data). Value= . indicatesmissing or suppressed data or value not calculated.
Kansas County Profile Clay County, Kansas Page 60 of 70
Income
1995 2005 2015
SOURCES OF PERSONAL INCOME:PROPRIETORS-FARM ($000)
U.S. Bureau of Economic Analysis,Regional Economic Information System(REIS)
Year CountyState ofKansas
NonMetro
KansasCountyRank
Per 1000or $ PerCapita
1995 10,329 536,051 515,276 23 1,128.1
1996 29,285 1,230,217 1,045,561 8 3,195.7
1997 23,371 1,114,719 938,144 11 2,595.3
1998 14,128 966,637 911,032 29 1,586.5
1999 12,894 1,085,436 1,045,920 36 1,460.4
2000 6,228 668,539 672,583 47 706.0
2001 4,588 779,473 769,825 62 525.5
2002 -2,814 150,137 186,990 90 -326.9
2003 8,584 1,309,803 1,197,900 68 1,010.7
2004 15,763 1,190,232 954,049 24 1,866.1
2005 11,988 1,575,919 1,418,571 54 1,419.7
2006 8,373 770,704 636,715 40 990.0
2007 8,995 1,095,000 994,589 61 1,054.9
2008 29,473 1,756,207 1,504,609 13 3,419.9
2009 18,930 1,557,257 1,336,669 32 2,227.1
2010 25,729 2,046,492 1,901,748 26 3,014.5
2011 28,686 3,398,205 3,156,357 50 3,369.7
2012 22,386 2,582,318 2,314,086 45 2,631.2
2013 47,591 5,133,350 4,522,167 42 5,664.9
2014 26,643 2,853,455 2,590,858 36 3,195.4
2015 23,305 2,008,627 1,827,108 30 2,794.4
2016 25,769 2,021,374 1,791,675 30 3,164.6

Institute for Policy & Social Research, The University of Kansas, Lawrence, KS 66045 (email: [email protected]) 12/21/2017
County: county value. Kansas: state value. County Rank: highest county value ranked #1. ($000): thousands of dollars. Nonmetro Kansas: Kansas total lessMetropolitan Areas as defined by the Office of Management and Budget (OMB; released 2/28/2013). Per 1000: For nonmoney amounts, Per 1000=(countyvalue / county population for the same year as the data) x 1000. $ Per capita=(county value / county population for the same year as the data). Value= . indicatesmissing or suppressed data or value not calculated.
Kansas County Profile Clay County, Kansas Page 61 of 70
Income
1995 2005 2015
SOURCES OF PERSONAL INCOME:PROPRIETORS-NONFARM ($000)
U.S. Bureau of Economic Analysis,Regional Economic Information System(REIS)
Year CountyState ofKansas
NonMetro
KansasCountyRank
Per 1000or $ PerCapita
1995 19,739 4,060,986 1,484,778 33 2,155.9
1996 20,334 4,434,345 1,609,451 34 2,218.9
1997 20,065 4,747,460 1,812,220 40 2,228.2
1998 22,310 4,965,611 1,819,677 36 2,505.3
1999 22,065 4,929,968 1,723,423 33 2,499.2
2000 27,393 5,021,217 1,641,012 25 3,105.1
2001 13,858 5,123,658 1,914,500 55 1,587.4
2002 14,575 5,536,610 2,030,802 55 1,693.4
2003 14,513 5,326,430 1,954,132 56 1,708.8
2004 14,982 3,931,076 2,095,098 55 1,773.6
2005 14,529 4,648,671 2,230,507 61 1,720.6
2006 16,705 7,388,910 2,707,966 59 1,975.1
2007 15,349 7,481,818 2,557,949 61 1,800.0
2008 18,172 10,166,363 3,294,133 65 2,108.6
2009 18,452 9,593,694 3,011,756 60 2,170.8
2010 18,459 9,126,810 3,328,557 64 2,162.7
2011 18,655 11,337,195 3,967,147 70 2,191.4
2012 20,118 14,849,449 4,251,744 71 2,364.6
2013 19,740 15,492,769 4,261,741 73 2,349.7
2014 18,552 14,752,087 4,138,516 76 2,225.0
2015 19,450 13,965,723 4,075,936 71 2,332.1
2016 20,555 13,051,583 3,787,637 68 2,524.3
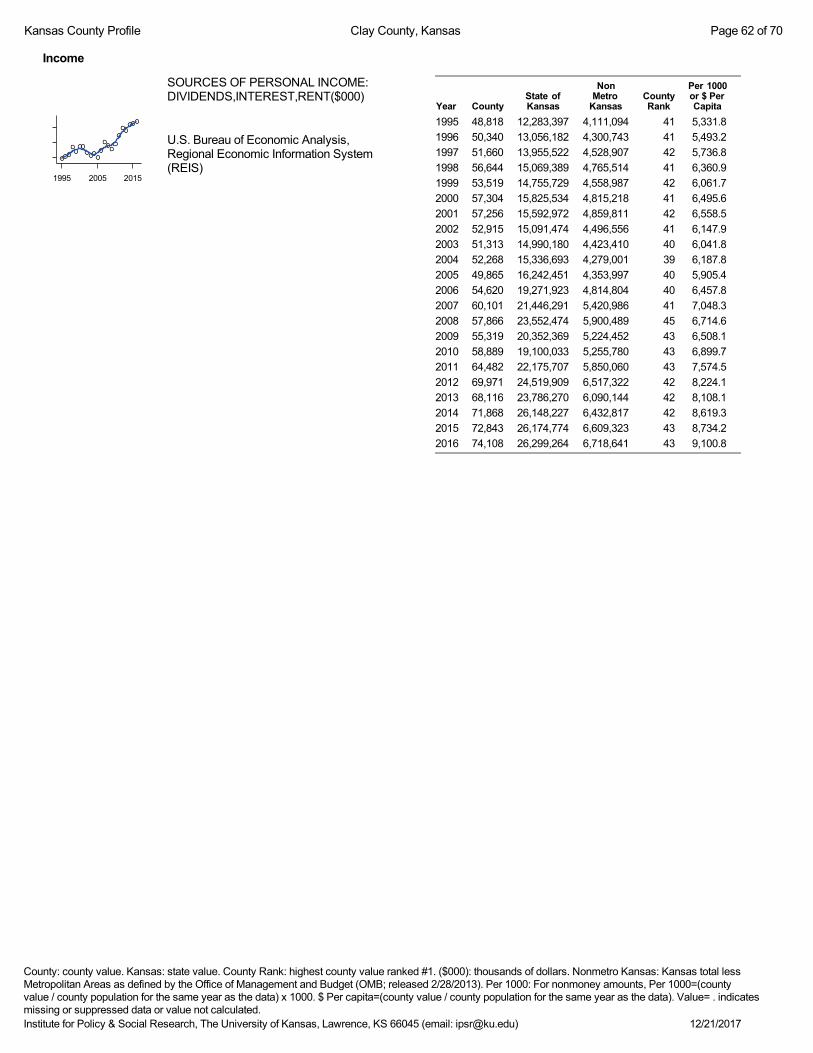
Institute for Policy & Social Research, The University of Kansas, Lawrence, KS 66045 (email: [email protected]) 12/21/2017
County: county value. Kansas: state value. County Rank: highest county value ranked #1. ($000): thousands of dollars. Nonmetro Kansas: Kansas total lessMetropolitan Areas as defined by the Office of Management and Budget (OMB; released 2/28/2013). Per 1000: For nonmoney amounts, Per 1000=(countyvalue / county population for the same year as the data) x 1000. $ Per capita=(county value / county population for the same year as the data). Value= . indicatesmissing or suppressed data or value not calculated.
Kansas County Profile Clay County, Kansas Page 62 of 70
Income
1995 2005 2015
SOURCES OF PERSONAL INCOME:DIVIDENDS,INTEREST,RENT($000)
U.S. Bureau of Economic Analysis,Regional Economic Information System(REIS)
Year CountyState ofKansas
NonMetro
KansasCountyRank
Per 1000or $ PerCapita
1995 48,818 12,283,397 4,111,094 41 5,331.8
1996 50,340 13,056,182 4,300,743 41 5,493.2
1997 51,660 13,955,522 4,528,907 42 5,736.8
1998 56,644 15,069,389 4,765,514 41 6,360.9
1999 53,519 14,755,729 4,558,987 42 6,061.7
2000 57,304 15,825,534 4,815,218 41 6,495.6
2001 57,256 15,592,972 4,859,811 42 6,558.5
2002 52,915 15,091,474 4,496,556 41 6,147.9
2003 51,313 14,990,180 4,423,410 40 6,041.8
2004 52,268 15,336,693 4,279,001 39 6,187.8
2005 49,865 16,242,451 4,353,997 40 5,905.4
2006 54,620 19,271,923 4,814,804 40 6,457.8
2007 60,101 21,446,291 5,420,986 41 7,048.3
2008 57,866 23,552,474 5,900,489 45 6,714.6
2009 55,319 20,352,369 5,224,452 43 6,508.1
2010 58,889 19,100,033 5,255,780 43 6,899.7
2011 64,482 22,175,707 5,850,060 43 7,574.5
2012 69,971 24,519,909 6,517,322 42 8,224.1
2013 68,116 23,786,270 6,090,144 42 8,108.1
2014 71,868 26,148,227 6,432,817 42 8,619.3
2015 72,843 26,174,774 6,609,323 43 8,734.2
2016 74,108 26,299,264 6,718,641 43 9,100.8

Institute for Policy & Social Research, The University of Kansas, Lawrence, KS 66045 (email: [email protected]) 12/21/2017
County: county value. Kansas: state value. County Rank: highest county value ranked #1. ($000): thousands of dollars. Nonmetro Kansas: Kansas total lessMetropolitan Areas as defined by the Office of Management and Budget (OMB; released 2/28/2013). Per 1000: For nonmoney amounts, Per 1000=(countyvalue / county population for the same year as the data) x 1000. $ Per capita=(county value / county population for the same year as the data). Value= . indicatesmissing or suppressed data or value not calculated.
Kansas County Profile Clay County, Kansas Page 63 of 70
Income
1995 2005 2015
SOURCES OF PERSONAL INCOME:TRANSFER PAYMENTS ($000)
U.S. Bureau of Economic Analysis,Regional Economic Information System(REIS)
Year CountyState ofKansas
NonMetro
KansasCountyRank
Per 1000or $ PerCapita
1995 31,767 7,752,389 3,350,524 48 3,469.5
1996 32,365 8,014,460 3,444,344 48 3,531.8
1997 33,740 8,409,892 3,603,814 48 3,746.8
1998 33,785 8,544,227 3,671,600 50 3,793.9
1999 34,309 8,902,161 3,812,664 51 3,885.9
2000 36,277 9,650,835 4,082,415 51 4,112.1
2001 40,363 10,549,298 4,407,858 49 4,623.5
2002 40,848 11,203,835 4,609,435 51 4,745.9
2003 42,320 11,709,430 4,765,114 50 4,982.9
2004 42,659 12,040,554 4,869,749 51 5,050.2
2005 46,453 12,682,434 5,127,960 50 5,501.3
2006 52,085 13,635,775 5,528,021 49 6,158.1
2007 55,664 14,667,271 5,852,430 48 6,528.0
2008 60,311 16,557,390 6,429,208 49 6,998.3
2009 62,164 18,019,784 6,905,011 50 7,313.4
2010 66,066 19,173,099 7,223,911 49 7,740.6
2011 68,674 19,630,001 7,403,325 48 8,067.0
2012 69,522 19,373,733 7,295,401 47 8,171.4
2013 70,237 19,660,435 7,339,337 48 8,360.6
2014 73,951 20,341,689 7,531,638 47 8,869.2
2015 75,238 21,266,488 7,815,041 47 9,021.3
2016 77,459 21,920,425 8,046,817 47 9,512.3

Institute for Policy & Social Research, The University of Kansas, Lawrence, KS 66045 (email: [email protected]) 12/21/2017
County: county value. Kansas: state value. County Rank: highest county value ranked #1. ($000): thousands of dollars. Nonmetro Kansas: Kansas total lessMetropolitan Areas as defined by the Office of Management and Budget (OMB; released 2/28/2013). Per 1000: For nonmoney amounts, Per 1000=(countyvalue / county population for the same year as the data) x 1000. $ Per capita=(county value / county population for the same year as the data). Value= . indicatesmissing or suppressed data or value not calculated.
Kansas County Profile Clay County, Kansas Page 64 of 70
Income
1995 2005 2015
SOURCES OF PERSONAL INCOME:LESS SOCIAL INSURANCE ($000)
U.S. Bureau of Economic Analysis,Regional Economic Information System(REIS)
Year CountyState ofKansas
NonMetro
KansasCountyRank
Per 1000or $ PerCapita
1995 10,092 5,091,029 1,499,200 50 1,102.2
1996 10,374 5,327,270 1,524,344 50 1,132.0
1997 10,822 5,697,015 1,596,507 51 1,201.8
1998 11,088 6,067,756 1,649,146 51 1,245.1
1999 11,404 6,342,550 1,682,913 52 1,291.7
2000 11,867 6,655,173 1,739,410 49 1,345.2
2001 11,168 6,869,934 1,821,955 51 1,279.3
2002 11,567 7,007,808 1,864,776 50 1,343.9
2003 12,107 7,172,007 1,916,633 50 1,425.5
2004 13,006 7,552,161 2,009,013 50 1,539.7
2005 13,932 7,906,311 2,094,677 50 1,649.9
2006 14,674 8,405,170 2,231,656 51 1,734.9
2007 15,509 8,801,746 2,352,157 52 1,818.8
2008 16,841 9,191,301 2,487,453 51 1,954.2
2009 16,400 8,995,216 2,457,565 50 1,929.4
2010 17,262 9,228,378 2,560,343 50 2,022.5
2011 15,369 8,512,072 2,364,272 50 1,805.4
2012 15,484 8,808,218 2,417,191 53 1,819.9
2013 17,656 10,204,440 2,765,660 54 2,101.7
2014 18,311 10,598,579 2,857,135 52 2,196.1
2015 18,372 11,044,023 2,904,611 52 2,202.9
2016 17,994 10,930,544 2,835,911 55 2,209.8
2010 2012 2014 2016
HUD MEDIAN FAMILY INCOME
U.S. Department of Housing and UrbanDevelopment (HUD)
Year CountyState ofKansas
NonMetro
KansasCountyRank
Per 1000or $ PerCapita
2010 52,200 63,100 . 53 .
2011 57,800 64,300 . 39 .
2012 58,600 65,200 . 39 .
2013 59,700 64,800 . 42 .
2014 57,700 64,400 . 52 .
2015 59,200 66,300 . 56 .
2016 58,700 66,700 . 51 .
2017 64,700 68,500 . 31 .
2010 2012 2014 2016
HUD 30% LOW-TO-MEDIUM INCOME(LMI) LIMIT - 4 PERSONS
U.S. Department of Housing and UrbanDevelopment (HUD)
Year CountyState ofKansas
NonMetro
KansasCountyRank
Per 1000or $ PerCapita
2010 15,850 . . 105 .
2011 16,600 . . 52 .
2012 17,450 . . 42 .
2013 17,900 . . 38 .
2014 23,850 . . 105 .
2015 24,250 . . 105 .
2016 24,300 . . 105 .
2017 24,600 . . 105 .
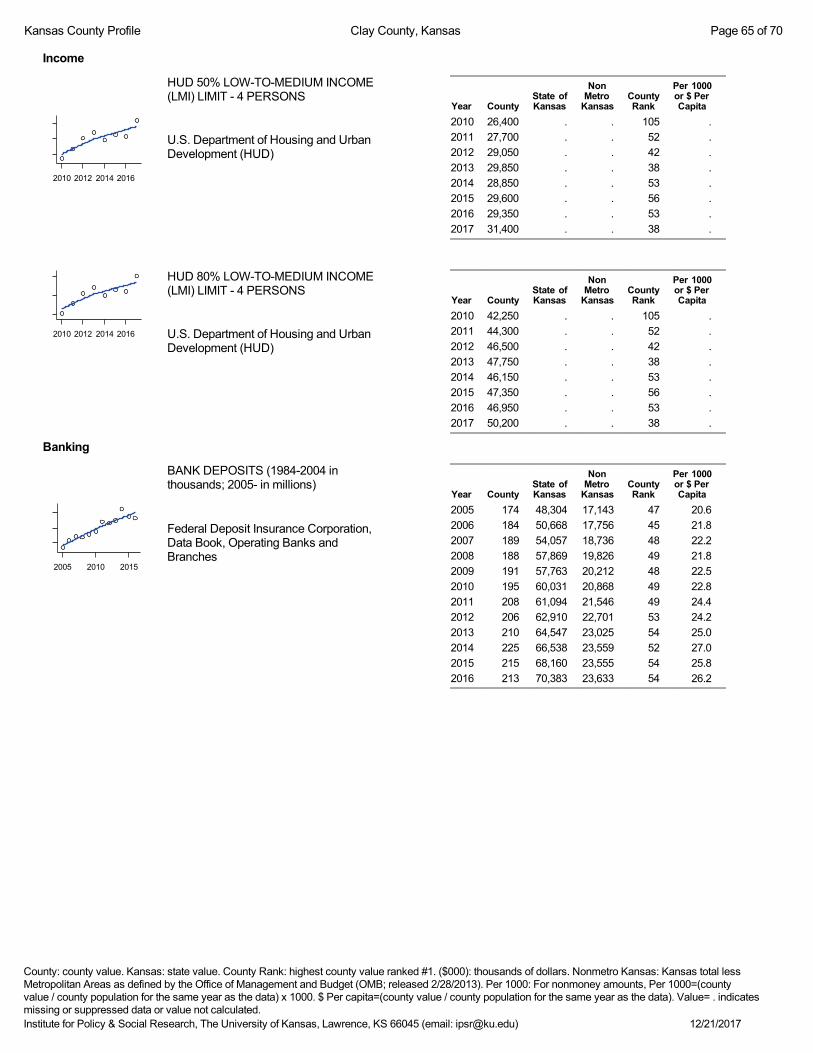
Institute for Policy & Social Research, The University of Kansas, Lawrence, KS 66045 (email: [email protected]) 12/21/2017
County: county value. Kansas: state value. County Rank: highest county value ranked #1. ($000): thousands of dollars. Nonmetro Kansas: Kansas total lessMetropolitan Areas as defined by the Office of Management and Budget (OMB; released 2/28/2013). Per 1000: For nonmoney amounts, Per 1000=(countyvalue / county population for the same year as the data) x 1000. $ Per capita=(county value / county population for the same year as the data). Value= . indicatesmissing or suppressed data or value not calculated.
Kansas County Profile Clay County, Kansas Page 65 of 70
Income
2010 2012 2014 2016
HUD 50% LOW-TO-MEDIUM INCOME(LMI) LIMIT - 4 PERSONS
U.S. Department of Housing and UrbanDevelopment (HUD)
Year CountyState ofKansas
NonMetro
KansasCountyRank
Per 1000or $ PerCapita
2010 26,400 . . 105 .
2011 27,700 . . 52 .
2012 29,050 . . 42 .
2013 29,850 . . 38 .
2014 28,850 . . 53 .
2015 29,600 . . 56 .
2016 29,350 . . 53 .
2017 31,400 . . 38 .
2010 2012 2014 2016
HUD 80% LOW-TO-MEDIUM INCOME(LMI) LIMIT - 4 PERSONS
U.S. Department of Housing and UrbanDevelopment (HUD)
Year CountyState ofKansas
NonMetro
KansasCountyRank
Per 1000or $ PerCapita
2010 42,250 . . 105 .
2011 44,300 . . 52 .
2012 46,500 . . 42 .
2013 47,750 . . 38 .
2014 46,150 . . 53 .
2015 47,350 . . 56 .
2016 46,950 . . 53 .
2017 50,200 . . 38 .
Banking
2005 2010 2015
BANK DEPOSITS (1984-2004 inthousands; 2005- in millions)
Federal Deposit Insurance Corporation,Data Book, Operating Banks andBranches
Year CountyState ofKansas
NonMetro
KansasCountyRank
Per 1000or $ PerCapita
2005 174 48,304 17,143 47 20.6
2006 184 50,668 17,756 45 21.8
2007 189 54,057 18,736 48 22.2
2008 188 57,869 19,826 49 21.8
2009 191 57,763 20,212 48 22.5
2010 195 60,031 20,868 49 22.8
2011 208 61,094 21,546 49 24.4
2012 206 62,910 22,701 53 24.2
2013 210 64,547 23,025 54 25.0
2014 225 66,538 23,559 52 27.0
2015 215 68,160 23,555 54 25.8
2016 213 70,383 23,633 54 26.2
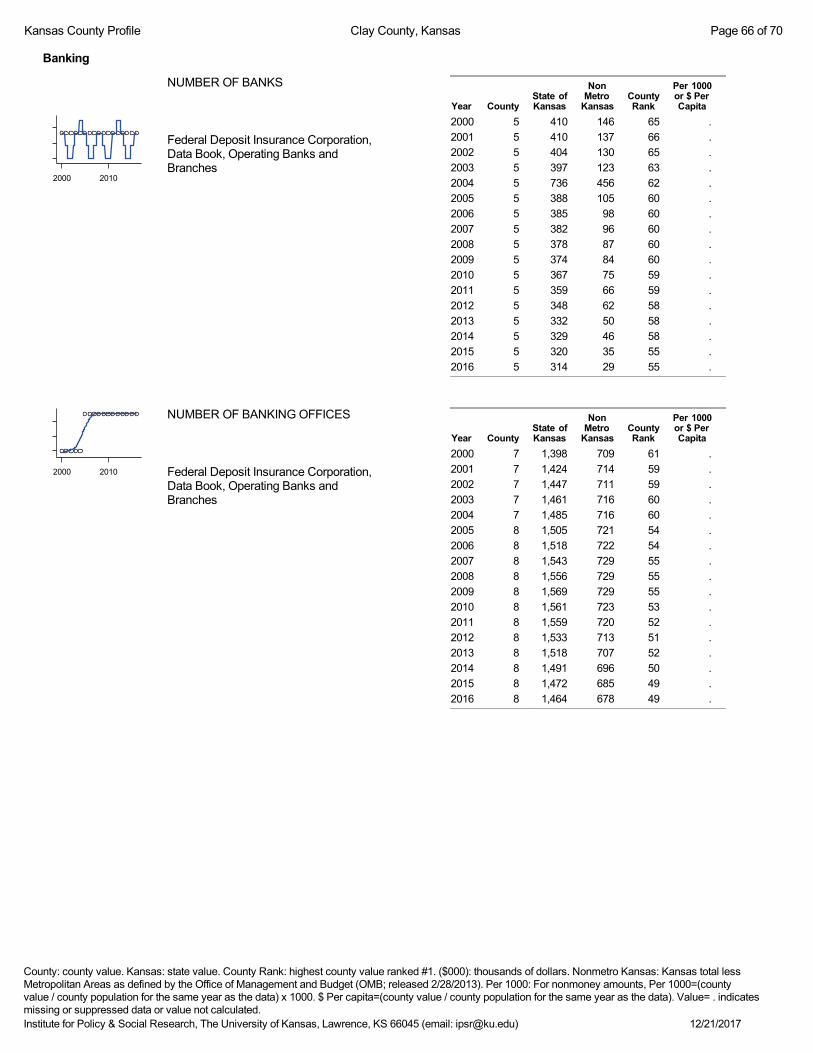
Institute for Policy & Social Research, The University of Kansas, Lawrence, KS 66045 (email: [email protected]) 12/21/2017
County: county value. Kansas: state value. County Rank: highest county value ranked #1. ($000): thousands of dollars. Nonmetro Kansas: Kansas total lessMetropolitan Areas as defined by the Office of Management and Budget (OMB; released 2/28/2013). Per 1000: For nonmoney amounts, Per 1000=(countyvalue / county population for the same year as the data) x 1000. $ Per capita=(county value / county population for the same year as the data). Value= . indicatesmissing or suppressed data or value not calculated.
Kansas County Profile Clay County, Kansas Page 66 of 70
Banking
2000 2010
NUMBER OF BANKS
Federal Deposit Insurance Corporation,Data Book, Operating Banks andBranches
Year CountyState ofKansas
NonMetro
KansasCountyRank
Per 1000or $ PerCapita
2000 5 410 146 65 .
2001 5 410 137 66 .
2002 5 404 130 65 .
2003 5 397 123 63 .
2004 5 736 456 62 .
2005 5 388 105 60 .
2006 5 385 98 60 .
2007 5 382 96 60 .
2008 5 378 87 60 .
2009 5 374 84 60 .
2010 5 367 75 59 .
2011 5 359 66 59 .
2012 5 348 62 58 .
2013 5 332 50 58 .
2014 5 329 46 58 .
2015 5 320 35 55 .
2016 5 314 29 55 .
2000 2010
NUMBER OF BANKING OFFICES
Federal Deposit Insurance Corporation,Data Book, Operating Banks andBranches
Year CountyState ofKansas
NonMetro
KansasCountyRank
Per 1000or $ PerCapita
2000 7 1,398 709 61 .
2001 7 1,424 714 59 .
2002 7 1,447 711 59 .
2003 7 1,461 716 60 .
2004 7 1,485 716 60 .
2005 8 1,505 721 54 .
2006 8 1,518 722 54 .
2007 8 1,543 729 55 .
2008 8 1,556 729 55 .
2009 8 1,569 729 55 .
2010 8 1,561 723 53 .
2011 8 1,559 720 52 .
2012 8 1,533 713 51 .
2013 8 1,518 707 52 .
2014 8 1,491 696 50 .
2015 8 1,472 685 49 .
2016 8 1,464 678 49 .

Institute for Policy & Social Research, The University of Kansas, Lawrence, KS 66045 (email: [email protected]) 12/21/2017
County: county value. Kansas: state value. County Rank: highest county value ranked #1. ($000): thousands of dollars. Nonmetro Kansas: Kansas total lessMetropolitan Areas as defined by the Office of Management and Budget (OMB; released 2/28/2013). Per 1000: For nonmoney amounts, Per 1000=(countyvalue / county population for the same year as the data) x 1000. $ Per capita=(county value / county population for the same year as the data). Value= . indicatesmissing or suppressed data or value not calculated.
Kansas County Profile Clay County, Kansas Page 67 of 70
Government
2007.5 2015.0
TANGIBLE ASSESSED VALUATION(KDoR, million$; 2006-)
Kansas Department of Revenue,Division of Property Valuation, StatisticalReport of Property Assessment andTaxation
Year CountyState ofKansas
NonMetro
KansasCountyRank
Per 1000or $ PerCapita
2006 66.3 28,964.3 10,354.3 67 7.8
2007 70.2 30,086.9 10,406.6 65 8.2
2008 74.5 31,000.3 10,943.1 64 8.6
2009 74.2 30,312.3 10,650.1 60 8.7
2010 74.7 29,450.2 10,265.0 62 8.8
2011 77.1 29,963.6 10,681.2 65 9.1
2012 81.5 30,382.9 10,996.5 62 9.6
2013 86.5 30,850.2 11,164.0 62 10.3
2014 89.9 31,783.0 11,509.3 63 10.8
2015 94.9 32,335.7 11,167.6 57 11.4
2016 99.6 33,156.3 11,028.2 50 12.2
1990 2000 2010
SALES TAX COLLECTIONS ($)
Kansas Department of Revenue
Year CountyState ofKansas
NonMetro
KansasCountyRank
Per 1000or $ PerCapita
1990 1,505,227 774,644,032 322,901,291 47 164,362.0
1991 1,609,234 813,200,448 348,677,002 47 178,012.6
1992 1,694,947 726,680,256 234,875,543 47 183,793.9
1993 2,061,462 937,521,920 296,141,081 47 225,370.3
1994 2,616,663 1,157,664,000 369,236,280 46 286,757.6
1995 2,628,834 1,212,060,160 386,456,981 47 287,116.0
1996 2,804,185 1,286,136,192 404,508,887 47 306,000.1
1997 2,862,744 1,354,385,664 417,767,713 47 317,906.1
1998 2,926,621 1,422,059,136 425,704,638 46 328,649.2
1999 3,090,179 1,452,454,656 423,545,768 45 350,003.3
2000 3,101,493 1,475,831,808 441,551,062 47 351,563.5
2001 2,916,113 1,481,026,688 434,871,136 47 334,033.6
2002 3,094,888 1,561,316,864 453,007,862 48 359,578.0
2003 3,168,112 1,626,782,976 471,668,008 48 373,026.3
2004 3,527,716 1,691,899,008 491,598,477 48 417,629.5
2005 3,370,260 1,744,980,352 508,788,053 50 399,130.7
2006 3,698,322 1,851,694,720 547,001,022 49 437,257.3
2007 3,957,135 1,917,546,752 574,948,931 49 464,071.1
2008 4,179,047 1,990,655,744 606,298,467 49 484,920.8
2009 3,955,046 1,866,223,078 565,475,017 49 465,299.5
2010 4,421,478 2,075,193,413 637,201,077 50 518,040.8
2011 4,838,257 2,347,193,367 723,576,813 51 568,337.5
2012 5,369,946 2,456,292,294 761,760,944 49 631,164.3
2013 5,008,725 2,489,204,048 767,684,555 54 596,205.8
2014 5,154,624 2,539,886,774 780,638,958 55 618,208.6
2015 5,159,756 2,642,374,740 771,874,734 50 618,675.7
2016 5,515,730 2,732,611,350 770,333,199 47 677,358.5
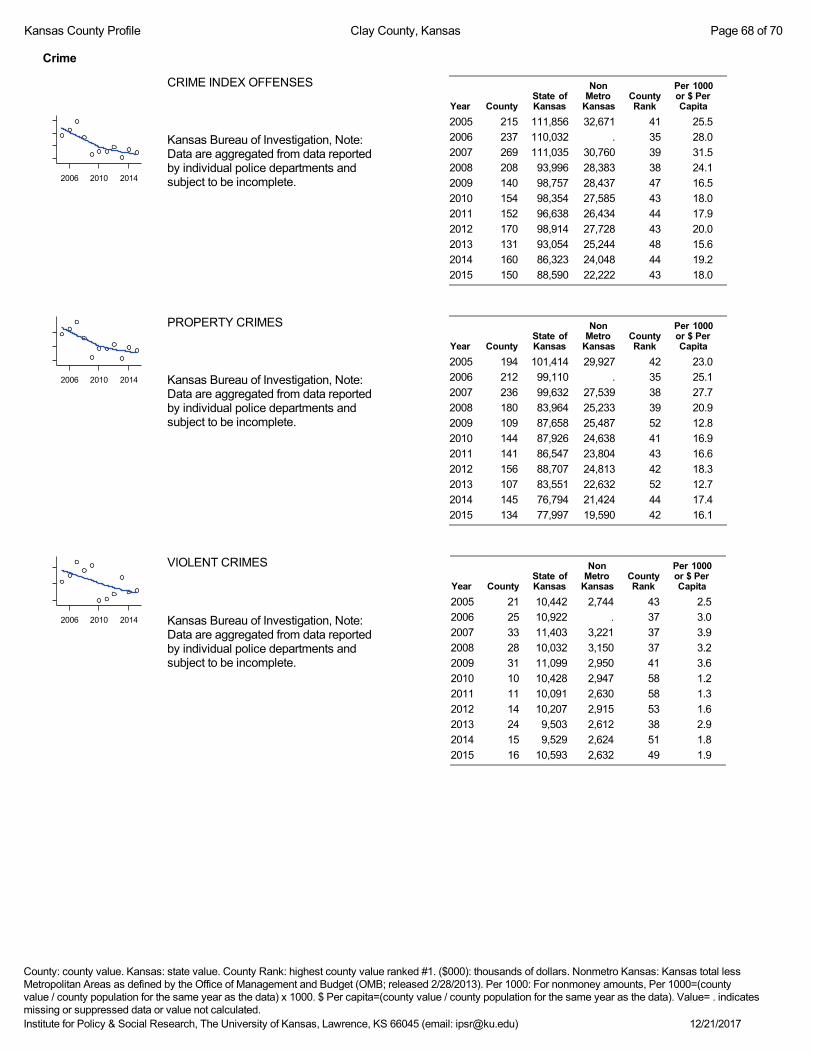
Institute for Policy & Social Research, The University of Kansas, Lawrence, KS 66045 (email: [email protected]) 12/21/2017
County: county value. Kansas: state value. County Rank: highest county value ranked #1. ($000): thousands of dollars. Nonmetro Kansas: Kansas total lessMetropolitan Areas as defined by the Office of Management and Budget (OMB; released 2/28/2013). Per 1000: For nonmoney amounts, Per 1000=(countyvalue / county population for the same year as the data) x 1000. $ Per capita=(county value / county population for the same year as the data). Value= . indicatesmissing or suppressed data or value not calculated.
Kansas County Profile Clay County, Kansas Page 68 of 70
Crime
2006 2010 2014
CRIME INDEX OFFENSES
Kansas Bureau of Investigation, Note:Data are aggregated from data reportedby individual police departments andsubject to be incomplete.
Year CountyState ofKansas
NonMetro
KansasCountyRank
Per 1000or $ PerCapita
2005 215 111,856 32,671 41 25.5
2006 237 110,032 . 35 28.0
2007 269 111,035 30,760 39 31.5
2008 208 93,996 28,383 38 24.1
2009 140 98,757 28,437 47 16.5
2010 154 98,354 27,585 43 18.0
2011 152 96,638 26,434 44 17.9
2012 170 98,914 27,728 43 20.0
2013 131 93,054 25,244 48 15.6
2014 160 86,323 24,048 44 19.2
2015 150 88,590 22,222 43 18.0
2006 2010 2014
PROPERTY CRIMES
Kansas Bureau of Investigation, Note:Data are aggregated from data reportedby individual police departments andsubject to be incomplete.
Year CountyState ofKansas
NonMetro
KansasCountyRank
Per 1000or $ PerCapita
2005 194 101,414 29,927 42 23.0
2006 212 99,110 . 35 25.1
2007 236 99,632 27,539 38 27.7
2008 180 83,964 25,233 39 20.9
2009 109 87,658 25,487 52 12.8
2010 144 87,926 24,638 41 16.9
2011 141 86,547 23,804 43 16.6
2012 156 88,707 24,813 42 18.3
2013 107 83,551 22,632 52 12.7
2014 145 76,794 21,424 44 17.4
2015 134 77,997 19,590 42 16.1
2006 2010 2014
VIOLENT CRIMES
Kansas Bureau of Investigation, Note:Data are aggregated from data reportedby individual police departments andsubject to be incomplete.
Year CountyState ofKansas
NonMetro
KansasCountyRank
Per 1000or $ PerCapita
2005 21 10,442 2,744 43 2.5
2006 25 10,922 . 37 3.0
2007 33 11,403 3,221 37 3.9
2008 28 10,032 3,150 37 3.2
2009 31 11,099 2,950 41 3.6
2010 10 10,428 2,947 58 1.2
2011 11 10,091 2,630 58 1.3
2012 14 10,207 2,915 53 1.6
2013 24 9,503 2,612 38 2.9
2014 15 9,529 2,624 51 1.8
2015 16 10,593 2,632 49 1.9

Institute for Policy & Social Research, The University of Kansas, Lawrence, KS 66045 (email: [email protected]) 12/21/2017
County: county value. Kansas: state value. County Rank: highest county value ranked #1. ($000): thousands of dollars. Nonmetro Kansas: Kansas total lessMetropolitan Areas as defined by the Office of Management and Budget (OMB; released 2/28/2013). Per 1000: For nonmoney amounts, Per 1000=(countyvalue / county population for the same year as the data) x 1000. $ Per capita=(county value / county population for the same year as the data). Value= . indicatesmissing or suppressed data or value not calculated.
Kansas County Profile Clay County, Kansas Page 69 of 70
Agriculture
2000 2005 2010
NUMBER OF FARMS
Kansas Agricultural Statistics, KansasFarm Facts
Year CountyState ofKansas
NonMetro
KansasCountyRank
Per 1000or $ PerCapita
1997 620 64,000 47,350 44 68.9
1998 600 65,000 48,290 44 67.4
1999 600 65,000 48,290 44 68.0
2000 580 64,000 47,500 46 65.7
2001 570 63,000 46,670 46 65.3
2002 570 63,000 46,670 46 66.2
2003 580 64,500 47,570 46 68.3
2004 580 64,500 47,570 46 68.7
2005 580 64,500 47,570 46 68.7
2006 570 64,000 47,070 46 67.4
2007 583 65,531 47,532 43 68.4
2012 541 61,773 45,085 45 63.6
2000 2005 2010
TOTAL ACRES HARVESTED
Kansas Agricultural Statistics, KansasFarm Facts
Year CountyState ofKansas
NonMetro
KansasCountyRank
Per 1000or $ PerCapita
1997 252,500 22,846,000 19,181,890 30 28,040.0
1998 247,200 22,143,500 18,708,130 32 27,759.7
1999 230,900 21,708,900 18,340,040 37 26,152.5
2000 226,610 21,639,000 18,313,340 40 25,686.9
2001 227,800 21,847,900 18,495,540 41 26,093.9
2002 220,720 20,230,400 16,878,370 33 25,644.2
2003 227,900 21,827,700 18,444,130 42 26,833.9
2004 228,310 20,876,900 17,514,970 35 27,028.5
2005 229,000 21,936,500 18,598,050 40 27,119.8
2006 223,700 21,412,700 18,070,400 40 26,448.3
2007 194,071 19,886,655 17,022,701 47 22,759.6
2012 209,664 21,043,596 17,750,237 45 24,643.2
2000 2005 2010
VALUE: LIVESTOCK AND POULTRY($000)
Kansas Agricultural Statistics, KansasFarm Facts
Year CountyState ofKansas
NonMetro
KansasCountyRank
Per 1000or $ PerCapita
1997 24,417 2,806,445 2,493,369 34 2,711.5
1998 19,325 2,670,432 2,371,235 47 2,170.1
1999 19,687 2,849,061 2,546,358 49 2,229.8
2000 20,955 2,901,469 2,601,622 44 2,375.3
2001 10,626 2,693,274 2,427,320 82 1,217.2
2007 31,121 9,525,971 . 60 3,649.7
2012 35,366 11,476,571 10,871,282 56 4,156.8

Institute for Policy & Social Research, The University of Kansas, Lawrence, KS 66045 (email: [email protected]) 12/21/2017
County: county value. Kansas: state value. County Rank: highest county value ranked #1. ($000): thousands of dollars. Nonmetro Kansas: Kansas total lessMetropolitan Areas as defined by the Office of Management and Budget (OMB; released 2/28/2013). Per 1000: For nonmoney amounts, Per 1000=(countyvalue / county population for the same year as the data) x 1000. $ Per capita=(county value / county population for the same year as the data). Value= . indicatesmissing or suppressed data or value not calculated.
Kansas County Profile Clay County, Kansas Page 70 of 70
Agriculture
2000 2005 2010
VALUE:FIELD CROPS ($000)EXCLUDING GOVERNMENTPROGRAM PAYMENTS
Kansas Agricultural Statistics, KansasFarm Facts
Year CountyState ofKansas
NonMetro
KansasCountyRank
Per 1000or $ PerCapita
1997 49,113 4,474,942 3,765,746 35 5,454.0
1998 39,994 3,594,319 3,101,461 35 4,491.2
1999 31,305 3,118,193 2,702,523 42 3,545.7
2000 22,957 2,915,660 2,518,540 52 2,602.2
2001 32,982 3,283,117 2,838,667 40 3,778.0
2002 29,965 3,011,855 2,533,782 42 3,481.5
2003 36,741 3,623,255 3,118,639 41 4,326.0
2004 40,117 3,445,688 2,870,199 33 4,749.3
2005 37,284 3,678,123 3,155,033 39 4,415.4
2006 50,043 4,308,716 3,645,054 38 5,916.6
2007 47,769 4,887,212 . 44 5,602.1
2012 80,502 6,983,993 5,983,653 31 9,461.9