institute of crop science & plant breeding i - geb...
TRANSCRIPT

Institute of Crop Science & Plant Breeding I
Head: Prof. Dr. Dr. h.c. W. Friedt
Identification and mapping of resistance genes against soil-borne viruses in
barley (Hordeum vulgare L.) and wheat (Triticum aestivum L.)
Inaugural Dissertation for the Achievement of the Degree
‘Doktor der Agrarwissenschaften’
at the Faculty of Agricultural and Nutritional Sciences, Home Economics and
Environmental Management
Justus-Liebig-University Gießen
Submitted by
Katrin Humbroich
from Nidda
Gießen, July 2007

Board of Examiners
Chairman of the Committee Prof. Dr. Steffen Hoy
1. Referee Prof. Dr. Dr. h.c. Wolfgang Friedt
2. Referee Prof. Dr. Wolfgang Köhler
Examiner Prof. Dr. Sylvia Schnell
Examiner Prof. Dr. Richard Marquard
Date of oral examination: 31.08.2007


Table of Contents
I
Table of Contents Table of Contents ...................................................................................................... I List of Figures.......................................................................................................... IV
List of Tables ........................................................................................................... VI List of Abbreviations.............................................................................................. VII 1 Introduction............................................................................................................ 1
2 Literature survey ................................................................................................... 2
2.1 Soil-borne viruses of cereals............................................................................. 2
2.1.1 The Barley yellow mosaic virus complex...................................................... 2
2.1.2 Soil-borne cereal mosaic virus disease ........................................................ 5
2.1.3 Wheat spindle streak mosaic virus disease.................................................. 6
2.2 Genetics of resistance....................................................................................... 7
2.2.1 Barley Yellow Mosaic Virus Complex ........................................................... 7
2.2.2 Soil-borne cereal mosaic virus ................................................................... 10
2.3 Molecular markers .......................................................................................... 12
2.3.1 DNA-based markers................................................................................... 12
2.3.1.1 Restriction Fragment Length Polymorphisms (RFLPs) ...................... 12
2.3.1.2 Random Amplified Polymorphic DNAs (RAPDs)................................ 13
2.3.1.3 Amplified Fragment Length Polymorphisms (AFLPs) ........................ 13
2.3.1.4 Simple Sequence Repeats (SSRs) .................................................... 14
2.3.1.5 Single Nucleotide Polymorphisms (SNPs) ......................................... 15
2.4 Application of molecular markers in plant breeding......................................... 17
2.4.1 Genetic linkage maps................................................................................. 17
2.4.2 Genetic diversity......................................................................................... 20
3 Material and Methods.......................................................................................... 23
3.1 Plant Material .................................................................................................. 23
3.1.1 Identification of new resistance resources of barley against the barley yellow
mosaic virus complex ....................................................................................... 23
3.1.2 Mapping populations used for the development of new PCR-based DNA
markers for resistance genes against BaMMV, BaYMV-1 and BaYMV-2......... 25
3.1.2.1 Mapping population 1 (MAP 1)........................................................... 25
3.1.2.2 Mapping population 2 (MAP 2)........................................................... 25
3.1.2.3 Mapping population 3 (MAP 3)........................................................... 25

Table of Contents
II
3.1.2.4 Mapping population 4 (MAP 4)........................................................... 25
3.1.2.5 Mapping population 5 (MAP 5)........................................................... 25
3.1.2.6. Mapping population 6 (MAP 6).......................................................... 26
3.1.2.7. Mapping population 7 (MAP 7).......................................................... 26
3.1.3 Wheat cultivars used for fingerprinting and studies on genetic diversity .... 26
3.2 Evaluation of virus resistance ......................................................................... 27
3.3 Molecular analysis .......................................................................................... 28
3.3.1 DNA extraction and measurement of DNA concentrations......................... 28
3.3.2 RAPD-analysis ........................................................................................... 30
3.3.3 Microsatellite-analysis ................................................................................ 32
3.3.4 AFLP-analysis ............................................................................................ 35
3.4 Bulked segregant analysis (BSA).................................................................... 38
3.5 Data analysis .................................................................................................. 39
3.5.1 Genetic mapping of BaMMV/BaYMV resistance loci.................................. 39
3.5.2 Estimation of genetic diversity and genetic relatedness ............................. 39
4 Results.................................................................................................................. 41
4.1 Screening of germplasms for the presence of rym4/rym5............................... 41
4.2 Identification and mapping of BaMMV resistance genes in different DH-
populations............................................................................................................ 43
4.2.1 Mapping the resistance gene of ‘Cebada’ (MAP 1) .................................... 43
4.2.2 Mapping the resistance gene of ‘Shimane Omugi’ (MAP 2) ....................... 43
4.2.3 Mapping the resistance gene of ‘CI 3517’ (MAP 3) .................................... 45
4.2.4 Mapping the resistance gene of ‘Belts 1823’ (MAP 4)................................ 47
4.2.5 Mapping the resistance gene of ‘Chikurin Ibaraki 1’ (MAP 5)..................... 47
4.2.6 Mapping the resistance gene of ‘Taihoku A’ (MAP 6)................................. 49
4.2.7 Mapping the resistance gene of ‘Muju covered 2’ (MAP 7) ........................ 51
4.3 Estimation of genetic relatedness of wheat cultivars and breeding lines......... 51
5 Discussion ........................................................................................................... 57
5.1 Identification of new resistance donors against barley yellow mosaic virus
disease ............................................................................................................. 57
5.2 Mapping of new resistance genes against Barley yellow mosaic virus ........... 58
5.2.1 Mapping resistance genes on chromosome 4H ......................................... 59
5.2.2 Mapping resistance genes on chromosome 6H ......................................... 63
5.3 Application of doubled haploids and molecular markers in plant breeding...... 66

Table of Contents
III
5.4 Wheat genetic diversity ................................................................................... 68
6 Summary .............................................................................................................. 72
7 Zusammenfassung.............................................................................................. 74
8 References ........................................................................................................... 79
9 Appendix .............................................................................................................. 97

List of Figures
IV
List of Figures
Figure 1: Results of screening 120 exotic barley accessions for the presence of
rym4/rym5 by the SSR marker Bmac0029 (banding pattern of selected
varieties)....................................................................................................41
Figure 2: Results of screening ‘Cebada’ for the presence of rym4/rym5 by the SSR
marker Bmac0029. ....................................................................................43
Figure 3: Partial map of chromosome 6H including the BaMMV-resistance of
‘Shimane Omugi’ ...................................................................................... 44
Figure 4: Partial map of barley chromosome 4H including the BaMMV resistance of
´CI 3517´ .................................................................................................. 46
Figure 5: Partial map of chromosome 6H including the resistance locus rym15 of
‘Chikurin Ibaraki 1’ .................................................................................... 48
Figure 6: Partial map of chromosome 4H including rym13 of ‘Taihoku A’ ................ 50
Figure 7: Partial map of barley chromosome 4H including the BaMMV resistance of
‘Muju covered 2’ ....................................................................................... 52
Figure 8: Dendrogram of 64 wheat cultivars and breeding lines based on UPGMA
cluster analysis of genetic diversity estimated on SSRs........................... 55
Figure 9: Dendrogram of 64 wheat cultivars and breeding lines based on UPGMA
cluster analysis of genetic diversity estimated on AFLPs ......................... 56
Figure 10: Genetic map of chromosome 4H including the BaMMV resistance of ‘CI
3517’ based on the analysis of 65 DH lines of the cross ‘CI 3517’ x ‘Reni’
(A) in comparison to the partial chromosome map of ‘IPK1’ and ‘IPK2’ with
the resistance gene rym11 (B, C, NISSAN-AZZOUZ et al. 2005) and the
barley consensus map (D, VARSHNEY et al. 2007) ................................ 60
Figure 11: Genetic map of chromosome 4HL with the resistance gene rym9 of
‘Bulgarian 347’ (A, WERNER et al. 2000b) in comparison with the genetic
map of chromosome 4HL with the resistance gene rym13 of ‘Taihoku A’
(B), the resistance gene rym8 of ‘10247’ (C, BAUER et al. 1997) and the
resistance gene rym12 of ‘Muju covered 2’ (D). ....................................... 62
Figure 12: Genetic map of barley chromosome 6H including the BaMMV resistance
gene rym15 of ‘Chikurin Ibaraki 1’ based on the analysis of 163 DH lines
derived from a ‘Chikurin Ibaraki 1’ x ‘Igri’ cross (A), 217 DH lines of a
‘Chikurin Ibaraki 1’ x ‘Plaisant’ cross (B) in comparison to the partial map of

List of Figures
V
the ‘Lina’ x ‘Hordeum spontaneum Canada Park’ map (C, RAMSAY et al.
2000), the barley consensus map of VARSHNEY et al. (2007, D) and to
the partial map of ‘Shimane Omugi’ (E).................................................... 65

List of Tables
VI
List of Tables
Table 1: Mapped resistance genes against barley yellow mosaic virus disease, their
source, resistance of donor and virus used for mapping (from Ordon et al.
2005, mod.). ............................................................................................... 9
Table 2: New resistance resources of barley against the BaYMV-complex.............. 23
Table 3: Selected wheat genotypes for fingerprinting............................................... 27
Table 4: Composition of buffers used for DNA extraction......................................... 29
Table 5: Solution for the determination of DNA concentrations. ............................... 30
Table 6: Reaction components of a 25 µl-PCR reaction for RAPD amplification. ..... 31
Table 7: Amplification cycles of the RAPD reaction.................................................. 31
Table 8: Composition of chemical products used for the RAPD analysis. ................ 31
Table 9: Compounds of the solutions and buffers used for gel electrophoresis........ 33
Table 10: Chromosomal localisation, PCR program and PCR recipe of all
polymorphic SSRs used for mapping in barley. ........................................ 34
Table 11: AFLP sequences for the +0/+1 pre-amplification. ..................................... 35
Table 12: Composition of the +0/+1 pre-amplification reaction mix. ......................... 36
Table 13: Amplification cycles of the +0/+1 analyses. .............................................. 36
Table 14: AFLP-sequences for the +3 amplification. ................................................ 37
Table 15: Composition of the +3 pre-amplification reaction mixes. .......................... 37
Table 16: Amplification cycles of the +3 amplification............................................... 38
Table 17: Screening of 120 gene bank accessions with the SSR marker Bmac0029.
................................................................................................................................. 42
Table 18: Chromosomal location, number of alleles and the PIC-values per locus for
40 wheat microsatellites. .......................................................................... 54

List of Abbreviations
VII
List of Abbreviations A adenine ACGM amplified consensus genetic markers AFLP amplified fragment length polymorphism BaMMV Barley mild mosaic virus BaMMV-Sil Barley mild mosaic virus strain found in Sillery, France BaYMV Barley yellow mosaic virus BaYMV-2 Barley yellow mosaic virus-2 BMELV Bundesministerium für Ernährung, Landwirtschaft und
Verbraucherschutz BSA bulked segregant analysis bp base pairs C cytosine CAPS cleaved amplified polymorphic sequences cDNA complementary DNA CIA Chloroform-Isoamylalcohol cM centiMorgan CTAB cetyltrimethylammonium bromide DArT Diversity Arrays Technology DAS-Elisa double antibody sandwich enzyme-linked immunosorbent
assay DGGE heteroduplex analysis by density gradient gel
electrophoresis DHPLC denaturing high-performance liquid chromatography DI diversity index DNA deoxyribonucleic acid dNTP deoxyribonucleotide EDTA ethylene diamine tetra-acetate e.g. for example ERAP Exon-Retrotransposon amplification polymorphism EST expressed sequence tags et al. et alii G guanine GS genetic similarity GST gene specific tags H’ Shannon-Weaver-Index ha hectare HCL hydrochloric acid i.e. id est ISSR Inter-simple sequence repeats LD linkage disequilibrium

List of Abbreviations
VIII
LOD logarithm of the odds value M molar MALDITOF Matrix Assisted Laser Desorption/Ionisation Time-of-Flight MAS marker-assisted selection min minute mio million mg milligram ml millilitre MgCl2 magnesium chloride NaOAc sodium acetate NH4OAc ammonium acetate Nlb nuclear inclusion protein b nm nanometre ORF open reading frame PAA polyacrylamide PCR polymerase chain reaction PIC polymorphic information content QTL quantitative trait loci RAPD random amplified polymorphic DNA RIL recombinant inbred lines RFLP restriction fragment length polymorphisms RGA Resistance gene analogues RNA ribonucleic acid rpm revolutions per minute s second SBCMV Soil-borne cereal mosaic virus SBRMV Soil-borne rye mosaic virus SBWMV Soil-borne wheat mosaic virus SCAR sequence characterised amplified region SFP single feature polymorphisms SMC simple matching coefficient SNP single nucleotide polymorphism SSR simple sequence repeats ssRNA single stranded ribonucleic acid STS sequence tag sites T thymine TBE Tris/Borat/EDTA-Puffer TE Tris-(hydroxylmethyl-)aminomethan TEMED tetremethylethylenediamide t-RNA transfer ribonucleic acid U unit UPGMA Unweighted paired group method using arithmetic
averages

List of Abbreviations
IX
USA United States of America USDA United States Department of Agriculture V volt VPg viral genome linked protein vs versus v/v volume /volume WSSMV Wheat spindle streak mosaic virus WYMV Wheat yellow mosaic virus µg microgram µl microlitre


Introduction
1
1 Introduction
Barley (Hordeum vulgare L.) and wheat (Triticum aestivum L.) are two of the most
important crop species. The worldwide acreage of wheat is first before rice maize and
barley: In 2006 the global production was estimated at about 622 million (mio) tonnes
of wheat and 138 mio tonnes of barley (USDA 2007). In Germany 3.12 mio hectares
(ha) of wheat were harvested and the area under barley cultivation accrued to 2.03
mio ha (BMELV 2007).
Due to the predicted growth of the world’s human population and the corresponding
increased global food demand, it is a continuing challenge to improve varieties of
crop plants, i.e. for disease resistance, to guarantee a stable harvest and yield
production parallel to the decreasing acreage under cultivation worldwide, i.e. for
barley in the last decades (USDA 2007). In spite of a permanent improvement of
resistance in barley and wheat they are still confronted with many viral, bacterial and
fungal pathogens, which cause significant damages and reduction in yield and quality
due to a co-evolutional adaptation of respective pathogens. In the last decades
several soil-borne virus diseases transmitted by the fungus Polymyxa graminis
became increasingly important in Europe as pathogens of cereals, particularly of
barley and wheat (HUTH 2002). These viruses are Barley yellow mosaic virus
(BaYMV), Barley mild mosaic virus, Soil-borne cereal mosaic virus (SBCMV) and
Wheat spindle streak mosaic virus (WSSMV), which cause high yield losses up to
80%. Therefore, because chemical treatments against Polymyxa graminis to prevent
high yield losses are neither efficient nor economic, it is of prime interest to produce
resistant varieties against these viral pathogens. The main objectives of the present
study were on one hand to screen exotic genetic resources of barley for resistance
and on the other hand to identify molecular markers for new resistance genes against
Barley yellow mosaic virus (BaYMV) by screening seven different DH populations.
With regard to wheat, the project aimed at the identification of sources of tolerance or
resistance to Soil-borne cereal mosaic virus (SBCMV) by field tests carried out in
France followed by genotyping of respective cultivars using EcoRI+3/MseI+3 AFLP
primer combinations and microsatellite markers in order to achieve information on the
genetic relatedness of resistant and susceptible cultivars and to identify SSR markers
suitable for mapping respective genes or quantitative trait loci (QTL).

Literature survey
2
2 Literature survey 2.1 Soil-borne viruses of cereals Several soil-borne viruses of cereals are known belonging to the plant virus family
Potyviridae. This family consists of six genera designated as Potyvirus, Ipomovirus,
Macluravirus, Rymovirus, Tritimovirus and Bymovirus (REVERS & CANDRESSE
2004, ADAMS et al. 2005). Besides this, there are the Furoviruses, a genus which is
not assigned to any specific family. Some of the most important viruses causing
serious diseases of cereals like the Barley yellow mosaic virus, Barley mild mosaic
virus, Wheat spindle streak mosaic virus, Oat mosaic virus, Wheat yellow mosaic
virus and Rice necrotic mosaic virus belong to the bymovirus group, that are all
transmitted by the fungus Polymyxa graminis (KANYUKA et al. 2003). Alike the
furoviruses, i.e. Soil-borne cereal mosaic virus, Soil-borne wheat mosaic virus and
Oat golden stripe virus, infect cereals via Polymyxa graminis (KANYUKA et al. 2003).
Besides Polymyxa graminis, a related fungal vector Polymyxa betae transmits the
furovirus beet necrotic yellow vein virus in sugar beets (RUSH 2003). All these
Polymyxa-transmitted viruses have in common that high yield losses and important
diseases are caused mainly in cereals (KANYUKA et al. 2003, ADAMS et al. 2004).
2.1.1 The Barley yellow mosaic virus complex In Japan the Barley yellow mosaic virus disease is already known since the 1940’s
and it is epidemic since the 1970’s (IKATA & KAWAI 1940, cited in INOUYE & SAITO
1975). After the first report in Germany in 1978 (HUTH & LESEMANN 1978) the
disease also occurred in several other European countries and in Eastern China
(HILL & EVANS 1980, LAPIERRE 1980, MAROQUIN et al. 1982, YILI & DENGDI
1983, LANGENBERG & VAN DER WAL 1986, FANTAKHUN et al. 1987, SIGNORET
& HUTH 1993, KATIS et al. 1997, ACHON et al. 2005). The typical yellow patches
appear in winter or early spring in the field as a result of the infection of roots in
autumn by the different strains of the Barley yellow mosaic virus disease. The
symptoms are mosaic pale green or yellow discolorations mostly on the youngest
leaves. Sometimes infected plants show complete yellowing with necrotic patches
and a stunted growth. Affected plants show fewer tillers, less reduction in grain yield

Literature survey
3
and grain size may be inhomogeneous. The severity of symptoms depends on the
barley cultivar and the environmental conditions in autumn during the infection and in
winter during the reproduction and spread of the virus within the plants. In general
symptoms become less obvious with increasing temperatures and plant growth.
Upper leaves are often free of symptoms. Typically, the symptoms appear in the
newly emerging leaves when plants begin to grow again after a cold period in winter.
This seems to be related to a temporary reversal of the major direction of phloem
transport (SCHENK et al. 1995). Until now, the manner of virus movement has not
been determined but virus RNA and the coat protein can be detected in root cells
before symptoms appear in the leaves (PEERENBOOM et al. 1996). Barley yellow
mosaic virus survives within resting spores that remain within root debris after crop
harvest and can persist in soil for many years (HUTH 1991) even in the absence of a
suitable host (USUGI 1988). The inoculum mostly becomes distributed as resting
spores within soil or crop debris through soil cultivation and on machinery. Therefore,
existing infected patches in the field enlarge and new ones may easily emerge.
Resting spores may also spread by wind-blown soil particles and zoospores may
travel short distances in soil water (HILL & WALPOLE 1989). Spring-sown barley
normally does not develop symptoms of the disease in the field due to adverse
environmental conditions for virus reproduction and spread and the viruses do not
cause yield losses in spring barley. However, many spring barley cultivars turned out
to be susceptible in laboratory resistance tests.
In Europe, the Barley yellow mosaic virus disease is caused by a complex of at least
four viruses or virus strains, i.e. Barley mild mosaic virus (BaMMV), BaMMV-SIL
(named according to the village Sillery in France, where the strain was first detected),
Barley yellow mosaic virus (BaYMV-1), and BaYMV-2 (HUTH 1989, HARIRI et al.
2003), infecting barley individually or in combinations. BaYMV-2 was detected in
Germany (HUTH 1989), in the United Kingdom (BEATON 1989), Belgium and France
(HARIRI et al. 1990). A new strain similar to BaMMV-SIL and BaMMV has just
recently been detected in Germany (HUTH et al. 2005, HABEKUSS et al. 2006). An
even more complex situation is present in Japan where seven strains of BaYMV and
two strains of BaMMV have been described (NOMURA et al. 1996). In Korea a strain
biologically and serologically different from BaMMV strains known in Germany and
Japan has been detected and several different strains have also been discovered in
China (CHEN et al. 1996, LEE et al. 1996, LEE et al. 2006). Due to transmission by

Literature survey
4
the widespread soil-borne fungus P. graminis growing of resistant barley cultivars
has to be considered as the only effective means to avoid high yield losses caused
by BaMMV, BaMMV-SIL, BaYMV and BaYMV-2.
The viruses of this complex have a quite narrow natural host range limited to the
Poaceae. The natural host is barley (Hordeum ssp.) but successful transmission by
mechanical inoculation to Aegilops (PROESELER 1988), Eremopyrum, Lagurus
(ADAMS 2004), Triticosecale (KEGLER et al. 1985), Secale (ORDON et al. 1992)
and Triticum durum L. (PROESELER 1993) has been carried out.
The whole genus Bymovirus, family Potyviridae, is a well-defined group of viruses
that resemble the aphid-transmitted potyviruses and other members of the family in
having flexuous filamentous particles (12-13 diameters) with modal lengths of 270
and 568 nm causing pin wheel inclusions in infected cells (KANYUKA et al. 2003).
The members have bipartite single stranded (ss) RNA genomes with a genome
linked protein (VPg) at the 5’terminus. Each segment carries a single open reading
frame (ORF) which encodes a polyprotein that is cleaved into functional proteins by
virus-encoded proteases. The coding sequence of the coat protein is located in the
C-terminus of the larger RNA1 polyprotein (KANYUKA et al. 2004a). Both RNA
species are needed for infection (KASHIWASAKI 1996). BaMMV causes similar
symptoms like BaYMV but the two viruses are serologically unrelated and their
polyproteins share only about 36% identical amino acids (SCHLICHTER et al. 1993).
Regarding these differences, serological methods or sequence tests are used to
discern both viruses. BaYMV-2, a strain which is able to infect cultivars carrying the
resistance gene rym4 (see below chapter 2.2.1), is very closely related to BaYMV.
The strains do not differ in the coding sequence of the coat protein and no diagnostic
serological methods have been reported to distinguish them (HUTH & ADAMS 1990).
The French BaMMV-SIL isolate is the only European BaMMV isolate able to infect
barley cultivars with the rym5 gene (see chapter 2.2.1, HARIRI et al. 2003). It is very
similar to the BaMMV strain with only five amino acid exchanges consistently
different between BaMMV and BaMMV-SIL. Two of these exchanges are in the viral
genome linked protein (VPg) cistron and in the nuclear inclusion protein b (NIb)
cistron region, respectively and seem to be functionally important (KANYUKA et al.
2004a).

Literature survey
5
2.1.2 Soil-borne cereal mosaic virus disease Soil-borne wheat mosaic virus (SBWMV) is a member of the genus Furovirus which
is also transmitted by the fungus Polymyxa graminis. Due to its high persistence the
virus causes yield losses in winter wheat in many areas of the world, especially in the
central and eastern part of the United States of America. SBWMV was first detected
in 1919 in the USA (MCKINNNEY 1925) and furoviruses causing similar diseases in
wheat and rye were later also found in Japan, China (DIAO et al. 1999), Italy
(RUBIES-AUTONELL & VALLEGA 1990), France (LAPIERRE et al. 1985), UK
(CLOVER et al. 1999a, CLOVER et al. 2001, BUDGE & HENRY 2002), several
African countries (KAPOORIA et al. 2000), Belgium (VAIANOPOULOS et al. 2005)
and in Germany (KOENIG et al. 1999). These isolates were thought to belong to the
same SBWMV species, but it turned out that the global population of furoviruses on
wheat consists of genetically divergent strains with a relatively high degree of
polymorphisms at the nucleotide and amino acid level. The American, Chinese,
European and Japanese isolates are now separately reclassified (KOENIG & HUTH
2000, SHIRAKO et al. 2000). The European virus isolate shares only 70% genome
identity with SBWMV from the USA and Japan (DIAO et al. 1999) and due to the
mainly infection of rye the name soil-borne rye mosaic virus was proposed in
Germany (KOENIG et al. 1999). The natural hosts of this virus are bread wheat,
durum wheat, rye, and triticale. In Germany, Poland and Denmark, the virus mainly
infects rye, whereas in the United Kingdom, Italy and France wheat is the
predominant host (HUTH 2002). Therefore, it was renamed as Soil-borne cereal
mosaic virus (SBCMV, KOENIG & HUTH 2000, YANG et al. 2001) in Germany and
Europe, respectively, which has recently been approved by the International
Committee on Taxonomy of Viruses. In 2002, severe damage in wheat due to a
furovirus infection was observed in a field near Heddesheim, Baden-Wuerttemberg,
Germany. As a result of sequencing the disease causing virus it turned out to be
closely related to the American strain of SBWMV. This was the first report of a type
strain of Soil-borne wheat mosaic virus in Europe (KOENIG & HUTH 2003).
Symptoms caused by SBCMV on susceptible cultivars in the field are a pale green-
yellow mosaic or streaks on the leaves and moderate to severe stunting. Young
leaves appear mottled and develop pale discolorations that cover both the leaf
lamina and the sheath (CLOVER et al. 2001, KASTIRR et al. 2004). The appearance
and severity of soil-borne mosaic virus symptoms on wheat may vary considerably
Literature survey
6
depending on the plant genotype, the concentration and aggressiveness of the virus
strain as well as the environmental conditions (BUDGE & HENRY 2002). Generally,
late planting in autumn is recommended to reduce the number of infected plants and
to minimise yield losses (HUTH 2002). All tolerant varieties are known to contain high
virus levels in the root system and no or low to moderate levels in the leaf tissue
(DRISKEL et al. 2002). Infected plants often occur in the field in circular patches of
varying size. In field samples SBCMV frequently occurs in mixed infections with the
bymovirus Wheat spindle streak mosaic virus (WSSMV) due to transmission of both
viruses via Polymyxa graminis (see chapter 2.1.3, HUTH 2002). The primary
zoospores of the vector penetrate root hairs or epidermal cells in autumn when there
is sufficient moisture and soil temperature and the SBCMV is subsequently
introduced into the host cytoplasm (KANYUKA et al. 2003). SBCMV consists of virus
particles with a bipartite genome. All particles are rod-shaped with modal length of
120 to 130 and 200 to 230 nm. The genome consists of two positive-sense ssRNAs,
with three open reading frames (ORFs, KOENIG et al. 1999) each. RNA1 and RNA2
have a cap structure at the 5’terminus and a tRNA-like structure at the 3’terminus.
Three different strains (-G, -O, -C) of SBCMV which only differ in their
aggressiveness (HUTH 2002) have been distinguished and showed after sequencing
more than 90% sequence identity (KOENIG et al. 1999). SBCMV can be
mechanically transmitted to several Poaceae like Bromus secalinus L., Chenopodium
quinoa Willd., Hordeum vulgare L., Secale cereale, Triticum aestivum, T. durum, T.
turgidum and Triticale (KASTIRR et al. 2004). Since virus-containing resting spores
of Polymyxa graminis persists in soil and crop debris for several decades, cultural
practises for virus control such as crop rotations or delayed planting are not effective,
whilst chemical control measures are unacceptable for ecological reasons.
2.1.3 Wheat spindle streak mosaic virus disease The appearance of Wheat spindle streak mosaic virus was reported for Africa,
Canada, the USA and several European countries (RUBIES-AUTONELL &
VALLEGA 1990, HAUFLER 1996, KAPOORIA & NDUNGURU 1998, CLOVER et al.
1999b, HUTH 2002, VAIANOPOULOS et al. 2006). The virus belongs to the
Bymoviruses such as Barley yellow mosaic virus, Barley mild mosaic virus, Oat
mosaic virus or Wheat yellow mosaic virus and is therefore also transmitted by the
soil-borne fungus Polymyxa graminis. The symptoms are similar to SBCMV. Infected

Literature survey
7
plants show yellow-to-light green streaks which occur in parallel to the leaf veins.
Besides the streaky symptoms fewer tillers are generated and the plants are dwarfed
resulting in yield reductions (HUTH 2002). Infection of the roots and symptom
expression are generally at temperatures between 5-17°C. Mixed infection with
SBCMV and WSSMV in fields is widespread (see chapter 2.1.2.1). Reportedly,
Wheat spindle streak mosaic virus reduces the level of field resistance to Soil-borne
cereal mosaic virus (CLOVER et al. 1999a). The natural host is winter wheat, durum
wheat, rye and triticale whereas some gramineous plants like Hordeum vulgare and
Avena sativa can not be infected by WSSMV. Like BaMMV/BaYMV, WSSMV has a
bipartite, positive ssRNA genome with two RNAs both encoding single polyproteins.
The function of the polyprotein of RNA1 is unknown whereas RNA2 encodes one
polyprotein, which is divided into two single proteins, i.e. P1 and P2. P2 is known to
be involved in fungal transmission (SOHN et al. 2004). Until now, no different
WSSMV strains have been detected.
2.2 Genetics of resistance 2.2.1 Barley Yellow Mosaic Virus Complex On the basis of intensive screening programmes, mainly with barley germplasms
derived from East Asia, resistance sources against the barley yellow mosaic virus
disease have been identified (ORDON et al. 1993) and different reactions to the
different strains of the BaYMV-complex have been observed (GÖTZ & FRIEDT 1993,
ORDON & FRIEDT 1993). Up to now 16 resistance genes are known of which 14
derived from the primary barley gene pool are recessive, while Rym14Hb and
Rym16Hb derived from Hordeum bulbosum are dominant (RUGE et al. 2003, RUGE-
WEHLING et al. 2006). The resistance genes are distributed over the whole barley
genome (GRANER et al. 2000, Ordon et al. 2005). An overview on all mapped
resistance genes against barley yellow mosaic virus disease is given in table 1. In
Europe barley yellow mosaic virus disease resistance is mainly based on two
resistance genes, rym4 and rym5, which are located on the long arm of chromosome
3H. Rym4 and rym5 represent two alleles of the same gene, the eukaryotic
translation initiation factor 4E (Hv-eIF4E, STEIN et al. 2005, KANYUKA et al. 2005).
The recessive resistance-encoding allele rym4, derived from the Dalmatian landrace
‘Ragusa’ (HUTH 1985), confers resistance against BaMMV and BaYMV-1 but it is not

Literature survey
8
effective against BaYMV-2. In contrast rym5, which is derived from the Chinese six-
rowed land race ‘Mokusekko 3’ (KONISHI et al. 1997, GRANER et. al. 1999a),
confers resistance against BaMMV, BaYMV-1 and BaYMV-2. However, rym5 has
been recently overcome by the new German BaMMV strain and BaMMV-SIL
(HARIRI et al. 2003, HABEKUSS et al. 2006). On chromosome 4H KONISHI et al.
(1997) identified another recessive resistance gene, rym1, which also derived from
‘Mokusekko 3’ and confers resistance against all BaMMV and BaYMV strains. The
resistance of ‘Mokusekko 3’ to all strains of the barley yellow mosaic virus complex in
Japan and Europe, including BaMMV-SIL and the new German BaMMV strain, is the
result of the combination of at least two genes, i.e. rym1 and rym5 (OKADA et al.
2003, OKADA et al. 2004, HABEKUSS et al. 2006). Another gene that confers
resistance against the European and Japanese BaYMV but not against BaMMV is
rym3, which was detected in ‘Haganemugi’ and ‘Ea 52’, which is a mutant of the
Japanese cultivar ‘Chikurin Ibaraki 1’ (UKAI 1984, KAWADA 1991, ORDON et
al.1993). Rym3 was mapped by RFLP analysis on the short arm of chromosome 5H
(SAEKI et al. 1999). By using a Japanese strain of BaYMV, the resistance gene
rym2, derived from the variety ‘Mihori Hadaka 3’, was mapped on chromosome 7HL
and rym6 of ‘Amagi Nijo’ on chromosome 3HL (TAKAHASHI et al. 1973, IIDA et al.
1999). Whereas rym2 confers resistance against BaMMV, BaYMV-1 and BaYMV-2,
rym6 donors are completely susceptible against European strains of the barley
yellow mosaic virus complex (KONISHI et al. 2002). The resistance gene rym7,
which confers partial resistance to BaMMV, has been mapped to the centromeric
region of chromosome 1HS (GRANER et al. 1999b). At the telomeric region of
chromosome 4HL four resistance genes, rym8, rym9, rym12 and rym13 are mapped,
whereas rym8, rym9 and rym13 forming a gene cluster. Thereof, resistance gene
rym8 derived from the cultivar ‘10247’ shows partial resistance against BaMMV and
BaYMV (BAUER et al. 1997, GRANER et al. 1999b). Rym9 confers resistance
exclusively against BaMMV, whereas rym12, derived from the Korean cultivar ‘Muju
covered 2’, shows a complete resistance against all strains of the Barley yellow
mosaic virus complex in Europe (ORDON et al. 1993, GRANER et al. 1996, BAUER
et al. 1997, SCHIEMANN et al. 1998). Furthermore, rym13, derived from the
Taiwanese cultivar ‘Taihoku A’, shows a complete resistance to the Barley yellow
mosaic virus complex (WERNER et al. 2003b, HABEKUSS et al. 2006). Further on,

Literature survey
9

Literature survey
10
rym10, found in ‘Hiberna’, was assigned to chromosome 3HL (GRANER et al. 1995,
GRANER et al. 1999a) and confers resistance against BaYMV-1 and BaYMV-2.
Resistance gene rym11 from the resistance donor ‘Russia 57’ has been mapped to
the telomeric region of chromosome 4HL and confers resistance to all strains of the
BaYMV complex (BAUER et al. 1997, NISSAN-AZZOUZ et al. 2005). The
BaYMV/BaYMV-2 resistance of ´Chikurin Ibaraki 1´ has been located on
chromosome 5HS (WERNER et al. 2003a) and the BaMMV resistance gene of this
variety, called rym15, on chromosome 6H (LE GOUIS et al. 2004). In addition to
these genes, two dominant resistance genes from Hordeum bulbosum, member of
the secondary barley gene pool, are mapped on chromosome 6HS (Rym14HB) and
Rym16HB on chromosome 2HL (RUGE et al. 2004, RUGE-WEHLING et al. 2006).
Regarding the new German BaMMV strain and BaMMV-Sil it turned out that rym4,
rym7, rym9, rym11, rym12, rym13, rym15, Rym14HB and Rym16HB, are effective
against these strains (HABEKUSS et al. 2006).
2.2.2 Soil-borne cereal mosaic virus Regarding the genetic base of resistance of bread wheat and durum wheat against
Soil-borne cereal mosaic virus (SBCMV) several resistance tests were carried out
and SBCMV resistant cultivars were identified (BUDGE & HENRY 2002, KANYUKA
et al. 2003). These resistant varieties are reported to carry a translocation resistance,
because all varieties show high virus levels in the roots (DRISKEL et al. 2002) but
normally virus transmission to stems and leaves is restricted but may appear under
certain environmental conditions (DRISKEL et al. 2002, HUTH & GOETZ 2007). The
inheritance of Soil-borne wheat mosaic virus (SBWMV) resistance, which is closely
related to SBCMV, was investigated in several studies. The determinism of genetic
resistance against this virus was described to be controlled by one dominant gene
(MODAWI et al. 1982), two (BARBOSA et al. 2001) or even three genes
(NAKAGAWA et al. 1959). In the United Kingdom SBCMV resistant cultivars were
developed including genetic material of the resistant cultivars ‘Cadenza’, ‘Charger’
and ‘Claire’. Due to a recently established glasshouse-based resistance test, the
monogenic inheritance of ‘Cadenza’ was identified (KANYUKA et al. 2004b). A study
based on a doubled haploid (DH)-population of the cross ‘Avalon’ x ‘Cadenza’
reveals a 1:1 segregation ratio, giving hint to a monogenic mode of inheritance of the
‘Cadenza’ derived resistance. This resistance locus, referred to as Sbm1, was

Literature survey
11
mapped to the distal end of chromosome 5DL and closely linked microsatellite
markers to the Sbm1 locus were identified (BASS et al. 2006). Until now, it is still
unknown whether the resistance of ‘Cadenza’ is related to a dominant, semi-
dominant or a recessive inheritance due to the totally homozygous character of the
used DH population (BASS et al. 2006). Regarding the pedigrees of ‘Charger’ and
‘Claire’ a genetic relation of these varieties to ‘Cadenza’ can be excluded. In this
case, the Argentinean wheat cultivar ‘Klein Rendidor’, which shows also resistance
against SBWMV, was identified as the resistance donor (MODAWI et al. 1982, BASS
et al. 2006). Within the European wheat germplasm, two resistance sources against
SBCMV are known, but further studies are necessary to confirm these presumptions
(BASS et al. 2006).
With respect to WSSMV (see chapter 2.1.3) resistance sources have been found in
some wheat species (COX et al. 1994, CADLE-DAVIDSON et al. 2006). In WSSMV
resistance screenings a qualitative resistance was observed and therefore a high
heritability controlled by a few dominant genes was assumed (KOEVERING et al.
1987). Due to difficulties in screening and mechanical inoculation of WSSMV, the
identification of molecular markers is of high interest for the development of resistant
cultivars. Hence, KHAN et al. (2000) identified one major gene resistance gene
against WSSMV in a RIL population from a cross between the resistant variety
‘Geneva’ and the susceptible cultivar ‘Augusta’. This resistance locus was mapped
by RFLP markers on chromosome 2DL but due to the population type, the mode of
inheritance could not be identified. Furthermore, a Triticum aestivum-Haynaldia
villosa translocation line T4VS·4DL was developed, which shows resistance against
WSSMV. The resistance locus was designated as Wss1 and is located on 4VS
(ZHANG et al. 2005). In several studies it has been demonstrated that the virus is
detectable by DAS-ELISA in resistant varieties after mechanical inoculation in the
greenhouse and even under natural conditions in the field (CARROLL et al. 2002,
KANYUKA et al. 2003). Therefore, the WSSMV resistance has to be assigned as a
tolerance, because distribution of the virus in the root system and virus transport from
the roots into the leaves is limited (KANYUKA et al. 2003). These findings are in
contrast to HUTH et al. (2002), who reported on immune wheat plants against
WSSMV.

Literature survey
12
2.3 Molecular markers Molecular markers or more generally speaking genetic markers detect genetic
differences, i.e. polymorphisms, at the DNA level between individuals and species,
respectively, whereas the variations are not visible in the phenotype except for
morphological markers (JONES et al. 1997). Regarding a target gene or trait of
interest, molecular markers act as flags because of their close localization to the
gene of interest. Molecular markers, which are tightly linked to an agronomical
important gene, can be used by breeders for marker-assisted selection (MAS), a tool
for an early selection of difficult traits in plants (VARSHNEY et al. 2006). Random
markers of unknown localisation and function can be used in pedigree studies and
germplasm investigations to discover genetic relations based on the comparison of
fingerprints. There are three different marker classes, mainly the morphological, the
biochemical and the DNA-based markers (COLLARD et al. 2005). Morphological
markers are visual traits, biochemical markers come up to differences in detected
enzymes and are influenced by environmental factors. Therefore, DNA, respectively
Polymerase chain reaction (PCR)-based molecular markers have been preferred in
the last decades, because of their numerous occurrences in the genome and their
neutral behaviour to environmental conditions (JOSHI et al. 1999).
2.3.1 DNA-based markers
2.3.1.1 Restriction Fragment Length Polymorphisms (RFLPs) RFLPs have primarily been used in human genome mapping (BOTSTEIN et al.
1980), the first organism for which polymorphisms were detected in coding
sequences. The procedure of this molecular marker method is divided into two steps.
The first step is based on the restriction endonuclease digestion of DNA, where the
restriction enzyme recognizes and cleaves specific nucleotide sequences and
therefore variations in the restriction site arise as a result of restriction fragments of
different sizes (JONES et al. 1997). The whole range of different DNA fragments are
separated by gel electrophoresis and transferred to a membrane by Southern blotting
(SOUTHERN 1975). In a second step hybridisation to a labelled probe visualises
DNA fragments of different size (polymorphisms). RFLPs were mainly used in the
1990s for creating linkage maps (GRANER et al. 1995, SAGHAI-MAROOF et al.

Literature survey
13
1996) or the assessment of genetic diversity in different crop plants like oilseed rape
(for review cf. SNOWDON & FRIEDT 2004) or barley (RUSSELL et al. 1997). The
major advantage of this method is its reliability and transferability to other populations
although RFLPs are very time-consuming.
2.3.1.2 Random Amplified Polymorphic DNAs (RAPDs)
In 1983 the Polymerase chain reaction (PCR) was developed (MULLIS & FALOONA
1987), which facilitated the efficient development of molecular markers. The PCR is
based on the amplification of a specific single nucleic acid sequence. To achieve this,
three steps are needed. First of all double-stranded DNA is denaturated followed by
an annealing step, where the primers attach to the single-stranded DNA template.
The third step is the elongation of the DNA template. During the last step the Taq
DNA polymerase isolated from a bacterium called Thermus aquaticus (CHIEN et al.
1976), synthesises a complementary DNA strand defined by the primers, and thus
copies the DNA sequence between the primer annealing sites. RAPDs are based on
using only a single primer of about 8-10 nucleotides for DNA amplification
(WILLIAMS et al. 1990). This decamer-primer acts as forward and reverse primer.
RAPDs are able to generate a large number of fragments of different size.
Polymorphisms are detected by gel electrophoresis and thus RARD markers are
identified due to the sequence differences in the primer binding sites. Therefore,
RAPDs are dominant markers. Furthermore, the method is relatively cheap and easy
to handle. The main disadvantages of these PCR-based markers are their lack of
reproducibility and their non-transferability to other plants (SCHLÖTTERER 2004).
Further on, RAPDs are used as specific markers in diversity studies (RUSSELL et al.
1997, SIMIONIUC et al. 2002) as well as in genetic mapping for identification and
localisation of e.g. resistance genes (ORDON et al. 1995, SCHIEMANN et al. 1997,
PELLIO et al. 2004).
2.3.1.3 Amplified Fragment Length Polymorphisms (AFLPs) AFLPs are based on the selective PCR amplification of restricted fragments
(ZABEAU & VOS 1993). This technique is divided into three different steps. In the
first one, genomic DNA is digested by two different restriction enzymes, a frequently
cutting enzyme (e.g. MseI, 4bp recognition sequence) and another one cutting less

Literature survey
14
frequently (e.g. EcoRI, 6bp recognition sequence). The resulting fragments are
ligated to restriction enzyme site specific adapters. The selective amplification of sets
of restriction fragments follows in a second step. In the PCR reaction primers are
used, which are complementary to the adapter sequences except for the presence of
one to three additional bases at the 3’ end arbitrarily chosen by the user. These
selective amplifications lead to a reduction in the number of amplified fragments to
1/16 and 1/256, respectively. The third step complies with a gel analysis where the
PCR products are visualised on a polyacrylamide (PAA) gel (VOS et al. 1995). The
polymorphisms, which are observed, are the results of insertions, deletions and point
mutations at the restriction sites, respectively. With AFLPs it is possible to detect
more than 100 DNA fragments in just one PCR. The disadvantage of the AFLPs is
their dominant inheritance and therefore the difficulty to identify homologous alleles.
In this case their reduced informativeness leads to problems in mapping e.g. F2
generations with heterozygous individuals (MUELLER & WOLFENBARGER 1999,
SAAL et al. 2002). Nevertheless, the AFLP method has a lot of advantages like its
high reproducibility, the quality of information, the ease of handling and the high
grade of polymorphisms detected. Therefore, AFLP markers are often used for DNA
fingerprinting, fine mapping of genes, genetic diversity analyses and for the
construction of genetic linkage maps (SCHIEMANN et al. 1999, UPTMOOR et al.
2003, ABU-ASSAR et al. 2005, NISSAN-AZZOUZ et al. 2005, STODART et al. 2005,
BRATTELER et al. 2006).
2.3.1.4 Simple Sequence Repeats (SSRs) SSRs or microsatellites are tandemly arranged repeats of several nucleotides, which
are present in the vast majority of eukaryotic genomes (DÁVILLA et al. 1999,
RAKOCZY-TROJANOWSKA et al. 2004). The frequencies of SSRs vary significantly
among different organisms. The most common SSRs in plants are dinucleotide
repeats including (AT)n, (GT)n and (GA)n (GUPTA & VARSHNEY 2000), whereas
(AC)n is one of the most frequent SSRs in mammals (TOTH et al. 2000). SSRs are,
due to their variation in the number of repeat units, highly polymorphic and flanked by
highly conserved genomic regions. SSR markers are in general inherited
codominantly, have a moderate abundance and good genome coverage. The main
advantages of SSRs are their multi-allelic nature, the reproducibility, their
unambiguous designation of alleles and their locus specificity (LI et al. 2000,

Literature survey
15
MACAULY et al. 2001, PARIDA et al. 2006). These properties have made SSRs a
powerful tool for genetic mapping, genome analysis and population genetics
(SCHLÖTTERER 2004). SSRs based linkage maps have been developed in all
major cereals such as barley (RAMSAY et al. 2000, LI et al. 2003), wheat (ROEDER
et al. 1998, SOMERS et al. 2004), maize (SHAROPOVA et al. 2002), and rice
(MCCOUCH et al. 1997, 2002). In wheat and barley significant progress has been
made by sequencing expressed sequence tags (ESTs) derived from SSRs for high
density mapping (THIEL et al. 2003, STEIN 2007, VARSHNEY et al. 2007).
Furthermore, SSRs have been used for genetic diversity studies in many plant
species e.g. sorghum (UPTMOOR et al. 2003, ABU-ASSAR et al. 2005), oat (LI et al.
2000), wheat (HAMMER et al. 2000), and barley (ROUSSEL et al. 2004, PANDEY et
al. 2006).
2.3.1.5 Single Nucleotide Polymorphisms (SNPs) SNPs represent the marker of choice during the last years and are based on a
single-base change in the DNA sequence (point-mutation), usually with an alternative
of two possible nucleotides at a specific position (VIGNAL et al. 2002). In the human
genome a total of ten million SNPs were detected, whereas over five million SNPs
possess a minor allele frequency of more than 10% (BOTSTEIN & RISCH 2003).
Furthermore, SNPs are distributed over the whole human genome at an estimated
frequency of one SNP every 506 bp (CARLSON et al. 2003). SNPs are bi-allelic,
codominant markers and regarding the modification or expression of a gene in non-
coding regions they are mostly silent. Moreover, SNPs have great potential for
automation and therefore for high-throughput screening (GUPTA et al. 2001). In
general, SNPs are used for association studies due to their high frequency in the
genome and their stability. Regarding the fully sequenced human genome the
location of the allelic variations is known. In linkage analysis studies of different
plants it could be confirmed that SNPs are very common in plant genomes. CHING et
al. (2002) found one SNP per 60 bp in outbreeding maize, in wheat one SNP every
212 bp (RAVEL et al. 2006) was reported, one SNP per 300 bp was detected in rice
and Arabidopsis thaliana (SCHMID et al. 2003, YU et al. 2005), and in barley SNPs
were found every 200 bp (ROSTOKS et al. 2005), whereas there was one SNP every
50 bp (RUSSELL et al. 2004) and 58 bp (NEUHAUS et al. 2004), respectively, in
samples including varieties of Hordeum spontaneum and Hordeum vulgare.

Literature survey
16
To identify SNPs various strategies have been developed (LANDEGREN et al.
1998). One method is the heteroduplex analysis of DNA molecules by density
gradient gel electrophoresis (DGGE). Electronic dot blot assays and denaturing high-
performance liquid chromatography (DHPLC) are further well-suited methods (KOTA
et al. 2001, SHIRASAWA et al. 2006). Furthermore, mass-spectroscopy using
MALDI-TOF (Matrix Assisted Laser Desorption/Ionisation Time-of-Flight), microarray
technology, EcoTilling and single strand conformation polymorphism (SSCP) are
used to score SNPs (STOERKER et al. 2000, ANDERSEN et al. 2003, COMAI et al.
2004, WANG et al. 2005).
There are still a lot of other molecular markers, mostly variations of the mentioned
procedures above, which are based on point mutations in the DNA sequence and are
used for genetic diversity studies or linkage mapping. A few recently developed
methods with high potential are listed. One of these techniques are the single feature
polymorphisms (SFPs), which are identified in transcript profiling data by visualizing
differences in hybridisation to individual oligonucleotide probes (VARSHNEY et al.
2005, WEST et al. 2006). The polymorphisms present in the DNA are transcribed into
the messenger RNA and may affect hybridization to the microarray probes if located
in a region complementary to the probe. SFPs detected using high density
oligonucleotides microarrays such as the Barley1 Affymetrix GeneChip (CLOSE et al.
2004) can serve as function-associated markers for genetic analyses including
quantitative trait loci (QTL) and linkage disequilibrium (LD) mapping. Further on,
Diversity Arrays Technology (DArT) enables the profiling of the whole genome
without any DNA sequence information. This method is based on the microarray
hybridisation which detects the presence or absence of a specific DNA fragment from
the whole genomic DNA of an individual or a whole population (JACCOUD et al.
2001, WENZL et al. 2004). Therefore, this technology generates a large number of
high-quality markers in several crop species like barley (WENZL et al. 2004),
Arabidopsis thaliana (WITTENBERG et al. 2005), cassava (XIA et al. 2005), wheat
(AKBARI et al. 2006), and pigeonpea (YANG et al. 2006).
Besides the already described marker techniques, several methods are described to
convert already existing unspecific PCR-markers to more robust ones, which are
easier and less laborious to use. To specify point mutations-based AFLPs or RAPDs
it is necessary to convert them into more stable single locus PCR markers like

Literature survey
17
Cleaved Amplified Polymorphic Sequences (CAPS), Sequence Characterised
Amplified Region (SCAR) or Sequence Tag Sites (STS). These techniques are
based on sequencing and design of specific primer pairs. Expressed Sequence Tags
(ESTs), which are useful tools in gene discovery, comply with STS markers. Their
sequence and location in the genome are known but ESTs derive from cDNA clones
(JOSHI et al. 1999). In addition, there are several functional and gene targeted
markers described like ACGMs (Amplified consensus genetic markers), GSTs (Gene
specific tags), RGAs (Resistance gene analogues) or ERAP (Exon-Retrotransposon
amplification polymorphism), which are ideal tools for marker-assisted selection
(GUPTA & VARSHNEY 2000, ANDERSEN & LÜBBERSTEDT 2003, GUPTA &
RUSTGI 2004, BAGGE et al. 2007).
2.4 Application of molecular markers in plant breeding The development of molecular markers was an important step for plant breeding and
opened a new area of molecular plant breeding. Molecular markers and especially
PCR-based marker systems facilitate genotyping and the assessment of genetic
diversity, the construction of linkage maps and the application in marker-assisted
breeding. Further on, molecular markers ease pyramiding of genes, e.g. resistance
genes, the detection of Quantitative trait loci (QTL) as well as the acceleration of
back crossing procedures (ORDON et al. 2004b, WERNER et al. 2005).
2.4.1 Genetic linkage maps To construct a genetic linkage map the grouping of linked markers into linkage
groups and the arrangement of the known markers to each other within this group is
necessary. This involves coding data for each marker on each individual of a
segregating population, e.g. a DH population, and later on linkage analysis using
software programmes like MapMaker (LANDER et al. 1987) or JoinMap (STAM &
VAN OOIJEN 1995) to detect linkage groups and construct genetic maps. The
linkage between two markers is usually measured by likelihood of odds ratio, which
calculates the ratio of linkage versus no linkage (COLLARD et al. 2005). This ratio is
worded as the logarithm of the ratio and is called a logarithm of the odds value (LOD)
or LOD score (RISCH 1992). Usually, LOD values over 3.0 are taken for the
construction of linkage maps, viz this value between two markers indicates that the

Literature survey
18
linkage is 1,000 times more likely than no linkage. The arrangement of markers is
based on the frequencies of recombination between them. By means of mapping
functions, recombination fractions are converted into genetic distances assessed in
centiMorgan (cM), because of the non-linearity of recombination frequency, i.e. the
frequency of crossing-over (COLLARD et al. 2005). The Kosambi mapping function
(KOSAMBI 1944) and the Haldane mapping function (HALDANE 1919) are the most
commonly used ones. Whereas Haldane expects no interference between crossing
over, Kosambi assumes that a recombination event gains influence on the
occurrence of a neighbouring recombination event (HARTL & JONES 2001). Genetic
linkage maps are necessary for the identification of chromosomal regions, which
possess ‘genes of interest’ or traits controlled by one or more genes, the
identification of genetic markers closely linked to these important traits, for synteny
studies (comparing genomes of different species) or for genome sequencing
(MOHAN et al. 1997). The first barley linkage map was constructed by KLEINHOFS
et al. (1988) with RFLP markers for chromosome 6H. A few years later more detailed
maps of the whole genome were created based on different types of populations
(GRANER et al. 1991, HEUN et al. 1991, KLEINHOFS et al. 1993). Other markers
like AFLPs (WAUGH et al. 1997) or SSRs (BECKER & HEUN 1995, LIU et al. 1996,
LI et al. 2003) were integrated in already existing maps to enhance the marker
density. RAMSAY et al. (2000) established the first linkage map using only
microsatellites. Further on, EST-derived SSRs were integrated into molecular maps
(PILLEN et al. 2000, THIEL et al. 2003). Herefrom, a strong clustering of
microsatellites markers around the centromeres of all chromosomes was observed
(RAMSAY et al. 2000, LI et al. 2003), which results from suppressed recombination
events in the centromeric regions (KÜNZEL et al. 2000) and leads further on to an
incomplete genome coverage. Among others, WENZL et al. (2006) constructed a
barley consensus map, which combines different maps with DArT markers to improve
the genome coverage. Corresponding dense molecular linkage maps of other crops
of worldwide importance like rice (MCCOUCH et al. 2002), maize (SHAROPOVA et
al. 2002), sorghum (MENZ et al. 2002), wheat (SOMERS et al. 2004, SONG et al.
2005), rape seed (KIM et al. 2006) and grapevine (DOLIGEZ et al. 2006) are
available.
The knowledge of the position of molecular markers on these linkage maps is very
useful for the identification of closely linked markers to genes encoding important

Literature survey
19
traits, and allows e.g. the precise localization of resistance genes. Several recessive
resistance genes are mapped in barley using Bulked Segregant Analysis (BSA, see
chapter 3.5, MICHELMORE et al. 1991). One of the first successful reports on the
application of BSA in barley was the mapping of resistance genes against powdery
mildew by GIESE et al. (1993), where the RFLP marker ris16 was closely mapped to
the resistance gene MlLa on chromosome 2H within a distance of 1 cM. Furthermore,
GARVIN et al. (2000) mapped the scald resistance gene Rrs14 by using BSA on
chromosome 1H closely linked to the STS marker Hor2 with a distance of 1.8 cM to
the resistance locus (for an overview of all resistance genes already mapped by
close association with DNA markers see CHELKOWSKI et al. (2003), WILLIAMS
(2003) and ORDON et al. (2004b)). A high number of studies have demonstrated the
identification of Quantitative Trait Loci (QTL) in many crop species based on existing
genetic linkage maps. The principle of QTL analysis is to separate the mapping
population into different groups with respect to the presence or absence of a
genotype at a marker locus and to determine the differences, which exist between
these groups on the phenotypic level with respect to a quantitative trait. If the
phenotypes between groups differ significantly, the marker locus, which partitions the
groups, is linked to a QTL. There are three different methods to detect a QTL: (1)
single-marker analysis, (2) simple interval mapping (SIM) and (3) composite interval
mapping (CIM, COLLARD et al. 2005), whereas CIM is the most common one
(JANSEN & STAM 1994). In cereals, many QTL for major agronomic traits have been
described. In barley, several markers for QTL of agronomic traits have been
identified so far. These works include QTL for yield (VON KORFF et al. 2006),
disease resistances like barley yellow dwarf virus (SCHEURER et al. 2000) or scald
(ZHAN et al. 2007), and leaf rust (MARCEL et al. 2007). Further on, e.g. SOMERS et
al. (1998) identified RAPD markers linked with linoleic acid desaturation in Brassica
rapa, and AFLP and SSR markers could be detected for Fusarium head blight
resistance in wheat (BUERSTMAYR et al. 2002, LIU & ANDERSON 2003). In other
crop species NARASIMHAMOORTHY et al. (2007) recently found markers for QTL
associated with the aluminium tolerance in alfalfa.
These molecular markers, which are closely linked to a gene of interest or to a QTL,
can be used for marker-assisted selection (MAS). The specific DNA marker alleles
can be applied for an indirect selection of DH populations, which are used for fixation
of the traits, to identify genes of interest in the seedling stage and furthermore to

Literature survey
20
screen for the genetic background (VARSHNEY et al. 2006, TUVESSON et al.
2007). This method simplifies the work of plant breeders due to the great efficiency of
marker assisted selection (MAS). One example of the sufficient use of MAS in barley
breeding is the incorporation of resistances into the existent barley breeding
materials against the barley yellow mosaic virus complex. Until now, several markers
for the selection of resistance gene loci have been developed (ORDON et al. 2003,
2004b). The most common one is the SSR marker Bmac0029, which is used by
many barley breeders for the selection of the rym4 and rym5 resistance genes (RAE
et al. 2007). Furthermore, MAS offers the opportunity for the accomplishment of gene
pyramiding. This has been shown in many crops like wheat (LIU et al. 2000), cotton
(GUO et al. 2005), rice (ZHANG et al. 2006) and barley (WERNER et al. 2005, 2007).
The use of tightly linked markers to a gene of interest is also the basis for map-based
cloning, in which the marker is used as a probe for the screening of a genomic library
(COLLARD et al. 2005), e.g. in barley based on a high resolution mapping (PELLIO
et al. 2005). The resistance locus rym4/rym5 was isolated (STEIN et al. 2005)
facilitating the production of ideal diagnostic marker, i.e. allele specific markers. The
map based cloning strategy has been applied in several crop species (for overview
STEIN & GRANER 2004).
2.4.2 Genetic diversity Genetic diversity represents the multifariousness within and between groups of
individuals or populations. The knowledge of this pool of genetic variation for these
individuals or within a population is necessary for breeding purposes (RAO &
HODGKIN 2002). Genetic diversity is estimated based on differences in DNA
sequences and these DNA-based marker data facilitate the reliable differentiation of
genotypes. Molecular marker-based genetic diversity can be expressed and
presented by different estimators and approaches like genetic diversity, genetic
similarity respectively distance, population structure and cluster analysis (LABATE
2000).
Frequently used methods for the estimation of genetic similarity and distance,
respectively, are the NEI and LI coefficient (1979), JACCARDs coefficient (1908),
modified ROGERs’ distance (WRIGHT 1978) and the simple matching coefficient
(SMC, SNEATH & SOKAL 1973). All are based on binary data, which count the
presence or absence of fragments or the allele frequency. The major differences
Literature survey
21
between these four methods are due to their emphasis of monomorphic or
polymorphic alleles. Whereas JACCARD just considers fragments, which are present
in all individuals, and ignores fragments, which are absent in both individuals. NEI &
LI measures the proportion of alleles, which are present and shared in each
individual. Modified ROGERs distance includes every locus scored as an orthogonal
dimension and SMC considers the fragments, which are present and absent
(MOHAMMADI et al. 2003). Due to this different emphasis on present and absent
alleles, JACCARD is commonly used for dominant markers and NEI & LI for
codominant markers (SCHÖN et al. 1997). Based on the matrix of genetic
distances/similarities cluster analyses can be carried out. Cluster analysis is a
statistical procedure, which groups individuals or populations into subsets or clusters
based on their common traits. The clustering methods can be differentiated into two
groups, herein after referred to as (1) the distance-based method and (2) the
Bayesian model-based method. The main principle of the first one is the calculation
with a pair-wise distance matrix as an input, whereas the model-based method
assumes that the observations from each cluster are random draws from some
parametric model (PRITCHARD et al. 2000). Distance-based methods are divided
into two groups: (1) hierarchical procedure, where single individuals are treated
separately before grouping into bigger clusters, and (2) non-hierarchical procedures,
which is rarely used for the estimation of genetic diversity (MOHAMMADI et al. 2003).
Among different hierarchical procedures known, the Unweighted Paired Group
Method using Arithmetic averages (UPGMA) is due to the high level of accuracy the
most frequently used one (MOHAMMADI et al. 2003).
The genetic diversity (H) is based on the number of alleles per locus and the
frequency of alleles per locus. The most frequently used index is the gene diversity
index by NEI (1973), which is a measure of the probability that two genotypes chosen
randomly out of the population possess different alleles (KREMER et al. 1998).
Another diversity measure is the Shannon-Weaver Index (H’, SHANNON & WEAVER
1949). In contrast to the gene diversity index by NEI (1973) the Shannon-Weaver
Index doesn’t prerequisite the Hardy-Weinberg equilibrium (FRITSCH & RIESEBERG
1996). Genetic diversity is of prime interest for plant breeding. Due to the variation in
allele frequency within species a selection is possible to change populations and to
introduce new varieties into breeding populations. Furthermore, the breeding system
of the species is significant for the evaluation of differences between populations

Literature survey
22
from different geographical regions (RAO & HODGKIN 2002). For the estimation of
genetic diversity DNA-based markers are an efficient tool. Attention should be paid to
the differences in genetic diversity resulting from different markers and their amount
of genome coverage (STAUB et al. 1997). In cereals and other crop species, many
studies about genetic diversity have been described, e.g. in barley (AHLEMEYER et
al. 2006, PANDEY et al. 2006), wheat (REIF et al. 2005, HAI et al. 2007) or rapeseed
(HASAN et al. 2006).

Material and Methods
23
3 Material and Methods
3.1 Plant Material
3.1.1 Identification of new resistance resources of barley against the barley yellow mosaic virus complex
120 exotic barley germplasms, resistant against BaYMV in Japan, have been
screened with the microsatellite marker Bmac0029 closely linked to the rym4/rym5
locus (GRANER et al. 1999a) in order to identify new resistance donors carrying
resistance genes different from rym4 and rym5 which are at present widely used in
European barley breeding programmes. Most of the 120 barley accessions mainly
originated from China, Nepal, Japan, Russia, Ethiopia and Turkey (Table 2) were
provided by the Barley Germplasm Centre, Research Institute for Bioresources,
Okayama University, Japan.
Table 2: New resistance resources of barley against the BaYMV-complex. Name Origin Name Origin
J. 20 Afghanistan Debra Birhan 1 Ethiopia
9055 Austria Debra Birhan 7 Ethiopia
Baku 3 Azerbaijan Deder 2 Ethiopia
Shemakha 1 Azerbaijan Dembi 3 Ethiopia
Shemaka 2 Azerbaijan Ethiopia 14 Ethiopia
Shemakha 3 Azerbaijan Ethiopia 53 Ethiopia
Chiuchiang China Ethiopia 65 Ethiopia
Chihchou Yinchiaai 3 China Ethiopia 80 Ethiopia
Hsingwuke 2 China Ethiopia 89 Ethiopia
Juichang 2 China Ethiopia 506 Ethiopia
Liussuchiao 1 China Ethiopia 510 Ethiopia
Liussuchiao 2 China Ethiopia 534 Ethiopia
Paishapu 2 China Gondar 6 Ethiopia
Paoanchen 1 China Glyorgi 2 Ethiopia
Shanghai 1 China Kulubi 1 Ethiopia
Tatung China Mota 1 Ethiopia
Addis Ababa 64 Ethiopia Mota 7 Ethiopia
Adi Abun 2 Ethiopia Nazareth 3 Ethiopia
Dabat 1 Ethiopia Sululta 4 Ethiopia

Material and Methods
24
Name Origin Name Origin
Sululta 10 Ethiopia Jungbori 20 Korea
France 7 France Masan Covered 5 Korea
Tibilisi 1 Georgia Sacheon Naked Korea
Tibilisi 7 Georgia Samcheog Dolbori Korea
Mammuto Germany Suweon 31 Korea
Esfahan 1 Iran Waegwan Covered 1 Korea
Esfahan 4 Iran Yeoncheon Native Korea
Gorgan 1 Iran Zairaishu Korea
Ramsar Iran Zairai Junkei 8 Korea
70 g Iran Chame 8 Nepal
Chikurin Ibaraki 3 Japan Dhumpu 2 Nepal
Fushiguro Japan Keronja 2 Nepal
Hakusanmugi Japan Keronja 3 Nepal
Hanhadaka 2 Japan Keronja 5 Nepal
Hayamugi Japan Sikha 10 Nepal
Hiroshima Japan Sipche 14 Nepal
Hosomugi 3 Japan Thonje 16 Nepal
Iwate Hozoroi 1 Japan Thonje 19 Nepal
Kinukawa Gozen 22 Japan Tsumje 3 Nepal
Kobinkatagi 4 Japan Katana 2 Syria
Koshimaki 40 Japan Turkey 3 Turkey
Nagaoka Japan Turkey 29 Turkey
Oeyama Rokkaku 3 Japan Turkey 33 Turkey
Sakaiwa Rokkaku 27 Japan Turkey 39 Turkey
Sekitori 2 Japan Turkey 41 Turkey
Shiro Omugi 79 Japan Turkey 44 Turkey
Taishomugi Japan Turkey 45 Turkey
Tochigi Torano-o 1 Japan Turkey 47 Turkey
Torano-o Japan Turkey 56 Turkey
Torano-o 7 Japan Turkey 62 Turkey
Baegsan Santoku 1 Korea Turkey 68 Turkey
Boseong Covered 3 Korea Turkey 77 Turkey
Changweon Jecheon 5-1 Korea Turkey 83 Turkey
Cheongyang Covered 2 Korea Turkey 86 Turkey
Gangneung Covered 3 Korea Turkey 101 Turkey
Gogseong Covered 4 Korea Turkey 179 Turkey
Goheung Covered 2 Korea Turkey 440 Turkey
Gwangju Baitori 1 Korea Turkey 524 Turkey
Hamyang Covered 9 Korea Turkey 581 Turkey
Hongcheon Anjeunbaengi 2 Korea Turkey 723 Turkey
Hongseong Native Korea Russia 4 USSR

Material and Methods
25
3.1.2 Mapping populations used for the development of new PCR-based DNA markers for resistance genes against BaMMV, BaYMV-1 and BaYMV-2
For the mapping approach of currently unknown resistance genes against the
BaYMV complex seven different crosses with original exotic resistance donors have
been generated and used. The mapping populations have been provided by the plant
breeding companies Pajbjergfonden, Odder, Denmark, Florimond-Desprez, Cappelle
en Pévèle, France and the Institute of Crop Science and Plant Breeding I, University
of Giessen and herein referred to as MAP1-7.
3.1.2.1 Mapping population 1 (MAP 1) The doubled haploid (DH) population MAP1 consists of 94 lines derived from a cross
between the resistance donor ‘Cebada’ and the German susceptible two-rowed
cultivar ‘Cleopatra’.
3.1.2.2 Mapping population 2 (MAP 2) A number of 54 anther-derived DH lines of the Japanese cultivar ‘Shimane Omugi’
crossed with the susceptible cultivar ‘Sumo’ as well as 65 additional DH lines of the
cross ‘Shimane Omugi’ with the German susceptible two-rowed cultivar ‘Gilberta’
were used for genetic mapping.
3.1.2.3 Mapping population 3 (MAP 3) MAP 3 was developed by crossing the resistance donor ‘CI 3517’ with the
susceptible two-rowed cultivar ‘Reni’ and comprises 80 DH lines.
3.1.2.4 Mapping population 4 (MAP 4) A progeny of 131 DH lines of the cross between the resistance donor ‘Belts 1823’
and the German cultivar ‘Franziska’ were used for marker development. ‘Franziska’ is
carrying rym4 and is therefore known to be resistant against BaMMV and BaYMV-1
in Europe.
3.1.2.5 Mapping population 5 (MAP 5) The Japanese resistant six-rowed cultivar ‘Chikurin Ibaraki 1’ was crossed with the
German susceptible two-rowed winter barley cultivar ‘Igri’. The DH population, which

Material and Methods
26
derived from the F1 generation by anther culture, comprised 163 DH lines. ‘Chikurin
Ibaraki 1’ shows resistance against all three types of the BaYMV complex in Europe
but is susceptible to BaYMV in Japan (GOETZ & FRIEDT 1993).
3.1.2.6 Mapping population 6 (MAP 6) A subset of the original population from the cross between the Taiwanese six rowed
cultivar ‘Taihoku A’ and the French susceptible cultivar ‘Plaisant’ (WERNER et al.
2003b) was used for the development of closer linked markers. The original subset
comprised 90 DH lines which was later enlarged to 154 DH lines of the same cross.
‘Taihoku A’ is known to be resistant to BaMMV and BaYMV/BaYMV-2 (GOETZ &
FRIEDT 1993).
3.1.2.7 Mapping population 7 (MAP 7) MAP 7 is composed of 151 DH lines derived from a cross of the Korean resistance
donor ‘Muju covered 2’ with the susceptible cultivar ‘Spirit’. Like ‘Taihoku A’, ‘Muju
covered 2’ is resistant to BaMMV, BaYMV/BaYMV-2, and to the new German
BaMMV-strain (GOETZ & FRIEDT 1993, HABEKUSS et al. 2006).
3.1.3 Wheat cultivars used for fingerprinting and studies on genetic diversity
Different wheat lines provided by different co-operation partners (W. von Borries-
Eckendorf, Germany; Pajbjergfonden, Denmark; Florimond-Deprez, France) were
screened for resistance against SBCMV and WSSMV in France in 2003 and 2004.
Based on resistance screening in the field, 64 interesting wheat lines were selected
and used for genotyping (Table 3).

Material and Methods
27
Table 3: Selected wheat genotypes for fingerprinting.
Name Provided by Reaction to
SBCMV/WSSMV
Name Provided by Reaction to
SBCMV/WSSMV
Asperge Florimond Desprez resistant 701-477c Pajbjergfonden resistant
Autan Florimond Desprez resistant 701-481a Pajbjergfonden resistant
Bobino Florimond Desprez resistant 798-398b Pajbjergfonden susceptible
Brando Florimond Desprez resistant BE01 W. v. Borries-Eckendorf resistant
Cadenza Florimond Desprez resistant BE02 W. v. Borries-Eckendorf resistant
Charger Florimond Desprez resistant BE03 W. v. Borries-Eckendorf resistant
Claire Florimond Desprez resistant BE04 W. v. Borries-Eckendorf resistant
Enesco Florimond Desprez resistant BE05 W. v. Borries-Eckendorf resistant
Farandole Florimond Desprez resistant BE06 W. v. Borries-Eckendorf resistant
Gaspard Florimond Desprez resistant BE07 W. v. Borries-Eckendorf resistant
Gascogne Florimond Desprez resistant BE08 W. v. Borries-Eckendorf resistant
Igor Florimond Desprez resistant BE09 W. v. Borries-Eckendorf resistant
Intense Florimond Desprez resistant BE10 W. v. Borries-Eckendorf resistant
Levis Florimond Desprez resistant BE12 W. v. Borries-Eckendorf resistant
Rubens Florimond Desprez resistant BE13 W. v. Borries-Eckendorf resistant
Sponsor Florimond Desprez resistant BE14 W. v. Borries-Eckendorf resistant
Taldor Florimond Desprez resistant BE15 W. v. Borries-Eckendorf resistant
Tremie Florimond Desprez resistant BE16 W. v. Borries-Eckendorf resistant
701-37c Pajbjergfonden resistant BE17 W. v. Borries-Eckendorf resistant
701-42c Pajbjergfonden susceptible BE18 W. v. Borries-Eckendorf resistant
701-176a Pajbjergfonden resistant BE19 W. v. Borries-Eckendorf resistant
701-176c Pajbjergfonden resistant BE20 W. v. Borries-Eckendorf resistant
701-177a Pajbjergfonden resistant BE21 W. v. Borries-Eckendorf resistant
701-177c Pajbjergfonden resistant BE22 W. v. Borries-Eckendorf resistant
701-191a Pajbjergfonden susceptible BE23 W. v. Borries-Eckendorf resistant
701-210a Pajbjergfonden resistant BE24 W. v. Borries-Eckendorf resistant
701-210b Pajbjergfonden susceptible BE25 W. v. Borries-Eckendorf resistant
701-244c Pajbjergfonden resistant BE26 W. v. Borries-Eckendorf resistant
701-256b Pajbjergfonden resistant BE27 W. v. Borries-Eckendorf resistant
701-372c Pajbjergfonden resistant BE28 W. v. Borries-Eckendorf resistant
701-422b Pajbjergfonden resistant BE29 W. v. Borries-Eckendorf resistant
701-477b Pajbjergfonden susceptible BE30 W. v. Borries-Eckendorf resistant
3.2 Evaluation of virus resistance
The reaction against BaMMV was estimated after mechanical inoculation in the
greenhouse according to FRIEDT (1983) in two replications comprising five plants
per DH-line. The inoculation was carried out with plant sap extract of BaMMV-
infected leaf material of the cultivar ‘Gerbel’. The sap was diluted 1:10 in K2HPO4

Material and Methods
28
buffer (0.1 M; 9.1 pH), mixed with carborundum powder (0.5 g/25 ml) and applied by
using a spray gun with 8 bar pressure. The youngest and second youngest leaves
were sprayed from both sides with an average of 2.5 ml diluted sap. The inoculated
plants were briefly rinsed under tap water and kept for one day in the shade at 18°C.
Afterwards the plants were transferred to a cooled green house chamber at 16°C.
Four weeks after inoculation resistance was estimated by double antibody sandwich
enzyme-linked immunosorbent assay (DAS-ELISA, KOENIG 1985).
Since neither BaYMV nor BaYMV-2 can be transmitted mechanically at a sufficient
infection level, field experiments were performed in 2003/2004 and in 2004/2005 at
three locations which were either infested with BaMMV, BaYMV (Giessen, Hesse) or
additionally with BaYMV-2 (Eikeloh, Northrhine-Westphalia and Lenglern, Lower
Saxony). Besides visual assessment, the resistance reaction against the two different
virus strains was determined by DAS-ELISA using specific antisera against BaMMV
and BaYMV (kindly provided by Dr. Frank Rabenstein, Federal Centre for Breeding
Research, Quedlinburg, Germany). Optical density was estimated photometrically at
405 nm and 620 nm reference wavelengths (Easy Reader 400 ATX, SLT-
Labinstruments, Crailsheim).
Regarding the new German BaMMV strain the resistance reaction of MAP 6 was
estimated by Dr. Antje Habekuß, Federal Centre for Breeding Research, Institute of
Epidemiology and Resistance Resources, Quedlinburg.
Resistance against SBCMV and WSSMV was scored visually by two different
breeders of the breeding companies Borries-Eckendorf and Florimond-Deprez at an
infested field at Vatan, France, in the years 2003 and 2004. The cultivars and wheat
lines were sown in two replications, whereas every replication comprised a double
row. The severity of virus infection was easy to differentiate, so it was possible to
score the symptoms using the complete range from 1 (resistant) to 9 (susceptible).
3.3 Molecular analysis
3.3.1 DNA extraction and measurement of DNA concentrations
DNA was isolated from two weeks old leaves as described by Doyle & Doyle (1990).
For this purpose, the frozen plant material was grounded with liquid nitrogen to a fine
powder. 200 mg of plant material together with 700 µl of the CTAB-extraction buffer

Material and Methods
29
were homogenised and incubated at 65°C for 20 to 30 minutes. To separate
polysaccharides, 700 µl of chloroform/isoamylalcohol (CIA, 24:1 [v/v]) were added to
the solution and shaken for 5 minutes. After a centrifugation step at 4°C during 10
min at 10,000 rpm the upper phase was removed and mixed with 600 µl of CIA. After
shaking the samples for 5 minutes, centrifugation was again carried out and the liquid
phase was transferred to a new 1.5 ml reaction tube and loaded with 50 µl 10 M
ammonium acetate (NH4OAc), 60 µl 3 M sodium acetate (NaOAc) and 500 µl cold
isopropanol. Upon slight swivelling, the DNA precipitated and formed a DNA pellet
after centrifugation at 4°C and 4,000 rpm for 4 minutes. The supernatant was
discarded and the DNA pellet was washed with 200 µl washing buffer (70 % ethyl
alcohol/10 mM ammonium acetate) for at least 10 minutes. After drying, the DNA was
dissolved in 100 µl TE-Buffer (10 mM Tris HCl, 1 mM EDTA, pH 8). RNA impurities
were removed by supplying 1 µl of RNAse (1mg ml-1) per 100 µl DNA solution. The
composition of the different buffers used for DNA extraction is shown in Table 4.
Table 4: Composition of buffers used for DNA extraction.
CTAB-Extraction buffer Washing buffer
CTAB 2 % ethyl alcohol 70 %
Na2EDTA [ pH 8.0] 20 mM NH4OAc 10 mM
ß-mercaptoethanol 0.2 %
NaCl 1.4 M TE-buffer
Na2S2O5 1 % Tris-HCl [ pH 8.0] 10 mM
Tris-HCl [pH 8.0] 0.1 M Na2EDTA [ pH 8.0] 1 mM
DNA concentration was determined using a Fluorometer (Model TK 100, Hoefer
Scientific Instruments, San Francisco, USA) and diluted to a final concentration of 25
ng/µl. The measurement is based on the attachment of the fluorescent dye H33258
(Hoechst) to the double stranded DNA. At 365 nm wavelength, this complex emits
light at 458 nm wavelength, which is measured by the fluorometer. For calibration of
the instrument, a calf thymus DNA solution (100 ng/µl) was used. Buffers and
solutions used for determining DNA concentration are listed in Table 5.
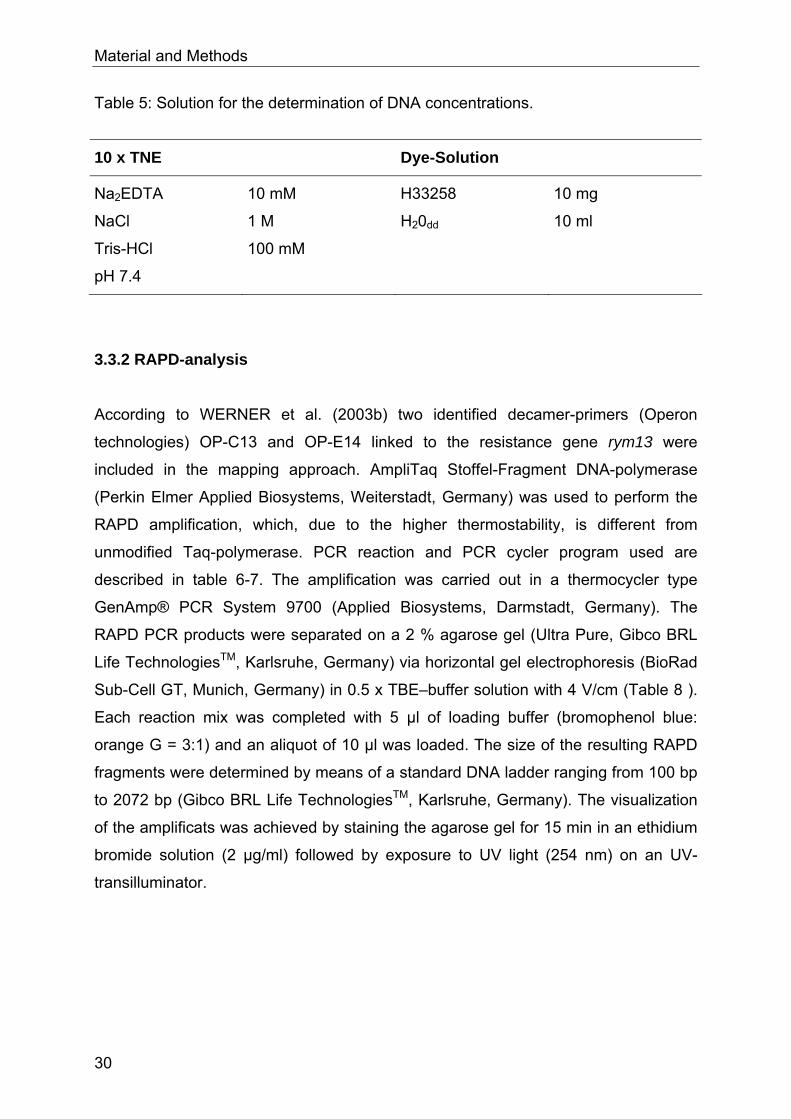
Material and Methods
30
Table 5: Solution for the determination of DNA concentrations.
10 x TNE Dye-Solution
Na2EDTA 10 mM H33258 10 mg
NaCl 1 M H20dd 10 ml
Tris-HCl 100 mM
pH 7.4
3.3.2 RAPD-analysis
According to WERNER et al. (2003b) two identified decamer-primers (Operon
technologies) OP-C13 and OP-E14 linked to the resistance gene rym13 were
included in the mapping approach. AmpliTaq Stoffel-Fragment DNA-polymerase
(Perkin Elmer Applied Biosystems, Weiterstadt, Germany) was used to perform the
RAPD amplification, which, due to the higher thermostability, is different from
unmodified Taq-polymerase. PCR reaction and PCR cycler program used are
described in table 6-7. The amplification was carried out in a thermocycler type
GenAmp® PCR System 9700 (Applied Biosystems, Darmstadt, Germany). The
RAPD PCR products were separated on a 2 % agarose gel (Ultra Pure, Gibco BRL
Life TechnologiesTM, Karlsruhe, Germany) via horizontal gel electrophoresis (BioRad
Sub-Cell GT, Munich, Germany) in 0.5 x TBE–buffer solution with 4 V/cm (Table 8 ).
Each reaction mix was completed with 5 µl of loading buffer (bromophenol blue:
orange G = 3:1) and an aliquot of 10 µl was loaded. The size of the resulting RAPD
fragments were determined by means of a standard DNA ladder ranging from 100 bp
to 2072 bp (Gibco BRL Life TechnologiesTM, Karlsruhe, Germany). The visualization
of the amplificats was achieved by staining the agarose gel for 15 min in an ethidium
bromide solution (2 µg/ml) followed by exposure to UV light (254 nm) on an UV-
transilluminator.

Material and Methods
31
Table 6: Reaction components of a 25 µl-PCR reaction mix for RAPD amplification.
Components Per reaction
DNA (5 ng/µl) 25 ng
decamer-primer (5 pmol/µl) 7.5 pmol
dNTPs (10 mM) 0.4 mM
MgCl2 (100 mM) 6.0 mM
PCR buffer 10x (Stoffel) 1x
AmpliTaq Stoffel-Fragment polymerase (10 U/µl) 1.5 U
H2Odd add 25 µl
Table 7: Amplification cycles of the RAPD reaction.
Cycles Phase Temperature Duration
1 x Denaturation 94°C 4 min
Denaturation 94°C 1 min
45x Annealing 36°C 1 min
Extension 72°C 2 min
1 x Fill in 72°C 7 min
Table 8: Composition of ingredients used for RAPD analysis.
10x TBE-buffer Loading Buffer
Tris HCl (Roth) 0.89 M Bromophenolblue 0.15 %
Boric acid (Roth) 0.89 M Ficoll 15 %
EDTA 0.5 M pH 8.0 0.5 M EDTA 100 mM
Orange G 0.15 %
Ficoll 15 %
EDTA 100 mM

Material and Methods
32
3.3.3 Microsatellite-analysis
A total of 45 simple sequence repeats (SSRs, microsatellites) were used for
genotyping the different barley populations (MAP 1-7). Out of these, 26 SSRs (Table
1-2, Appendix) evenly distributed on the seven barley chromosomes, were used for
BSA (see chapter 3.5). All microsatellites were amplified according to LIU et al.
(1996), RAMSAY et al. (2000) and THIEL et al. (2003). The diagnostic marker
Bmac0029 (rym4, rym5) was amplified according to GRANER et al. (1999a). PCR
reaction for each SSR which turned out polymorphic in BSA is shown in Table 10.
The different PCR cycling programs are shown in Table 3 in the appendix. PCR
amplifications of 65 wheat SSRs (Table 4-5, Appendix) were carried out according to
ROEDER et al. (1998), GUPTA et al. (2002) and SOMERS et al. (2004). In some
cases, the forward primer was 5’-end labelled with the fluorescence dye IRD 700 or
IRD 800 whereas in other cases a ‘tailed primer method’ (OETTING et al. 1995) was
used (Table 4, Appendix). This method employs a two-part primer. A standard
sequencing primer M13 or ‘tail’ is added to the 5’-end of the forward primer. The
forward primer binds specifically to the DNA sequence and can be amplified together
with the SSR-motif by a universal fluorescence labelled primer (M13) complementary
to the ‘tail’, thereby saving costs for labelling each SSR forward primer. All
microsatellites used for mapping are listed in Table 1 of the appendix including
sequence information, repeat motif, labelling, fragment size, PCR recipe, PCR
program and chromosomal localisation. SSR-amplification products were separated
on a denaturing polyacrylamide gel based on an 8 % Long Ranger Gel Solution
(FMC Biozym, Hessisch Oldendorf, Germany). The fluorescence-labelling allowed
the detection on a LI-COR DNA Sequencer GenReadir 4200 (MWG Biotech AG,
Ebersberg, Germany). An equal amount of formamide loading buffer was added to
the PCR-samples, which afterwards were denatured in a thermocycler at 95°C for 90
s. The electrophoresis was conducted in 1 x TBE Long Run Buffer under specific
conditions: 1500 V, 50 W, 35 mA and 48°C. Determination of the microsatellites
allele sizes was achieved by utilising a labelled standard ladder ranging from 50 to
350 bp. The chemical composition of gels and buffers used for SSR detection are
listed in Table 9. The EST derived microsatellite GBM 1015 was separated on a 2 %
agarose gel via horizontal gel electrophoresis (BioRad Sub-Cell GT, München,
Germany) in 0.5 x TBE–buffer with 4 V/cm like described before for the RAPD

Material and Methods
33
amplification (see chapter 3.3.2).
Table 9: Compounds of solutions and buffers used for gel electrophoresis.
PAA-gel solution 8% 10 x TBE Long Run
Buffer
Long Ranger PAA Solution
50 % (FMC, Biozym,
Hessisch Oldendorf)
16 ml tris-HCl (Sigma)
boric acid (Sigma)
EDTA (Sigma)
1340 mM
450 mM
25 mM
urea (USB, Cleveland, USA) 42 g H20dd add 1 l
10 x TBE 10 ml
H20dd add 100ml
Gel Solution for a PAA-Gel
(0.25 mm, 25 cm)
Formamide-Loading-
buffer
PAA-Gel Solution 8 % 25 ml formamide (Sigma) 95 ml
TEMED (Sigma) 25 µl EDTA (Sigma) 2 ml
DMSO (Sigma) 250 µl basic fuchsine (Sigma) 0.1 g
APS, 10 % (Roth) 175 µl bromophenol blue 0.01 g
H20dd add 100 ml

Material and Methods
34
Material and Methods
35
3.3.4 AFLP-analysis AFLP analysis was essentially carried out according to VOS et al. (1995). DNA
restriction and ligation was performed using the AFLP Core Reagent Kit (Gibco Life
Technologies, Eggenstein, Germany). 150 ng of genomic DNA was digested with the
restriction enzymes EcoRI (5’-G/AATTC-3’) and MseI (5’-T/TAA-3’) according to the
manufacturers’ instructions in a thermocycler at 37°C for two hours and a final
enzyme inactivation at 70°C for 15 min. Adapters with complimentary sequences to
the restriction enzymes’ recognition sites were ligated to the specific restriction sites
of the DNA fragments by T4-ligase. Incubation of the samples was carried out in a
thermocycler at 20°C for two hours. A 1:10 dilution in TE-AFLP-buffer was used as
DNA template for the following pre-amplification steps. Ligation was followed by two
pre-amplification steps using primers complementary to each of the two adapter
sequences. First, non-selective AFLP primers E-00 and M-00 were used in order to
reduce unspecific background on polyacrylamide gels (+0 pre-amplification), followed
by an amplification using primers (E01 and E02 as well as M01 and M02)
complementary to each of the two adapter sequences with one additional selective
nucleotide (+1 pre-amplification). Thus, amplification of only 1/16th of EcoRI-MseI
fragments occurred. The PCR-reaction of the +0 pre-amplification was diluted 1:10
and used as DNA template for the +1 pre-amplification. The components of the PCR-
reaction and the PCR cycle profiles of the +0/+1 pre-amplification are listed in Table
12+13. The sequences of the primers are listed in Table 11.
Table 11: AFLP sequences for the +0/+1 pre-amplification.
Primer Primer name Sequence
+0-EcoRI-primer E00 5' - GAC TGC GTA CCA ATT C - 3'
+0-MseI-primer M00 5' - GAT GAG TCC TGA GTA A - 3'
+1-EcoRI-primer E01 5' - GAC TGC GTA CCA ATT CA - 3’
+1-EcoRI-primer E02 5’ - GAC TGC GTA CCA ATT CC - 3’
+1-MseI-primer M01 5’ - GAT GAG TCC TGA GTA AA - 3’
+1-MseI-primer M02 5' - GAT GAG TCC TGA GTA AC - 3'

Material and Methods
36
Table 12: Composition of the +0/+1 pre-amplification reaction mix.
+0 pre-amplification +1 pre-amplification per reaction
DNA template 5µl of a 1:10 dilution
of the ligation
5µl of a 1:10 dilution
of the +0 pre-
amplification
polymerase-buffer 10x 5µl 5µl 1x
dNTPs (10 mM) 1µl 1µl 0.2 mM
EcoRI-primer (50 ng/µl) 1.5 µl E00 1.5 µl E01 or E02 75 ng
MseI-primer (50 ng/µl) 1.5 µl M00 1.5 µl M02 or M01 75 ng
Taq-polymerase 0.2 µl 0.2 µl 1 U
H20dd add 50 µl add 50 µl
Table 13: Amplification cycles of the +0/+1 analyses.
Steps Reaction Temperature Time Cycles
1 Denaturation 94°C 3 min 1 x
2 Denaturation
Annealing
Polymerisation
94°C
56°C
72°C
30 s
60 s
60 s
20 x
3 Fill in 72°C 5 min 1 x
The PCR reaction of the +1 pre-amplification was diluted 1:20 with TE buffer and
used as template for the selective amplification (+3-amplification). This amplification
was carried out using primers with three additional selective nucleotides (Table 14).
The compounds of the PCR reactions and the PCR-cycle profile are listed in Table
15+16. For AFLP-detection the PCR products were separated on a polyacrylamide
(PAA)-gel using the same protocol as described before for SSR-detection (see
chapter 3.3.2). In each case the EcoRI primer was labelled at the 5'-end with
fluorescence dye IRD700 or IRD800 (MWG Biotech). Electrophoresis was conducted
in 1 x Long Run TBE buffer at 1.500 V, 40 W, 40 mA and 48°C. Determination of the
generated fragment sizes was achieved using the 50 to 700 bp standard ladder.

Material and Methods
37
Table 14: AFLP-sequences for the +3 amplification.
Primer Selective bases Primer Selective bases
E31 5' - ... AAA - 3' M47 5' - ... CAA - 3'
E32 5' - ... AAC - 3' M48 5' - ... CAC - 3'
E33 5' - ... AAG - 3' M49 5' - ... CAG - 3'
E36 5' - ... ACC - 3' M50 5' - ... CAT - 3'
E39 5' - ... AGA - 3' M51 5' -… CCA - 3'
E40 5' - ... AGC - 3' M52 5‘ -… CCC - 3'
E43 5' - ... ATA - 3' M53 5' -… CCG - 3'
E51 5’ - ... CCA - 3’ M54 5' -… CCT - 3'
E53 5’ - ... CCG - 3’ M55 5' -… CGA - 3'
E56 5’ - ... CGC - 3’ M56 5' -… CGC - 3'
M36 5’ - ... ACC - 3’ M57 5' - ... CGG - 3'
M39 5’ - ... AGA - 3’ M58 5' - ... CGT - 3'
M40 5’ - ... AGC - 3’ M59 5' - ... CTA - 3'
Table 15: Composition of the +3 pre-amplification reaction mixes.
+3 amplification per reaction
DNA template 5µl of a 1:20 dilution of the
+1 pre-amplification
polymerase-buffer 10x 2 µl 1x
dNTPs (10 mM) 0.4 µl 0.2 mM
EcoRI-primer (50 ng/µl) 0.25 to 1.5 µl 7.5 to 12.5 ng
MseI-primer (10 ng/µl) 3 µl 30 ng
Taq-polymerase 0.08 µl 0.4 U
H20dd add 20 µl

Material and Methods
38
Table 16: Amplification cycles of the +3 amplification.
Steps Reaction Temperature Time Cycles
1 Denaturation 94°C 3 min 1 x
2 Denaturation
Annealing
Polymerisation
94°C
65°C
(-0.7°C/cycle)
72°C
30 s
30 s
60 s
12 x
3 Denaturation
Annealing
Polymerisation
94°C
56°C
72°C
30 s
30 s
60 s
22 x
4 Fill-in 72°C 5 min 1 x
3.4 Bulked segregant analysis (BSA)
According to the phenotypic data, bulks comprising equal amounts of 10 barley
DNAs of the respective DH lines (susceptible/resistant) were constructed for BSA
(MICHELMORE et al 1991). For the identification of polymorphic SSRs, 26
microsatellites (Table 1, Appendix) uniformly distributed over the seven barley
chromosomes were screened for polymorphisms between these two bulks. To detect
linkage of the polymorphic microsatellites, the 10 DH lines included in each bulk were
tested. In case linkage was detected, the whole population was analysed with this
SSR and additional SSRs located in the same region were screened on the bulks
and mapped accordingly (see chapter 3.3.3). The same procedure was applied to
AFLPs.

Material and Methods
39
3.5 Data analysis
3.5.1 Genetic mapping of BaMMV/BaYMV resistance loci
Linkage analysis of the barley mapping populations was performed with the JoinMap
3.0 software (STAM & VAN OOIJEN 1995). Crossover units were converted into map
distances (cM) by applying the Kosambi function (KOSAMBI 1944). By using the chi-
square test it was determined, whether the observed data were compatible to the
expected values of a 1:1 segregation ratio of the DH populations or whether there
was a distorted segregation ratio. A threshold log likelihood ratio (LOD) of 3.0 was
used to arrange markers into linkage groups.
3.5.2 Estimation of genetic diversity and genetic relatedness
Based on the analyses of 40 SSRs and 30 AFLP primer combinations the genetic
diversity and genetic similarity of wheat breeding lines and cultivars was estimated
based on the presence (1) or absence (0) of bands using the software package
RFLP-Scan 2.0. The resulting 0/1 matrix includes both monomorphic and
polymorphic bands. The genetic similarity was estimated according to NEI and LI
(1979), which is corresponding to the Dice coefficient (DICE 1945):
GS=2a/2a+b+c
whereby a refers to alleles shared between two varieties, and b and c refer to alleles
present in either one of the two varieties. On the basis of the Dice similarity matrix,
Unweighted Pair Grouped Method Arithmetic Average (UPGMA-) clustering of the
different wheat genotypes was carried out using the Sequential Agglomerative
Hierarchical and Nested (SAHN) method of the software package NTSys-pc 1.7. The
genetic diversity of SSR data was estimated based on the number of alleles per
locus and the mean diversity index (DI) over all loci was calculated according to NEI
(1973):
where xij is the frequency of the i th allele of locus j and n is the number of loci.
The Shannon-Weaver Index (also called Shannon-Wiener Index, SHANNON-
WEAVER 1949) H’ was used to analyse genetic diversity of the AFLP data due to the

Material and Methods
40
dominant character of this marker type. This index takes into account the phenotypic
frequency:
whereas S is the number of species and pi is the relative abundance of each species.
The analysis was performed by the software POPGENE 1.32.
In order to get information of the usefulness of the SSRs the polymorphic information
content (PIC) of the different microsatellites was calculated (see Chapter 4.3). The
polymorphic information content (PIC) is a tool to measure the informativeness of a
given SSR marker. According to WEBER (1990) and ANDERSSON et al. (1993), the
PIC-value was calculated as follows:
whereby k is the total number of alleles detected for a microsatellite and Pi is the
frequency of the ith allele in the set of wheat genotypes investigated.

Results
41
4 Results The main objective of this work was to identify and characterise new or already
known resistances resources in barley and wheat against soil-borne viruses, i.e.
Barley yellow mosaic virus (BaYMV), Barley mild mosaic virus (BaMMV) in barley
and Wheat spindle streak mosaic virus (WSSMV) and Soil-borne cereal mosaic virus
(SBCMV) in wheat. Therefore, molecular markers were used to map resistance
genes of diverse origin in different DH populations of barley and fingerprint resistant
or tolerant cultivars and landraces in wheat.
4.1 Screening of germplasms for the presence of rym4/rym5
In order to identify donors of new resistance genes against barley yellow mosaic
virus disease carrying genes different from rym4 and rym5, 120 gene bank
accessions, resistant against BaYMV in Japan, were analysed by using the SSR
marker Bmac0029
being closely linked to
the rym4/rym5 locus
and being to some
extent diagnostic for
these different alleles.
In these studies it turned out, that out of the screened exotic germplasm 12
genotypes revealed a fragment size of 145 bp indicative for rym4, 44 showed the
size of 148 bp indicative for rym5 and 61 genotypes carried different fragment sizes
ranging from 140 to 170 bp (Fig. 1). Those remaining genotypes not carrying rym4 or
rym5 are potential candidates for detecting new resistance genes. Detailed results of
detected fragment size after screening the barley accessions are given in Table 17.
To identify new resistance resources, the remaining 61 genotypes were evaluated for
resistance against the European strains of BaYMV and BaMMV in a one year trial at
three locations. After the screening, ‘Chikurin Ibaraki 3’, ‘Hakusanmugi’, ‘Hongcheon
Anjeunbaengi 2’, ‘Ramsar’, ‘Sekitori 2’, ‘Turkey 3’ and ‘Turkey 179’ turned out to be
resistant to the common European strains BaMMV, BaYMV and BaYMV-2 (Heidi
Jaiser, personal communication). Therefore, these accessions represent useful

Results
42
Table 17: Screening of 120 gene bank accessions with the SSR marker Bmac0029. Name Fragment
size
Name Fragment
size
Name Fragment
size
Adi Abun 2 168 Hiroshima 148 Sipche 14 145
Addis Ababa 64 168 Hongcheong Anjeunbaengi 2 168 Sululta 4 168
Baku 3 157 Hongseong Native 148 Sululta 10 168
Baegsan Santoku 1 148 Hosomugi 3 148 Suweon 31 148
Boseong Covered 2 148 Hsingwuke 2 -* Taishomugi 172
Chame 8 168 Iwate Hozoroi 1 148 Tatung 168
Cheongyang Covered 2 139 Juichang 2 148 Thonje 16 145
Changweon Jecheon 51 148 Jungbori 20 148 Thonje 19 168
Chihchou yinchiaai 3 148 J. 20 145 Tibilisi 1 148
Chikurin Ibaraki 3 168 Katana 2 159 Tibilisi 7 145
Chiuchiang 148 Keronja 2 145 Tsumje 3 145
Dabat 1 168 Keronja 3 145 Tochigi Torano-o 1 148
Debra Birhan 1 168 Keronja 5 145 Torano-o 148
Debra Birhan 7 168 Kinukawa Gozen 22 148 Torano-o 7 148
Deder 2 168 Kobinkatagi 4 148 Turkey 3 168
Dembi 3 168 Koshimaki 40 148 Turkey 29 164
Dhumpu 2 168 Kulubi 1 168 Turkey 33 168
Esfahan 1 168 Liussuchiao 1 148 Turkey 39 145
Esfahan 4 168 Liussuchiao 2 148 Turkey 41 168
Ethiopia 14 168 Mammuto 168 Turkey 44 164
Ethiopia 53 168 Masan Covered 5 148 Turkey 45 141
Ethiopia 65 168 Mota 1 168 Turkey 47 168
Ethiopia 80 168 Mota 7 168 Turkey 56 168
Ethiopia 89 168 Nagaoka 168 Turkey 62 168
Ethiopia 506 148 Nazareth 3 168 Turkey 68 168
Ethiopa 510 168 Oeyama Rokkaku 3 148 Turkey 77 168
Ethiopia 534 168 Paishapu 2 148 Turkey 83 168
France 7 168 Paoanchen 1 148 Turkey 86 145
Fushiguro 148 Ramsar 140 Turkey 101 145
Gangneung Covered 3 148 Russia 4 148 Turkey 179 168
Glyorgi 2 168 Sacheon Naked 148 Turkey 440 168
Gogseong Covered 4 148 Sakaiwa Rokkaku 27 148 Turkey 524 170
Goheung Covered 2 148 Samcheog Dolbori 148 Turkey 581 -*
Gondar 6 168 Sekitori 2 168 Turkey 723 168
Gorgan 1 148 Shanghai 1 148 Waegwan Covered 1 148
Gwangju Baitori 1 148 Shemakha 1 158 Yeoncheon Native 148
Hakusanmugi 168 Shemaka 2 165 Zairai Junkei 8 148
Hamyang Covered 9 148 Shemakha 3 -* Zairaishu 168
Hanhadaka 2 148 Shiro Omugi 79 148 70 g 168
Hayamugi 148 Sikha 10 145 9055 168
* - = unverifiably

Results
43
sources for broadening the genetic base of barley yellow mosaic virus disease in
Europe.
4.2 Identification and mapping of BaMMV resistance genes in different DH- populations 4.2.1 Mapping the resistance gene of ‘Cebada’ (MAP 1)
Due to breeders
information it was
supposed that the
resistance of ‘Cebada’ is
not due to rym4 or rym5.
The phenotyping of
resistance against
BaMMV after mechanical
inoculation suggested the
presence of one
resistance gene in this
DH population due to the
observed segregation
ratio of resistant vs. susceptible plants of 46:48 (Chi2 = 0.42, p=0.650). However,
since checking respective bulks with markers of each chromosome did not result in
any polymorphisms, resistant and susceptible bulks were screened with Bmac0029
being closely linked to the rym4/rym5 locus. As can be seen in Figure 2 the analysis
revealed that ‘Cebada’ carries rym5 because a fragment of 148 bp was detected in
‘Cebada’ being indicative for rym5 and a clear differentiation between the susceptible
and resistant bulk was observed. Therefore, no further molecular work was carried
out on this DH population.
4.2.2 Mapping the resistance gene of ‘Shimane Omugi’ (MAP 2)
In the DH population ‘Shimane omugi’ x ‘Sumo’ and ‘Shimane Omugi’ x ‘Gilberta’
(MAP 2) a segregation ratio of resistant vs. susceptible plants of 51: 46 (Chi2 = 0.257;

Results
44
Figure 3: Partial map of chromosome 6H including the BaMMV-resistance of
‘Shimane Omugi’.
p=0.612) was observed giving hint to a single recessive gene effective against
BaMMV. In the initial screening using BSA the BaMMV resistance of ‘Shimane
Omugi’ was mapped on chromosome 6H. Polymorphisms between the bulks
containing susceptible and resistant lines, respectively, were observed with
Bmac0018. Linkage of the BaMMV resistance to Bmac0018 has been confirmed by
analysis of the single lines included in these bulks. Furthermore, additional SSRs
located in the same chromosomal region of 6H were analysed on the bulks. In this

Results
45
respect well defined polymorphisms between bulks differing in their resistance to
BaMMV were detected for Bmac0127, Bmag0001, Ebmac0639, Ebmac0874,
HVM14, and HVM74. In order to achieve further marker saturation in this
chromosomal region AFLP based BSA was conducted with 96 EcoRI+3/MseI+3
AFLP primer combinations. Sixteen AFLP primer combinations revealed
polymorphisms between the parents as well as the susceptible and resistant bulks.
Out of these 16 promising primer combinations just six combinations E31M56,
E31M57, E31M58, E32M53, E40M54, and E40M57 revealed linkage on the DH lines
included in the bulks. The whole population was screened with these AFLP primer
combinations and the microsatellites mentioned above. The resulting linkage group
(Fig. 3) located on chromosome 6H comprises a length of 13.5 cM with six SSR
markers plus six AFLP markers. The marker with the closest linkage to the BaMMV
resistance locus is E40M54, which has been mapped in a distance of 2.2 cM.
E40M54 generated an additional fragment on lines carrying the resistance encoding
allele at 274 bp. Furthermore, three AFLP markers were detected to co-segregate at
a genetic distance of 3.3 cM. All three AFLP marker show an additional fragment in
resistant DH lines namely E31M56 at 234 bp, E31M57 at 508 bp and E40M57 at 500
bp. A second cluster comprises four microsatellite markers. These are HVM14,
Ebmac0874, Ebmac0639 and HVM74, which have been mapped at a distance of 4.7
cM from the resistance locus. HVM14 generated a resistant fragment at 157 bp
whereas susceptible lines reveal a fragment at 161 bp. HVM74 amplifies a fragment
of 216 bp in resistant lines and 228 bp in susceptible lines. The SSR markers
Ebmac0639 and Ebmac0806 amplified a fragment of 147 bp and 173 bp,
respectively, in resistant lines and 167 bp and 198 bp, respectively, in susceptible
lines.
4.2.3 Mapping the resistance gene of ‘CI 3517’ (MAP 3)
Alarmed by the results obtained in MAP1, ‘CI 3517’ and MAP 3 were screened with
Bmac0029 in a first step in order to exclude that ‘CI 3517’ may also carry rym5 or
rym4. Although it was shown that ‘CI 3517’ did not carry rym5 or rym4, 15 DH lines
out of 80 were identified in this DH population to carry rym4 and were thus excluded
from further analyses. In the remaining DH lines a segregation ratio of resistant (r) vs.
susceptible (s) of 1:1 (26r:38s; Chi2= 2.25; p= 0.134) was observed based on the

Results
46
Figure 4: Partial map of barley chromosome 4H including the BaMMV resistance of
´CI 3517´.
DAS-ELISA-results giving hint to a single recessive resistance gene effective against
BaMMV. Bulks were composed of six susceptible and six resistant lines of the DH-
population. In order to assign the resistance gene to a chromosome SSRs (listed in
Table 1, Appendix) were analysed in a first step. Polymorphisms between the bulks
were revealed by microsatellite Bmag0353 on chromosome 4H. Additional
microsatellites located in the same chromosomal region were analysed in order to
identify more closely linked markers. In this respect, additional polymorphisms

Results
47
between the bulks were detected for Bmac0384, Ebmac0906, Bmac0181, HVM03,
HVM68 and Bmac0310. The remaining population comprising 65 DH lines was
genotyped with these markers. Based on the genotypic data, the BaMMV resistance
was mapped with the closest linkage at a distance of 8.4 cM to the co-segregating
SSR markers Bmac0384, Bmac0181, Ebmac0906, and HVM03 (Fig. 4). The SSR
markers HvOle and HVM40, which are located in the direction of the centromer,
turned out to be monomorphic.
4.2.4 Mapping the resistance gene of ‘Belts 1823’ (MAP 4)
It was known that ‘Franziska’, one of the parents of the population MAP 4, carries
rym4. Therefore, the population has been primarily screened with SSR marker
Bmac0029 in order to identify lines carrying the resistance encoding allele at the
rym4/rym5 locus, which had to be excluded from mapping as they are not informative
for mapping the resistance of ‘Belts 1823’. In this respect it turned out that ‘Belts
1823’, which is the donor of the assumed new resistance of MAP 4, possesses rym5.
Therefore, no further analysis was performed on this population.
4.2.5 Mapping the resistance gene of ‘Chikurin Ibaraki 1’ (MAP 5)
The phenotyping of resistance against BaMMV after mechanical inoculation
suggested the presence of one resistance gene in the MAP 5 DH population due to a
detected segregation of 78 resistant to 85 susceptible lines fitting a 1:1 segregation
ratio (Chi2 = 0.301; p=0.583). In order to localise the BaMMV resistance, DNA bulks
were composed and analysed by microsatellite markers. Primary screenings
revealed polymorphisms between the bulks consisting each of 15 completely
resistant lines and susceptible lines with Bmac0018 and Ebmac0806 located on
barley chromosome 6H. Further analysis, first on the members of the bulks then on
the whole population confirmed linkage between the resistance locus and these two
markers. Consequently, additional microsatellite markers located in the same region
of chromosome 6H were screened. Additional polymorphisms between the single
lines included in these bulks were detected for Bmac0127, Bmag0001, Ebmac0639
and Ebmac0874. Therefore, all 163 DH lines of the cross were analysed with these
SSR markers resulting in a linkage group of six mapped SSRs (Fig. 5). The map
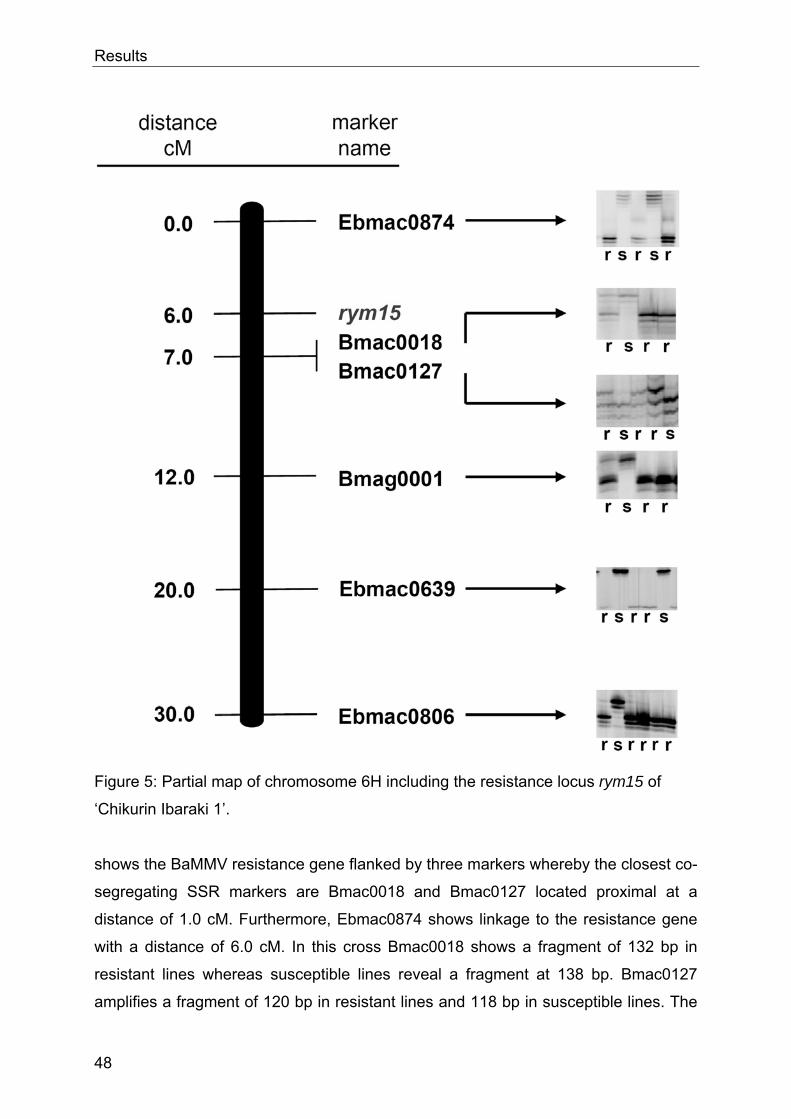
Results
48
Figure 5: Partial map of chromosome 6H including the resistance locus rym15 of
‘Chikurin Ibaraki 1’.
shows the BaMMV resistance gene flanked by three markers whereby the closest co-
segregating SSR markers are Bmac0018 and Bmac0127 located proximal at a
distance of 1.0 cM. Furthermore, Ebmac0874 shows linkage to the resistance gene
with a distance of 6.0 cM. In this cross Bmac0018 shows a fragment of 132 bp in
resistant lines whereas susceptible lines reveal a fragment at 138 bp. Bmac0127
amplifies a fragment of 120 bp in resistant lines and 118 bp in susceptible lines. The

Results
49
two co-segregating microsatellites Bmac0018 and Bmac0127 are ideal DNA markers
for marker assisted selection due to their small genetic distance of 1.0 cM.
4.2.6 Mapping the resistance gene of ‘Taihoku A’ (MAP 6)
On the basis of earlier work (WERNER et al. 2003b) it was known that ‘Taihoku A’
contains a new BaMMV resistance gene also referred to as rym13 located on
chromosome 4H. Recently, HABEKUSS et al. (2006) described a new German
BaMMV strain, against which ‘Taihoku A’ also confers resistance after mechanical
infection. Using a subset of the original mapping population ‘Taihoku A’ x ‘Plaisant’,
which was enlarged by 64 DH lines of up to 154 DH lines, mechanical inoculation
and DAS-ELISA was carried out. A segregation ratio of 87r: 67s (p=0,107; Chi2=
2.59) confirmed that rym13 also confers resistance against the new German strain of
BaMMV. BSA was carried out with so far untested SSRs and with AFLPs to identify
more closely linked markers to the resistance gene. At that time the closest SSR
marker (WMS06) had been mapped proximal of rym13 at a distance of 15.2 cM
(WERNER et al. 2003b). Furthermore, a marker cluster comprising the AFLP
markers E53M36, E53M40 and the RAPD marker OP-C13 located 6.7 cM distally
was identified (WERNER et al. 2003b).
Unfortunately, in this region of chromosome 4H only few microsatellites are known.
Therefore, EST derived SSRs’ (THIEL et al. 2003), kindly provided by Prof. Andreas
Graner, IPK Gatersleben, were used for BSA. Polymorphisms between the two bulks
containing 10 resistant and 10 susceptible DH lines were only observed with
GBM1015. To find polymorphism on the different bulks a subset of 256
EcoRI+3/MseI+3 AFLP primer combination was applied for BSA. Eleven
EcoRI+3/MseI+3 AFLP primer combinations showed polymorphism on these bulks.
Three combinations differentiated between the several DH lines included in the bulks
and were used for mapping. E33M56 (250 bp) and E43M59 (285 bp) generated an
additional fragment on the resistant lines (Figure 6). The map comprises a length of
39.1 cM with seven AFLP markers, three microsatellite markers and two RAPD
markers, with the closest markers being linked at a distance of 1.0 cM to rym13. This
marker is E53M36, which shows an additional fragment on resistant DH lines at 105
bp. GBM1015, E51M40 and the RAPD-marker OP-C13, which are co-segregating,

Results
50
Figure 6: Partial map of chromosome 4H including rym13 of ‘Taihoku A’.
mapped at a genetic distance of 1.5 cM proximal to rym13. OP-C13 generated bands
of 900 bp in the resistance donor ‘Taihoku A’. The AFLP primer combination E51M40
(120 bp) showed an additional fragment on lines carrying the resistance encoding
allele. GBM1015 amplified a fragment of 100 bp in resistant lines and bands of 200
bp were detected in susceptible lines. They are all located proximal to the resistance
locus. Furthermore, linkage was detected for the microsatellite marker HVM67 with a
recombination rate of 4.3 cM. DH lines with the susceptibility encoding allele revealed

Results
51
a fragment of 115 bp and the resistant lines showed a smaller fragment of 112 bp
after using HVM67.
4.2.7 Mapping the resistance gene of ‘Muju covered 2’ (MAP 7)
In the DH population ‘Muju covered 2’ x ‘Spirit’ a segregation ratio of 51 resistant to
100 susceptible lines (Chi2= 15.90, p= 6.675) was found after a resistance test
against BaMMV. This segregation ratio does not fit to the expected 1r:1s segregation
as an excess of susceptible plants was observed which may be due to different
suitability of the parental lines for tissue culture procedures. Due to former analyses
by GRANER et al. (1996) it was known, that the resistance of ‘Muju covered 2’ is
localised on chromosome 4H. In order to map this BaMMV resistance bulks were
composed and analysed by SSR markers located on this chromosome.
Polymorphisms were found only with HVM67 and Ebmac0788 because of the limited
availability of microsatellites in this region of chromosome 4H. WMS06 located on the
long arm of chromosome 4H was monomorphic between the bulks. Therefore, EST
derived SSRs, kindly provided by Prof. Andreas Graner, IPK Gatersleben, were
additionally analysed. Out of these only GBM1015 was polymorphic and used
besides the two above mentioned SSRs for mapping. Based hereon, a genetic map
was constructed based on 154 DH lines with a length of 38.7 cM (see Figure 7). The
SSR marker with the closest linkage to the BaMMV-resistance is Ebmac0788
mapped within a distance of 7.8 cM. Furthermore, linkage to the resistance gene was
detected for GBM1015, located distally with a distance of 23.9 cM. The linkage of
HVM67 is rather loose with a recombination rate of 30.9 cM to the resistance locus.
4.3 Estimation of genetic relatedness of wheat cultivars and breeding lines
The aim of this work was to reveal the genetic relatedness within a subset of wheat
genotypes and breeding lines resistant against Soil-borne cereal mosaic virus
(SBCMV) compared to a few tolerant varieties. Therefore, 1146 wheat cultivars had
been evaluated by different breeders (see Material and Methods chapter 3.2) in field
trials in Vatan, France, for resistance. Out of all screened wheat genotypes 64
interesting, predominantly resistant wheat genotypes were selected for analysis of
genetic relatedness by fingerprinting with 40 SSRs and 30 +3-AFLP primer

Results
52
Figure 7: Partial map of barley chromosome 4H including the BaMMV resistance of
‘Muju covered 2’.
combinations. Genetic analyses with the 40 SSRs resulted in the detection of 305
alleles, whereas the number of alleles per locus was on average 7.5 within the range
of 1 to 17. In addition, the Polymorphic Information Content (PIC) value was
estimated, which gives information about the usefulness of a SSR regarding marker
development in breeding programmes and estimation of genetic diversity. The SSR
marker with the highest PIC-value is wmc276 (0.89) whereas the monomorphic
wmc41 shows the lowest value (0.00). All results and further information of the 40
SSRs are given in Table 18. Based on the presence or absence of the amplification
of alleles, the pair-wise genetic similarity (GS) according to NEI and LI (1979), which

Results
53
corresponds to the likelihood that an allele is generated in a second genotype, was
analysed ranging from 0.19 to 0.86 with an average of GS=0.49. The minimum
genetic similarity of 0.19 was observed between the genotypes ‘Enesco’ vs.
‘Sponsor’ and the maximum genetic diversity of 0.86 was found between the Danish
breeding lines ‘701-176c’ vs. ‘701-177c’. The mean genetic diversity (DI) across the
loci within the analysed set of wheat genotypes was DI=0.57. An UPGMA-cluster
analysis, based on the 0/1-matrix derived GS, was carried out (Fig. 8). The
dendrogram reveals a strong differentiation of the French cultivars (from ‘Tremie’ to
‘Gaspard’) from the rest of the analysed wheat lines due to their origin. However, no
clear grouping could be observed within the remaining genotypes, but the high level
of genetic diversity in the analysed set indicated a sufficient level of genetic diversity
within these SBCMV resistant lines.
Regarding AFLP data, 1847 fragments were detected in total. The genetic similarity
(GS) was estimated between 0.50 and 0.97 with an average of GS=0.74. The
maximum similarity was observed between the French cultivars ‘Tremie’ vs. ‘Taldor’,
whereby the minimum genetic similarity of 0.50 was found between the cultivars
‘Sponsor’ vs. ‘Enesco’. Genetic diversity according to the Shannon-Weaver Index
was H’=0.521, whereas the percentage of polymorphic loci added up to 88.2%.
Within the wheat accessions of the three different breeding companies the genetic
diversity was calculated on a similar level between the lines of the German
(H’=0.439) and the Danish (H’=0.443) breeding company. The genetic diversity of the
genotypes within the French group was clearly higher with H’=0.524. The UPGMA
cluster analysis based on UPGMA is shown in Figure 9. Similar results as mentioned
for the SSR analysis were obtained with AFLPs. The French cultivars of the group
‘Tremie’ to ‘Gaspard’ are separated from the rest of wheat genotypes. A stronger
grouping according to their origin, respectively to the breeding companies, was
observed for the rest of the lines. Detailed information about the different genotypes
has to be concealed with respect to further breeding programs at each breeding
company.

Results
54
Table 18: Chromosomal location, number of alleles and the PIC-values per locus for
40 wheat SSRs.
SSR Chromosome Alleles PIC-value
wmc24 1A 13 0.67
wmc254 1A 07 0.48
wmc177 2A 07 0.69
wmc264 3A 06 0.75
gwm513 4A 05 0.57
psr6465 4A 02 0.17
wmc219 4A 05 0.26
barc117 5A 04 0.65
gwm129 5A 06 0.56
gwm304 5A 10 0.88
gwm415 5A 06 0.70
wmc215 5A 10 0.74
wmc398 6A 05 0.55
wmc168 7A 07 0.59
wmc44 1B 13 0.76
wmc149 2B 13 0.76
wmc245 2B 02 0.49
barc147 3B 05 0.43
wmc78 3B 07 0.77
wmc307 3B 07 0.57
wmc322 3B 06 0.68
wmc418 3B 05 0.67
wmc625 3B 08 0.41
wmc754 3B 13 0.85
wmc777 3B 04 0.22
barc20 4B 07 0.75
wmc47 4B 09 0.40
wmc238 4B 10 0.86
wmc710 4B 11 0.68
gwm539 5B 07 0.40
wmc104 5B 06 0.59
wmc276 7B 17 0.89
wmc147 1D 08 0.28
wmc41 2D 01 0.00
wmc167 2D 09 0.48
wmc601 2D 14 0.85
wmc52 4D 04 0.12
wmc331 4D 15 0.67
psr6394 5D 08 0.70
wmc161 5D 07 0.61

Results
55

Results
56

Discussion
57
5 Discussion 5.1 Identification of new resistance donors against barley yellow mosaic virus disease As a result of extensive screening programmes several exotic germplasms were
identified within the primary barley gene pool showing resistance against all known
strains of the barley yellow mosaic virus disease (GÖTZ & ORDON 1993, ORDON et
al. 1993), but due to co-evolution of the virus (HARIRI et al. 2003, HABEKUSS et al.
2006), i.e. the detection of new resistance breaking virus strains, new sources of
resistance have to be identified. Therefore, it is of prime interest to identify new
varieties possessing a BaMMV/BaYMV resistance, which is not allelic to the BaMMV
resistance genes rym4 (ORDON & FRIEDT 1993) or rym5, because these have
already been overcome by new strains of these viruses. In this context, exotic
germplasms, although their agronomic traits are not outstanding, become more and
more important for broadening the genetic base of resistance against BaYMV
disease (ORDON & FRIEDT 1994). The main objective of the present study was to
identify new resistance genes against BaMMV/BaYMV and respective molecular
markers by screening resistant genetic resources for known PCR-based markers for
rym4/rym5 and analysing segregating DH populations. In order to identify new
resistance donors against BaYMV/BaMMV 120 exotic gene bank accessions, which
are resistant against BaYMV in Japan, were analysed in the present study with the
diagnostic SSR marker Bmac0029 for rym4 and rym5 resistance. The genotypes,
which are not carrying rym4 or rym5, are potential candidates for the identification of
new resistance genes. After evaluation of the BaYMV/BaMMV resistance of these
exotic germplasms in greenhouse and field trials the varieties ‘Chikurin Ibaraki 3’,
‘Hakusanmugi’, ‘Hongcheon Anjeunbaengi 2’, ‘Ramsar’, ‘Sekitori 2’, ‘Turkey 3’ and
‘Turkey 179’ were identified to be resistant against BaMMV, BaYMV and BaYMV-2
(H. JAISER personal communication) and carrying genes different from rym4/rym5.
Therefore, these are useful sources for further breeding programmes to broaden the
genetic base of resistance against the barley yellow mosaic virus complex. These
germplasms can now be crossed to high yielding barley varieties to develop new
resistant cultivars. However, in tests for allelism it has to be verified, if these exotic
genotypes possess already known resistance genes like rym11, rym12 and rym13,

Discussion
58
which impart resistance against all known strains of BaYMV, or if the varieties
possess new, not yet identified, resistance genes. Despite only a few newly detected
virus strains which are able to overcome already known resistance genes in Europe
up to now, the search of new resistance donors is an ongoing task, because of the
enduring risk of co-evolution. Regarding the present situation seven strains of
BaYMV and two of BaMMV have been described in Japan (NOMURA et al. 1996),
whereas in France and Germany new variants of BaMMV have been reported which
have overcome the resistance genes being effective so far (HARIRI et al. 2003,
KANYUKA et al. 2004, HABEKUSS et al. 2006). Beside the primary barley gene
pool, the secondary gene pool, i.e. Hordeum bulbosum, is used to improve BaYMV
resistance. Hordeum bulbosum possesses a lot of useful traits like several disease
resistances (PICKERING et al. 2000, WALTHER et al. 2000). Due to problems with
hybrid instability, interspecific incompatibility and endosperm degeneration the
transfer of genetic material was previously limited, but these problems have been
solved almost completely (PICKERING & JOHNSTON 2005). Through interspecific
crosses loci from Hordeum bulbosum, which confer resistance against BaYMV,
scald, stem rust, and powdery mildew, were transferred into the Hordeum vulgare
genome (PICKERING et al. 1995, RUGE et al. 2003, RUGE-WEHLING et al. 2006,
PICKERING et al. 2006, SHTAYA et al. 2007).
5.2 Mapping of new resistance genes against Barley yellow mosaic virus The aim of the present work was to identify and localize new resistance genes and to
develop closely linked molecular markers in addition to those genes already known.
Therefore, seven different DH populations were used for mapping purposes. The
total offspring of all seven crosses between a new resistance donor and a
susceptible variety were screened with the diagnostic marker Bmac0029 to identify
rym4 and rym5 resistance donors. By this approach, the offspring of the cross
‘Cebada’ x ‘Cleopatra’ and the cross ‘Belts 1823’ x ‘Franziska’ were identified to carry
the recessive resistance genes rym5 and rym4, respectively. Both genes have
successfully been mapped already (SCHIEMANN et al. 1997, GRANER et al. 1999a,
PELLIO et al. 2005). Map based cloning and sequencing revealed that rym4 and
rym5 are two alleles of the same gene and encode a eukaryotic translation initiation
factor 4E (Hv-eIF4E, STEIN et al. 2005). Since sequence information is already
available and rym4 and rym5 are no longer effective against certain BaYMV strains

Discussion
59
(HARIRI et al. 2003, HABEKUSS et al. 2006), no further analysis and mapping was
carried out on these DH populations.
5.2.1 Mapping resistance genes on chromosome 4H The resistance locus of the variety ‘CI 3517’ was mapped on chromosome 4H, with
the closest linkage revealed by a cluster of SSR markers (Bmac0384, Bmac0181,
Ebmac0906 and HVM03) in a distance of 8.4 cM. In comparison to the map position
of the recessive resistance locus rym11 of the DH mapping population ‘IPK1’ and
‘IPK2’ on chromosome 4H (NISSAN-AZZOUZ et al. 2005) allelism with the resistance
locus of ‘CI 3517’ can be hypothesized because all three maps (see Fig. 10) show
the same SSR markers linked, located all in the centromeric region of chromosome
4H. The map of ‘CI 3517’ compared with the partial map of ‘IPK1’ published by
NISSAN-AZZOUZ et al. (2005) and the barley consensus map (VARSHNEY et al.
2007) revealed only some slight rearrangements of the marker order (see Fig. 10).
The SSR markers Bmac0384 and Bmac0181 have been mapped proximally to
rym11 (NISSAN-AZZOUZ et al. 2005) contrary to the DH population of ‘CI 3517’,
where a co-segregation with other SSR markers distally to the resistance locus was
observed (NISSAN-AZZOUZ et al. 2005). Furthermore, the order of the flanking
marker located distally is inversed compared to the barley consensus map published
by VARSHNEY et al. (2007). The SSR marker HVM03 has been mapped distally to
the resistance gene in the DH population of ‘CI 3517’, whereas the marker has been
mapped proximally to rym11 in the ‘IPK2’ map. These differences between the order
of the markers and the map distances are assumed to be due to the size of the
mapping populations, because in smaller mapping population estimations of
recombination frequencies are not as accurate as in larger populations. Therefore
rearrangements may be due to the higher resolution of the rym11 region of ‘IPK1’
(191 DH lines) and ‘IPK2’ (161 DH lines) in comparison to the rym region of 65 DH
lines of the population ‘CI 3517’ x ‘Reni (see Fig. 10). In addition, it has to be taken
into account that SSR markers are clustering in the centromeric region (RAMSAY et
al. 2000, LI et al. 2003) and a suppressed recombination occurs in proximal
chromosome regions (KÜNZEL et al. 2000) leading to differences in the estimations
of genetic distances. Furthermore, the order of SSR markers can vary due to the
application of the AFLP markers in mapping of genes like applied to map the
resistance genes of ‘IPK1’ and ‘IPK2’. Based on earlier works by WERNER et al.

Discussion
60

Discussion
61
(2003b), the resistance gene rym13 of ‘Taihoku A’ mapped on chromosome 4H, like
the earlier described resistance genes rym1 (OKADA et al. 2004), rym8 (BAUER et
al. 1997) rym9 (WERNER et al. 2000a), the above mentioned rym11 (BAUER et al.
1997, NISSAN-AZZOUZ et al. 2005) and rym12 (GRANER et al. 1996). The closest
linked markers in the mapping approach of WERNER et al. (2003b) revealed a
cluster comprising the AFLP markers E53M36, E53M40 and the RAPD marker OP-
C13 located 6.7 cM distally of the resistance gene rym13. Therefore, in the present
work more closely linked single markers were identified by enlarging the mapping
population to an entire DH population of 154 lines and mapping of additional AFLP
markers. In doing so, a new linkage map was generated, comprising seven new
AFLP markers, three microsatellite markers and two RAPD markers with the closest
one present in a distance of 1.0 cM to the BaMMV resistance locus rym13 (Fig. 11
B). Regarding the mapped SSR markers HVM67 and WMS06, the results suggest
that the resistance gene rym13 is located within the same genomic region like the
resistance gene rym9 from ‘Bulgarian 347’ (WERNER et al. 2000b, see Fig. 11). In
both cases, HVM67 shows a closer linkage to the resistance genes compared to
WMS06. On the basis of a preliminary allelism test (WERNER 2002) it can be
deduced that rym13 and rym9 are not allelic like the rym4/rym5 resistance locus
(STEIN et al. 2005), but additional test are necessary to confirm these results.
As a result of previous studies by GRANER et al. (1996) it is known, that the
resistance gene rym12 is located on chromosome 4H, too. In the present study,
rym12 is mapped in the cross ‘Muju covered 2’ x ‘Spirit’ by the use of SSR markers of
the long arm of chromosome 4H. Due to the limited availability of microsatellites in
this region, polymorphisms between the bulks were only found by using the markers
HVM67, Ebmac0877, and the EST derived SSR GBM1015. Ebmac0877 is distally
the closest linked marker to the resistance locus with a distance of 7.8 cM (D, Figure
11). With respect to the other linkage maps mentioned above the SSR marker
WMS06 does not reveal polymorphisms in the ‘Muju covered 2’ x ‘Spirit’ map.
BAUER et al. (1997) mapped the resistance gene rym8, which shows only partial
resistance against BaMMV and BaYMV (GRANER et al. 1999b), in the telomeric
region of chromosome 4H in the map interval between the RFLP markers MWG051
and MWG616 (C, Fig. 11). Due to double-crossover events it was not possible to
determine the exact map position. The mapping of the RFLP markers MWG051 and
MWG616 suggest that the recessive resistance genes rym8 and rym9 are located in

Discussion
62

Discussion
63
the same genomic region of chromosome 4H, because both RFLP markers are
linked to the two resistance loci (BAUER et al. 1997). Therefore, the three resistance
genes rym8, rym9 and rym13 form a gene cluster on the long arm of chromosome
4H in the telomeric region. To find out, if these resistance genes are allelic additional
tests have to be carried out. With respect to rym12, which is located in the same
telomeric region like rym8, rym9, and rym13 (ORDON et al. 2004a), it may be
concluded that it is pertinent to the gene cluster mentioned above. Further marker
saturation with AFLP marker has to be done to find more closely linked markers to
confirm this hypothesis. Due to the great distance of the SSR marker HVM67 of 77.7
cM to the resistance gene rym11 from ‘Russia 57’ (see Fig. 10 C, NISSAN-AZZOUZ
et al. 2005), it exemplifies the different position of rym11 in contrast to rym13, where
HVM67 showed a close linkage of 4.3 cM (Fig. 11 B).
5.2.2 Mapping resistance genes on chromosome 6H The BaMMV resistance gene of the Japanese variety ‘Chikurin Ibaraki 1’ could be
mapped on the short arm of chromosome 6H. The two closest PCR markers are the
co-segregating SSRs Bmac0018 and Bmac0127, which have been mapped in a
distance of 1.0 cM from the resistance gene rym15. These results are in accordance
with the results of LE GOUIS et al. (2004) based on 217 DH lines of the cross
‘Chikurin Ibaraki 1’ x ‘Plaisant’. Regarding the results of LE GOUIS et al. (2004), the
SSR marker Bmac0173 shows the closest linkage to rym15. Unfortunately,
Bmac0173 is monomorphic in the ‘Chikurin Ibaraki 1’ x ‘Igri’ population used in the
present work (see Fig. 12). Besides the co-segregating SSRs Bmac0018 and
Bmac0127 rym15 was found to be flanked distally by the SSR Ebmac0874, which is
in accordance with the results of LE GOUIS et al. (2004). The molecular marker
order of the two already mentioned maps of chromosome 6HS are confirmed by
maps published by RAMSAY et al. (2000) based on the DH population ‘Lina’ x ‘H.
spontaneum Canada Park’ composed of 86 DH lines and by the barley consensus
map recently published by VARSHNEY et al. (2007). Both maps reveal a highly
comparable clustering of the markers Ebmac0874 and Ebmac0806 with only slightly
different genetic distances in between. Bmac0173, which is closely linked to rym15 in
the ‘Chikurin Ibaraki 1’ x ‘Plaisant’ population (LE GOUIS et al. 2004), is located
distally in both maps. The two common SSR markers closest to rym15 Bmac0127
and Bmag0018 also form a cluster in the ‘Lina’ x ‘Hordeum spontaneum Canada

Discussion
64
Park’ map of RAMSEY et al. (2000), but are mapped in a distance of 0.5 cM in the
barley consensus map of VARSHNEY et al. 2007. Furthermore, the marker order of
the ‘Chikurin Ibaraki 1’ x ‘Igri’ population used in the present study is highly similar
when compared to other maps (LE GOUIS et al. 2003, RAMSAY et al. 2000,
VARSHNEY et al. 2007), except for Ebmac0639, which is more closely linked to the
centromeric region. A strong clustering of SSR markers close to the centromeric
region of chromosome 6H was observed (RAMSAY et al. 2000, LI et al. 2003), which
is probably due to suppressed recombination in the centromeric regions and which
likely impede further marker saturation. This results in a gap of 14-22 cM without any
mapped SSR markers at the short arm of chromosome 6H (RAMSAY et al. 2000,
VARSHNEY et al. 2007). All markers shown in the four different linkage maps (see
Fig. 12), are suitable for the marker assisted selection (MAS), whereas Bmac0127
and Bmac0018 can be used for a fine-mapping approach of the BaMMV resistance
gene of ‘Chikurin Ibaraki 1’, because these markers are flanking the gene in a
distance of 1.0 cM (see Fig. 12A). To check whether the majority of plants selected
on the basis of these markers will carry the resistance-encoding allele, the two
flanking markers Bmac0018 and Bmac0127, respectively, and Ebmac0874 can be
chosen instead of only one. In addition, the markers Bmac0018, Bmac0127 and
Ebmac0874 possess high diversity indices with 0.59, 0.83 and 0.62 (RAMSAY et al.
2000), which make them powerful tools for MAS (LE GOUIS et al. 2004) due to their
high polymorphic character in European barley cultivars.
For the identification and mapping of a new resistance gene against the barley yellow
mosaic virus disease the DH populations of the cross ‘Shimane Omugi’ x ‘Gilberta’
and ‘Shimane Omugi’ x ‘Sumo’ were characterised concerning their BaMMV reaction
in greenhouse trials. Thereby, a BaMMV resistance gene could also be mapped on
the short arm of chromosome 6H. In this case additional AFLP markers were used
where E40M54 reveals the closest linkage within a distance of 2.2 cM, followed by a
cluster of co-segregating AFLP markers. In comparison to the results of LE GOUIS et
al. (2004), the barley consensus map of VARSHNEY et al. (2007), and the map of
‘Chikurin Ibaraki 1’ from the study discussed before, the two BaMMV resistance
genes seem to be located within the same genomic region of chromosome 6HS. The
map of the ‘Shimane Omugi’ resistance shows some rearrangements regarding the
molecular marker order but there are still some of the same SSRs mapped. Only the
SSR marker Ebmac0874 has been mapped distally of the resistance locus derived of

Discussion
65

Discussion
66
‘Shimane Omugi’ in opposite direction compared to the results of LE GOUIS et al.
(2004). However, results are still in accordance to the population of ‘Lina’ x ‘H.
spontaneum Canada Park’ (RAMSAY et al. 2000). Furthermore, the SSR markers
Bmac0127, HVM74 and HVM14 are also co-segregating in the DH population of
‘Chikurin Ibaraki 1’ x ‘Plaisant’, whereas the markers Bmac0127 and HVM14 have
been mapped within a distance of 0.4 cM to HVM74 in the barley consensus map.
Only two markers, HVM14 and Bmac0127, could be mapped by RAMSAY et al.
(2000), but are also co-segregating. Molecular markers like Ebmac0806 and
Bmac0173, which are located distantly from the centromeric region, turned out to be
monomorphic in the ‘Shimane Omugi’ population. Due to a still concordant order of
the SSRs of the maps of the ‘Shimane Omugi’ and ‘Chikurin Ibaraki 1’ resistance
(Fig. 12A+B), it can be assumed that the different localization of the resistance gene
rym is likely due to the included AFLP markers. In summary, it can be hypothesised,
that the locus conferring resistance in ‘Shimane Omugi’ is the same like the
resistance locus in ‘Chikurin Ibaraki 1’, which has to be proven by tests for allelism.
5.3 Application of doubled haploids and molecular markers in plant breeding Molecular markers, in particular microsatellite markers (SSRs), are important tools to
facilitate the effective selection on a single plant level in an early developmental
stage independently of the symptom development in the field. The use of molecular
markers for the breeding companies is time-saving, and therefore cost-effective
which is a major aspect in developing new improved varieties (FRIEDT & ORDON
2004, ORDON et al. 2005) especially for a private profit-oriented breeding company.
In the present study the usefulness of the SSR marker Bmac0029 as a diagnostic
selection marker facilitated e.g. the identification of the already known resistance
genes rym4 and rym5. Especially for mapping the ‘CI 3517’ resistance on
chromosome 4H it was a prerequisite to eliminate DH lines carrying the rym4
resistance gene to be able to map the new resistance gene. Furthermore, the
usefulness of SSR markers in gene mapping and in MAS has been proven already in
many different crop species like barley (WERNER et al. 2003a), wheat (PENG et al.
1999), and soybean (MUDGE et al. 1997). In comparison to RFLPs (GRANER et al.
1991), SSRs facilitate a much faster mapping and compared to AFLPs (VOS et al.
1995) specific SSR markers can be used by breeding companies directly and easily
in plant breeding programs without the conversion into STS markers. Further on,

Discussion
67
SSR markers are very useful tools for the location of a gene of interest on
chromosomes (JOSHI et al. 1997) and therefore giving hint to the specific map
position.
Regarding the present study, it was observed that the use of DH populations as
mapping populations is well suited for the development and application of PCR-
based markers to identify resistance genes against Barley yellow mosaic virus
disease. DH populations are advantageous in comparison to F2-populations, because
DHs represent totally homozygous lines, with a defined segregation ratio of recessive
to dominant genotypes in 1:1, which can be easily phenotyped (TUVESSON et al.
2007). The DH-technology, starting from F1 donor plants, leads immediately to
homozygous DH lines without further segregation and facilitate a more accurate
selection compared to F2-generations (WERNER et al. 2007). Further on, DH
populations can be easily reproduced. Reliable phenotypic data are of high
importance for marker development. These data can be obtained for BaMMV on
segregating DH populations by mechanical inoculation in the greenhouse followed by
DAS-ELISA (FRIEDT 1983), a prerequisite for the estimation of the segregation ratio
(GÖTZ & FRIEDT 1993). Furthermore, DH populations are advantageous in
comparison to recombinant inbred lines (RIL), because they can be produced in a
shorter period of time. The DH-technology is already used for practical breeding in
several crop species like rapeseed, wheat and barley (CUSTERS 2003, JACQUARD
et al. 2003, TUVESSON et al. 2003, DEVAUX & PICKERING 2005). This procedure
has also been developed for rye, triticale, oat, and cabbage, but is still rarely used
(MANNINEN et al. 2004). Based on the DH-technology, the resistance genes rym12,
rym13, rym15, the BaMMV resistance of ‘Shimane Omugi’ and of ‘CI 3517’ have
been mapped. Furthermore, rym4 (GRANER & BAUER 1993), rym5 (GRANER et al.
1999), rym13 (WERNER et al. 2003b), rym15 (LE GOUIS et al. 2004) and the
BaYMV/BaYMV-2 resistance of ‘Chikurin Ibaraki 1’ (WERNER et al. 2003a) have
been identified by using DHs.
The availability and combination of molecular markers and doubled haploids facilitate
an efficient combination of different resistance genes in one breeding line
(pyramiding) against the barley yellow mosaic virus complex (ORDON et al. 2004,
WERNER et al. 2005, 2007). Pyramiding may lead to durable and broad spectrum
resistance (WERNER et al. 2000b, ORDON et al. 2005), which is of prime interest
due to resistance breaking strains described in the last years in Europe and Japan

Discussion
68
(NOMURA et al. 1996, HARIRI et al. 2003, HABEKUSS et al. 2006). There are
several possibilities to create durable resistances due to the application of molecular
markers, which were developed e.g. for the resistance genes rym13 and rym15 in
this study. WERNER et al. (2005) reported on two strategies, which involve one and
two DH steps, respectively, to combine the resistance genes rym4 or rym5 with rym9
and rym11. Many of the resistance genes described before (see Chapter 2.2.1) –
except rym11 and rym13 – are not effective against all strains of the barley yellow
mosaic virus complex, rym9 for example is only effective against BaMMV and
BaMMV-SIL and rym5 shows resistance against BaMMV, BaYMV and BaYMV-2
(KANYUKA et al. 2004) and are therefore appropriate genes for pyramiding
strategies. The identified resistance genes in the present work like rym13 or rym15
can easily be incorporated into pyramiding strategies due to the availability of closely
linked markers. The combination of genes is a useful approach for extending the
usability of these resistance genes in barley breeding. For example the combination
of rym5 and rym9 should result in a resistance against all strains of barley yellow
mosaic virus known in Europe (KANYUKA et al. 2004). Pyramiding of genes has
been applied in several crop breeding programmes leading to the development of
varieties possessing multiple and durable resistances (ORDON et al. 2005, BOYD
2006, ZHANG et al. 2006). The successful marker-assisted pyramiding has already
been reported for wheat with respect to three powdery mildew resistance genes
Pm3, Pm4a and Pm21 (LIU et al. 2000) and two cereal cyst nematode resistance
genes of Aegilops variabilis (BARLOY et al. 2007). Furthermore ZHANG et al. (2006)
published the combination of the two dominant resistance genes Xa7 and Xa21
against bacterial blight in hybrid rice. The combination of the two resistance genes
Bph1 and Bph2 against the brown planthopper (Nilaparvata lugens Stål) into rice by
means of pyramiding has also been reported (SHARMA et al. 2004).
5.4 Wheat genetic diversity The wheat data presented in this study are the basis for ongoing breeding
programmes for soil-borne cereal mosaic virus, because detailed knowledge on the
genetic diversity between genotypes in the frame of a breeding programme is of
prime interest and facilitates a more efficient selection of parental genotypes.
Furthermore, parental lines can be selected based on the cluster analysis and
molecular markers can be used for the identification of suitable wheat genotypes.

Discussion
69
The objective of the studies on wheat was to analyse the genetic relatedness
between 64 wheat genotypes, provided by different co-operation partners from
Denmark, France and Germany, using 40 SSR markers and 30 EcoRI+3/MseI+3
AFLP primer combinations. Both types of molecular markers were able to distinguish
the 64 accessions examined and therefore found to be suitable for assessing the
genetic diversity within this material. The set of 40 (39 polymorphic ones) SSRs
produced a total number of 305 different alleles, which can be considered as
sufficient to get stable and reliable estimations of the genetic relatedness (STACHEL
et al. 2000). Although ZHANG et al. (2002) insist upon the need of 350 to 400 alleles
to distinguish between wheat materials, STACHEL et al. (2000) required only 202
alleles to get a cluster analysis, which clearly differentiated between the wheat
accessions according to their agroecological areas. Furthermore, STĘPIEŃ et al.
(2007) came to the conclusion that 166 alleles are sufficient for the successful
assessment of the genetic diversity in Polish wheat varieties. Thus the necessary
number of polymorphic alleles can vary and depends highly on the investigated
numbers of included varieties and their evolutionary relatedness (STACHEL et al.
2000, ROUSSEL et al. 2004). GAO et al. (2003) reported only on 163 alleles for the
effective characterisation of 108 rice accessions and PANDEY (2006) suggested that
237 alleles are enough to cluster 161 barley varieties. Based on the polymorphic
information content (PIC) value, which is a tool to measure the informativeness of a
given SSR marker, 27 SSR markers used in the present study turned out to be highly
polymorphic (PIC value > 0.5, STODART et al. 2005) and are therefore well suited
for the use in genetic diversity studies and discrimination of varieties. In comparison
to previous studies on genetic diversity of wheat cultivars, it could be shown that the
average number of alleles per locus in the present work (7.5) was lower. The mean
number of alleles per locus reported by RÖDER et al. (2002), studying 502 recent
European wheat varieties, was 10.5, whereas ROUSSEL et al. (2005) detected the
mean average of 16.4 alleles per locus in 480 European wheat cultivars released
from 1840 to 2000. Furthermore ROUSSEL et al. (2004) assessed the genetic
diversity of 559 French bread wheat varieties with 41 SSRs and found the average
number of alleles with 14.5. These differences and the higher variation respectively
are probably due to the analyses of old varieties and landraces in comparison to the
present study where breeding lines and newer cultivars were used. This result could
be explained by the intensive use of related species during the last decades

Discussion
70
(ROUSSEL et al. 2004). In addition to this, the extended geographic distribution of
the investigated genotypes is a further explanation (STACHEL et al. 2000,
ROUSSEL et al. 2004). Further on, the number of genotypes, which were used in
other studies for the estimation of genetic diversity, was usually higher when
compared to the 64 genotypes described in this project. Therefore, a higher variation
within the wheat material was expected. STACHEL et al. (2000) reported the mean
number of alleles with 4.8 for studying genetic differentiation in only 60 wheat
cultivars originating from Austria, Germany and Hungary. This value is comparable to
the present study and to results of different authors, who detected 5.5 alleles per
locus in 43 Chinese wheat varieties (ZHANG et al. 2002) and found the average
number of 4.7 alleles per locus in 30 parents (LIU et al. 2007). The PIC values for
each SSR marker (see Table 18, chapter 4.3) is comparable to the PIC values
published in earlier works (PRASAD et al. 2000, MCCARTNEY et al. 2004). Only the
wheat SSRs wmc167, wmc177, and wmc254 used in the present study were less
informative compared i.e. to the work of PRASAD et al. (2000) and MCCARTNEY et
al. (2004), who showed the use of SSR markers for detecting DNA polymorphism
and haplotype diversity in wheat.
Regarding the use of AFLPs as genetic markers, one major advantage is the large
number of scorable bands (ROY et al. 2004), which increases the power for the
detection of polymorphisms. In the present study more than 1800 fragments were
detected and 88.2 % of scorable AFLP loci turned out to be polymorphic, which is
relatively high when compared to other studies. The mean level of polymorphism
reported by HAZEN et al. (2002) or ROY et al. (2004) was 14 % and 46 %,
respectively. However, both authors used only 8 EcoRI+3/MseI+3 AFLP primer
combinations in genetic diversity studies with 44 and 55 genotypes, respectively. The
genetic similarity of the different AFLP markers was 0.74 in contrast to the SSR
markers, where a wider range was found leading to a lower GS value of 0.54. Similar
results were published by ROY et al. (2004) for bread wheat, RUSSELL et al. (1997)
for barley, and UPTMOOR et al. (2003) for sorghum. In accordance with these
results similar levels of the mean genetic diversity were observed with both marker
systems. Regarding the SSR data the diversity index (DI) value, which is the mean
number of alleles detected over all loci, is 0.57 and the genetic diversity within the set
of the 64 wheat cultivars analysed with AFLP is 0.521. The comparison of AFLP
markers with SSRs showed that microsatellite markers have a higher specificity while

Discussion
71
AFLPs possess the highest marker index resulting from the large number of loci
detected by one AFLP primer combination. This comparison was described in
different studies of crop species like barley, wheat and soybean (POWELL et al.
1996, RUSSELL et al. 1997, BOHN et al. 1999). Furthermore, the knowledge about
the genome location of SSRs is useful for future studies and for sampling the
genome, but the efficiency in detection of polymorphism and therefore the generation
of well saturated maps is much higher for the AFLP markers (MORAGUES et al.
2007). The results on genetic relatedness after UPGMA cluster analysis within the 64
wheat accessions revealed a clear grouping of the cultivars regarding their origin,
respectively their breeding companies. With respect to the genetic diversity estimated
by the Shannon-Weaver-Index for the 64 genotypes, which are separated into three
different groups according to their breeding companies, it was observed, that the
group with varieties of the French breeding company had the highest diversity with
H’=0.524, whereas the genetic diversity was calculated on a similar level in the
German and Danish accessions with H’=0.439 and H’=0.443, respectively. These
differences can be considered to be due to their different pedigrees. For the cultivars
of the French company it could be shown that wheat varieties like ‘Tremie’ or
‘Cadenza’ were used, which had already been released in France and the UK in
contrast to the German and Danish breeding companies, where breeding lines with a
similar genetic background were taken for the estimation of genetic relatedness.

Summary
72
6 Summary
Barley yellow mosaic virus (BaYMV) and Barley mild mosaic virus (BaMMV) have
spread to the most winter barley growing areas in Europe and have become a
serious threat to winter barley cultivation. Besides, an increasing spread of soil-borne
viruses of wheat, i.e. Soil-borne cereal mosaic virus (SBCMV) and Wheat spindle
streak mosaic virus (WSSMV), respectively, was observed in the last decade. Due to
transmission of these viruses by the ubiquitous soil-borne fungus Polymyxa graminis
chemical measures are neither efficient nor economically and environmentally
acceptable to prevent high yield losses. The only way to ensure high crop yields in
infested areas is breeding and cultivation of resistant cultivars. Therefore, the aim of
the present study was to identify PCR-based markers for new resistance genes
against BaYMV by analysing seven DH populations and to evaluate barley
germplasm for new resistance donors by screening them with already known
molecular markers. With respect to wheat the main objective was to identify sources of
tolerance or resistance to SBCMV followed by marker-based genotyping of resistant
and tolerant cultivars as the starting point of a breeding program.
After screening 120 exotic barley germplasm by using the SSR marker Bmac0029 for
the identification of rym4/rym5, seven genotypes were detected, which carry neither
rym4 nor rym5 and showed complete resistance against BaYMV/BaMMV in field trials.
Those barley accessions are potential candidates for detecting new resistance
genes. By analysing different DH populations the resistance locus of barley stock ‘CI
3517’ was mapped on the long arm of chromosome 4H, just like the resistance gene
rym13 of variety ‘Taihoku A’. The new closest linked marker E53M36 for rym13 was
mapped at a distance of 1.0 cM and can be used for MAS in the future. Furthermore,
rym12 of the resistant cultivar ‘Muju covered 2’ was localised by SSR markers on the
long arm of chromosome 4H. However, closer molecular markers have to be
developed for MAS. Using bulked segregant analysis (BSA) the resistance genes of
Japanese varieties ‘Chikurin Ibaraki 1’ and ‘Shimane Omugi’ were mapped on
chromosome 6H. Regarding rym15 of ‘Chikurin Ibaraki 1’ the SSR markers
Bmac0127 and Bmac0018 are closest linked with a distance of 1.0 cM. With respect
to ‘Shimane Omugi’ E40M54 is the closest marker mapping in a distance of 2.2 cM.
Based on the mapped SSR markers it can be hypothesised that the locus conferring

Summary
73
resistance in ‘Shimane Omugi’ is the same as the resistance locus in ‘Chikurin
Ibaraki 1’. However, this has to be further proven by allelism tests.
In addition, 64 wheat accessions derived from a set of 1,146 cultivars tested for
resistance to SBCMV of three different breeding companies were analysed for
genetic relatedness using SSR markers and EcoRI+3/MseI+3 AFLP primer
combinations. The application of 40 genome covering microsatellites revealed a high
level of genetic diversity (DI=0.57) and genetic similarity (GS) was estimated to range
from GS=0.19 to GS=0.86, with an average of GS=0.49. The genetic diversity
according to the Shannon-Weaver Index based on 30 AFLP primer combinations
amounts to H’=0.521, whereas genetic similarity was estimated to vary between 0.50
and 0.97, with an average of GS=0.74. Furthermore, genetic diversity was measured
among the wheat lines of the different breeding companies revealing a similar level
between the German (H’=0.439) and the Danish materials (H’=0.443). Regarding the
varieties of the French breeding company, a much higher genetic diversity (H’=0.524)
was estimated, probably due to the incorporation of susceptible accessions and
already released cultivars.
The results on genetic diversity in the breeding materials of barley and wheat
developed by different European breeding companies presented here allow
conclusions on the potentials for future progress. Above that, the identification of
molecular genetic markers for different virus resistance genes enables the
confirmation of the chromosomal location of resistance genes and an indirect
selection for these major-gene resistances based on the respective molecular
markers (“Smart Breeding”).

Zusammenfassung
74
7 Zusammenfassung
Eine der bedeutendsten Viruskrankheiten im europäischen Wintergerstenanbau ist
die bodenbürtige Gelbmosaikvirose. Die Krankheit wird in Europa durch einen
Erregerkomplex verursacht, dem die Viren Barley Mild Mosaic Virus (BaMMV),
BaMMV-SIL, Barley Yellow Mosaic Virus (BaYMV) und BaYMV-2 zugerechnet
werden (HUTH 1989, HUTH & ADAMS 1990). Weiterhin gehört ein in Deutschland
erst kürzlich entdeckter neuer BaMMV-Stamm dazu, der dem französischen BaMMV-
SIL Stamm sehr ähnlich ist (HABEKUSS et al. 2006). Als weitere, bedeutende
bodenbürtige Getreideviren sind das Wheat Spindle Streak Mosaic Virus (WSSMV)
und das Soil-borne Cereal Mosaic Virus (SBCMV) zu nennen, für die in den letzten
Jahren insbesondere im Winterweizenanbau eine starke Ausbreitung nachgewiesen
wurde (HUTH 2002, HUTH & GOETZ 2007). Aufgrund der vektoriellen Übertragung
der Viren durch den weit verbreiteten bodenbürtigen Pilz Polymyxa graminis
(TOYAMA & KUSABA 1970) ist weder eine chemische Bekämpfung dieser Virosen
noch eine weite Fruchtfolgestellung der Wintergerste bzw. des Winterweizens
effektiv. Die einzige Möglichkeit zur Vermeidung hoher Ertragsverluste liegt somit im
Anbau resistenter Sorten. Insgesamt wurden bisher 16 Resistenzgene gegenüber
der Gelbmosaikvirose beschrieben, von denen lediglich die Resistenzgene rym4 und
rym5 im aktuellen Sortenspektrum in Deutschland vorliegen. Mit der Entdeckung
neuer Erregerstämme in Deutschland bzw. Europa, gegen welche rym4/rym5-Träger
keine Resistenz zeigen, nimmt der Bedarf nach neuen Resistenzgenen bzw. der
Integration weiterer Gene in das Sortenmaterial deutlich zu.
Wesentliches Ziel der vorliegenden Arbeit war es daher, molekulare Marker für
Resistenzgene der Gerste gegen die Gelbmosaikvirose zu identifizieren, indem
genetische Ressourcen mit Hilfe PCR-basierter Marker im Hinblick auf bekannte
Resistenzgene analysiert sowie segregierende DH-Populationen untersucht wurden.
Bezüglich Weizen zielte das Projekt auf die Identifikation von resistenten bzw.
toleranten Sorten gegenüber SBCMV ab, gefolgt von einer molekularen
Genotypisierung des bearbeiteten Weizenmaterials als Beginn eines zielgerichteten
Resistenzzüchtungsprogramms.
Um neue Resistenzdonoren zu identifizieren, wurden 120 exotische
Gerstenherkünfte aus der Genbank in Okayama, Japan, untersucht. Hierzu wurden

Zusammenfassung
75
die Genotypen, die Resistenz gegen japanische BaYMV-Isolate zeigten, mit Hilfe des
codominanten SSR-Markers Bmac0029 (GRANER et al. 1999a) im Hinblick auf die
Resistenzgene rym4 und rym5 analysiert. Bei 44 Genotypen zeigte sich das für rym5
spezifische Allel (148 bp) und in weiteren 12 Herkünften ein Fragment von 145 bp,
welches für rym4 spezifisch ist. Die sieben exotischen Gersten ‚Chikurin Ibaraki 3’,
‚Hakusanmugi’, ‚Hongcheon Anjeunbaengi 2’, ‚Ramsar’, ‚Sekitori 2’, ‚Turkey 3’ and
‚Turkey 179’ (Heidi Jaiser, pers. Mitt.), die nach diesen Untersuchungen weder rym4
oder rym5 trugen und Resistenz in Feldversuchen gegen BaMMV, BaYMV-1 und
BaYMV-2 Isolate zeigten, stellen nach weiteren Allelietests mit Resistenzdonoren
wertvolles Ausgangsmaterial für eine Erweiterung der genetischen Basis gegenüber
BaYMV/BaMMV dar.
Um für eine zielgerichtete Selektion molekulare Marker für Resistenzgene gegen die
Gelbmosaikvirose zu entwickeln, wurden sieben verschiedene DH-Populationen
genotypisiert. Zusätzlich zu den molekularen Analysen wurden die DH-Populationen
anhand von Resistenztests gegenüber BaMMV mittels mechanischer Inokulation in
Anlehnung an FRIEDT (1983) phänotypisiert und anschließend DAS-ELISA Tests im
Gewächshaus durchgeführt. Zuerst erfolgte bei den molekularen Analysen ein
Screening der Kreuzungen zwischen jeweils einem neuen Resistenzdonor und einer
anfälligen Varietät mit dem SSR-Marker Bmac0029, um auszuschließen, dass in
diesen trotz anderslautender Angaben rym4 bzw. rym5 vorhanden sind. Anhand
dieser Vorgehensweise wurden in den Kreuzungen ‚Cebada’ x ‚Cleopatra’ und ‚Belts
1823’ x ‚Franziska’ die Resistenzgene rym4 und rym5 identifiziert. Da diese beiden
Resistenzgene in vorherigen Arbeiten kartiert (SCHIEMANN et al. 1997, GRANER et
al. 1999a, PELLIO et al. 2005) und isoliert (STEIN et al. 2005) wurden und nicht
mehr gegen alle europäischen BaYMV-Stämme eine Resistenz zeigen, wurden keine
weiteren Kartierungsarbeiten durchgeführt. Mittels der ‚bulked segregant analysis’
(BSA) wurden in den verbleibenden fünf DH-Populationen Resistenzgene gegen die
Gelbmosaikvirose mittels molekularer Marker lokalisiert. Dadurch konnte der BaMMV
Resistenzlocus von ‚CI 3517’, aus der 65 DH-Linien umfassenden Kreuzung ‚CI
3517’ x ‚Reni’, auf Chromosom 4H kartiert werden. Die aktuelle Kopplungskarte
umfasst sieben SSR-Marker, wobei die am engsten gekoppelten Marker Bmac0181,
Bmac0384, Ebmac0906 und HVM03 ein Cluster bilden und eine Distanz von 8,4 cM
zu dem Resistenzlocus aufweisen. Des Weiteren konnte das Resistenzgen rym13

Zusammenfassung
76
aus ‚Taihoku A’, welches eine vollständige Resistenz gegen alle bisher in Europa
auftretenden Gelbmosaikvirus-Stämme aufweist, auf dem langen Arm von
Chromosom 4H lokalisiert werden. Dort wurden bereits aus vorherigen Arbeiten die
Resistenzgene rym1 (OKADA et al. 2004), rym8 (BAUER et al. 1997), rym9
(WERNER et al. 2000a), rym11 (BAUER et al. 1997, NISSAN-AZZOUZ et al. 2005)
und rym12 (GRANER et al. 1996) lokalisiert. Die betreffende Kopplungsgruppe der
Kreuzung ‚Taihoku A’ x ‚Plaisant’ (154 DH-Linien) besteht aus sieben AFLP-, drei
SSR- und zwei RAPD-Markern und besitzt eine Länge von 39,1 cM. Der AFLP-
Marker E53M36 ist bei einem Abstand von 1,0 cM mit rym13 am engsten gekoppelt.
Proximal zu dem Resistenzlocus konnte der SSR-Marker HVM67 in einer Distanz
von 4,3 cM zu rym13 kartiert werden. Aufgrund der in dieser Population kartierten
SSR-Marker HVM67 und WMS06 kann davon ausgegangen werden, dass rym13 in
dem gleichen Chromosomenabschnitt wie rym9 und rym8 lokalisiert ist. Mittels einer
SSR-Analyse konnte das Resistenzgen rym12 von ‚Muju covered 2’ aus der
Kreuzung ‚Muju covered 2’ x ‚Spirit’, bestehend aus 151 DH-Linien, ebenfalls auf
dem langen Arm von Chromosom 4H kartiert werden. Aufgrund der geringen
Markerabsättigung in dieser Region umfasst die genetische Karte mit einer Länge
von 38,7 cM lediglich drei SSR-Marker. Dabei zeigt der Marker Ebmac0877 mit einer
Distanz von 7,8 cM den geringsten Abstand zu rym12. Um Aussagen darüber treffen
zu können, ob rym12 in der gleichen Region wie rym8, rym9 und rym13 lokalisiert ist,
müssen weitere Marker in dieser Region kartiert werden.
Der BaMMV-Resistenzlocus von ‚Shimane Omugi’ konnte auf dem langen Arm von
Chromosom 6H lokalisiert werden. Hierzu wurden die zwei Kreuzungen ‚Shimane
Omugi’ x ‚Gilberta’ und ‚Shimane Omugi’ x ‚Sumo’ zu einer Kartierungspopulation
von 97 DH-Linien zusammengefasst. Die Kopplungsgruppe umfasst eine Länge von
13,5 cM mit insgesamt sechs AFLP-Markern und sechs Mikrosatellitenmarkern. Der
Marker mit der geringsten Kopplung zu dem Resistenzlocus ist der AFLP-Marker
E40M54, welcher in einer Distanz von 2,2 cM kartiert werden konnte. Des Weiteren
konnten drei AFLP-Marker, welche co-segregieren, proximal mit einem Abstand von
3,3 cM zu dem Resistenzgen kartiert werden. In der 163 DH-Linien umfassenden
Population ‚Chikurin Ibaraki 1’ x ‚Igri’ konnte das Resistenzgen rym15 in der
centromeren Region von Chromosom 6H lokalisiert werden. Die aktuelle
Kopplungsgruppe, die 30 cM umfasst, besteht aus sechs Mikrosatellitenmarkern,
wobei drei SSR-Marker das BaMMV-Resistenzgen rym15 flankieren. Die beiden am

Zusammenfassung
77
engsten gekoppelten SSR-Marker sind Bmac0018 und Bmac0127, welche proximal
einen Abstand von 1,0 cM zu dem Resistenzlocus aufweisen. Distal konnte der
Mikrosatellit Ebmac0874 in einer Distanz von 6,0 cM zu dem Resistenzgen rym15
lokalisiert werden. Die beiden Marker Bmac0018 und Bmac0127 sind aufgrund ihrer
geringen genetischen Distanz zu dem BaMMV-Resistenzlocus sehr gut für eine
markergestützte Selektion geeignet. Im Hinblick auf die Resistenz von ‚Shimane
Omugi’ und dessen Lokalisation auf Chromosom 6H kann durchaus vermutet
werden, dass es sich um identische Resistenzloci handelt. Um dies bestätigen zu
können, müssen weitere Allelietests durchgeführt werden.
Zur Identifikation resistenter Weizengenotypen gegenüber Soil-borne cereal mosaic
virus (SBCMV) wurden 1146 Sorten und Genotypen in Feldversuchen in Frankreich
von Züchtern getestet, von denen 64 potentielle Kreuzungspartner auf molekularer
Ebene unter Verwendung von 40 Mikrosatelliten und 30 EcoRI+3/MseI+3 AFLP-
Primerkombinationen charakterisiert wurden. Basierend auf der Auswertung der
Fragmentmuster und der Erstellung einer 0/1 Matrix wurde die genetische Ähnlichkeit
nach NEI und LI (1979) errechnet sowie die genetische Diversität nach Shannon-
Weaver (1949). Im Rahmen der SSR-Analysen wurden insgesamt 305 Fragmente
detektiert, wobei 1 bis 17 Allelen pro Locus entsprechend durchschnittlich 7,65
Allelen pro Locus, identifiziert werden konnten. Die ermittelten Polymorphic
Information Content (PIC) – Werte lagen zwischen 0,00 (wmc41) und 0,89 (wmc276).
Innerhalb des Sortimentes wurde anhand der Daten eine genetische Diversität (DI)
von DI=0,57 ermittelt und die genetische Ähnlichkeit (GS) umfasste einen Bereich
von GS=0,19-0,86 (Mittelwert GS=0,49), wobei der größte Wert der genetischen
Ähnlichkeit zwischen den dänischen Züchtungslinien ‘701-176c’ und ‘701-177c’ und
die geringste Ähnlichkeit zwischen den Varietäten ‚Sponsor’ und ‚Enesco’ auftrat.
Ähnliche Ergebnisse zeigten die AFLP-Analysen. Basierend auf der Untersuchung
von 1847 Fragmenten wurde eine genetische Diversität von H’=0,52 ermittelt, wobei
der Prozentanteil der polymorphen Loci bei 88,2 % lag. Die genetische Ähnlichkeit
wurde anhand der Analysen mit GS=0,50-0,97 (Mittel GS=0,74) bestimmt. Die größte
genetische Ähnlichkeit konnte zwischen den Varietäten ‚Tremie’ und ‚Taldor’ und die
geringste wiederum zwischen ‚Sponsor’ und ‚Enesco’ ermittelt werden. Die
Clusteranalysen, die auf den genetischen Ähnlichkeitskoeffizienten basieren, zeigten
bei den SSR- sowie den AFLP-Analysen eine deutliche Gruppierung von Genotypen
Zusammenfassung
78
gleicher geographischer Abstammung, welche sich weiter entsprechend der Herkunft
der untersuchten Sorten (Züchterhäuser) untergliedert. Im Hinblick auf die
genetische Diversität differenziert nach den jeweiligen Gruppen, die sich nach den
drei verschiedenen Züchtungshäusern richten, konnte für das dänische (H’=0,443)
und deutsche Sortiment (H’=0,439) eine ähnlich große genetische Diversität
beobachtet werden. Dagegen war die Diversität zwischen den Varietäten der
französischen Gruppe mit H’=0,524 deutlich größer. Aufgrund dieser Ergebnisse ist
von einer ausreichenden genetischen Variabilität zwischen den resistenten Linien
und im Vergleich zu anfälligen Sorten auszugehen, so dass eine gute Basis für eine
effektive Resistenzzüchtung von Weizen gegen SBCMV gegeben ist.
Die hier präsentierten Ergebnisse der genetischen Diversität von Zuchtmaterial der
Gerste und des Weizens verschiedener europäischer Züchter verdeutlichen das
große Potenzial für zukünftige Züchtungsprogramme. Des Weiteren ermöglicht die
Entwicklung von molekularen Markern für verschiedene Virusresistenzgene die
Identifizierung und Bestätigung der chromosomalen Lokalisation und die indirekte
marker-gestützte Selektion auf diese Resistenzen („Smart Breeding“).

References
79
8 References Abu-Assar A.H., R. Uptmoor, A.A. Abdelmula, M. Salih, F. Ordon, W. Friedt, 2005.
Genetic variation in sorghum germplasm from Sudan, ICRISAT, and USA assessed by simple sequence repeats (SSRs). Crop Sci 45: 1636-1644.
Achon M.A., M. Marsinach, C. Ratti, C. Rubies-Autonell, 2005. First Report of Barley yellow mosaic virus in Barley in Spain. Plant Disease 89: 105.
Adams M.J., 2004 In: Lapierre, H.; Signoret, P. A, 2004. Virus and virus diseases of Poaceae (Gramineae), INRA Èditions, Versailles, France, 580-584.
Adams M.J., J.F. Antoniw, C.M. Fauquet, 2005. Molecular criteria for genus and species discrimination within the family Potyviridae. Arch Virol 150: 459-479.
Ahlemeyer J., R. Snowdon, F. Ordon, W. Friedt, 2006. Agrodiversity - Genetic diversity in crops and cropping systems. In: Benckiser G, Schnell S (eds) Biodiversity in agricultural production systems. CRC Press, Boca Raton, Fl, USA, pp. 21-40.
Akbari M., P. Wenzl, V. Caig, J. Carling, L. Xia, S. Yang, G. Uszynski, V. Mohler, A. Lehmensiek, H. Kuchel, M.J. Hayden, N. Howes, P. Sharp, P. Vaughan, B. Rathmell, E. Huttner, A. Kilian, 2006. Diversity arrays technology (DArT) for high-throughput profiling of the hexaploid wheat genome. Theor Appl Genet 113: 1409-1420.
Andersen J.R. & T. Lübberstedt, 2003. Functional markers in plants. Trends in Plant Science 8: 554-560.
Andersen P.A., C. Jespersgaard, J. Vuust, M. Christiansen, L.A. Larsen, 2003. Capillary electrophoresis-based single strand DNA conformation analysis in high-throughput mutation screeening. Hum Mutat 21: 455-465.
Anderson J.A., G.A. Churchill, J.G. Autrique, S.D. Tanksley, M.E. Sorells, 1993. Optimizing parental selection for genetic linkage maps. Genome 36: 181-186.
Bagge M., X. Xia, T. Lübberstedt, 2007. Functional markers in wheat. Curr Opin Plant Biol 10: 211-216.
Barbosa M.M., L.R. Goulart, A.M. Prestes & F.C. Juliatti, 2001. Genetic control of resistance to soil borne wheat mosaic virus in Brazilian cultivars of Triticum aestivum L. Thell. Euphytica 122: 417-422.
Barloy D., J. Lemoine, P. Abelard, A.M. Tanguy, R. Rivoal, J. Jahier, 2007. Marker-assisted pyramiding of two cereal cyst nematode resistance genes from Aegilops variabilis in wheat. Mol Breeding 20: 31-40.
Bass C., R. Hendley, M.J. Adams, K.E. Hammond-Kosack, K. Kanyuka, 2006. The Sbm1 locus conferring resistance to Soil-borne cereal mosaic virus maps to a gene-rich region on 5DL in wheat. Genome 49: 1140-1148.
Bauer E., J. Weyen, A. Schiemann, A. Graner, F. Ordon, 1997. Molecular mapping of novel resistance genes against barley mild mosaic virus (BaMMV). Theor Appl Genet 95: 1263-1269.
Beaton D., 1989. ‘Resistant’ varieties hit by BYMV strain. Farmers Weekly 3: 42. Becker J. & M. Heun, 1995. Barley microsatellites: allele variation and mapping.
Plant Mol Biol 27: 835-845. BMELV, 2007. Bundesministerium für Ernährung, Landwirtschaft und
Verbraucherschutz. http://www.bmelv.de/ Bohn M., H.F. Utz, A.E. Melchinger, 1999. Genetic similarities among winter wheat
cultivars determined on the basis of RFLPs, AFLPs, and SSRs and their use for predicting progeny variance. Crop Science 39: 228-237.

References
80
Botstein D., R.L. White, M. Skolnik, R.W. Davis, 1980. Construction of a genetic linkage map in man using restriction fragment length polymorphisms. Am J Hum Genet 32: 314-331.
Botstein D., N. Risch, 2003. Discovering genotypes underlying human phenotypes: past successes for Mendelian disease, future approaches for complex disease. Nat Genet 33: 228-237.
Boyd L., 2006. Perspective: Can the durability of resistance be predicted? J Sci Food Agric 86: 2523-2526.
Bratteler M., C. Lexer, A. Widmer, 2006. A genetic linkage map of Silene vulgaris based on AFLP markers. Genome 49: 320-327.
Budge G. & C.M. Henry, 2002. Assessing resistance of winter wheat varieties to soil-borne wheat mosaic virus and wheat spindle streak mosaic virus. HGCA Project Report No. 293 London, UK: Home Grown Cereals Authority.
Buerstmayr H., M. Lemmens, L. Hartl, L. Doldi, B. Steiner, M. Stierschneider, P. Ruckenbauer, 2002. Molecular mapping of QTLs for Fusarium head blight resistance in spring wheat. I. Resistance to fungal spread (Type II resistance). Theor Appl Genet 104: 84-91.
Cadle-Davidson L., M.E. Sorrells, G.C. Bergstrom, 2006. Identification of Small Grains Genotypes Resistant to Wheat spindle streak mosaic virus. Plant Disease 90: 1045-1050.
Carlson C.S., M.A. Eberle, M.J. Rieder, J.D. Smith, I. Kruglyak, D.A. Nickerson, 2003. Additional SNPs and linkage-disequilibrium analyses are necessary for whole-genome association studies in humans. Nat Genet 33: 518-521.
Carroll J.E., G.C. Bergstrom, S.M. Gray, 2002. Assessing the resistance of winter wheat to wheat spindle streak mosaic bymovirus. Can J Plant Pathol 24: 465-470.
Chelkowski J., M. Tyrka, A. Sobkiewicz, 2003. Resistance genes in barley (Hordeum vulgare L.) and their identification with molecular markers. J Appl Genet 44: 291-309.
Chen J.P., M.J. Adams, F.T. Zhu, Z.Q. Wang, J. Chen, S.Z. Huang, Z.C. Zhang, 1996. Response of foreign barley cultivars to barley yellow mosaic virus at different sites in China. Plant Pathol 45: 1117-1125.
Chien J.P., D.B. Edgar, J.M. Trela, 1976. Desoxyribonucleic acid polymerase from Thermus aquaticus. J Bacteriol 127: 1550-1557.
Ching A., K.S. Caldwell, M. Jung, M. Dolan, O.S. Smith, S. Tingey, M. Morgante, A.J. Rafalski, 2002. SNP frequency, haplotype structure and linkage disequilibrium in elite maize inbred lines. BMC Genet 3: 19-33.
Close T.J., S.I. Wanamaker, R.A. Caldo, S.M. Turner, D.A. Ashlock, J.A. Dickerson, R.A. Wing, G.J. Muehlbauer, A. Kleinhofs, R.P. Wise, 2004. A new resource for cereal genomics: 22K Barley GeneChip comes of age. Plant Physiol 134: 960–968.
Clover G.R.G., D.M. Wright, C.M. Henry, 1999a. First report on soil-borne wheat mosaic virus in the United Kingdom. Plant Disease 83: 880.
Clover G.R.G., C.M. Henry, 1999b. Detection and discrimination of wheat spindle streak mosaic virus and wheat yellow mosaic virus using multiplex RT-PCR. European Journal of Plant Pathology 105: 891-896.
Clover G.R.G., C. Ratti, C.M. Henry, 2001. Molecular characterization and detection of European isolates of Soil-borne wheat mosaic virus. Plant Pathology 50: 761-767.

References
81
Collard B.C.Y., M.Z.Z. Jahufer, J.B. Brouwer, E.C.K. Pang, 2005. An introduction to markers, quantitative trait loci (QTL) mapping and marker-assisted selection for crop improvement: The basic concepts. Euphytica 142: 169-196.
Comai L., K. Young, B.J. Till, S.H. Reynolds, E.A. Greene, C.A Codomo, L.C. Enns, J.E. Johnson, C. Burtner, A.R. Odden, S. Henikoff, 2004. Efficient discovery of DNA polymorphisms in natural populations by Ecotilling. Plant J 37: 778-786.
Cox T.S., M.E Sorrels, G.E. Bergstrom, R.G. Sears, B.S. Gill, E.J. Walsh, S. Leath, J.P. Murphy, 1994. Registration of KS92WGRC21 and KS92WGRC22 hard red winter wheat germplasms resistance to wheat spindle streak mosaic virus, wheat soil-borne mosaic virus, and powdery mildew. Crop Sci 34: 546-546.
Custers J.B.M., 2003. Microspore culture in rapeseed (Brassica napus L.). In: Maluszynski M., Kasha K.J., Forster B.P., Szarejko I (eds) Doubled haploid production in crop plants- a manual. Kluwer Academic Publishers, Dordrecht/Boston/London, pp 185-193.
Dávilla J.A., Y. Loarce, E. Ferrer, 1999. Molecular characterization and genetic mapping of random amplified microsatellite polymorphism in barley. Theor Appl Genet 98: 265-273.
Devaux P., R. Pickering, 2005. Haploids in the improvement of Poaceae. In: C.E. Palmer, W.A. Keller and K.J. Kasha (eds), Haploids in Crop Improvement II, Series: Biotechnology in Agriculture and Forestry, Vol. 56, 215-242. Springer-Verlag, Berlin, Heidelberg.
Diao A., J. Chen, F. Gitton, J.F. Antoniw, J. Mullins, A.M. Hall, M.J. Adams, 1999. Sequences of European wheat mosaic virus and oat golden stripe mosaic virus and genome analysis of the genus Furovirus. Virology 261: 331-339.
Dice L.R., 1945. Measures of the amount of ecologic association between species. Ecology 26: 297-303.
Doligez A., A.F. Adam-Blondon, G. Cipriani, G. Di Gaspero, V. Laucou, D. Merdinoglu, C.P. Meredith, S. Riaz, C. Roux, P. This, 2006. An integrated SSR map of grapevine based on five mapping populations. Theor Appl Genet 113: 369-382.
Doyle J., J.Doyle, 1990. Isolation of plant DNA from fresh tissue. Focus 12: 13-15. Driskel B.A., R.M. Hunger, M.E. Payton, J. Verchot-Lubicz, 2002. Response of hard
red winter wheat to Soilborne wheat mosaic virus using novel inoculation methods. Phytopathology 92: 347-374.
Fantakhun A.T., L.A. Pavlenko, A.D. Bobyr, 1987. The pathogen of barley yellow mosaic in Ukraine (in russisch, engl. Zusammenfassung). Mikrobiol Zurnal 42: 76-80.
Friedt W., 1983. Mechanical transmission of soil-borne barley yellow mosaic virus. Phytopath Z 106: 16-22.
Friedt W. & F. Ordon, 2004. Breeding for virus resistance of barley: Amalgamation of classical and biotechnological approaches. Proc 9th Int Barley Genet Symp 20.-26.06.2004, Brno, Czech Republic, pp. 329-337.
Fritsch P. & L.H. Rieseberg, 1996. The use of Random Amplified Polymorphic DNA (RAPD) in conservation genetics. In: Smith T.B., Wayne R.K. (eds): Molecular Genetic Approaches in Conservation. Oxford University Press, New York, 54-73.
Gao L., B.A. Schaal, J. Jia, Y. Dong, 2003. Assessment of population genetic structure in common wild rice Oryza rufipogon Griff. Using microsatellite and allozyme markers. Theor Appl Genet 106: 173-180.
References
82
Garvin D.F., A.H.D. Brown, H. Raman, B.J. Read, 2000. Genetic mapping of the barley Rrs14 scald resistance gene with RFLP, isozyme and seed storage protein markers. Plant Breeding 119: 193-196.
Giese H., A.G. Holm-Jensen, H.P. Jensen, J. Jensen, 1993. Localisation of the Laevigatum powdery mildew resistance gene to barley chromosome 2 by the use of RFLP markers. Theor Appl Gen 85: 897-900.
Götz, R. & W. Friedt, 1993. Resistance to the barley yellow mosaic virus complex – Differential genotypic reactions and genetics of BaMMV-resistance of barley (Hordeum vulgare L.). Plant Breeding 111: 125-131.
Graner A., A. Jahoor, J. Schondelmaier, H. Siedler, K. Pillen, G. Fischbeck, G. Wenzel, R.G. Herrmann, 1991. Construction of a RFLP map of barley. Theor Appl Genet 83: 250-256.
Graner A. & E. Bauer 1993. RFLP mapping of the ym4 virus resistance gene in barley. Theor Appl Genet 86: 689-693.
Graner A., Bauer E., Kellermann A., Proeseler G., Wenzel G. & F. Ordon, 1995. RFLP analysis of resistance to the barley yellow mosaic virus complex. Agronomie 15: 475-479.
Graner A., E. Bauer, J. Chojecki, A. Tekauz, A. Kellermann, A. Proeseler, M. Michel, V. Valkov, G. Wenzel, F. Ordon, 1996. Molecular mapping of disease resistance in barley. In: G. Scoles, B.Rossnagel (eds.) Proc VI Intern Oat Con & VII Intern Barley Genetics Symp, Poster Sessions Vol 1, Saskatoon, Canada, University Extension Press, Saskatoon, Saskatchewan, 253-255.
Graner A., S. Streng, A. Kellermann, A. Schiemann, E. Bauer, R. Waugh, B. Pellio & F. Ordon, 1999a. Molecular mapping of the rym5 locus encoding resistance to different strains of the Barley Yellow Mosaic Virus Complex. Theor Appl Genet 98: 285-290.
Graner A., S. Streng, A. Kellermann, G. Proeseler, A. Schiemann, H. Peterka, F. Ordon, 1999b. Molecular mapping of genes conferring resistance to soil-borne viruses in barley. An approach to promote understanding of host-pathogen interactions. J Plant Diseases and Protection 106: 405-410.
Graner A., W. Michalek., S. Streng, 2000. Molecular Mapping of Genes Conferring Resistance to Viral and Fungal Pathogens. Proc. 8th International Barley Genetics Symposium, Adelaide, Australia. Vol I, inv. papers: 45-53.
Guo W.Z., T.Z. Zhang, Y.Z. Ding, Y.C. Zhu, X.L. Shen, X.F. Zhu, 2005. Molecular marker assisted selection and pyramiding of two QTLs for fiber strength in upland cotton. Yi Chuan Xue Bao 32: 1275-85.
Gupta P.K. & R. K. Varshney, 2000. The development and use of microsatellite markers for genetic analysis and plant breeding with emphasis on bread wheat. Euphytica 113: 163-185.
Gupta P.K., J.K. Roy, M. Prasad, 2001. Single nucleotide polymorphisms: a new paradigm for molecular technology and DNA polymorphism detection with emphasis on their use in plants. Curr Sci 80: 524-535.
Gupta P.K. & S. Rustgi, 2004. Molecular markers from the transcribed/expressed region of the genome in higher plants. Funct Integr Genomics 4: 139-162.
Gupta P.K., H.S. Balyan, K.J. Edwards, P. Isaac, V. Korzun, M. Röder, M.-F. Gautier, P. Joudrier, A.R. Schlatter, J. Dubcovsky, R.C. De la Pena, M. Khairallah, G. Penner, M.J. Hayden, P. Sharp, B. Keller, R.C.C. Wang, J.P. Hardouin, P. Jack, P. Leroy, 2002. Genetic mapping of 66 new microsatellite (SSR) loci in bread wheat. Theor Appl Genet 105: 413-422.
Habekuss A., T. Kühne, I. Krämer, F. Rabenstein, F. Ehrig, B. Ruge-Wehling, W. Huth, F. Ordon, 2006: Wirksamkeit bekannter Resistenzgene gegenüber

References
83
einem neuen rym5-resistenzbrechenden deutschen BaMMV-Isolat Vortr Pflanzenzüchtg 68, S. 38
Hai L., C. Wagner, W. Friedt, 2007. Quantitative structure analysis of genetic diversity among spring bread wheat (Triticum aestivum L.) from different geographical regions. Genetica 130: 213-225.
Haldane J.B.S., 1919. The recombination of linkage values and the calculation of distance between the loci of linkage factors. J Genet 8: 299-309.
Hammer K., A.A. Filatenko, V. Korzun, 2000. Microsatellite markers – a new tool for distinguishing diploid wheat species. Genetic Resources and Crop Evolution 47: 497-505.
Hariri D., M. Fouchard, H. Lapierre, 1990. Resistance to barley yellow mosaic virus and barley mild mosaic virus in barley. In: Koenig, R. (ed). Proc 1st Symp. Intern. Working Group Plant Viruses with Fungal Vectors. Braunschweig, Germany, August 21-24, 109-112.
Hariri D., M. Meyer & H. Prud'homme, 2003. Characterization of a new barley mild mosaic virus pathotype in France. Eur J Pathol 109: 921-938.
Hartl D. & E. Jones, 2001. Genetics: Analysis of Genes and Genomes, Jones and Bartlett Publishers, Sudburry, MA.
Hasan M., F. Seyis, A.G. Badani, J. Pons-Kuehnemann, W. Lühs, W. Friedt, R.J. Snowdon, 2006. Surveying genetic diversity in the Brassica napus gene pool using SSR markers. Genet Res Crop Evol 53: 793-802.
Haufler K.Z., 1996. Wheat spindle streak mosaic bymovirus. In: Brunt A.A., K. Crabtree, M.J. Dallwitz, A.J. Gibbs, L. Watson (eds) Viruses of Plants: Descriptions and Lists from the VIDE Database, 1393-1395. Centre for Agricultural and Biosciences International, Wallingford, Oxon.
Hazen P.S., P. Leroy, R. Ward, 2002. AFLP in Triticum aestivum L.: Patterns of diversity and genome distribution. Euphytica 125: 89-102.
Heun M., A.E. Kennedy, J.A. Anderson, N.L.V. Lapitan, M.E. Sorrels, S.D. Tanksley, 1991. Construction of a fragment length polymorphism map for barley (Hordeum vulgare). Genome 34: 437-447.
Hill S.A., E.J. Evans, 1980. New or unusual records of plant diseases and pests. Barley Yellow Mosaic Virus. Plant Pathology 29: 197-199.
Hill S.A., B.J. Walpole, 1989. National and local spread of barley yellow mosaic virus in United Kingdom. Bulletin OEPP/EPPO Bulletin 19: 555-562.
Huth W., 1985. Versuche zur Virusdiagnose und Resistenzträgererstellung in Gerste gegen Barley Yellow Mosaic Virus. Vortr Pflanzenzüchtg 9: 107-120.
Huth W., 1989. Ein weiterer Stamm des Barley Yellow Mosaic Virus in der Bundesrepublik Deutschland. Nachrichtenbl Deut Pflanzenschutzd 40: 49-55.
Huth W., 1991. Verbreitung der Gelbmosaikviren BaYMV, BaMMV und BaYMV-2 und Screening von Gerstensorten auf Resistenz gegenüber BaYMV-2. Nachrichtenbl Deut Pflanzenschutzd 43: 233-237.
Huth W., 2002. Die bodenbürtigen Viren von Weizen und Roggen in Europa – ein zunehmendes aber durch ackerbauliche Maßnahmen und Anbau resistenter Sorten lösbares Problem. Gesunde Pflanzen, 54. Jahrg., Heft 2: 51-57.
Huth W. & D. Lesemann, 1978. Eine für die Bundesrepublik neue Virose an Wintergerste. Nachrichtenbl Deut Pflanzenschutzd 30: 184-185.
Huth W. & M.J. Adams, 1990. Barley Yellow Mosaic Virus (BaYMV) and BaYMV-M: two different viruses. Intervirology 31: 38-42.
Huth W. & R. Goetz, 2007. Zur Situation bodenbürtiger Viren des Weizens und Roggens in Deutschland. Getreide Magazin 2/2007: 112-115.

References
84
Huth W., A. Habekuss, F. Ordon, 2005. Neue Stämme des Barley mild mosaic virus auch in Deutschland. Nachrichtenbl Deut Pflanzenschutzd 57: 152-154.
Iida Y. & T. Konishi, 1994. Linkage analysis of a resistance gene to barley yellow mosaic virus strain II in two-rowed barley. Breeding Science 44: 191-194.
Iida Y., Ban T. & T. Konishi, 1999. Linkage analysis of the rym6 resistance gene to Japanese strain II of barley yellow mosaic virus (BaYMV-II) in barley. Barley Genet Newsletter 29: 31-32.
Ikata S., I. Kawai, 1940. Studies on wheat yellow mosaic disease. Noji Kairyo Shiryo 154: 1-123.
Inouye T., Y. Saito, 1975. Barley yellow mosaic virus. CMI/AAB Description Plant Viruses 143: 4.
Jaccard P., 1908. Nouvelles recherches sur la distribution florale. Bull Soc Vaud Sci Nat 44: 223-270.
Jacquard C., G. Wojnarowiez, C. Clément, 2003. Anther culture in barley. In: Maluszynski M., Kasha K.J., Forster B.P., Szarejko I (eds) Doubled haploid production in crop plants - a manual. Kluwer Academic Publishers, Dordrecht/Boston/London, pp 21-27.
Jaccoud D., K. Peng, D. Feinstein, A. Kilian, 2001. Diversity Arrays: a solid state technology for sequence information independent genotyping. Nucleic Acids Res 29: e25.
Jansen R. & P. Stam, 1994. High resolution of quantitative traits into multiple loci via interval mapping. Genetics 136: 1447-1455.
Jones N., H. Ougham, H. Thomas, 1997. Markers and mapping: we are all geneticists now. New Phytol 137: 165-177.
Joshi S.P., P. R. Ranjekar, V.S. Gupta, 1999. Molecular markers in plant genome analysis. Current Science 77: 230-240.
Kanyuka K., E. Ward, M.J. Adams, 2003. Polymyxa graminis and the cereal viruses it transmits: a research challenge. Molecular Plant Pathology 4: 393-406.
Kanyuka K., G.R.D. McGrann, K. Alhudaib, D. Hariri & M.J. Adams, 2004a. Biological and sequence analysis of a novel European isolate of Barley mild mosaic virus that overcomes the barley rym5 gene. Arch Virol 149: 1469-1480.
Kanyuka K., D.J. Lovell, O.P. Mitrofanova, K. Hammond-Kosack, M.J. Adams 2004b. A controlled environment test for resistance to soil-borne cereal mosaic virus (SBCMV) and its use to determine the mode of inheritance of resistance in wheat cv. Cadenza and for screening Triticum monococcum genotypes for sources of SBCMV resistance. Plant Pathology 53: 154-160.
Kanyuka K., A. Druka, D.G. Caldwell, A. Tymon, N. McCallum, R. Waugh, M.J. Adams, 2005. Evidence that the recessive bymovirus resistance locus rym4 in barley corresponds to the eukaryotic translation initiation factor 4E gene. Molecular Plant Pathology 6: 449-458.
Kapooria R.G., J. Ndunguru, 1998. Studies on the occurrence of viruses infecting wheat in Zambia. Proceedings of the 36th Congress of the South African Society of Plant Pathologists, p 53.
Kapooria R.G., J. Ndunguru, G.R.G. Clover, 2000. First reports of Soil borne wheat mosaic virus and Wheat Spindle Streak mosaic virus in Africa. Plant Disease 84: 921.
Kashiwasaki S. 1996. The complete nucleotide sequence and genome organization of barley mild mosaic virus (Na 1 strain). Arch Virol 141: 2077-2089.
Kastirr U., F. Rabenstein, T. Kuehne, 2004. Soil-borne cereal mosaic virus. In: Lapierre, H.; Signoret, P.-A. (eds), 2004. Virus and virus diseases of Poaceae (Gramineae). INRA Èditions, Versailles, France, 580-584.

References
85
Katis N., K. Tzavella-Klonari, M.J. Adams, 1997. Occurrence of barley yellow mosaic and barley mild mosaic bymovirus in Greece. European Journal of Plant Pathology 103: 281-284.
Kawada N., 1991. Resistant cultivars and genetic ancestry of the resistance genes to barley yellow mosaic virus in barley (Hordeum vulgare L.). Bull Kyushu Natl Agric Exp Stn 27: 65-79.
Kegler H., D. Haase, G. Proeseler, H. Kleinhempel, J. Richter, R. Schlenker, E. Schützler, 1985. Zur Virusresistenz bei Triticale. Arch Phytopathol Pflanzenschutz 21: 247-248.
Khan A.A., G.C. Bergstrom, J.C. Nelson, M.E. Sorrells, 2000. Identification of RFLP markers for resistance to wheat spindle streak mosaic bymovirus (WSSMV) disease. Genome 43: 477-482.
Kleinhofs A., S. Chao, P.J. Sharp, 1988. Mapping of nitrate reductase genes in barley and wheat. In: Proceedings of the 7th International Wheat Genetics Symposium, held at Cambridge, England, 13-19 July 1988. Edited by T.E. Miller, and R.M.D. Koebner, Institute of Plant Science Research, Cambridge Laboratory, Trumpington, England. pp: 541-546.
Kleinhofs A., A. Kilian, M.A. Saghai-Maroof, R.M. Biyashev, P. Hayes, F.Q. Chen, N. Lapitan, A. Fenwick, T.K. Blake, V. Kanazin, E. Ananiev, E. Dahleen, J.D. Frankowiak, D. Hoffmann, R. Scagsen, B.J. Steffenson, 1993. A molecular, isozyme and morphological map of the barley (Hordeum vulgare) genome. Theor Appl Genet 86: 705-712.
Kim J.S., T.Y. Chung, G.J. King, M. Jin, T.-J. Yang, Y.-M. Jin, H.-I. Kim, B.-S. Park, 2006. A Sequence-Tagged Linkage Map of Brassica rapa. Genetics 174: 29-39.
Koenig R., 1985. Antikörper im Dienste der Pflanzenvirologie. Nachrichtenbl Deut Pflanzenschutzd 37: 161-170.
Koenig R., S.W.A. Pleij, W. Huth, 1999. Molecular characterisation of a new furovirus mainly infecting rye. Archives of Virology 144: 2125-2140.
Koenig R. & W. Huth, 2000. Soil borne rye mosaic virus and European wheat mosaic virus: two names for a furovirus with variable genome properties which is widely distributed in several cereal crops in Europe. Archives of Virology 145: 689-697.
Koenig R. & W. Huth, 2003. Natural infection of wheat by the type strain of Soil-borne Wheat Mosaic Virus in a field in Southern Germany. European Journal of Plant Pathology 109: 191-193.
Koevering V.M., K.Z. Haufler, D.W. Fulbright, T.G. Isleib, E.H. Everson, 1987. Heritability of resistance in winter wheat to wheat spindle streak mosaic virus. Phytopathology 77: 742-744.
Konishi T., T. Ban, Y. Iida & R. Yoshimi, 1997. Genetic analysis of disease resistance to all strains of BaYMV in a Chinese barley landrace Mokusekko 3. Theor Appl Genet 94: 871-877.
Konishi T., F. Ordon, M. Furusho, 2002. Reactions of barley accessions carrying different rym genes to BaYMV and BaMMV in Japan and Germany. Barley Genet Newsl 32: 46-48.
Kosambi D.D., 1944. The estimation of map distances from recombination values. Cit. In: De Vienne D, 1998. Les marqueurs moléculaires en génétique et biotechnologies végétales. INRA
Kota R., M. Wolf, W. Michalek, A. Graner, 2001. Application of DHPLC for mapping of single nucleotide polymorphisms (SNPs) in barley (Hordeum vulgare L.). Genome 44: 523-528.

References
86
Kremer A., R.J. Petit, O. Pons, 1998. Measures of polymorphism within and among populations. In: Karp A., Issac P.G., Ingram D.S. (eds): Molecular Tools for Screening Biodiversity. Chapman & Hall, London. 301-311.
Künzel G., L. Korzun, A. Meister, 2000. Cytologically integrated physical restriction fragment length polymorphism maps for barley genome based on translocation breakpoints. Genetics 154: 397-412.
Labate J.A., 2000. Review and Interpretation – Software for Population Genetic Analysis of Molecular Marker Data. Crop Sci 40: 1521-1528.
Lander E.S., P. Green, J. Abrahamson, A. Barlow, M.J. Daly, S.E. Lincoln, L. Newburg, 1987. Mapmaker: an interactive computer package for constructing primary genetic linkage maps of experimental and natural populations. Genomics 1: 174-181.
Landegren U., M. Nilsson, P.Y. Kwok, 1998. Reading bits of genetic information. Methods for single-nucleotide polymorphism analysis. Genome Res 8: 769-776.
Langenberg W.G.D., D. van der Wal, 1986. Identification of barley yellow mosaic virus by immuno-electron microscopy in barley but not in Polymyxa graminis or Lagena radicicola. Neth J Pl Path 92: 133-136.
Lapierre H., 1980. Nouvelles maladies à virus sur céréales d’hiver. Le producteur Agricole Francais 270,11.
Lapierre H., M. Courtillot, C. Kusiak, D. Hariri, 1985. Resistance au champ des blés en semis d’automne au virus de la mosaique du blés (wheat soil borne mosaic virus). Agronomie 5: 565-572.
Lee K.J., S. Kashiwazaki, T. Hibi, I.Y. So, 1996. Properties and capsid protein gene sequence of a Korean isolate of barley yellow mosaic virus. Ann Phytopah Soc Jap 62: 397-401.
Lee K.J., M.K. Choi, H.L. Wang, M. Rajkumar, 2006. Molecular analysis of Korean isolate of barley yellow mosaic virus. Virus Genes 32: 171-176.
Le Gouis J., P. Devaux, K. Werner, D. Hariri, N. Bahrman, D. Beghin, F. Ordon, 2004. Rym15 from the Japanese cultivar ´Chikurin Ibaraki 1´ is a new Barley Mild Mosaic Virus (BaMMV) resistance gene mapped on chromosome 6H. Theor Appl Genet 108: 1521-1525.
Li C.D., B.G. Rossnagel, G.J. Scoles, 2000. The development of oat microsatellite markers and their use in identifying relationships among Avena species and oat cultivars. Theor Appl Genet 101: 1259-1268.
Li J.Z., T.G. Sjakste, M.S. Röder, M.W. Ganal 2003. Development and genetic mapping of 127 new microsatellite markers in barley. Theor Appl Genet 107: 1021-1027.
Liu J., D. Liu, W. Tao, W. Li, S. Wang, P. Chen, S. Cheng, D. Gao, 2000. Molecular marker-facilitated pyramiding of different genes for powdery mildew resistance in wheat. Plant Breeding 119: 21-24.
Liu J., L. Liu, N. Hou, A. Zhang, C. Liu, 2007. Genetic diversity of wheat gene pool of recurrent selection assessed by microsatellite markers and morphological traits. Euphytica 155: 249-258.
Liu S.X., J.A. Anderson, 2003. Marker assisted evaluation of Fusarium head blight resistant wheat germplasms. Crop Sci 43: 760-766.
Liu Z.W., R.M. Biyashev, M.A. Saghai-Maroof, 1996. Development of simple sequence repeat DNA markers and their integration into a barley linkage map. Theor Appl Genet 93: 869-876.
Macauly M., L. Ramsay, W. Powell & R. Waugh, 2001. A representative, highly informative 'genotyping set' of barley SSR's. Theor Appl Genet 102: 801-809.

References
87
Manninen O., P. Tanhuanpää, T. Tenhola-Roininen, E. Kiviharju, 2004. Doubled haploids and genetic mapping in barley, rye and oat. In: Vollmann J., Grausgruber H., Ruckenbauer R. (eds). Genetic variation for plant breeding. Publisher BOKU-University of Natural Resources and Applied Life Sciences, Vienna, Austria, p 30.
Marcel T.C., R.K. Varshney, M. Barbieri, H. Jafary, M.J.D. de Kock, A. Graner, R.E. Niks, 2007. A high-density consensus map of barley to compare the distribution of QTLs for partial resistance to Puccinia hordei and of defence gene homologues. Theor Appl Genet 114: 487-500.
Maroquin C., M. Cavelier, A. Rassel, 1982. Premières observations sur le virus de la mosaique jaune de l’orge en Belgique. Bull Rech Agron Gembloux 17: 157-176.
McCartney C.A., D.J. Somers, G. Fedak, W. Cao, 2004. Haplotype diversity at Fusarium head blight resistance QTLs in wheat. Theor Appl Genet 109: 261-271.
McCouch S.R., X. Chen, O. Panaud, S. Temnykh, Y. Xu, Y.G. Cho, H. Huang, T. Ishii, M. Blair, 1997. Microsatellite marker development, mapping applications in rice genetic and breeding. Plant Molecular Biology 35: 89-99.
McCouch S.R., L. Teytelman, Y. Xu, K.B. Lobos, K. Clare, M. Walton, B. Fu, R. Maghirang, Z. Li, Y. Xing, Q. Zhang, I. Kono, M. Yano, R. Fjellstrom, G. DeClerck, D. Schneider, S. Cartinhour, D. Ware, L. Stein, 2002. Development of 2,240 new SSR markers for rice (Oryza sativa L.). DNA Res 9: 199-207.
McKinney H.H., 1925. A mosaic disease of Winter Wheat and Winter Rye. Bulletin No. 1361. Washington, DC, USA, US Department of Agriculture.
Menz M.A., R.R. Klein, J.E. Mullet, J.A. Obert, N.C. Unruh, P.E. Klein, 2002. A high-density genetic map of Sorghum bicolour (L.) Moench based on 2926 AFLP®, RFLP and SSR markers. Plant Mol Biol 48: 483-499.
Michelmore R.W., I. Paran, R.V. Kesseli, 1991. Identification of markers linked to disease resistance genes by bulked segregant analysis: A rapid method to detect markers in specific genomic regions by using segregating populations. Proc Natl Acad Sci USA 88: 9828-9832.
Modawi R.S., E.G. Heyne, D. Burnetta, W.G. Willis, 1982. Genetic studies of field reaction to wheat soil-borne mosaic virus. Plant Disease 66: 1183-1184.
Mohammadi S.A., B.M. Prasanna, 2003. Analysis of Genetic Diversity in Crop Plants-Salient Statistical Tools and Considerations. Crop Sci 43: 1235-1248.
Mohan M., S. Nair, A. Bhagwat, T.G. Krishna, M. Yano, C.R. Bhatia, T. Sasaki, 1997. Genome mapping, molecular markers and marker-assisted selection in crop plants. Molecular Breeding 3: 87-103.
Moragues M., M. Moralejo, M.E. Sorrells, C. Royo, 2007. Dispersal of durum wheat [Triticum turgidum L. ssp. Turgidum convar. durum (Desf.) MacKey] landraces across the Mediterranean basin assessed by AFLPs and microsatellites. Genet Resour Crop Evol 54: 1133-1144.
Mudge J., P.B. Cregan, J.P. Kenworthy, W.J. Kenworthy, J.H. Orf, N.D. Young, 1997. Two microsatellite markers that flank the major soybean cyst nematode resistance locus. Crop Sci 37: 1611-1615.
Mueller U.G., L. La Reesa Wolfenbarger 1999. AFLP genotyping and fingerprinting. Trends in Ecology and Evolution 14: 389-394.
Mullis K.B., F.A. Faloona, 1987. Specific synthesis of DNA in vitro via a polymerase-catalyzed chain reaction. Methods Enzymol 155: 335-350.
Nagakawa M., Y. Soga, S. Watanabe, H. Gocho, K. Nishio, 1959. Genetical studies on the wheat mosaic virus. II Genes affecting the inheritance of susceptibility

References
88
to strains of yellow mosaic virus in varietal crosses of wheat. Japanese Journal of Breeding 9: 118-120.
Narasimhamoorthy B., J.H. Bouton, K.M. Olsen, M.K. Sledge, 2007. Quantitative trait loci and candidate gene mapping of aluminium tolerance in diploid alfalfa. Theor Appl Genet 114: 901-913.
Nei M., 1973. Analysis of gene diversity in subdivided populations. Proc Natl Acad Sci USA 70: 3321-3323.
Nei M., W.H. Li, 1979. Mathematical model for studying genetic variation in terms of restriction endonucleases. Proc Natl Acad Sci USA 76: 5269-5273.
Neuhaus G., R. Horn, 2004. Implications of Single Nucleotide Polymorphisms for Plant Breeding. Progress in Botany 65: 55-71.
Nissan-Azzouz F., A. Graner, W. Friedt, F. Ordon, 2005. Fine-mapping of the BaMMV, BaYMV-1 and BaYMV-2 resistance of barley (Hordeum vulgare) accession ‘PI1963’. Theor Appl Genet 110: 212-218.
Nomura K., S. Kashiwazaki, H. Hibino, T. Inoue, E. Nakata, Y. Tsuzaki, S. Okuyama, 1996. Biological and Serological Properties of Strains of Barley Mild Mosaic Virus. J Phytopathol 144: 103-107.
Oetting W.S., H.K. Lee, D.J. Flanders, G.L. Wiesner, T.A. Sellers, R.A. King, 1995. Linkage analysis with multiplexed short tandem repeat polymorphisms using infrared fluorescence and M13 tailed primers. Genomics 30: 450-458.
Okada Y., S. Kashiwazaki, R. Kanatani, S. Arai, K. Ito, 2003. Effects of barley yellow mosaic disease resistant gene rym1 on the infection by strains of Barley yellow mosaic virus and Barley mild mosaic virus. Theor Appl Genet 106: 181-189.
Okada Y., R. Kanatani, S. Arai, I. Kazutoshi, 2004. Interaction between Barley Yellow Mosaic Disease-resistance Genes rym1 and rym5, in the Response to BaYMV Strains. Breeding Science 54: 319-325.
Ordon F., M. Erdogan, W. Friedt, 1992. Genetics of resistance of barley to soil-borne mosaic viruses. Reproductive Biology and Plant Breeding, Book of Poster Abstracts, XIIIth EUCARPIA Congress, July 6-11, Angers, France, 707-708.
Ordon F., R. Götz, W. Friedt, 1993. Genetic stocks resistant to barley yellow mosaic viruses (BaMMV, BaYMV, BaYMV-2) in Germany. Barley Genet Newsl 22: 46-49.
Ordon F. & W. Friedt, 1993. Mode of inheritance and genetic diversity of BaMMV resistance of exotic barley germplasms carrying genes different from 'ym4'. Theor Appl Genet 86: 229-233.
Ordon F. & W. Friedt, 1994. Agronomic traits of exotic barley germplasms resistant to soil-borne mosaic-inducing viruses. Genetic Resources and Crop Evolution 41: 43-46.
Ordon F., E. Bauer, W. Friedt, A. Graner, 1995. Marker-based selection for the ym4 BaMMV-resistance gene in barley using RAPDs. Agronomie 15: 481-485.
Ordon F., B. Pellio, K. Werner, A. Schiemann, W. Friedt, A. Graner, 2003. Molecular breeding for resistance to soil-borne viruses (BaMMV, BaYMV, BaYMV-2) of barley (Hordeum vulgare L.) J. Plant Diseases and Protection 110: 287-295.
Ordon F., W. Friedt, A. Graner, 2004a. Genetic control of BaMMV and BaYMV. In: Lapierre, H.; Signoret, P.A., 2004. Virus and virus diseases of Poaceae (Gramineae), INRA Èditions, Versailles, France 465-471.
Ordon, F., W. Friedt, K. Scheurer, B. Pellio, K. Werner, G. Neuhaus, W. Huth, A. Habekuss, A. Graner, 2004b. Molecular markers in breeding for virus resistance in barley. J Appl Genet 45: 145-159.

References
89
Ordon F., J. Ahlemeyer, K. Werner, W. Köhler, W. Friedt, 2005. Molecular assessment of genetic diversity in winter barley and its use in breeding. Euphytica 146: 21-28.
Pandey M.P., 2006. Molecular assessment of genetic diversity and population differentiation of hulless barley (Hordeum vulgare L.) landraces from the Himalayas of Nepal and its relevance for barley breeding. Dissertation at the Faculty of Agricultural and Nutritional Sciences, Home Economics and Environmental Management. Justus-Liebig-Universität Giessen. pp 34-59.
Pandey M.P., C. Wagner, W. Friedt, F. Ordon, 2006. Genetic relatedness and population differentiation of Himalayan hulless barley (Hordeum vulgare L.) landraces inferred with SSRs. Theor Appl Genet 113: 715-729.
Parida S.K., K.A.R. Kumar, V. Dalal, N.K. Singh, T. Mohapatra, 2006. Unigene derived microsatellite markers for the cereal genomes. Theor Appl Genet 112: 808-817.
Peerenboom E., J.F. Antoniw, M.J. Adams, H.H. Steinbiss, 1996. Strand-specific RT-PCR detects replication of BaYMV and BaMMV in leaves and roots. In: Proceedings of the third Symposium of the International Working group on Plant Viruses with Fungal Vectors, 6-8 August 1996, Dundee, Scotland, pp 181-183. Denver, CO. American Society of Sugar Beet Technologies.
Pellio B., K. Werner, W. Friedt, A. Graner, F. Ordon, 2000. Resistance to the Barley yellow Mosaic Virus Complex-from Mendelian Genetics towards Map Based Cloning. Czech J Genet Plant Breed 36: 84-87.
Pellio B., S. Streng, A. Graner, W. Friedt, F. Ordon, 2004. Development of PCR-based markers closely linked to rym5. J Plant Disease Protection 111: 30-38.
Pellio B., S. Streng, E. Bauer, N. Stein, D. Perovic, A. Schiemann, W. Friedt, F. Ordon, A. Graner, 2005. High-resolution mapping of the Rym4/Rym5 locus conferring resistance to the barley yellow mosaic virus complex (BaMMV, BaYMV, BaYMV-2) in barley (Hordeum vulgare ssp. vulgare L.). Theor Appl Genet 110: 283-293.
Peng J.H., T. Fahima, M.S. Roeder, Y.C. Li, A. Dahn, A. Grama, Y.I. Ronin, A.B. Korol, E. Nevo, 1999. Microsatellite tagging of the stripe-rust resistance gene YrH52 derived from wild emmer wheat, Triticum dicoccoides, and suggestive negative cross over interference on chromosome 1B. Theor Appl Genet 98: 862-872.
Pickering R. & P.A. Johnston, 2005. Recent progress in barley improvement using wild species of Hordeum. Cytogenet Genome Res 109: 344-349.
Pickering R.A., A.M. Hill, M. Michel, G.M. Timmerman-Vaughan, 1995. The transfer of a powdery mildew resistance gene from Hordeum bulbosum L. to barley (H. vulgare L.) chromosome 2 (21). Theor Appl Genet 91: 1288-1292.
Pickering R.A., P.A. Johnston, G.M. Timmermann-Vaughan, M.G. Cromey, E.M. Forbes, B.J. Steffenson, T.G. Fetch JR, R. Effertzm, L. Zhang, B.G. Murray, G. Proeseler, A. Habekuss, D. Kophanke, I. Schubert, 2000. Hordeum bulbosum – A new source of disease resistance genes for use in barley breeding programmes. Barley Genet Newsletter 30: 6-9.
Pickering R., B. Ruge-Wehling, P.A. Johnston, G. Schweizer, P. Ackermann, P. Wehling, 2006. The transfer of a gene conferring resistance to scald (Rhynchosporium secalis) from Hordeum bulbosum into H. vulgare chromosome 4HS. Plant Breeding 125: 576-579.
Pillen K., A. Binder, B. Kreuzkam, L. Ramsay, R. Waugh, J. Förster, J. Léon, 2000. Mapping new EMBL-derived barley microsatellites and their use in differentiating German barley cultivars. Theor Appl Genet 101: 652-660.

References
90
Powell W., M. Morgante, C. Andre, M. Hanafey, J. Vogel, S. Tingey, J.A. Rafalski, 1996. The comparison of RFLP, RAPD, AFLP and SSR (microsatellite) markers for germplasm analysis. Molecular Breeding 2: 225-238.
Prasad M., R.K. Varshney, J.K. Roy, H.S. Balyan, P.K. Gupta, 2000. The use of microsatellites for detecting DNA polymorphism, genotype identification and genetic diversity in wheat. Theor Appl Genet 100: 584-592.
Pritchard J.K., M. Stephens, P. Donnelly, 2000. Inference of population structure using multilocus genotype data. Genetics 155: 945-959.
Proeseler G., 1988. Wirts- und Nichtwirtspflanzen des Gerstengelbmosaik-Virus (barley yellow mosaic virus). Arch Phytopath Pflanzen 24: 267.
Proeseler G., 1993. Triticum durum Desf. A further host of barley yellow mosaic virus (BaMMV). J Phytopathology 138: 262-264.
Rae S.J., M. Macauly, L. Ramsay, F. Leigh, D. Matthews, D.M. O’Sullivan, P. Donini, P.C. Morris, W. Powell, D.F. Marshall, R. Waugh, W.T.B. Thomas, 2007. Molecular barley breeding. Euphytica DOI 10.1007/s10681-006-9166-8.
Rakoczy-Trojanowska M., H. Bolibok, 2004. Characteristics and a comparison of three classes of microsatellite-based markers and their application in plants. Cell Mol Biol Lett 9: 221-238.
Ramsay L., M. Macaulay, S. degli Ivanissevich, K. McLean, L. Cardle, J. Fuller, K.J. Edwards, S. Tuvesson, M. Morgante, A. Massari, E. Maestri, N. Marmiroli, T. Sjakste, M. Ganal, M. Powell, R. Waugh, 2000. A simple sequence repeat-based linkage map of barley. Genetics 156: 1997-2005.
Rao V.M., T. Hodgkin, 2002. Genetic diversity and conservation and utilization of plant genetic resources. Plant Cell, Tissue and Organ culture 68: 1-19.
Ravel C., S. Praud, A. Murigneux, A. Canaguier, F. Sapet, D. Samson, F. Balfourier, P. Dufour, B. Chalhoub, D. Brunel, M. Beckert, G. Charmet, 2006. Single nucleotide polymorphism frequency in a set of selected lines of bread wheat (Triticum aestivum L.). Genome 49: 1131-1139.
Reif J.C., P. Zhang, S. Dreisigacker, M.L. Warburton, M. van Ginkel, D. Hoisington, M. Bohn, A.E. Melchinger, 2005. Wheat genetic diversity trends during domestication and breeding. Theor Appl Genet 110: 859-864.
Reverse F. & T. Candresse, 2004. Family POTYVIRIDAE. In: Lapierre, H.; Signoret, P. A, 2004. Virus and virus diseases of Poaceae (Gramineae). INRA Èditions, Versailles, France, 385-389.
Risch N., 1992. Genetic linkage: Interpreting LOD scores. Science 255: 803-804. Roeder M., V. Korzun, K. Wendehake, J. Plaschke, M.-H. Tixier, P. Leroy, W. Ganal,
1998. A microsatellite map of wheat. Genetics 149: 2007-2023. Röder M.S., K. Wendehake, V. Korzun, G. Bredemeijer, D. Laborie, L. Bertrand, P.
Isaac, S. Rendell, J. Jackson, R.J. Cooke, B. Vosman, M.W. Ganal, 2002. Construction and analysis of a microsatellite-based database of European wheat varieties. Theor Appl Genet 106: 67-73.
Rostoks N., S. Mudie, L. Cardle, J. Russell, L. Ramsey, A. Booth, J.T. Svensson, S.I. Wanamaker, H. Walia, E.M. Rodriguez, P.E. Hedley, H. Liu, J. Morris, T.J. Close, D.F. Marshall, R. Waugh, 2005. Genome-wide SNP discovery and linkage analysis in barley based on genes responsive to abiotic stress. Mol Gen Genomics 274: 515-527.
Roussel V., J. Koenig, M. Beckert, F. Balfourier 2004. Molecular diversity in French bread wheat accessions related to temporal trends and breeding programmes. Theor Appl Genet 108: 920-930.

References
91
Roussel V., L. Leisova, F. Exbrayat, Z. Stehno, F. Balfourier, 2005. SSR allelic diversity changes in 480 bread wheat varieties released from 1840 to 2000. Theor Appl Genet 111: 162-170.
Roy J.K., M.S. Lakshmikumaran, H.S. Balyan, P.K. Gupta, 2004. AFLP-Based Genetic Diversity and Its Comparison With Diversity Based on SSR, SAMPL, and Phenotypic Traits in Bread Wheat. Biochemical Genetics 42: 43-59.
Rubies-Autonell C. & V. Vallega, 1990. Soil-borne wheat mosaic virus and wheat spindle streak mosaic virus in Italy. In: König R (ed) Proc 1st Symp Intern Working Group Plant Viruses with Fungal Vectors, Braunschweig, Germany August 21-24.199, pp 135-138.
Ruge B., A. Linz, G. Pickering, P. Greif, P. Wehling, 2003. Mapping of Rym14HB, a gene introgressed from Hordeum bulbosum and conferring resistance to BaMMV and BaYMV in barley. Theor Appl Genet 107: 965-971.
Ruge B., A. Linz, A. Habekuß, K. Flath, P. Wehling, 2004. Introgression and mapping of novel resistance genes from the secondary gene pool of barley, Hordeum bulbosum. Proc 9th Int Barley Genet Symp 20-26 June 2004, Brno, Czech Republic, pp. 729-736.
Ruge-Wehling B., A. Linz, A. Habekuss, P. Wehling, 2006. Mapping of Rym16HB, the second soil-borne virus-resistance gene introgressed from Hordeum bulbosum. Theor Appl Genet 113: 867-873.
Rush C.M., 2003. Ecology and Epidemiology of Benyviruses and Plasmodiophorid Vectors. Annu Rev Phytopathol 41: 567-92.
Russell J., J.D. Fuller, M. Macauly, B.G. Hatz, A. Jahoor, W. Powell, R. Waugh, 1997. Direct comparison of levels of genetic variation among barley accessions detected by RFLPs, AFLPs, SSRs, and RAPDs. Theor Appl Genet 95: 714-722.
Russell J., A. Booth, J. Fuller, B. Harrower, P. Hedley, G. Machray, W. Powell, 2004. A comparison of sequence-based polymorphism and haplotype content in transcribed and anonymous regions of the barley genome. Genome 47: 389-398.
Saal B., G. Wricke, 2002. Clustering of amplified fragment length polymorphism markers in a linkage map of rye. Plant Breeding 121: 117-123.
Saeki K., Miyazaki C., N. Hirota, A. Saito, K. Ito, T. Konishi, 1999. RFLP mapping of BaYMV resistance gene rym3 in barley (Hordeum vulgare). Theor Appl Genet 99: 727-732.
Saghai-Maroof M.A., G.B. Yang, R.M. Biyashev, P.J. Maughan, Q. Zhang, 1996. Analysis of barley and rice genome by comparative RFLP linkage mapping. Theor Appl Genet 92: 541-551.
Schenk P.M., J.F. Antoniw, J.F. de Batista, V. Jacobi, J. Adams, H.-H. Steinbiss, 1995. Movement of barley mild mosaic and barley yellow mosaic viruses in leaves and roots of barley. Annals of Applied Biology 120: 291-305.
Scheurer K.S., W. Friedt, W. Huth, R. Waugh, F. Ordon, 2001. QTL analysis of tolerance to a German strain of BYDV-PAV in barley (Hordeum vulgare L.) Theor Appl Genet 103: 1074-1083.
Schiemann A., A. Graner, W. Friedt, F. Ordon, 1997. Specificity enhancement of a RAPD marker linked to the BaMMV/BaYMV resistance gene ym4 by randomly added bases. Barley Genet Newsletter 26: 63-65.
Schiemann A., E. Bauer, A. Graner, W. Friedt, F. Ordon, 1998. RAPD-markers linked to the BaMMV-resistance gene ym9. Barley Genet Newsletter 28: 19-22.
Schiemann A., V. Dauck, W. Friedt, S. Streng, A. Graner, F. Ordon, 1999. Establishment of a fluorescence-based AFLP technique and rapid marker

References
92
detection for the resistance locus rym5. Barley Genet Newsletter 2. http://wheat.pw.usda.gov/ggpages/bgn/29/a29-01.html
Schlichter U., A. Sohn, E. Peerenboom, J. Schell and H.-H. Steinbiss, 1993. Molecular analysis of the capsid protein gene of a German isolate of barley mild mosaic virus. Plant Cell Reports 12: 237-240.
Schlötterer C., 2004. The evolution of molecular markers - just a matter of fashion? Nature Reviews Genetics 5: 63-69.
Schmid K.J, T.R. Sorensen, R. Stracke, O. Torjek, T. Altmann, T. Mitchell-Olds, B. Weisshaar, 2003. Large-scale identification and analysis of genome-wide single-nucleotide polymorphisms for mapping in Arabidopsis thaliana. Genome Res 13: 1250-1257.
Schön C.C., W. Link, 1997. Biometrische Methoden zur Beschreibung genetischer Diversität – Fallbeispiele. Schriften zu genetischen Ressourcen Band 8: Züchterische Nutzung pflanzengenetischer Ressourcen – Ergebnisse und Forschungsbedarf –Tagungsband eines Symposiums vom 29.09. bis 01.10.1997 in Gatersleben, pp 110-117.
Shannon C.E., W. Weaver, 1949: The mathematical theory of communication. Univ. of Illinois Press, Urbana.
Sharma P.N., A. Torii, S. Takumi, N. Mori, C. Nakamura, 2004. Marker-assisted pyramiding of brown planthopper (Nilaparvata lugens Stål) resistance genes Bph1 and Bph2 on rice chromosome 12. Hereditas 140: 61-69.
Sharopova N., M. McMullen, L. Schultz, S. Schroeder, H. Sanchez-Villeda, J. Gardiner, D. Bergstrom, K. Houchins, S. Melia-Hancock, T. Musket, N. Duru,
M. Polacco, K. Edwards, T. Ruff, J.C. Register, C. Brouwer, R. Thompson, R. Velasco, E. Chin, M. Lee, W. Woodman-Clikeman, M.J. Long, E. Liscum, K. Cone, G. Davis, E. Coe JR., 2002. Development and mapping of SSR markers for maize. Plant Mol Biol 48: 463-481.
Shirako Y., N. Suzuki, R.C. French, 2000. Similarity and divergence among viruses in the genus Furovirus. Virology 270: 201-207.
Shirasawa K., S. Shiokai, M. Yamaguchi, S. Kishitani, T. Nishio, 2006. Dot-blot SNP analysis for practical plant breeding and cultivar identification in rice. Theor Appl Genet 113: 147-155.
Shtaya M.J.Y., J.C. Sillero, K. Flath, R. Pickering, D. Rubiales, 2007. The resistance to leaf rust and powdery mildew of recombinant lines of barley (Hordeum vulgare L.) derived from H. vulgare x H. bulbosum crosses. Plant Breeding 126: 259-267.
Signoret P.A., W. Huth, 1993. Soil borne viruses on barley in Southern France. J Plant Diseases and Protection 100: 239-242.
Simioniuc D., W. Friedt, R. Uptmoor, F. Ordon, 2002. Genetic diversity and relationships of pea cultivars (Pisum sativum L.) revealed by RAPDs and AFLPs. Plant Breeding 121: 429-435.
Sneath P.H.A., R.R. Sokal, 1973. Numerial taxonomy. Freeman, San Francisco, CA. Snowdon R.J., W. Friedt, 2004. Molecular markers in Brassica oilseed breeding:
current status and future possibilities. Plant Breeding 123: 1-8. Sohn A., P.A. Signoret, L.E. Davidson, G.A. Bergstrom, 2004. Wheat spindle streak
mosaic In: Lapierre, H.; Signoret, P. A, 2004. Virus and virus diseases of Poaceae (Gramineae). INRA Èditions, Versailles, France 597-599.
Somers D.J., K.R.D. Friesen, G. Rakow, 1998. Identification of molecular markers associated with linoleic acid desaturation in Brassica napus. Theor Appl Genet 96: 897-903.

References
93
Somers D.J., P. Isaac, K. Edwards, 2004. A high-density microsatellite consensus map for bread wheat (Triticum aestivum L.). Theor Appl Genet 109: 1105-1114.
Song Q.J., J.R. Shi, S. Singh, E.W. Fickus, J.M. Costa, J. Lewis, B.S. Gill, R. Ward, P.B. Cregan, 2005. Development and mapping of microsatellite (SSR) markers in wheat. Theor Appl Genet 110: 550-560.
Southern E., 1975. Gel electrophoresis of restriction fragments. Meth Enzymol 68: 152-176.
Stachel M., T. Lelley, H. Grausgruber, J. Vollmann, 2000. Application of microsatellites in wheat (Triticum aestivum L.) for studying genetic differentiation caused by selection for adaptation and use. Theor Appl Genet 100: 242-248.
Stam P., J.W. Van Ooijen, 1995. JoinMap ™ version 2.0: Software for the calculation of genetic linkage maps. CPRO-DLO, Wageningen.
Staub J.E., J. Box, V. Meglic, T. Horejsi, J.D. McCreight, 1997. Comparison of isozyme and random amplified polymorphic DNA data for determining intraspecific variation in Cucumis. Genet Reso Crop Evol 44: 257-269.
Stein N., 2007. Triticeae genomics: advances in sequence analysis of large genome cereal crops. Chromosome Research 15: 21-31.
Stein N. & A. Graner, 2004. Map-based gene isolation in cereal genomes. In: Gupta P.K., R.K. Varshney (eds) Cereal genomics. Springer, Berlin Heidelberg, New York.
Stein N., D. Perovic, J. Kumlehn, B. Pellio, S. Stracke, S. Streng, F. Ordon, A. Graner, 2005. The eukaryotic initiation factor of translation 4E confers multiallelic recessive bymovirus resistance in Hordeum vulgare (L.). The Plant Journal 42: 912-922.
Stępień L., V. Mohler, J. Bocianowski, G. Koczyk, 2007. Assessing genetic diversity of Polish wheat (Triticum aestivum) varieties using microsatellite markers. Genet Resour Crop Evol 54: 1499-1506.
Stodart B.J., M. Mackay, H. Raman, 2005. AFLP and SSR analysis of genetic diversity among landraces of bread wheat (Triticum aestivum L. em. Thell) from different geographic regions. Australian Journal of Agricultural Research 56: 691-697.
Stoerker J., J.D. Mayo, C.N. Tetzlaff, D.A. Sarracino, I. Schwope, C. Richert, 2000. Rapid genotyping by MALDI-monitored nuclease selection from probe libraries. Nat Biotechnol 18: 1213-1216.
Takahashi R., Hayashi J., Inouye T., Moriya I., C. Hirao, 1973. Studies on resistance to yellow mosaic disease in barley. I. Tests for varietal reactions and genetic analysis of resistance to the disease. Ber Ohara Inst 16: 1-17.
Thiel T., W. Michalek, R.K. Varshney, A. Graner, 2003. Exploiting EST databases for the development and characterization of gene-derived SSR markers in barley (Hordeum vulgare L.) Theor Appl Genet 106: 411-422.
Toth G., Z. Gaspari, J. Jurka, 2000. Microsatellites in different eukaryotic genome: survey and analysis. Genome Res 10: 1967-1981.
Toyama A. & T. Kusaba, 1970. Transmission of soil-borne barley yellow mosaic virus. 2. Polymyxa graminis Led. as vector. Ann Phytopath Soc Japan 36: 223-229.
Tuvesson S., R. v. Post, A. Ljungberg, 2003. Wheat anther culture. In: Maluszynski M., Kasha K.J., Forster B.P., Szarejko I (eds). Doubled haploid production in crop plants- a manual. Kluwer Academic Publishers, Dordrecht/Boston/London, pp 71-76.

References
94
Tuvesson S., C. Dayteg, P. Hagberg, O. Manninen, P. Tanhuanpää, T. Tenhola-Roininen, E. Kivihariu, J. Weyen, J. Förster, J. Schondelmaier, J. Lafferty, M. Marn, A. Fleck, 2007. Molecular markers and doubled haploids in European plant breeding programmes. Euphytica DOI 10.1007/s10681-006-9239-8.
Ukai Y., 1984. Genetic analysis of a mutant resistant to barley yellow mosaic virus. Barley Genet Newsletter 14: 31-33.
USDA, 2007. United States Department of Agriculture, Foreign Agricultural Service. http://www.fas.usda.gov/psdonline/psdQuery.
Uptmoor R., W.G. Wenzel, W. Friedt, G. Donaldson, K. Ayisi, F. Ordon, 2003. Comparative analysis on the genetic relatedness of Sorghum bicolor accessions from Southern Africa by RAPDs, AFLPs and SSRs. Theor Appl Genet 106: 1316-1325.
Usugi T., 1988. Epidemiology and management in Japan of soil-borne cereal mosaic viruses with filamentous particles. In: Cooper, J. I. & M. J. C. Asher (eds) Developments in Applied Biology 2. Viruses with fungal vectors, pp 213-225.
Vaianopoulos C., A. Legrève, V. Moreau, S. Steyer, H. Maraite, C. Bragard, 2005. Occurence of bymo- and furoviruses on wheat in Belgium. Parasitica 61: 47-54.
Vaianopoulos C., A. Legrève, C. Lorca, V. Moreau, S. Steyer, H. Maraite, C. Bragard. 2006. Widespread Occurrence of Wheat spindle streak mosaic virus in Belgium. Plant Disease 90: 723-728.
Varshney R.K., A. Graner, M.E. Sorrells, 2005. Genomics-assisted breeding for crop improvement. Trends in Plant Science 10: 621-630.
Varshney R.K., D.A. Hoisington, A.K. Tyagi, 2006. Advances in cereal genomics and applications in crop breeding. Trends in Biotechnology 24: 490-499.
Varshney R.K., T.C. Marcel, L. Ramsay, J. Russell, M.S. Röder, N. Stein, R. Waugh, P. Langridge, R.E. Niks, A. Graner, 2007. A high density barley microsatellite consensus map with 775 SSR loci. Theor Appl Genet 114: 1091-1103.
Vignal A., D. Milan, M. SanCristobal, A. Egger, 2002. A review on SNP and other types of molecular markers and their use in animal genetics. Genet Sel Evol 34: 275-305.
Von Korff M., H. Wang, J. Leon, K. Pillen, 2006. AB-QTL analysis in spring barley: II. Detection of favourable exotic alleles for agronomic traits introgressed from wild barley (H. vulgare ssp spontaneum). Theor Appl Genet 112: 1221-1231.
Vos P., R. Hogers, M. Bleeker, M. Reijans, T. Van de Le, M. Hornes, A. Frijiters, J. Pot, J. Peleman, M. Kuiper, M. Zabeau, 1995. AFLP: a new technique for DNA fingerprinting. Nucleic Acids Research 23: 4407-4414.
Walther U., H. Rapke, G. Proeseler, G. Szigat, 2000. Hordeum bulbosum – a new source of disease resistance – transfer of resistance to leaf rust and mosaic viruses from H. bulbosum into winter barley. Plant Breeding 119: 215-218.
Wang H.Y., M. Luo, I.V. Tereshchenko, D.M. Frikker, X. Cui, J.Y. Li, G. Chu, M.A. Azaro, Y. Lin, L. Shen, Q. Yang, M.E. Kambouris, R. Gao, W. Shih, H. Li, 2005. A genotyping system capable of simultaneously analyzing >1000 single nucleotide polymorphisms in a haploid genome. Genome Res 15: 276-283.
Waugh R., N. Bonar, E. Baird, B. Thomas, A. Graner, P. Hayes, W. Powell, 1997. Homology of AFLP products in three mapping populations of barley. Mol Gen Genet 255: 311-321.
Weber J.L., 1990. Informativeness of human (dC-dA)n - (dG-dT)n polymorphisms. Genomics 7: 524-530.

References
95
Wenzl P., Carling J., D. Kudrna, D. Jaccoud, E. Huttner, A. Kleinhofs, A. Kilian, 2004. Diversity Arrays Technology (DArT) for whole-genome profiling of barley. PNAS 101: 9915-9920.
Wenzl P. H. Li, J. Carling, M. Zhou, H. Raman, E. Paul, P. Hearnden, C. Maier, L. Xia, V. Caig, J. Ovesna, M. Cakir, D. Poulsen, J. Wang, R. Raman, K.P. Smith, G.J. Muehlbauer, K.J. Chalmers, A. Kleinhofs, E. Huttner, A. Kilian., 2006. A high-density consensus map of barley linking DArT markers to SSR, RFLP and STS loci and agricultural traits. BMC Genomics 7: 206-228.
Werner K., 2002. Kartierung und Pyramidisierung von Resistenzgenen gegen die Gelbmosaikvirose (BaMMV, BaYMV, BaYMV-2) der Gerste (Hordeum vulgare ssp. vulgare). Dissertation beim Fachbereich Agrarwissenschaften, Ökotrophologie und Umweltmanagement an der Justus-Liebig-Universität Giessen.
Werner K., B. Pellio, F. Ordon, W. Friedt, 2000a. Development of an STS marker and SSRs suitable for marker-assisted selection for the BaMMV resistance gene rym9 in barley. Plant Breeding 119: 517-519.
Werner K., W. Friedt, F. Ordon, 2000b. Strategies for „pyramiding“ resistance genes against the barley yellow mosaic virus complex based on molecular markers and DH lines. Proc. 8th Int. Barley Genetics Symp. 22-27 Oct. 2000, Adelaide, Australia, 200-202.
Werner K., W. Friedt, E. Laubach, R. Waugh, F. Ordon, 2003a. Dissection of resistance to soil-borne yellow mosaic inducing viruses of barley (BaMMV, BaYMV, BaYMV-2) in a complex breeders cross by SSRs and simultaneous mapping of BaYMV/BaYMV-2 resistance of ´Chikurin Ibaraki 1´. Theor Appl Genet 106: 1425-1432.
Werner K., S. Rönicke, J. Le Gouis, W. Friedt, F. Ordon, 2003b. Mapping of a new BaMMV-resistance gene derived from the variety ´Taihoku A´. J Plant Disease Protec 110: 304-311.
Werner K., W. Friedt & F. Ordon, 2005. Strategies for pyramiding resistance genes against the barley yellow mosaic virus complex (BaMMV, BaYMV, BaYMV-2). Mol Breeding 16, 45-55.
Werner K.; W: Friedt, F. Ordon, 2007. Localisation and combination of resistance genes against soil-borne viruses of barley (BaMMV, BaYMV) using doubled haploids and molecular markers. Euphytica, DOI: 10.1007/s10681-006-9206-4.
West M.A.L., H. van Leeuwen, A. Kozik, D.J. Kliebenstein, R.W. Doerge, D.A. St. Clair, R.W. Michelmore, 2006. High-density haplotyping with microarray-based expression and single feature polymorphism markers in Arabidopsis. Genome Res 16: 787-795.
Williams J.G.K., A.R. Kubelik, K.J. Livak, J.A: Rafalski, S.V. Tingey, 1990. DNA polymorphisms amplified by arbitrary primers are useful as genetic markers. Nucleic Acids Res 18: 6531-6535.
Williams K.J., 2003. The molecular genetics of disease resistance in barley. Australian Journal of Agricultural Research 54: 1065-1079.
Wittenberg A.H.J., T. van der Lee, C. Cayla, A. Kilian, R.G.F. Visser, H.J. Schouten, 2005. Validation of the high-throughput marker technology DArT using the model plant Arabidopsis thaliana. Mol Genet Genomics 274: 30-39.
Wright S., 1978. Evolution and genetics of populations. Vol IV. The Univ. of Chicago Press.

References
96
Xia L., K. Peng, S. Yang, P. Wenzl, C. de Vicente, M. Fregene, A. Kilian, 2005. DarT for high-throughput genotyping of cassava (Manihot esculenta) and its wild relatives. Theor Appl Genet 110: 1092-1098.
Yang J., J. Cheng, Y. Cheng, M.J. Adams, 2001. Sequence analysis of a soil-borne wheat mosaic virus isolate from Italy shows that it is the same virus as European wheat mosaic virus and soil-borne rye mosaic virus. Science in China 44: 216-24.
Yang S., W. Pang, J. Harper, J. Carling, P. Wenzl, E. Huttner, X. Zong, A. Kilian, 2006. Low level of genetic diversity in cultivated pigeonpea compared to its wild relatives is revealed by diversity arrays technology (DArT). Theor Appl Genet 113: 585-595.
Yili R., J. Dengdi, 1983. On barley yellow mosaic virus (BYMV). Acta Phytopathol Sinica 99: 244-253.
Yu J., J. Wang, W. Lin, S. Li, H. Li, J. Zhou, P. Ni, W. Dong, S. Hu, C. Zeng, J. Zhang, Y. Zhang, R. Li, Z. Xu, S. Li, X. Li, H. Zheng, L. Cong, L. Lin, J. Yin, J. Geng, G. Li, J. Shi, J. Liu, H. Lv, J. Li, J. Wang, Y. Deng, I. Ran, X. Shi, X. Wang, Q. Wu, C. Li, X. Ren, J. Wang, X. Wang, D. Li, D. Liu, X. Zhang, J. Ji, P. Chen, S. Wu, J. Liu, Y. Xiao, D. Bu, J. Tan, I. Yang, C. Ye, J. Zhang, J. Xu, Y. Zhou, Y. Yu, B. Zhang, S. Zhuang, H. Wei, B. Liu, M. Lei, H. Yu, Y. Li, H. Xu, S. Wei, X. He, L. Fang, Z. Zhang, Y. Zhang, X. Huang, Z. Su, W. Tong, J. Li, Z. Tong, S. Li, J. Ye, L. Wang, L. Fang, T. Lei, C. Chen, H. Chen, Z. Xu, H. Li, H. Huang, F. Zhang, H. Xu, N. Li, C. Zhao, S. Li, L. Dong, Y. Huang, L. Li, Y. Xi, Q. Qi, W. Li, B. Zhang, W. Hu, Y. Zhang, X. Tian, Y. Jiao, X. Liang, J. Jin, L. Gao, W. Zheng, B. Hao, S. Liu, W. Wang, L, Yuan, M. Cao, J. McDermott, R. Samudrala, J. Wang, G.K. Wong, H. Yang, 2005. The genomes of Oryza sativa: a history of duplications. PLoS Biol 3: e38.
Zabeau M & P. Vos, 1993. Selective restriction fragment amplification: a general method for DNA fingerprinting. European patent application number 92402629 Publication number 0 534 858 A1.
Zhan J., B.D.L Fitt, H.O. Pinnschmidt, S.J.P. Oxley, A.C. Newton, 2007. Cultivar resistance and sustainable management of Rhynchosporium secalis populations on barley. Plant Pathology accepted.
Zhang J., X. Li, G. Jiang, Y. Xu, Y. He, 2006. Pyramiding of Xa7 and Xa21 for the improvement of disease resistance to bacterial blight in hybrid rice. Plant Breeding 125: 600-605.
Zhang Q., Q. Li, X. Wang, H. Wang, S. Lang, Y. Wang, S. Wang, P. Chen, D. Liu, 2005. Development and characterisation of a Triticum aestivum-Haynaldia villosa translocation line T4VS·4DL conferring resistance to wheat spindle streak mosaic virus. Euphytica 145: 317-320.
Zhang X., C. Li, L. Wang, H. Wang, G. You, Y. Dong, 2002. An estimation of the minimum number of SSR alleles needed to reveal genetic relationships in wheat varieties. I. Information from large-scale planted varieties and cornerstone breeding parents in Chinese wheat improvement and production. Theor Appl Genet 106: 112-117.

Appendix
97
9 Appendix .

Appendix
98

Appendix
99
Table A3: PCR program for the SSR-analysis.
PCR program Phases
A 18 cycles of 1 min at 94°C, 1 min at 64°C (0.5°C/cycle), 1
min at 72°C
30 cycles of 1 min at 94°C, 1min at 55°C, 1 min at 72°C
1 cycle of 5 min at 72°C
B 18 cycles of 1 min at 94°C, 1 min at 69°C (0.5°C/cycle), 1
min at 72°C
30 cycles of 1 min at 94°C, 1min at 55°C, 1 min at 72°C
1 cycle of 5 min at 72°C
C 1 cycle of 3 min at 94°C, 2 min at 55°C, 1 min 30 s at 72°C
30 cycles of 1 min at 94°C, 1min at 55°C, 1 min 30 s at 72°C
1 cycle of 5 min at 72°C
D 1 cycle of 3 min at 94°C, 1 min at 66°C, 1 min at 72°C
6 cycles of 30 s at 94°C, 30 s at 65°C
24 cycles of 30 s at 72°C, 30 s at 94°C, 30 s 60°C
1 cycle of 5 min at 72°C
E 1 cycle of 3 min at 94°C, 1 min at 55°C, 1 min at 72°C
30 cycles of 1 min at 94°C, 1min at 55°C, 1 min at 72°C
1 cycle of 5 min at 72°C
F 1 cycle of 3 min at 94°C, 1 min at 58°C, 1 min at 72°C
30 cycles of 1 min at 94°C, 1min at 58°C, 1 min at 72°C
1 cycle of 5 min at 72°C
Ebmac906 1 cycle of 3 min at 94°C, 30 s at 52°C, 30 s at 72°C
25 cycles of 30 s at 94°C, 30 s at 52°C, 30 s at 72°C
1 cycle of 5 min at 72°C
GBM 1 cycle of 3 min at 94°C
10 cycles of 30 s at 94°C, 30 s 60°C (-0.5°C/cycle), 15 s 72°C
30 cycles of 30 s at 94°C, 30 s 55°C, 15 s 72°C
1 cycle of 5 min at 72°C

Appendix
100
PCR program Phases
HVM03 1 cycle of 3 min at 94°C, 2 min at 55°C, 1 min 30 s at 72°C
30 cycles of 1 min at 94°C, 2 min at 55°C, 1 min 30 s at
72°C
1 cycle of 5 min at 72°C
HVM15 18 cycles of 3 min at 94°C, 1 min at 94°C, 30 s 64°C
(-0.5°C/cycle), 1 min at 72°C
30 cycles of 1 min at 94°C, 1min at 55°C, 1 min at 72°C
Table A4: PCR recipes of the wheat SSRs. I II
DNA 2.0 µl 2.0 µl
10x PCR-buffer 2.5 µl 1.5 µl
dNTPs 0.4 µl 0.3 µl
MgCl2 / 0.4 µl
R-primer 1.0 ml 0.15 µl
F-primer 1.0 µl 0.15 µl
M13-primer / 0.15 µl
H20 18.0 µl 10.25 µl
Taq- polymerase 1.0 µl 1.0 µl
Table A5: PCR programs for the wheat SSR reactions. PCR program Phases
I 1 cycle of 3 min at 94°C
45 cycles of 1 min at 94°C, 1 min at 55°C, 2
min at 72°C
1 cycle of 10 min at 72°C
II 1 cycle of 3 min at 95°C
35 cycles of 20 s at 95°C, 20 s at 55°C, 30 s
at 72°C
1 cycle at 5 min at 72°C

Appendix
101

Appendix
102

Appendix
103

Appendix
104

Appendix
105

Appendix
106

Appendix
107

Appendix
108

109
Danksagung Herrn Prof. Dr. Wolfgang Friedt danke ich herzlich für die Überlassung des Promotionsthemas und die allzeit gewährte Unterstützung bei der Durchführung dieser Arbeit. Herrn Prof. Dr. Wolfgang Köhler danke ich für die bereitwillige Übernahme des Koreferats. Weiterhin möchte ich besonders Herrn Prof. Dr. Frank Ordon für die wissenschaftliche Betreuung danken, die stete Diskussionsbereitschaft und das Vertrauen in meine Arbeit. Für die sehr gute Zusammenarbeit in dem CRAFT-Projekt ‚VIRRES’ möchte ich den Projektpartnern und somit Dr. Andrea Schiemann, Dr. Heidi Jaiser, Dr. Pierre Devaux und Dr. Andreas Jacobi danken. Ein besonderes Dankeschön gilt all jenen, die mir bei den zahlreichen Feldversuchen auf vielfältige Weise geholfen haben, trotz Beschwerde mancher zum „Sklaventreiber“ zu avancieren. Petra Kretschmer und Roland Kürschner danke ich im Besonderen für die Aufzucht der Gerstenlinien und die Mithilfe bei den ELISA-Versuchen im Gewächshaus. Weiterhin möchte ich meinen herzlichen Dank an Swetlana Renner, Kirsten Ramlow und Annette Plank zum Ausdruck bringen, die aufgrund ihrer verantwortungsvollen technischen Assistenz zum Gelingen dieser Arbeit beitrugen und sich nicht durch das zeitweilige „Rumhüpfen“ ihrer Doktorandin im Labor aus der Ruhe bringen ließen. Allen derzeitigen und ehemaligen Kolleginnen und Kollegen des Instituts danke ich für die freundliche Arbeitsatmosphäre und die vielen aufmunternden Worte, wenn mal wieder eine DH-Population ihr „wahres Gesicht“ zeigte. Insbesondere möchte ich Dr. Jutta Ahlemeyer und Dr. Carola Wagner danken, die stets Rede und Antwort für meine zahlreichen Fragen standen oder einfach nur so für nette Unterhaltung sorgten, wenn ich mal wieder eine ‚Arbeitspause’ einlegte und unaufgefordert in ihrem Büro Platz nahm. Mein besonderer Dank gilt Dr. Katja Banzhaf und Dr. Ruth Eichmann für die sorgfältige Durchsicht dieser Arbeit sowie für ihre Freundschaft in all den Jahren. Für die finanzielle Unterstützung sei der Commission of the European Communities (Contract No QLK5-CT-2002-71855), Directorate-General Research - Quality of Life and Management of Living Resources Programme und der Arbeitsgemeinschaft industrieller Forschungsvereinigungen (AiF), Projektträger des BMWA PRO INNO, gedankt. Schließlich gilt meinen Eltern, meiner Oma, meiner Schwester mit Familie und Jürgen mein herzlicher Dank, da sie mich auf vielfältige Weise unterstützt haben und stets für mich da waren, auch wenn ich nicht immer gewillt war, vorwiegend Sonntags, dies auf freundliche Art zu zeigen.
