institution brockport. - eric · anido, san jose, california; diane lewandowski, chicago public...
TRANSCRIPT

4
DOCUMENT RESUME
ED 240 764 EC 161 827
AUTHOR Minnick, Joseph P.; Short, Francis X.TITLE The Physical Fitness of Sensory and Orthopedically
Impaired Youth: Project UNIQUE. Final Report.INSTITUTION State Univ. of New York, Brockport. Coll. at
Brockport.SPONS AGENCY Special Education Programs (ED/OSERS), Washington,
DC.PUB DATE Nov 82GRANT 0007902258NOTE 318p.; The document was developed through the
Physical Education Department.PUB TYPE Reports - Research/Technical (143)
EDRS PRICE MF01/PC13 Plus Postage.DESCRIPTORS Age Differences; Blindness; Cerebral Palsy;
Curriculum Development; Deafness; ElementarySecondary Education; Evaluation Methods; *HearingImpairments; *Motor Development; Muscular Strength;*Physical Disabilities; *Physical Fitness; *PhysicalHealth; Sex Differences; *Visual Impairments
ABSTRACTThe report summarizes findings from an examination of
the physical fitness of orthopedically and sensory impaired students(10-17 years old). Physical fitness was hypothesized to include sixareas: body composition, muscular strength/endurance, speed, agility,flexibility, and cardiorespiratory endurance. A chapter on methodsdetails subject selection procedures (including information ofdefinitions, categories, and codes) and tests for each of the sixareas. Ss' scores are presented for each test item, at each age, formales and females, and for sexes combined. The effects ofgroups/conditions, age, and sex on physical fitness test performanceare analyzed, as are the effects of severity and onset ofhandicapping condition and methods of ambulation. Also presented isdescriptive information contrasting performance of nonhandicapped andhandicapped Ss. Factor structures of fitness for specific groups areprovided. Curricular implications of the study's results pertain tothe commonality of factor structure, levels of physical fitness, typeand severity of handicapping condition, age, sex differences,educational setting, individualization, education responsibility, andtraining materials. (CL)
************************************************************************ Reproductions supplied by EDRS are the best that can be made *
* from the original document. ************************************************************************

THE PHYSICAL FrANESS OF SENSORY
AND ORTHOPEDICALLY IMPAIRED YOUTH
byJoseph P. Winnick and
Francis X. ShortPhysical Education DepartmentState University of New York
College At Brockport
Project UNIQUEFinal Report, November, 1982
Funded bySpecial Education Programs
U.S. Department of Education
This project was funded by Special Education Programs, U.S. Department ofEducation, Grant No. G007902258, Project No. 023CH10058. The contentspresented in this final report are those of the authors and do not necessarilyreflect the position or policy of Special Education Programs and no officialendorsement by Special Education Programs should be inferred.
3

THE PHYSICAL FITNESS OF SENSORY
AND ORTHOPEDICALLY IMPAIRED YOUTH
Printed at theState Uni,,ersity of New York
College at BrockportBrockport, N.Y. 14420
4

-,`
Preface
In 1979, the State University of New York, College at Brockport wasawarded a grant from the Office of Special Education and Rehabilitative Services(presently Special Education Programs), Department of Education, Washington,D.C., to study the fitness of sensory and orthopedically impaired children andyouth. During the next three years, the objectives of the project wereaccomplished through a variety of activities and with the help of many individuals.The material that is presented in this report is a culmination of the activitiesof the project.
The impetus for this project may be traced back to Public Law 94-142,which specifies that all handicapped children must be made available a free,appropriate public education which emphasizes special education and relatedservices to meet their unique need. The law clearly states that physicaleducation must be made available to meet the unique needs of the handicapped.This project was designed to help professionals identify the unique physicalfitness needs of individuals classified as sensory or orthopedically impaired.The study was based on the assumption that to determine a unique need, it isnecessary to have a point of reference, and that this point of reference shouldbe normal performance, whenever appropriate; the performance of other childrenand youth of the same sex, age, and disability, at certain times; and one's ownperformance at various points in time, as appropriate. In certain cases, itwas recognized that all of these references could be used in the identificationand/or justification of a unique need. If these are, indeed, the referencesfor unique needs, it is necessary to provide baseline data relative to thephysical fitness performance of these references, as appropriate. This, then,
became the major focus of Project UNIQUE.
Prior to this study, relatively little research pertaining to the physicalfitness of individuals with auditory impairments had been conducted. In regardto individuals with visual impairments, the most notable research was conductedby Buell in the 1950's. Little or no information was available in regard to thequantitative physical fitness abilities of youth with orthopedic disabilities.Tests to measure physical fitness factors were notably absent for these persons.The fact that little research had been conducted relative to individuals withorthopedic disabilities was not entirely by accident or total neglect. Thediverse nature of various orthopedic conditions, the limitations placed on them,the wide variation in abilities, the complexities involved in conducting suchresearch, concerns about the worthiness of quantitatively derived data, andphilosophical beliefs about treatment and development all influenced the pursuitof, or lack of pursuit of, research in this area. These factors were obstacleswhich had to be dealt with in planning and conducting this present investigation.
Many of the problems associated with conducting this project were concep-tual in nature. It was extremely difficult to group subjects in a way that wouldbe relevant to physical fitness performance. After considerable thought,analysis, and debate, a decision was made to closely follow subclassificationsrecently developed by sport organizations, particularly the National Associationof Sports for Cerebral Palsy and the rational Wheelchair Athletic Association.
In selecting subjarts for the study, it was necessary to eliminate inai-viduals with multi. handicapping conditions. To do otherwise would have compounded
5

-
the results. This made it very difficult to attain a large number ofsubjects for the study. The fact that the study was concerned with relativelylow incidence handicapping conditions meant that subjects were not generallyavailable in high numbers in integrated settings. Instead, they were dispersedthroughout broad geographical areas. Further, the availability of subjectswas affected by mainstreaming. Instead of being able to obtain large numbersof eligible subjects at institutions, it was necessary to test a small numberof subjects in many settings. These and other limiting factors limited subjectnumbers.
To the extreme satisfaction of the project staff, youngsters themselvesenjoyed being subjects in the study. Even their teachers were amazed to findthat youngsters of all groups were eager to take tests and to perform to thebest of their abilities. When this was realized, it gave an added impetus tothe investigators in regard to the importance of this study. It was clearthat youngsters, whether normal or victims of some handicapping conditions,wanted to know their abilities and wanted to know how they compared with others.They also were interested in knowing how to improve their performance.
The principal researchers of this study needed to depend heavily on othersfor data collection. The central staff at Brockport trained coordinators andfield testers in order to help collect data. More than 225 individuals, inover 150 schools and institutions, situated in 23 states plus the District ofColumbia, collected data for this study. Fortunat.ly, this study had manycontributors (they are listed in the acknowledgement section). Without thehelp of those individuals, there is no way that this study could have beencompleted. Some persons gave extraordinary assistance. These included:Claudine Sherrill, Texas Woman's University; Leslie Anido, San Jose, California;Diane Lewandowski, Chicago Public Schools; Pat Kaylor, Adelphi University;Garth Tymeson, Northern Illinois University; Marty Williams and Karen Williams,Texas Woman's University; Michael Paciorek, Eastern Michigan University; MattSullivan, St. Louis County; Sandy Day, Hawkins and Associates, Inc., Washington,D.C.; Pat Lamb, Wisconsin School for the Deaf; Janice Fruge', Louisiana Depart-ment of Education; David Grove, Fairfax (Virginia) Public Schools; Troy Haydon,Tennessee School for the Deaf; Joy Krebs, Human Resources School, Albertson,New York; and Cam Kerst, Tacoma Public Schools.
This study would not have been conducted without Melville Appell, thefirst Project Officer. Without Mel's help, this project would never havegotten off the ground. Thanks must also be extended to Dr. Julian Stein.While at AAHPERD. Dr. Stein made several contributions to the project.Dr. Stein served as a resource for the conceptualization of the project. Whenthe project was not ready for implementation, he said so loud and clear, and itwas necessary to go back to the drawing board several times. Because of hisprofessional involvement, this project is much better than it would haveotherwise been.
The most important contributions to the project were made by the centralstaff at Brockport. Specifically, thanks have to be given to graduateassistants: Sue Fetzner, 1979-80; Joseph Kelly, 1980-81; and Scott Conners,1981-82. Each of these individuals contributed much more than normallyexpected of a graduate assistant. Other graduate assistants in Special PhysicalEducation also made tremendous contributions to the success of the project.
ii
6

Barry Shultz, serving as chief statistical consultant, also was ox trewndousvalue to the project. Finally, thanks has to be given to Deborah Shuster,whose outstanding skills as a secretary were of tremendous importance inattaining positive results in the project.
There is little question that this project was a team effort, includingmany, many individuals and institutions throughout the United States. In
addition, it was a project in which individuals with handicapping conditionscontributed much. To all of these individuals and institutions, very deepappreciation is extended.
Joseph P. Winnick, Project Director
Francis X. Short, Project Coordinator

)4(
ACKNOWLEDGEMENTS
This project was conducted via a professional team effort ircluding theProject UNIQUE central staff at the State University of blew York, College atBrockport; U.S. Department of Education; the project advisory board; pro-fessional organizations; various consultants; area coordinators; local coordina-tors; and field testers. The project could not have been completed without thecooperation of many schools and agencies throughout the United States. Through-out the project, it was clear that the individuals and institutions involvedoffered their help and cooperation because it was their hope that the resultsof the project would enhance the education of sensory and orthopedically impairedyouth. To these individuals and institutions, very deep appreciation is extended.
Central Staff at the State University of New York,College at BrockRort
Project DirectorProject Coordinator:Secretary:
Graduate Assistants:
Joseph P. WinnickFrancis X. ShortDeborah S. ShusterSue Fetzner (1979-80)Joseph Kelly (1980-81)Scott Conners (1981-82)
Office of Special Education and Rehabilitative Services
Project Officers: Melville AppellJames HamiltonMax Mueller
Project UNIQUE Advisory Boa:
G. Lawrence Rarick - University of California at Berkeley (Chair)Robert Christina - Pennsylvania State UniversityJames Horgan - University of Illinois at Chicago CircleStan Labanowich - University of KentuckyHelen Jo Mitchell - Department of Recreation, Washington, D.C.Claudine Sherrill - Texas Woman's University
iv

4
Special Commendations
This project could not have been successful without the help of manydedicated persons including several who made extraordinary efforts on behalfof the project. Individuals who made extraordinary efforts include: ClaudineSherrill, Marty Williams, and Karen Williams, Texas Woman's University; LeslieAnido, San Jose, California; Diane Lewandowski, Chicago Public Schools; PatKaylor, Adeiphi University; Garth Tymeson, Northern Illinois University; MichaelPaciorek, Eastern Michigan University; Matt Sullivan, St. Louis County; SandyDay, Hawkins and Associates, Inc., Washington, D.C.; Pat Lamb, Wisconsin Schoolfor the Deaf; Janice Fruge', Louisiana State Department of Education; DavidGrove, Fairfax County (Virginia) Public Schools; Troy Hayden, Tennessee Schoolfor the Deaf; Joy Krebs, Human Resources School, Albertson, New York; andCam Kerst, Tacoma Public Schools. Melville Appell, the first project officer,and Julian Stein must also be credited with important impacts on the project.
Professional Organizations
American Alliance for Health, Physical Education, Recreation, and DancePresident's Council on Physical Fitness and SportsNational Association of Sports for Cerebral Palsy
Julian SteinJan HurwitzCraig HuberPeter MaudPaul Surburg
Project Consultants
Marti GramDavid AuxterHarold FallsRoger BunceBarry Shultz
Regional Coordinators
Robert Roice - SouthwestClaudine Sherrill - CentralFrancis X. Short - Northeast
Nancy CarrDavid PorrettaRobert CalielPatricia FryeDonald Hawkins
John Dunn- NorthwestJanice Pruge' - CentralRobert Janus - Southeast
Area Coordinators
Leslie Anido - SouthwestCam Kerst - NorthwestKaren DePauw - NorthwestJames Horgan - CentralJohn Silva - NortheastDiane Craft - Northeast
Garth Tymeson - SouthwestJames rorehouse - NorthwestLane Goodwin - CentralSandy Day - SoutheastPatricia Kaylor - Northeast
State Coordinators
Leonard Kalakian - MinnesotaErnest Lange - New Mexico
v
Andre Zawitkowski - South DakotaMichael Paciorek - Tennessee
9

City/County Coordinators
Diane Lewandowski - Chicago, IllinoisMatthew Sullivan - St. Louis County, MissouriBarbara Juliano - Houston, TexasDean Austin - Lincoln, Nebraska
Ronald FrenchScott BorisoffPaul SurburgSusan Mansfield
Carl ColganMat GuidryWendell LiemohnWalter Erring
Hezi AharoniLeslie AnidoSue ArenaJohn AtkirsonBarbara AudieMary AyoPam BachmanArnette BarnesKaren BarnesLinda BarnesVicky BasileDennis Batchalo,Mark BelzerDebra BillingsRichard BlackKathleen BloomfieldJoseph BoshardyPatricia BozzaKay BranchCheryll BransfombRene' BravoKelly BridgesSusan D. BrophyArthur T. BrownFrederick BrownKen BrownKaren BrunnerErnest Bundschuh
Local Coordinators
Warren SippErnest BundschuhMichael Horvath
Contributors
Layne C. HackettWilson BuddleBilly Ray StokesNorman Frisch
Field Testers
Becky BurchCecilia ButlowJoy CamplinJana CarlsonRobbie Jane CarmichaelVic CastilloJanis CauseyKurt ClarkMarie ColwellRosanna CopelandScott ConnersLawrence CrawfordRichard CromwellEugene DaquilaKathy DavidheiserCarole DresslerEdward DavisNathaniel DavisRichard DavisSandy DayVicki DeanJoan den BroaderJim DePaepeLinda DianaHelen DublinRick FabianiJeanne FairSue Fetzner
vi
10
Sue GrosseDavid ReamsJean Pyfer
Richard IncardonnaFrancis Filardo
Cathy FlowersPatricia A. FoltzPam CosterJames FowlkesLorna FoxworthSharon FranklinDebbie FreemanDan FreitasDavid FrierdichDon FuttenMaria GirciaRodney GerkeJohn GillenRobert GrayLois GriffinDonna GromadzkiSusan GrosseDavid GroveHarry GrovemanJoan GrunebaumMillie Leon GuerroAriane Gu3naJean GustafsonRichard HancockDennis HansonPaula HansonDiane HarrisonTroy Haydon

4,4
Marie HermanJerry N. HarmsenAnja HoekmanDonald IloltermanMichael A. HorvatEdward HuxleyGloria HutchinsNova HutchisonJeanne JacksonMark JenksGordon JewettDonn JohnsonLinda JohnstoneJi Ji JonasMike JudgeBarbara JulianoJacquie KanodeJoseph Kelly
Cam KarstEileen M. KiernanAnne KistTim KnaebleBradley KnudsonSteve KotisJoy KrebsCarolyn KruegerArthur KubicPat LambJudy LazearKim LeeNancy LefstadJane Ann LeonardDaniel LevyBarbara LinnehamBonnie MacCallumLouis M. MakoczySusan MansfieldBetty MartinezDenise MhtarkeyRobert MatthewsMargaret MauckPatricia McCreadyJohn McDonaldPatricia McHaleThomas McGeeJeffery McKeeRobert McLaughlin
Nancy MegginsonRalph MestreJoy MiguezSonya MilesPat MillerJan MilnerBlrbara McrianTracy NewloveBernadette NorrisDebra OestreicherGreg PackardMike PaciorekLaurie PatrickBeatriz PazSusan PearlBill PearsonAnn PierceMitzi PittsCarmalee PraterBarbara PrinceJanice PuderJulie RauKathy RaybornDan Remahi
Joan RichardsKarla RichardsCarolyn RobersonMatt RobertcLynn RosenthalMarc RothLyn RourkeEdward RuyackAnne M. SaetreGil SanksAlan SataloffHal Saute:Margaret SavageKathy SchaffDan SchlaferJohn SchrockStuart SchultzDoris Schwarz
Ruth SegerCarolyn SharpRabi ShatilaBob SheinerBarbara Shields-Dilly
vii
Sara ShipmanKathy SilvermanWarren SippAnn SkuldtSusan SloaneJohn SmithRichard Sifir7
Harry SnyderDave SonnichsenAl SorensonMichielle SparrowSue StoddardDebra StoneMary StyneAnna SwensonRonald SzezesniakRobert SzymanKurt SzyndowskiPam TellochCheryl Thomas
Lorna ThomasGlenn ThompsonAnne TolleGeorge Ann ToopCarol TorreyLinda TylerGarth TymesonJanet TuckerRoger Uperaft
Gary Van DorenJim Van DykeJames VarnerGail VasterlingJulie WadsworthLinda J. WarnockSandra WeeksJulie WeisBob WestermannFrank WikierakJack WiilhiteKaren WilliamsMarty WilliamsCincy WingoLeila WintonPeg WorthingtonDeborah WurdackTerry-Lynn Zieman

Testing Sites,
Californiu State School for the Deaf, Riverside, CaliforniaBlackford High School, San Jose, CaliforniaRogers Middle School, San Jose, CaliforniaChandler Tripp School, San Jose, CaliforniaMonroe Elementary School, San Jose, CaliforniaFremont School for the Deaf, Fremont, CaliforniaBernal Intermediate School, San Jose. CaliforniaWashington School, Redondo, CaliforniaKennedy High School, Fremont, California
Santa Clara County Office cf Education, San Jose, CaliforniaNorseman Elementary School, Fresno, CaliforniaIona Olson Elementary School, Marina, CaliforniaLos ()robins Junior high School, Marina, CaliforniaTokay High Schorl, Lodi, CaliforniaLodi Hign Schcol, T:Ord;.e.California
George Patton Elementary School, Fort Ord, CaliforniaMarshall Elementary School, Fort Ord, CaliforniaJ. C. Crumpton Elementary School, Marina, California
Walter Culton Junior High School, Monterey, CaliforniaMarina Del Mar Elementary School, Marina, Californiaholters Elementary School, Fresno, California
Hoover High School, Fresno, CaliforniaAiwahnee Junior high School, Fresno, California
Model Secondary School at Gallaudet College, Washington, D.C.Kendall Demonstration Elementary School for the Deaf, Washington, D.C.
Horace Mann junior High School, Miami, FloridaArcola Lake Elementary, Miami, FloridaBiscayn Gardens Elementary School, Miami, FloridaTropical Elementary School, Miami, Florida
Georgia Academ, for the Blind, Macon, Georgia
Idaho State School for the Deaf and Blind, Gooding, IdahoJenifer Junior High School, Lewiston, Idaho
Mahalia Jackson School, Chicago, IllinoisReinberg School, Chicago, IllinoisNathan Hale School, Chicago, IllinoisRay Elementary School. Chicago, IllinoisShields Elementary School, Chicago, IllinoisWhitney Young High School, Chicago, IllinoisMark Skinner School, Chicago, IllinoisLake View High School, Chicago, IllinoisFarnsworth Sch,..ol, Chicago, Illinois
Lincoln Elementary School, Chicago, IllinoisBeidler School, Chicago, IllinoisHanson Park School, Chicago, IllinoisSpalding High School, Chicago, IllinoisJames Ward Elementary School, Chicago, Illinois
viii
12

e.v;A ,
Louisiana School for the Deaf, Baton Rouge, LouisianaPatterson Junior high School, Patterson, LouisianaShannon Elementary School, Morgan City, LouisianaCrowell Elementary School, Franklin, LouisianaLouisiana School for the Visually Impaired, Baton Rouge, LouisianaValley Park Middle School, beton Rouge, LouisianaChildren's Hospital. New Orleans, LouisianaJ.V. Fairchild Junior High School, Jefferson, LouisianaNew Orleans Mental health Canter, New Orleans, LouisianaPatterson Senior high School, Patt°rson, Louisianabayou Vista Elementary School, Morgai City, LouisianaMohican School, Baton Rouge, LouisianaLouisiana Special Education Center, Alexandria, LouisianaCaddo Exceptional, Shreveport, Louisiana
St. Louis Park Public School, St. Louis Park, MinnesotaCourage Center, Golden Valley, MinnesotaMinnesota Braille and Sight Saving School, Faribault, MinnesotaComo Special School, St. Paul, Minnesota
Missouri School for the Blind, St. Louis, MissouriSpecial School District, St. Louis County, Town and Country, Missouri
Lincoln Public Schools, Lincoln, Nebraska
Gipson Junior High, Las Vers, NevadaWestern High School, Las VE,,s, Nevada
Camp Marcella, Verona, New JerseyBruce Street School, Newark, New JerseyHelen Keller School, Newark, New Jerseybranch Brook School, Ne.krk, New Jersey
New Mexico School for the Visually Impaired, Alamogordo, New Mexico
St. ary's School for the Deaf, Buffalo, New YorkRochester School for the Deaf, Rochester, New YorkNew lork State School for the Blind, Batavia, New YorkBrockport Middle School, Brockport, New YorkJefferson High School, Rochester, New YorkKendall Central Schools, Kendall, New YorkNew York State School for the Deaf, Rome, New YorkHilton Central Schools, Hilton, New YorkAlbion high School, Albion, New YorkAlbion Middle School, Albion, New YorkHuman Resources School, Albertson, New YorkNew York Institute for the Education of the Blind, Bronx, New YorkRush-Henrietta Central School District, Henrietta, New YorkSchool No. 29, Rochester, New YorkJohn H. West Elementav School, Plainedge, New YorkHerricks Middle School, New Hyde Park, New YorkAlbany Center for the Disabled, Albany, New YorkLexington School for the Deaf, Jackson Heights, New YorkSt. Joseph's School for the Deaf, Bronx, New YorkAl Sigl Center for Rehabilitative Agencies, Rochester, New YorkFairport Central School, Fairport, New York
ix

Columbus Public Schools, Columbus, OhioOhio State School for the blind, Columbus, OhioSunbeam School, Cleveland, Ohio
Parkview School for the Blind, Muskogee, OklahomaOklahoma School for the Deaf, Sulphur, Oklahoma
Overbrook School for the Blind, Philadelphia, PennsylvaniaLiberty Elementary School, Pittsburgh, PennsylvaniaBeechwood Elementary School, littsburgh, PennsylvaniaRiezenstein Middle School, Pittsburgh, 1ennsylvaniaAllegheny Valley School, Pittsburgh, PennsylvaniaPioneer Center, Pittsburgh, PennsylvaniaJohn Morrow Elementary, Pittsburgh, PennsylvaniaRegent Square Elementary School, Pittsburgh, PennsylvaniaWidener Memorial School, Philadelphia, Pennsylvania
Crippled Children's Hospital, Sioux falls, South Dakotasouth Dakota School for the Deaf, Sioux Falls, South DakotaSouth Dakota School for the Visually Handicapped, Aberdeen, South Dakota
Tennessee School for the Deaf, Knoxville, TennesseeTennessee School for the Blind, Nashville, Tennessee
Bruce Shulkey Elementary School, Fort Worth, TexasTexas School for the Deaf, Austin, TexasPreston hollow Day School, Dallas, TexasTexas School for the Blind, Austin, TexasGrady Special School, Houston, TexasDenton High School, Denton, TexasBrownsville Regional School for the Deaf, Brownsville, 'exasCongress Junior High School, Denton, TexasRogers Elementary School, Houston, TexasLockhart Elementary School, Houston, TexasMilby Senior High School, Houston, TexasEdison Junior High School, Houston, Texasbelch Middle School, Houston, Texas
Kate Bell Elemental') School, Houston, TexasHolland Middle School, Houston, TexasTijerina Elementary School, Houston, TexasAlief Yovens Elementary School, Alief, TexasDon P. Killough Middle School, Alief, Texas.Pershing Middle School, Houston, TexasElsik High School, Alief, TexasWestbury, Houston, Texas
011e Middle School, Alief, TexasA.J. Martin Elementary School, Alief, TexasCimmeron School, Galena Park, TexasLandrum Junior high School, Spring Branch, TexasSpring Branch High School, Spring Branch, TexasChancellor Elementary School, Alief, TexasSharpstown School, Houston, Texas
x

Utah School for the Deaf, Ogden, Utah
Fairfax County Public Schools, Fairfax, VirginiaVirginia School for the Deaf and Blind, Hampton, VirginiaWhite Oaks Elementary School, Burke, Virginia
Jason Lee Junior High School, Tacoma. WashingtonTruman Junior High School, Tacoma, WashingtonBirney Elementary School, Tacoma, WashingtonSeward Elementary School, Tacoma, WashingtonStadium High School, Tacoma, WashingtonSkyline Elementary School, Tacoma, WashingtonHunt Junior High School, Tacoma, Washington
21st Street Elementary School, Milwaukee, WisconsinWebster Middle School, Milwaukee, WisconsinCass Street Elementary School, Milwaukee, WisconsinMarshall High School, Milwaukee, WisconsinEmerson Elementary School, Milwaukee, WisconsinGaenslen School, Milwaukee, WisconsinManitoba, Milwaukee, WisconsinSilver Spring Elementary School, Milwaukee, WisconsinStewart Elementary School, Milwaukee, WisconsinLake Buff Elementary School, Shorewood, WisconsinUniversity of Wisconsin, La Crosse, WisconsinWisconsin School for the Deaf, Delavan, WisconsinWisconsin School for the Visually Impaired, Janesville, Wisconsin
xi
15

Table of Contents
PaPreface
Acknowledgements iv
List of Tables xvii
List of Figures xxii
CHAPTER I - INTRODUCTION
Background
PL 94-142 and the Unique Needs Concept
Focus of the Study
Objectives
Hypothesized Factor Structure of Physical Fitness
1
1
4
5
6
6
CHAPTER II - METHODS AND PROCEDURES 9
General Procedures9
Geographic Areas. . .9
Field Testers11
Subject Selection 12
Selection of Normal Subjects 12
Impaired Subject Selection 12
Subject Definitions, Categories, Codes 20
Normal (Non-Impaired) 20
Visually Impaired 20
Auditory Impaired 20
Orthopedic Impaired 21
Multiple Impairments 22
xii
16

r
...
Description of Tests and Test Procedures
Body Composition Measures
Muscular Strength/Endurance
Speed
Agility
Page
23
23
24
35
37
4
Flexibility 38
Cardiorespiratory Endurance 40
Static Balance . . 42
Participation Guides and Test Modifications . . 45
Test Modifications for the Auditory Impaired . 4'
Test Modifications for the Visually Impaired 47
Participation Guide and Test Modifications forSubjects with Amputations 50
Participation Guide and Test Modifications forSubjects with Congenital Anomalies . 61
Participation Guide and Test Modifications forSubjects with Cerebral Palsy. . 71
NASCP Classification System (1979) 73
Participation Guide and Test Modifications for Subjectswith Spinal Neuromuscular Conditions 80
NWAA Classification System . 82
Data Recording and Review . 85
Training Program for Testers .... 85
Trend Analysis and Test Reliability .. 88
Equipment 91
CHAPTER III - PHYSICAL FITNESS PERFORMANCE AND PERFORMANCE FACTORS . . . 92
Introduction . 92
Means and Standard Deviations of Project UNIQUE PhysicalFitness Test Items .. 93
17

LIM
Physical Fitness Test Performance as a Function ofCondition, Sex, and Age 132
Comparisons of Normal, Auditory Impaired, and VisuallyImpaired Groups/Conditions 132
Normal and Cerebral Palsy Comparisons 144
Normal and Spinal Neuromuscular Comparisons 153
Physical Fitness Test Performance as a Function of Severityand Onset of Handicapping Condition and Methods ofAmbulation 159
Auditory Impaired 159
Visually Impaired 161
Cerebral Palsy .... 164
Spinal Neuromuscular 167
Physical Fitness Test Performance as a Function of CommunitySize and Educational Environment 168
Normal 168
Auditory 171
Visual 173
Cerebral Palsy 174
Spinal Neuromuscular 177
Additional Descriptive Statistics 178
Magnitude of Differences of Individuals with HandicappingConditions and Normal Subjects Expressed in StandardDeviation Units .. 178
Variability and the Performance of Test Items 181
Percent of Subjects with Handicapping Conditions ScoringHigher than Median Values of Normal Subjects 182
CHAPTER IV - FACTOR STRUCTURE OF THE NORMAL AND IMPAIREDSUBJGCT GROUPS 188
Factor Analytic Procedures 188
Results of the Factor Analyses 190
xiv
18

Page
Factor Structure of the Normal Girls 191
Factor Structure of the Normal Boys 193
Factor Structure of the Auditory Impaired Girls 196
Factor Structure of the Auditory Impaired Boys 199
Factor Structure of the Visually Impaired Girls 201
Factor Structure of the Visually Impaired Boys 203
Factor Structure of the Cerebral Palsied Girls 206
Factor Structure of the Cerebral Palsied Boys 208
Factor Structure of the Paraplegic Wheelchair SpinalNeuromuscular Participants 210
Summary 212
CHAPTER V - SYNTHESIS, SUMMARY, AND IMPLICATIONS 214
Introduction 214
A Comparison of the Physical Fitness of Normal, Orthopedically,and Sensory Impaired Boys and Girls 214
Physical Fitness Performance and Handicapping Condition 214
Physical Fitness Test Performance as a Function ofSeverity of Handicapping Condition 217
Physical Fitness Test Performance as a Function ofOnset of Handicapping Condition ... 218
Performance of Run Items as a Function ofMethod of Ambulation 218
Age Trends and Physical Fitness Performance .. 219
Sex Trends and Physical Fitness 221
Physical Fitness Performance as a Function of Community Size,Geographical Location, Educational Environment, andPhysical Fitness Experiences 222
Community Size 222
Geographical Location 223
Educational Environment 223
xv 19

r
Page
Factor Structure of Physical Fitness 225
Physical Fitness Performance as a Function ofPhysical Education Experiences 226
Physical Fitness Test 229
Criteria for the Selection of Test Items
Physical Fitness Test Items
Reliability of Test Items
Validity
Intercorrelations
Curricular Implications
Commonality of Factor Structure
Levels of Physical Fitness
Influence of Handicapping Conditions and Severityof Handicapping Conditions
Age as a Factor in Performance
Sex Difference and Performance
Physical Fitness and Educational Setting
Individualization
Recognition of Physical Fitness as an
Educational Responsibility
Need for Training Materials
229
230
231
245
2S0
255
255
255
255
2S6
2S7
257
257
258
2S9
BIBLIOGRAPHY 260
APPENDICES
APPENDIX A - Condition Codes
APPENDIX B - The Project UNIQUE Physical Fitness Test (under separate cover)
APPENDIX C - The Project UNIQUE Physical Fitness Training Programfor Normal, Sensory Impaired, and OrthopedicallyImpaired Youth (under separate cover)
xvi
20

List of Tables
Page.
Table 2.1 Number of Subjects Categorized by GeographicLocation, Handicapping Condition, and Sex 12
Table 2.2 Normal Subjects Categorized by Sex, Age, andCommunity Size . 13
Table 2.3 Visually Impaired Subjects Categorized by Conditionand Educational Environment 14
Table 2.4 Auditory Impaired Subjects Categorized by Conditionand Educational Environment 15
Table 2.5 Cerebral Palsy Subjects Categorized by Conditionand Educational Environment 16
Table 2.6 Spinal Neuromuscular Subjects Categorized byCondition and Educational Environment 17
Table 2.7 Anomaly/Amputee Subjects Categorized by Condition
and Educational Environment 18
Table 2.8 Number of Subjects Categorized by Condition, Sex,and Age 19
Table 2.9 Participation Guide for Normal, Auditory, andVisually Impaired Subjects 46
Table 2.10 Participation Guide for Subjects with Amputations 51
Table 2.11 Participation Guide for Subjects with CongenitalAnomalies . 62
Table 2.12 Participation Guide for Subjects with Cerebral Palsy . . . 72
Table 2.13 NASCP Classification System (1979) 73
Table 2.14 Participation Guide for Subjects with SpinalNeuromuscular Conditions 81
Table 2.15 NWAA Classification System . 82
Table 2.16 Means, Standard Errors of Measurement, and AlphaCoefficients of Project UNIQUE Reliability Samples . . . . 89
Table 2.17 Means and Alpha'Coefficients of Grip Strength Testswith Significant Trend Categorized by MeasurementSchedule 90
Table 3.1 Mevs and Standard Deviations of Project UNIQUE TestItems Obtained on Normal Individuals 91

Table 3.2 Means and Standard Deviations of Project UNIQUE TestItems Obtained on Subjects with Auditcry Impairments . . . 100
Table 3.3 Means and Standard Deviations of Project UNIQUE TestItems Obtained on Subjects with Visual Impairments . . . . 106
Table 3.4 The Performance of Subjects %ith Visual Impairments on
Running Events Categorized by Sex and Method ofAmputation 112
Table 3.5 Means and Standard Deviations of Project UNIQUE TestItems Obtained ca Individuals with Amputations andCongenital Anomalies 114
Table 3.6 Means and Standard Deviations of Project UNIQUE TestItems Obtained on Individuals with Cerebral Palsy . . . . 120
Table 3.7 Performance of Subjects with Cerebral Palsy on RunningEvents Categorized by Sex and Method of Ambulation . . . . 126
Table 3.8 Means and Standard Deviations of Project UNIQUE TestItems Obtained on Individuals with Spinal NeuromuscularImpairments 127
Table 3.9 Means and Standard Deviations of Project UNIQUE TestItems Obtained by Subjects Classified as SpinalNeuromuscular-Paraplegic 131
Table 3.10 Univariate F Values for Normal, Auditory Impaired, andVisually Impaired Subjects by Sex, Age, r oi Condition . . .133
Table 3.11 Univariate F Values for Normal and Cerebral PalsiedSubjects by Sex, Age, and Condition 145
Table 3.12 Univariate F Values for Cerebral Palsied Subjects by
Sex and Ago 152
Table 3.13 Univariate F Values for Normal and Spinal NeuromuscularSubjects by Sex, Age, and Condition 154
Table 3.14 Univariate F Values for Normal al.d Spinal NeuromuscularSubjects by Sex, Age, and Condition 158
Table 3.15 Univariate F Values for Hard of hearing and Deaf Subjectsby Sex, Age and Condition 160
Table 3.16 Number of Visually Impaired Subjects Categorized byCondition, Sex, and Age 161
Table 3.17 Univariate F Values for Partially Sighted and BlindSubjects by Sex, Age, and Condition 162
xviii
22

LolTable 3.18 Analysis of Running Methods for Visually Impaired
Subjects 163
Table 3.19 Analysis of Cerebral Palsy Running Methods 165
Table 3.20 Analysis of the Performance of Subgroups of CerebralPalsied Subjects 166
Table 3.21 Number of Normal Subjects Categorized by Sex andCommunity Size 168
Table 3.22 Means and Univariate F Values Adjusted for Age forNormal Subjects by Sex and Community Size 169
Table 3.23 Number of Auditory Impaired Subjects Categorize bySex and Educational Environment 171
Table 3.24 Means and Univariate F Values Adjusted for Age forAuditory Impaired Subjects by Sex and EducationalEnvironment 172
Table 3.2S Number of Visually Impaired Subjects Categorized bySex and Educational Environment 174
Table 3.26 Means and Univariate E Values Adjusted for Age forVisually Impaired Subjects by Sex and EducationalEnvironment 175
Table 3.27 Means and Univariate E Values Adjusted for Age forCerebral Palsied Subjects by Sex and EducationalEnvironment 176
Table 3.28 Number of Cerebral Palsied Subjects Categorized bySex and Educational Environment 177
Table 3.29 Number of Spinal Neuromuscular Subjects Categorizedby Sex and Educational Environment 177
Table 3.30 Magnitude of Differences Expressed in S.D. Scale UnitsBetween Subjects with Impairments and Normal Subjectson Project UNIQUE Test Items 179
Table 3.31 Coefficients of Variation of Test Items 183
Table 3.32 Median Values for Normal Subjects on Test Items 184
Table 3.33 Percent of Impaired Subjects Categorized by Sexwith Scores High r than Median Values of Normal Subjects. 185
Table 4.1 Test Scores Included in Factor Analysis Categorizedby Group 189
xix
23

PeTable 4.2 Number of Subjects in the Factor Analysis Categorized
by Group and Sex 189
'Table 4.3 Factor Structure of Physical Fitness Test Items(Raw Score Matrix) for Normal Girls 151
Table 4.4 Factor Structure of Physical Fitness Test Items(Residual Matrix) for Normal Girls 192
Table 4.5 Factor Structure of Physical Fitness Test Items(Raw Score Matrix) for Normal Boys 194
Table 4.6 Factor Structure of Physical Fitness Test Items(Residual Matrix) for Normal Boys 195
Table 4.7 Factor Structure of Physical Fitness Test Items(Raw Score Matrix) for Auditory Impaired Girls 197
Table 4.8 Factor Structure of Physical Fitness Test Items(Residual Matrix) for Auditory Impaired Girls . 198
Table 4.9 Factor Structure of Physical Fitness Test Items(Raw Score Matrix) for Auditory Impaired Boys 199
Table 4.10 Factor Structure of Physical Fitness Test Items(Residual Matrix) for Auditory Impaired Boys . 200
Table 4.11 Factor Structure for Physical Fitness Test Items (RawScore Matrix) for Visually Impaired Girls 201
Table 4.12 Factor Structure of Physical Fitness Test Items(Residual Matrix)for Visually Impaired Girls 202
Table 4.13 Factor Structure of Physical Fitness Test Items (RawScore Matrix) for Visuall%, Impaired Boys 204
Table 4.14 Factor Structure of Physical Fitness Test Items(Residual Matrix) for Visually Impaired Boys 2C5
Table 4.15 Factor Structure of Physical Fitness Test Items (RawScore Matrix) for Cerebral Palsied Girls 206
Table 4.16 Factor Structure of Physical Fitness Test Items(Residual Matrix) for Cerebral Palsied Girls 207
Table 4.17 Factor Structure of Physical Fitness Test Items (RawScore Matrix) for Cerebral Palsied Boys 209
Table 4.18 Factor Structure of Physical Fitness Test Items(Residual Matrix) for Cerebral Palsied Boys 209
xx
24

Page
_Table 4.19 Factor Structure of Physical Fitness Test Items (RawScor-it for Parap 1 egNeuromuscular Participants 210
Table 4.20 Factor Structure of Physical Fitness Test Items
(Residual Matrix) for Paraplegic Wheelchair SpinalNeuromuscular Participants 211
Table 5.1 Survey Results Pertaining to Physical EducationExperiences 227
Table 5.2 Project UNIQUE Physical Fitness Test for Normal,Sensory Impaired, and Orthopedically Impaired Childrenand Youth: Components and Test Items 232
Table S.3 Project UNIQUE Physical Fitness Tes. Items X MajorSubject Groups 23S
'Table S.4 Reliability Coefficients of Project UNIQUE PhysicalFitness Test Items 237
Table S.S Principal Component Factor Loadings (OrthogonalSolutions) on Project UNIQUE Physical Fitness TestItems 746
Table S.6 Factor Labels by Groups 248
Table 5.7 Intercorrelations of Test Items by Major SubjectGroups 252
xxi
25

List of Figures
Page
Figure 2.1 Project UNIQUE Geographical Coverage 10
Figure 2.2 Anthropometric Measures 25
Figure 2.3 Flexed Knee Sit-Ups 27
Figure 2.4 Timed Leg Raise 27
Figure 2.S Timed Trunk Raise 29
Figure 2.6 Right and Left Grip Strength 31
Figure 2.7 Flexed Arm Hang 31
Figure 2.J Pull-Up 32
Figure 2.9 Standing Broad dump 34
Figure 2.10 Softball Throw 34
Figure 2.11 50-Yard/Meter Dash 36
Figure 2.12 Shuttle Run 39
Figure 2.13 Sit and Reach Apparatus Construction Procedures . . . 39
Figure 2.14 Sit and Reach Test 41
Figure 2.15 Modified Stork Test 44
Figure 2.16 Modified Shuttle Run S8
Figure 3.1 Significant Sex by Age Interactions (Means Plottedwith 994 Confidence Intervals) for Normal, AuditoryImpaired, and Visually Impaired Subjects 134
Figure 3.2 Significant Sex by Condition Interactions (MeansPlotted with 99% Confidence Intervals) ior Normal,Auditory Impaired, and Visually Impaired Subjects . . . 136
Figure 3.3 Significant Age by Condition Interactions (MeansPlotted with 99% Confidence Intervals) for Normal,Auditory impaired, and Visually Impaired Subjects . . . 137
Figure 3.4 Significant sex by Age by Condition Interactions(Means Plotted with 994 Confidence Intervals) forNormal, AuditJry Impaired, and Visually ImpairedSubjects 138

6
Objectives
More specifically, the objectives of this study were:
1. To provide descriptive data of the physical performance of orthopedicallyand sensory impaired boys and girls between the ages of 10 and 17.
2. To compare the physical fitness of orthopedically and sensory impairedsamples with each other and with normal boys and girls of the same sexand age.
3. To identify, analyze, and compare age trends of the physical developmentof normal, orthopedically, and sensory impaired boys and girls.
4. To analyze the effects of onset of handicapping conditions, physical
education experiences, Aotivity history, and geographic influences on thephysical fitness of c ipedically and sensory impaired boys and girls.
S. To determine sex influences on the physical fitness of orthopedically andsensory impaired boys and girls.
6. To determine the factor structure of physical ,abilities of orthopedicallyand sensory impaired boys and girls and to compare the factor structurewith normal populations and with each other.
7. To identify curricular implications pertaining to physical fitness onthe basis of measured physical fitness abilities of orthopedically andsensory impaired boys and girls.
8. To develop valid and reliable tests of physical fitness for the ortho-pedic and sensory impaired on the basis of data collected.
Hypothesized Factor Structure of Physical Fitness
The theoretical frame of reference for this study emerges from aparticular conception of physical fitness which is supported by relatedfactor analytic studies, tba conceptions reflected in currently used field-based tests of physical fitness, and logical considerations.
For the purposes of this project, physical fitness vas recognized as apart of the total fitness of the individual. Total fitness includes mentaldevelopment, emotional development, social development, motor development, andphysical development appropriate to the maturity of the individual. It also
assumed that physical fitness implies freedom from disease, the ability to meetthe physical requirements of daily tasks without undue fatigue, and the abilityto withstand ordinary stresses of life without harmful strain. This concept
of physical fitness enables the individual to carry out the requirements ofdaily living, to enjoy leisure time pursuits, and to meet unforeseen emergencies.
In agreement with previous work which has been done in relationship tophysical fitness in field situations, this study recognized physical fitnessas a multidimensional construct. This means that physical fitness was notconsidered as a generic concept, but was considered as an umbrella term for a
33
CHAPTER I
INTRODUCTION
Background
The positive value of physical fitness is widely accepted in the UnitedStates today. Physical fitness is important for enhancing the quality andlength of life and is important in the play and development of children andyouth.
Although physical fitness is important for all persons, it is particularlyimportant for children and youth with sensory or orthopedic impairments. Inregard to persons with visual impairments, the importance of physical activityhas been recognized for many years. rhysical activity has been advocated forpersons with visual handicaps, particularly in residential school programsthroughout the country for over a century. Educators of the blind have longfelt that the blind need greater than average stamina if they are to effectivelycone in society. Physical fitness is important for persons with visualimpairments so that they may move effectively through the environment.
because of communicative difficulties and accompanying tendency to withdraw,it is not uncommon for the physical fitness status of persons with auditoryimpairments to be below normal. Since this is the case, it is important toarrange and carefully plan physical development for these persons. When thisis done, there is no reason why an individual with an auditory handicap cannotbe as successful as non-impaired persons in physical development.
For the orthopedic impaired, the values of physical fitness are profound.Individuals with congenital anomalies or amputations must not only developnon-impaired body parts, but also must seek to develop, to the optimal level,affected parts of the body. Individuals with spinal neuromuscular conditionsneed to maintain and develop their physical fitness to engage in physicalactivity pursuits and develop and maintain a healthy body. All persons withorthopedic impairments desperately require activities to overcome atrophy,contractures, and possible deformities. They may, in fact, need higher levelsof fitness for compensatory behaviors, i.e., to facilitate ambulation. There-fore, physical fitness is often a primary concern in their educational program.Although physical fitness is important for these individuals for health andphysical performance, it is also important for social and emotional development.Where necessary physical fitness levels are attained, these individuals arelikely to participate in play and sport activities and receive the samephysical and social benefits from these activities as non-impaired childrenand youth.
Although it is clear that physical fitness is at least as, if not more,important to the sensory and orthopedic impaired as the non-impaired, lessattention has been given to fitness related programs for these individuals.In some situations, they are absolutely neglected in instructional physicaleducation programs, trramurals, and athletic programs. According to law,the handicapped have an equal opportunity to attain the same benefits fromthese programs as normal individuals. With the passage of PL 94-142 and
Sectio 504 of the Rehabilitation Act of 1973, an impetus for change has beenprovided. However, legislation is not enough.
A:tf1 rt
.1

If the sensory and orthopedic impaired are to develop the physicalfitness necessary to pursue careers, participate in intramural and athleticactivities, or to enjoy the quality of life to which they are entitled, theyneed quality individualized education programs. To effectively implementquality programs for these individuals, teachers and program leaders musthave knowledge and skills to assess performance, determine unique needs, setobjectives and goals to improve performance, and implement and evaluatequality programs. Information is needed about the physical fitness abilitiesof these groups. There is a need to know what abilities may be improved,their rate and sequence of development, how they may be improved, how they maybe measured, and the factors which affect performance. Valid and reliableinstruments to measure the components of physical fitness, which are relevantand appropriate for these groups, must be developed and used. Teachers andprogram leaders must recognize differences, the implications that differencessuggest in implementing programs, and the need to make allowances for individualswho may be different.
A review of research indicates that very little normative data is availablein regard to the physical performance of the visually impaired. Buell (1966,1973) developed physical fitness tests designed for individuals with visualhandicaps by adapting the AAHPER, Youth Fitness Test, the AAU Physical FitnessTest, and the California Minimal Performance Test. Subsequently, Buelldeveloped adjusted norms for blind and partially sighted boys and girls on the50-yard dash, the 600-yard run/walk, and proposed substitutions for some ofthe other items on these particular tests. In his doctoral dissertation,Buell (1950) developed standards of achievement for children and youth withvisual handicaps in selected areas of athletic performance.
Although there is a paucity of research in which the performance ofyoungsters witn visual handicaps is compared with normally sighted youngsters,it has been generally found, and tnere is an agreement amongst writers, thatchildren ancilyputh with visuallyihandicapping conditions are poorer in physicalfitness measures than their normally sighted peers, the scores of partiallysighted youngsters exceed those of totally blind youngsters, and the performanceof visually impaired boys exceeds that of visually impaired girls (Buell, 1966,1973; Wianick, 1979). According to descriptive data, visually handicappedgirls improve in physical proficiency between the ages of six and 13 or 14,but appear to plateau between the ages of 13 or 14 and 17 (Winnick, 1979).Based on data collected by Buell (1966, 1973), visually handicapped boys, onthe other hand, show consistent improvement in performance between the ages ofsix and 17 (Winnick, 1979).
Available research also indicates that the performance of youngsters withvisual handicapping; conditions is affected by physical education experiences andopportunities for movement. Buell (1950b) found that motor performance ofyoungsters with visual handicapping conditions was affected by the physicaleducation they received in school and elsewhere. The importance of opportunityfor movement or nobility for motoric development was supported by a study byNorris, Spalding, and Brodie (1957).
In regard to the onset and duration of blindness, Buell (1950a, 1950b)reported that children who lose their vision after six years of age do not haveas much difficulty in developing physical abilities as do children blind from
29-

4-6
early childhood. He found that recently blinded girls performed better inrunning, throwing, and jumping than thos fflicted earlier, and that boyslosing their vision after six years of age itfew a basketball farther thanthe blind who had never seen a throw.
3
On the basis of his review of the research, Winnick (1979) found that therelative performance of youngsters with visual handicapping conditions, inmeasures of physical proficiency; varies with the type of activity performed.He noted that blind youngsters have particular difficulty in activities which
involve throwing, since they have not seen the activity performed correctly.It follows that differences on throw-type fitness items may be due more tocoordination and learning than to real differences in physical fitness.Winnick (1979) also points out that high scores in activities involving runningAre particularly difficult to attain by blind youngsters because performanceis restricted by the need to maintain contact with guide wires, performingwith a partner, or being guided by auditory or tactual cues. The blind comenearer to the performance of the normally sighted in uncomplicated activitiesperformed in place, such as the flexed arm hang, sit-ups, pull-ups, and theStanding broad jump (Winnick, 1979). When youngsters with visual handicappingconditions perform below normal standards in these events, real differences inphysical fitness are more likely to exist, and these differences are invariablyinfluenced by participation in physical activity (Winnick, 1979).
Although the physical and motor performance of the normally sighted exceedsthat of youngsters impaired visually, comparisons reveal that differencesbP1-ween these groups decrease with increases in age. For example, differencesin broad jumping, running speed, and long distance running at ages six toseven decreases as youngsters approach and attain age 17 (Winnick, 1979). In
fact, Buell (1950a) found that high school boys with visual impairments exceededmean scores of normally sighted high school boys in the standing broad jump.He attributed this result to greater familiarity and practice of the task byyoungsters with visual impairments.
In regard to the deaf, the ability to balance has received the most atten-tion of researchers studying their physical and motor status. In one of theearliest studies evaluating the motor abilities of deaf children, Long (1932)found that the performance of hearing subjects in walking a balance beam wassignificantly superior to that of deaf subjects aged eight to 17 with whomthey were paired. In another study, Morsh (1936) found that, when blindfolded,deaf subjects showed inferior balancing performance to that of blindfoldedhearing subjects. In a more comprehensive study, Myklebust (1964) tested andcompared the performance of deaf and hearing subjects on the railwalking testand again found that deaf children were inferior to the hearing. In addition,the deaf were found to progress in ability with age, but the hearing maintainedtheir superiority throughout the age ranges studied. In the same study,Myklebust studied railwalking performance as a function of etiology and foundno significant differences between the acquired, congenital, and undeterminedgroups. However, the meningetic were significantly inferior to each of theother three groups. Myklebust found that the poor performance by the groupwith meningitis could be explained by the malfunctioning of semicircularcanals--a condition frequently associated with this disease. On the basis ofresearch which has been completed, it appears fair to conclude that the deaf,as a group, are inferior to the hearing on static and dynamic balance, particularly
30

ar
in areas where semicircular canal dysfunction exists. However, implicationsshould be drawn with extreme caution since there is much clinical evidenceindicating that the deaf can achieve high degrees of performance in balance-oriented activities and, in many cases, balance has not been found to be aninhibiting factor in performance.
_
As is true with other physical and motor areas, relatively little research_ -1
has been completed relative to motor maturation or the development of locomotorabilities of the deaf. Nyklebust (1954) conducted a study in which the sitting,and walking ages for normalt aphasic, emotionally disturbed, mentally retarded,and deaf subjects were compared. Differences between the deaf and hearing ,
were not significant. Frisina (19SS) found that mentally retarded deaf childrenwere significantly inferior to normal deaf children in age of sitting and walking...In view of these findings, it may be necessary that mental age be controlledwhen between group comparisons of motor maturation are made.
Winnick (1979) states that clinical data and other observations of theperformance of the deaf have lead professionals to attribute other physiealand motor characteristics to the deaf. Some writers have indicated that thedeaf are underdeveloped physically because of their tendency to withdrawfrom play activities and games and sports requiring communication. Nyklebust(1964) stated that persons with severe hearing losses tend to walk with ashuffling gait. Since this characteristic is not limited to those with semi-circular dysfunctioning, Nyklebust assumes it is due to the inability of thedeaf to hear movement sounds, i.e., their feet shuffling as they walk. Arnheim,Auxtcr, and Crowe (1969) stated that deaf children have poor body mechanicsand poor patterns of locomotion. Fait (1972) assets that movement of the deafmay be poorly coordinated, purposeless, vague, and distorted because of theloss of background sounds for orientation and a..curacy in the recognition ofspace and motion.
Although some studies have been conducted to determine the effects ofphysical training on the physical fitness factors of certain types of individualswith orthopedic impairments, little or no information is available in regardto the quantitative physical fitness abilities of orthopedically impairedchildren and youth. Also, tests to measure factors related to physical fitnessdevelopment have been notably absent. Typically, physical performance hasbeen assessed using qualitatively oriented assessment devices which have beendeveloped by physical or occupational therapists. Although Vodola (1978) hasdeveloped a four-item physical fitness test which may be used with ambulatoryretarded children, no norms were given for ambulatory retarded children inconjunction with the test. The fact that little research has been conductedis not entirely by accident or total neglect. The nature of various orthopedicconditions, the limitations placed on individuals, the wide variation inabilities, the complexities involved in conducting such research, concernsabout the worthiness of quantitatively derived instruments, and philosophicalbeliefs about treatment and development have influenced the pursuit of researchin this area.
PI. 94-142 and the Unique Needs Concept
According to PI. 94-142, all handicapped children must be provided a free,appropriate public education which emphasizes special education and related
31
1

services to meet their unique needs. The law defines the term special educa-tion as specially designed instruction, at no cost to parents or guardians, tomeet the unique needs of the handicapped child, and includes classroominstruction, instruction in physical education, home instruction, and instructionin hospitals and institutions.
The law clearly states that physical education must be provided to meetthe unique (as opposed to identical or same) needs of the handicapped. Butwhat are needs? What constitutes a unique need?
It seems logical that to determine a unique need, one must select a pointof reference. Just as speed of movement becomes meaningful when it is basedon simultaneity and visual defects when related to normal vision, uniquephysical needs of individuals with handicapping conditions must be based upona standard of reference. This reference may include the performance of non-impaired children and youth of the same sex, age, or grade level; the performanceof other children and youth with the same age, sex, and disability; or one'sown performance in various points in time. In certain instances, all of thesereferences may be used in the identification of a unique need.
There is a need in the field for baseline data which can be utilized byprofessionals to determine unique needs and to plan and implement qualityprograms for the sensory and orthopedic impaired. Where possible, it is helpfulto utilize quantifiable data so that the reference point is objective andclear, appropriate objectives can be clearly set, programs may be planned, andprogress can be measured.
Focus of the Study
It should be clear, on the basis of the information which has been presented,that there is a need to increase knowledge concerning the physical fitnessabilities of sensory and orthopedically impaired children and youth. Ultimately,
this information is necessary so that program leaders may assess, compare, andimprove performance. The intention of this study was to provide basic datawhich may be utilized by professionals to determine the unique needs of sensoryand orthopedically impaired youngsters and to provide further informationconcerning factors which may influence the development of the physical fitnessof these populations. Data generated from this study will provide basicinformation to compare individuals at various ages, data which may be used tocompare the performance of impaired with normal populations, and data whichwill enable intra - individual comparisons. The study provides data relativeto the factor structure of physical abilities of the sensory and orthopedicimpaired, baseline data which might be used to identify curricular emphaseswith these populations, data which will provide age and sex comparisons, datawhich will serve as a basis for studying the relationship between onset ofconditions and physical performance, and data which will contribute to anunderstanding of degree of handicapping conditions and performance. Finally,from the results of study, a valid and reliable test of physical fitness forimpaired groups under consideration was developed and, hopefully, will be usedto assess present levels of performance, compare performance, and identifyunique needs. The study was delimited to include orthopedic and sensoryimpaired youngsters between the ages of 10 and 17.
$32
.;4
Yj

.a.e/f,t
v44 4 , .t A.
Objectives
t ^
More specifically, the objectives of this study were:
1. To provide descriptive data of the physical performance of orthopedicallyand sensory impaired boys and girls between the ages of 10 and 17.
2. To compare the physical fitness of orthopedically and sensory impairedsamples with each other and with normal boys and girls of the same sexand age.
3. To identify, analyze, and compare age trends of the physical developmentof normal, orthopedically, and sensory impaired boys and girls.
4. To analyze the effects of onset of handicapping conditions, physical
education experiences, activity history, and geographic influences on thephysical fitness of C-F ..pedically and'sensory impaired boys and girls.
T6 determine sex influences on the physical fitness of orthopedically andsensory impaired boys and girls.
6. To determine the factor structure. of physical abilities of orthopedicallyand sensory impaired boys and girls and to compare the factor structurewith normal populations and with each other.
7. To identify curricular implications pertaining to physical fitness onthe basis of measured physical fitness abilities of orthopedically andsensory impaired boys and girls.
8. To develop valid and reliable tests of physical fitness for the ortho-pedic and sensory impaired on the basis of data collected.
Hypothesized Factor Structure of Physical Fitness
The theoretical frame of reference for this study emerges from aparticular conception of physical fitness which is supported by relatedfactor analytic studies, the conceptions reflected in currently used field-based tests of physical fitness, and logical considerations.
6
For the purposes of this project, physical fitness was recognized as apart of the total fitness of the individual. Total fitness includes mentaldevelopment, emotional development, social development, motor development,, andphysical development appropriate to the maturity of the individual. It alsoassumed that physical fitness implies freedom from disease, the ability to meetthe physical requirements of daily tasks without undue fatigue, and the abilityto withstand ordinary stresses of life without harmful strain. This concept
of physical fitness enables the individual to carry out the requirements ofdaily living, to enjoy leisure time pursuits, and to,meet unforeseen emergencies.
In agreement with previous work which has been done in relationship tophysical fitness in field situations, this study recognized physical fitnessas a multidimensional construct. This means that physical fitness was notconsidered as a generic concept, but was considered as an umbrella term for a
.33.

7
series of specific components. Thus, physical fitness was conceived of beingincapable of being represented by a single measure, but consists of a seriesof specific abilities which, although related, to some extent, are discreteenough to warrant separate measurement.
This concept of physical fitness recognizes fitness as involving both ahealth related and a physical performance related component. It recognizesthe importance of physical fitness for the optimum health of the individualand the physical fitness necessary to optimally perform tasks of daily livingand physical and sport activities. In agreement with the AANPERD HealthRelated Physical Fitness Test (1980), this concept of poysical fitness recognizescardiorespiratory function, body composition (leanness/fatness), and abdominaland low back-hamstring musculoskeletal function as areas of physiologicalfunction which are related to positive health. This concept of fitness isalso in agreement with physical fitness tests which are used to measure thephysiological functional abilities which are necessary to perform tasks ofdaily living, certain occupational activities, and particularly, sportactivities (performance related physical fitness). The AAHPER Youth FitnessTest (1976) was used as a reference point in selecting performance relatedcomponents of fitness. Test modifications developed by Buell (1966, 1973) wereconsidered in terms of components, test items, and modifications of test itemswhich may be appropriate for visually impaired children and youth. Particularattention was given to these sources because it was assumed that the factorstructure for the groups under study herein would be similar, if not the same,as those of normal and visually impaired populations. If this assumption wasfound to be correct, it would enhance comparative evaluations. These testswere developed with the assumption that components including muscular strength/endurance, speed, agility, cardiorespirat "ry function, body composition, andflexibility are components of physical fitness which influence performance.
The theo'retical framework for this study was influenced by the results ofrelated factor analytic studies of physical fitness using normal subjects(Fleishman, 1964a, 1964b), normal and educable mentally retarded (EMR) subjects(Rarick and Dobbins, 1972), and normal and trainable mentally retarded (TMR)subjects (Rarick and McQuillan, 1977). These studies were analyzed to helpdetermine the hypothesized factor structure and test items to measure factorsor components of physical fitness.
In s!'ecting components for study, one additional factor was considered.Since it was felt that balance may be a factor in influencing participationin physical activities, particularly for the physically 1'tndicapped and possiblythe auditory impaired, it was decided to administer a teat of static balancein the study. However, it should be stressed that this was not conceived asa physical fitness component., but as a factor which might influence participationin physical fitness and, thereby, influence physical fitness status.
In essence, then, the theoretical frame of reference for this study wasbased on the belief that there are certain relatively well defined componentsof physical fitness which are needed for the purposes of developing optimalhealth and enhancing performance in daily activities, occupational activities,and sport performance. It was hypothesized that the basic components underlyinghealth and performance related physical fitness should include muscular strength/endurance, cardiorespiratory endurance, a desirable level of fatness/leanness,
34
I
rg
4

flexibility in certain areas of the body, speed of movement, and the abilityto change directions (agility). The components of fitness, as well as thetest items which were used in this study to measure the components, are listedbelow. It was believed that these components enhance the domain of physicalfitness, as conceptualized in this study, and serve as a logical foundationfor identifying the physical fitness components of normal, sensory impaired,and orthopedically impaired children and youth and for attaining the otherobjectives of the study.
1. Body Composition
triceps skinfoldsubscapular skinfoldabdominal skinfold
2. Muscular Strength/Endurance
flexed knee sit-upstimed leg raisetimed trunk raisegrip strengthflexed arm hangpull-upsstanGing broad jumpsof0all throw (distance and/or velocity)
3. Speed
50-yard dash50-meter dash
4. Agility
rise-to-standmat creepshuttle run
5. Flexibility
sit and reach
6. Cardiorespiratory Endurance
Ages 10-12: 1 mile or 9-minute runAges 13-17: 111 mile or 12-minute run
In addition to the hypothesized factor structure of physical fitness,a test item measuring static balance was incorporated in the study.
35
8

O
CHAPTER II
METHODS AND PROCEDURES
General Procedures
In this section, a brief overview of the procedures that were followedin this study is presented. The first step was the formulation of a hypo-thesized factor structure which embraced health and performance dimensions ofphysiCal fitness of normal and impaired children and youth between the agesOf 10 and 17: The second step was to identify, define, and classify subjectgroups in a way which would be relevant to physical fitness performance. Thethird step was to select tests which would' measure the various hypothesizedfactors Of physical fitness and to modify these for individuals with handi-Capping,conditions, as appropriate. The fourth step was to analyze items inlet* of subject classifications to determine whether or not test items couldladliniitered to a particular subgroup. In cases where subjects could totappropriately take a test, the items were eliminated for that particularidbjeCt.grOUp. Participation guides, matching test items and subject classifi-datiOniOiere developed so that testers would know which items should beadministered or modified for a particular group or subgroup. Thelifth stepWas to develop a testing network which could be employed for the testing ofsubjects throughout the United States. Once the network was established, thenext step was to train personnel to administer tests, select subjects, recorddata, and transmit data to the SUNY, College at Brockport for analysis. Oncethe testing personnel were trained and certified to collect data, subjects wereselected following standardized procedures and tests were administered.Following test administration, data were transferred from field data recordingsheets to computerized scan sheets. After data were recorded on these forms,it was checked by the central staff of Project UNIQUE. The data, then, wereanalyzed by the project staff, and a final report, including a physical fitnesstest and a training program, was developed.
The time duration of the investigation was from June 1, 1979 toAugust 31, 1982. The actual collection of data extended from March 1980 toMarch 1982.
Geographical Areas
Subjects were selected from institutionalized and non-institutionalizedsettings located throughout five geographical areas of the United States,including the northeast, southeast, central, northwest, and southwest regionsof the country (see Figure 2.1). Each of these regions included one or morecoordinators who organized and administered training and testing in theirgeographical areas. Coordinators located testers in their region, conductedtraining programs, certified testers, recommended participating school districtsand subjects for the study, coordinated testing schedules, and dispersedequipment, as needed. The states and territories encompassed within regionsis presented below.
t,
9
36
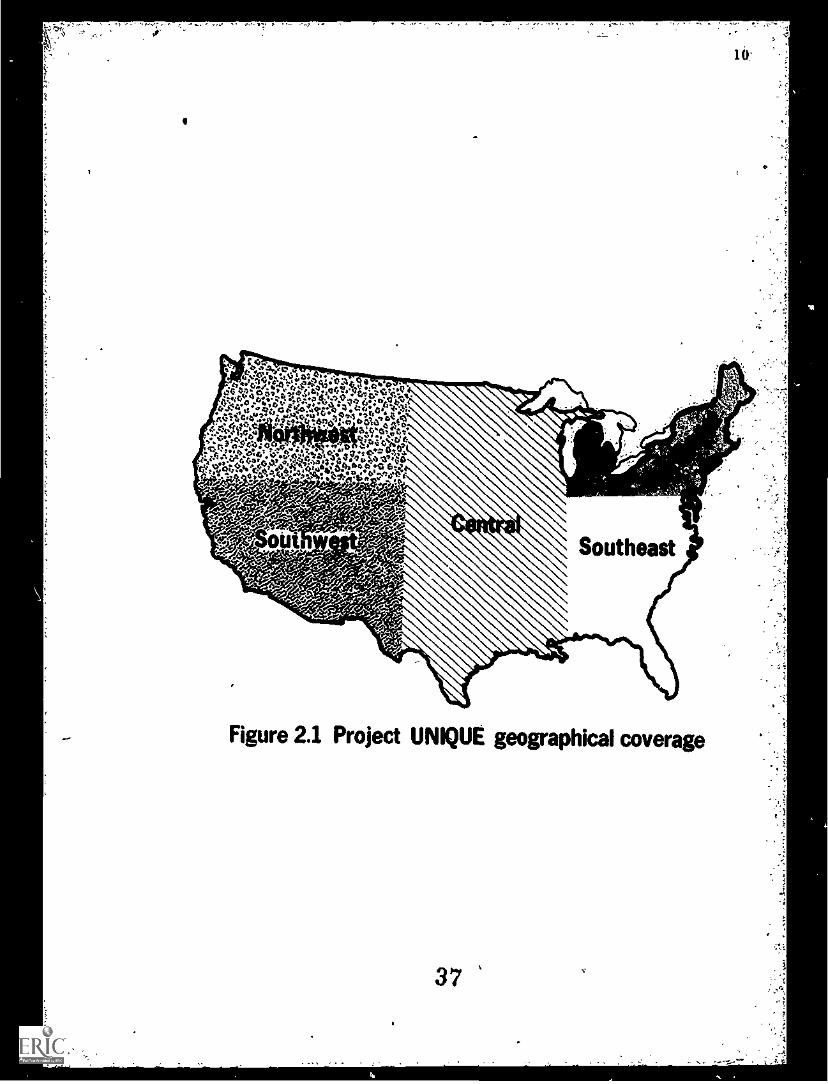
Figure 2.1 Project UNIQUE geographical coverage

11
Northeast Southeast Central Northwest Southwest
New York VirginIs lands Wisconsin Washington CaliforniaNew Jersey Maryland Minnesota Oregon ArizonaMaine Virginia Texas Idaho New MexicoNew Hampshire West Virginia Illinois Montana UtahConnecticut North Carolina Missouri North Dakota ColoradoMassachusetts South Carolina Arkansas South Dakota NevadaDelaware Georgia Kansas Wyoming HawaiiPennsylvania Florida Mississippi Alaska GuamOhio Alabama LouisianaMichigan Kentucky IowaVermont Tennessee NebraskaRhode Island Puerto Rico Indiana
Oklahoma
Field Testers
Field testers were identified and trained by coordinators. Except wherethese functions were performed by central staff or coordinators, field testersServed to identify subjects, attain permissions to test the subjects, adminis-tered tests to pupils in schools or institutional settings, recorded data on adata recording sheet, and transferred the data from the data recording sheetto a computerized scan sheet. All data were forwarded to Brockport for checking,computer preparation, and data analysis.
Field testers for the study consisted of individuals, mostly graduatestudents and teachers, who were certified as Project UNIQUE testers. Indivi-duals certified as testers were required to complete a competency-based trainingprogram. To a great extent, teachers of physical education tested theirown pupils.
i 38

12
Subject Selection
The subjects for this study came from states representing the fiveregions of the United States previously identified. Subjects were selectedfrom four major categories: normal (non-impaired), the visually impaired,auditory impaired, and orthopedic impaired. A distribution of subjects bygeographic region and handicapping condition is presented in Table 2.1. Allsubjects were between the ages of 10 through 17 and free of multiple handi-capping conditions. Age was determined by the individual's age at the timethe first test was administered.
TABLE 2.1. NUHBEK OF SUBJECTS CATEGORIZED BY GEOGRAPHIC LOCATION, HANDICAPPINGCONDITION, AND SEX.
NortheastBoys Girls
SoutheastBoys Girls
CentralBoys Girls
NorthwestBoys Girls
SouthwestBoys Girls
Norindi 282 346 102 73 52 159 28 34 47 69
V2S114. 99 71 77 54 166 107 10 5 SS 25Impairments
Auditory 228 '192 156 121 273 215 39 26 127 91Impairments
Orthopedic 118 114 18 13 127 97 4 3 61 SOImpairments
Selection of Normal Subjects
The sample of normal subjects was, to the extent possible, randomlyselected from those schools which agreed to participate in the study. In mostcases, intact physical education classes were randomly selected from thephysical education schedule. Effort was made to include only bias-freegroups/classes of subjects, i.e., those representative of the gi %eral schoolpopulation.
Normal subjects were selected from testing sites located in urban, suburban,and rural settings. For the purpose of this study, an urban site was onelocated in a community ;laving a population of 200,000 or greater. A suburbansite was defined as a school located in a community of 10,000 or moreindividuals, but less than 200,000 individuals. A rural site was one locatedin a community with a population of less than 10,000. A distribution ofnormal subjects categorized by age, sex, and community size is presentedin Table 2.2.
Impaired Subject Selection
The sample of subjects with impairments was selected from testing siteswhich agreed to participate in the study. Since the availability of subjectsat sites never exceeded the sample size, needed, every eligible subject thatcould be tested was tested, and random sampling was not applicable. Also, since
. 39
i4

4
TABLE 2.2. NORMAL SUBJECTS CATEGORIZED BY SEX, AGE, AND C{ UNITY SIZE.
13
Rural
Ages 10 11 12 13 14 15 16 17 Total
Boys 22 11 19 22 13 7 7 14 115
Girls 30 21 28 42 24 12 8 17 182
Suburban
Ages 10 11 12 13 14 15 16 17 Total
Boys 44 52 61 24 25 35 50 13 304
Girls 31 41 50 9 66 36 56 10 319
Urban
Ages 10 11 12 13 14 15 16 17 Total
Boys 11 6 13 7 0 19 23 13 92
Girls 10 0 37 60 45 16 8 4 180
Totals 148 131 208 184 173 125 152 71 1192
the number of sites involved never exceeded the total required, there was noreason to apply random sampling procedures to sites selected. However, aswith the normal group, only groups/classes of subjects which were felt to berepresentative of that special population were included.
Subjects with impairments were selected from both institutionalized andnon-institutionalized sites. For the purpose of this study, a non-institutionalized site 4as defined as any school which was not totally segregatedby handicapping conditions, or which included both normal and impairedpersons. An institutionalized site was defined as either a public or privateschool/agency attended solely by students with impairments. An instituticnalizedsite was further subcategorized according to the residence of pupils. Thoseliving at home (not at the institution) and attending an institutionalize:setting were categorized as non-resident institutionalized. Those residingwithin the institution were classified as resident institutionalized. Adistribution of subjects with impairments categorized by condition and educe.-tional environment is presented in Tables 2.3 through 2.7.
A total of 3,914 children and youth between the ages of 10 and 17 weretested during this study. A distribution of these subjects is presented inTable 2.8.
40
-4
yi

- ,..- 0," "Ns
TABLE 2.3. VISUALLY IMPAIRED SUBJECTS CATEGORIZED BY CONDITION ANDEDUCATIONAL ENVIRONMENT.
Institutionalized
Partially Sighted ,
-
Ages 10 11 12 13 14 15 16 17 Total
Boys 20 25 27 24 36 29 29 34 224
Girls 4 17 16 20 20 17 14 23 131
Blind
Ages 10 11 12 13 14 15 16 17 Total
4 3 3 10 11 14 10 11 66Boys
Girls 5 7 7 7 6 9 8 6 55
Non-Institutionalized
Partially Sighted
Ages 10 11 12 13 14 15 16 17 Total
Boys 13 5 10 7 18 11 15 1 80
Girls 3 2 7 7 9 IO 11 5 54
Blind
Ages 10 11 12 13 14 15 16 17 Total
Boys 2 0 1 2 4 3 4 1 17
Girls 2 1 1 5 3 7 2 1 22
Totals 53 60 72 82 107 100 93 82 649
41
14

TABLE 2.4. AUDITORY IMPAIRED SUBJECTS CATEGORIZED BY CONDITION ANDEDUCATIONAL ENVIRONMENT.
Institutionalized
Hard of Hearing
.Ages 10 11 12 13 14 15 16 17 Total
Boys 10 9 8 10 8 21 32 22 120
Girls 4 4 9 7 6 10 26 13 79
Deaf
Ages :1 11 12 13 14 15 16 17 Total
Boys 54 44 4 61 58 108 152 67 587
Girls 30 43 38 56 59 95 109 53 483
Non-Institutionalized
Hard of Hearing
Ages 10 11 12 13 14 15 16 17 Total
Boys 2 8 5 8 5 2 4 3 37
Girls 3 4 4 4 3 4 7 0 29
Deaf
Ages 10 11 12 13 14 15 16 17 Total
Boys 6 8 10 20 13 11 11 0
Girls 3 8 5 11 8 1S 2 2 54
Totals 112 128 122 177 160 266 343 160 1468
42
17
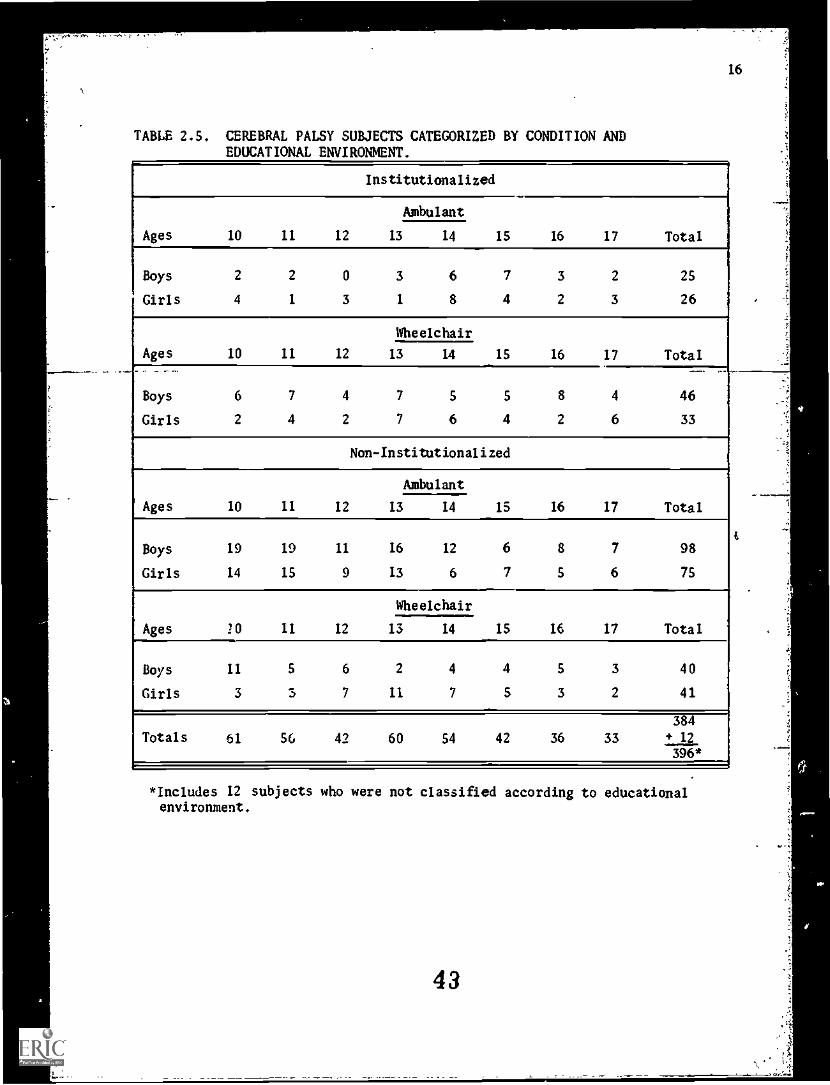
-.0% ^
TABLE 2.5. CEREBRAL PALSY SUBJECTS CATEGORIZED BY CONDITION ANDEDUCATIONAL ENVIRONMENT.
Institutionalized
Ambulant
Ages 10 II 12 13 14 IS 16 17 Total
Boys 2 2 0 3 6 7 3 2 2S
Girls 4 I 3 1 8 4 2 3 26
Wheelchair
Ages 10 II 12 13 14 IS 16 17 Total
Boys 6 7 4 7 S S 8 4 46
Girls 2 4 2 7 6 4 2 6 33
Non-Institutionalized
Ambulant
Ages 10 II 12 13 14 IS 16 17 Total
Boys 19 19 II 16 12 6 8 7 98
Girls 14 IS 9 13 6 7 S 6 7S
Wheelchair
Ages 20 II 12 13 14 IS 16 17 Total
Boys II S 6 2 4 4 S 3 40
Girls 3 3 7 II 7 S 3 2 41
384
Totals 61 SG 42 60 S4 42 36 33 + 12
396*
*Includes 12 subjects who were not classified according to educationalenvironment.
43
wow...1mm.

TABLE 2.6. SPINAL NEUROMUSCULAR SUBJECTS CATEGORIZED BY CONDITION ANDEDUCATIONAL ENVIRONMENT,
Institutionalized
Paraplegic
Ages 10 11 12 13 14 15 16 17 Total
Boys 4 1 5 2 1 5 2 6 26
Girls 3 5 2 2 1 6 4 2 25
Quadriplegic
Ages 10 11 12 13 14 15 16 17 Total
Boys 0 0 0 0 0 0 0 0 0
Girls 0 0 0 0 Q. 0 0 1 1
Non-Institutionalized
Paraplegic
Ages 10 11 12 13 14 15 16 17 Total
Boys 9 8 5 5 7 5 3 4 46
Girls 13 9 8 3 4 4 2 1 44
Quadriplegic
Ages 10 11 12 13 14 15 16 17 Total
Boys 0 0 1 0 0 0 0 1 2
Girls 0 0 0 1 0 1 0 1 3
Totals 29 23 21 13 13 21 11 16 147
[
44
4.
17

TABLE 2.7. ANOMALY/AMPUTEE SUBJECTS CATEGORIZED BY CONDITION ANDEDUCATIONAL ENVIRONMENT.
Institutionalized
Ages 10 11 12
Anomaly
1S 16 17 Total13 14
Boys
Girls
2
1
2
0
0
1
3 1
0 1
0
2
1
0
0
1
9
6
Ages 10 11 12
Amputee
IS 16 17 Total13 14
Boys
Girls
0
1
0
0
0
0
1 0
2 1
0
0
1
0
2
0
4
4
Non-Institutionalized
Ages 10 11 12
AnomalY
IS 16 17 Total13 14
Boys
Girls
2
1
3
1
1
0
1 1
3 2
4
1
0
- 2
3
2
IS
12
Ages IC 11 12
Amputee
IS 16 17 Total13 14
Boys
Girls
3
0
2
0
0
0
0 0
2 1
0
0
0
1
3
0
8
4
Totals 10 8 2 12 7 7 5 11 62
r
45

TABLE 2.8. NUMBER OF SUBJECTS CATEGORIZED BY CONDITION, SEX, AND AGE.
Age NormalBoys Girls
VisuallyImpaired
Boys Girls
AuditoryImpaired
Boys Girls
OrthopedicImpaired
Boys Girls
10 77 71 39 14 72 40 60 42
11 69 62 33 27 69 59 52 38
12 93 11S 41 31 66 S6 3S 33
13 S3 131 43 39 99 78 40 45
14 38 13S 69 38 84 76 37 37
1S 61 64 57 43 142 124 37 34
16 80 72 58 3S 199 144 32 22
17 40 31 47 35 92 68 3S 26
Sub- Sll 681 387 262 823 64S 328 277
Totals
TOTALS 1,192 649 1,468 60S
GRAND TOTAL 3,914
46
19
.3

V. ....ft, 1
20
Subject Definitions, Categories, CodesO
For the purposes of this study, four major categories of subjects wereidentified: normal (non-impaired), the visually impaired, auditory impaired,and orthopedic impaired. The definitions included for subject selection werein accordance with the rules and regulations governing PI. 94-142 (FederalRe ister, August 23, 1977). The purpose of this section is to interpret andclari y the definitions of the populations utilized in the present study.
The primary system used to categorize subjects in this study consistedof assigning each subject a three-digit number which corresponded to thesubject's handicapping condition. These "condition codes" may be found inAppendix A.
Normal (Non - Impaired
For the purposes of this study, a normal or non-impaired subject was onewho was (1) not identified as handicapped by the school district, (2) freefrom physical impairments or disabilities which may have influenced testresults, and (3) attended regular classes in non-institutionalized regularschools.
Visually Impaired
Subjects with visual impairments included the blind and the partiallysighted. The blind included those subjects with a visual acuity for distancevision of 20/200 or less in the better eye with best correction; or visualacuity of more than 20/200 if the width diameter of field vision substendedan angle no greater than 20 degrees; or were those who could not read print andneeded instruction in braille. Partially sighted subjects were those childrenwith a visual acuity of 20/200, but less than 20/70 with correction; or thosechildren who were able to be educated through the medium of vision with specialaids. Determination of groupings was made by the school/agency the individualattended. Pupils with visual impairments were further classified based uponthe onset of the condition. The onset of the condition was categorized asoccurring either congenitally, between birth and age six, or after age six.
Auditory Impaired
Subjects with auditory impairments included the deaf and hard of hearing.For the purposes of this study, hard of hearing was defined as decible lossranging from 27-90 db in the better ear or when the sense of hearing, althoughdefective, was functional with or without a hearing aid, but hearing abilitywas subnormal. Hard of hearing also meant a hearing impairment, whetherpermanent or fluctuating, which adversely affected a child's educationalperformance, but which was not included under the definition of deaf. Thedeaf included those individuals who had a hearing loss of 91 db or greater inthe better ear or whose hearing was nonfunctional for the ordinary purposes oflife, and/or deaf meant a hearing impairment which was so severe that thechild was impaired in processing linguistic information through hearing withor without amplification and which adversely affected educational performance.
47

21
Orthopedic Impaired
According to PL 94-142, orthopedic impaired refers to those persons whoseimpairment adversely affects their educational performance. It includesimpairments caused by congenital anomaly (e.g., poliomyelities, bone tuber-culosis, etc.), and impairments from other causes (e.g., cerebral palsy,amputations, and fractures or burns which cause contractures). For the purposesof this study, this definition was employed. Not all types of subjects withorthopedic impairments, however, were includ:d. This study subdivided theorthopedic category into the following four divisions: amputations, congenitalanomalies, cerebral palsy, and spinal neuromuscular conditions. Amputeeswere subjects who had part or all of one or more of their extremities missing.Thus, amputations were congenital or acquired. Subjects identified as possessingcongenital anomalies included, for the purposes of this study, individualswhose extremities weri-lulli or partially- present but were deformed. rn thecase of congenital anomalies, the conditions must have been present at birth.Spinal neuromuscular conditions were conceptualized as acquired or congenitalconditions characterized by spinal lesion which directly affected limb func-tioning. However, subjects with progressive muscular conditions associatedwith spinal lesions were not included in the study. Cerebral palsy was definedas a disorder characterized by disturbances in voluntary motor functioningresulting from lesions in the brain that affect the motor control centers.
For the purposes of subject selection, test administration, and dataanalysis, the four orthopedic categories were further subclassified. Theamputee and congenital anomaly subclassifications were based on extremityinvolvement and included one-arm only, two-arm only, one-leg only, two-legonly, one-arm and one-leg (same side), and one-arm and one-leg (opposite side).In addition, test items were selected for tri- and quad-amputees and congenitalanomalies based upon subject ability. These groups were excluded if theycould not be appropriately evaluated on any test item.
Spinal neuromuscular conditions were subclassified based upon the siteof spinal cord lesion. These categories were adopted from the classificationsystem of the National Wheelchair Athletic Association (NWAA) and were asfollows: (1) all cervical lesions, (2) lesions from T1 (first thoracicvertebrae)to TS, (3) lesions from T6 to TIO, (4) lesions from T11 to L2 (secondlumbar vertebrae), and (S) lesions at or below L3. For the purpose of testselection, testers were required only to classify spinal neuromuscular subjectsas either quadriplegic or paraplegic. Quadriplegic was defined as all cervicallesions, and paraplegic was considered to be those lesions occurring at orbelow T1. (IC the subject had been previously classified by the NWAA, thetester was asked to record the classification. The NWAA classificationsystem may be found in the modifications section of tAs chapter.)
The subclassifications of the cerebral palsied followed the 1979 sportclassifications of the National Association of Sports for Cerebral Palsy( NASCP). All cerebral palsied subjects were placed in one of the eight NASCPclassifications for this study. Classifications were made by Project UNIQUEtesters. This classification system appears in the modifications section ofthis chapter. Cerebral palsied subjects were also classified based upon thetype of cerebral palsy (spastic, athetoid, ataxic, rigid, tremor, or mixed)and limb involve:Item (monoplegia, diplegia, triplegia, hemiplegia, paraplegia,or quadriplegia).
48
A

22
Accordin; to the above definitions and classifications, the followingare examples of handicapping conditions which were included in the study:
1. Amputations - any extremity or combination
2. Congenital Anomalies - club foot, deformed limbs (non-spinal conditions)
3. Spinal Neuromuscular Conditions - post-polio, spina bifida, spinal cordlesions
4. Cerebral Palsy
The following are examples of conditions which were not involved in thestudy as primary handicapping conditions:
ArthritisMultiple SclerosisMuscular Dystrophy and Other DystrophiesTemporary Orthopedic DisabilitiesOsgood-Schlatter's DiseaseScoliosis and Other Structural Spinal/Postural DisabilitiesCystic FibrosisDiabetes MellitusCardiovascular Disorders (congenital or acquired)Respiratory DisordersArthrogryposis
Multiple Impairments
In selecting subjects for this study, the reality of individuals withmultiple impairments was of tremendous concern. Subjects with multiplehandicapping conditions were not ordinarily selected for this study. Theexception to this occurred in cases where additional handicapping conditionsdid not significantly affect performance on the physical fitness items includedin the study. For example, it was permissible to include an individual withcerebral palsy who, in addition, had some minor learning disability. However,if it was felt that the learning disability would seriously affect performanceon the test items, the individual was not included. In regard to mentalretardation, educable, trainable, and profoundly retarded individuals were notincluded in the selection of subjects. The intelligence quotient for mentalretardation was set at 69 or below. Individuals identified_ as slow learnerswere included in the study if they possessed one of the major handicappingconditions under investigation.
49
I
3

Description of Tests and Test Procedures
23
A description of tests and test procedures employed in this study aredescribed in this section. This description includes: a brief descriptionof the test items, the type of facility recommended for testing, equipmentneeded, scoring and trials, and procedures pertaining to group testing. Itwas suggestea that the items be administered in the following orCer: bodycomposition measures, sit-ups, timed leg raise, timed trunk raise, rise-to-stand, mat creep, shuttle run, modified stork test, sit and reach, grip strength,flexed arm hang, pull-ups, SO-yard/meter dash, standing broad jump, softballthorw, and long distance run. Testers were advised to demonstrate items tosubjects. Testers were informed that subjects should not be tested on morethan half the items during any one test day. Testers were instructed not totest subjects in environments where the temperature was above 90 degrees orbelow SO degrees, or where temperature plus humidity exceeded 17S.
A positive approach toward subjects participating in this study wasemphasized. Testers were instructed to encourage subjects to try as hard aspossible and to give verbal reinforcement after each trial on an activity.Enthusiastic encouragement by the tester during the administration of testitems was emphasized so that each subject's participation in the testing wouldbe a positive experience. On the other hand, testers were encouraged todiscourage razzing or cheering by observers (including subjects in the group)in all performances, but particularly running events.
Body Composition Measures
Test Items
Triceps Skinfold, Subscapular Skinfold, Abdominal Skinfold, Height,and Weight
Testers were instructed to obtain anthropometric measurements ina.gymnasium, office, or other enclosed area.
Equipment
Lange skinfold fat caliper, green felt tip pen, stadiometer, and
-alibrated scale.
Procedure Skinfold Measures
Description
Skinfold measures were taken at the triceps, subscapular,and abdominal regions. Testers obtained three readings at each site for eachsubject. A gre.en felt tip pen was used to mark a dot at the exact spot atwhich measures were taken. Skinfolds were obtained by grasping the skin andunderlying fat between the thumb and index finger with the span of the graspdependent upon the thickness of the skinfold. The skinfold caliper was
s o
4

24
applied approximately one centimeter (less than one-half inch) above thefingers holding the skinfold. All skinfold measurements were taken in thefollowing order: triceps, subscapular, abdomen. This order was repeatedfor the second and third measurements.
Triceps
The triceps skinfold was taken at the back of thedominant arm, midway between the elbow and the apex of the armpit. With thesubject's arm freely hanging, the skinfold was taken parallel to the longaxis of the arm. The triceps skinfold was a vertical fold and is illustratedin Figure 2.2a.
Sub
The subscapular skinfold was taken at a site one inchbelow and medial to the inferior angle of the scapula on the dominant side.The subscapular skinfold was taken at an angle (in line with the naturalcleavage lines of the skin) depicted in Figure 2.2b.
Abdominal
The abdominal skinfold was a vertical fold taken at asite two inches to the right of the person's midline, in line with the umbil-icus, and parallel to the long axis of the body. The abdominal skinfold siteis shown in Figure 2.2c.
Scoring and Trials
Skinfold measurements were recorded to the nearest millimeter.Three readings were obtained at each site for each subject. In addition, themean of the three site readings were recorded.
Procedures - Height and Weight
Description
Height was measured by having the subject stand facing thetester with shoes removed. Weight was taken by having the subject stand ona scale. Subjects removed their shoes and were clothed in lightweight athleticattire when tested.
Scoring and Trials
Single determinations of height and weight were taken. Heightreadings were recorded to the nearest half inch, and weight readings wererecorded to the nearest pound.
Muscular Strength/Endurance
Test Items
Timed flexed knee sit-ups, timed leg raise, timed trunk raise,
51

A. Triceps skinfold
B. Subscapular skinfold
C. Abdominal skinfold
2" to the netof the belly button
. Figure 2.2 Anthropometric measures
52
25
4

26
right and left grip strength, flexed arm hang, pull-ups, standing broad jump,and softball throw.
Facility
Gys asium or outdoor surface. It was recommended that the softballthrow be performed outdoors.
Equipment
Floor mat, stopwatch, one-foot ruler, hand dynamometer, hortzontalbar, tape measure, softball, and 2" X 2" X 4" block.
Procedure - Flexed Knee Sit-Ups
Description
In the flexed knee sit-up test, subjects were tested to determinethe number of sit-ups which could be performed in 60 seconds. To start, eachsubject assumed the supine lying position with knees bent, feet on the floor,and heels not more than twelve inches from the buttocks. The subject thencrossed the arms and placed their hands securely on the opposite shoulder andmaintained this position throughout the sit-up. subjects were required totouch the knee-thigh area on the rise and to place the midback in completecontact with the testing surface on the return to supine. The subject's feetwere held by a partner to keep them in touch with the surface. Each rise fro*the supine to the correct sit-up position was counted as one sit-up. Therequired body position for the sit-up is illustrated in Figure 2.3.
Scoring and Trials
One trial was administered for the sit-up test. The subject'sscore was the total number of sit-ups executed in 60 seconds.
Group Testing
In order to expedite testing, it was permissible for a groupof 10 participants--10 partners--to be tested at one time. Partners assumedthe normal assisting position and counted aloud, yet softly, the running countof the number of sit-ups executed fr the subject.
Procedure - Timed Leg_Raise
Description
In the leg raise, the subject was tested to determine thelength of time that straightened legs could be held. This test item was begunfrom a supine position with clasped hands placed behind the head/neck area, theelbows flat on the floor, legs straight, and both feet and legs together. Fromthis position, both legs were elevated to approximately 12 inches above the floorand held for as long a4 possible (see Figure 2.4). If the subject's legs bent,separated, or became heightened or lowered more than three inches above the12-inch mark, the timing of this activity ceased. It was recommended that
. . 53

FLEXED KNEE SIT-UPS

28
testers place a one-foot ruler on the floor under the subject's heels toDetermine height. Once timing began, it was recommended that the ruler bemoved to the side and be used as a guide.
Scoring_and Trials
The subject's score was the number of seconds that the legs wereheld in the desired position. Only one trial was given for this activity.
Group Testing
Testers were permitted to test a group of five subjects on thetrunk raise at one time (equipment permitting).
Procedure - Timed Trunk Raise
Description
In this test, the subject was tested to determine the lengthof time that the hyperextended trunk could be held in a raised position fromthe prone. The starting position for this test item was a prone position ona gym mat in such a way that the upper body above the illiac crest (beltline) protruded beyond the edge of the mat. The fingers were clasped andplaced in contact with the head with the elbows pointed outward and the calvesof the subject were held down. From this position, the subject hyperextendedthe back and attempted to hold this position for as long as possible. Timingceased when the subject lowered the trunk from the hyperextended position.Testers were encouraged to place a 2" x 2" x 4" wooden block to the side of
each subject to serve as a guide for the hyperextended criterion for the
cessation of timing. The timed trunk raise is depicted in figure 2.5.
Scoring and Trials
The subject's score on this test item was the number of secondsthat the subject was able to hold the required hyperextended position. Eachsubject performed one trial in this test item. A brief practice trial waspermitted.
Group
Testers were permitted to test a grOup of five persons on thetrunk raise at one time (equipment permitting).
Procedure - Right and Left Grip'Strength
Description
In grip strength tests, subjects squeezed a hand dynamometerwith maximum force. Right and left grip strength was measured with the useof an adjustable hand grip dynamometer (Preston PC5032). The dynamometer wasadjusted for each subject so that the middle joint (second joint) of thefingers fit firmly around the pulling mechanism as the heel of the hand wasplacad at the base of the dynamometer and the thumb was wrapped around the
55

r -,.-.N. , c6"....e T. !.: 1 $t t--:,
t,
14
i.
;I
,;14
on,..1-, .1. , -.- -
t
.1,. -14* Vtk
°.
Co

30
lase. The subjects squeezed the dynamometer while seated in a straightback desk chair. Hand and arm contact with the seat or any other obstacleswhich might provide additional leverage or impede movement was not permitted.The desired position is demonstrated in Figure 2.6. At the signal to begin,the subject squeezed the dynamometer as hard as possible with the armextended downward.
Scoring and Trials
The score for each trial was recorded to the nearest kilogram.The average of the three trials for the right hand and the average of thethree trials with the left hand were recorded. Three trials were givenfor each subject with each hand. Right and left hand trials were alternatedas subjects were tested.
Procedure - Flexed Arm Hang
Description
In the flexed arm hang, the subject grasped a horizontal barusing an overhand (pronated) grip, the elbows flexed, the chest close to thebar, and the chin over the bar (see Figure 2.7), and attempted to hold thisposition for as long as possible. If the chin of the subject rested on thebar, the subject tilted the head back in an attempt to keep above the bar,or the subject's chin fell below the bar, timing of this activity ceased.Each subject was provided two trialz on the flexed arm hang with a minimumof one minute rest interval provided between the trials. Testers wereencouraged to administer the second trial after a complete class was testedto allow rest between trials. It was recommended that spotters be used tohelp subjects assume the proper starting position and to prevent injuryfrom falling. However, spotters were not permitted to touch subjects as theyperformed the test item.
Scr.ing and Trials
Two trials were administered to each subject. The time, correctto the nearest second, that the subject correctly maintained the flexed armhang position was the trial score for each subject. The subject's score onthis test item was the mean score of two trials.
Procedure - Pull-Ups
Description
The pull-up test required a subject to perform as many chin-upsfrom a horizontal bar as possible. The starting position for the pull-upwas a hang position using an overhand (pronated) grip. From this position,the subject attempted to raise the body upward to a chin above the barposition. The subject then lowered to the original starting position andrepeated this process as many times as possible (see Figure 2.8). The bodyof the subject was not permitted to swing, kick, or push off the floor withtheir feet during the pull-up. Testers or spotters were permitted to preventswinging by extending their arms in front of the subject's thighs, helpstudents grasp the bar, and to prevent injury from falling. However, spotters
57

t:e
adjust hand grip dynamometerto fit subject's grip
ita\740
Li*411111116
Figure 2.6 Rignt and left grip strength
overhand grip
no up or downmovement
Figure 2.7 Flexed arm hang
58
31
.
4. I
3

*774,: ;:4., 4,4 4, .41
1
, . 11,77$ f n4t7."7 7'7": . %; 7:!'4,1,4:44.
Llirrulfisirttto ::11141..
21;I 6
7a.cotNi
h.
bo

33
were not permitted to touch subjects as they attempted to perform pull-ups.Improperly performed pull-ups were not counted.
Scoring and Trial:
One trial was administered in the pull-up test. The scoreattained by the subject was the number of successfully completed pull-ups.
Procedure - Standing Broad Jump
Description
In the standing broad jump, subjects were directed to jump asfar as possible from a take-off line using a two foot take-off and landingon both feet. The jump was measured from the take-off line to the pointnearest the take-off line where the subject's back heel touched the flooror ground. It was recommended that each subject be permitted a practicetrial during which measuring procedures and the importance of the armswinging and body rocking for maximum performance were explained.
Scoring and Trials
Scoring for the standing broad jump consisted of recording thedistance the subject jumped (heel mark) in feet and inches to the nearestrounded inch. Each subject was provided three trials. The subject's scorein this test item was determined by computing the mean score of the threetrials.
Group Testing
It was permissible for two subjects to be tested at onetime--one on each side of a measuring tape.
Procedure - Softball Throw
Description
For this test item, each subject was instructed to throw aregulation softball overhand at an angle of approximately 40 degrees as farforward as possible. Subjects were permitted one forward step during theoverhand throwing motion. A stopwatch was started at the time that the ballwas released from the subject's hand and stopped when the ball landed onthe ground. It was recommended that all subjects be permitted to warm-upbefore throwing any distances (practice or actual). Testers were asked notto test subjects during excessive wind conditions (15 mph or more). Thesoftball throw is illustrated in Figure 2.10.
Scoring and Trials
Each subject was allowed two practice throws and three testthrows. Two scores were recorded for each softball throw trial. The firstscore was a timed score in tenths of a second and represented the flighttime of the subject's throw. The second score was a distance score. It
60

..

represented the actual feet and inches that the ball traveled. Averagedtrial times and trial distance scores were also recorded on this test item.
S. peed
Test Items
50-Yard/Meter Dash
Facility
Althoqgh an outdoor area is preferred, an indoor or outdoor areamay be used for the 50- yard /meter dash.
Equipment
Stopwatch
Procedure - 50-Yard/Meter Dash
Description
This test item was administered to determine each subject'sspeed in performing both 50-yard and 50-meter runs. Subjects were shown thestarting line and the finish line of a 50-meter course and were instructedto iun 50 meters as fast as possible in a straight line. Subjects weretold that two times would be determined: one at SO yards and the second atSO meters. Timers positioned themselves between the 50-yard finish line andthe 50-meter (55 yards) finish line. Both 50-yard and 50-meter finish lineswere marked and subjects were instructed to run to the second line. Timeat the 50-yard mark and 50-meter mark was measured. The 50- yard /meter dash
was begun by having the tester raise his/her hand above their head to signifyREADY. The tester then dropped the hand by their thigh and called out GO tobegin the test. Mistrials were repeated. All subjects were required to wearathletic sneakers and were tested on a hard, flat surface. Testers wereencouraged to become proficient in using stopwatches prior to administeringthis test item.
Scoring_ and Trials
The score for the 50- yard /meter dash was the amount of time(seconds and tenths) it took a subject to run from the starting line tothe 50-yard and 50-meter finishing lines. Scores were recorded for both.distances. Only one trim was administered.
same time.
Group Testing
It was recommended that two subjects run the test at the
62
35
4

36
start50 50
yards meters(55 yards)
Figure 2.11 50-yard/meter dash
63

37
Sw
Agility
Test Items
Rise-to-Stand, Mat Creep, Shuttle Run
Facility
Indis.er gyr tsium or large room preferred. Flat level lutdoorsurfaces Lore acceptLole.
Equipment
Gymnasium mat, stopwatch, tape, plastic pylons or other suitablemarkers, and four brooks of wood 2" X 2" X 4".
4
Procedure - Rise-to-Stand
Description
In this test item, subjects were asked to move from a supineposition on a mat to a sable standing position as quickly as possible. Thesupine position on a mat was the starting position for the rise-to-stand.The hands of each subject were placed by their side, palms down. From thisposition, the subject moved to a standing position as quickly as possible.To signal, testers raised their hand above Their head in clear view to thesubject and said READY. When the hand was dropped to the thigh area andthe instructor said GO, the subject began. Testers ceased timing when thesubject came to a stable standing position.
ScorinbandIfials
Bach subject was administered three trials. The time elapsed(correct to t)ie nearest tenth of a second) in assuming a standing positionfrom a supine' position was recorded. The mean of the three trial scores wasalso recorded.
Procedure - Mat Creep
;
In this test, subjects creeped on their hands and knees ona mat as quickly as possible from a starting line to and around a pyloneight feet away and then back to the finish line. Subjects were required tocreep rather than pivot around the pylon. Knee pads could be worn by subjectsto prevent abrasions. The subjects were signaled to begin by having thetester raise tneir hand above their head, verbally commanding READY, anddropping their hand to their thigh, verbally commanding GO! TETWopwatchwas started on the GO command and stopped as soon as any body part broke theplane of the finish line on the mat.
64

38
Scoring and Trials
Subjects were provided three trials. The subject's trial scorewas the time (correct to the nearest tenth of a second) that it took a subjectto complete the mat creep. The mean of trial scores was recorded.
Procedure - Shuttle Rua.
Description
In the shuttle run (Figure 2.12), subjects ran 30 feet from astarting line, picked up a 2" X 2" X 4" block, ran back to the starting line,,placed the block behind the starting line, ran 30 feet, picked up anotherblock, and ran back to the starting line (subjects were not required to placethe second block on the ground or floor). Thus, the start and finish lineswere one in the same. Testers were instructed to test two subjects runningin different lanes at one time. Each runner was tested in a lane approximately1S feet in width and 30 feet in length (plus end line space). All subjectswere required to wear athletic sneakers and be tested on a hard, flat surface.Testers were instructed to use both verbal and hand signals to signal subjects.Subjects falling during the test were retested after a brief interval. In
case of a false start, subjects were retested immediately. It was recommended
that timers place themselves in front of the start/finish line to signal thestart, and return to the start/finish line to record each subject's time atthe finish.
Scoring and Trials
Subjects were permitted two trials for this test item with atleast a three-minute rest interval between trials. The trial score for the£huttle run was the amount of time correct to tents of a seccnd, that ittook to run the complete shuttle course. The mean'of trial scores was alsorecorded.
Grout Testing
Testers were instructed to test two subjects running in differentlanes at one time.
Flexibility
Test Item
Sit and Reach Test
Facility
Indoor gymnasium or room preferred. Flat level outdoor surfaceswere acceptable.
Equipment
The sit and reach test was aministered using a sit and reachapparatus (Figure 2.13) or an improviied sit and reach apparatus using a benchand meter stick. The sit and reach apparatus was constructed using plywood.
65

end
30'
Figure 2.12 Shuttle run
SITAND-REACH APPARATUSCONSTRUCTION PROCEDURES
1----21"
1-12 " --1
Figure 2.13 Sit and reach apparatusconstruction procedures
66
1
301I.
LH'
kblocks
2"x2"xV
39

41
The top panel was marked with one centimeter gradations, with the 23 centi-meter line exactly in line with the vertical panel against which the subjects'feet were placed.
Procedure - Sit and Reach Test
Description
In the sit and reach test, each subject was asked to reachforward as far as possible from a sitting position. To start the test, eachsubject was instructed to lie supine with legs straight, feet placed flushagainst the sandpapered side of a sit and reach apparatus with shoes removed(see Figure 2.14). From this position, the subject moved to a sittingposition. A partner then held down the subject's knees firmly so that theyremained in contact with the floor or supporting surface. The subject thenextended tee arms and hands in front of the body (one hand on top of the other)and attempted to reach past their toes and contact the centimeter measurementboard on the sit and reach apparatus with their fingertips. Subjects werecautioned not to bob with their torso, but to slowly reach forward as far aspossible four times, and hold for one second on the fourth reach. Testers wereinstructed to provide a practice trial for each subject.
Scoring and Trials
Two trials of this test item were administered. The trial scoreon the sit and reach test was the distance, to the nearest centimeter, that thesubject was able to reach and hold for one second. Trial scores, as well asthe mean of two trial scores, were recorded for each subject.
Cardiorespiratory Endurance
Test Item
One mile/nine-minute run for ages 10 to 12, and a one-and-one-halfmile/twelve-minute run for ages 13 and older.
Facility
The run was performed either indoors or outdoors. An outsidetrack 1/8 to 1/4 of a mile was highly recommended. If an indoor facilitywas used for testing, the minimum course which was constructed was 7 1/2 yardsX 20 yards in space. (A subject needed to complete 32 laps of a 20 X 7 1/2 yardcourse.)
Equipment
Stopwatches, tape, pylons or other suitable markers
Procedure - 1 Mile/9Minute Run, 111 Mile/12-Minute Run
Description,
This test item was designed to measure cardiorespiratory enduranceby measuring the time taken to run one or one-and-one-half miles, or by measuring


=1.
42
the distance completed in nine or 12 minutes. Subjects ranging in age from10 to 12 were instructed to run for one mile or for nine minutes, whicheverarrived first. Subjects ranging in age from 13 to 17 were instructed to runfor one-and-one-half miles or 12 minutes, whichever came first. Subjectswere permitted to walk if they felt tired. However, once the subject cameto a stop, the test ended for that subject and distance and time was recorded.Subjects were instructed to pace themselves. Subjects began in the star.lingposition on a hand and verbal signal from the tester. 1c was necessary forsubjects to wear sneakers at athletic clothing.
To facilitate test administration, it was recommended thatmarkers be spread at intervals around the running area. The markers were usedto facilitate recording of yardage covered by each subject in the event thata Subjeci did not complete a distance of one or one-and-one-half miles. It
was also recommended that testers use assistants to record times when verballyissued by the tester, record the laps completed by each runner, and mark theresidual yard distance when a runner stopped before completing the full distance.
Scoring and Trials
One trial of this test item was administered. The actualrunning tije and the actual distance covered by each subject was recordedimmediately upon completion of a run. In cases where subjects were unableto complete the one/one-and-one-half mile run for their age group in nine or12 minutes, respectively, the distance covered in nine or 12 minutes wasrecorded. In cases where subjects completed the one/one-and-one-half milerun in less than nine or 12 minutes, respectively, this time was recorded.The subject's run was considered finished when the subject: (1) came to acomplete stop, (2) expired nine/12 minutes of running time, (3) completed theone/one-and-one-half mile distance. Subj;ct times were recorded in minutesand seconds (nearest whole second). The actual distance covered was recordedin yards.
Group Testing
It was permissible to test up to four subjects at once onthis test item.
Static Balance
Test Item
Modified StorK Test
Facility
Indoor gymnasium, large room or a flat outdoor testing surfacewas permissible.
Equipment
Stopwatch
69

43
Procedure - Modified Stork Test
Description
In the modified stork test, the subject attempted to balancein a standing position with the arms folded, eyes closed, and one leg raisedoff the supporting surface by bending the knee (Figure 2.15). Testers wereinstructed to place the subject away from obstacles or pointed objects,provide a demonstration of correct procedures, and test at least two subjectsat a time. Minute pivoting on the standing leg was permitted to the extentthe tester felt that no significant advantage was provided and the individualremained in essentially the same spot. Stopping or placing the raised leg incontact with the standing leg was not permitted. Timing on each trial ceased
allowed_the.elevated-foot to-touch-the-floor;-the-subject-.3 opened eyes, or if their arms unfolded. Testers were instructed to demonstrate
the modified stork test to the subject, allow the subjects a brief practicei trial, and demOitrate acceptable and unacceptable pivoting.
Scoring and Trials
Each subject was administered three trials. The trial score onthe modified stork test was the balancing time, correct to the nearest second,that.the individual was able to hold the desired position. The mean of thethree trials was recorded.
Group Testing
It was permissible for a group of four to five subjects to betested on the stork test at one time.
70
46.
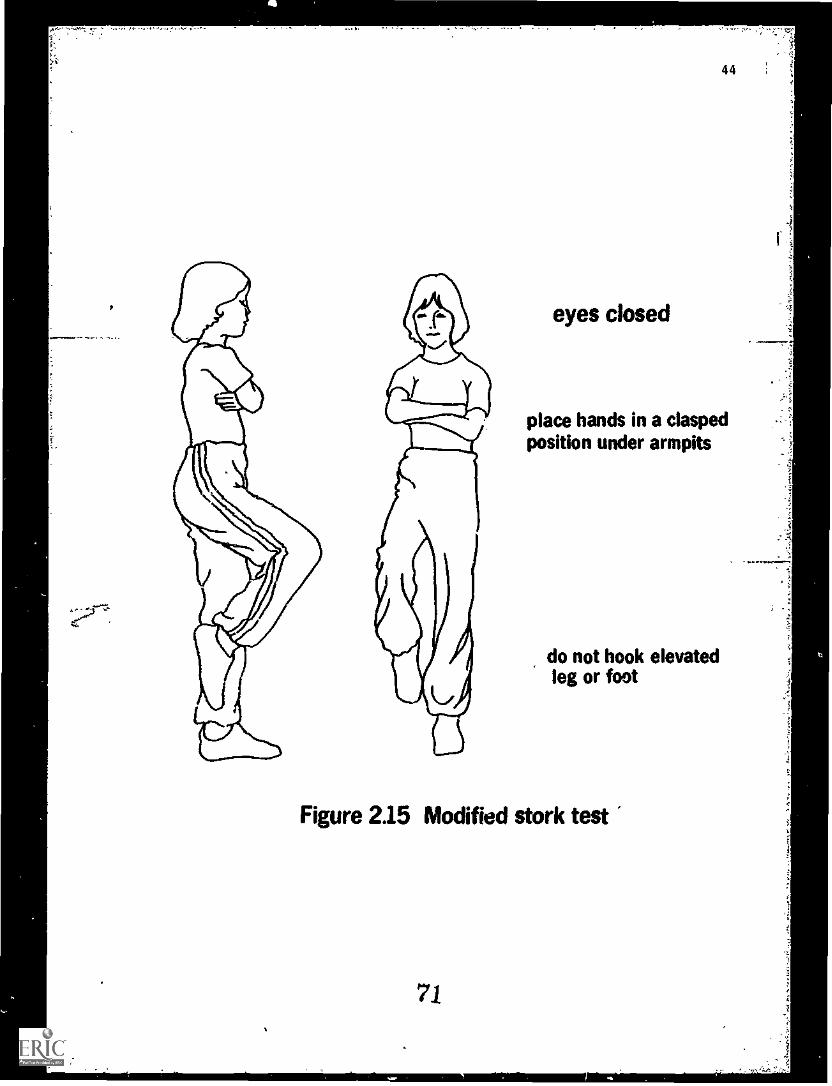
eyes closed
place hands in a claspedposition under armpits
do not hook elevatedleg or foot
Figure 2.15 Modified stork test
71

0
A,..,t
Participation Guides and Test Modifications
45
In order to accommodate the abilities and limitations of individuals withhandicapping conditions, it was necessary, in many cases, to modify oreliminate certain test items for subjects. To enhance data collection, aseries of participation guides were developed, one for each of the majorsubject groups, to identify those items considered appropriate for eachpopui'tion. While each participation guide was developed in consultation withexperts in adapted physical activity for the various populations and whiletesters were encouraged to follow the guide; as closely as possible, testerswere instructed to eliminate any test item which they believed to be con-traindicated for a subject.
-- The participation guides for each of the subject groups are presented onthe following pages. With each participation guide is a description of testmodifications which were considered necessary for appropriate participation.Testers could only modify test items as described herein. One modificationwhich applied to certain subject groups was the "run code" classification. Foreach test item which involved running (shuttle run, SO-yard/meter dash, longdiitance run), subjects participated using their normal method of ambulation.The method of ambulation employed was noted by the tester as a "run code."The following run codes were available to subjects: (1) moved wheelchairforward with arms, (2) moved wheelchair forward with feet, (3) moved wheelchairbackward with feet, (4) used a cane, (S) used crutches, (6) partner assisted,(7) guide wire or rope assisted, (7) used a walker, and (8) unassisted. If
the subject employed a method of ambulation different than those describedabove, he/she was not tested on the running items.
The first participation guide presented here (Table 2.9) was appropriatefor normal, auditory impaired, and visually impaired subjects. It was
suggested that subjects in these three groups participate in all test items.Normal subjects took all test items without modification. The modifica-tions necessary for auditory impaired subjects were minimal and centeredprimarily on alternative methods of communicating the requirements of eachtest item. These adaptations are discussed in terms of general and specificmodifications. Visually impaired subjects required additional modifications.Generally, these modifications consisted of conveying directions verbally incombination with tactual and/or kinesthetic cues and allowing subjects a"walk through" practice trial to "get the feel" of the test item. Each testitem, with appropriate modification, is discussed separately for the visuallyimpaired group.
72

TADLE 2.9. PARTICIPATION GUIDE FOR NORMAL, AUDITORY, AND VISUALLY IMPAIREDSUBJECTS.
Test
Participation GuideNormal Auditory Visual
. Body Composition Measures
Height and Weight X X ,ATriceps Skinfold X XSubscapular Skinfold X X X
Abdominal Skinfold X X X
2. Muscular Strength/Endurance
Sit-Ups X X XLeg Raise X X XTrunk Raise X X XRight Grip X X X
Left Grip X X XFlexed Arm Hang X X XPull-Ups X X XStanding Broad Jump X X X
Softball Throw X X X
3. Speed
50- Yard /Meter Dash X X X
4. Agility
Rise-to-Stand X X X
Mat Creep X X XShuttle Run X X X
S. Flexibility
Sit and Reach X X X
6. Cardiorespiratory Endurance
9-Minute/I-Mile Run
orI2-Minute/IIIMile Run
X
7. Static Balance
Modified Stork Test X X X
73

I
47
Test Modifications for the Auditory Impaired
General Modifications
I. Each test item was carefully demonstrated.
2. If possible, instructions to auditory impaired subjects were givenby a person skilled in non-verbal communication.
3. If necessary, instructions were given in writing prior'to thetesting of subjects.
4. All starting and stopping signals were given by hand signals. Anelevated arm with the palm of the hand open and facing the subject signifiedSTOP. This signal was similar to that used by a police officer. The GO signalwas given by dropping a raised hand from above the head to one's thigh.
Specific Modification
Modified Stork Test
To begin this test, subjects were instructed to close theireyes and begin their balance test when they were touched by the experimenter.
Test Modifications for the Visually Impaired
Body Composition
Height, Weight, Skinfolds
No modifications were considered necessary.
Muscular Strength/Endurance
Timed Flexed Knee Sitps
No modifications were considered necessary.
Timed Leg Raise
No modifications were considered necessary.
Timed Trunk Raise
No modifications were considered necessary.
Right and Left Grip Strenja
No modifications were considered necessary.
Flexed Arm Hang
No modifications were considered necessary.
74
;
3
-4

48
Pull-Ups
No modifications were considered necessary.
Standing, Broad Jump
When blind subjects jumped in the practice trial (two trialsallowed), touch was used to emphasize the body rock and arm swlng. Also,testers touched the back of the subject's heel when explaining distance markingand straddle landings. If the subject requested arm support during the jump,this assistance was provided.
Softball Throw
A tactual aid was placed on the ground so that visually impairedsubjects knew the location of the throwing line: The tactual aid could havebeen a narrow board, a different surface (dirt-grass), or some other device.
Speed,
SO-Yard/Meter Dash
Blind subjects ran this test under one of two conditions:(1) with a sighted or functionally able partially sighted partner who guided(but did not pull or assist) the blind runner, or (2) alone, but with thetactual aid of a gait:a rope or wire extended along the course. Partiallysighted subjects were given the option of utilizing a partner or running alone.All visually impaired subjects were offered an opportunity to jog or walkthe SO meter distance so that they could famil4arize themselves with thecourse. It was emphasized to visually impaired subjects that there was aconsiderable amount of clear space after the finish line. If a partner wasused, this person must have been able to run at least as fast as the subject.
Agility
Rise - to -Stand
After the rise-to-stand procedures and instructions wereexplained to the subject, individuals slowly performed a practice trial. Thiswas intended to give the subject a clear idea of the activity. No othermodification was considered necessary for blind subjects.
Mat Creed
The only adaptation necessary for blind subjects was providing
the subject with a verbal cue when he/she was at a point just past the pylonthat they should turn around to creep back to the starting line. hiscue was provided by saying TURN AROUND when the subject was just past thepylon. Each subject also was provided with a slow practice trial so thathe/she could become faimilar with the course.
75

49
Shuttle Run
Blind subjects could run the course under two conditions:(1) with a sighted or functionally able partially sighted partner who wasable to run faster than the blind partner, or (2) alone, but with the benefitof a guide rope or wire extended along the course. It was emphasized toblind subjects that there was a considerable amount of clear space after thefinish line and that they would be running a short distance. When blindsubjects arrived at one end of the run, as indicated by a signal from thetester, they bent down and touched the floor, then returned to the startingline and repeated the process. This procedure was repeated until the shuttlerun distance was completed (three surface touches and a running finish).Brightly colored wooden blocks were provided to test partially sighted subjects.Blind and partially sighted subjects were allotved to jog or walk the coursein order to become familiar with the test item.
Flexibility
Sit and Reach
The subject's feet were placed in position against the sand-paper side of the box. Two practice trials in which the instructor guidedthe blind subject through the motion were permitted. No other modificationswere considered necessary.
Cardiorespiratory Function
One Mile/Nine-Minute Run, One-and-One-Half Mile /Twelve- Minute Run
Blind subjects ran this test with a normally or functionallyable partially sighted partner who guided the blind runner. The blind runnergrasped the elbow of the partner or ran hand-in-hand with the partner.Partially sighted subjects were given the option of utilizing a partner orrunning alone- Visually impaired subjects were offered an opportunity towalk around one or more of the track turns so that they could familiarizethemselves with the course.
Static Balance
Modified Stork Test
Blind subjects were allowed a practice trial to provide aclear idea of the activity. No other mod'fication was considered necessaryfor blind subjects.
76

Participation Guide and Test Modificationsfor Subjects with Amputations
The participation guide for subjects with amputations is presented inTable 2.10. Participation for these subjects was largely dependent upon limb
involvement. The modifications were not extensive and reflected a "commonsense approach" to involving subjects with amputations by slightly alteringtest procedures. Each test item, with appropriate modification, is sub-sequently presented for subjects with amputations.
Body Composition Measures
Height and Weight
The heightwith the device on. (The
was taken from the end ofand testers were asked tosheets.)
The weightdevices removed.
SO
of a subject wearing a prosthetic device was takenheight of a double leg amwae not wearing prosthesesthe longest remaining ail) to the top of the head,indicate the site of 7.he amputation on the score
of all subjects was taken with braces and prosthetic
Triceps, Subscapular, and Abdominal Skinfolds
. One-Arm Involvement
The triceps measure was taken on the non-impaired arm.
Two-Arm Involvement
Subjects were not to be tested on the triceps measure ifthe involvement was above the elbow.
One-Leg Involvement
No modifications were considered necessary.
Two-Leg Involvement
SuL4ects may have been supported for measurement of sub-scapular and abdominal i t measures. These measures were taken from :-.. standing
position where possible.
One-Arm One-Leg Same-Side Involvement
The triceps measure was taken on the non-impaired arm.
One-Arm One-Leg Opposite-Side involvement
The triceps measure was taken on the non-impaired arm.
77
4

4
I
TABLE 2.10. PARTICIPATION GUIDE FOR SUBJECTS WITH AMPUTATIONS.*
Test
51
Participation by SubclassificationOne Arm Two Arm One Leg Two Leg One Arm One ArmOnly Only Only Only One Leg One Leg
Same OppositeSide Side
I. Body Composition Measures
Height and Weight X X X X X XTriceps Skinfold X X** X X X X
Subscapular Skinfold X X X X X X
Abdominal Skinfold X X X X X X
2. Muscular Strength/Endurance
Sit-Ups X X X X X
Leg Raise X Y. X X X
Trunk Raise X vA X X X
Right Grip X or X X X or X orLeft Grip X X X X XFlexed Arm Hang X XPull-Ups X X
Standing Broad Jump X X X X X
Softball Throw X X X X X
seated
3. Speed
SO-Yard/Meter Dash X X X*** X*** X*** X***
4. Agility
Rise-to-Stand X X X X X
Mat Creep X X X X
Shuttle Run X X X*** X*** X*** X***
S. Flexibility
Sit and Reach
. Cardiorespiratory Function
9-Minute/1-Mile Runor X X X*** X*** X*** X***
12-Minutei1h-Mile Run
. Static Balance
Modified Stork Test X X X X Xi iMm1Mil..,E===11,
*Testers were instructed to administer appropriate tests to tri- and (. ,d-amputees.
* *Participation was dependent upon the site of amputation.***Method of ambulation varied according to ability (set run code classifications).
78

Muscular Strength/Endurance
Timed Flexed; Knee Sit-Ups
One-Am Involvement
Subjects were required to cross the non-impaired arm ontheir chest and any possible portion of the impaired arm.
possible.
Two -Arm Involvement
Subjects crossed their arms on their chest to the extent
One-Leg Involvement
The non-impaired leg of the subject was held down by apartner; the impaired leg was given as much support as possible.
Two- Leg Involvement
Subjects were not tested on this item.
{fie -Arm One-Leg Involvement
The non-impaired leg of the subject was held down by apartner and the impaired leg was given as much support as possible. Subjectscrossed the non-impaired arm on the chest and any possible portion of theimpaired limb.
Timed Leg Raise
One-Arm Involvement
Subjects were required to keep one hand in firm contactwith the back of their head and neck at all times.
Two-Arm Involvement
Subjects placed their arms at a backward angle, similarto the position assumed by the upper arms when the hands clasp the head.
One-Leg Involvement
Subjects raised only one leg.
'Iwo -Leg Involvement
Subjects did not participate in this exercise.
One-Arm One-Leg Involvement
Subjects raised one leg and placed one hand behind theirhead/neck area during the leg raise.
79
52

53
Timed Trunk Raise
One-Arm Involvement
Subjects were required to keep one hand in contact with theback of the head and neck P.c all times.
Two-Arm Involvement
Subjects placed upper limbs at a backward angle, similarto the position assumed by the upper arms when the hands clasp the head.
,One-Le LanKaven_IuLt
The non-impaired leg was held down and the impaired legwas stabilized to the fullest possible extent.
Two-Leg Involvement
Subjects were supported on the upper thigh and/or buttocks.
One-Arm One-Leg_ Involvement
The non-impaired leg was secured at the calf and theimpaired leg was held down at the upper thigh and/or buttocks, to the fullestpossible extent. Subjects placed one hand behind their head/neck area duringthe trunk raise.
S. wow
t.;
Right and Left G.in Strength
One-Arm Involvement
Subjects performed the test with the non-impaired arm only.
Two-Arm Involvement
Subjects did not participate in this activity.
One-Leg_Involvement
No modifications were considered necessary.
Two-Leg Involvement
No modifications were considered necessary.
One-Arm One -Leg Involvement
Subjects performed the test with the non-impaired arm only.
80

" 0
Flexed Arm Hang,
One-Arm Involvement
Subjects did not participate in this activity.
Two-Ara Involvement
Subjects did not participate in this activity.
One-Log Involvement
No modifications were consio.ed necessary.
Two-Leg Involyment
No modifications were considered necessary.
One-Arm One-Leg Involvement
Subjects did not participate in this activity.
Pull-Ups
One-Arm Involvement
Subjects did not participate in this a-tivity.
Two-Arm Involvement
Subjects did not participate in this activity.
One-Leg Involvement
No modifications were considered necessary.
Two-Leg Involvement
No modifications were considered necessary.
One-Arm One-Leg InVolvement
Subjects did not participate in this activity.
Standing Broad Jump
One-Arm Involvement
No modifications were considered necessary.
Two-Arm Involvement
No modifications were considered necessary.
81
S4

1,7
One-Leg involvement
Subjects were allowed to participate in this activity.If the subject requested arm support during the jump, this assistance wasprovided.
Two-Leg Involvement
Subjects did not participate in this activity.
One-Arm One-Leg Involvement
Subjects were allowed to participate in this activity.If the subject requested arm support during the jump, this assistance wa4provided.
Softball Throw
One-Arm Involvement
No modifications were considered necessary.
Tv'..- arm Involvement
Subjects did not participate in this activity.
One-Leg involvement
No modifications werf: considered necessary.
SS
Two -Leg Involvement
Subjects performed this activity from a seated position ina straight back chair or wheelchair Subjects were given adequate warm up andtwo practice trials. Wheelchair participants were instructed to lock theirbrakes prior to throwing.
Speed
One-Arm One-Leg Xnvolvement
No modifications were considered necessary.alb
rd/Meter Dash
One-Arm Involvement
No modifications were considered necessary.
Two-Arm Involvement
No modifications were considered necessary.
82

F
"
1.
_
One or 'No-Leg Involvement
56
The event was completed under one of the followingconditions: moved wheelchair forward with arms, moved wheelchair forward withfeet, moved wheelchair backward with feet, used crutches, used a cane, used awalker, or used no assistive device.
One-Arm One-Leg Involvement
The event was completed under one of the following
conditions: moved wheelchair forward with arms, moved wheelchair forward withfeet, moved wheelchair backward with feet, used crutches, used a cane, used a
walker, or used no assistive device.
Agility
Rise-to-Stand
One-Arm Involvement
No modifications were considered necessary.
Two-Arm Involvement
No modifications were considered necessary.
One-Leg Involvement
No modifications were considered necessary.
Two-Leg Involvement
Subjects did not participate in this activity.
One-Arm One-Leg Involvement
No modifications were considered necessary.
Mat Cree0
One-Aim Involvement
No modifications were considered necessary.
Two-Arm Involvement
Subjects did not participate in this activity.
One -Leg Involvement
No modifications were considered necessary.
83

. - - . ... ...
57
Two-Leg Involvement
Subjects did not participate in this activity.
One-Arm One-Leg Involvement
No modifications were considered necessary.
Shuttle Run
One-Arm Involvement
No modifications were considered necessary.
Two-Arm Involvement
Subjects were instructed to bend down so that one kneetouched the running surface. When the subject returned to the starting line,he/she bent down and again touched the surface with a knee. This was repeatedUntil the shuttle run distance was complete (three knee touches and a runningfinish).
One-Leg, Two-Leg Involvement or One-Ailm One-Leg Involvement
This event was completed under one of the followingconditions; moved wheelchair forward with arms, moved wheelchair forwardwith feet, moved wheelchair backward with feet, used a cane, used crutches,used a walker, or used no assistive device. If a wheelchair was utilized,the subject wheeled to the wooden blocks which were set up on an invertedwastebasket (size ranging from 15 inches to 25 inches in height). The subjectpicked up one block and placed it on his/her lap and wheeled back to the startingline. The block then was dropped down to the floor behind the starting. line.The subject returned to the second block,.picked it upoff the basket, placed
'Pit in the lap, and_wheeled as quickly as possible past the start/finish line tocomplete-the shuttle run. The modified shuttle run is illustrated in Figure 2.16.
Flexibility
Sit and Reach
One-Arm Involvement
No modifications were considered necessary.
Two-Arm Involvement
Subjects did not participate in this activity.
One-Leg Involvement
No modifications were considered necessary.
84

ev

tia
59
Two-Leg Involvement
Subjects did not participate in this activity,
One-Arm One-Leg Involvement
No modificat ons were considered necessary.
Cardiorespiratory Function
One Mile/Nine-Minute Run, One-and-One-Half Mile/Twelve-Minute Run
One-Arm Involvement
No modifications were considered necessary.
Two-Arm Involvement
No modifications were considered necessary.
One-Leg or Two-Leg Involvement
The event was completed under one of t,e followingconditions: moved wheelchair forward with arms, moved wheelchair forward withfeet, moved wheelchair backward with feet, used crutches, used a cane, useda walker, used no assistive device.
One-Arm One-Leg Involvement
This event was completed under one of the followingconditions: moved wheelchair forward with arms, moved wheelchair forward withfeet, moved wheelchair backward with feet, used crutches, used a cane, used awalker, used no pssistive device.
Static Balance
.r..
Modified Stork Test
One-Arm Involvement14#0,
Subjects were required to cross one arrif In their chestand cross any nortion of the impaired arm. One-arm amputegs were not allowedto extend the impaired limb for balancing purposes.
Two-Arm Involvement
Subjects were required to cross their chest with anyportion of impaired limbs they possessed. Twoarm amputees were not allowedto extend their upper limbs as balancing aids.
One-Leg Involvement
No modifications were considered necessary.
86

V
t
Two-Leg Involvement
Subjects did not participate in this activity.
One-Arm One -Lea Involvement
Subjects were required to cross one arm on their chestand cross any portion of the impaired arm. One-arm amputees were not allowedto extend the impaired limb for balancing purposes.
87
60
J

-
61
Participation Guit!e and Test Modifications for
Subjects with Congenital Anomalies
Test modifications for subjects with congenital anomalies are presenteein this section. In addition, the participation guide is presented inTable 2.11.
Body Composition Measures
Height and Weight
The height of a subject wearLg a prosthetic device was takenwith the device on. (The height of a subject with de!ible leg anomalies notwearing prostneses was taken from the 1.nd of the longest remaining limb to thetop of the head, and testers were asked to indicate the site of the anomalyon the score sheet.)
The weight of all subjects was taken with braces and prostheticdevices removed.
Triceps, Subscapular, and Abdominal Skinfolds
One-Arm Involvement
The triceps measure was taken on the nol-impaired arm.
Two-Arm Involvement
It was not possible to take the triceps measure if thelevel of involvement was above the elbow on each arm.
One-Leg Involvement
No modifications were considered necessary.
Two-Leg Involvement
Subjects were supported for measurement of subscapular andabdominal at measures. These measures were taken fro ,-- standing position.
.1
One-Arm One-Leg Same-Side Involvement
The triceps measure was taken on the non-impaired arm.
One-Arm One-Leg Opposite-Side Involvement
The triceps measure was taken on the non - impaired arm.
88
_a

S.- u
67
TABLE 2.11. PARTICIPATION GUIDE FOR SUBJECTS WITH CONGENITAL ANOMALIES.*
TIst
Participation by Subclass4-4 .-nOne Arm no Arm One Leg No Le One ArmOnly Only Only Onl One Leg One Leg
Same OppositeSide Side
1. Body Composition Measlres
Height and Weigh .. X X X X XTriceps Skinfold WA X** X X XSubscapular Skinfold X X X X X XAbdominal Skinfold X X X X X X
2. Muscular Strength/Endurance
Sit-Ups X X X X XLeg Raise X X X X X
Trunk Raise X X X X XRight Grip X or X X X or X orLeft Grip X X X X XFlexed Arm Hang X XPull-Ups X XStanding Broad Jump X X X X XSoftball Throw X X X X X
seated
3. Speed
SO-Yard/Meter Dash X
4. Agility
Rise-to-StandMat CreepShuttle Run
XX
X
X
X
X*** Xw X*** X*"
X X XX x X
X*** XWC
X*** X***
S. Flexibility
Sit and Reach X X
6. °respiratory Function
Minute/1-Mile Runor Y. X X** X
wc
'92-Minute/11/2-Kile Run
7. Stitic Balance
Modified Stork Test X X X
X*** X***
X Xidwe - Only subjects who used a wheelchair in daily activities were tested on
this item.*Testers were instructed to administer appropriate tests to tAiplegic andquadriplegic participants.
**Participation was dependent upon the site of anomaly.***Method of ambulation varied according to ability (see run code claasifications).
89

a
63
Muscular Strength/Endurance
Timed Flexed Knee Sit-Ups
One-Arm Involvement
Subjects were required to cross the non-impaired arm ontheir chest and any possible portion of the impaired arm.
Two-Arm involvement
Subjects were instructed to cross their arms on theirchest to the extent possible.
One-Le& Involvement
The non-impaired leg of the subject was held down by apartner and the impaired leg was supported to the fullest possible extent.
Two-Leg Involvement
Subjects were not tested on this item.
OneArm One-Leg involvement
The non-impaired log 01 the subject was held down by apartner and the impaired leg was supported to the fullest possible extent.Subjects crossed the non-impaired arm and any possible portion of the impairedlimb on the chest.
Timed Leg Raise
One-Arm involvement
Subjects were required to keep one hand in firm contactwith the back of their head and neck at all times.
Two-Arm Involvement
Subjects placed arms tetta backward angle, similar to the$osition assumed by the upper arms when the'hands clasp the head.
One-Leg Involvement
Subjects raised only one leg.
Two-Leg Involvement
Subjects did not participate in this exercise.
One-Arm One-Leg Involvement
Subjects raised one leg and placed one hand behind theirhead/neck area during the leg raise.
90
1
4

64
Tined Trunk Raise
One-Arm Involvement
Subjects were required to keep one hand in contact withthe back of the head and neck at all times.
Two-Arm Involvement
Subjects placed upper limb.; at a backward angle, similarto the position assumed by the upper arms when the hands clasp the head.
One-Leg Involvement
The non-impaired leg was held down and the impaired legwas stabilized to the fullest possible extent.
Two-Leg Involvement
Subjects were supported on the upper thigh and/or buttocks.
One -Arm One-Lei_Involvement
The non-impaired leg was held down at the calf and theimpaired leg was held down at the upper thigh and/or buttocks to the fullestpossible extent. Subjects placed one hand behind their head/neck area duringthe trunk raise.
Right and Left Grip Strength
One-Arm Involvement
Subjects performed the test win the non-impaired arm only.
Two-Arm Involvement
Subjects did not participate in this activity.
One-Leg Involvement
14LvottiAyl
No modifications were consider fic sary.;
7141Two-Leg In
dvolvement ;.
4
No modifications were considered necessary.
One-Arm One-Leg Involvement
Subject,, performed the testtwith the non-impaired arm only.
91

Flexed Arm Hang
One-Arm Involvement
Subjects did not participate in this activity.
Two-Arm Involvement
Subjects did not participate it this actiity.
Ane-Leg Involvement
No modifications were consicered necessary.
Two-Les Involvement
No modifications were considered necessary.
One-Arm One-Leg Involvement
Subjects did not participate in this activity.
Pull-Ups
One-Arm Involvement
Subjects did not participate in this activity.
Two-Arm Involvement
Subj-:ts did not participate in this activity.
One-Leg Involvement
No modifications were considered necessary.
Two-ke Involvement
A A No modifications were conlared neoVrs40 y.
Ve:tplOne-Arm One-Leg Involvement
Subjects oid not participate in this activity.
=din Broad jUMD
One-Arm Invo'vemen.
1
No modifications were considered necessary.
Two-Arm Involvement
No modifications were considered necessary.
92
65

One-Leg Involvement
Subjects were allowed to participate in this activity.If the subject requested arm support during the jump, this assistance wasprovidtd.
Two-Leg Involvement
Subjects did not participate in this activity.
One-Arm One-Leg Involvement
Subjects were allowed to participate in this activity.If the subject requested arm support during the jump, this assistance wasprovided.
Softball Throw
One-Arm Involvement
No monficatious were considered necessary.
Two-Arm Involvement
Subjects did not participate in this activity.
One-Leg Involvement
No modifications were considered necessary.
Two-Leg Involvement
Subjects performed this activity from a seated position ina straight back chair or wheelchair. Subjects were given adequate warm up andtwo oracUce trials. Subjects were instructed to lock their brakes pri,dthrowing.
00- 4le'Armi5ne-Le Inv A
Nth modifications eie considered necessary. },A
ISpeed*
SO-Yard/Neter Dash
. / One-Arm Involvement
)(! / No modifications were considered necessary.
,
Two-Arm Involvement
No wdifications were considered necessary.
93
66

67
One-Leg involvement
Some subjects did not participate in this activity.This test was administered only to subjects who, it was thought, were capableof completing the event in a reasonable period of time (l: seconds or less).
Two-Leg Involvement
Only subjects who used wheelchairs in daily activitieswere tested. These subjects were tested according to one of the followingconditions; moved wheelchair forward with arms, moved wheelchair forward withfeet, or moved wheelchair backward with feet.
One-Arm One-Leg Involvement
Some subjects did not participate in this activity. ThisLt,t was administered only to subjects who, it was thought, were capable ofcompleting the event in a reasonable period .of time (15 seconds or less).
Agility
Rise-to-Stand
One-Arm Involvement
N' modifications were considered necessary.
TwoArm Involvement
Subjects did not participate in this activity.
One-Leg Involvement
No modifications were considered necessary.
1
:ywolLeg Involvement/: ON 0At pa,
.t)
Subjects did` ite in this activity.
II
,
One-Arm One-Leg Involvement's 1'1'
No modifications were considered necessary.
Mat Creep 1;
One-Arm Involvement
No modifications were considered necessary.
Two-Arm Involvement
Subjects did not participate in this activity.
94

68
One-Leg Involvement
No modifications were considered necessary.
Two-Leg Involvement
Subjects did not participate in this activity.
One-Arm One-Leg Involvement
No modifications were considered necessary.
Shuttle Run
One-Arm Involvement
No modifications were considered necessary.
Two-Arm Involvement
Subjects were instructed to bend down at the end lines sothat one knee touched the running surface. This was repeated until the shuttlerun distance was completed (three knee touches and a running finish).
One-Leg Involvement
Some subjects did not participate in this activity.This test was administered only to subjects who, it was thought, were capableof completing the event in a reasonable period of time (30 seconds or less).
Two-Leg Involvement
This test as administered only to subjects who used awheelchair for daily activities. This event was completed ukder one of thefollowingtonditions: moved wheelchair forwa'd with arms, moved wheelchairforwaremith feet, or moved whAlfhair backward with feet. WheelchairpartiOliants wheeled to the wobdeA blocks which were set up on an invertedwastftaket (size ranging from IS inches to 2S inches in height). TIP) subjepi44# up one block and placed it on his/her lap and wheeled back to the stalir"ot. The block then was dropped to the floor behind the starting Iine. Thsnoject returned to the second block, picked it up off the basket, placed itinthe lap, and wheeled as quickly as possible past the start/finish lire tocomplete the shuttle run.
One-Arm One-Leg Involvement
Some subjects did not participate in this activity. Thistest was administered only to subjects who were believed to be capable ofcompleting the event in a reasonable period of time (30 seconds or less).
95

Flexibility
Sit and Reach
One-Arm Involvement
No modifications were considered necessary.
Two -Arm Involvement
Subjects did not participate in this activity.
One-Leg Involveaent
Mo.modifications were couelJeted necessary.
Two -Leg Involvement
Subjects did not participate in this activity.
One-Arm One -Leg_ Involvement
No modifications were considered necessary.
Cardiorespiratory Function
One Mile/Nine-Minute Run, One -and- One -Half Mile/Twelve-Minute Run.11111.,...411NIS
One-Arm Involvement
No modifications were considered necessary.
Two-Arm Involvement
ho modifications were considered necessary.
I./ 4,
One-Leg Involvement
69
Some subjects did not participate in this activity. Thitest was administered onl :' to subjects who were reasonably capable of parti4-pating in this event.
("
Two-Leg Involvement
Only subjects who used wheelchairs in daily activitieswere tested. These subjects were tested according t, one of the followingconditions; .coved wheelchair forward with arms, moved wheelchair forwardwith feet, or moved wheelchair backward with feet.
One-Arm One-Leg Involvement
Some subjects did not participate in this activity. Thistest was administered only to subjects who were reasonably capable of parti:i-pation in 14....s event.
96

I
Static Balance
Modified Stork Test
One-Arm Involvement
Subjects were required to cross the non-impaired armand any poftion of the impaired arm on the chess. The impaired limb was notto be used for balancing purposes.
Two-Arm Involvement
Subjects were required to cross their chest with anyportion of impaired limbs they possessed. Subjects were not allowed toextend their upper limbs as balancing aids.
One-Leg Involvement
No modifications were considered necessary.
Two-Leg Involvement
Subjects did not participate in this activity.
One-Arm One-Leg Involvement.
Subjects were required to cross the non-impaired armand any portion of the impaired arm on their chest. The impaired limb wasnot to be used for balancing purposes.
97
70

71
Participation Guide and Test Modifications forSubjects with Cerebral Palsy
Test modifications for subjects with cerebral palsy are presented inthis section. In addition, the participation guide is presented inTable 2.12. The participation guide for subjects with cerebral palsy wasdeveloped in conjunction with the 1979 classification system of the NationalAssociation of Sports for Cerebral Palsy ; NASCP). The eight NASCP classesare defined on Table 2.13 immediately following the participation guide. Asevident in the participation guide, the more severely involved subjects withcerebral palsy were tested on fewer items than were less severely involvedsubjects. Class i subjects, for instance, were only tested on the bodycomposition measures. Many of the modifications employed with subjects withcerebral palsy were designed to improve the stability of the participant,such as in the softball throw, where subjects could lean against the back of achair or could perform the activities seated. Each test item, QAth appro-priate modification, is discussed separately for subjects with cerebral palsy.
Body Composition
Height and Weight
The height of a subject wearing braces.was taken with the braceon. The height of a subject with exaggerated flexor tone (e.g., spasticparaplegic) was recorded as his/her functional standing height (i.e., noattempt was made to relax and straighten affected parts of the body prior tomeasurement). The height of a wheelchair participant was taken with thesaject lying on a mat.
Wheelchair
wheelchaireither the
The weight of all subjects was taken with bracestemoved.participants were weighed without their wheelchairs.
Testers were instructed to omit height and.weight measures forparticipants if obtaining these measures posed o safety problem tosubject or the tester.
Triceps, Subscapular, and Abdominal Skinfolds
Classes 1 -VII
No modifications were considered necessary.
Muscular Strength/Endurance
Timed Flexed Knee Sit-Ups
Class I
This test was not administered to Class I subjects.
Classes II-VII
No major modifications were considered necessary. Testersattempted to follow regular standardized procedures.
98
7
4.

11.
TABLE 2.12. PARTICIPATION GUIDE FOR SUBJECTS WITH CEREBRAL PALSY.
Participation by SubclassificationWheelchair Ambulant
Test Severe Minimal Severe MinimalI II III IV VA VB VI VII
. Body Composition Measures
Height and Weight XXXXX, 'XXXTriceps Skinfold X X X X X X X X
Subscapular Skinfold X X X X X X X X
Abdominal Skinfold X X X X X X X X
. Muscular Strength/Endurance
Sit-Ups X X X X X X XLeg Raise X X X X X X X
Trunk Raise X X
Right Grip X X X X X X X
Left Grip X X X X X X X
Flexed Arm Hang X X X X X
Pull-Ups X X X X X
Standing Broad Jump X X X
Softball Throw X* X* X*XXXX. Speed
50-Yard/Meter Dash xwc xwc xwc k x x x
. Agility
Rise-to-Stand X X. X
Mat Creep X X X X X X X
Shuttle Runxwc xwc xwc'
. Flexibility
Sit and Reach X x x x
. Cardiorespiratory Function
9-Minute/1 Mile RunOr Xwc X X X X
12-Minute/lh Mile Run
. Static Balance
' Modified Stork Test X X
we - Only subjects whoused a wheelchair for daily activities weretesting on this item..
*Subjects performed this item while seated.
99
72

TABLE 7.13. NASCP CLASSIFICATION SYSTEM (1979)*
Class I
individuals who:
A) Are quadriplegicB) Wheelchair bound, cannot ambulate a long distance without
assistance
C) Pave poor functional strength and severe control problems inthe upper extremities and torso
D) Move their wheelchair with their arms during .track events
Class 1I
lndividuals who:
A) Are quadriplegicB) Wheelchair bound, cannot ambulate without assistanceC) Have poor functional strength and severe control problems in
the upper extremities ane torsoD) Propel thef.r wheelchair using feet during track events
Class III
Individuals who:
A) Are quadriplegic or triplegicB) Ambulate with assistive devices without personal assistance
and/or nee. to use a wheelchair at all times or for regulardaily activities
C) Have fair functional strength and moderate control problems inthe upper' extremities and torso
D) Propel wheelchair with arms during track events
Class IV
lndividuals who:
k' Are paraplegic or triplegic (two legs and one arm or possiblequadriplegic)
B) Ambulate with assistive devices without assistance and/or needto use a wheelchair for convenience in daily activities
C) Have good functional strength and minimal control problems inthe upper extremities and torso (upper extremities may haveexaggerated reflexes)
D) Move wheelchair with arms during track events
*Adopted from: National Association of Sports for Cerebral Palsy, Constitu-tion, Rules Classification, and National Records Sports Manual. NationalAssociation of Sports for Cerebral Palsy, 1979.
100
73

74
TABLE 2.13 (cont..)
Class .VA
Individuals who:
A) Are quadriplegic athetoid (or similar involvement)B) Ambulate without assistive devices during regular daily activitiesC) Will compete in track events on their feet without assistive
devicesD) Have moderate to severe control problems in all extremities and
torsoE) May use a chair for stabilization in non-track events
Class Vg
Individuals who:'
A) Are spastic paraplegic (or similar involvement)B) Utilize cane or crutches in regular daily ambulationC) Will compete in all events on their feet utilizing assistive
devices (i.e., canes/crutches)D) Have good functional strength and minimal control problems in
the. upper extremities and torso (upper extremities may haveexaggerated reflexes)
E) May use a chair for stabilization in non-track events
Class VI
Individuals who:
A) Are quadriparetic athetoid with moderate to minimal controlproblems
B) Ambulate without assistive devices during daily activitiesC) Will compete in track events on their feet without the use of
assistive devicesD) Have moderate to minimal control problems in three or all
extremities and torsoE) May not use a chair for stabilization in non-track events
Individuals who:
A) Are hemi or monoplegic (one arm, possible very minimal quadriplegic)B) Ambulate without assistive devices during daily activities and
are capable of running and jumping freelyC) Will compete in all events on their feet without assistive devicesD) May not use'a chair for stabilization in non-track events
101
O
kI

7S
Timed Leg Raise
Class I
This test was not administered to Class I subjects.
Classes II-VII
No major modifications were considered necessary. Testers14°attempSed to follow regular standardized procedures.\;::
Timed Trunk Raise
Classes I-VB
This test was not administered to Classes I -V8.
Classes VI and VII
No major modifications were considered necessary. Testersattempted to follow regular standardized procedures.
Right and Left Grip Strength
Class I
This test was not administered to Class I subjects.
Classes II-VII
No major modifications were considered necessary, however,only limbs with functional strength were tested.
Flexed Arm Hang .
Classes I-III
This test was not administered to Classes I-III.
Classes IV-VII
This test was administered without modificatin to thefullest possible extent. Where arm involvement prohibited grasping the bar,the bearing of weight or reasonable execution, this item was omitted.
0
Pull-Ups
Classes I-III
This test was not administered to Classes 1-III.
102 ws

Mr
76
Classes IV-VII
This test was administered without modification to the vfullest possible extent. Where arm involvement prohibited grasping the bar,the bearing of weight, or reasonable execution, this item was omitted.
Standing Broad Jump
Classes I-IV
This test was not administered to Classes I-IV.,
Class VA
This test was administered without major modification. If
the subject requested arm support during the jump, this assistance was provided.
Class VB
This test was not administered to Class VB subjects.
Classes VI and VII
No modifications were considered necessary.
Softball Throw
wheelchair.
Class I
This test was riot administered to Class I subjects.
Classes II-IV
Subjects were required to perform the task seated in a
Classes VA and VB
Subjects were allowed to use a chair for stabilizationduring the softball throw.
Classes VI and VII
No major modifications were considered necessary.4
Soeed
SO-Yard/Meter Dash'
Class I
This test was not administered to Class I subjects.
or

77
Classes II-IV
Subjects in these classes completed the task in a wheelchair.The test was only administered to subjects who used wheelchairs in dailyactivities. Subjects propelled their wheelchair either forward or backwardusing the feet or forward using their arms.
Class VA
Subjects were required to ambulate in this event withoutassistive devices.
Class VB
Subjects used a cane, crutch, or walker for this test.
Classes VI and VII
No major modifications were considered necessary.
. Agility
Rise-to-Stand
Classes I-IV
This test was not administered to Classes I-IV.
Class VA
No major modifications were considered necessary, althoughit was permissible for subjects to use a chair to balance after attaining thestand.
Class VB
The test was not administered to Class VB subjects.
Classes VI and VII
No modifications were considered necessary.
gat Creep
Class I
This test was not administered to Class I subjects.
Classes II-VII
No modifications were considered necessary. Any movementto complete the task was permitted. Thus, participants were permitted tocrawl.
104.)

78
Shuttle Run
Class I
This test was not administered to Class I subjects.
Classes II-IV
Subjects completed this task in a wheelchair. They propelledtheir wheelchair either forward or backward using their feet or forward withtheir arms. Subjects wheeled to the wooden blocks which were set up on aninverted wastebasket (size ranging from 15 inches to 25 inches in height). The
subject picked up one block, placed it on his/her lap, and wheeled back tothe starting line. The block then was dropped to the floor behind thestarting line. The subject returned to the second block, picked it up off thebasket, placed -it in the lap, and wheeled as quickly as possible past thestart/finish line to complete the shuttle run.
Classes VA and VB
Instead of picking up blocks from the floor, subjectspicked up blocks from an inverted wastebasket (size ranging from 15 inches to25 inches in height). The subject picked up one block and ran back to thestarting line, dropped the block behind the starting lire, returned to thesecond block, picked it up off the basket, and ran as quickly as possible pastthe start/finish line to complete the shuttle run.
Classes VI and VII
No modifkations were considered necessary.
. Flexibility
Sit and Reach
Classes I-III
This test idS not administered to Classes I-III.
Classes, IV and VA
No modifications were considered necessary.
Class VB
This test was not administered to Class VB subjects.V
Classes VI and VII
No modifications were considered necessary.
.105
G-

p
C)
79
Cardiorispiratory Function
One Mile/Nine-Minute Run, One-and-One-Half Mile/Twelve-Minute Run
Classes I-III
This test was not administered to Classes I-III.
Class IV
Subjects in this classification were required to use awheelchair for this event and to propel it forward with their arms.
Class VA
Subjects were required to ambulate in this event withoutassistive devices.' r
Class VB
Subjects used a cane, crutches, or a walker for this test.
Classes VI and VII
Subjects were required to ambulate in this event withoutassistive devices.
Static Balance
Modified Stork Test
Classes I-VB
This test was not administered to Cl. ses I-VB.
Classes VI and VII
No modifications were considered necessary.
106 I

Partici ation Guide and Test Modifications for
80
Subjects with Spinal Neuromuscular Conditions
Test modificAtions for subjects with spinal neuromuscular conditionsare presented in this section, In addition, the participation guide is 4\
presented in Table 2.14. The participation guide used for subjects with --
spinal neuromuscular conditions was dev.eloped in conjunction with theclassification system of the National Wheelchair Athletic Association (NWAA).The NWAA system can be found in Table 2.1S immediately following the participa-tion guide; however, for the purposes of test selection, testers needed onlyio determine whether the subject was quadriplegic or paraplegic. Paraplegicsubjects participated in a greater number of test items. The test items forsubjects with spinal neuromuscular conditions-generally were modified to allowfor wheelchair participation. Each test item with appropriate modificationis discussed separately for subjects with spinal neuromuscular conditions.
Body Composition
Height and Weight
The height of a subject wearing braces was taken with,the braceson. The height of a wheelchair participant was taken with the subjeCt lyingon a mat, if possible.
The weight of all subjects was taken with orates removed.Wheelchair participants were weighed without their wheelchairs.
CI
Testers Were instructed to omit height and weight measures forwheelchair participants if obtaining these measures posed a safety problemto either the subject or the tester.
Triceps, Subsca ular and Abdominal Skinfolds
Quadriplegic and Paraplegic Involvement
Some subjects needed to be supported while skinfoldmeasurements were being taken. Abdominal and subscspular measures were takenfrom a seated position.
Muscular Strength/Endurance
Sit-Ups, Leg Raise, Trunk Raise
Quadriplegic and Paraplegic Involvement
Subjects were not te d on these items
Right and Left Grip Strength
Quadriplegic Involvement
Subjects were not tested on these items.
107

81
TABLE 2.14. PARTICIPATION CUIDE FOR SUBJECTS WITH SPINAL eUROMUSCULARCONDITIONS.
Participation by SUbc151illIWErOn
TestQuadriplegic cParaplegic or
Comparable7Disaality.(Complete orIncomplete)*IA 18 IC
(Complete or Incomplete)*II III IV V
1. Body Composition Measures
Height and Weight r X X X X X X
Triceps Skinfold X X X X X X XSubscapular Skinfold X X X X X X X
Abdominal Skinfold X X X X X . X X
2. Muscular Strength/Enduranc
Sit-UpsLeg RaiseTrunk RaiseRight Grip X** X** X** X**
Left Grip X** X** X** X**..
Flexed Arm Hang X X X X
Pull-Ups X X X X
Standing Broad Jump
3.
Softball Throw
Speed
X** X** X** X** X** X*, X**
SO-Yard/Meter Dash XWC
XWC
XWC
XWC
4. Agility
Rise-to-StandMat CreepShuttle Run
WCX
WCXWC WC XWCWC WC ATX
WCX
S. NoFlexibility
Sit and Reach
6. Cardiorespiratory Function
9-Minute/1 Mile Runor X
wcXwc
Xwc
XWL
XWC
XWC
XWC
12-Minute/11/2 Mile Run
7. Static Balance
Modified Stork TestEIMMII.=1111 IIMMR1
we - Only subjects who used wheelchairs in daily activities were tested.onthis item.
*It was not necessary' to classify subjects into seven categories. Testersneeded only to distinguish the quadriplegic and paraplegic.
**Subjects were tested in a seated position a these itt.ns.
108

k
TABLE 2.15. NWAA CLASSIFICATION SYSTEM.*
82
Class IA
All cervical lesions with complete or incomplete quadriplegia whohave involvement of upper extremities, weakness of triceps (up to and includinggrade 3 on the testing scale) and with severe weakness of the trunk and lowerextremities interfering significantl) with trunk balance and the ability towalk.
Class IS
All cervical lesions with complete or incomplete quadriplegia whohave involvement of upper extremities but less than IA with preservation ofnormal or good triceps (4 or 5 testing scale) and with a generalized weaknessof the trunk and lower extremities interfering significantly with trunkbalance and the ability to walk.
Class IC
All cervical lesions with complete or incomplete quadriplegia whohave involvement of upper extremities but less than IB with preservation of
normal or good triceps (4 or 5 on testing scale) and normal or good fingerflexion and extension (grasp and release) but without intrinsic hand functionand with a generalized weakness of the trunk and lower extremities interferingsignificantly with trunk balance and the ability to walk.
Class II
Complete or incomplete paraplegia below T1 down to and including T5or comparable disability with total abdominal paralysis or poor abdominalmuscle strength (0-2 on testing scale) and no useful trunk sitting balance.
Class Ill
Complete or incomplete paraplegia or comparable disability belowTS down to and including T10 with upper abdominal and spinal extensor muscula-ture sufficient to provide some element of trunk sitting balance but not normal.
Class IV
Complete or incomplete paraplegia or comparable, disability belowT10 down to and including L2 without quadriceps or very weak quadriceps witha value up,p) and including 2' on the testing scale, and gluteal paralysis.
Class V
Complete or incomplete paraplegia or comparable disability belowL2 with quadriceps in grades 3-5.
*Adopted from: National Wheelchair Athletic Association: Constitution andRules, Training Techniques and Records. National Wheelchair Athletic Association,40-24 62nd Street, Woodside, N.Y., 11377.
109
0:

Paraplegic Involvement
Subjects were allowed to be tested in their wheelchairs.
Flexed Arm Hang and Pull-Ups
Quadriplegic Involvement
Subjects were not tested on these items.
Paraplegic Involvement
Where possible, bars were lowered so that wheelchairparticipants could pull themselves out of their wheelchairs for these items,otherwise subjects were lifted to the bar. Careful spotting was employedat all times.
Standing Broad Jump
Quadriplegic Involvement
Subjects were not tested on this itei
Paraplegic Involvement
Subjects did not participate on this item.
Softball Throw
Quadriplegic and Paraplegic Involvement
Subjects in wheelchairs were tested on the softball throw
from a seated position. Subjects in wheelchairs were instructed to locktheir brakes prior to throwing.
Speed
SO-Yard/Meter Dash
Quadriplegic Involvement
Subjects were not tested on this item.
Paraplegic Involvement
Subjects completed the SO-yard/meter dash in a wheelchair
under one of the following conditions: moved wheelchair forward with arms,moved wheelchair forward with feet, or moved wheelchair backward with feet.Only subjects who used a wheelchair for daily activities were tested.
110
83
84
Agility
Rise-to-Stand and Mat Creep
Quadriplegic and Paraplegic Involvement
Subjects were not tested on these items.
Shuttle Run
Quadriplegic and Paraplegic Involvement
Subjects who used a wheelchair for daily activities parti-cipated in the shuttle run using this method of ambulation. The subject wheeledto the two wooden blocks which were set up on an inverted wastebasket (sizeranging from IS inches to 25 inches in height). The subject picked up oneblock, placed it on his/her lap, and wheeled back to the starting line. Theblock then was dropped to the floor behind the starting line. The subjectreturned to the second block, picked it up off the basket, placed it in theirlap, and wheeled as quickly as possible past the start/finish line to completethe shuttle run.
flexibility
Sit and Reach
222driplegicand_Earaplegic Involvement
Subjects were not tested on this item.
Cardiorespiratory Function
One Mile/Nine-Minute Run, One-and-One-Half Mile/Twelve-Minute Run
Quadriplegic and Paraplegic Involvement
Subjects who participated in this test utilized a wheel-
chair. Only subjects who used a wheelchair for their daily activi:cies weretested. The test was conducted under one of the following conditions: movedwheelchair forward with arms, moved wheelchair forward with feet, or movedwheelchair backward with feet.
StatiC Balance
Modified .Stork Test
Quadriplegic and Paraplegic Involvement
Subjects were not tested on this item.
111
4'
tj-y,

85
Data Recording and Review
Project UNIQUE testers were provided with two forms for the purpose ofdata recording--data sheets and scan sheets. Data sheets were used in the
field during the actual conduct of testing. Data sheets provided clearly
labeled areas for demographic and performance information. The units ofmeasure (feet, seconds, etc.) for each test item were also specifiee. Testers
were instructed to compute all averages and conversions (i.e., feet to inches)
on the data sheets.
Once the data sheets were completed, testers transferred the demographicand performance data to computer scan sheets. As with the data sheets, thescan sheets clearly labeled required information and presented units ofmeasurement to facilitate data transfer. Testers were instructed to submit
both the data sheets and scan sheets to project personnel in Brockport.
When the data arrived at the SUNY, College at Brockport, they were care-
fully reviewed by project staff. All averages and data conversions were checked
individually. Also, data from each test site were entered into the computer,analyzed as grouped data, and the printout reviewed for additional errors.In instances where questions arose concerning the validity of the data, testerswere contacted and the problems discussed. In cases where it was found thattest procedures had been violated in some way, the data in question were
not included in data analysis. Considerable effort was made to insure that
only accurate data were used in the study.
Training Program for Testers
All Project UNIQUE testers were required to participate in the competency-based Project UNIQUE Training Program designed to develop the skills andknowledge necessary to effectively implement the testing protocols of the
study. The training program, which required approximately four hours, presentedthe overview and scope of the study; the organizational structure for datacollection; definitions and classifications of subjects; a description of
test items and how they were administered; test modifications; samplingprocedures; an explanation of unique testing equipment and supplies; andmethods of data recording. Field testers were provided with a 1S8-page manualdetailing this information which testers could take with them and use as areference as they performed their duties as field testers. Each training
session was conducted by a trainer who had previously attended a trainingsession, demonstrated the required competencies, and was considered qualifiedto train others in the procedures of the study. Trainers were provided and
followed an outline of the training program to standardize training procedures.
The purpose of the training session was to provide testers with the
following competencies:
1. Understand the purposes'and general procedures of Project UNIQUE.
2. Understand the purpose of each test item.
3. Understand the specific testing procedures for normal and impairedpopulations.
112

86
4. Understand the specific test modifications for the various impairedpopulations.
S. Demonstrate the ability to set up and utilize unfamiliar pieces ofequipment to be used for data collection.
.6. Demonstrate the ability to record data accurately on the data recordingsheet.
7. Demonstrate-the ability to accurately transfer and code data from thedata recording sheet to the scan sheet.
8. Understand the sampling procedures to be employed in subject selection.
To determine whether competencies had been attained, two types ofevaluations were required of trainees. First, trainees were required todemonstrate test related skills at the conclusion of the training session.This demonstrative evaluation required accurate completion of Project UNIQUEscore sheets, accurate transfer of data to' Project UNIQUE scan sheets, andappropriate administration of the skinfold test, the sit and reach test, andthe grip strength test. The ability to administer the skinfold test, the sitand reach test, and the grip strength. test was evaluated because it was feltthese tests were relatively unfamiliar to many professionals. Trainees were'graded on a SO -point scale during their demonstrative evaluation. Pointswere awarded as follows:
Demonstrative Evaluation
Competency Points
Data Recording Capability (score sheets) 16
Data Transfer Capability (scan sheets) 16
Skinfold Assessment 6
Sit and Reach Assessment 6
Grip Strength Assessment 6
50
In evaluating data recording and data transfer capabilities, score sheetsand scan sheets were divided into eight sections. Trainees received twopoints for each section where data were accurately recorded or transferred.The data were provided by the trainer. For the test administration competencies,specific criteria were listed. These competencies are given below:
Skinfold Competencies
1. Proper identifiOation of the abdominal area.2. Proper 'identification of the triceps area.3. Proper identification,of the subscapular area.4. Separation of skinfold from muscle tissue.5. Proper placement of guide dots for measurement.6. Reliability in measures (less than S percent error),
113

87
Sit and Reach Competencies
1. Subject placed in a seated position, legs extended on mat.2. Subject's shoes removed, knees held down, feet flush against apparatus.3. Subject advised not to bob before reaching.4. Tester begins activity properly with hand/verbal signal.S. Reach held for one second while score is recorded.6. Score recorded, accurately to nearest centimeter.
Grip Strength Competencies
1. Testing instructions performed properly.2. Hand dynamometer adjusted so that handle is gripped with fingers
(second joint) and the heel of thu hand is placed at the base of thedynamometer with the thumb wrapped around the base.
3. Subject,seated properly with arms free from the chair.4. Activity begun properly with hand/verbal signal. Hands alternated
during test trials.S. Score recorded accurately (trials and mean).6. Each subject provided three trials, alternating with each hand.
The second type of evaluation required.of trainees was the completion ofa written examination. This written evaluation consisted of 50 multiple choicequestions' rvilated to the purpose of the project, general test procedures,general test instructions, specific test modifications, and sampling procedures.Trainees were asked to submit answers to the written evaluation some timeafter the completion of the training session and before their scheduled dateto begin testing. The written evaluation was also based on a.50-point scale.Points were awarded as follows:
Written Evaluation
Competency
Number ofQuestions/Points
Purpose of the Project 3
General Test Procedures 14
General Test Instructions 14
Specific Test Modifications 14
Sampling Procedures- S50
The complete training program evaluation was worth 100 points. Traineeswere required to attain a score of at least 90 points prior to testingsubjects. Those trainees failing to score at least 90 points were givenadditional opportunities to achieve the necessary score.
1,14

I
88
Trend Analysis and Test Reliability
Daquila (1982), in an unpublished Master's Thesis, investigated the trendanalysis and test reliability of all multiple-trial Project UNIQUE test items(skinfolds, rise-to-stand, mat creep, ihuttle'run, stork test, sit and reach,trip strength, flexed arm hang, broad jump, and softball throw) and two single-,trial test items--timed leg raise and timed trunk raise. To analyze multiple-trial items (all trials were administered on the same day), Daquila randomlyselected 50 Project UNIQUE subjects from each of the major subject categories(normal, auditory impaired, visually impaired, and orthopedic impaired). Toprovide data for the two single-trial items, Daquila tested 50 normal, SO audi-tory impaired, and 47 visually impaired subjects. Orthopedically impairedsubjects were not included in this aspect of the study since the timed legraise and timed trunk raise were generally not administered to these subjects.Three trials were administered for both the timed leg raise and timed trunkraiseto each subject during consecutive physical education class periods (twoto three days between trials).
taqukla computed repeated measures analysis of variance (for trendanalysis), Cronbach's alpha coefficient (for reliability), and the standarderror of measurement (for variability) for each item in each major subjectgroup. In some instances, especially in the orthopedic group, it was necessaryto compute these analyses with a sample size of less than 50. The results ofthese analyses are presented. in Table 2.16.
The results presented in Table 2.16 indicate that, in most cases, thedata were trend free,, i.e., a repeated measures analysis of variance did not
,
yield a significant trials effect at the .05 level. A significant trendemerged for sit and reach (all groups), shuttle run (normal group), mat creep(normal group), broad jump(visually impaired group). right and left gripstrength (normal and auditory impaired groups), and left grip strength (ortho-pedically impaired group). With the exception of grip strength, performancegenerally improved on subsequent trials in those cases where trend was present.Effects of learning and/or warm-up may have influenced performance on thoseitems. Fatigud was apparently a factor during grip strength in most, but notall, subject categories, as performance generally declined on subsequent trials.
Generally, the alphh coefficients'presented in Table 2.16 are high, withthe majority above .90. Three coefficients are in the .70's"and only two arebelow .70. The reliability coefficients presented in Table 2.16, in general,
r are higher than those found in other studies for similar items. The item mostunreliable appears to be the modified stork test. While three of the fouralphas are at least minimally acceptable (above .70), the standard errors ofmeasurement are relatively large.indicating that, although subjects generallymaintained their rank in the group, there can be little confidence that themean closely approximates a subject's true score. Despite generally acceptablealphas, therefore, the mean score for the stork test may not truly representthe subject's performance on the test. .
The lowest calculated alpha was associated with the rise-to-stand forthe normal group (.40). This low alpha may be attributed to the short periodof time in which the item was completed (which may have contributed tomeasurement error), and the low range of scores obtained for normal subjects(whi0.)may have reduced the reliability coefficient). Rise-to-stand, however,
115

TABLE 2.16. MEANS, STANDARD ERRORS OF MEASUREMENT, AND ALPHA COEFFICIENTS OF PROJECT UNIQUE RELIABILITY SAMPLES.
TestItems
# ofTrials
Normal Visual Auditory - OrthopedicN X SEM a N X SEM a N X SEM a N X SEM a
Triceps 3 50 12.72 .33 .99 50 13.75 1.04 .97 50. 12.49 .7$ .98 50 12.70 .85 .97Skinfold
Abdominal 3 50 14.14 .54 .99 50 16.68 2.66 .90 50 13.74 .91 .98 49 13.93 .53 .99
Skinfold
Subdcapular 3 50 10.29 .36 .99 50 13.84 .60 .99 50 10.45 .44 .99 50 10.64 .35 .99Skinfold
Rise-io-Stand 3 50 1.38 .38 .40 50 1.88 .22 .91 50 1.67 .16 .90 25 4.39 .51 .93
Mat Creep 50 3.56* .:15 .85 50 4.42 .23 .97 50 3.86 .20 .96 41 10.23 1.22 .97
Shuttle Run 2 50 11.31* .46 .86 50 12.49 .68 .92 50 11.95 2.48 .70 50 34.77 2.04 .99
Stork Test 3 50 46.96 26.92 .89 50 17.15. 10.06 .77 50 9.t9 7.52 .76 22 2.42 2.86 .61
Sit and Reach 2 50 29.19* .95 .99 50 23.22* 1.15 ,98 50 22.95* .94 .99 38 20.93* .97 .99
Right Grip 3 50 24.01* 1.08 .98 50 23.58 1.14 .99 50 23.42* 1.36 O.97 50 14.1.5 1.33 .98
Left Grip 3 50 22.36* 1.04 .98 50 21.17 1.69 .97 50 21.01* 1.21 .98 50 14.86* 1.00 .99
Arm Hang 2 50 8.35 2.188 .93 50 11.48 4.85 .84 50 9.17 3.11 .92 50 2.50. 1.08 .96
Broad Jump 3 50 5.27 .18 .96 50 4.96* .29 .94 50 5.08 .16 .98 21 2.04 .16 .99
Softball Time 3 50 2.13 .24 .84 50 1.88 .26 .88 50 2.03 .22 .88 49 1.05 .14 .94
Soft61all 3 50 92.39 7.62, .95 SO 70.71 4.35 .99 50 84.73 4.11 .99 SO 28.91 4.51 .86, Distance
Leg Raisel 3 50 40.52 9.534 .83 47 41.99 11.34 .91 40 -53.93 9.12 .93
TrunktRaiSe/ 3 50 61.35 13.33 .91 46 47.75 4.57 .99 50' 59.37 11.40 .91.
*Significant trend pre%tni, in the data
.
12-3 days between trials
N - Number of subjects in analysis
X - Mean Score
SEM - Standard Errol* of Measurement
a - alpha coefficient
Daquifa, Cene A. "Reliability of Selected Health and Performance Related Test Items from the Project UNIQUE' Physical Fitness Test Battery." Unpublished Master's Thesis, SUNY College at Brockport, 1.982.
co

90
was founeto be reliable for the visual, auditory, and orthopedic groups(alphas of .90 or above).
It should be noted chat use of the Crontmch alpha is most appropriatefox repeated measures when the dat# are trend free. The alpha coefficientspresented in Table 2.16, however, were calculated using all trials. Thisprocedure was followed because at least two trials are required to computealpha and the number of trials must be sufficient to determine a trend ;freeschedule. Only two trials were administered for the sit and reach and shuttlerun tests, thus requiring all trials to be included in the computation of thealpha coefficient for those items. In the two instances where mat creep andbroad jump demonstrated significant trends, the number of trials were in-sufficitnt to determine a trend -free schedule. For those cases where gripstrength evidenced significant trend, a second set of alphas was calculatedusing trials one and two only. (Trial three was eliminated because it wassignificantly differenthan either trial one or trial two in each instance.)Table 2.17 contrasts the means ad alpha coefficients for the two-trialschedule with the means and alpha coefficients calculated using all trials.
TABLE 2.17. hEANS AND ALPHA COEFFICIENTS OF GRIP STRENGTH TESTS WITHSIGNIFICANT TREND CATEGORIZED BY MEASUREMENT SCHEDULE.
Trials 1, 2, G 3X a
Trials 1 G 2X a
Right .,rip
Non-Impaired 24.01 .98 24.28 .96
Auditory Impaired 23.42 .97 23.85 .95
Left Grip
Non-Impaired .22.36 .98 22.76 .98
Auditory Impaired 21.01 .98 21.25 .98
Orthopedically Impaired 14.86 .99 15.29 .99
The data presented in Table 2.17 demonstrate that modifying the measurementschedule does not appreciably. affect the reliability of the test. The gripstrength test can be considered very reliable for each subject category regard-less of the measurement schedule employed. Project UNIQUE employs the threetrial schedule so that test procedures are consistent for all disabilityclassifications.
Excluding height and weight, four single trial test items were not includedin Daquila's reliability study. These items were as follows: sit-ups, pull-ups,50-yard/meter dash, and long distance run. Previous reselrch has shown theseitems to possess satisfactory reliability (refer to Charn. V for detailedinformation).
118
C

. -C
91
yquipment,
With the exception of a hand dynamometer, skinfold caliper, and a it
and reach apparatus, the equipment employed in this study was typically foundin physical education programs. Specific equipment needed to administer aparticular test is identified in an earlier section of this chapter. Handdynamometers, skinfold calipers, and sit and reach pieces of-equipment wereprovided by the project. To help assure proper functioning of their instruments,field testers were asked, upon receiving test equipment, to check it for damage,obvious malfunction, and performance according to standards identified for theproject. If equipment was damaged and standards were not met, field testerswere asked to return the qiiipment to Brockport.
The hand dynamometer selected for this study was the Smedley-typedistributed by the J.A. Preston Corporation, The dynamometer consisted of ametal frame with an adjustable stirrup on the haldgrip. The minimal accuracyaccepted for using the instrument for testing was ± 5 kg., using an 18 kg. weightas a reference. Thts standard, unfortunately, allowed considerable error inmeasurement, but was required since the instrument appeared to be incapableof greater accuracy.
The Lange skinfold caliper was selected as the fat caliper to be used inthe study. This caliper meets the 10 grams per square millimeter standardgenerally subscribed to in research investigations. Upon receipt from thedistributor (Cambridge Scientific Industries), the Lange skinfold caliperswere checked by the Project UNIQUE staff and were considered acceptable ifthey were within ± 10 percent when measuring standard widths throughout theirrange of measurements. The Lange skinfold calipers were well within thisstandard and were found to be very reliable.
The sit and reach pieces of equipment were constructed locally usingplywood (see Figure 1.13): The top panel was marked with one centimetergradations with the 23 centimeter line exactly in line with the verticalpanel against which the subjects' feet were placed. Each sit and reach apparatuswas checked to determine whether specifications were met and were subsequentlymailed to testers.
119

I CHAPTER III
PHYSICAL FITNESS PERFORMANCE AND PERFORMANCE FACTORS
Introduction
This chapter presents performance scores of subjects on Project UN1QUUtest items, compares performance of different classes of subjects, and analyzesselected factors which have been hypothesised to affect performance. Thefirst part of the chapter presents means and standard deviations on ProjectUNIQUE test items which havt< been obtained by normal subjects and subjects withvisual impairments, auditory impairments, amputations and congenital anomalies,cerebral palsy, and spinal neuromuscular impairments. Means and standarddeviationi are presented ?or each test item, at each age (10 to 17), for malesand females and. for sexes combined.
The second major iectIon of this chapter presents and analyzes the effectsof groups/conditions, age, and sex on phySical fitness test performance. Theapproach used is to present this analysis in three subsections. In the first,individuals with auditory and visual impairments are contrasted with eachother and with the normal subjects for.each test item. In the next subsection,the cerebral palsy sample is compared with the normal sample for each testitem. .Finally, normal individuals and subjects with spinal neuromuscularconditions are contrasted. Multivariate and univariate analyses Of variancewere used to investigate performance differences as a function of subjectgroups/conditions, sex, and age.
The third major section of this chapter analyzes the effects of severity'and onset of handicapping condition and methods of ambulation on physical fitness,test performance. Multivariate and univariate analyses of variance and co.variance were used to investigate the significance of age of onset of handi-capping condition (visually impaired group only), methods of ambulation(visually impaired and cerebral palsy groups only), and community size oreducational environment.
The final section of this chapter presents descriptive informaticopertaining to the magnitude of differences between individuals with handicappingconditions and normal subjects (expressed in standard deviation units) onphysical fitness rest items, the variability of performance on test items, andthe percent of subjects with handicapping conditions scoring higher than medianvalues of normal subjects on Project UNIQUE Physical Fitness Test item.
Means and standard deviations are presented for all test items originallyselected for the study. Further analyses, however, were performed on selecteditems only. Sum of the skinfolds-and sum of the grip strengths were not analyzedfurther since the itemswhich comprised these variables were analyzed separately.Rise-to-stand and stork test were excluded from further analysis due to low reli-ability. Fifty-meter dash and softball throw for velocity were not analyzedfurther due to their clo;e relationship to other variables in the study (SO-yarddash and softball throw for distance).
92
120

)
93
Descriptive statistics were calculated for subjects with congenitalanomalies and amputations and these results are presented in this chapter.Due to the relatively low number of subjects in this group (N=62), however,no attempt uos made to analyze these data using inferential techniques.
Means and Standard Deviations ofProject UNIQUE Physical Fitness Test items
;s was mentioned above, the first section of this chapter presents meansand standard deviations of Project UNIQUE test items obtained by the majorsubgroups involved in the study. In the subsequent tables, information ispresented for each test item originally selected for the study. Information
is specifically given for males and females at each age from 10 to 17.Information presented is regard to individuals with amputations and congenitalanomalies is combined, i,e., it is not separated by these conditions. Meansand standard deviations presented relative to individuals with spinal neuro-muscular impairments must be carefully considered. Data which are presentedrelative to skinfold and softball,test items includes all subjects classifiedat spinal neuromuscular. Means and standard deviations presented relative togrip strength, flexed arm hang, and pull-ups includes all subject., clarsifiedas spinal neuromuscular except for quadriplegics. Data pertaining to theSO-yard .nd SO-meter dashes, the shuttle run, and long distance run includeonly subjects classified as spinal neuromuscular and who performed these testitems in wheelchairs.
121
o

94
MLLE 3.1. MEANS AND STANDARD DEVIATIONS OF PROJECT UNIQUE TEST ITiMSOBTAINta ON NORMAL INDIVIDUALS.
Variable Age MeanFemale
SD N MeanMaleSD N
- -Cabined
Mean SD N
Tricep 10 11.9 6.2 t1 12.9 5.7 69 12.4 5.9 130Skinfold 11 9.4 6.0 4S 11.8 4.1 60 10.8 5.1 105
Omm.) 12 12.9 6.5 100 13.8 5.3 82 13.3 6.0 182
13 14.8 6.R 126 13.4 6.6 48 14.4 6.8 174
14 15.4 7.7 130 11.0 4.3 33 14.5 7.3 163 -
15 14.6 6.6 63 12.S 4.7 56 13.8 5.8 119
16 14.2 6.9 67 11.2 4.0 69 1Z-7 5.8 136
17 12.0 5.9 24 11.4 5.7 34 11.6 5.7 S8
Entire 13.8 7.0 616 12.5 5.2 451 13.2 6.3 1067
Abdominal 10 11.7 7.0 61 10.5 0.3 68 11.1 6.6 129
Skinfold 11 10.0 6.6 45 9.7 5.0 60 9.8 5.7 '05
(mm.) 12 13.7 9.0 99 12.5 6.1 81 13.2 7.8 180
13 16.1 8.2 125 13.S 9.1 48 15.4 8.5 173
L4 17." 9.1 130 11.1) 6.2 33 16.0 8.S 163
15 14.5 8.5 63 14.2 8.7 56 14.3 8.5 119
16 12.7 6.8 67 11.3 4.5 69 12.0 5.7 136
17 12.4 6,9 24 12.b 5.2 34 12.6 5.9 58
Entire 14.4 8.4 614 11.9 6.6 449 13.3 7.8 1063
Subscapular 10 9.4 4.8 61 . 9.1 5.3 69 9.2 5.1 130
Skinfold 11 b.4 5.1 45 8.1 3.7 60 8.2 4.3 105
(m.) 12 10.1 5.0 99 9.9 4.4 82 1C.0 4.8 181
13 .12.4 6.3 12S 10.9 7.2 47 12.0 6.6 172
14 12.6 6.2 130 10.1 4.8 33 12.1 6.0 163
15 11.5 5.8 63 11.3 4.4 56 11.4 5.2 219
16 10.8 4.4 67 10.3 3.8 69 10.5 4.1 13617 10.2 5.3 24 12.1 4.8 34 11.3 5.1 58
Entir.2 11.1 5.7 614 10.0 4.9 450 10.7 5.4 1064
Sum of 10 21.3 10.6 61 22.0 10.5 69 21.7 10.5 130
Triceps 11 ' 17.8 10.5 45 19.9 7.1 60 19.0 8.7 105
and Sub- 12 23.0 11.2 99 23.7 9.1 82 23.5 10.3 181
scapular 13 27.2 12.6 125 24.2 13.3 47 26.4 12.8 172
Skinfolds 14 28.1 13.1 130 21.1 8.0 33 26.7 12.6 163
(mm.) 15 26.0 11.3 63 24.2 8.3 56 25.2 10.0 119
16 25.0 10.1 67 21.5 7.3 69 23.2 8.9 136
17 22.2 9.8 24 23.4 10.0 34 22.9 9.9 58
Entire 24.9 12.0 614 22.5 9.3 450 23.9 11.0 1064
122
J.
A

t.
95
TABLE 3.1. (cont.)
[Variable Age MeanFemaleSD N Mean
MaleSD N
CombinedMean SD N
Sit-Ups 10- 32.9 7.4 70 35.6 7.8 76 34.3 7.7 146(no.) 11 32.4 9.5 62 38.7 10.2 69 35.7 10.3 131
12_
35.0 8.6 114 39.7 10.3 92 37.1 9.7 20613 36.6 8.5 131 40.7 10.3 53 37.8 9.2 184
14 34.2 9.0 132' 46.6 6.7 37 36.9 10.0 169
15 36.7 10.8 64 47.8 8.6 58 42.0 11.3 12216 35.9 10.9 71 46.3 9.2 69 41.1 11.3 14017 34.8 11.9 28 41.3 12.5 36 38.5 12.6 64
Entire 34.9 9.3 672 41.6 10.3 490 37.7 10.3 1162
Leg Raise 10 26.0 19.2 68 32.2 23.7 77 29.3 21.8 145
(sec.) 11 28.3 21.9 59 32.9 24.2 68 30.7 23.2 127
12 33.2 20.7 108 35.8 29.9 90 34.4 25.3 198
13 32.8 24.7 131 36.9 23.3 51 33.9 24.3 182
14 35.5 27.9 132 48.6 29.8 37 38.4 28.7 169
15 45.1 36.3 62 61.5 41.0 59 53.1 39.4 121
16 43.3 30.8 68 56.4 34.0 72 50.0 33.0 140
17 39.6 30.5 30 59.1 40.7 36 50.3 37.5 66
Entire 34.9 26.8 658 43.7 32.7 490 38.6 29.8 1148
Trunk Raise 10 49.2 41.6 64 44.2 35.4 72 46.5 38.4 136
(sec.) 11 54.3 39.3 61 56.6 47.3 66 55.5 43.4 127
12 44.8 34.8 106 46.1 30.8 89 45.4 33.0 195
33 43.8 31.2 129 52.1 32.2 51 46.1 31.6 180*
14 47.9 32.1 126 52.5 28.1 37 49.0 31.2 163
15 57.9 35.8 63 45.4 32.0 56 52.0 34.5 119
16 60.3 37.6 69 54.8 40.2 69 57.6 38.9 138
17 64.9 40.4 28 48.1 29.2 34 55.7 35.5 62
Entire 50.3 35.9 646 49.8 35.7 474 50.1 35.8 1120
Right Grip 10 12.2 4.5 62 15.8 4.8 61 14.0 5.0 123(kg.) 11 15.0 5.1 47 18.2 5.0 44 16.5 5.3 91
12 19.3 6.0 92 20.9 4.3 63 19.9 5.4 155
13 21.9 6.4 130 26.5 8.9 53 23.2 7.5 183
14 24.1 6.7 132 34.2 9.5 38 26.4 8.5 170
15 28.1 6.2 64 41.0 9.2 57 34.2 10.1 121
16 28.5 6.2 68 45.1 9.0 68 36.8 11.3 136
17 27.1 6.7 28 44.9 10.1 34 36.9 12.4 62
Entire 22.1 7.9 623 30.4 13.8 418 25.4 11.4 1041
123

/
J
/
TABLE cont
.v
96
Variable Age MeanFemaleSD N Mean
MaleSD N
CombinedMean SD
Left Grip, 10 10.4 ,4.4 62 14!.1 4.4 61 12.2 4.7 123
(kg.) 11 13.3 4.6 46 16.4 4.3 43 14.8 4.7 89
12 .17.0 6.0 92 18.0 4.7 63 17.4 5.5 155
13 19.7 6.8 130 22.4 9.4 53 20.5 7.7 183
14 20.2 5.9 132 30.1 10.0 38 22.4 8.1 170.
15 24.4 6.1 64 38.0 8.1 57 30.8 9.8 121
16 25.1 5.2 k8 41.3 8.9 68 33.2 10.9 136
17 23.6 6.7 28 39.5 9.4 34 32.3 11.4 62
Entire 19.3 7.3 622 27.2 13.1 417 22.4 10.7 1039
Sum of 10 22.6 8.5 62 29.9 8.8 61 26.2 9.4 123
Grips 11 28.3 9.5 46 34.6 9.0 43 31.4 9.7 89
(kg.) 12 36.2 11.6 92 38.9 8.6 63 37.3 10.5 155
13 41.6 12.7 130 48.8 -18.0 53 43.7 14.7 183
14 44.3 12.0 132 64.3 19.0 38 48.8 16.1 170
15 52.5. 11.8 64 79.0 16.9 57 65.0 19.5 121
16 53.6 10.8 68 86.4 17.4 68 70.0 21.9 136
17 50.8 12.8 28 84.4 18.9 34 69.2 23.5 62
Entire 41.4 14.7 622 57.7 26.6 417 47:9 21.9 1039
Arm Hang 10 10.1 12.1 69 16.9 22.9 72 13.6 18.7 141
(sec.) 11 12.7 13.9 56 23.5 25.6 64 18.5 21.5 120
12 '10.6 13.0- 104 18.3 16.5 79 13.9 15.0 183
13 7.0 8.4 130 24.0 27.1 49 11.6 17.5 179
14 7.4 8.2 132 13.2 8.4 34 8.6 -8.5 166
15 8.9 8.2 63 18.6 11.7 57 13.5 11.1 120
16 8.8 11.3 67 22.9 11.9 69 15.9 13.6 13417 5.2 7.6 30 18.7 11.3 34 12.4 11.8 64
Entire 8.8 10.6 651 19.8 18.9 458 13.3 15.6 1109
Pull-Ups 10 1.2 2.3 67 2.2 2.3 77 1.7 . 2.3 144
(no.) 11 1.4 2.6 59 3.1 3.0 67 2.3 2.9 12612 1.0 1.5 104 3.0 2.9 89 1.9 2.5 19313 0.6 1.5 128 3.7 3.1 51 1.5 2.5 179
14 0.4 1.2 125 4.6 3.3 27 1.2 2.4 15215 0.9 2.4 62 5.3 3.8 57 3.0 3.8 11916 0.6 1.4 66 7.0 3.7 68 3.9 4.3 13417 0.7 1.1 31 6.2 4.2 36 3.6 4.2 67
Entire 0.8 1.8 642 4.2 3.6 472 2.2 3.2 1114
124

.o.
97 ,
TAbLE 3.1. (cont.
Yuriaule Age MeanFemale
SD N MeanMaleSD N
Combined
Mean SD h
Broad Jump 10 52.3 6.9 70 59.0 7.1 74 55.7 7.7 144
(incites) 11 54.8 $.6 60 63.3 8.1 65 59.2 9.4 125
12 60.0 8.5 100 62.8 8.5 79 61.2 8.6 17913 61.5 9.2 130 67.3 8.7 52 63.2 9.4 182
14 62.7 10.0 127 74.1 10.4 35 65.1 11.1 162
15 63.8 8.3 63 '81.3 9.5 58 72.2 12.5 121
16 64.4 9.8 68 82.4 10.6 71 73.6 13.6 139
17 63.2 11.8 31 81.1 12.3 37 73.0 15.0 68Entire 60.5 9.8 649 70.3 13.0 471 64.6 12.3 1120
Softball 10 576.3 187.7 68 997.1 237.2 74 795.6 300.7 142
Distance 11 583.2 231.9 45 1094.4 248.2 57 868.9 350.2 102
(inches) 12 823.5 328.9 78 1211.9 342.8 57, 987.5 385.1' 135
13 874.1 319.2 119 1427.8 463.8 42 1018.5 435.6 161
14 856.4 333.6 125 1640.9 407:4 35 1028.0 477.6' 160
15 938.5 292.3 63 1935.0 403.5 60 1424.6 610.2 '12316 898.5 292.0 50 1876.3 574.1 72 1475.6 679.0 122
17 995.3 328.1 26 2040.8 600.1 30 1555.4 718.0 56Entire 820.0 323.9 574 1487.3 565.1 427 1104.6 552.4 1001
Softoall 10 41.5 5.7 30 52.3 7.4 35 47.3 8.6 65Velocity 11 41.8 3.4 7 57.0 8.1 26. 53.7: 9.6 33
(feet per 12 51.5 12.4 59 62.2 10.1 36 S5.5 .12.6 95
second) 13 50.6 11.3 96 62.3 9.9 16 S2.3 .11.8 112
14 47.9 9.2 111 64.8 8.4 23 50.8 11.1 134
15 50.3 9.4 44 71.5 7.9 49 61.5 13.7 93
16 50.4 8.2 31 70.2 12.4 55 63.1 14.6 8617 63.5 17.5 2 71.4 12.0- 13 70.3 12.4 15
Lntire 49.1 10.4 380 64.6 11.8 253 55.3 13.3 633
50 -Yard 10 9.2 0.9 69 8.S 04 75 8.8 0.9 144.
Dash 11 8.9 1.1 58 8.2 0.8 69 8.5( 1.0 127(sec.) 12 8.3 0.8 104 8.2 0.9 90 8.3 0.8 194
13 8.3 0.9 130 7.7 0.8 50 8.1 0.9 18014 8.4 1.7 125 6.8 0.8 33 8.1 . 1.7 15815 8.3 1.3 63 6.7 0.6 60 7.5 1.3 12316 8.2 1.4 61 6.8 0.6 74 7.4' 1.3 135
17 8.3 1.2 28 7.1 1.1 33 7.7 1.3 61
Entire 8.4 1.2 638 7.6 1.1 484 8.1 1.2 1122 '
125
,

a
0
98
TABLt 3.1.
cont.
Variable
Age
Mean
Female
SD
NMean
Male
SD
N
Combined
Mean
SD
N
50-Meter
10
10.1
1.0
69
9.4
0.9
75
9.7
1.0
144
dash
11
9.8
1.2
58
9.0
0,9
69
9.4
1.1
127
(sec.)
12
9.0
0.8
104
9.0
0.9
90
9.0
0.8
194
13
9.0
0.9
130
8.6
0.8
50
8.8
0.9
180
14
9.1
1.9
123
7.6
1.0
33
8.8
1.8
156
15
9.0
1.6
61
7.5
0.6
60
8.2
1.4
121+
16
9.1
1.5
62
7.5
0.7
74
8.2
1.4
136
17
9.7
1.4
28
7.9
1.3
33
8.7
1.6
61
Entire
9.2
1.4
635
8.4
1.2
484
8.9
1.3
1119
Rise-to-
10
1.7
0.5
61
1.6
0.4
61
1.7
0.4
122
'Stand
11
1.7
0.4
49
1.5
0.4
49
1.6
0.4
98
(sec.)
12
1.7
0.4
109
1.6
0.4
88
1.6
0.4
197
13
1.6
0.5
129
-1.5
0.5
50
1.6
0.5
179
14
1.7
0.5
133
1.3
0.3
37
1.6
0.5
170
15
1.5
0.4
64
1.3
0.3'
59
1.4
0.4
123
16
1.6
0.5
71
1.3
0.5
75
1.5
..;.5
146
17
1.5
0.4
29
1.5
0.5
35
1.5
0.4
64
Entire
1.6
0.5
645
1.5
0.4
454
1.6
0.5
1099
Mat Creep
10
4.1
0.6
66
3.7
0.7
77
3.9
0.7
143
(sec.)
11
4.0
0.8
57
3.6
0.5
(IS
3.8
0.7
122
12
4.2
0.7
108
3.8
0.5
85
4.0
0.7
193
13
4.2
0.8
128
3.5
0.5
53
4.0
0.8
181
14
4.3
1.0
130
3.2
0.4
37
.0
1.0
167
15
4,0
0.8
64
3.3
0.6
58
3.6
0.8
122
16
4.1
0.9
70
3.3
0.6
70
3.7
0.9
140
t.
17
4.4
1.3
28
3.7
0.9
35
4.0
1.1
63
-Entire
4.2
0.9
651
3.5
0.6
480
3.9
0.8
1131
.
.
Shuttle
10
11.7
0.8
62
11.3
1.0
67
11.5
0.9
129
Run
11
11.6
1.0
42
11.1
0.9
60
11.3
1.0
102
(sec.)
12
11.5
1.0
99
11.2
1.1
78
11.3
1.0
177
13
11,6
0.9
128
11.1
0.8
51
11.5
0.9
179
14
11.5
1.2
128
10.2
0.8
36
11.2
1.2
164
'
15
11.1
1.1
63
10.0
1.1
57
10.5
1.2
120
16
11:4
1.4
64
9.8
0.9
68
10.6
1.4
132
17
11.6
1.3
28
10.3
1.4
34
10.9
1.5
62
Entire
11.5
1.1
614
10.7
1.2
451
11.1
1.2
1065
126
41

99
TULE 3.1. cont.
Variable Age MeanFemale.SD N Mean
MaleSD N
CombinedMean SD N
Sit and 10 28.4 6.3 70 24.0 6.3 77 26.1 6.6 147
Reach 11 28.0 7.0 60 22.4 7 0 68 25.0 ,7.5 128
(cm.) 12 28.9 8.5 113 23.3 6.4 91 26.4 8.1 204
13 32.4 7.3 130 22.7 6.3 53 29.6 8.3 183
14 32.2 8.4 134 27.5 8.5 37 31.2 8.6 171
15 32.4 8.5 63 26.9 9.3 59 29.7 9.3 122
16 34.0 7.8 70 28.3 8.9 71 31.1 8.8 141'
17 33.5 6.6 28 27.8 7.7 35 30.3 7.8 63Entire 31.2 8.0 668 25.0 7.8 491 28.6 8..5 1159
.
Long 10 251.8 184.3 71 269.3 173.8 77 260.9 178.6 148
Distance 11 354.9 219.6 62 355.5 193.0 69 355.2 205.6 131
Run 12 391.2 218.1 115 357.4 205.2 93 376.1 212.6 208(Yards per 13 246.0 179.6 131 353.8 203.8 53 277.1 192.6 184Minute) 14 273.7 195.9 135 520.8 156.9 38 327.9 213.8 173
15 '195.3 125.8 64 256.1 121.5 61 225.0' 127.0 125
16 213.2 136.1 72 305.5 1F9.4 80 261:8 155.3 152
17 288.8 189.2 31 316.8 160.7 40 304.6 173.0 71
Entire 280.2 196.4 681 332.2 187.3 511 302.5" 194.2 1192r.Stork 10 20.5 29.6 68 15.2 12.2 75 17.7 22.3 143
Stand 11 39.7 95.8 60 26.4 28.0 65 32.7 69.4 125
(sec.) 12 43.3 51.8 111 29.2 39.9 87 37.1 47.3 198
13 57.5 74.0 131 46.8 44.6 51 54.5 67.1 182
14 35.3 31.9 131 41.8 52.1 37 36.7 37.2 168
15 36.3 46.9 62 39.0 77.8 58 37.6 63.5 120
16 32.5 35.3 70 34.6 29.2 69 33.5 32.3 139
17 26.7 24.9 28 44.5 38.6 36 36.7 34.3 64
Entire 39.3 55.8 661 32.6 43.4 478 36.5 51.0 1139
4-
-127

100
TABLE 3.2. MEANS AND STANDARD DEVIATIONS OF PROJECT UNIQUE TEST ITEMSOBTAINED ON SUBJECTS WITH AUDITORY IMPAIRMENTS.
. .
Variable AgeFemale
Mean . SD N MeanMaleSD N
Combined
Mean SD N
Tricep 10 13.5 S.0 37 12.7 6.6 72 13.0 6.1 109Skinfold 11 13.2 4.6 53 12.8 6.0 66 12.9 5.4 119
(mm.) 12 17.0 7.0 52 13.0 6.2 64 14.8 6.9 116
13 16.2 6.6 64 12.8 5.7 90 14.1 6.2 16014 17.2 6.6 71 11:1 6.1 84 13.9 7.0 15515 17.8 8.0 116 10.9 5.3 139 14.1 7.5 25516 17.6 6.9 129 11.7 6.1 179 14.2 7.1 30817 16.9 6.0 64 11.4 5.8 86 13.7 6.5 150
, Entire 16.7 6.8 586 11.9 6.0 786 13.9 6.8 1372
Abdominal 10 10.S 4.4 37 11.S 8.7 72 11.2 7.5. 109
Skinfold 11 12.3 5.7 53 13.4 9.9 66 12.9 8.3 119(mm.) 12 15.8. 6.8 52 14.3 11.0 64 15.0 9.4 116
13 16.6 8.0 64 13.0 7.S 96 14.4 7.9 16014 17.0 7.6 71 13.7 9.2 84 15.2 8.6 155
15 17.6 8.4 116 13.7 8.4 139 15.5 8.6 255
16 18.2 7.1 129 14.S 8.4 179 16.1 8.1 30817 18.1 8.6 64 13.5 7.6 86 15.S 8.3 150
Entire 16.S 7.7 586 13.6 8.7 786 14.8 8.4 1372
Subscapular 10 9.6 4.0 37 8.8 5.4 72 9.1 S.0 109
Skinfold 11 10.0 3.9 S3 10.1 7.1 66 10.1 9 119(mm.) 12 13.6 6.S 52 10.9 7.4 64 12.1 7.1 116
13 13.5 4.7 64 10.8 6.3 96 11.9 S.9 160
14 14.7 6.4 71 10.4 5.4 84 12.3 6. 15S
15 14.8 6.8 116 10.8 4.9 139 12.6 6.2 2SS
16 15.6 S.6 129 11.4 5.4 179 13.1 S.8 308
17 15.4 6.9 64 11.3 4.7 86 13.1 6.1 150Entire 14.0 6.2 S86 10.7 5.7 786 12.1 6.1 1372
Sum of 10 23.2 8.3 37 21.5 11.4 72 22.1 10.5 109
Triceps 11 23.2 7.7 53 22.9 F2.3 66 23.0 10.4 119
and Sub- 12 30.6 12.7 S2 23.8 13.0 64 26.9 13.2 116
scapular 13 29.7 10.2 64 23.6 10.9 96 26.0 11.0 160
Skinfolds 14 31.9 12.2 71 21.5 10.5 84 26.3 12.4 155
(nm.) 15 32.7 13.6 116 21.7 9.6 130 26.7 12.8 255
16 33.2 11.5 129 23.1 10.4 179 27.3 12.0 308
17 32.3 10.8 64 22.7 9.7 86 26.8 11.2 150Entire 30.7 11.9 5E6 22.6 10.8 786 26.0 12.0 1372
128

t
'
TABLE 3:2.
.(cont.
101
'
Variable
Age
Mean
Female
SD
NMean
Male
SD
NCombined
Mean
SD
N
Sit-Ups
10
24.3
9.3
39
'
29.4
9.6
71
27.6
9.7
110
(no.)
11
29.3
10.0
59
30.0
12.0
67
29.7
11.1
126
12
28.5
.9.7
56
31./if
10.5
65
30.2
10.2
121
13
27.8
9.4
72
33.3
11.7
98
31.0
11.1
170
14
28.6
11.2
70
34.9
12.1
84
32.0
12.1
154
15
29.6
10.8
122
36.7
11:2
140
33.4
11.5
262
16
31.2
11.3
140
38.4
11.6
196
35.4
12.0
336
17
32.7
11.2
64
40.0
10.2
92
37.0
,11.2
156
Entire
29.5
10.7
622
35.3
11.7
813
32.8
116
1435
Leg Raise
10
23.7
16.2
39
28.2
25.1
71
26.6
22.4'
110
(sec.)
11
'
21.8
19.4
59,
26.6
28.7
67
24.4
24.8
126
12
21.1
15.3
56
28.1
21:2
64
24.8
19.0
120
13
18.9
15.0
78
28.7
. 24.0
96
24.3
21.0
174
-14
24.5
19.0
73
36.7
26.8
82
30.9
24.2
155
15
133.2
22.2
122
41.3
24.6
136
37.5
23.8
258
16
435.3
23.6
141
.49.6
34.2
194
43.6
31.0
335
17
37.1
27.0
66
57.9
34.9
91
49.2
33.4
157
Entire
28.6
21.8
634
39.8
30.6
801
34.8
27.6
1435
Trunk Raise
10
36.6
23.7
38
34.2
33.0
70
35.1
30.0
108
(sec.)
11
44.3
28.9
57
'
42.9
35.0
67
43.5
32.2
124
12
36.1
25.1
53
42.3
27.8
64
39.5
26.7
117
13
35.1
27.0
75
40.6
29.7
96
38.1
28.6
171
14
36.4
27.7
68
40.3
29.6
80
.'38.5
28.7
148
15
40.8
35.9
120
41.0
35.0
132
40.9
35.3
252
16
45.6
40.0
139
50.7
41.8
Ilk,.
48.5
41.1
327
17
51.5
39.2
65
46.2
37.5'
91
48.4
38.1
156
Entire
41.5
33.6
615
43.4
35.5
788
42.6
34.7
1403
.-
Right Grip
10
14.9
8.5
40
15.3
6.3
71
15.1
7.2
111
(kg.)
11
14.7
'7.4
S7
14.9
6.3
69
14.8
6.8
126
12
19.2
7.1
54
21.1
8.3
65
20.2
7.8
119
13
21.3
7.4
71
'
24.4
9.1
96
23.1
8.5
167
14
24.1
8.2
70
29.9
10.6
83
27.2
10.0
153
15
24.6
8.4
122
35.7
10.6
141
30.5
11.1
263
16
24.3
7.5
139
39.4
10.3
196
33.1
11.8
335
17
27.0
7.8
65
46.1
10.7
92
38.2
13.4
157
Entire
22.3
8.7
618
31.1
13.9
813
27.3
12.7
1431
_.
129
AIL

TABLE 3.2. (cont.)
102
Variable Age MeanFemale
SD N MeanMaleSD
CombinedMean SD N
Left Grip 10 13.4 7.9 40 14.1 6.6 71 13.8 7.1 111
(kg.) 11 13.5 7.3 57 13.7 6.0 69 13.6 6.6 126
12 17.6 7.0 54 19.0 8.2 65 18.3 7.7 119
13 20.0 7.5 71 22.2. 9.7 97 21.3 8.9 168
14 21.4 7.7 70 28.4 11:1 83 25.2 10.3 153
15 22.4 8.1 122 .33.3 9.9 141 28.2 10.6 26316 21.6 6.7 139 36.5 9.4 .19/ 30.3 11.1 33617 24.3 7.4 65 42.5 10.3 91 34.9 12.9 156
Entire 20.2 8.1 618 28.8 13.2 814 25.1 12.1 1432
Sum of 10 ,28.2 16.4 40 29.4 12.7 71 14.1 14.1 111
Grips 11 . 28.2 14.5 57. 28.7. 12.0 69 13.1 13.1 126
(kg.) 12 36.7 13.8 '54 40.1 16.2 65 15.2 15.2 119
13 41.3 14.5 71 40.4 18.3 96 16.9 16.9 167
14 45.5 15.5 70 58.3 20.2 83 19.2 19.2 153
15 47.0 16.1 122 69.0 19.9 141 21.3 21.3 26316 45.9 13.9 139 75.9 19.0 196 22.6 22.6 335
17 51.3 14.7 65 88.6 20.1 91 25.8 25.8 156
Entire 42.5 16.5 618 59.9 26.7 812 24.4 24.4 1430
Arm Hang 10 6.7 7.1 38 8.9 9.9 68 8.1 9.1 106
(sec.) 11 7.9 7.6 57 9.5 12.1 64 8.8 10.2 121
12 4.7 5.2 55 9.5 10.2 60 7.2 8.5 115'
13 4.2 6.9 .77 14.2 16.0 90 9.6 13.6 167..
14 6.6 8.7 68 17.1 15.0 69 11.8 13.3 137
15 6.4 7.9 112 21.3 15:7 123. 14.2 14.6 235
16 39.7 10.9 135 23.9 15.0 170 17.6 15.1 305
17 :.6.8 8.5 67 22.2 14'.9 78 15.1 14.5 145
Entire 6.9 8.6 609 17.5 15.3 722 12.7 13.8 1331
Pull-Ups 10 0.9 1.7 40 1.7 2.2 70 1,4 2.1 110
(no.) 11 0.8 1.3 58 1.5 2.1 65 1.2 1.8 123
12 0.3 0.8 54 2.2 2.5 65 1.3 20 119.
13 0.4 1.1 69 3.2 3.3 97 2.0 3.0 166
14 0.9 2.1 63 4.1 4.3 82 2.7 3.8 145
15 0.9 2.3 116 5.4 4.0 ,138 3.4 4.0 254
16 0.; 1.3 139' 6.1 4.5 196 3.9 4.4 335
17 0.5 1.1 57 6.8 4.6 92 4.4 4.8 149
Entire 0.7 1.6 596 4.4 4.2 805 2.8 3.8 1401
130

4
i
103
TABLE 3.2. (cont.)
Variable Age MeanFemale'
SD N MeanMaleSD N Mean
CombinedSD N
Broad Jump 10 48.9 10.9 38 52.3 8.6 67 51.0 9.6 105
(inches) 11 53.6 8.7 56 54.8 9.4 62 54.2 9.1 118
12 56.0 9.9 52 60.9 9.6 59 58.6 10.0 111
15 58.2 .8.1 71 65.5 12.5 98 62.4 11.4 169
.
14 57.2 10.3 63 69.4 13.1 83 64.1 13.4 14615 60.2 10.9 116 74.8 12.5 132 68.0 13.8 24816 58.9 12.4 132 77.9 11.6 186 70.0 15.2 318
' 17 59.9 11.5 65 82.9 11.9 85 72.9 16.3 150
Entire 57.6 11.1 593 70.0 15.0 772 64.6 14.8 1365
Softball 10 491.9 136.2 38 824.0 307.8 64 700.3 303.2 102
Distance 11 566.1 169.7 54 806.8 254.9 57 689.7 248.1 111
(inches) 12 667.1 214.0 48 1159.3 359.3 60 940.6 389.4 10813 766.8 243.7 67 1282.8 348.0 83 1052.3 399.0 150
14 889.7 310.8 70 1402.7 .435.9 77 1158.4 459.0 147r. 15 9.14.0 379.7 120 1531.5 468.2 134 1239.8 527.7 254
16 887.2 348.0 142 1597.8 444.9 195 1298.3 537.2 337
17 887.7 346.7 650 1759.2 524.4 89 1391.4 628.4 154
Entire 808.4 335.9 '604 1391.5 514.5 759 1133.1 530.3 1363
Softball 10 35.7 5.8 20 46.7 7.8 32 42.5 8.9 52
Velocity 11 39.6 6.0 . 35 46.2 1.2 33 42.8 7.3 68
(feet per 12 43.1 8.3 ,28 55.9 ' 8.8 30 49.7 10.6 58second) 13 46.8 8.4 44 60.5' 7.5 52 54.2 10.5 96
14 49.4 7.6 56 62.4 13.8 62 56.2 13.0 118
15 49.3 8.7 78 64.1 .10.3 105 57.8 12.1 183
16 47.2 8.4 114 63.7 9.5 138 56.2 12.2 252.
17 49.3 9.5 47 69.2 10.0 70 61.2 13.8 117
Entire 46.6 8.9 422 61.4 11.7 522 54.8 12.9 944
50 -Yard 10 9.4 1.1 .34 - 8.9 0.8 65 9.1 1.0 99
Dash 11 9.0 1.2 r54 9.1 1.8 61 9'.1 1.5 112
(sec.) 12 8.7 1.0 46 8.7 1.6 61 8.7 1.4 107
13 8.7 1.3 60 8.5 2.0 83 8.6 1.8 143
14 8.4 j.4 66 7.8 1.4 74 8.1 1.4 140
15 8.7 2.3 119 7.3 1.1 132 8.0 1.9 25116 8.3 1.3 141 7.1 0.8 197 7.6 1.2 33817 8.1 0.9 65 6.9 0.7 91 7.4 1.0 156
El:tire 8.6 1.5 582 7.8 1.5 764 8.1 1.6 1346
Pe
7131lk
r
,-
1

6
TABLE 3.2.
(cont.
Variable
Age
Mean
Female
SD
NMean
Male
SD
NCombined
Mean
SD
N
50-Meter
10
10.6
'1.4
34
10.1
1.6
69
10.3
1.5
104
Dash
11
9.9
1.1
53
10.0
1.8
62
10.0
1.5
115
(sec.)
12
9.6
1.1
46
9.5
1.6
61
9.5
1.4
107
13
9.6
1.5
60
9.2
2.0
83-
9.4
1.8
143
14
9.4
1.5
66
8.6
1.5
74
9.0
1.5
140
15
9.5
2.3
116
.8.0
1.2
129
8.7
2.0
245
16
9.3
1.6
131
7.6
0.9
172
8.4
1.5
3d3
17
8.8
1.0
65
7.4
0.8
87
8.0
1.1
152
Cntire
9.5
1.6
571
8.5
1.7
737
9.0
1.7
1308
.
Rise-to-
10
1.6
0.4
37
1.7
0.6
63
1.7
0.5
100
Stand
11
1.8
0.5.
55
1.7
0.6
66
1.8
0.6
121
(sec.)
12
1.7
0.4
56
1.6
0.8
64
1.7
0.6
120
13
1.7
0.4
71
.
1.6
.0.6
98
1.6
0.5
169
14
1.7
0.6
72
L.5
0.6
82
1.6
0.6
154
15
1.7
0.6
123
1.4
0.5
139
1.5
0.6
262
16
1.6
0.6
119
1.4
0.5
198
1.5
0.5
337
17
1.7
.0.6
65
1.3
0.5
92
1.4
0.6
155
Entire
1.7
0.5
616
1.5
0.6
802
1.6
0.6
1418
Mat Creep,
(sec.)
10
11
4.6
4.6
1.0
1.2
36
53
4.2
4.5
1.0
1.6
61
64
4.3
4.5
1.0
1.4
97
117
12
4.5
1.2
55
4.1
1.4
64
.4.3
1.3
119
13
4.3
1.3
77
4.2
'
1.7
96
4.3
1.5
173
14
4.5
1.1
71
3.9
1.0
84
412
1.1
155
15
4.4
1.3
119
3.6
0.9.
135
4.0
1.2
254
16
4.4
1.1
140
3.6
0.9
193
3.9
1.1
333
17
4.2
1.2
63
3.4
0.8
90
3.4
1.1
1S3
Entire
4.4
1.2
614
3.8
1.2
787
4.1
1.2
1401
Shtittle
10
3.2
2.6
38
12.1
1..8
67
12.5
2.2
105
Run
112.3
2.0
56
12.7
3.1
65
12.5
2.6
121
(sec.)
12
12.0
1.3
56
11.9
2.4
64
11.9
1.9
120
13
12.2
2.3
71
11.7
3.1
97
11.9
2.8
168
14
12.0
1.6
61
11.2
1.9
83
11.5
1.8
144
15
.
12.1
2.4'
114
10.5
1.2
133
11.2
2.0
247
16
11.8
2.1
131
10.3
1.2
186
10.9
1.8
317
17
11.6
1.8
62
10.0
1.3
85
10.6
1.7
147
Entire
12.0
2.1
589
11.0
2.1
780
11.5
2.2
1369
c13
2

105
TABLE:3. 2.
(cont.)
Variable
Age
-Female
Mean
SD
NMean
Male
SD
NCombined
Mean
SD
N
Sit and
10
24.0
6.5
-40
72.7
6.5
69
23.2
6.5
109
Reach
11
23.5
6.8
59
21.3
7.2
69
22.3
7.1
128
(cm.)
12
26.1
7.9
56
24.0
7.2
64
25.0
7.6
120
13
26.0
7.6
72
22.6
8.3
96
24:0
8.2
168
14
27.3
8.4
71
24.1
10.0
83
.25.6
9.4
154
15
29.1
8.9
123
25.0
8.7
139
26.9
9.0
262
16
28.4
8.8
140
26.3
9.4
196
27.2.
9.2
336
1'1
29.4
9.5
64
29.3
8.3
92
29.3
8.8
156
Entire
27.3
8.5
625
24.8
8.8
808
25.9
8.8
1433
Long
10
145.7
34.6
34
172.9
38.8
61
163.2
39.4
95
Distance
11
164.2
35.8
47
170.9
45.7
55
167.8
41.4
102
Run
12
158.0
31.2
36
180.3
43.4
41
169.9
39.6
77
(Yards per
13
151.2
36.7
59
191.2
42.3
77
173.8
44.6
136y
minute)
14
158.1
38.7
64
194.4
52.5
69
.176.9
49.7
133'
15
151.2
43.8
113
202.6
47.8
120
177.7
52.5
233
16
164.0
40.8
109
207.9
48.3
152
189.6
50.2
261
17
154.7
34.5
55
221.1
44.2
72
192.3
52.0
127
Entire
156.4
38.9
517
196.8
48.5
647
178.8
48.8
1164
Stork
10
9.6
13.2
40
11.7
20.4
72
10.9
18.1
112
Stand
11
6.5
8.2
57
9.1
12.0
69
7.9
10.5
126
(sec.)
12
7.3
7.5
55
6.8
9.4
65
7.0
8.5
120
13
5.3
6.1
78
12.2
19.6
98
9.1
15.5
176
14
10.Q.
17.0
74
14.4
24.1
82
12.3
21.1
156
15
13.5
20.2
122
12.8
17.9
138
13.2
19.0
260
16
12.7
14.6
140
13.4
18.2
191
13.1
16.8
331
17
12.9
17.3
67
9.5
12.0
89
11.0
14.5
156
Entire
10.4
15.(
633
11.8
17.7
804
11.2
16.6
1437
v
133
O

106
TABLE 3.3. MEANS AND STANDARD DEVIATIONS OF PROJECT UNIQUE TEST FilmsObTAINED ON SUBJECTS WITH VISUAL IMPAIRMENTS.
Variaule Age MeanFemaleSD N Mean
MaleSD N
CombinedMean SD N
Tricep 10 12.3 6.4 14 12.7 6.2 39 12.6 6.2 53Skinfold 11 15.4 7.6 27 13.9 5.1 33 14.6 6.3 60
(mm.) 12 16.5 7.2 30 15.6 9.0 41 16.0 8.3 71
13 15.8 7.6 39 13.8 7.4 43 14.8 7.S 82
14 15.9 8.8 38 11.7 7.3 69 13.2 8.1 107
15 16.5 7.5 42 12.1 6.4 56 14.0 7.2 9816 t8.2 9.3 55 11.7 7.3 55 14.2 8.7 9017 17.7 9.0 55 12.4 6.2 46 14.7 3.0 81
Entire 16.4 8.1 260 12.8 7.1 382 14.2 7.7 642
Abdominal 10 10.4 6.2 '14, 10.1 8.5 39 10.2 7.9 53
Skinfold 11 14.6 9.4 27 15.7 8.0 33 14.1 8.6 60(mm.) 12 15.9 10.1 30 16.2 13.7 41 16.0 12.3 71
13 14.3. 8.1 39 15.8 12.0 43 15.1 10.3 82
14 16.6 11.4 37 14.3 11.2 69 15.1 11.3 106
15 16.3 8.2 42 15.5 10.1 56 15.8 9.3 98
16 18.3 12.1 3S 14.7 11.3 55 16.1 11.7 90
17 16.3 8.7 35 17.9 10.1 46 17.3 9.5 81
Entire 15.8 9.7 259 ' 14.9 10.9 382 15.2 10.4 641
Subscapulaf 10 7.5 3.6 14 8.8 6.5 39 8.5 5.9 53
Skinfcld 11 13.5 8.3 27 10.5 5.2 33 11.8 6.9 60(mm.) 12 12.6 '- 5.3 3( 12.7 10.2 41 12.6 8.4 71
13 12.7 5.1 38 12.8 9.4 43 12.8 7.7 81
14 14.9 10.1 38 11.1 7.5 68 12.4 8.7 106
15 15.4 8.6 42 12.5 6.9 56 13.7 7.8 98
16 15.6 7.7 35 13.3 10.1 54 14.2 9.3 89
1 14.9 7.6 35 13.8 5.9 46 14.3 6.7 81
Entire 13.9 7.7 259 12.0 8.1 380 12.8 8.0 639
Sum of 10 . 19.8 9.2 14 21.5 12.2 39 21.0 11.4 53
Triceps 11 28.9 1$.3 27 24.5 9.0 33 26.4 12.3 60
and Suu- 12 29.1 12.1 30 28.2 18.5 41 28.6 16.0 71
:5capular 13 28.7 12.1 38 26.6 16.2 43 27.6 14.4 81
Skinfolds 14 30.8 18.4 38 22.7 14.3 68 25.6 16.3 106
(mm.) 15 31.8 45.4 42 24.5 12.4 56 27.7 14.2 98
.16 33.8 15.6 35 25.2 16.3 54 28.5 16.5 89
. 17 32.7 15.7 35 26.2 11.0 46 29.0 13.6 81
Entire 30.3 .15.0 259 ?4.8 14.2 380 27.0 14.8 639
0
0.
134
v
,
4

107
TABLE 3.S. (cont.)Female Mal e Combined
Variaole Age
Sit-Ups 10 27.1 10.4 14 30.6 11.1 39 29.7 10.9 53(no.) 11 25.9 9.2 27 31.6 13.1 33 29.0 11.8 60
12 28.1 9.6 '31 32.6 10.6 39 3Li.6 10.3 70
13 28.1 9.6 39 37.3 12.7 42 32.9 12.1 81
14 28.6 9.3 37 35.4 9.8 66 33.0 10.1 103IF 30.5 10.4 43 35.3 12.4 55 33.2 11.7 9816 31.5 7.3 35 36.9 11.0 57 34.8 10.1 9;
17 29.1 10.4 3S 39.4 10.4 46 34.9 11.6 81
Entire 28.9 9.5 261 35.2 11.5 377 32.6 11.2 6381Leg Raise(see.)
Trunk Raise 10(sec.) 11
I213
14
15
16
17
Entire
18.415.2
26.5
35.331.439.439.9
32.731.8
19.3 12
17.1 26
28.1 3')
38.6 3b
28.0 3634.6 42
38.6 35
30.1' 35
32.2 252
.16.5
34.633.530.337.035.540.435.533.7
15.6
36.538.324.231.0
34.035.026.331.4
3832
39
42
67
525647
373
16.9
25.
30.532.6
35.137.240.2
34.332.9
16.3
30.834.231.630.034.1
36.227.9
31.7
50586978
103
94
91
82
625
-
Right Grip 10
(4.) 11
12
13
14
15
16
17
Entire
10
11
12
13
14
15
1617
Entire
Mean SD N Mean SP N
15.1
27.023.222.9
21.932.228.731.226.3
10.5
13.1
16.615.9
16.7
17.921.0
22.717.4
14.2 14
24.6 27
33.0 31
27.8 .37
19.1 37
31.1 43
29.4 35
32.4 35
28.1 259
4.0 14
6.4 27
6.5 31
5.6 39
7.1 38
9.1 438.1 35
7.0 357.8 262
28.1
27.423.923.130.540.049.657.136.1
11.7
15.2
19.621.325.129.833.836.125.2
31.424.019.9
20.926.240.846.640.335.3
6.4
8.1
7.5
16.8
9-99.6
10.1
11.912.3
39
32
3942
6754
57
47377
38
3341
43
68
5756
47
383
Mean SR N
24.627.2
23.623.1
27.5
36.641.746.1
32.1
11.4
14.2
18.3
18.7
22.124.7
28.9
30.422.1
28.424.126.324,224.236.942.039.132.9
5.87.4
7.2
9.1
9.8
11.1
11.3
12.111.3
53
59
70
79104
97
92
82
636
52
6072
82
106
100
91
82645
135
vb.

TABq 3.3.
Variable
1 Left Grip(kg.)
Sum ofGrips
(kg.)
Arm Hang(sec.)
.Pull -Ups
(no.)
k
.7
108
(tont.)
Age MeanFemaleSD N Mean
MaleSD N
CombinedMean N
10 9.4 3.7 14 10.2 6.4 38 10.0 5.7 5211 11.9 6.5 27 13.8 8.1 33 13.0 7.4 6012 15.3 6.0 31 16.8 6.3 41 16.2 6.2 7213 14.3 5.7 39 18.4 8.8 43 16.5 7.7 8214 15.1 5.9 38 22.6 10.1 67 19.9 9.5 10515 16.4 8.7 43 26.6 8.7 57 22.2 10.0 10016 19.8 7.8 35 31.1 9.3 56 26.8 10.3 9117 19.8 6.9 35 32.8 12.2 47 27.3 12.1 82
Entire 15.8 7.3 262 22.6 11.n 382 19.9 10.6 644
10 19.9 7.4 14 22.0 12.5 38 21.4 11.3 5211 25.0 12.8 27 29.0 15.9 33 27.2 14.6 6012 31.9 12.1 31 36.5 13.5 41 34.5 13.0 7213 30.2 11.0 39 39.7 19.3 43 35.2 16.5 82
14 31.8 12.8 38 47.4 19.2 67 41.8 18.7 105
15 34.3 17.3 43 56.4 17.4 57 46.9 20.S 100
16 40.8 15.0 35 64.9 18.5 56 55.6 20.8 9117 42.5 13.1 3; 68.9 23.5 47 57.6 23.6 82
Entire 33.3 14.6 262 47.8 23.4 382 41.9 21.5 644
10 4.9 6.1 13 8.1 8.5 37 7.2 8.0 50
11 4.8 6.3 27 11.6 11.9 30 8.4 10.2 57
12 6.3 6.2 30 8.5 8.5 35 7.5 7.5 6513 3.8 4.2 32 11.4 13.2 41 8.0 10.9 7314 6.2 7.5 33 14.6 16.0 61 11.6 14.2 94
15 5.3 5.0 41 15.5 14.6 46 10.8 12.3 8916 5.8 6.3 33 15.0 13.5 43 11.1 11.8 7617 10.9 13.-9 29 20.0 17.7 42 16 2 16.8 71
Entire 6.0 7.6 238 13.4 14.1 3' 16.4 12.4 57S
10 0.7 1.5 14 1.9 2.1 38 1.6 2,0 52
11 0.6 1.4 27 2.0 2.6 33 1.4 2.2 6012 1.1 2.1 31 1.6 2.0 40 1.4 2.0 71
13 1.0 2.2 34 3.1 3.9 43 2.2 3.4 77
14 0.8 1.7 36 3.6 3.8 69 2.6 3.5 105
15 0.7 1.6 43 3.9 4.1 55 2.5 3.6 9816 0.9 1.9 35 4.6 4.2 54 3.2 4.0 8917 0.5 1.2 30 3.7 4.7 47 3.7 4.5 77
Entire 0.8 1.7 250 3.5 3.9 371 2.4 3.5 629
1 3

109
TAbLE 3.3. (cont.)
Variable Age MeanFemaleSD N Mean
MaleSD N
CombinedMean SD N
Broad Jump 10 40.2 10.7 13 49.5 10.3 39 47.2 11.1 52(inches) 11 44.0 14.8 27 52.5 10.7 33 48.7 13.3 60
12 50.9 14.9 30 56.8 11.4 38 54.2 13.3 6813 48.2 11.4 36 59.3 16.3 42 54.2 15.2 7814 53.2 14.5 37 64.2 17.0 66 60.2 16.9 10315 54.4 11.5 42 67.6 17.6 56 61.9 16.6 9816 55.3 12.1 34 70.3 17.2 58 64.8 17.1 9217 53.9 12.2 35 73.1 17.3 47 64.9 18.0 82
Entire 51.1 13.4 254 62.9 17.2 379 58.2 16.8" 633
_Softball 10 271.4 146.4 13 520,6 251.5 36 454.5 252.6 49'
Distance 11 360.6 243.3 25 648.4 276.3 29 515.2 296.9 54(inches) 12 568.9 302.0 29 785.1 354.9 33 684.0 346.1 62
13 464.8 249.9 31 835.4 431.4 39 671.3 405.0 7014 529.1 233.1 28 974.5 421.2 55 824.2 423.8 8315 552.0 277.6 33 1088.2 568.8 44 858.4 535.6 771-6 678.5 302.0 30 1091.8 492.0 43 921.9 73
17 549.3 265.6 28 1239.1 524.0 41 959.2_468.9
553.2 69Entire 517.1 280.6 217 922.7 487.2 320 758.8 461.1 537
Softball 10 26.4 6.7 10 35.1 9.4 25 32.6 9.5 3SVelocity 11 31.1 10.0 17 39.7 9.S 20 35.7 10.5 37
(feet per 12 39.2 11.5 19 47.3 12.4 24 43.7 12.6 43second) 13 33.2 10.6 14 47.4 12.1 19 41.4 13.4 33
14 38.5 7.5 13 50.4 8.9 26 46.4 10.1 3915 35.6 9r3 13 62.3 26.4 16 50.3 24.3 2916 44.2 1.1.7 15 50.5 11.7 22 48.0 12.0 3717 40.1, 8.2 16 54.5 16.4 21 48.2 15.1 37
Entire 36.5 10.8 117 47.8 .15:4 173 43.2 14.8 290
50-Yard 10 11.6 2.1 13 10.3 3.2 36 10.7 3.0 49Dash 11 10.5 1.9 2S 10.4 2.4 30 10.4 2.2 55
(sec.) 12 9.8 2.3 30 9.6 3.9 37 9.7 3.2 6713 10.3 2.3 32 9.4 2.6 39 9.8 2.5 7114 9.6 2.1 33 8.7 2.1 de 9.1 2.1 9315 9.0 1.7 37 8.3 1.9 50 8.6 1.9 8716 9.0 1.9 33 8.2 1.8 55 8.5 1.9 8817 10.0 2.1 35 8.0 3.1 46 8.8 2.9 81
Entire 9.8 2.1 238 8.9 . 2.7 353 9.3 2.5 591
137

110
TABLE 3.3. (cont.)Female Male Combined
Variable Age Mean SD N Mean SD N Mean SD N
50-Meter- 10 13.2 2.3 12 11.4 3.6 36 11.9 3.4 48Dash 11 11.6 2.1 26 11.4 2.7 33 11.5 2.5 59
(sec.) 12 11.0 2.3 30 10.6 4.2 39 10.8 3.5 6913 11.3 2.5 35 10.2 2.8 42 10.7 2.7 7714 10.7 2.3 35 9.6 2.2 62 10.0 2.3 9715 10.0 1.8 41 9.2 2.0 53 9.5 1.9 9416 9.9 2.1 33 9.0 2.2 56 9.3 2.2 8917 11.0 2.3 35 8.7 3.5 47 9.7 3.2 82
Entire 10.8 2.3 247 9.9 3.0 368 10.2 2.8 615
Rise-to- 10 1.8 0.7 14 1.8 0.5 39 1.8 0.6 53Stand 11 2.2 1.0 27 2.0 0.8 33 2.1 0.9 60
(sec.) 12 2.1 0.6 31 1.7 0.5 39 1.9 0.6 7013 1.9 0.7 37 1.8 0.7 42 1.8 0.7 79
14 1.9 0.6 3b 1.8 0.9 67 1.8 0.8 103
15 2.0 0.6 41 1.8 0.7 54 1.9 0.7 95
16 2.0 0.6 35 1.6 0.6 55 1.7 0.6 9017 2.1 0.8 35 1.5 0.5 47 1.7 0.7 82
Entire 2 0 0.7 25b 1.7 0.7 376 1.8 0.7 632
Mat Creep 10 5.5 1.4 13 4.7 1.1 37 4.9 1.2 50(sec.) 11 5.2 1.3 27 4.7 1.8 32 4.9 1.6 59
12 6.7 6.7 30 4.6 1.2 37 5.5 4.7 67
13 5.2 1.5 35 4.3 1.6 40 4.7 1.6 75
14 5.1 1.5 33 4.2 1.3 61 4.5 1.5 94
15 5.7 2.9 40 4.4 1.2 45 5.0 2.3 85
16 5.7 2.6 33 4.7 1.7 47 5.1 2.2 80
17 5.2 1.3 30 4.3 1.8 42 4.7 1.6 72Entire 5.5 3.0 241 4.5 1.5 341 4.9 582
Shuttle 10 14.6 2.7 13 16.5 9.2 36 16.0 8.1 49
Run 11 17.6 10.5 26 13.2 2.3 32 15.1 7.5 58(sec.) 12 15.1 5.2 30 14.4 10.9 36 14.7 8.7 66
13 16.2 9.2 32 13.3 3.9 39 14.6 6.9 71
14 13.7 2.8 33 12.7 3.4 59 13.1 3.2 92
15 14.0 2.7 37 12.4 2.4 49 13.1 2.6 86
16 13.4 2.1 33 12.2 2.7 48 12.7 2.5 81
17 14.0 2.7 28 12.0 2.8 41 12.8 2.9 69
Entire 14.8 5.7 232 13.2 5.5 340 13.8 5.6 572

111
TABLE 3.3. (cont.)
Variable Age MeanFemaleSD N Mean
MaleSD N
CombinedMean Si)
-'
N
Sit and 10 25.9 6.3 14 24.6 8.2 39 24.4 7.7 53Reach 11 26.8 7.1 27 23.1 8.1 31 24.8 7.8 58
(cm.) 12 26.6 8.9 31 23.3 8.7 39 24.8 8.8 '70
13 26.0 9.2 34 23.2 9.0 41 24.5 9.2 75
14 26.4 8.1 3(i 25.2 .0 63 25.6 8.7 99
15 28.4 9.4 41 22.7 10.5 SO 25.3 10.3 91
16 29.0 9.4 33 26.6 9.6 52 27.6 9.6 85
17 26.5 10.2 31 26.2 8.7 '43 .26.4 9.3 74
Entire 27.0 8.8 247 24.5 9.1 358 - 25.5 9.1 605
LOng 10 141.6 42.2 13 153.1 33,5 35 150.0 36.0 48Distance 11 147.8 28.5 22 163.0 46.2 29 156.4 40.0 51
Run 12 152.4 48.9 26 157.9 33.1 31 155.4 40.7 57(Yards per 13 139.8 41.4 30 161.3 46.3 33 151.1 45.0 63Minute) 14 134.9 38.5 34 174.5 52.1 53 159.0 50.9 87
15 148.8 40.2 32 174.4 50.3 48 164.1 47.9 8016 148.6 40.3 33 184.4 42.3 50 '170.2 44.9 8317 139.9 37.8 27 191.7 45.4 41 171.1 49.3 68
Entire 144.1 39.8 217 171.9 46.1 320 160.7 45,7 537
6tork Stand 10 23.0 34.8 14 21.3 62.6 39 21.7 56.3 !...3
(sec.) 11 11.4 10.7 27 24.4 48.5 32 18.5 36.7 8912 19.5 31.4 30 18.8 32.9 38 19.1 32.0 68
13 12.Q 21.4 37 27.8 47.9 42 20.8 38.4 79
14 20.7 :1.0.8 34 33.6 64.9 64 29.1 60.4 9815 17.5 22.3 42 21.5 41.9 SO 19.7 34.3 92
16 12.9 15.0 33 13.5 16.9 49 13.3 16.1 82
17 10.9 9.8 30 21.9 50.2 42 17.3 39.0 72
Entire 1S.7 27.3 247 23.3 48.6 356 20.2 41.4 603
133

r
112
TABLE 3.4. THE PERFORMANCE uF SUbJECT!. WITH VISUAL IMPAIRMENTS ON RUNNINGEVENTS CATEGORIZED BY SEX AND METHOD OF AMBULATION.*
Test Itemand
Subject_croup
Subjects with Visual impairments
Method of Ambulation TotalPartner
Mean :JD
Guide WireN Mean SD N
UnassistedMean SD N Mean SD N
Shuttle RunLutire 14.8 4.4 43 18.8 11.2 66 13.0 3.9 462 13.8 15.6 571
female 1b.1 5.4 20 19.4 10.0 36 13.7 3.8 176 14.8 5.7 232Nale 13.7 2.9 23 18.1 12.5 30 12.3 4.0 286 13.2 5.5 339
50-YardbashEntire 10.2 3.2 30 11.0 3.6 109 8.8 1.9 452 9.3 2.5 591
Female 10.3 2.0 17 11.5 2.6 51 9.2 1.7 170 9.8 2.1 238
Mule 10.0 4.4 13 10.S 4.3 58 8.6 2.0 282 8.9 2.7 353
Long Dis-tance RunEntire 153.2 37.0 76 146.0 44.9 48 163.7 46.9 413 160.7 4:'.7 537
Female 138.8 .32.1 40 136.6 41.3 22 146.6 41.4 155 144.1 39.8 217
Male 169.2 35.7 36 153.9 47.1 26 174.1 47.0 258 171.9 46.1 320
blind :i212jects
Shuttle RunEntire 15.1 4.5 36 18.8 11.1 53 15.2 6.5 39 16.7 8.5 128
Female 16.4 5.6 18 19.0 8.8 28 17.4 9.6 16 17.8 8.2 62
Male 13.9 2.8 18 18.6 13.4 25 13.7 2.0 23 15.6 8.7 66
50-Yard
DashEntire 9.9 2.8 26 11.2 3.9 88 9.8 1.8 27 10.6 3.4 141
Female 10.3 2.0 17 11.9 2.7 19 9.4 1.9 13 11.0 2.6 69
fiale 9.1 3.9 9 10.6 4.5 49 9.7 1.8 14 10.1 4.1 72
Long Dis-
tance RunEntire 152.8 37.2 70 143.2 48.0 39 140.4 41.8 28 147.5 41.5 137
remale 138.5 32.5 39 129.6 44.4 17 137.7 36.8 11 136.1 36.1 67
Male 170.8 35.2 :51 153.7 49.0 22 142.2 45.7 17 158.5 43.5 70
*Units of measure are in seconds for shuttle run and dash, and yards perminute for the long distance run.
140

I
113
TA6LE 3.4. cont.
'lest Item
andSubject
uroup
Partially Sighted Subjects
Method of Amuulation TotalPartner Guide Wire
Mean SD h Wan .1.1) h
UnassistedMean Si) N Mean SD
Shuttle kunntire 13.2 3.2 7 78.7 11.8 13 12.8 3.6 423 13.0 4.1 443Female 13.6 2..1 2 20.7 14.1 8 13.3 2.3 160 13.7 4.0 170
Male 13.0 3.7 5 15.5 6.7 5 12.6 4.1 263 12.6 4.2 273
50-lardwashEntire 12.1 5.3 4 10.1 2.0 21 8.8 1.9 425 8.9 2.0 450Female - - 10.2 1.7 12 9.2 1.7 157 9.3 1.7 169
Male 12.1 5.3 4 10.1 2.4 9 8.5 2.0 268 8.6 2.2 281
Long Dis-tance Run
Entire 157.8 37.7 6 158.1 27.0 9 165.4 46.8 385 165.2 46.3 400Female 150.0 - 1 160.5 13.0 5 147.3 41.7 144 147.7 41.0 150
Male 159.4 42.0 5 155.1 41.2 4 176.3 46.4 241 175.6 46.2 250
141
N_

114
TABLE 3.5. MANS ANU STANDARD DEVIATIONS OF PROJECT UNIQUE TEST ITEMSObTA1NED ON INDIVIDUALS W1TU AMPUTATIONS AND CONGENITAL ANOMALIES.
Variable Age Mean
FemaleSD N Mean
MuleSD N
CombinedMean SD N
Tricep 10 13.6 0.5 .3 6.2 2.7 7 8.4 4.2 10
Skinfold 11 14.7 0.0 1 15.1 .8.1 7 15.1 7.5) 8
(mm. ) 12 16.5 0.0 1 8.7 0.0 1 12.6 5.5 2
13 9.8 6.4 7 12.9 9.0 5 11.1 7.3 12
14 21.6 6.0 4 9.3 1.4 2 17.5 7.9 615 20.4 7.0 3 7.5 2.4 4 13.0 8.2 7
16 17.4 6.7 3 27.0 3.0 2 21.6 7.6 5
17 18.0 2.4 3 16.3 9.1 7 16.8 7.6 10Entire 15.8 6.6 25 12.6 8.3 35 13.9 7.7 60
Abdominal 10 13.8 2.2 3 5.2 2.2 7 7.8 4.6 10
Skinfold 11 17.0 0.0 1 19.0 15.0 7 18.8 13.9 8
(mm.) 12 19.8 0.0 1 15.4 0.0 1 17.6 3.1 2
13 11.8 6.5 7 17.4 13.2 5 14.1 9.7 12
14 18.5 4.1 5 6.2 2.6 2 15.0 7.0 7
15 20.5 1.6 3 6.6 1.9 4 12.6 7.6 7
16 22.0 11.5 3 35.7 6.2 2 27.5 11.5 5
17 14.2 6.9 3 19.3 14.4 8 17.9 12.6 11
Entire 16.3 6.5 26 14.9 12.9 36 15.5 10.6 62
Subscapular 10 11.5 1.1 3 5.7 1.2 7 7.4 3.0 10Skinfold 11 14.3 0.0 1 14.8 9.1 7 14.7 8.4 8
(mm.) 12 11.0 0.0 1 7.0 0.0 1 9.0 2.8 2
13 9.2 3.9 7 9.5 6.1 5 9.3 4.7 12
14 17.1 4.8 5 6.5 2.1 2 14.0 6.5 7
15 17.0 6.5 3 11.3 5.9 4 13.7 6.4 7
16 15.7 7.2 3 27.5 2.1 2 20.4 8.3 5
17 17.0 0.9 3 15.8 10.5 8 16.1 8.8 11
Entire 13.8 5.2 26 12.1 8.6 36 12.8 7.3 62
Sum of 10 25.1 1.0 3 11.9 3.4 7 15.9 7.0 10
Triceps 11 29.0 0.0 1 29.9 17.0 7 29.8 15.7 8
and Sub- 12 27.5 0.0 1 15.7 0.0 1 21.6 8.3 2
scapular 13 19.0 10.2 7 22.4 14.9 5 20.4 11.8 12
Skinfolds 14 40.6 8.1 4 15.8 3.5 2 32.4 14.4 6
(mm.) 15 37.4 13.1 3 18.8 3.8 4 26.8 12.8 7
16 33.1 9.9 3 55.4 0.9 2 42.0 14.1 5
17 35.0 3.2 3 33.4 18.9 7 33.9 15.5 10
Entire 29.8 11.2 25 24.9 16.3 35 26.9 14.5 60
142

TABLE 3.5. (cont.)
115
Female Male CombinedVariable Age Mean SD N Mean SD N Mean SD
Sit-Ups 10 0.0 0.0 1 11.8 9.3 6 10.1 9,6 7(no.) 11 4.0 0.0 1 12.5 12.7 6 11.3 12.0 7
12 - . -
13 4.2 8.0 6 27.0 32.5 .2 9.9 17.6 8
14 5.3 10.5 4 4,0 0.0 1 5.0 9.1 5
. 15 1.5 2.1 2 16.0 0.0 1 6.3 8.5 316 20.5 2.1 2 0.0 0.0 1 13.7 11.9 317 19.0 0.0 1 16.0 15.6 5 16.5 14,0 6
Entire 6.6 9.2 17 13.6 13.7 22 10.6 12:3 39
Leg Raise 10 0.0 0.0 1 27.3 28.1 6 23.4 27.6 7
(sec.) 11 1.0 0.0 1 7.8 7.9 5 6.7 7.6 6
12 - - -
13 29.7 27.2 6 13.0 18.4 2 25.5 25.2 8
14 21.5 35.9 4 14.0 4.2 2 19.0 2E.2 '6
15 7.0 0.0 2 0.0 0.0 1 4.7 4.0 3
16 17.5 12.0 2 21.0 0.0 1 18.7 8.7 3
17 2.0 1.4 2 16.2 20.2 5 12.1 17.9 7
Entire 17.7 24.2 18 16.3 19.0 22 16.9 21.2 40
Trunk 10 6.0 5.6 3 6.3 6.0 6 6.2 5.5 9
Raise 11 12.0 0.0 1 17.3 16.8 6 16.6 15.5 7
(sec.) 12 -
13 11.6 16.1 7 4.3 5.1 4 8.9 13.3 11
14 33.0 60.2' 5 30.5 29.0 2 32.3 50.5 7
15 14.5 10.6 2 1.0 1.4 2 7.8 9.9 4
16 11.0 0.0 1 18.0 0.0 1 14.5 4.9 2
17 8.0 7.2 3 30.3 40.0 7 23.6 34.6 10
Entire 15.5 29.6 22 16.1 24.0 28 15.8 26.3 50
Right Grip 10 10.5 0.7 2 8.2 3.1 6 8.8 2.8 8
(kg.) 11 - 12.6 9.0 7 12.6 9.0 7
12 27.0 0.0 1 10.0 0.0 1 18.5 12.0 2
13 17.0 5.9 6 19.3 12.1 4 17.9 8.3 10
14 15.3 9.0 4 12.0 0.0 1 14.6 8.0 5
15 25.7 15.5 3 20.5 14.9 4 22.7 14.1 7,
16 13.7 6.5 3 30.0 0.0 1 17.8 9.7 4
17 5.0 7.1 2 34.4 11.5 5 26.0 ,.7.4 7
Entire 16.1 9.4 21 17.9 12.8 29 17.2 11.4 SO
143

116
TABLE S.S. (cont.
lemale Male CombinedVariable Age Mean SD N Mean SD N Mean SD
Left Grip 10 7.S 3.5 2 8.3 4.6 7 8.1 4.2 9
(kg.) 11 12.4 9.0 5 12.4 9.0 5
12 27.0 0.0 1 10.0 0.0 1 18.5 12.0 2
13 15.2 7.1 6 19.5 17.4 4 16.9 11.6 1014 12.3, 3.9 4 7.0 0.0 1 11.2 4.1 5
15 22.3 18.9 3 21.5 17.1 4 21.9 16.3 716 10.3 .14.6 3 27.0 14.1 2 17.0 15.5 5
17 6.0 8.5 2 .31.3 19.7 6 25.0 20.6 8
Entire 13.9 10.4 21 18.1 15.2 30 16.4 1S.5 SI
Sum of 10 18.0 4.2 2 16.2 7.7 6 16.6 6.8 8
drips 11 26.8 18.4 5 26.8 18.4 5
(kg.) 12 54.0 0.0 1 20.0 0.0 1 37.0 24.0 2
13 32.2 11.6 6 38.8, 29.1 4 34.8 19.2 1014 27.5 11.5 4 19.0 0.0 1 25.8 10.6 5
15 48.0 33.8 3 42.0 31.9 4 44.6 30.0 7
16 24.0 15.4 3 67.0 0.0 1 34.8 24.9 417 11.0 15.6 2 61.6 28.4 5 47.1 34.5 7
lintire 30.0 18.5 21 35.9 26.5 27 33.3 23.3 48
Arm hang 10 2.0 0.0 1 6.2 10.5 6 5.6 9.7 7
(sec.) 11 - - - 3.8 6.5 5 3.8 6.5 5
12 6.0 0.0 1 0.0 0.0 1 3.0 4.2 213 9.6 10.4 5 4.0 4.9 4 7.1 8.4 9
14 2.3 3.3 4 0.0 0.0 1 1.8 3.0 5
15 0.0 0.0 2 9.5 9.7 4 6.3 9.0 6
16 3.3 3.1 3 1.5 2.1 2 2.6 2.6 5
17 4.S 6.4 2 10.3 10.0 3 8.0 8.4 5
Entire 4.7 6.5 18 5.5 7.8 26 5.2 7.3 44
Pull-Ups 10 2.0 0.0 1 2.5 4.3 6 2.4 3.9 7
(no.) 11 - .. 1.2 1.6 5 1.2 1.6 5
12 0.0 0.0 1 0.0 0.0 1 0.0 0.0 2
13 3.6 5.0 5 2.8 4.9 4 3.2 4.6 9
14 1.0 2.0 4 0.0 0.0 1 0.8 1.8 515 0.0 0.0 3 4.3 7.2 4 2.4 5.6 7'6 1.0 1.0 3 0.0 0.0 2 0.6 0.9 5
17 =0.0 0.0 2 0.5 1.0 4 0.3 0.8 6
Entire 1.4 2.9 19 1.9 3.8 27 1.7 3.5 46

117
TAW: 3.54 (cont.)
. Female Male CombinedVariable Age Mean SD N Mean SD N Mean SD N
broad, Jump 10 36.4 16,9 S 36.4 16.9 5
(inches) 11 35.6 15.3 5 35.6 15.3 5
12 - -
13 23.0 0.0 1 60.0 0.0 1 41.5 26.2 2
14 6.5 0.7 2 36.0 0.0. 1 16.3 17.0 3
15 18.0 25.5 2 43.0 9.9 2 30.5 21.4 4
16 43.5 10.6 2 55.0 0.0 1 47.3 10.0 3
17 35.0 19.8 2 43.3 36.2 6 41.3 31.7 8
Entire 25.4 18.8 9 40.8 21.9 21 36.2 21.9 30
softball 10 328.5 294.9 2 478.3 438.3 7 445.0 399.2 9Distance 11 730.7 312.1 7 730.7 312.1 7
(inches) 12 200.0 0.0 1 208.0 0.0 1 204.0 5.7 2
13 243.4 126.9 7 1005.3- 777.0 4 520.5 581.8 11
14
15
288.0534.3
171.2244.7
4-
3
937.0476.7
0.0239.5
1
3
417.8505.5
325.9218.9
5
6
16 349.0 0.0 1 711.0 673.2 2 590.3 519.9 3
17 344.5 65.8 2 721.8 449.7 5 614.0 411.6 7
Entire 317.7 177.0 20 669.7 457.6 30 528.9 407.9 50
Softball 10 119.9 147.4 2 44.9 21.7 6 63.7 68.2 8
Velocity 11 42.8 10.4 2 42.8 10.4 2
(feet per 12 22.5 0.0 1 22.5 0.0 1
second) 13 40.3 18.0 4 33.2 2.8 2 37.9 14.4 6
14 32.6 6.0 2 49.3 0.0' 1 38.2 10.5 3
15 35.8 8.7 3 35.1 7.6 3 35.5 7.3 6
16 30.5 0.0 1 57.8 0.0 1 44.2 19.3 2
17 32.5 7.3 2 41.6 12.7 5 39.0 11.6 7
Entire 47/8 52.0 14 41.2 14.6 21 43.8 34.2 35
50-Yard 10 18:3 7.1 2 12.9 7.7 4 14.7 7.3 6
Dash 11 17.4 0.0 1 17.0 6.6 6 17.1 6.0 7
(sec.) 12 15.6 0.0 1 - - 15.6 0.0 1
13 60.8 90.9 6 27.4 31.3 4 47.4 72.' 10
14 20.4 9.9 3 9.8 0.0 1 17.8 9./ 4
15 42.3 0.0 1 15.5 2.3 4 20.9 12.1 5
le 13.7 0.0 1 23.5 0.0 1 18.6 6.9 2
17 15.6 4.0 3 16.4 6.4 6 16.1 5.4 9
Entire 33.2 53.7 18 17.6 12.9 26 24.0 36.0 44
145

TA*SLE 3.5. (cont.)
118
Female Male CombinedVariable Age Mean SD* N Mean SD N Mean SD N
50-Meter 10 20.9 6.7 2 14.4 8.5 4 16.6 7.9 6Dash 11 19.2 8.9 6. 19.2 '8.0 6
(sec.) 12 - - -
13 67.8 99.3 6 29.4 33.0 4 52.4 79.0 1014 23.3 12.5 3' 10.8 0.0 1 20.2 12.0 4
15 47.9 0.0 1 17.3 2.3 4 23.4 13.8 5
16 15.2 0.0 1 26.0 0.0 1 20.6 7.6 2
17 17.3 3.5 3 17.8 6.6 6 17.6 5.5 9
Entire 39.6 62.2 16 19.3 13.7 26 27.1 40.4 42
Rise-to- 10w
2.3 1.4 5 2.3 1.4 5
Stand 11 2.7 0.0 1 2.0 1.2 5 2.1 1.1 6
(sec.) 12 - - - - -
13 10.6 5.9 5 5.3 5.3 2 9.1 5.9 /
14 7.7 2.5 1- 2.4 0.6 2 5.0 3.4 4
15 4.7 0.7 2-. 3.4 0.0 1 4.3 0.9 3
16 3.3 0.2 2 1.7 0.0 1 2.7 0.9 3
17 3.7 1.4 2 2.6 1.3 3 3.0 1.3 5
Entire 6.7 4.7 14 2.6 1.9 19 4.3 3.9 33
Mat Creep :0 8.3 6.2 6 8.3 6.2 6
(sec.) 11 8.3 0.0 1 6.9 3.0 5 7.1 2.7 6
12, - - - - - -
13 11.3 8.7 6 28.5 33.2 2 15.6 16.6 8
14 15.0 8.4 4 5.4 2.8 2 11.8 8.3 6
15 9.4 1.6 2 6.6 0.0 1 8.5 2.0 3
16 3.3 1.1 2 5.4 0.0 1 4.0 1.5 3
17 3.5 4.2 2 7.7 4.0 3 6.0 4.2 5
Entire .9.1; 7.5 17 9.3 10.8 20 9.6 9.3 37
Shuttle 10 20.4 3.5 2 21.0 6.5 6 20.8 5.6 8
Run 11 18.5 0.0 1 19.3 5.1 7 19.2 4.7 8
(sec.) 12 26.3 0.0 1 - 26.3 0.0 1
13 39.6 31.0 6 30.8 26.8 4 36.1 28.2 lc,
14 26.4 3.8 3 13.6 0.0 1 23.2 7.1 4
15 38.7 0.0 1 19.7 3.8 4 23.5 9.1 5
16 16.6 0.4 2 33.5 0.0 1 ,22.2 9.8 3
17 15.4 3.8 3 15.9 , 4.3 5 15.7 3.9 8
Entire 27.4 19.3 19 21.1 11.2 28 23.6 15.2 47
146)1.
Or

TABLE 3.5. (cont.)
Female Male Combined
14.0
Variab le Age Wan SD N Mean SD N Mean SD N
Sit and 10 20.8 8.6 6 20.8 8.6 6
Reach 11 21.0 11.3 5 21.0 11.3 5
(cm.) 12 50.0 0.0 1 50.0 0.0 1
13 27.3 5.3 6 15.7 7.5 3 23.4 8.1 9
14 22.0 9.5 3 17.0 0.0 1 20.8 8.2 4
15 17.0 1.4 2 2.0 0.0 1 12.0 8.7 3
16 25.5 19.1 2 27.0 2.8 2 26.3 11.2 4
17 20 0 15.6 2 21.8 12.7 5 21.3 12.2 7
Entire 25.3 10.9 16 20.0 9.9 23 22.2 10.5 39
Long 10 108.6 15.4 2 118.8 43.1 2 113.7 27.1 4
Distance 11 80.0 0.0 1 108., 89.1 4 102.7 78.2 5
Run 12 55.3 0.0 1 - 4 - 55.3 0.0 1
(Yards per 13 97.4 24.4 3 70.3 50.3 2 86.6 34.0 5
Minute) 14 109.6 67.1 3 - 199.6 67.1 3
15 - - 18.$ 8.8 2 18.8 8.8 2
16 68.8 0.0 1 36.7 0.0 f 52.? 22.7 2
17 81.4 0.0 1 97.8 74.6 ... 93.1 61.5 4
Entire 93.6 35.8 12 84.2 65.6 14 88.6 53.1 26
Stork Stand 10 0.0 0.0 1 7.0 3:2 4 5.6 4.2 5
(sec.) 11 21.4 44.0 5 21.4 44.0 5
12 - -
13 5.6 8.1. 5 15.0 19.8 2 8.3 11.4 .7
14 5.7 9.8 3 1.5 0.7 2 4.0 7.3 5
15 1.0 1.4 2 1.0 0.0 1 1.0 1.0 3
16 12.5 3.5 2 51.0 0.0 1 25.3 22.4 3
17 5.5 2.1 2 21.4 28.0 7 17.9 25.2 9
Entire 5.5 6.8 15 16.8 27.1 22 12.2 21.8 37
Is
147
IMMI

120
TABLE 3.6.
MEANS AND STANDARD DEVIATIONS OF PROJECT UNIQUE TEST ITEMS
BTAINED ON INDIVIDUALS WITH CEREBRAL PALSY.
Variable
Nu__
Mean
Female
SD
NMean
Male
SD
N
----------
Combined
Mean
SD
N
Triceps
10
15.0
8.1
22
10.8
6.3
40
12.3
7.2
62
Skinfold
11
10.1
4.0
23
11.1
5,4
36
10.7
4.9'
59
(mm. )
12
14.1
9.7
22
11.6
5.3
22
12.9
7.8
44
13
13.0
7.0
32
11,8
6.0
25
13.3
6.5
57
14
14.3
6.1
27
9.Z
6.6
26
12.1
6.7
53
15
13.8
6.5
20
12.2
7.3
22
12.9
6.9
42
16
15.3
6.6
13
9.4
4.3
23
11.5
5.9
36
17
17.1
6.8
17
10.5
4.8
16
13.9
6.7
33
-"I
Entire
13.9
7.1
176
11.1.
5.9
210
12.4
6.6
386
Abdominal
10
12.6
6.2
22
9.5
7.6
40
10.6
7.3
62
Skinfold
11
9.5
4.4
23
9.8
7.2
36
9.7
6.2
59
(mm.)
12
13.6
10.3
22
10.2
7.5
22
11.9
9.1
44
13
13.8
9.0
32
14.2
8.4
25
14.0
8.7
57
14
15.9
7.6
27
11.0
10.4
26
13.5
9.3
53
15
13.1
5.8
19
14.6
11.0
22
13.9
8.9
41
16
16.8
7.7.
12
12.2
6.2
23
13.8
7.0
35
1/
17.7
8.1
17
15.3
9.7
16
16.6
8.8
33
Entire
13.9
7.9
174
11.7
8.6
210
12.7
8.3
334
Subscapular
10
10.6
6.8
22
8.5
6.2
39
9.2
6.4
61
Skinfold
11
8.0
3.6
".:3
9.0
6.0
35
8.6
5.1
58
(man.)
12
11.3
8.7
22
9.9
6.6
22
10.6
7.7
44
13
11.2
5.9
31
11.6
6.4
25
11.3
6.1
56
14
11.4
4.4
27
9.8
8.6
25
10.6
6.7
52
15
12.2
5.8
18
12.8
8.9
22
12.5
7.6
40
16
13.6
6.0
13
10.7
3.2
23
11.8
4.5
36
17
15.3
6.1
17
11,6
4.2
16
13.5
5.5
33
Entire
11.4
6.2
173
10.2 .
6.6
207
10.7
6.4
380
Sum of
10
25.5
14.1
22
19.4
11.7
39
21.6
12.8
61
Triceps
11
18.2
7.2
23
19.9
10.5
35
19.2
9.3
58
and Sub-
12
25.4
17.9
22
21.5
11.6
22
23.4
15.0
44
scapular
13
24.4
12.1
31
25.3
11.4
25
24.8
11.7
56
Skinfolds
14
25.7
9.7
27
19.9
13.5
25
22.9
11.9
52
(Pm )
15
26.0
12.5
18
24.9
14.4
22
-25.4
13.4
40
16
29.0
11.9
13
20.0
6.7
23
23.3
9.8
36
17
32.4
11.6
'
17
22.0
7.9
16
27.4
11.1
33
Entire
25:3
12.7
173
21.3
11.3
207
23.2
12.1
380
148

121
, TABLE 3.6. (cont.
Variable Age MeanFemal
SD N MeanMaleSD N
CombinedMean' SD N
Sit-Ups 10 10.1 19 9.3 13.3 35 9.6 13.0 52
(no.) 11 8. 7.1 18 9.7 9.2 27 9.1 8.4 45
12 7.1 9/6 15 7.8 9.1 15 7.4 9.2 d30
13 5:2 -./.9 23 6.4 9.0 21 5.8 8.4 44
14 5.1 8.2 19 12.5 10.3 20 8.9 9.9 39
15 1.4 3.3 14 6.2 8.5 18 4.1 7.0 32
16 3.4 7.9 9 7.7 9.3 19 6.3 9.0 28
17 4.9 7.7 13 6.1 9.9 14 5.5 8.8 27
Entire 5.9 8.7 130 8.5 10.2 167 7.4 9.7 297
%
Leg gaise 10 9.3 12.3 17- 11.2 22.7 30 10.5 19.4 47
(sec.) 11 8.3 7.7 17 1 8.1 11.6 27 8.2 10.2 44
12 6.4 8.9 16 13.8 24:7 16 10.1 1,8.7 32
13 7.7 9.4 24 2.7 5.7 19 5.5 '8.2 43
14 8.9 13.4 18 13.2 15.6 17 11.0 14.5 35
15 9.8 7.9 14 6.8 6.0 17 8.1 7.0 31
16 14.9 22.6 10 6.7 6.4 18 9.6 14.6 28
17 3.8 4.8 13 10.2 35.0 12 11.2 25.2 25
Entire 8.4 11.2 129 9.7 17.9 156 9.1 15.3 285
Trunk Raise 10 42.3 67.3 12 16.1 11.6 16 27.3 45.7 28
(sec.) 11 19.2 20.6 10 22.5 26.6 11 20.9 23.4 21
12 13.1 27.2 8 10.8 8.1 5 12.2 21.3 13
.13 14.0 13.6 6 9.1 12.6 7 ,11.4 12.7 13
14 28.9 20.6 7 13.0 11.4 11 19.2 17.0 18
15 18.0 29.9 7 28.0 23.3 4 21.6 26,9 11
16 7.0 9.6 3 14.9 12.5 9 12.9 12.0 12
17 7.3 7.6 6 5.8 6.9 5 6.6 7.0 11
Entire 21.7 36.3 59 15.3 15.8 68 18.3 27.4 127
Right Grip 10 5.7 7.2 17 6.8 6.2 30 6.4 6.5 47
(kg.) 11 6.7 4.3 18 8.8 '7.2 26 8.0 6.2 44
12 10.7 7.5 18 10.8 7.7 18 10.8 7.5 36
13 13.7 9.8 22 15.1 8.4 22 14.4 9.3 44
14 14.1 9.0 21 15.0 9.7 20 14.6 9.2 41
15 10.9 7.8 16 16.8 11.4 19 14.1 10.2 35
16 15.5 8.1 11 23.8 11.1 22 21.0 10.8 33
17 15.8 5.3 14 22.9 13.1 14 19.4 10.5 28
Entire 11.5 8.3 137, 14.2 10.8 171 13.0 9.9 308
149

. .
122
TABLE 3.6. (cont.)
Variable Age - MeanFemaleSD N Mean
MaleSD N
CombinedMean Si) N
Left Grip 10 5.0 5.1 18 8.8 6.3 32 7.4 6.1 SO(kg.) . 11 6.5 5.4 19 8.6 6.2 26 7.7 5.9 45
12 9.3 6.7 19 11.5 7.1 17 10.4 6.9 3613 13.5 7.7 ?7 12.3 9.5 22, '- 0 8.4 4914 12.0 10.8 21 15.1 14.7 20 A....5 12.8 4115 9.1 7.7 17 18.9 9.1 19 14.3 9.7 3616 16.9 8.1 9 lo.7 13.0 22 18.9 11.7 31
17 15.4 8.4 14 24.2 11.8 14 19.8 11.0 28
Entire 10.6 8.3 144 14.0 10.9 172 12.4 9.9 316
Sum of 10 9.3 11.4 16 15.4 16.8 30 13.3 11.3 46.Grips,(kg.)
11
12
12.6
19.78.3
13.4
18
18
17.0
22.2
12.513.9
24
17
15.1
21.911.013.5
42
3513 27.3 15.4 21 26.8 17.1 21 27.0 16.1 4214 26.1 18.7 21 29.7 16.9 i9 27.8 17.8 4015 19.6 13.6 16 35.7 15.9 1.9 28.4 16.8 35
16 34.0 15.2 9 43.5 22.5 22 40.7 20.9 31
17 31.1 12.2 14 46.1 24.2 13 38.3 20.0 27
Entire 21.9 15.6 133 27.9 19.5- 165 23.2 18.1 298
Arm Hang 10 1.2 3.1 14 1.7 3.3 20 1.5 3.2 34
(sic.) 11 1.2 1.9 13 3.1 6.7 22 2.4 5.5 35
12 3.1 5.1, 11 5.1 10.2 14 4.2 8.2 25
13 2.5 4.5 11 4.2 8.6 1.) 3.5 6.9 24
14 1.0 1.7 13 4.1 4.9 16 2.7 4.1 2915 0.9 2.0 9 4.3 5.4 15 3.0 4.7 24
16 2.3 2.3 6 11.4 15.7 12 8.4 13.4 18
17 0.9 1.6 11 7.7 10.7 9 4.0 7.8 20Entire 1.6 3.1 88 4.7 8.5 121 3.4 6.9 209
Pull-Ups 10 0.2 0.8 14 0.4 0.8 20 0.3 ',.$ 34
(no.) 11 0.2 0.6 13 0.8 1.9' 22 0.5 1.6 35
12 1.4 2.9 12 0.9 1.7 14 1.2 2.3 26
13 0.5 0.8 11 1.5 3.2 13 1.0 2.4 24
14 0.0 0.0 13 0.8 1.5 16 0.4 1.2 29
15' 0.1 0.3 10 2.6 4.6 15 1.6 3.7 fte,..p.
16 0.2 0.4 6 2.2 3.8 13 1.6 3.2 19
17 0.3 0.6 11 1.9 3.2 8 0.9 2.3 19
Entire' 0.4 1.2 90 1.3 2.7 121 0.9 2.3 211
150

4
TABLE 3.6 . (cont.)
123
Female Male CombinedVariable A_e Mean SD N Mecn SD N Mean SD N
Broad Jump 10 26.5 10.2 11 32.2 12.5 15 29.8 11.7 26(inches) 11 27.3 14.5 11 26.0 12.9 12 26.6 13.4 23
12 30.8 17.0 6 27.6 18.4 7 29.0 17.1 13
13 23.6 14.2 7 35.6 11.5 8 30.0 13.8 15
14 22.6 21.5 8 40.3 13.6 12 33.3 18.9 2015 30.0 14.1 7 37.5 14.8 4 32.7 14.1 11
16 22.5 31.8 2 30.4 13.7 9 29.0 16.2 11
17 27.0 14.9 7 39.8 12.9 4 31.6 15.0 11
Entire 26.5 15.0 59 33.0 13.9 71 30.0 14.7 130
Softball 10 231.5 131.4 16 308.8 281.4 31 282.5 242.2 47
Distance 11 232.9 134.6 19 338.3 177.1 28 295.7 168.0 47(inches) 12 182.0 108.7 17 343.8 208.2 16 260.4 181.5 33
13 253.6 128.0 27 407.0 311.6 22 322.5 239.4 4914 244.4 209.5 21 424.1 264.7 18 327.3 250.4 39
15 168.9 79.7 14 520.5 447.0 14 344.7 362.3 2816 235.4 146.8 11 461.5 510.4 19 378.6 282.0 30
17 301.1 216.0 14 388.1 227.1 13 343.0 221.6 27Entire 232.9 151.4 139 386:5 282.0 161 313.3 243.0 300
Softball 10 25.3 7.6 10 39.2 39.6 17 34.1 32.1 27Velocity 11 31.6 12.8 15 31.9 9.7 19 31.8 11.0 34
(feet per 12 26.4 15.3 10 31.9 13.6 7 28.7 14.5 17
second) 13 39.0 57;1 16 32.2 13.8 17 35.5 40.5 3314 4027.4 13.6 14 42.8 35.1 16 35.6 27.9 3015 25.0 11.9 12 32.6 16.9 11 28.6 14.7 2316 23.3 7.5 9 35.6 14.6 11 30.1 13.2 20
17 29.8 11.2 12 35.2 11.7 9 32.1 11.4 21
Entire 29.2 25.3 98 35.5 23.2 107 32.5 24.4 205
50-Yard 10 25.9 18.3 13 30.7 31.3 29 29.2 27.8 42Dash 11 2g.6 17.1 15 23.5 11.5 25 23.5 13.7 40
(sec.) 12 41.7 34.3 18 31.5 35.7 16 36.9 34.9 3413 56.7 54.0 21 24.7 17.6 17 42.4 44.4 3814 36.9 25.7 21 33.3 47.4 18 35.3 36.8 3915 51.7 64.3 12 25.4 17.5 13 38.0 47.2 25
16 119.3 225.2 10 37.9 42.5 16 69.2 144.8 2617 51.8 59.2 12 28.8 19:4 10 41.4 46.2 22
Entire 47.9 76.7 122 29.3 30.2 144 37.8 57.1 266
151
01
4$

4
124
TABLE 3.6. (cont.
Variable Age Mean
Female
SD N MeanMaleSD N
CombinedMean SD N
50-Meter 10 31.0 20.9 12 35.3 36.1 29 34.0 -32.2 41
Dash 11 26.7 19.6 14 25.2 11.5 23 2.8 14.9 37
(sec.) 12 46.2 35.3 18 35.1 39.5 16 41.0 37.2 34
13 69.2 65.3 19 27.9 19.2 17 49.7 52.9 3614 47.4 38.6 19 37.9 54.4 17 42.9 46.3 36
15 57.7 71.1 12 28.4 19.4 13 42.4 52.3 25
16 141.1 277.9 10 42.0 47.7 16 80.1 177.7 2617 59.7 75.4 13 . 31.7 22.0 10 47.5 59.2 23
Entire 57.0 95.2 117 32.9 34.1 141 43.8 69.8 258
Rise-to- 10 3.6 1.9 12 2.5 0.7 16 3.0 1.4 28
Stand 11 2.9 0.7 11 3.3 1.6 13 3.1 1.3 24
(sec.) 12 3.7 2.2 9 3.5 1.5 7 3.6 1.8 16
13 3.1 0.7 8 2.7 1.3 6 2.9 1.0 16
14 12.9 22.6 7 3.2 2.7 13 6.6 13.7 20
15 4.1 2.1 9 2.9 1.1 4 3.8 1.9 13
16 5.2 2.2 4 3.1 1.3 7 3.9 1.9 11
17 5.7 3.1 7 4.7 2.3 6 5.3 2.7 13
Entire 4.8 7.6 67 3.1 1.7 74 3.9 5.4 141
Mat Creep 10 13.6 15.0 18 15.9 15.5 32 15.1 15.2 SO
(sec.) 11 12.0 11.2 18 11.3 6.7 28 11.6 8.6 46
12 15.7 16.3 18 12.8 12.7 18 14.3 14.5 36
13 14.5 11.6 21 10.0 7.6 18 12.4 10.1 39
14 21.5 16.5 19 13.9 19.2 18 17.8 18.0 37
15 15.6 15.1 13 10.5 5.2 16 12.7 10.9 29
16 14.1 10.3 9 16.0 13.5 16 15.3 12.3 25
17 31.3 44.2 11 17.1 21.3 11 24.2 34.6 22
Entire 16.8 18.8 127 13.4 13.2 157 14.9 16.0 284
Shuttle ld 25.7 18.0 14 40.7 34.7 32 36.1 31.2 46
Rim 11 28.2 16.5 16 26.8 14.8 25 27.3 15.3 41
(sec.) 12 46.8 31.3 19 34.3 36.6 17 40.9 34.0 36
13 52.2 39.7 20 34.9 22.1 20 43.6 32.9 40
14 42.8 23.4 20 46.0 68.2 18 44.3 49.2 38
15 45.6 31.4 12 35.8 25.8 14 40.3 28.4 26
16 44.2 22.3 11 37.2 26.3 16 40.0 24.5 27
17 49.2 39.4 12 39.7 25.7 13 44.3 32.6 25
Entire 42.1 29.8 124 36.7 34.6 155 39.1 32.6 279
A
152

f
125
TABLE 3.6. (cont.)
Variable Age MeanFemaleSD N Mean
MaleSD N
CombinedMean SD N
Sit and 10 18.1 10.9 11 15.5 7.1 20 16.4 8.5 31
Reach 11 18.8 9.7 12 17.7 9.8 15 18.1 9.6 27
(cm.) 12 13.5 7.2 11 21.0 9.5 11 17.3 9.1 22
13 25.4 14.1 11 21.2 8.8 11 23.3 11.7 22
14 24.1 18.1 8 16.3 11.6 15 19.0 14.3 23
15 17.7 13.9 10 18.6 12.S 8 18.1 12.9 18
16 13.5 15.5 4 10.8 7.1 13 11.4 9.2 17
17 20.4 9.0 9 22.5 . 9.4 6 21.3' 8.9 15
Entire 19.2 12.3 76 17.2 9.6 99 18.1 10.9 175
Long 10 93.1 32.9 9 '6.4 43.2 15 95.2 39.0 24
Distance 11 71.3 36.6 7 89.9 32.9 16 84.3 34.4 23
Run 12 79.7 43.9 9 76.3 20.9 8 78.1 34.0 17
(yards per 13 84.7 19.2 5 87.6 52.1 12 86.7 44.3 17
minute) 14 63.5 30.8 7 97.9 S3.1 14 86.4 48.9 21
15 52.2 29.9 8 77.8 50.8 8 65.0 42.4 16
16 48.9 24.7 4 83..0 65.3 10 73.3 57.9 14
17 81.8 36.8 11 76.3 52.8 8 79.5 42.9 19
Entire 73.9 35.1 60 87.7 46.4 91 82.2 42." 151
Stork Stand 10 7.0 7.5 11 7.3 9.4 16 7.1 8.5 27
(sec.) 11 14.3 35:1 10 7.5 8.1 12 10.6 24.0 22
12 14.3 20.4 6 18.8 33.3 6 16.6 26.4 12
13 1.0 1.4 2 28.5 39.4 8 23.0 36.7 10
14 2.2 1.S 5 3.0 0.9 10 2.7 1.2 15
15 5.7 ,9.2 7 -48.0 74.1 4 21.1 46.4 11
16 1.5 0.7 2 4.7 4.7 7 4.0 4.3 9
17 1%S 1.0 .6 7.5 13.0 4 3.9 8.2 10
Entire 7.6 18.0 49 12.4 26.1 67 10.4 23.1 116
153

0
126
TABLE 3.7. PERFORMANCE OF SUBJ1CTS hITH CEREBRAL PALSY ON RUNNING EVENTSCATEGORIZED BY SEX AND METHOD OF AMBULATION.
Method ofAmbulation Mean
TemaleSD N Mean
MaleSD
1
N.
. .
. 50-Yard Dash (sec.
Wheelchair 96.9 125.1 36 56.8 45.5 34
Other Assistivebevice 40.3 26.6 26 33.6 21.7 35
Unassisted 19.8 9.9 58 14.7 7.1 74
Total 47.4 7b.9 120 29.3 30.3 143
Shuttle Run (sec.!
Wheelchair 73.0 29.3 34 69.7 42.3 34
Other Assistive Device 44.6 25.4 26 46.8 37.8 38
Unaisisted 24.9 14.5 63 18.2 6.6 81
Total 42.3 29.8 123 36.8 34.8 153
Long Distance Run (Yards Per Minutel
Wheelchair 51.1 34.0 18 46.9 25.7 17
0.:;er Assistive Device 54.9 23.6 16 57.4 26.7 28
Unassisted 74.8 39.2 40 107.2 45.1 56
Total 64.7 36.4 74 83.3 46.4 101
154
4

TABLE 3.8. MANS AND STANDARD Ifl OF PRoi1, C1 UNIQUL TLST ITEMS
OBTAINED Oh INDIVIDUALS h1111 SPINAL NLUROMUSCULAR IMPAIRMLNTS.*
Female Male Combined
127
Variable Age Mean SD N Mean SD N Mean SD
Tricep 10 12.4 5.0 16 17.2 5.8 13 14.5 5.8 29Skinfold 11 13.7 7.8 14 13.6 3.4 9 13.7 6.4 23
(mm.) 12 14.6 7.4 10 14.7 6.2 10 14.o 6.6 2013 14.4 7.4 6 19.6 10.3 7 17.2 9.1 1314 18.2 8.J 5 S' 9 5.4 7 13.4 7.6 1215 21.7 6.6 11 12.6 5.8 10 17.3 7.6 2116 21.8 10.1 6 23.2 13.9 S 22.4 11.3 11
17 16.5 5.9 5 12.1 5.3 11 13.5 5.7 16
Entire, 16.0 7.6 73 14.9 7.4 72 15.4 7.5 145
AbAominal 10 14.5 7.7 15 17.1 7.1 12 15.7 7.4 27
Skinfold 11 12.3 7.8 14 17.3 8.4 8 14.1 8.2 22(mm.) 12 16.2 8.7 10 14.6 5.4 9 1S.4 7.2 19
13 15.5 8.8 5 15.9 9.2 6 15.7 8.6 11
14 18.8 16.6 5 12.7 7.3 6 15.5 12.2 11
15 19.2 17.4 IO 19.9 12.1 8 19.5 14.9 1
16 25.3 14.3 6 29.5 11.6 5 2712 12.7 11
17 25.6 17.4 5 14.2 6.4 10 18.0 12.0 15
Entire 17.1 12.0 70 17.1 8.9 64 17.1 10.6 134
Subscapular 10 9.9 5.0 15 13.7 5.4 12 11.6 5.4 27
Skinfold 11 11.1 6.6 14 12.0 4.7 8 11.5 5.9 22
(mm.) 12 13.8 8.5 10 13.8 6.0 9 13.8 7.2 19
13 9.8 4.0 6 16.3 10.3 7 13.3 8.4 13,
14 16.9 11.9 5 9.5 4.5 7 12.6 8.8 .12
15 15.6 11.8 11 14.8 8.2 9 15.3 10.1 20
16 21.5 8.6 26.t) 13.6 5 23.5 10.8 11
17 18.5 10.4 5 12.6 5.1 10 14.6 7.5 15
Entire 13.6 8.7 72 14.3 7.8 67 13.9 8.2 139
Sum of 10 22.0 9.8 15 31.5 10.3 12 76.2 10.9 27
TricTs 11 24.9 14.0 14 25.4 8.1 8 25.1 12.0 22
and Sub- 12 28.3 15.5 10 29.0 10.9 9 28.7 13.1 19
scapular 13 24.2 11.2 6 35.9 19.9 7 30.5 17.0 13
Skinfolds 14 35.1 20.1 S 19.4 9.7 7 25.9 16.2 12
(mm.) 15 37.2 17.3 11 28.3 11.2 9 33.2 15.2 20
16 43.3 18.3 6 49.2 27.3 5 46.0 21.8 11
17 35.1 15.8 5 25.6 8.0 10 28.7 11.6 15
Entire' 29.5 15.6 72 29.6 14:2- -67 29.6 14.9---139-
*Data presented relative to skinfold and softball test items include allsubjects classified as spinal neuromuscular. Data pertaining to gripstrength, flexed arm hang, and pull-ups include all subjects classified asspinal neuromuscular, except for quadriplegics. Data pertaining to theSO-yard and 50-meter dashes, shuttle run, and long distance run include onlysubjects classified as spinal neuromuscular and who performed these testitems in wheelchairs.

Variable Age MeanFemale
SD N MeanMaleSD N
CombinedMean SD N
Right Grip 10 9.2 6.6 15 10.1 5.9 13 9.6 6.2 28(kg.) 11 11.9 6.0 13 15.2 4.5 9 13.3 5.5 22
12 11.7 7.4 10 28.0 18.7 10 19.9 16.2 2013 15.0 6.8 5 23.4 9.9 7 19.9 9.5 1214 12.0 9.7 5 24.8 10.7 5 18.4 11.8 1015 22.8 6.7 10 26.0 13.5 10 24.4 10.5_ 20-
16 19.8 4.3 6 45.4 12.9 5 31.5 15.9 11
17 26.7 14.5 3 31.0 10.7 9 29.9 11.2 12
Entire 14.5 8.6 67 23.6 14.5 68 19.1 12.8 135
Left Grip 10 8.1 5.9 15 .9.2 6.1 13 8.6 5.9 28
(kg.) 11 11.2 5.2 11 13.4 5.4 9 12.1 5.3 22
12 11.0 7.8 10 24.1 18.7 10 17.6 15.5 20
13 12.8 5.7 S 21.0 13.0 7 17.6 11.0 12
14 12.2 12.4 5 18.8 11.3 6 15.8 11.7 11
15 19.7 6.9 10 23.5 15.1 10 21.6 11.6 20
16 18.7 5.5 6 42.2 12.9 5 29.4 15.3 11
17 24.7 12.7 3 29.6 10.9 9 28.3 11.0 12
Entire 13.2 8.3 67 21.1 14.6 69 17.2 12.5 136
Sum of 10 17.3 12.4 15 19.3 11.8 13 18.2 12.0 28
Grips 11 23.1 10.6 13 28.7 9.3 9 25.4 10.2 22
(kg.) 12 22.7 14.8 10 52.1 37.1 10 37.4 31.4 20
13 27.8 12.3 5 44.4 22.6 7 37.5 20.2 12
14 24.2 21..3 .5 45.6 22.0 5 34.9 23.3 10
15 42.5 13.3 10 49.5 28.3 10 46.0 21.8 20
16 38.5 8.2 6 87.6 25.1 5 60.8 30.7 11
17 51.3 27.2 3 60.6 21.1 9 58.3 21.8 12
Entire 27.7 16.5 67 44.8 28.9 68 36.3 25.0 135
Arm Hang 10 3.1 5.1 12 2.0 4.9 11 2.6 4.9 23
(sec.) 11 4.9 5.8 13 5.1 8.8 8 5.0 6.8 21
12 1.8 2.7 8 8.9 11.1- 8 5.3 8.6 16
13 6.7 11.5 3 7.0 8.6 5 C.9 9.0 8
14 1.8 2.5 5 5.4 7.6 5 3.6 5.7 10
15 4.8 5.5 9 6.8 5.7 9 5.8 5.5 18
16 0.3 0.5 4 13.3 7.4 3 5.9 8.2 7
17 0.0 0.0 3 8.7 8.1 7 6.1:1 7.8 10
Entire 3.3 5.1 57 6.4 7.8 56 4.8 6.8 113

129
TABLE 3.8. cont.
Variable Age MeanFemale
SD N MeanMaleSD N
Combined.
Mean SD N
Pull-Ups 10 1.3 2.3 12 0.5 1.0 11 0.9 1.8 23
(no.) 11 1.6 2.4 11 1.1 0.8 8 1.4 1.9 19
12 1.1 1.8 8 1.9 2.3 8 1.5 2.0 16
13 0.0 0.0 3 2.8 4.3 4 1.6 3.4 7
14 0.0 0.0 S 3.8 5.3 5 1.9 4.1 10
15 0.6 1.3 10 2.8 2.9 9 1.6 2.4 19
16 0.0 0.0 4 3.7 3.2 3 1.6 2.7 7
17 1.0 1.0 3 3.4 3.2 7 2.7 2.9 10
Entire 0.9 1.8 S6 2.2 2.9 55 1.5 2.5 111
Softball 10 183.4 90.0 16 221.1 86.8 13 200.3 89.1 29
Vistance 11 206.4 98.5 13 415.1 195.2 8 285.9 173.0 21
(inches) 12 239.5 173.9 10 549.3 325.3 10 394.4 299.5 20
13 246.0 139.7 6 432.1 281.0 7 346.2 238.6 13
14 185.8 102.1 5 375.3 320.5 8 302.4 269.5 13
:5 263.5 62.8 10 397.2 249.3 10 330.4 189.7 20
16 205.2 69.2 6 651.8 374.8 5 408.2 336.1 11
17 188.6 105.7 S 391.7 234.1 9 319.1 217.6 la
Entire 214.5 107.8 71 406.' 270.0 70 309.9 225.9 141
Softball 10 24.2 5.5 13 23.7 5.5 9 24.0 5.3 22
Velocity 11 24.7 7.9 9 38.2 13.7 7 30.6 12.5 16
(feet per 12 22.6 8.9 9 34.6 12.1 8 28.3 11.9 17
second) 13 34.5 29.3 6 32.4 12.0 6 33.4 21.4 12
14 21.2 8.1 5 31.4 14.4 4 25.7 11.8 9
15 25.9 4.0 9 29.6 6.7 8 27.6 5.6 17
16 21.7 5.4 5 41.8 15.2 3 29.2 13.8 8
17 24.4 9.2 5 32.2 9.4 7 28.9 9.8 12
Entire 24.9 11.1 61 32.0 11.1 52 28.2 11.6 113
50-Yard 10 37.4 17.4 7 27.2 8.0 10 31.4 13.3 17
Dash 11 21.9 2.6 7 22.3 4.4 6 22.1 3.4 13
(sec.) 12 21.3 3.5 S 21.6 6.5 8 21.5 5.3 1313 40.7 9.6 3 28.9 21.0 4 33.9 17.0 7
14 22.9 6.0 4 75.7 105.6 5 52.2 79.8 9
15 - 23.0 7.5 10 56.7 96.4 7 36.9 61.7 17
16 24.1 2.5 5 16.8 2.0 4 20.8 4.4 917 46.5 23.6 4 19.5 2.2 7 29.3 18.9 11
Entire 28.3 13.3 45 32.8 49.0 51 30.7 36.8 95
157

I
TABLE 3.8. (cont.)
130
Female Male CombinedVariable Age Mean SD Mean SD Mean SD N
SO -Meter 10 33.2 7.9 7 31.1 11.2 10 32.0 9.7 17
Dash 11 24.0 3.3 7 25.2 5.7 4 24.4 4.1 11
(sec.) 12 22.5 4.1 4 21.1 6.2 6 21.7 S.3 10
13 50.9 17.0 3 31.3 19.8 4 39.7 20.1 7
14 25.0 7.1 4* 93.9 117.7 4 59.4 85,.5 8
15 28.0 7.6 9 65.7 109.3 7 44.4 72.0 16
16 26.9 2.9 5 18.2 0.2 2 24.4 4.9 7
17 49.7 24.3 4 21.4 2.9 7 31.7 19.7 11
Entire 30.9 13.0 43 38.3 56.9 44 34.6 41.4 87
Shuttle Run 10 37.7 10.3 8 34.7 8.0 10 36.1 8.9 18
(sec.) 11 28.7 6.6 8 30.0 7.3 5 29.3 6.7 14
12 27.6 4.0 5 28.3 6.2 9 28.0 5,3 14
13 51.5 10.5 3 35.3 20.6 4 42.2 18.0 7
14 30.8 5.5 4 57.9 33,8 6 47.0 29,0 10
15 30.5 7.4 10 63.5 88.1 7 44.1 56.7 17
16 36.7 6.1 5 24.6 1.7 4 31.3 7.8 9
17 46.0 29.5 5 32.3 8.7 9 37.2 19.0 14
Entire 34.7 13.0 48 38.2 34.6 SS 36.6 26.7 103
Long 10 68.0 32.5 7 83.9 33.6 9 77.0 33.0 16
Distance 11 82.2 20.2 b 75.2 34.1 6 78.4 27.5 11
Run 12 95.9 18.7 5 111.0 27.3 6 104.2 23.9
(yards per 13 48,9 35.3 3 84.7 40.0 3 66.8 39.0 6
minute) 14 70.5 42.1 4 48.5 43.3 3 61.1 40.6 7
15 79.0 29.3 9 75.1 35.1 6 77,4 30.6 15
16 76.6 28.4 5 111.9 0.0 1 82.4 29.2 6
17 60.4 25.9 5 79.9 38.1 7 71.7 33.7 12
Entire 74.2 29.3 43 82.8 35.5 41 78.4 32.5 84
4
158
(

TAbLE 3.9. MEANS AND STANDARD DEVIATIONS OF PROJECT UNIQUE TEST ITEMSObTAINIID SUBJECTS CLASSIFIED AS SPINAL NEUROMUSCULAR-PARAPLEGIC.
Test Item MeanFemale
SD N MeanMaleSD N Mean
TotalSD
Triceps 16.1 8.0 57 15.2 6.8 54 1S.7 7.4 111
Skinfold (mm.)Abdominal 17.5 12.9 54 17.8 8.3 47 17.6 10.9 101
Skinfold (mm.)Subscapular 13.9 8.9 56 14.4 6.9 50 14.1 8.0 106Skinfold (mm.)
Sum of Triceps
and Subscapular30.0 16.1 56 30.2 12.5 50 30.1 14.4 106
Skinfolds (mm.)Shuttle Run (sec.) "32.7 10.9 53 35.1 33.6 S3 33.9 24.9 106
Right Grip (kg.) 14.6 9.0 56 23.1 14.5 56 18.8 12.8 112
Left Grip (kg.) 13.4 8.8 56 21.0 14.7 56 17.2 12.6 112
Sum of Grips (kg.) 27.9 17.5 56 44.1 28.9 56 36.0 25.1 112
Flexed Armhang (sec.)
2.5 4.2 48 5.7 7.4 45 4.1 6.2 93
Pull-Ups (no.) 0.8 1.6 46 2.1 2.7 45 1.4 2.3 91
50-Yard Dash (sec) 26.8 10.1 53 29.2 37.1 51 28.0 26.8 104
50-Aeter Dash(sec.)
29.7 11.0 51 33.9 42.3 44 31.6 31.7 95
Softball 202.8 94.9 56 390.0 233.4 53 293.8 199.1 109
Distance (in.)Softball Velocity(ft. per sec.)
24.3 11.9 47 1 31.6 11.0 42 27.7 12.0 89
Long Distance Run 823.0 319.7 46 871.3 357.4 42, 845.1 337.1 88
(Yards per mite.

13:
Physical Fitness Test Performance as a Function ofCondition, Sex, and Age
In this section the influence of condition, age, and sex differences onphysical fitness, as determined through multivariate and univariate analysisof variance techniques, is presented. Since normal, auditory impaired, andvisually impaired subjects were designated to take the same test items (seeparticipation guide), their data were analyzed together. Performance data onthe cerebral palsy and spinal neuromuscular groups were analyzed and arepresented separately. These latter tv.o groups of subjects were compared withnormal subjects only: Comparisons were made between normal and orthopedicimpaired subjects only on items where procedures were reasonably similar. Forinstance, comparisons were not made on running items since many orthopedicimpaired subjects used wheelchairs or other assistive devices. Minor proceduraldifferences (e.g., cerebral palsied subject could not cross arms on chestproperly for sit-up test) were allowed for the purposes of data analysis.
MultivariAte analysis of-variance procedures were employed for thenormal, auditory impaired,.visually impaired, and spinal neuromuscular groups.Multivariate procedures were not utilized with the cerebral palsied group dueto the fact that the participation guidd dictated that different and veryspecific classes of cerebral palsied subjects took different items, tnerebyobviating a multivariate approach. Univariate analysis of variance wasemployed as the post hoc test when significant multivariate F ratios werecalculated. It should be noted, however, that the univariate ANOVAs werecalculated separately from the multivariate statistics. This was done so thatall subjects who took an item could be included in the analysis of.that itemregardless of whether or not they had taken the remaining items in the battery.The result of this approach was that tbe univariate statistics were calculateden somewhat different group of subjects than were the multivariate statistics;however, a greater number of subjects were available for the univariate analysis"!
The .05 level of significance was adopted for use with all multivariateANOVA procedures. In the univariate analysis, the .01 level of significancewas adopted for use to help reduce experimentwise-error.
Graphic analysis (means were plotted with 99 percent' confidence intervals)
and the Scheffe' multiple comparison procedure were used for other post hoccontrasts. Graphic analysis was used to help explain main effects in thepresence of significant interaction, while the Scheffe' procedure was used toexplain main effects in the absence of significant interaction. The Scheffe'procedure was selected because it is appropriate for unequal cell sizes. Sincethe Scheffe' procedure is more conservative than other multiple comparisontechniques, the .05 level of significance was adopted instead of the morerigorous .01. This would seem to be consistent with Ferguson's (1971) suggestion.
4
CoTparisons of Normal, Auditory Impaired,and Visually Impaired Groups/Conditions
A three-way analysis of variance design was used to investigate theeffects of condition, age, and sex on the normal, auditory impaired, andvisually Impaired subjects. The results of the multivariate ANOVA yielded asignificant sex by age by condition interaction (pc..000). Since the multi-variate ANOVA indicated an "interaction model," the post hoc univariate
1 60

133
analysis was performed. The results of the three-way univariate ANOVA testsare presented in Table 3.10.
TABLE 3.10. UN1VARIATE F VALUES FOR NORMAL, AUDITORY IMPAIRED, ANDVISUALLY IMPAIRED SUBJECTS BY SEX, AGE, AND CONDITION.
Test Item Sex
4
Abe Cond.
Sex
X
Age
SexX
Cond.
AgeX
Cond.
Sex
X
AgeX
Cond.
Triceps Skinfold / 102.87* 3.66* 16.80* 3.32* 15.92* 1.17 .74
Abdominal Skinfold 18.71* 9.43* 16.84* 1.94 1.98 1.67 1.31
Subscapular Skinfold 40.89* 14.33* 26.00* 2.31 , .01 1.65 1.23
Sit-Ups 231.08* 16.57* 134.65* 2.71* 12.55 1.40 1.46
Leg Raise 78.84* 30.91* 33.55* 4.33* .03 1.10 .53
Trunk Ruise .12 5.66* 59.61* 1.56 1.85 .97 .79
Mat Creep 72.44* 2.73* 46.17* 1.34 2.98 1.07 .47
Shuttle Run 33.71* 18.00* 199.36* 3.01.* 2.62 1.92 3.12*
Sit apd Reach 111.51* 13.95* 32.36* 1.70 14.70* 1.56 .61
RighrGrip 538.84* 244.42* 96.24* 41.98* 3.29 5.20* 1.07
Left Grip 503.92* 222.25* 78.44* 44.49 3.59 5.27* .40
Arm Hang 283.81* 6.35* 25.31* 5.25* 3.39 5.13* 1.64
Pull-Ups 698.06* 23.77* 7.81* 28.20* 6.14* 1.03 .82
50-Yard Dash 165.95* 48.61* 172.87* 7.79* 1.97 1.90 1.53
Broad Jump 587.54* 102.88* 138.50* 19.8',' .33 .81 1.43
Softball Throw 1213.30* 99.97* 261.17* 19.13* 30.10* 2.08* 2.12*
(Distance)Long Distance Run 334.76* 12.00* 69.63* 7.24* 6.15* .56 .97
*Significant at the .01 level.
results of the univariate ANOVA presented in Table 3.10 axe discussedbelow for each test item.
Triceps Skinfold
Results which emerged relative to triceps skinfold are depicted inFigures 3.1A and 3.2A. A significant sex factor emerged for the tricepsskinfold due to the fact that girls 114d significantly larger skinfolds thanboys between the ages of 14 and 17. The scores of the auditory impaired andvisually impaired subjects evidently contributed the most to these differencessince no overall difference was observed between normal boys and normal girlsOn the triceps measure. Auditory impaired and visually impaired girls hadlarger triceps skinfold measures than normal girls. There was no significantdifference in triceps skinfold of the auditory impaired aid the visually impairedfemale subject groups. Conlition was not a significant factor for boys; nosignificant differences emerged among the three groups of male subjects. Age
was a significant factor for both sexes, although after ages 11 or 12, girlstended to have larger skinfolds and boys smaller skinfolds. For instance,
girls between the ages of 13 and 17 had significantly larger skinfolds than 10
161

k
Girls Boys
iiz
I
16
14
12
10
46
40
55
50
£3
40
33
)2
25
20
I
i i
1 t
t
ANN
`\ \\ .1. I\1. ........----..
1
:9
1L.-110 11 12 13 14 0 0 11
l'geTRICEPS SKINFOLD
-A -
10 11 12 13 0 15 16 IfAge
LEG RAISE
-C-
oo
)5
)1)
E10ii) 002
20
15
10 I
39
11
t bE
z 33
II
. 29
it
EVI
fe0002
0
40
3$
30
25
20
15
10
I
1
;
,
10 11 12 13 14
Age
SITUPS
.43.
15 16 a
,
10 11 12 13 14 15 0 IP
Age
RIGHT GRIP
i
://i/i "...:.......1.........
/i i
r /1 ...i..'i
10 11 12 13 0 15 16 13
Age
LEFT GRIP
-E
Figure 3.1 Significant sex by age interactions (means plotted with 99% confidence intervals)
for normal, auditory impaired and visually impaired subjects.
162
134
47

Girls 7- - Boys
O
I
zo
16 ". 4.44
;
12
41
to
10 .11 11 13 1 1$ 16 13
Age
ARM HANG
6
to tl ti ) 13 14 IS 16 ItAge
50ARD DASH
-H
E3
0
SS
tOL
13
I
i,/I/I
1 1
10 H 17 15 1 IS 16 13
Age
PULLAIn-G-
or
I0 11 1: 13 II 16 16 13
Age
STANDING BROAD JUMP
10 11 11 13 14 16 1.6 ItAge
LONG DISTANCE RUN
Figure (cont ) Significant sex by age interactions (means plotted with 99% confidence intervals)
for normal, auditory impaired and visually impaired subjects.
163

GaAs BoYs
tr
1.3
Normal Auditory V(suet
&Med GO*ICKEPS SIONfOLO
-A-
NOM* AudIt011
Subject Group
PLILLOS
3. 2 Significant sex by condition interactions (meansplotted with 99%figure confidence interval:
-C-
for normal, auditory impaired and visually is,npaired subier
311
§ 21
C)
24
23
Normal Auditory VisaSulam Grouts
SIT & REACH-8-
IAD
132
Noma! Auditor; %Asa
SubjectGroup
LONG OtSTANCE
VS
t.
164

+,
e"
I-
Normal Auditory - -- Visual
24
41
2941
35
31
3)
E p
22 ziro 25
21
19
JP r)$
13
'IF
.
/ t
f-t
10 It 12 13 14 s$ 16 17
Age
RIGHT GRIP-A
24
70
36
3$
32
30
26
v. 26
e 74
ao- r2
2 2010
16
14
12
10
10 it 12 a '14 15 16 )2
Age
LEFT GRIP
-8-
4
10 11 12 t is t$ 16 17
Age
ARM HANG
-C-
Figure 3,3 Significant age by condition interactions (meal's plotted with.99% confidence intervals)
for normal, auditory impaired and visually impaired subjects.
165
137

Girls - - Boys
77
113
tr.*
c 160
14
17
10
7?
r 20
_
10 11 17 11 U 19 16 13
IS
0 16
14
10
171
1 . --
1
(0 II 12 13 PI 15 lo
Age AgeSHUTTLE RUN SHUTTLE RUN
NORMAL AUDITORY
-A-
11
10
190
110
150
110lr
90
m
.41
1/0
150
1101..
4.)
50
0
. .
1.41
7t)
Ik
1
III)
al
TO
4)
10
-
1 1
1
12 1 I 14
Age
SHUTTLE RUNVISL.
-C
,e
/
11
r
1
16
1
i
11 10
e
1
11 ( 13 14 15
Age
SOFTBALLDISTANCE
NORMAL
T
1
L
i 1 1
16
;
I
It
PO
att 11 12 13 14 35 16 17
AgeSOFTBALL DISTANCE
AUDITORY
-E
10 1' 12 11 14 14 16 ItAge
SOFTBALL DISTANCEVISUAL
-F-
figure 3.4 Significaht :ex by age by condition interactions (mean means plotted with 99% confidence intervals)
for normal, auditory impaired and visually impaired subjects.
166
138
v

139
or 11 year old girls. Conversely, boys between the ages of 14 and 16 hadsignificantly smaller skinfolds than 12 year old boys.
Abdominal Skinfold
Only main effects were significant for the abdominal skinfold measure.Girls had significantly larger skinfolds than boys. Subjects between the agesof 13 and 17 had significantly larger skinfolds than 10 and 11 year old subjects.Normal subjects (both boys and girls) had significantly smaller abdominalskinfolds than the visually impaired and auditory impgired subjects. No
significant difference was found between auditory impaired and visually impairedsubjects.
Subscapular Skinfold
Only main effects were significant for the subscapular skinfoldmeasure. Girls had significantly larger skinfold measures than boys. Oldersubjects (13-17) had significantly larger skinfolds than younger subjects(10-11). Normal subjects had significantly smaller subscapular skinfolds thanauditory impaired subjects and visually impaired subjects. No significantdifference was found between auditory impaired and visually impaired subjects.
Results pertaining to sit-up performance (see Figure 3.1B) indicatethat boys performed significantly more sit-ups than girls between ages 14 and 17.In view of the lack of significant interaction of condition with sex or age,the pattern can be considered similar for all three groups. Age was a significantfactor for boys but not for girls. Older boys, in general, performed significantlymore sit-ups than younger boys. Regardless of sex or age, normal subjectsperformed more sit-ups than the auditory impaired or the visually impaired groups. 'The auditory impaired and visually impaired groups did not differ significantlyform each other on the sit-up test.
Leg Raise
Except for significant differences in *favor of boys at the ages of16 and 17, no significant differences were found on the leg raise test betweenboys and girls (see Figure 3.1C). Since condition does not interact significantlywith sex or age, this pattern can be considered similar for all three groups.Age was a significant factor for both sexes; older subjects tended to performlonger leg raises than younger subjects, especially after age 13. There was nosignificant interaction of age and condo 'on. Regardless of sex and age,normal subjects had significantly higher leg raise scores than auditory impairedor visually impaired subjects. No significant difference was observed betweenauditory impaired and visually impaired subjects.
Trunk Raise
.Only the main effects of age ane condition were significant for theunivariate ANOVA on trunk raise. Regardless of condition or age, no signifi-cant difference in trunk raise performance was observed between boys and girls.The significant age effect was primarily due to the superior performance ofthe 16 year olds when contrasted to some of -:he younger age groups (10, 12, and13); other differences in age were nonsignificant. Normal subjects performed
167

140
significantly longer trunk raises than both visually impaired and auditoryimpaired subjects, and auditory impaired subjects performed Lignificantlylonger trunk raises than visually impaired subjects.
Mat Creep
The main effects of sex, age, and condition were significant for themat creep test. Boys were faster than girls on the mat creep. The lack ofa significant sex by condition interaction indicates that this pattern can be
considered similar for the three major groups. Despite the significant ageeffect, the Scheffe' procedure did_not find any age differences at the .05level. (When the Scheffe' alpha was raised to .10, a significant differencewas found between 12 and 16-year old subjects favoring the older group.)Visually impaired subjects were significantly slower than normal and auditoryimpaired subjects. This difference, at least in part, may be attributable tothe sight requirements the task. There was no significant difference betweennormal and auditory impaired subjects on the mat creep.
Shuttle Run'
Informatibn pertaining to the shuttle run is presented in Figures 3.4A-C.A significant sex effect (boys faster than girls) was obtained for normal subjectsbetween ages 14 and 17 and auditory impaired subjects between the ages of 15 and17. Na significant sex differences emerged for visually impaired subjects.Age was a significant factor for normal and auditory impaired boys; older boystended to perform the shuttle run faster than younger boys. Age was notsignificant for normal and auditory impaired girls or for visually impairedboys and girls. Significant differences were observed between conditions forfemale subjects. Normal girls were faster than auditory impaired girls at 10and 15 years of age, and were faster than visually impaired girls at all ages.Auditory impaired girls were faster than visually impaired girls at age 12 andbetween the ages of 14 and 17. Normal boys exceeded the performance of auditoryimpaired boys at'll and 14 years of age and exceeded the performance of visuallyimpaired boys at all ages except 12 and 17. Auditory impaired boys ran fastershuttle runs than visually impaired boys between ages 15 and i7. A, with themat creep, at least some of the differences observed between visually impairedsubjects and those from the other two groups were probably the result of thesight requirements of the task and the fact that running procedure were modified(partner or guide wire assisted) for skme visually impaired subjects. (In this
regard, the reader may wish to interpret these results with some caution, sincemodifications in running procedure resulted in variances which were considerablylarger for the visually impaired group than for either the normal or auditoryimpaired groups.) The effects of running procedures on the shuttle run perform-ance of visually impaired participants is investigated in a subsequent Sectionof this report.
Sit and Reach
Age was a significant factor on the sit and reach test regardless ofsex or conditioh, with older subjects generaliy scoring significantly higherthan younger subjects. Girls had significantly higher scores titan boys on thesit and rLd.:11 within the normal and auditory impaired groups. Sex was not astatisticall:: significant factor for the visually impaired group (see:,igre 3.24). Condition was not a significant factor for boys; no significant
168

141
differences were ebserled between tne thr.se groups of subjects. Normal girlsubjects, however, made significantly higher scores than auditory impaired orvisually impaired girls. No significant differences were found betweenauditory impaired and visually impaired girls.
Right Grip Strength
Boys had significantly higher right hand grip strength scores thangirls between ages 14 and 17. Age was a significant factor for all conditions;older subj is generally did better than younger subjects, and this was true ofgirls as well as, boys. The sex by age interaction is apparently due to the factthat at approximately age 14, the rate of improvement was considerably greaterfor boys than it was for girls (see Figure 3.1D). No significantldifferencesbetween normal and auditory impaired subjects on right hand grip)strength werediscovired. Normal subjects, however, made significantly higher scores thanvisually impaired subjects between the ages of 13 and 16. Auditory impairedsubjects (boys and girls) exceeded the performance of the visually impairedsubjects at ages 14, 15, and 17 (see Figure 3.3A).
Left Grip Strength
As with the right hand grip strength, boys made significantly higherscores than girls between the ages of 14 and 17 on left hand grip strength.This pattern may be considered similar for al' groups. Age was a significantfactor, regardless of sex or condition; although at approximately age 13,boys began to make more rapid gains in grip strength than did girls (seeFigure 3.11.). No significant differences existed between normal and auditoryimpaired subjects. Normal subjects, however, significantly exceeded theperformance of visually impaired subjects at ages 13, 1S, and 16; and auditoryimpaired subjects surpassed visually impaired subjects at ages 10, 13, 14, IS,
and 17 (see Figure 3.3E).
Flexed Arm Hang
The performance of boys on the arm hang significantly exceeded thatof girls between the ages of 12 and 17 (see Figure 3.1F). Age was found to bea significant factor for boys, most notably due to the superior performance ofthe 15 to 17-year olds; no significant differences were observed between 10 to14-year old boys. Age had a different effect for girls. A nonsignificantdecrease in performance was found between 11 and 13-year old girls, followed bya significant increase between 13 and 16-year old girls. The age by conditioninteraction indicats that the performance curve for normal subjects is differentthan those of the two impaired grouts (see Figure 3,3C). Age was significantfor normals 'because of the inferior performance of the 14-year olds as opposedto the superior performance of the older groups (15-17), as is the case withthe auditory and visually impaired subjects. Normal subjects did significantlybetter than visually impaired subjects between the ages of 10 and 12 and
_significantly better than auditory impaired subjects at ages 11 and 12. Auditory_impaired subjects made significantly higher scores than visually impairedsubjects at age 16, but no other significant condition differences were observed.
Pull -H
Regardless of age or condition, boys did significantly more pull-upsthan girls (see Figures 3.1G and 3.2C). Age was a significant factor for boys;
169

142
performance increased as age increased. Age was a nonsignificant factor forgirls; in fact, performance even declined somewhat between ages 11 and 14 and1S and 17, Condition was not a significant factor for girls; no significantdifferences were observed between the subject groups for girls. Auditoryimpaired boys, however, made significantly higher scores than visually impairedboys on pull-ups. The performance of the normal boys did not differ signifi-cantly from the performance or either of the impaired groups.
SO-Yard Dash
Results of data analysis indicate that boys significantly exceeded theperformance of girls on the 50-yard dash for all conditions. Boys ran signifi-cantly faster than girls between the ages of 15 and 17 (see Figure 3.1H).- Agewas a significant factor for both sexes, although boys demonstrated steadyimprovement between ages 13 and 16, and girls demonstrated no significantimprovement aster age 12. No significant difference was observed between normaland auditory impaired subjects, although visually impaired subjects were signi-ficantly slower than normal or auditory impaired subjects on the SO-yard dash.At least part of this difference would seem to be attributable to the sightrequirements of the task and the different running procedures (guide wire orpartner assisted) employed by some visually impaired runners. (As with theshuttle roll, the reader may wish to interpret these results with sol- caution,since modifications :el running. procedure resulted in variances which were largerfor the visually impaired group than for either the normal or auditory impairedgroups.) Tt' effects of running procedure on the SO-yard dash performance ofvisually imr.ired participants is investigated in a subsequent section of thisreport.
Standing Broad Jump
With Cie exception of age 12, the performance of boys significantlyexceeded that of girls on the standing broad jump (see Figure 3.11). Sincecondition did not interact significantly with either sex or age, this patternis considered similar for all groups. Age was a significant factor for bothsexes, although boys made steady improvement to age 17, and girls made nosignificant improvement after age 12. No significant differences existedbetween normal and auwtory impaired subjects; however, normal and auditoryimpaired subjects jumped a significantly longer distance than visually impairedsubjects on the standing broad jump.
Softball Throw (Distance),
Boys were found to throw the softball a significantly greater distancethan girls across all ages and ail conditions except for 12-year old visuallyimpaired subjects where no scx difference was found (see Figures 3.4D-F).Age was a significant factor for both sexes and all conditions; older subjectsoelerally threw the, bail farther than younger subjects. The rate of improvement0
__over age,_however,_seemed to be greater for boys& .especially for normal andauditory impaired boys. No signific-,rt differences were found between normaland auditory impaired girls on the softball throw. Normal girls, regardless ofage,, threw significantly farther than visually impaired girls; and with twoexceptions (ages 12 and 16), auditory impaired girls also threw significantlyfarther 0.an visually impaired girls. Normal boys threw farther than auditoryimpaired boys at 10, 11, IS, and ;6 years of age and significantly farther than
170
40,

143
visually impaind boys at all ages. Auditory impaired boys outdistancedvisually impaired boys at all ages with the exception of age 11, where nosignificant difference was detected.
Long !'istance Run
toys made significantly4Superior long distance run scores than girlsregardless of condition or, with one exception (age 12), age. Age was asignificant factor for boys (elder boys tended to accumulate more yards perminute than younger boys), but it was not a significant factor for girls(see Figure 3.13). Regardless of sex, the difference between normal andauditory impaired subjects was not significant at the .01 level. The longdistance run sc. is of normal and auditory impaired subjects, however, weresignificantl) higher than those of the visually impaired subjects (seeFigure 3.21)). Some of the differences observed between visually impairedsubjects and those of the other groups are probably attributable t., differentrunning procedures (running with the aid of a partner or guide wire) employed bysome, visually impaired subjects. The effects of running procedures on the longdistance run performance of visually impaired participants are investigated ina subsequent section of this document.
Summary
In this section, the ettects of sex, i;ge, and_condition on physical fit-ness performance are presented. With two exceptions, the performance of boys wassignificantly superior to the performance of girls on the test items. No sexdifference was found on the timed trunk raise item, and girls were found tobe significantly superior to boys on the sit and reach test. The fact thatgirls exceeded the performance of boys on a measure of flexibility is consistentwith previous research findings. The trunk raise finding, however, is of moreinterest. Subjects who took the trunk raise were instructed to fully hyper-extend the back and hold the position for as long as possible. Perhaps thegirls were able to hyperextend their backs to a greater .-:xtent than boys and,in so doing, obtained a mechanical advantage which allowed the girls to.maintainthe trunk raise for a period of time commensurate with the boys. Th;refore,the strong performance of the girls an the trunk raise may have been due asmuch to low hack flexibility as to the strength of the back extensors. In
ad6ition to the .rformance items, girls were found to have significantlylarger.skinfolc. Neisures taken from the triceps, abdominal, and subscapular
regions than boys (differences between normal boys and girls on the tricepsmeasure was significant at the .05 level but not at the .01 level).
Generally speaking, age has found to be a significant factor on performanceand skinfold measures. Sex, however, was found to have a differential effecton age on four test items. For the sit-ups, pull-ups, and long distance run,age was found to be a significant factor for boys, but not for girls. On thetriceps skinfold measure, older girls tended to have larger skinfolds, Whileolder boys tended to have smaller skinfolds than their younger counterparts.Overall, performance tended to improve with age, and skinfold measures (withthe exception noted above) tended to increase with age.
klthough the extent of differences vary truly item to item, the performanceof harmal subjects was never exceeded significantly by the performance of
171

144
either the auditory impaired or visual!). impaired groups. For a number oftest items, no significant differences were found between normal and auditoryimpaired subjects: standing broad hum }. SO-yard dash, mat creep, right ank!left grip strength, long distance run, pull-ups, triceps skinfold (boys), sit andreach (boys), and softball throw (girls). Significant differences were foundfor at least one age for abdominal skinfold, subscapular skinfold, sit-ups, legraise, trunk raise, shuttle run, arm hang, triceps skinfold (girls), sit andreach (girls), and softball throw for distance (boys). No significant differ-ences were found between normal and visually impaired subjects on pull-ups,triceps skinfold (boys), and sit and reach (boys). Significant differencesbetween normal and visually impaired subjects, on at least one age, werefound in the following test items: abdominal skinfold, subscapular skinfold,sit-ups, leg raise, trunk raise, sat creep, shuttle run, right and left gripstrength, flexed arm hang, SO-yard dash, softball throw for distarice, standingbroad jump, long distance run, triceps skinfold (girls), and sit and reach(girls). In regard to comparisons between auditory impaired and visuallyimpaired sut4icts, no significant differences were found on the following testitems: triceps skinfold, abdominal skinfold, subscapular skinfold, sit-ups,leg raise, sit reach, and pull-ups (girls). Significant differencesbetween auditory impaired and visually impaired subjects were found on at leastone age on tho-collowing items: trunk raise, mat creep, shuttle run, rightgrip, left.giip, flexed arm hang, 50 -yard dash, standing broad jump, softballdistance, (tong distance run, and pull-ups (boys).
Based on the information presented above, it is clear that the performanceof normal subjects generally exceeds that of the other two groups. It is alsoclear that the performance of auditory impaired subjects generally exceeds
that of children and youth with visual impairments. Certainly, differencesfavoring the normal and auditory impaired over the visually'impaired would beexpected in running items such as the SO-yard dash, shuttle run, and longdistance run because of the effect of sight on performance. However, differences
In grip strength, arm hang, pull-ups, and stand:ng broad jump would be lessexpected.
Normal and Cerebral Palsy Comparisons
As in the previous analysis, a three-way univariate ANOVA classified by sex,age, and condition has used to compare normal and cerebral palsied subjectson those items where procedures were reasonably similar. Comparisons withnormal subjects were not made on the mat creep, shuttle run, SO-yard dash,softball throw, or long distance run due to procedural differences. Each ofthese five items was analyzed for sex and age differences within the cerebralpalsy group, and these results are subsequently presented in this chapter.
Cerebral palsied subjects were entered into each analysis based uponthe cerebral palsy participation guide (see page 72). A5 mentioned earlier,this approach obviated a multivariate ANOVA procedure. The results of diethree-.ay univariate ANOVA are presented in Table 3.I1.
The .cults of the univariateANOVAs are discussed below for each test item.
Triceps
Sex was a significant factoror cerebral palsied subjects; girlshad significantly larger skinfold measures than boys. As noted earlier, the
172

rABLE 3.11. UNIVARIATE F VALUES FOR NORMAL. AND CEREBRAL. PALSIED SUBJECTS 81SEX, AGE, AND CONDITION.
Test Item Sex
Triceps SkInfoldAbdominal SkinfolilSubscapular SkinfoldSit-UpsLeg RaiseTrunk RaiseSit and ReachRight GripLeft Grip
Arm HangPull-Ups
Broad Jump
SexX
Age Cond. Age
Sex AgeX x
Cond. Cond.
23.87* 3.27* .09 4.01*14.05* 6.91* .63 2.135.76 7.44* 3.38 .73
59.52* 1.07 2410.77* 5.26*9.95* 3.96* 288.44* .95
.86 .62 93.79* .59
28.09* 3.72* 191.74*. 1.95155.37* 95.52* 720.18* 10.79*158.12* 80.47* 460.43* 10.98*44.28* 1.06 100.93* .0-143.39* 3.61* 82.51* 0:40*81.90* 9.83* 1235.00* 4.:4*
*Significant at the .01 level.
1 5
X
Age
x
Cond.
7.27* .71 1.65
.18 1.4 .78
1.23 1.3913.53* 6..0* .11
5.25 3 15* .65
.01 .19 .7310,21* .25* 1.7S
30.68* 2.21* 1.7719.75* 9.46* 2.78*
10.93* .90 .40
42.83 1.19 1.33
3. / 4.44* 1.66
dificrFat_e between normal girls anu normal boys was not ,ww'icwwt at the.01 level (see Figure 3.6A)-t The significant sex by a e interaction. (seeFigure 3.5A) was due to'the,iact that boys had significantly smaller skinfoldsthan girls at ages 14 and 16, but no other sex by a differences were noted.Presumably, the sex differences at 14 and 16 years lay be attributed more tothe cerebral palsied group since the sex effect fo normals was nonsignificant.Regardless of condition, age was a significant f ctor for both boys and girls,but apparently for different reasons. Fourteen year old girls had significantlylarger skinfolds than 11-year old girls, while 6-year old boys had significantlysmaller sk.infolds than 12-year old boys. Wherer.differences were significant,therefore, older girls had larger measures and older boys smaller measuresthan their younger counterparts. Condition was not a significant factor onthe triceps skinfold; no s.gnificant differences existed between normal andcerebral palsied boys or between normal and cerebral palsied girls.
Abdominal Skinfold
Only the main effects of sex and age were found to be significantfor the abdominal skinfold. Regardless of age or condition, girls hadsignificantly larger skinfolds than 'oys. The significant age effect was dueprimarily to differences in 10 and 11-year olds when contrasted with some ofthe older age groups (most notably 13, 14, and 15-yeiir olds). The 10 and11-year olds had significantly smaller abdominal skinfolds than some of theolder groups. In one instance, however, a younger age group (14) was foundto have a significantly larger skinfold than an older age group (16). Conditionwas not a significant factor for this test item.
173

Age
STANDING BROAD JUMP
1
Figure 3.5 Significant sex by age interactions (means plotted with 99% confidence intervals)
for normal and cerebral palsied subjects.

.
Girls - - - Boys
Itl
ii
t :+1
ao
E
1 i''':,(t
ICP Normal
Subject Group
TRICEPS SKINFOLD
-A-
30
m
26
ai76 .4eE 22WV
20
.8
16
16
.-
/,..
Cr' NormalSubject Group
Sri& REACH
-C-
As
// f//
////
/
/1
..,
iS
10
1$ /' Ae /i
40 //
2S / /Vz / ,
15 //10 ;/I
5111,.
1--1,0CP Normal
Subject Group
SIT-UPS
11
30
28
26
0 26
A 22ro,. 20
18
16
16
12
10
.,
.,,
3
62
:
0
43-
1
CP NormalSubject Group
RIGHT GRIP
-0-
I ,'"
7CP Normal CP Normal
Subject Group Subject Grow
ARM HANG PULL.UPS
-C-_c.
.
.
Figure 3.6 Significant sex by condition interactions (means plotted with 99% conedence intervals)
for normal and cerebral palsied subjects.
175
ow'
147
a

Normal . CP
to
0
36
70
/0
16
12
$
4
10 11
/--.,,y I a. 4:.
I
ea
Jr 40
3
20
.
t
T
I t 10 - '"*":
I
12 13 N 15 14 It 10 li 12 13 14
Age AgeSITUPS LEG RAISE
A. -B-
/N
.1 I V
10 It 12 13 34 15 16 31
AgeSIT & REACH
-C-
to
to
0
33
20
10
1
15 16 17
.0 iti2B
e 324
02 20
T16 ,_.
337 7:116 1
4
10 11 lt 33 . 35 16 17
Age
RIGHT GRIP
-D-
r
te-
30 Ii 32 33 1 15 16 17
Age
STANDING BROAD JUMP
E-
Figure 3 Significant age by condition interactions (means plotted with 99% confidence intervals)
for format and cerebral palsied subjects.
176
148

Girls Boys
46
A
it,
0 .4. 31
...Y3
CO26
02
1
21
10
11
6
. ".- I ***---
10 11 12 11 16 IS 16 11
Ate.LEFT GRIP
NoritalA
.
16
.14
36
131
.r.
..
21
16
It
6
10 11 12 13 34 IS 16 0Age
LEFT GRIPCP
.8.
Figure 3.8 Significant sex by age by condition interactions (means plotted with 99% confidence intervals)....----
for normal and cerebral palsied subjects.
6
S
4
1E 3
Z2
t
0
i'..'......1
1013 1412
Age
PULLAIPS
IV
Figure 3.9 Significant sex by age interactions (means plottelwith 99% confidence intervals)
for normal Jnd spinal neuromuscular subjects. i
.1
177
149
........
I
-.,

Subscaeurar Skinfold
Age was the only significant factor which emerged on the subscapulnr
skidfold; sex and condition were not significant factrs.
At, with the abdominal
skir.fold, age differences in the subscapular skinflqd were due primarily to
differences of 10 and 11-year olds when compaTed to ,,'me of the older age
groups (13,
14,
15, and 17).
The 10 and 11-rear old subjects had significantly
smaller skinfolds than the older subjects.
ISO
it
U
Interpretation of the sit-up test was difficult 13eca-ase all three
two-way interactions were significant in the absence of a three-wqy interact ..on
(see Figures 3.3B, 3.6B, and 3.7A) Condition, however, wast,clearly a
cant factor; regardless of sex or age, normal subjects performed more sit Aps
than cerebral palsied subjects.
Sex was apparently a si,nificant factor ter
normals, but not for cerebral palsied subjects.
Normal boys performed more
sit -upi than normal girls.
The graph depicting the sex by age interaction is
not helpful, however, in identifying at which ages these differences exist;
no significant sex by age differences were found when this interaction was
plotted (see Figure 3.30.
(In tne absence of a significant Sex by age by
condition effect, this conflict is not easily explained.
Since sex was a
significant factor for normal subjects but not for cerebral palsied subjects,
an "averaging effect" may have obscured real sex differences for normal subjects
at certain ages.
This larger standard error if the mon for the normal and
cerebral palsied combined group resulted in the generation of wider confidence
intervals which may have served to mask true differences.
When separate
graphs for normal boys and girls and cerebral palsied boys and girls were
plotted, significant differences be seen normal boys and girls cdsted between
the ages of 14 and 17; however, no differences t.'tween cerebral palsied boys
and girls were observed.)
Age was a significanl factor for boys (apparently
more so for normal boys in light of the Le by condition interaction), but
not for girls.
This was apparently due to the superior performance of the 15
and 16-year old boys-when contrasted with 10-year old boys.
Furthermore, age
had a significant effect on normal subjects (older subjects tended to make
higher scores), but no significant differences .Jetween age groups were detected
for cerebral palsied subjects.
In fact, a slight (but nonsignificant) tendency
fc.r scores to decline with age was noticed with the cerebral palsied group.
Leg Raise
s
Boys performed significantly longer leg raises than girls regardless
of age or condition.
Age was a significant factor for normal subjects (15 a:.d
16-year olds had larger scores. than 10 to 13-year olds), but not for cerebral
palsied subjects (see Figure 3.7B).
Regardless of sex or age, normal subjects
performed significantly longer leg raises than cerebral palsied subjects.
Trunk Raise.
The main effect of condition was the only significant factor Olich
emeiled from the trunk raise; no significant diffe-rences wre found for sex
or age.
Regarless of sex or age, normal subjects performed significantly
longer trunk raises than cerebral palsied subjects.
178
ti

ti
Sit and Reach
151
Normal girls, regardless of age, significantly exceeded the performanceof normal boys on the sit and reach. Cerebral palsied girls made higher scoresthan cerebral palsied boys, but the difference was not statistically significant.Age was a significant factor for normal subjects; generally, older subjectsmade higher scores than younger subjects. Age was not a significant factorfor cerebral palsied subject's. Regardless of sex, normal subjects weresuperior to cerebral palsied subjects on the sit and reach (see Figure 3.6C).With the exception of age 13 where no significant difference was observed,normals made significantly higher scores than cerebral palsied subjects at allages. (see Figui, 3.7C).
Right Grip StrengthSy.
As with sit-ups, the emergence of three significant two-way inter-actions in the absence of a significant three-way interaction made the inter-pretation of the right hand grip strength somewhat more difficult (seeFigures 3.SC, 3.6D, and 3.7D). Condition, however, was clearly a significantfactor regardless of sex or age. Normal subjects exceeded the performance ofcerebral palsied subjects. Normal boys made significantly higher scores thannormal girls, but no such difference was observed for cerebral palsied subjects.The sex difference for normal subjects was operative at the upper ages. Thesex by age graphic analysis (see Figure 1.5C) indicates that significant sexdifferences existed between ages 1S to 17. (In the previous section, it wasreperted that sex differences on the right grip for normal subjects occurredbetween 13 and 17 years. As with the sit-ups, perhaps the "averaging effect"of combining the normal and cerebral palsied groups served to obscure a truedifference at ages 13 and 14 in the present analysis.) Age appeared to he asignificant factor for both iexes and both subject groups; older subjectsgenerally made higher scores than younger subjects.
Left Grip Strength
The sex by age by condition interaction was fOUnd to be significantfor the left hand grip strength (see Figures 3,8A and 3.8B). Significant sexdifferences were observed between normal boys and girls. at 10 years of age and
between 14 and 17 years of age. No significant sex differences were found
for the cerebral palsied group. Age was a significant factor for both normaland cerebral palsied subjects regardless of sex. Generally, older subjectsmade better scores than younger subjects, although the performance curves forcerebral palsied subjects (especially girls) were more erratic than those ofthe normal subjects. With one exception, normal subjects, regardless of sexor age, were found to have significantly higher left hqnd grip scores thancerebral palsied subjects. No significant difference was observed between17-year old normal and cerebral palsied girls.
Flexed Arm Hang
Boys performed significantly longer flexed arm hangs than girls,regardless of age or condition. The sex by condition interaction is apparentlydue to the fact that there xs a greater difference between the normal boysahl girls, although the difference is significant in both cases (see Figure 3.6E).
179

152
Age was not a significant factor in this analysis regardless of sex orcondition. Normal subjects made significantly higher scores on the armhang than cerebral palsied subjects.
Pull-Ups
Normalboys executed a significantly greater number of pull-upsthan normal girls. Boys significantly exceeded the performance of girlsbetween the ages of 12 and 17. The difference between cerebral palsied boysand girls was not significant at the .01 level. Age was found to . fe adifferent effect on pull-up performance for boys and girls (see Figt....e.3.50).Boys generally improved with age and significart differences eMerged betweenthe'10 to 12 and 15 to 17 age groups. No significant age difference was foundfor girls; in fact, there was a general decline in performance between theages of 11 and 14. Normal boys did a significantly greater number of pull-ufithan cerebral palsied boys; howeuer, the difference between normal girlsand cerebral palsied girls was not significant (see Figure 3.6F).
Standing Broad Jump
Boys, regardless of condition, jumped significantly farther thangirls on the standing broad jump between the ages of 15 and 17 (see Figure 3.5E).(When normal subjects were analyzed with auditory and visually impaired subjects,significant sex differences were found at all ages, except age 12.) Age wasa significant factor for normal subjects but not for cerebral palsied subjects(see Figure 3.7E). The performance of the normal subjects generally improvedwith age and age had a significant effect for both boys and girls. Regardlessof sex or age, normal subjects jumped significantly farther than cerebrapalsied subjects.
Additional Sex and Ake.ComparisonsWithin the Cerebral Palsied Group
The data presented below in Table 3.12 iepict the effects of sex andage on the fitness test performance of subjects with cerebral palsy on ihatcreep, shuttle tun, SO-yard dash, softball distance, and long distance run.Comparisons with normal subjects were not made on these items since procedureswere modified significantly for some cerebral palsied participants.
° TABLE 3.12. UNIVAIATE F VALUES FOR CEREBRAL PALSIED SUBJECTS BY SEX AND AGE.4=MIIIMIIMerbo
Sex'X
Test Item Sex A e A e
Nat Creep 3.66 1.73 .87
Shuttle Run 1.51 1.28
50-Yard Dash '8.32* 2.17 1.50
Softball Distance 37.53* .85 1.20Long Distance Run 3.40 .88 .61
"'Significant at the .01 level.
180

153
The data in Table 3.12 indicate that sex was a significant factor ontwo 'of the variables: SO-yard dash and softball throw. In both of thesecases, performance differences favored the boys. No other sex or agedifferences were obserted on these five items for subjects with cerebral palsy.
Summary
. This section of the report analyzed sex, age, and condition differencesfor normal and cerebral palsied subjects. With the exception of the skinfoldmeasures, the performance of girls on the pull-up test and the performance of17-year old girls on left grip, significant differences favoring normal subjects
were found on all test items. Far fewer sex and age differences were foundin the cerebral palsied group than in the normal group. With the exceptionof the trunk raise, sex was a significant factor for normal subjects on alltest items. With the exception of the sit and reach teft, this differencefavored normal boys. In regard to skinfolds, there was no significantdifference between normal boys and girls, but normal girls had significantlyhigher abdominal and subscapular skinfolds than normal boys. For the cerebralpalsied group, sex was a significant factor on the triceps and abdominalskinfolds, leg raise-, flexed arm hang, standing broad jump, 50-yard daah,and softball. throw. Age was found to be significant for cerebral palsiedsubjects on only three performance items, the two grip strength measures,pull-ups (boys only), and the skinfold tests. Conversely, age was a significantfactor for normal subjects on virtually all test items. (Trunk raise andflexed arm hang did not yield significant age effects for normals in thisanalysis; 'avAever, age was found to be significant for both when the performanceof normal subjects was analyzed with the performance of auditory imp :red and-visually impaired subjects.)
The findings presenteCbere should probably be viewed with a certaindegree of_caution,..especially.those_findings drawn froi.graphs_depicting S2X _
by age interactions. la these graphs, normal and cerebral palsied subjectswere combined and perioniance was plotted by sex and age. When normal andcerebral palsied subjects were combined, however, the large discrepancy ismean scores gerwr.11y resulted in the computation of a standard deviation whichwas larger in the combined group than it was in either of the separate groupsThis larger standard deviation, ipi turn, contributed to a relatively largestandard error of the mean which eventually resulted in the generation of very)wide, confidence intervals. The width of these intervalobscure some true significant sex by age differen
1
Normal and Spinal Neuromuscular Compa isons
A three-way ANOVA design wc used to investigate sex, age, and conditiOndifferences between normal subj cts and subjects with spinal neuromuscularconditions on those items where procedures were reasonably similar (skinfolds,grip strength, arm hang, and pull -ups). Comparisons between subject groupswere not made on shuttle run, 5 -yarl dash, long distance run, or softballthrow due to significant procedutal differences. The effects of sex and ageon the performance cf spinal neuvmuscular participants were investigatedseparately for these items, and,jaiese results are presented later in thissection. (
184
<

Quadriplegic spinal neuromuscular subjects were not included in thisanalysis due to the low number of subjects in the category (N=6) and thefact that quadriplegic participants were subject to a different szhedule ofitems than paraplegic participants (sec participation guide, page 81). Allother subjects with spinhi neuromuscular conditions were included in thisanalysis (N=141, boys T 72, girls = 69). Due to the relatively low numberof subjects in the spinal neuromuscular group, the age variable was reducedto two groups for this analysis: 10 to 13 yetis of age (SN boys = 39,SN girls = 45) and 14 to 17 years of age (SN boys = 35, SN girls = 24).
The results of the multivariate.ANOVA indicated that all three two-wayinteractions were significant (p< .002) for this analysis. Since the multi-variate ANOVA indicated thc presence of an "interaction model," the univariateanalysis was perforied pose hoc. The results of the three-way univariateANOVA are presented in Table 3.13.
TABLE 3.13. 1JNIVAR1ATL F VALUES FOR hORMAL AND SPINAL NEUROMUSCULAR SUBJECTSBY SEX, AGE, AND CONDITION.
Test Item
Triceps SkinfoldAbdominal SkinfoldSubscapular SkinfoldRight GripLeft Grip
Pull -Ups
Sex C Cond.
Sexx
A e
SexX
Cond.
AgeX
Cond.
8.69* 4.57 25.82* 31.19* .22 3.38
S.13 14.12* 35.72* 5.23 '.99 5.'71.52 23.89* 54.00* 8.69* .41 6.28
132.92* 284.01* 7S.69* 31.62* .00 6.93*116.05* 248.74* 56.75* 33.78* .35 5.51
25.95* .OS 43.17* .63 7.15* Al104.22* 14.47* 17.58* 37.63* 19.43* 2.20
Sexx
Age
Cond.
.8.91*2.81
10.71*
11.26*
13.62*
.31
.30
*Significant at the .01 level:
The results of the univariate analysis are discussed below for each
test item.
Triceps Skinf.d
A significant sex by age by conditlon effect emerged on the tricepsskinfold (see Figures 3.11A and 3.11B). Sex was a significant factor forolder (14-17) normal subjects, girls had larger skinfolds than boys. Sex wasnot a significant factor for younger (10-13) normal subjects or for spinalneuromuscular' ubjects at either age group. Age was not significant for normalsubjects or for spinal neuromuscular boys, but older spinal neuromuscular girlshad significantly larger skinfolds t ?-an younger spinal neuromuscular girls.
Older spinal neuromuscular girls had significantly larger skinfolds than oldernormal girls, but no other conditicn effects were significant.
132

Girls Boys
12
4
\\\\ t -1\\ z,. P..
I
'L LN.mil--- --gr-- Normal SN
Subject Group Subject Group
ARM HANG PULL UPS
A. .8.
Figure 3 10 Sigueiicant sex by condition mteractions (mea plotted with 99% confidence intervals)
for normal and spinal neuromuscular subjects.
r:
)1. /0*.g :9to is
E 10 10
IS,4..3IT.1
4.)
:Pi3 34Age Age
TRICEPS SKINF01.0Normal
A
TRICEPS SKINFOLDSpinal Neuromuscular
B
Figure 311 Significant sex by age by condition rro-racoons (means pLAted watt 99% cora:fenceintervals)
for normal and spinal neuromuscular subjects
183

1.
-- Girls Boys
27
ov 113 II 04o 4,
16xe 16
# 14 e IA
12
10
rt
1611 Age
SUBSCAPULAR SKINFOLD
NormalC
101)Age
1413
SI:;3SC.APULAR SKINFOLDSpina' Neuromuscular
D.
/ 44144
40 / I' 4°1/36 // 4,1
/J2 . :1..
,_ ._/___ _E_ L____,,,, 28 / 11 '")to /2 0" ii I ..- .."'
b i.,.-- 1,,,/ -
tl
Age
RIGHT GRIPNormal
ql
34 «i
0.) a:
. /36 / sc
371/ 1i
e, .4,
vl.9 2111 / E_ 13
O 14 // to0 14
X / .1./........420 z / P.
e
16 1----. 1^
8 4
6 WO.Age
LEFT GRIP
Normal
34 I/
.,
; .i4 itAge
la
RIGI l CRIPSpinal N tUroinuscular
F
1013Age
LEFT GRIPSpinal Ngul'omuscutar
14 1)
Figure 311 {cont.) Significant sex by age by conclihor, interactions (means plotted with 99% confidence intervals)
for normal and spinal neuromuscular subjects. 14aka
S.

1S7
Abdominal Skinfolds
Only the main effe, lge and condition were significant on theabdominal skinfolds. Old s had significantly larger skinfolds thanyounger subjects, and su'jects with spinal neuromuscular conditions hadsignificantly larger skinfolds than normal subjects.
Subscapular Skinfolds
A significant sex by age by condition effect was obtained for thesubscapular skinfold measure (see Figures 3.11C and 3.11D). Sex was a non-significant factor for both groups of subjects. Age was also nonsignificant.Younger spinal neuromuscular boys had significantly larger skinfolds thanyounger normal boys, and older spinal neuromuscular girls had significantlylarger skinfolds than older normal girls.
R1it Grip Strength
The three-way sex by age by condition interaction was significant forthe right hand grip strength (see Pigures 3.111! and 3.IIF). Sex was a signifi-cant factor for older normal subjects (boys had higher scores than girls), butno other gex differences were observed (differences between spinal neuromuscularboys and girls were significant at the .OS level but not at the .01 level).Regardless of sex or condition, older subjects made significantly higher scoresthan younger subjects on the right hand grip strength. Normal girls hadsignificantly higher scores than spinal neuromuscular girls at both age groups.Older normal boys significantly surpassed the performance of older spinalneuromuscular boys; however, there was no significant difference between youngerno-30 and spinal neuromuscular boys.
Left Gri ) Strength
As with the right hand grip strength, the analysis of the left handgrip strength yielded a significant three-way interaction (see Figure 3.11G and3.11H). Similarly, sex was a significant factor for older normal subjects(boys did better), but no other sex differences were observed. Age was asignificant variable for normal subjects and spinal newomuscular girls (oldersubjects surpassed the performance of younger subjects), but no such differencewas found for spinal neuromuscular boys. older normal boys achieved signifi-cantly higher scores than older spinal neuromuscular boys, but tl:c difference1,tween younger normol and spinal neuromuscular boys was not signifiLant.Conversely, younger normal girls achieved significantly higher scores thanyounger spinal neuromuscular girl.z, but the difference between older normaland spinal neuromuscular girls was not significant.
Flexed Arm Hang
Sex was found to be a significant factor for normal subjects (boysexceeded the performance of girls), but no significant sex difference was foundfor subjects with spinal neuromuscular conditions on the flexed arm hang (seeFigure 3.10A). Regardless of sex or condition, age was not a significantvariable on this item. .Normal subjects performed significantly longer flexedarm hangs than spinal neuromuscular subjects.
185

158
Pul 1 -Up
Sex was a significant factor for normal subjects on the pull -upsft(see Figure 3.1011). Normal boys performed more pull-ups than normal girls.This difference was operative for both younger and older subjects (seeFigure 3.9A). No significant sex difference was observed for spinal neuro-muscular subjects. Boys, regardless of condition, improved significantly withage, but age differences were nonsignificant for girls. Normal boys performeda significantly greater number of pull-ups than spinal neuromuscular boys, butthe difference between normal girls and spinal neuromuscular girls was notsignificant (see Figure 3.10R).
Additional Sex and Age Comparisons 11 thinthe Spinal Neuromuscular Group
Univariate F values for spinal neuromuscular sex and age comparisonsare presented below in Table 3.14 for four test items (shuttle run, 50-yarddash, scftball distance, and long distance run). Comparisons were not madewith normal subjects since procedures were vastly modified for some spinalneuromuscular subjects. The multivariate analysis of these data yielded asignificant main effect for sex (p4:.000).
TABLE 3.14. UN1VARIATI. 1, VALUES FOR SPINAL NEUROMUSCULAR SUBJECTS BYSEX AND AGE.
Test Item
SexX
Sex Age Age
Shuttle Run i.13 1.47 1.84
50-Yard Dash .91 .73 2.03
.SOftbail Distance 2S.58* .62 .24
Long Distance Run .09 1.26 .02
*Significant at the .01 level.
The data in Table 3.14 indicate that sex was a significant factor(favoring boys) for spinal neuromuscular subjects on the softball throw.No other significant sex or agc differences were found en these four items.
Summary
Spinal neuromuscular and norkal subjects were compared on seven ProjectUNIQUE test items. xcept for skinfolds, the scores of the normal subjectswere generally signif:cantly superior to those of the spinal neuromuscularsubjects on the four pertermance items which were compared. No significantdifferences, however, were fould between )(ginger (10-13) normal and spinal
'neuromuscular boys on the grip strength measures. In addition,-no significantdifferences were found between older (14-17) normal and spinal neuromusculargirls on left hand grip strength or between normal and spinal neuromusculargirls (both age groups) on pull-ups. Although not all comparisons weresignificant, there was a trend for spinal neuromuscular subjects to have largerskinfold measures than normal subjects.
186

159
Few significant sex and age differences emerged for the spinal neuro-muscular group. In fact, only one ziignificant sex difference emerged (boys'exceeded the girls on the softball throw). Ago was significant for spinalneuromuscular subjects on rigl.t hand grip strength (older subjects wirh higherscores), for spinal neuromuscular girls on left hand grip strength (oldersubjects uith higher stores), and for spinal neuromuscular boys on pull-ups(older boys with higher scores). Relative to skinfold measures, older girlswith spinal neuromuscular conditions significantly exceeded younger girls withspinal neuromuscular conditions on triceps and abdominal skinfold. Older boyswith spinal aeuromu,,cular conditions ignificaatly exceeded the abdominalskinfold of younger boys. No other significant age differences emerged.
Itysical 1itness Test Performance as a Function ofSeverity and Onset of handicapping Condition
and Methods of Ambulation
The effects or the severity of each of the major handicapping conditionsupon physical fitness test performance are presented in this section. Theseverity of the condition is defined ul different ways for each subject group(refer to Chapter If for specific definitions). Auditory impaired subjects weresubclassified as either hard of hearing or deaf. Visually impaired subjectswere subclassified as either partially sighted or blind. Cerebral palsiedsubjects were subclassified into one of eight NASCP sport classifications(based upon functional ability) and spinal cord injured subjects (members ofthe spinal neuromuscular group) were subclassified based upon the site of thespinal cord lesion.
in addition to the seve'rity of the handicapping condition, the effectsof two other variables on performance were investipted for certai.. groups.The effects of different "running" methods were analyzed in regard to thevisually impaired and LerebraI palsied groups, and the effects of age of onsetof handicapping condittonswereinvestigated in regard to the visually impaired
group.
Auditory Impaired
In this section, differences betueen hard of hearing and deaf subjects onProject UN1Q01-. test items are analyzed. A three-way analysis of variance designclassified by sex, 4e, and condition (hard of hearing or deaf) was used to
test the significance of difference 1,..teen the subgroups of auditory impairedsubjects (hard of hearing: boys = 157, girls 2 108; deaf: boys = 666,
girls = 537). Since sex and age differences of auditory impaired subjectswere discussed in a previous section or the report, the main effects of sex adage and the sex by age interaction are of less interest in the present analysis.Of particular interest in the present investigation is the maim effect ofcondition and its possible interaction with sex and age.
The main effect of condition uas significant in the multivariate ANOVA
(I14.000). Onivariate ANOVAs were calculated po.A hoc. The results of the
univariate ANOVAs are presented in Table 3.15.
No aigniflcant sex by age by condit'on or sex by condition interactionsappear in 1..nle A. On five items (sit-ups, right grip, left grip, standing
187

TABLE 3.15. UNIVARIATL 1. VALUES I:C*101(1)0F WARING AND DEAF SUBJECTS BYSEX, AGE, AND CONDITION.
160
est Items Sex Age Cond.
SexX
Age
Sex.x
Cond.
Agex
Cond.
SexX
Age
x
Cond.
Triceps Skinfold 8b,48* .47 3.98 3.27 1.69 1.90 1.91
Abdomii'al Skinfold 14.24- 2.54 1.53 2.43 .13 .39 1.81
Subscapular Skinfold 49.85* 3.85* .28 1.48 1.70 .68 1.31
Sit -Ups 41.02* 7.65* .04 1.19 .01 3.8S* 1.43Leg Raise 25.61' 1.1.09* .54 .92 .60 1.04 .86
Trunk Rais. .22 1.08 3.31 .63 .02 1.34 .69
Mat Greco 34,23* 5.42* 4,18 1.88 ,b7 1.97 t55
Shuttle Run 29.72* 9.25* .01 2.33 .01 1.04 .44
Sit and Reath 16.66* 6.25* .88 .66 .61 1.05 .68
Right Grip 1;9.94* 87.13* 2.91 16.31* .S0 4.52* .51
Left Grip 143.98* 76.85! 8.89* 16,93* .4S 3.54* .44
Arm Hang 65.32' 9.86* .87 5.45*' .91 .99
Pull-Ups 148.3)'' 16.98* 1.93 m52* 2.61 .41 ..82SO-Yard Dash 34.36* 16.61* .17 4.22* .43 1.25 .50
Broad Jump 137.08* 36.35* .22 10.70* .42 3.03* .43
Softball Throw (Dist.) 330.48* 31.87* .02 453* .44 1.88 .77
Long Distance Run 63.92* 5.00* .11 4.23* 1.20 2.90* .6S
*Significant at the .01 level.
broad ;ump, and long distance run), a significant age by condition interaction.- is-obtained, rho naturc of this interainion is discussed below for each item,Nonsighificant differences between hard of hearing and deaf subjects werefound in the remainiag 12 items.
Sit-Ups
Both hard of hearing and deaf subjects generally improved with ageon the sit-up test. With one exception, the differences between subjectgroups were nonsigaificant. At 16 years of age, deaf subjects (X=36.73) per-formed significantly more sit-ups than hard of hearing subjects (X=29.84).
Right Grip Strength
The mean right hofid grip strength score for 10 to 13-year old deafsubjects was slightly higher than that of the 10 to 13-year old hard of hearingsubjects; conversely, the mean score for 14 to 17-year old hard of hearingsubjects was slightlly higher than that, of the 14 to 17-year old deaf subjects.None of these differences, however, were significant.
Left Grip Strength
Age was a significant factor for both deaf and hard of hearingsubject- or. left hand grip strength. A' 13 years of age, deaf subjects (X=22.10)made significantly higher scores than hard of hearing subjects (X=15.96). No
.188
e..
rt

a.
161
other significant differences between the subgroups of auditory impairedsubjects were obsiived.
Standing Broad ?amp.
Generall- speaking, older subjects jmped farther Lhnn.younger subjectsregardless of condition. When plotted, the performance curves of herd ofhearing and deaf subjects crossed four times across the eight age groups.No significant differences, however, mere found ')etween the groups of subjectsat any age.
Long Distance Run
Age wag a significant factor on the long distance run for both hardof hearing and deaf ;ubjects. As with the standing broad jump, he plottedperformance curves crossed a number of times; however, nc differences betweenthe groups of subjects were found at any age.
"iiromary
Thirteen-year old deaf students had significantly higher left hand gripstrength scores than 13 -year old hard of hearing students, did 16-year old
deaf students performed significantly, more sit-ups than 16-year old hard ofhearing students. With these two exceptions, no significant differences werefound ketween hard of hearing and deaf participants on Project UNIQUE testitems.
Visually Impairedsomm,14.)
es
In this section, the effe'ts of selected variables associated with theINntformance of vi,"111y impoire4 subjects are analyzed. Analyses whichinvestigated diftlrences between partially sighted and blind subjects, theeffects of age of onset of the visual Impairment on fitness measures, anddifferghces between running methods arc presented herein.
To test the significance of differences between partially sighted andblind subje-ts, a three .way ANOVA design classified by sex, age, and condition(partially sighted or Mind) was employed. In this analysis, it was necessaryto combine subjects into two age groups (10-13 and 14-17) to maintain acceptablecell sizes. Table 3.16 presents a breakdown of the number of visually impairedsubjects entered into this analysis.
TABLE 5.16. NUMBER OF VISUALLY IMPAIRLb SUBJECTS CATEGORIZED BYCONDITION SEX, AND AGE.
Partially Sighted BlindGirls ho s Girls Boys
10-13 76 131 35 25
14-17 109 173 42 58
189Mo.

162
The multivariate ANOVA procedure yielded a significant sex by age by
'
condition effect (pe...011).
Univariate analyses were computed post hoc.
The results of the univariate analyses of variance are presented in Table 3.17.
TABLE 3.17.
UN1VARIATE F VALUES FOR PARTIALLY SIGHTED AND BLIND SUBJECTS
BY SEX, AGE, AND CONDITION.
Sex
x
Test Item
Sex
Sex
Age
Age
XX
XX
Sex
Age
Cond:
Age
Cond.
Cond.
Cond.
Triceps Skinfold
27.97*
.17
1.47
'4.52
1.66
.22
.52
Abdominal Skinfold
1.56
4.32
2.44
.09
.26
.00
.14
Subscapular Skinfold
8.96*
8.60*
1.09
1.06
1.01
'.01
.00
Sit-Ups
40.05*
4.77
.82
.02
;29
1.40
1.02
Leg Raise
9.11*
14.46*
.00
6.32
.28
.01
1.34
Trunk Raise
.28
14.43*
5.18
.26
*.06
2.15
.97
Mat Creep
29.00*
.01
42.25*
.57
4.36
3.44
.89
Shuttle Run
4.78
36.53*
56.30*
.06
.13
13.36*
.31
Sit and Reach
5.74
8.09*
1.55
.00
1.62
5.11
.18
Right Grip
64.31* 104.28*
3.41
27.37*
.76
.03
,.16
Left Grip
,53.37*
99.54*
2.91
31.18*
.69
.31
.80
Arm Hang
41.10*
11.71*
.42
3.96
.65
.00
.06
Pull-Ups
72.25*
10.39*
.01
12.79*
1.04
.01
.22
50-Yard Dash
e3.52
63.14*
73.95*
9.18*
.60
15.45*
2.89
Broad Jump .
66.96*
59.68*
26.03*
4.30,
2.76
.33
1.04
Softball Throw (Dist.)
74.62*
39.65*
55.88*
9.10*
2.39
1.12
1.57
Long Distance Run*
26.41*
4.98
12.07*
4.58
.32
.01
3.74
'*Significant at the .01 level.
.,ince the effects.of sex and age on the peiformance of visually impaired
,subjects was pre.,ented earlier, they will not be discussel further here.
Of
primary importance in the present analysis is the main effect of condition
and
its interaction with sex and age.
On six test items--mat creep (BR=6.82,.
PSR=4.56),ohuttle run (BR=16.67, PSR=13.02), 50-yard.dash (BR=10.58,
PSI=8.89.:, standing broad jump (BK=52.83, PS1=59.93), softball throw for
diw6nce (Bx=42.17, PSR=69.75), and long distance run (Bi=147.54, PSR=165.12)--the
main effect of condition was significant.
In each case, the,difference favored
the partially sighted group.
The significant age by condition interaction in
the shuttle run and dash is apparently due to the fact that the rate of improve-
ment between younger and older subjects was greater for blind participan 4
than
partially sighted participants.
No significant difference was found bet* en
partially sighted and blind subjects on the
other 11 Project UNIQUE test items.
To investigate the effects of the age of onset of the visual impairment
upon measures of fitness, a two-way
ANOVA design was employed.
The variables
of age of onset and condition (partially sighted or blind) were entered into
the analysis.
Age of onset was categorized as (1) occurring congenitally
(N=476), (2) occurring between birth and age six (N=125), and (3) occurring

a
Oto
`163
after age 6 (N=48). Since the effects Afxbndition were investigated in theprevious analysis the primary interest in the present analysis is the maineffect of age of onset and its interaction with condition. The vlitivariateANOVA procedure yielded nonsignificant F values for both age of onset (9(.289)and the interaction between age of onset and condition (p4;.238). Consequently,
post hoc nnivariate procedures were nut employed, and it was concluded thatage of onset of a visual handicapping condition was not a significant variablein the performance o Projet'UNIQUE fitness measures.
Visually Impaired participants employed one of three running methrxiswhen performing the dash, the shuttle run, and the long 4istance run. Subjectscould run with a partner, with the aid of a rope or guide wire, or unassisted.To investigate the effects of running method on the performance of these threeitems, a one -way Uhivariate ANOVA procedure was utilized. A multivariateprocedure ':as obviated due to the fact that some subjects employed differentmethods for' each 'running item. The. results of thw univariate-analysis arepresented in Table 3.18. .
TABLE 3.18. ANALYSIS OF RUNNING METHODS EvR VISUALLY IMPAIRED SUBJECTS.1
F Rdtio.
MeansPartnerAssisted
GuideWire Unassisted
16Shuttle Run (sec.) 34.49*, 14.8(q2) 18.77(1) 13.04(2)
N=43 1=66 N=462 ,
SO-Yard Dash (sec.) 38.17* 10.17(1) 10.98(1) 8.82(2)N=30 N=109 N=452
Long Distance Run 4.48** 153.19(1,2) 146.00(2) .163.75(1)
(yds./min.) N=76- N=48 N=413
*Significant at .01 level.. **Fignificant at .012 level.
1Numbers in parentheses convey Schefe. comparisons. Means Will the samenumber in parentheses did not differ significantly; means with differentnumbers in parentheses differed significantly.
The data presented in Table 3.18 indicate that-running method was asignificant factor for visually impaired subjects on riain ;:, items. On 7.he
shuttle run, visually impaired subjects who ran either urh,Jsist d. or with apartner had siga.ificantly faster times than subjects who ran w" h the aid ofa guide wire. On the So-yard dash, subjects who ran unassiste were'significantlyfaster than subjects who ran either Stith a partner or with the aid of a guidewire. On the long distance run, subjects who ran unassisted averaged asignifican*'y higher number of yards pkr mine.e than those who ran with the aidof a guide wire.
.Su/mmary
. The degree of the visual Impairment (partially sighted versus blind) was
found to be a significant factor on six of the Project'UNIQUE test items. On
. ..o. , 19i
a. 4,

164
each- of these items, the difference betheen the weans fhvored the partiallysightedsidajects. rive of these items required some form of movement. throughspace (juttipihg) or moving to a target (manning, creeping), and the sixth item4nvolved throwing. ActiOtios h'hich require movement through spate (particularlyrunning to visual cues) and throwing have been previously Identilied as taskswhich are. particularly difficult for blind Children (Winrick, 1979).
o-
The age of onset of the visual impairment was found to be a nonsignifieahtfactor on the rlrformance of the Project UNIQUE test iter4 as iialicated by a'multivariate ailklysis. This finding is in conflict tFith sabgeations made byBuell (1950a, 0540 that.children who lose their vision prior to age six have'more difficulty adjusting to ph)sical activities than do children who lose theirvisiaa after age six. Buell found that this was especially true of running,throwing, and jumping tasks. In consideration of this finding, the fiveProject- UNIQUE test items whith required running, throwing, or jumping (dash,shuttle run, long distance run, softball thibw, standing broad jump) were .
entered into a separate multivariate ANOVA to deter mine if age of onset.significantly affectelperformance in these areas. Neither the main er=ect ofagg of onset (pc..994) ar the interaction between rile of onset and severity ofcondition (pc. :104) were found to be significant at the .05. level. Age ofonset apparently dtd not Mgnificantly influence the performance of visuallyimpaired participants on Project UNIQUE test items.
Subj,g,cts ultb peitcwmed the running events unas.:sted attained superiorscores than subjects :Mho ran with the use 15f a, guide wire.' Unassisted subjects a
also significantly exceedt.1 the performance of partner assisted subjects on the50,iard °ash; however. nostatistical difference was found between unassisted.sabjects and partner as4istee subjects on either the chattle runner- the long
run: The performance of partner assisted and guile wire assistedsubjects differed significantly only on the shuttleaun,where'apparealY verbaland/or tactual cues provided by the lidrtner were iidafal in improving`
on task requiting changes of airectivt. i ipe general superiosity of unassisted
runners is not oastiomlaxly-sufprlsing loaically it is easler to rununencumbered by a partner or a guide hire and abo because running method is
classified-as blind run unassisted. the maj rity of blind subjects-at least somewhat related to the severity of the con. tit, While some subjectswho wereran with as.,:stance and the majority of theotirtially sighted subjects rahunassisted. , k
Since running method was found to tie a's anificant factor, an additionalanalysis was perfogd to eoapare visually impaA.red subjects wha ran unassistedwith normal subjeAs on the three running items. This anclysi$ was performed toverify that differences observed betAeen'normil and visualll'impaired subjectson running items,discussed earlier were not due solely to dicferences.iuprocedures (running methods). This analysis:, in fact, confirmed that the
differences t .weep visudly impaired and normal subjects were significant on- a11three running items and that this difference was not due to variations tit
running method. .
CerebralPalsy
This section presents the effects of severity of eoridition.and running
methods or. theyerformatice of .catrehril palsied subjects. severity of conditionwas'reffeczed in terms of the 1979 NASCP' dassifi azidh system.' Running methods
92
!... `.
.
A

TABLE 3.26. MEANS AND UNIVARIATE F VALUES ADJUSTED FOR AGE FOR VISUALLY IMPAIRED SUBJECTS BY SEX ANDEDUCATIONAL ENVIRONMENT.
Test Item
Means F Ratio
IR INR NI
CovariateAge Sex
EducationalEnvironment
SexX
EducationalEnvironment
Triceps Skinfold 15.49 13.94 12.84 .05 30.48* 7.58* .16
Abdominal Skinfold 16.60 14.69 12.72 9.31* 1.61 8.34* .11
Subscapular Skinfold 13.91 12.36 11.19 15.58* 7.37* 7.24* .06
Sit-Ups 32.95 34.17 28.71 20.16* 31.96* 11.72* 1.19
Leg Raise 36.77 25.72 20.71 30.92* 4.84 16.65* 1.22
Trunk Raise 32.80 37.38 30.49 18.35* 1.20 1.30 1.13
Mat Creep 4.84 4.90 5.42 .87 10.25* 3.87 3.36
Shuttle Run 14.33 13.19 13.52 22.87* 9.40* 1.86 .15
Sit and Reach 25.86 26.07 25.32 4.02 5.71 .27 1.52
Right Grip 22.16 23.62 18.13 288.49* 70.69* 16.26* 2.75
Left Grip 19.96 21.35 16.36 270.98* 63.21* 14.35* 1.20
Arm Hang 9.98 14.83 7.10 27.94* 42.54* 10.79* .62
Pull-Ups 2.28 2.65 1.60 34.08* 91.97* 4.03 1.96
50-Yard Dash 9.62 9.15 8.95 51.73* 12.41* 4.54** .98
Standing Broad Jump 57.08 60.03 55.28 111.23* 72.14* 2.96 .17
Softball Distance 58.95 59.92 62.29 101.21* 92.21* .56 2.39
Long Distance Run 163.77 152.14 148.32 11.71* 29.63* 7.13* .94
*Significant at the .01 level.**Significant at the .011 level.
206 207

TABLE 3.20. ANALYSIS OF THE PERFORMANCE OF SUBGROUPS OF CEREBRAL PALSIED SUBJECTS.
Test Item F Ratio
NASCP ClassificationIII
N=62IV
N=37VA VB
N=25 N=64Means
VI
N=43VIIN=90
Triceps Skinfold (mm.) .65 13.33 12.58 10.66 13.01 12.42 12.36
Abdominal Skinfold (mm.) 2.34 15.15 15.05 11.94 12.93 11.96 11.15
Subscapular Skinfold (mm.) 1.63 10.82 13.48 10.05 10.82 10.91 10.04
Sit-Ups (no./min.) 22.06* .86(2) 4.07(2) 7.81(1.2) 3.48(2) 11.36(1) 13.70(1)
Leg Raise (sec.) 2.81 5.06 9.04 7.29 6.25 14.91 11.18
Trunk Raise (sec.) .78 15.17 19.76
Mat Creep (sec.) 16.43* 28.08(1) 25.35(1,2) 14.53(2,3) 14.53(3j 7.79(3) 8.40(3)
Shuttle Run (sec.) 54.55* 82.20(1) 44.71(1,2) 40.46(3,4) 34.42(3,4) 21.12(4,5) 18.45(5)
Sit and Reach (cm.) 1.94 12.65 20.36 18.21 16.39 18.04
Right Grip (kg.) 5.64* 10.28(1) 16.73(1) 13.70(1) 15.91(1) 12.84(1) 11.44(1)
Left Grip (kg.) 4.66* 9.02(2) 16.00(1) 13.12(1,2) 16.02(1) 12.00(1,2) 10.99(1,2)
Arm Hang (sec.) 2.89 6.00 .61 2.81 1.71 4.43
Pull-Ups (no.) 2.16 1.31 .11 .97 .21 1.23
50-Yard Dash (sec.) 15.73* 88.71(1) 43.05(2) 33.47(2) 27.92(2) 15.70(2) 15.29(2)
Broad Jump (in.) 4.12 21.00(2) 28.33(1,2) 32.40(1)
Softball Throw (Dist.) (ft.) 12.69* 13.85(3) 22.47(2,3) 22.86(1,2,3) 24.11(2,3) 33.06(1,2) 37.48(1)
Long Distance Run(yds./min.)
18.24* 35.23(3) 59.43(2,3) 45.24(2,3) 68.22(2) 85.30(1,2) 108.19(1)
*Significant at the .01 level.
194
195

167
Unassisted runners also significantly surpassed the performance of runnerswho used assistive devices on the shuttle run and long distance run. Despitea 20-second difference in performance, the means of the unassisted and assistivedevice groups did not differ significantly on the SO-yard dash. Assistivedevice participants significantly exceeded the performance of wheelchairparticipants on the 50 -yard dash and shuttle run, but no significant differencewas found among these groups on the long distance run.
Since running method was found to be a significant factor for cerebralpalsied subjects, an additional analysis was performed to confirm that differenceson running items between normal and cerebral palsied subjects reported earliercould not be solely attributable to differences in procedure. In this analysis,only unassisted cerebral palsied runners were contrasted with normal runners.The main effect of condition remained Jignificant for each of the runningLess; the differences observed between normal and cerebral palsied subjects(favoring normal subjects) on running items were not due solely to differencesin running procedure.
Summary
This section of the report discussed differences aP .g classes ofcerebral palsied subjects and differences among running methods employed bycerebral palsied subjects. Differences among classes of cerebral palsiedsubjects were identified for all items which required movement through space(running, creeping, and jumping). In addition, class membership was significantfor sit-ups, softball throw, and the grip strength items. No other classdifferences were identified. Generally, it was found that cerebral palsiedsubjects who ran unassisted surpassed the performance of subjects who ran withthe aid of assistive devices or used a wheelchair. This is not a surprisingfinding, since method of ambulation is somewhat related to the severity ofthe condition. Perhaps, of greater interest, is the finding that subjects whoused assistive devices were significantly faster than their wheelchaircounterparts over a shorter distance (shuttle run or dash), but not over alonger distance (long distance run).
Spinal Neuromuscular
This section of the report examines the effects of severity of conditionon the performance of spinal neuromuscular subjects whose level of spinal cordinvolvement was knohn. Severity of condition was defined by the site of spinalcord lesion and was similar to the classification system utilized by the NationalWheelchair Athletic Association. The site of spinal cord lesion watt opera-tionally defined by the following categories: (1) all cervical lesions (N=7),(2) lesions between Tl and TS inclusive (N=S), (3) lesions between 16 and TlOinclusive (N=36), (4) lesions between ill and L2 inclusive (N=39), and(5) lesions at L3 or below (N=33). A relatively low number of subjects, however,in the first two categories obviated their inclusion in the analysis.
A one-way multivariate analysis was performed. The dependent variableswere the 11 Project UNIQUE test items deemed appropriate for paraplegic spinalcord injured subjects (see participation guide), and the independent variablewas the site of spinal cord lesion. The multivariate ANOVA indicated that thesite of lesion was not a significant factor (p <.691) on Project UNIQUE testperformance, The test battery, therefore, did not discriminate between spinalcord injured participants with lesions occurring at T6 or below.
126

168
Physical Fitness Test Performance as a Function ofCommunity Size and Educatiowal Environment
This section of the report presents diffe-ences in performance on ProjectUNIQUE test items as a function of either community size (normal subjects) oreducational environment (impaired subjects). Differences on these variableswere analyzed, and are presented separately fox each subgroup. For normalsubjects, community size was conceptualized and defined as either urban(population of 206,000 or greater), suburban ( population equal to or greaterthan 10,000 but less than 200,000), and rural (population less than 10,000).For impaired subjects, educational environment was defined essentially byschool placement and residence. Impaired subjects were classified as eitherinstitutionalized residents (IR), institutionalized nonresidents (INR), ornon-institutionalized (NI). A subject was considered to be "institutionalized"if all of the students attending his/her school were handicapped. In thiscontext, therefore, an "institution" could be either a public or privatesegregated school. A subject was considered "non-institutionalized" if normalpupils attended the same school. This h4$ true even if the subject was educatedin a self-contained special class in that schoo:. Subjects were classifiedas residents if they resided at the school or agency rather than away fromthe school or agency.
In each analysis, a two-way analysis of covariance design was employed.Community size or educational environment and sex served as the independentvariables, and age served as the covariate. Age was covaried in an effort toaccount for possible differences in age distribution within the subgroups ofeducational environment and sex. With the exception of the cerebral palsiedgroup, a multivariate ANCOVA was calculated initially,
Normal
A sex by community size breakdown of the number of normal subjects inthis analysis is presented in Table 3.21.
TABLE 3.21. NUMBER OF NORMAL SUBJECTS CATEGORIZED BY SEX AND COMMUNITY SIZE.
Community Size Girls Boys
Urban 180 92
Suburban 319 304
Rural 182 115
The multivariate ANCOVA yielded a significant (p.000) community size bysex interaction for normal subjects. Univariate F values wore calculated posthoc. The results of the univariate analysts are presented in Table 3.22.
The data in Table 3.22 indicate that community size was a significantfactor on a number of Project UNIQUE test items. Three items - -leg raise,
trunk raise, and standing broad jump--had significant main effects for communitysize in the absence of significant interaction. The 99% confidence intervalsfor the adjusted means for the urban, suburban, and rural subgroups were
197
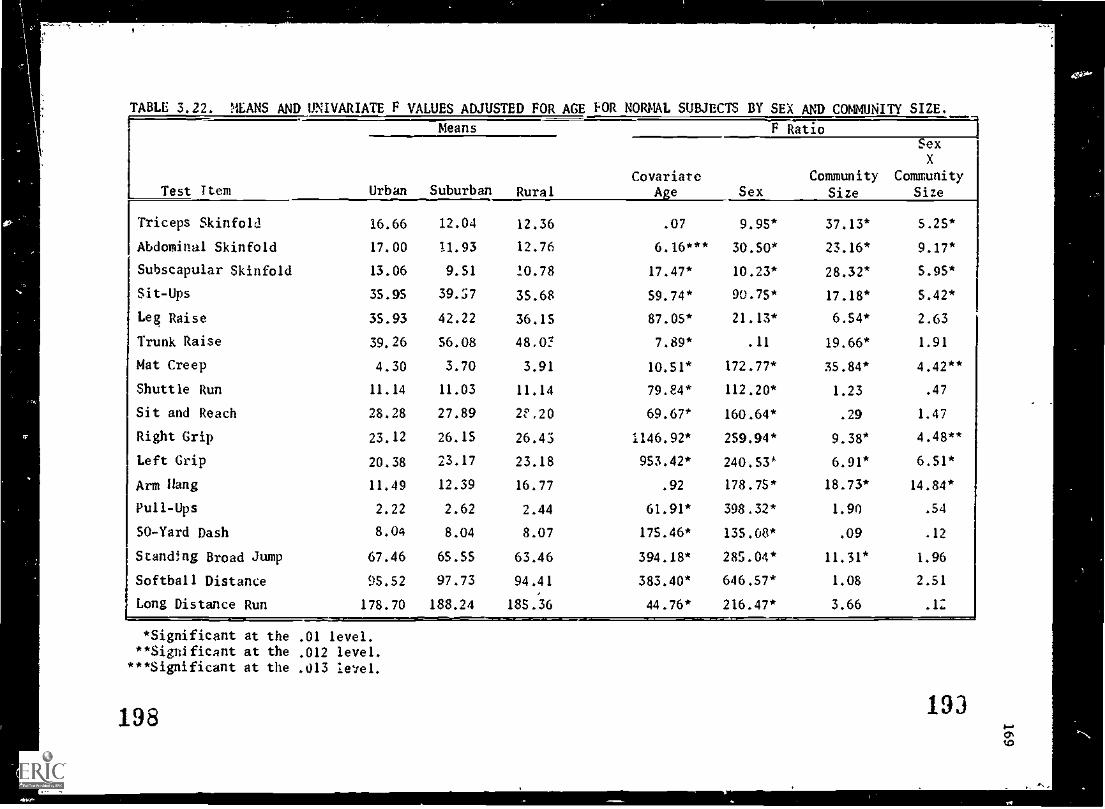
TABLE 3.22. MANS AND UNIVARIATE F VALUES ADJUSTED FOR AGE FOR NORMAL SUBJECTS BY SEX AND COMMUNITY SIZE.
Test item
Means F Ratio
Urban Suburban RuralCovariate
AgeCommunity
Sex Size
SexX
CommunitySize
Triceps Skinfold 16.66 12.04 12.36 .07 9.95* 37.13* 5.25*
Abdominal Skinfold 17.00 11.93 12.76 6.16*** 30.50* 23.16* 9.17*
Subscapular Skinfold 13.06 9.51 10.78 17.47* 10.23* 28.32* 5.95*
Sit-Ups 35.95 39.57 35.68 59.74* 90.75* 17.18* 5.42*
Leg Raise 35.93 42.22 36.15 87.05* 21.13* 6.54* 2.63
Trunk Raise 39.26 56.08 48.01 7.89* .11 19.66* 1.91
Mat Creep 4.30 3.70 3.91 10.51* 172.77* 35.84* 4.42**
Shuttle Run 11.14 11.03 11.14 79.24* 112.20* 1.23 .47
Sit and Reach 28.28 27.89 2f,20 69.67* 160.64* .29 1.47
Right Grip 23.12 26.15 26.43 1146.92* 259.94* 9.38* 4.48**
Left Grip 20.38 23.17 23.18 953.42* 240.53* 6.91* 6.51*
Arm Hang 11.49 12.39 16.77 .92 178.75* 18.73* 14.84*
Pull-Ups 2.22 2.62 2.44 61.91* 398.32* 1.90 .54
50-Yard Dash 8.04 8.04 8.07 175.46* 135.08* .09 .12
Standing Broad Jump 67.46 65.55 63.46 394.18* 285.04* 11.31* 1.96
Softball Distance 95.52 97.73 94.41 383.40* 646.57* 1.08 2.51
Long Distance Run 178.70 188.24 185.36 44.76* 216.47* 3.66 .1Z
*Significant at the .01 level.**Significant at the .012 level.
***Significant at the .013 level.
198 193

a
t.
170
contrasted on these items to determine where significant differences occurred.This technique failed to identify any significalt differences on the timedleg raise; however, when the confidence intervals were reduced to the 9S% level,suburban subjects were found to have significantly higher scores than eitherurban or rural subjects. On the timed trunk raise, suburban subjects werefound to be superior to urban subjects at the 99% level. Urban subjectsexceeded the performance of suburban and rural subjects on the standing broadjump.
Significant community size by sex interactions emerged on eight additionalvariables. The nature of this interaction is discussed briefly below for eachitem.
Triceps Skinfold
Urban girls had significantly larger skinfolds than either suburbanor rural girls. The difference between suburban and rural girls was notsignificant. No significant community size differences existed among theboys.
Abdominal Skinfold
As with the triceps measure, urban girls had significantly largerskinfolds than either suburban or rural girls. No other significant differenceswere found.
Subscapylar Skinfold
On the subscapular measure, urban girls were found to have signifi-cantly larger skinfolds than rural girls, and rural girls were found to havesignificantly larger skinfolds than suburban girls. No significant differenceswere found among the boys.
Sit-Ups
Suburban boys bac; significantly higher sit-up scores than either
urban or rural boys. Urban and rural boys did not differ significantly, and
no significant differences were found among the girls.
Mal Cre4
Suburban and rural girls recorded significantly faster mat creep timesthan urban girls. Suburban boys were significantly faster than urban boys, butrural boys did not differ significantly from either of the other groups.
Right and Left Grip Strength
Rural girls had significantly higher grip strength scores than urban
girls. Suburban girls did not differ significantly from either of the othergroups. No significant differences existed among the boys.
Flexed Arm Han
Rural boys had significantly higher flexed arm hang times than either
urban or suburban boys. No significant differences among girls were found.
20U

171
Summary
Significant differences in performance by community size were foundin 11 of the 17 test items. A somewhat greater number of differences existedfor girls than boys. A clear pattern of differences was not apparent for theboys. Where community size differences existed for the girls, however, thereappeared to be a tendency for the performance of urban girls to be inferior tothat of suburban and rural girls. The standing broad jump test was the onlyexception to this tendency.
Auditory
A sex by educational environment breakdown of the number of auditoryimpaired subjects in this analysis is presented in Table 3.23.
TABLE 3.23. NUMBER OF AUDITORY IMPAIRED SUBJECTS CATEGORIZED BY SEX ANDEDUCATIONAL ENVIRONMENT.
Educational Environment Girls Boys
Institutionalized Resident 365 480Institutionalized Nonresident 197 227Non-Institutionalized 83 116
The multivariate ANCOVA yielded a significant (p <.000) educationalenvironment by sex interaction for auditory impaired subjects. The results ofthe post hoc univariate analysis are presented '. Table 3.24.
The data in Table 3.24 indicate that educational environment was asignificant factor on most Project UNIQUE test items. Eleven test items yieldedsignificant main effect F values for educational environment in the absenceof significant interaction. On sit-ups, mat creep. shuttle run, right gripstrength, and 50-yard dash, institutionalized resieents_and institutionalizednonre :idents made significantly superior scores when compared to non-institutionalized subjects. No significant differences emerged between thetwo institutionalized samples on these items.
On the triceps skinfold, institutionalized rr..idents had significantlylarger skinfolds than institutionalized nonresidents. No differences werefound for the abdominal skinfold using 99% confidence intervals; however,institutionalized residents had agnificantly larger skinfolds than instituttionalized nonresidents and non-institutionalized subjects at the .05 level.Institutionalized residents exceeded the performance of non-institutionalizedsubjects on the leg raise and exceeded the performance of both institutionalizednonresidents and non-institutionalized subjects on the flexed arm hang. On thetrunk raise, institutionalized nonresidents made significantly higher scoresthan institutionalized residents. On the softball throw, institutionalizedresidents significantly outdistanced institutionalized nonresidents, and theinstitutionalized nonresidents significantly outdistanced the non-institutionalizedsubjects. No other significant differences among groups were observed forthese items.
201

-
TABLE 3.24. MEANS AND UNIVARIATE F VALUES ADJUSTED FOR AGE FOR AUDITORY IMPAIRED SUBJECTS BY SEX ANDEDUCATIONAL ENVIRONMENT.
Test Item
Means F Ratio
IK 4NR NI
CovariateAge Sex
EducationalEnvironment
SexX
EducationalEnvironment
Triceps Skinfold 14.72 13.28 14.87 .05 162.16* 7.52* 3.18
Abdominal Skinfold 15.79 14.22 13.78 17.83* 27.13* 6.80* .47
Subscapular Skinfold 12.36 12.09 13.03 46.45* 67.49* 1.49 .45
Sit-Ups 33.68 33.2i 25.42 60.02* 76.78* 47.16* .22
Leg Raise 36.11 33.92 26.93 116.03* 46.10* 9.53* .54
Trunk Raise 40.46 48.28 38.01 17.81* 1.69 8.77* .25
Mat Creep 3.98 3.91 5.23 23.04* 67.21* 109.47* .95
Shuttle Run 11.25 11.18 13.42 93.05* 73.71* 110.57* .03
Sit and Reach 26.13 26.50 24.74 64.79* 19.91* 2.92 .76
Right Grip 26.68 28.98 22.15 837.54* 206.00* 37.06* 3.15
Left Grip 24.48 26.88 19.44 763.36* 210.64* 47.43* 4.58*
Arm Hang 13.85 10.88 9.12 73.75* 170.03* 14.36* 2.46
Pull-Ups 2.77 2.36 2.19 125.80* 274.81* 3.58 7.55*
50-Yard Dash 7.91 8.04 9.69 191.31* 94.87* 135.87* .83
Standing Broad Jump 63.54 65.23 61.00 409.90* 246.04* 10.99* 6.47*
Softball Distance 90.05 98.13 84.37 421.72* 517.97* 14.11* 2.93
Long Distance Run 184.80 168.57 154.38 24.05* 146.31* 27.48* 9.02*
*Significant at the .01 level.
202a
203

173
in addition, a significant educational environment by sex interactionemerged on four items. Each of these items is discussed briefly below.
Left Grip Strength
institutionalized nonresident eris had significantly higher lefthand grip strength scores than girls from either the institutionalized residentor non-institutionalized groups. Boys from ...tic two institutionalized groups
exceeded the performance of non-institutionalized boys on left hand gripstrength.
Pull-Ups
institutionalized resident boys performed a significantly greaternumber of pull-ups than non-institutionaliwd boys. No other significantdifferences were identified for this test item.
Stag nding Broad Jump
institutionalized resident girls jumped significantly farther on thestanding broad jump than institutionalized nonresident Boys from thetwo institutionalized groups jumped significantly farther than boys from thenon-institutionalized group.
Long Distance Run
institutionalized resident boys covered a significantly greaternumber of yards per minute on the long distance run than boys from either theinstitutionalized nonresident or non-institutionalized groups. No othersignificant differences were observed.
Summary
Educational environment was found to be a significant factor for audi-tory impaired subjects on 15 of the 17 Project UNIQUE test items. While the super-iority of groups and subgroups varied from item to item, there was a definitetrend that the performance of non-institutionalized subjects was generallyinferior to the performance of institutionalized subjects. On 12 of the 13performance items (skinfolds excluded), the performance of non - institutionalizedsubjects was surpassed by the performance of at Nast one of the institutioulizedgroups. in general, therefore, it appears that auditory impaired subjectswho attended segregated facilities were more successful on Project UNIQUE testitems than those who attended school in integrated settings.
Visual
A sex by educational environment breakdown of the number of visuallyimpaired subjects in this analysis is presented in Table 3.25.
The multivariate ANCOVA yielded a significant Ce:.000) main eff:ect ofeducational environment for the visually impaired group. A univariate analysiswas performed post hoc. The results of this analysis are presented in Table 3.26.
204

TABLE 3.25. NUMBER OF VISUALLY IMPAIRED SUBJECTS CATEGORIZED BY SEX ANDEDUCATIONAL ENVIRONMENT.
Educational Environment Girls Boys
Institutionalized Resident 146 242Institutionalized Nonresident 40 47
Non-Institutionalized 76 98======1M
174
As indicated by the data in Table 3.26, approximately ine-half (nine of17) of the variables yielded significant main effects for educational environment.Sex did not interact with educational environment on any of the variables.Levels of educational environment were contrasted by comparing the 99% con-fidence intervals of the adjusted means on each of the ten significant variables.
On each of the skinfold measures, institutionalized residents werefound to have significantly larger skinfolds than non-institutionalizedsubjects. Subjects from the two institutionalized groups (resident and non-resident) made significantly higher scores than non-institutionalized subjectson sit-ups and the two grip strength measures. On leg raise and long distancerun, institutionalized residents significantly surpassed the performance ofnon-institutionalized subjects; and on flexed arm hang, institutionalized non-residents exceeded the performance of non-institutionalized subjects. Nodifferences were found between the subgroups of educational setting for the50-yard dash.
Summary
Educational environment was found to be a significant factor on nine ofthe 17 test items. Although educational environment was not significant onas many variables for visually impaired subjects as for auditory impaired sub-jects, the trend for the institutionalized groups to be superior to the non-institutionalized groups was apparent in each analysis. Of the six performanceitems where educational environment was significant for the visually impaired,the non-institutionalized group was found to be inferior to at least one ofthe institutionalized groups in every case. Visually impaired subjects whoattended school in segregated settings were more successful on certain ProjectUNIQUE test items than were visually impaired subjects who attended schoolin integrated settings.
Cerebral Palsy
A sex by educational environment breakdown of the number of cerebralpalsied subjects in this analysis is presented in Table 3.28.
The results of the univariate ANCOVA designed to investigate the effectof educational setting on the test performances of cerebrai palsied subjects
are presented in Table 3.27.
As shown by the data in Table 3.27, the main effect of educatic -1 settingwas significant on only three test items--mat creep, shuttle run, .end right hand
205
-r

TABLE 3.26. MEANS AND UNIVARIATE F VALUES ADJUSTED FOR AGE FOR VISUALLY IMPAIRED SUBJECTS BY SEX ANDEDUCATIONAL ENVIRONMENT.
Test Item
Means F Ratio
IR INK NI
CovariateAge Sex
EducationalEnvironment
SexX
EducationalEnvironment
Triceps Skinfold 15.49 13.94 12.84 .05 30.48* 7.58* .16
Abdominal Skinfold 16.60 14.69 12.72 9.31* 1.61 8.34* .11
Subscapular Skinfold 13.91 1?..36 11.19 15.58* 7.37* 7.24* .06
Sit-Ups 32.95 34.17 28.71 20.16* 31.96* 11.72* 1,19
Leg Raise 36.77 25.72 20.71 30.92* 4.84 16.65* 1.22
Trunk Raise 32.80 37.38 30.49 18.35* 1.20 1.30 1.13
Mat Creep 4.84 4.90 5.42 .87 10.25* 3.87 3.36
Shuttle Run 14.33 13.19 13.52 22.87* 9.40* 1.86 .15
Sit and Reach 25.86 26.07 25.32 4.02 5.71 .27 1.52
Right Grip 22.16 23.62 18.13 288.49* 70.69* 16.26* 2.75
Left Grip 19.96 21.35 16.36 270.98* 63.21* 14.35* 1.20
Arm Hang 9.93 14.83 7.10 27.94* 42.54* 10.79* .62
Pull-Ups 2.28 2.65 1.60 34.08* 91.97* 4.03 1.96
50 -Yard Dash 9.62 9.15 8.95 51.73* 12.41* 4.54** .98
Standing Broad Jump 57.08 60.03 55.28 111.23* 72.14* 2.96 .17
Softball Distance 58.95 59.92 62.29 101.21* 92.21* .56 2.39
Long Distance Run 163.77 152.14 148.32 11.71* 29.63* 7.13* .94
*Significant at the .01 level.**Significant at the .011 level.
206 207

_N. w , -=..
TABLE 3.27. MEANS AND UNIVARIATE F VALUES ADJUSTED FOR AGE FOR CEREBRAL PALSIED SUBJECTS BY SEX ANDEDUCATIONAL ENVIRONMENT.
Test Item
Means F Ratio
IR INR NI
CovariateAge Sex
EducationalEnvironment
SexX
EducationalEnvironment
Triceps Skinfold 14.54 13.13 11.93 .15 12.90* 3.51 .16
Abdominal Skinfold 15.40 13.25 12.13 13.47* 6.09** 3.28 .65
Subscapular Skinfold 12.77 11.07 10.36 12.98* 2.41 2.85 .1$
Sit-Ups 3.84 5.79 7.93 4.24 .71 2.71 1.65
Leg Raise 8.37 13.56 8.11 .11 2.66 2.76 .32
Trunk Raise 15.39 7.69 15.58 3.51 .16 .44 1.65
Mat Creep 19.30 23.03 12.96 .97 1.37 7.54* 3.22
Shuttle Run 47.62 62.90 36.06 .42 .03 13.56* .67
Sit and Reach 21.90 16.51 17.64 .00 .76 .94 .03
Right Grip 15.02 9.19 12.71 88.04* 4.73 4.84* .29
Left Grip 13.50 8.65 12.42 69.29* 8.56* 4.31** .69
Arm Hang 2.30 2.99 2.91 5.43 6.69* .36 .12
Pull-Ups .75 .63 .75 4.56 7.61* .01 .55
50-Yard Dash 34.06 58.86 38.91 3.85 1.65 1.16 .60
Standing Broad Jump 31.85 31.41 27.54 .31 2.21 .97 .17
Softball Distance 22.49 19.45 26.58 8.97* 11.55* 2.57 .98
Long Distance Run 85.35 64.50 74.82 2.97 .21 .39 2.09
*Significant at the .01 level.
**Significant at the .014 level.
208209
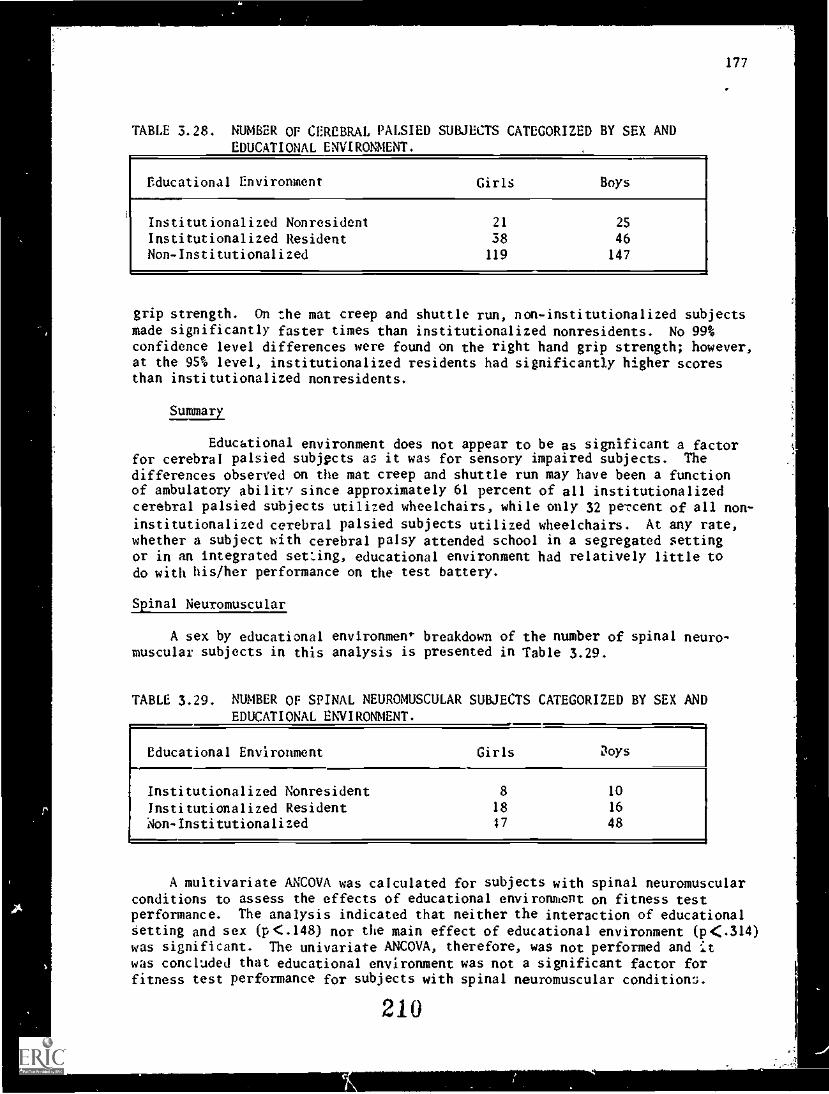
177
TABLE 3.28. NUMBER OF CEREBRAL PALSIED SUBJECTS CATEGORIZED BY SEX ANDEDUCATIONAL ENVIRONMENT.
Educational Environment Girls Boys
Institutionalized Nonresident 21 25
Institutionalized Resident 38 46Non-Institutionalized 119 147
grip strength. On the mat creep and shuttle run, non-institutionalized subjectsmade significantly faster times than institutionalized nonresidents. No 99%confidence level differences were found on the right hand grip strength; however,at the 95% level, institutionalized residents had significantly higher scoresthan institutionalized nonresidents.
Summary
Educational environment does not appear to be as significant a factorfor cerebral palsied subjects as it was for sensory impaired subjects. Thedifferences observed on the mat creep and shuttle run may have been a functionof ambulatory ability since approximately 61 percent of all institutionalizedcerebral palsied subjects utilized wheelchairs, while only 32 percent of all non-
institutionalized cerebral palsied subjects utilized wheelchairs. At any rate,whether a subject with cerebral palsy attended school in a segregated settingor in an integrated setting, educational environment had relatively little todo with his/her performance on the test battery.
Spinal Neuromuscular
A sex by educational environment breakdown of the number of spinal neuro-muscular subjects in this analysis is presented in Table 3.29.
TABLE 3.29. NUMBER OF SPINAL NEUROMUSCULAR SUBJECTS CATEGORIZED BY SEX ANDEDUCATIONAL ENVIRONMENT.
Educational Environment Girls Zoys
Institutionalized Nonresident 8 10
Institutionalized Resident 18 16
Non-Institutionalized 17 48
A multivariate ANCOVA was calculated for subjects with spinal neuromuscularconditions to assess the effects of educational environment on fitness testperformance. The analysis indicated that neither the interaction of educationalsetting and sex (p (.148) nor the main effect of educational environment (p<.314)was significant. The univariate ANCOVA, therefore, was not performed and itwas concluded that educational environment was not a significant factor forfitness test performance for subjects with spinal neuromuscular condition:;.
210

178
Additional Descriptive Statistics
This section presents additional descriptive statistics which furtherserve to detail jifferences between the major subgroups. Specifically, the
magnitude of differences between normal and impaired subjects expressed instandard deviation units is discussed. Also, coefficients of variation werecalculated for each item in each subject group and are presented in thissection. Finally, the percentages of impaired subjects whose performancesurpassed the median score of normal subjects for each test item is presented.
Magnitude of Differences of Individuals withHandicapping Conditions and Normal SubjectsExpressed in Standard Deviation Units
In order to identify and analyze the magnitude of differences in testitems between subjects with impairments and normal individuals, results onvariables have been expressed in standard deviation units. The resultsrepresent the standard deviation units, or fractional parts thereof, thatmean scores of the impaired on a particular test item differ from the meanScore of normal children of the same sex on that test item. The results ofthese computations appear in Table 3.30. In Table 3.30, individuals withauditory impairments, visual impairments, cerebral palsy, spinal neuromuscularconditions, and congenital anomalies!amputations are compared with the resultsattained by normal subjects. The standard deviation units which are presentedin the table are computed by subtracting the mean raw scores of males or femalesof each of the categories of normal subjects from the corresponding mean rawscore of male or female subjects with impairments and dividing the differenceby the standard deviation of the corresponding sex group in the normal sample.,Thus, a zero score represents the standard mean value for normal boys and girls.In the table, the lack of sign represents a standard deviation unit above themean, and the minus sign (-) represents a standard deviation unit below the
mean Units above the mean should not indiscriminantly be interpreted todenote desirable performance. In some cases, negative signs reflect low scores
which indicate superior performance. This is true in the case of timed eventsincluding the 50-yard dash, mat creep, and shuttle run. Skinfold measures belowthe mean (negative sign) will generally be desirable; however, extreme positiveor negative scores may be undesirable.
The comparisons shown in Table 3.30 do not distinguish subjects in termsof the procedures followed in test administration. Thus, for example, subjectsperforming dashes in wheelchairs or running with a sighted partner are comparedin this table with normal youngsters running the dash unassisted. (In cases
where subjects performed test items with modifications, results are analyzed ingreater detail in an earlier section of this report.)
In relationship to comparisons between individuals with auditory impair-ments and normal subjects, the information in Table 3.30 indicates that theperformance of the auditory impaired is relatively close to that of normal
subjects. The magnitude of differences between normal and auditory impairedsubjects in no case exceeds one standard deviation. In fact, most of the
differences between these groups do not exceed a magnitude of difference greaterthan 0.25. Although not tested for statistical significance, there appear to begreater differences between auditory impaired and normal girls than between
211

(4*
179
TABLE 3.30. MAGNITUDE OF DIFFERENCES EXPRESSED IN S.D. SCALE UNITS BETWEENSUBJECTS WITH IMPAIRMENTS AND NORMAL SUBJECTS ON PROJECT UNIQUETEST ITEMS.
Test Item
AuditoryImpairments
Female Male
Visual
ImpairmentsFemale Male
CerebralPalsy
Female Male
SpinalNeuromuscularFemale Male
CongenitalAnomalies/Amputee
Female Male
Triceps 0.41 -0.12 0.37 0.05 0.01 -0.27 0.31 0.46 0.29 0.02
Skinfold*
Abdominal 0.25 0.26 0.17 0.4S -0.06 -0.03 0.32 0.79 0.23 0.45
Skinfold*
Subscapular 0.51 0.14 0.49 0.41 0.05 0.04 0.44 0.88 0.47 0.43Skinfold*
SitUps -0.58 -0.61 -0.65 -0.62 -3.12 -3.21 -3.04 -2.72
Leg Raise -0.24 -0.12 -0.32 -0.23 -0.99 -1.04 -0.64 -0.84
Trunk Raise -0.25 -0.18 -0.52 -0.45 -0.80 -1.39 -0.97 -0.94
Mat Creep* 0.22 0.50 1.44 1.67 14.00 16.50 6.33 9.67
Shuttle Run* 0.45 0.25 3.00 2.08 27.82 21.67 21.09 22.92 14.45 8.67
Sit and Reach -0.49 -0.03 -0.53 -0.06 -1.50 -1.00 - - -0.74 -0.64
Right Grip 0.03 0.05 -0.59 -0.38 -1.34 -1.17 -0.96 -0.45 -0.76 -0.91
Left Grip 0.12 0.12 -0.48 -0.35 -1.19 -1.01 -0.84 -0.47 -0.74 -0.69
Arm Hang -0.18 -0.12 -0.26 -0.54 -0.68 -0.80 -0.52 -0.71 -0.39 -0.76
Pull-Ups -0.06 0.06 0.00 -0.19 -0.22 -0.81 0.05 -0.56 0.33 -0.64
50-Yard Dash* 0.17 0.18 1.17 1.18 32.92 19.73 16.58 22.91 20.67 9.09
Broad Jump -0.30 -0.02 -0.96 -0.57 -3.47 -2.87 - - -3.58 -22.69
Softball -0.04 -0.17 -0.94 -1.00 -1.81 -1.95 -1.87 -1.91 -1.55 -1.45Distance
Long Distance -0.63 -0.72 -0.69 -0.86 -1.05 -1.31 -1.05 -1.33 -0.95 -1.32Run
*Except in the case of skinfold measures, low scores (negative S.D. unit) onthese items denote superior performance. Extreme positive or negative skinfoldscores are undesirable. Generally, skinfold measures below the mean (negativesign) are desirable.
214

180
auditory impaired and normal lays. Also, girls with auditory impairments'appear to perform below normal girls on more items than boys with nttitoryimpairments relative to normal boys. As a group, individuals with auditoryimpairments appear to fall behind, to the greatest extent, on test items whichinvolve running. Individuals with auditory impairments appear to comparefavorably to normal subjects in grip strength.
When comparing the results of subjects with visual impairments withresults attained Iv normal subjects, it becomes apparent that normal individualsexceed the performance of subjects with visual impairments on many test items.The magnitude of difference between the visually impaired and the normal isgenerally greater that that between the auditory impaired and the normal. Theseresults support the contention that normal individuals as a group, are leaner,possess greater muscular strength and endurance, more flexibility, and greateragility and speed than subjects with visual impairments. The largest differencesoccur in softball distance and in those test items involving moving to a targetin the fastest possible time. The results pertaining to the softball throw arein agreement with those found in previous research and are evidently accountedfor by a learning factor. The fact that individuals with visual impairmentsscore lower than individuals with normal vision on items requiring them to runfrom one place to another is, of course, expected. Individuals moving withoutthe benefit of sight and with the nee4 to use guide wires, partners, or otherassistive devices are at a disadvantage. The magnitude of difference betweennormal boys and those with visual impairments is least in items pertaining toflexibility, certain items involving muscular strength/endurance, and skinfoldmeasurements. In regard to girls, the magnitude of differences is smallestin pull-ups. This could be attributed to the fact that neither group performedwell on this test item.
Of the specific handicapping groups compared, individuals with orthopedicimpairments exhibited the greatest differences from normal subjects. From thedata presented in Table 3.30, it can be clearly seen that the various subgroupscomprising orthopedic impairments are within one standard deviation unit ofthe performance of normal subjects on items where similar procedures werefollowed. However, :.hen orthopedically impaired youngsters performed test itemswith modifications, the magnitude of differences were increased greatly. rntest items such as the 50-yard dash or shuttle run, the differences are verylarge. This is expected since individuals who perform these activities in awheelchair or with some assistive device are at a tremendous disadvantage whencompared with youngsters without lower body disabilities. Thus, the magnitudeof differences must be attributed to differences in methods of ambulation aswell as possible differences in fitness. The orthopedic groups come closestto the normal groups in skinfold measurements.
In the case of subjects with cerebral palsy, it is apparent that indivi-duals with cerebral palsy are relatively close to normal subjects in the areaof body composition. Relative to test items measuring muscular strength/endurance, individuals with cerebral palsy are generally between one and twostandard deviations below the performance of normal subjects. In the case ofsit-ups and broad jump, the magnitude of differences exceeds or approachesthree standard deviation scale units. It is possible that these results maybe influenced by the inadequate inhibition of reflex patterns.
213

181
In the case of items requiring subjects to ambulate for a particulardistance or time, indi%iduals with cer bral palsy are far below the performanceof normal subjects. Although this might be attributed, to some extent, todifferences in physical fitness, certainly the fact that individuals withcerebral palsy performed these ,activities in wheelchairs and with assistivedevices (i.e., with modifications) is a factor in the large discrepancy.
Individuals with spinai neuromuscular conditions come closer to theperformance of normal subjects than do individuals with cerebral palsy; however,they also exhibit relatively large differences in regard to certain itemsdealing with body comnosition and muscular strength/endurance. On dashes andthe shuttle run, the performance of individuals with spinal neuromuscularconditions is much different than that of normal subjects. Again, this may beattributed, to great extent, to the fact that these activities were performedin wheelchairs and that the activities are characterized by starts and stopsin a relatively short period of time, requirhig the constant overcoming ofinertia. Interestingly, thy: diszrepancv between performance of normal subjectsand performance of individuals with spinal neuromuscular conditions on the longdistance run (yards per minute) was 'ess (slightly above one standard deviation)than found in other timed items relative to ambulation. Evidently, when thedistance is increased, the discrepancy between normal and wheelchair performersdecreases.
In regard to individuals with congenital anomalies or amputations, resultsare similar to those '-70 .1th the other two groups included in the orthopediccategory.
In summary, individuals with auditory impairments are closer to theperformance of normal subjects than individuals from the other groups. Indivi-duals with auditory impairments are generally followed in comparative performanceby individuals with visual impairments. Individuals with cerebral palsy exhibitperformance closest to normal 1.erforma ce than any of the other groups in theskinfold test items. On the other hand, the sit-up performance of individualswith cerebral palsy deviates more from normal performance than any other impairedgroup. The cerebral palsy group is also the 4eakest as expressed by scoreson grip strength and arm hang. The cerebral palsied and individuals withcongenital anomalies/amputations are extremely different from normal subjectsin broad jump performance. Individuals with orthopedic impairments performingthe softball throw from a seated position deviate, to a great extent, fromnormal performance. The difference between normal subjects' performance andthe performance visually handicapped individuals in the softball throw isrelatively large. Finally, meaniagful comparisons must be limited in caseswhere test items have been sioificantly modified for individuals with handi-capping conditions. Meaningfu, analysis in these cases must consider eachmodification. This analysis was performed in other sections of this report.
Variability and the Performance of Test Items
It has long been accepted that individuals with handicapping conditionsare more variable in their r4rformance on physical fitness related test itemsthan normal individuals. It is also expected that the extent of variabilitywill be a function of the particular variable being measured. To providecomparable data on the variability of performance of subjects included in this
x'14
4

-^w
182
study, coefficients of variation were computed and are presented in Table 3.31.The coefficient of variation enables data to be arrange(' into units which maybe compared, i.e., data is transferred to the same scale of measurement withthe same units. The coeffi:ient of variation is determined by multiplyingthe standard deviation of a sample by 100 and dividing by the mean of thesample. Essentially, this procedure provides a statistic which indicates thevariability of ono sample in relationship to its mean. This statistic enhancescomparison to a second sample in relationship to its mean.
The coefficients of variation in relationship to Project UNIQUE PhysicalFitness Test items are presented ia Table 3.31. Generally, the results indicatethat individuals with handicapping conditions are more variable than normalsubjects in their physical performance. This becomes particularly obviousin comparing normal subjects with individuals with orthopedic impairments.With few exceptions, the variation in performance of cerebral palsied youngstersand youngsters with congenital anomalies/ampuations far exceeds the variationof normal boys and girls. It should be mentioned that although the resti?".amight be due to the wider variation in physical fitness of handicapped youngstersas compared to normal youngsters, it is also important to realize that variationis influenced by the varying procedures under which individuals with handicappingconditions performed the test items. For example, it is not surprising thatthe coefficient of variation of running items for individuals with visualimpairments exceeds that of normal individuals, because individuals with theseimpairments performed these activities with a partner, guide wire, or with noassistance. Individuals with orthopedic impairments performed dashes and otherevents in a variety of modalities.
Different test items tend to elicit greater or lesser variation inperformance. The test items which elicit the least variation in performanceinclude the broad jump and dashes (except for individuals with orthopedicimpairments), long distance run in yards per minute (except for normal subjectsand certain groups of subjects with orthopedic impairments), and the shuttlerun (except for individuals with visual and orthopedic impairments). The matcreep is an item which varies relatively little in the case of normal subject:.Skinfoid and sit and reach test items are among those which vary least whencomparisons are made within the orthopedic classes.
Test hems eliciting greatest variation are quite definite. The flexedarm hang, pull-ups, leg raise, and trunk raise are items which elicit relativelygreat variation across all or most subject groups.
In summary, it is clear from Table 3.31 that individuals with handicappingconditions exhibit greater variation in performance than normal subjects.Variability also tends to increase in test items in which iAividuals performitems under different conditions and in which subjects are asked to hold cer-tain positions for indefinite periods of time.
Percent of Subjects with Handicapping ConditionsScoript Hie n. than Median Values of Normal Subjects
In comparing the performance of individuals with handicapping conditionsar normal subjects, a great deal of attention placed on the analysis ofgroup performances and upon the mean and standard deviation as measures of
215
et.

ABLE 3.31. COEFFICIENTS OF VARIATION OF TEST ITEMS.
Variables NormalGirls Boys
AuditoryImpairmentsGirls Boys
Visual
ImpairmentsGirls Boys
SpinalNeuromuscularCirls Bo s
CerebralPalsy
Girls Bo
CongenitalAnomalies/Amputees
Girls Bo s
Triceps Skinfold 50.65 41.40 40.93 50.16 49.70 55.30 47.86 49b55 51.26 53.17 41.66 65.55
Abdominal 58.38 55.93 44.87 64.02 61.22 73.59 70.33 52.15 56.71 73.81 39.85 86.60Skinfold
SubscapuIar 51.60 48.79 43.94 53.56 55.59 67.15 64.06 54.52 55.04 64.60 37.54 70.73Skinfold
Sit-Ups 26.68 24.85 36.34 33.17 33.01 32.76 146.24 121.17 137.98 100.82
Leg Raise 76.85 74.84 76.39 76.87 106.99 98.00 133.79 183.94 136.90 116.49
Trunk Raise 71.25 71.73 81.09 81.70 101.22 93.19 167.22 103.41 191.70 148.72
Mat Creep 20.62 17.58 27.37 31.19 54.44 33.20 112.30 98.87 75.76 115.27
Shuttle Rim 9.43 10.82 17.27 19.39 38.20 41.31 37.38 90.45 70.69 94.17 70.69 55.21
Sit and Reach 25.63 31.13 31.23 35.43 32.72 37.27 - 63.79 55.90 43.'7 49.69
Right Grip 55.39 45.34 38.77 44.76 44.51 48.71 59.:8 61.68 72.19 76.32 58.12 71.29
Left Grip 37.90 48.05 40.19 45.95 46.13 51.38 62.67 69.47 78.44 76.33 74.87 83.84
Flexed Arm Hang 120.49 95.55 124.24 87.49 125.71 104.78 155.02 122.65 191.19 181.96 139.84 141.45
Pull-Ups 225.66 86.77 223.41 95.23 215.77 11'.38 196.74 132.76 348.43 215.07 203.56 203.63
50-Yard Dash 14.58 14.12 17.87 19.19 21.82 30.46 47.05 149.56 160.16 102.85 161.59 73.32
Broad Jump 16.23 18.50 19.19 21.40 26.29 27.32 - - 56.38 42.11 73.82 53.68
Softball 39.50 38.00 41.54 36.97 54.25 52.80 50.28 66.38 65.02 72.97 55.70 63.33Distance
Long Distance Run 70.07 56.38 24.89 24.62 27.65 26.83 39.48 42.86 47.54 52.90 38.24 77.86
2 1 C
217

18.;
central tendency and variation, respectively. Through various statisticalanalyses and under certain assumptions, one may conclude that one group ishighe« or lower in performance than another group. fn this particular study,it ha.; generally been found ti.Jt normal subjects exceed the performance ofindividuals with handicapping conditions. Although the performance of individualswith handicapping conditions is generally lower than that of normal subjects,it remains impoAnnt to know if the performance of individuals with handicappingconditions is invariably low, or if a certain percentage of these individualsperform above a point at which SO percent of normal subjects perform, i.e., *henormal medirAn value. If individuals with handicapping conditions exceed medianperformance values, the indication is that at least median performance is withirthe reach of certain classes of individuals. A question related to such ananalysis is whether performance above normal median performance function oftest horns or components of physical fitness. For example, intlividdals withhandicapping conditions may exceed median levels of performance of normalsubjects in flexibility but not in muscular strengthiendurance. In order toshed some light on these questions, the percent of impaired subjects by sexwith scores higher than meuian values of normal subjects was determined. Themedian values for normal subjects are presented in Table 3.32, and the percentof impaired subjects who surpassed the median score for normals is presented inTable 3.33.
TALL 3.32. MEDIAN VALUES FOR NORMAL SUBJECTS ON TEST ITEMS.
Test Item Girls Boys
Triceps Skinfold (mm.) 15.0 11.'
Abdominal Skinfold (mm.) 11.8 10.0Subscapular Skinfold (mm.) 10.0 9.0Sit-Ups (no.) 3F.0 41.4Leg Raise (sec.) 28.6 34.8Trunk Raise (sec.) 42..8 42.1Mat Creep (sec.) 4.0 3.5Shuttle Run (sec.) 11.4 10.o
Sit and !Inch (cm.) 31.4 25.1Right Grip (kg.) 22.0 28.7
Left Grip (kg.) 19.4 24.6Arm Hang (sec.) 5.5 14.9Pull-Ups (no.) 0.2 3.3SO -Yard Dash (sec.) 8.3 7.6Broad Jump (in.) 60.4 69.0Softball Distance (ft.) 62.5 114.9Long Distance Run (yds./min.) 164.7 20(.0
Although the information presented is relatively straight forward, a fewpoints need to be made relative to Table 3.33. First, the information presentedin the table does not consider modifications in test administration or specificInfluences of disabilities. Thus, for example, when individuals with visualimpairments are compared with normal individuals in the SO-yard dash, nodistinction is made as to whether individuals with visual impairments used
218

185
TABLE 3.33. PERCENT OF IMPAIRED SUBJECTS CATEGORIZED BY SEX WITH SCORES HIGHERTHAN MEDIAN VALUES OF NORMAL SUBJECTS.*
CongenitalVisual Cerebral SpinalAuditory Anomalies/
Test Item Impairments impairments Palsy Neuromuscular AmputeesFemale Male Female Male Female Male Female Male Female Male
Triceps 65.5 42.1 58.1 46.1 47.2 37.1 61.6 62.5 72.0 40.0
Skinfold
Abdominal 69.8 55.5 53.3 56.5 52.3 44.8 57.1 78.1 73.1 44.4
Skinfold
Subscapular 75.8 54.5 66.0 55.5 49.7 45.9 52.8 71.6 80.8 50.0
Skinfold
Sit-Ups 34.4 27.6 28.4 28.1 1.5 0.6 0.0 4.6
Leg Raise 39.0 47.7 31.3 36.9 5.4 4.5 22.2 13.6
Trunk Raise 40.2 43.3 29.8 30.6 17.0 4.4 9.1 14.3
Mat Creep** 55.5 57.3 77.6 78.0 100.0 100.0 - 76.5 90.0
Shuttle 59.9 50.8 86.2 79.7 99.2 99.4 100.0 100.0 100.0 100.0
Run**
Sit and 31.2 47.9 33.6 48.9 15.2 23.2 25.0 34.8
Reach
Right Grip 49.7 54.4 26.7 40.0 10.2 12.3 16.4 32.4 23.8 27.6
Left Grip 54.5 60.4 30.5 41.1 19.4 15.1 19.4 36.2 23.8 33.3
Arm Hang 42.7 48.3 37.8 35.6 5.7 7.4 21.1 17.9 38.9 15.4
Pull-Ups 33.1 50.2 29.6 38.5 2.2 11.6 32.1 23.6 31.6 11.1
50-Yard 51.6 43.1 73.5 70.3 98.4 99.3 100.0 100.0 100.0 100.0
Dash**
Broad Jump 39.8 52.5 26.0 34.0 0.0 1.4 0.0 9.5
Softball 51.5 50.9 18.9 16.3 1.4 1.2 0.0 0.0 5.0 6.7Distance
Long Distance 41.0 45.1 31.3 25.3 1.7 1.1 0.0 0.0 8.3 7.1
Run
*The information presented herein does not consider modifications in proceduresfollowed, in certain instances, in test administration. Subjects performingactivities in wheelchairs or using other assistive devices, for example, arecompared with subjects following unmodified procedures.
**Because lower raw scores reflect better performance in the 50-yard dash, matcreep, and shuttle run, the percentages presented above relative to theseitems indicate the percentage of subjects who scored above the median pointrelative to raw score but below the median performance level.
219

186
guide wires, partners, or other assistive devices and no distinction is madebetween the blind and partially sighted. Obviously, these factors willinfluence results. The information in Table 3.33 presents global comparisons.
In analyzing the information in Table 3.33, it must be stressed that lowerraw scores reflect better performance in the 50-yard dash, mat creep, andshuttle run. This being the case, the percentages presented in the tablerelative to these items indicate the percentage of subjects who scored abovethe median point relative to raw score but below the median performance level.Thus, 73.5 percent of visually impaired females scored above the median pointon the 50-yard'dash, which means that the greatest percentage of femaleswho performed better in the 50-yard dash than normal females is 26.5 percent.In the case of skinfold measures, caution also needs to apply, since low scoreson skinfolds may denote superior performance. Extreme positive or negativescores in relationship to skinfolds are undesirable.
In reviewing the information in Table 3.33, it can be seen that individualswith auditory impairments very frequently exceed. he median performance ofnormal subjects. Over SO percent of auditory impaired males exceed the medianvalue of normal males in right grip, left grip, pull-ups, broad jump, andsoftball throw for distance. In addition, auditory impaired males compare favorablywith normal males in triceps skinfold. Females with auditory impairments, onthe other hand, compare quite favorably with normal females on left gripstrength and softball throw for distance. A relatively small percentage ofindividuals with auditory impairments exceeds median performance levels of normalsubjects on sit-ups.
Although many individuals with visual impairments exceed median performancevalues of normal subjects, individuals with visual impairments, as a group,do not exceed the median performance values of normal subjects to as great anextent as do individuals with auditory impairments. Among the areas in whichmale individuals with visual impairments compare most favorably are in skinfoldmeasurements, grip strength, and sit and reach. Females with visual impairmentscompare most favorably with normal individuals in skinfold, leg raise, armhang, sit and reach, and the long distance run. The poorest performance ofmales with visual impairments, in comparison with normal males, occurred insoftball throw for distance, long distance run, sit-ups, mat creep, and shuttle
run. The poorest performances of females with visual impairments, in comparisonwith normal females, occurred on shuttle run, mat creep, 50-yard dash, softballdistance, broad jump, right grip strength, and sit-ups.
Individuals with orthopedic impairments clearly exceed the performance ofnormal individuals less often than do individuals from other groups of handi-capping conditions. Relative to individuals with cerebral palsy, few exceedmedian performance levels of normal individuals in measures of muscularstrength/endurance and cardiorespiratory endurance. Individuals with cerebralpalsy compared most favorably with normal youngsters in skinfold measurements.Individuals with spinal neuromuscular conditions exceed the median levelperformance of normal individuals, to a greater extent, in the area of muscularstrength/endurance than do individuals with cerebral palsy. However, in thearras related to softball throw for distance and test items involving therequirement to move a wheelchair for time, Zew individuals with spinal neuro-muscular conditions exceed median values of normal subjects. Relative to
220

187
individuals with spinal neuromuscular conditions, most youngsters who exceedmedian level performance of normal subjects do so in the area of skinfoldmeasurements. Male individuals with congenital anomalies/amputations comparemost favorably with skinfold measures of normal males. In addition, males withcongenital anomalies/amputations compare best with normal males in grip strengthand sit and reach. Males with congenital anomalies/amputations compare leastfavorably with normal males in sit-ups, broad jump, softball throw for distance,dashes, mat creep, shuttle run, and long distance events. The relatively lowvalues associated with "running" events were undoubtedly affected by thedifferent procedures that were followed by these subjects in performing theseactivities. In other words, differences were undoubtedly due to differencesin procedures as well as differences in fitness. Female subjects with congenitalanomalies/amputations compared best with normal females in arm hang and pull-ups.Females with congenital anomalies/amputations scored lowest relative to normalfemales in sit-ups, trunk raise, broad jump, softball throw for distance, longdistance run, stork stand, dashes, rise-to-stand, and shuttle run.
In summary, individuals with auditory impairments compare most favorablyrelative to median performance levels of normal subjects. A reasonable per-centage of individuals with visual impairments exceed normal median performance,except in activities involving speed of movement through space. Individualswho exhibit orthopedic impairments generally compare most favorably in itemsdealing with skinfold measurements. Comparisons of individuals with orthopedicimpairments with normal individuals is limited because of modifications intest items. Within the limitations of such comparisons, individuals withorthopedic impairments do not score well relative to normal individuals.
221

4
CHAPTER IV
FACTOR STRUCTURE OF THE NORMAL ANDIMPAIRED SUBJECT GROUPS
A number of factor analytic solutions were caiculated from data on thenormal and impaired subject groups. Factor structures were obtained for normalboys and girls, auditory impaired boys and girls, visually impaired boysand girls, cerebral palsied boys and girls, and paraplegic wheelchair spinalneuromuscular subjects (sexes combined). The procedures utilized and theresults obtained from these analyses are discussed in this chapter.
Factor Analytic Procedures
The factor analytic techniques used were those proposed by Harris andHarris (1971) and employed by Rarick and Dobbins (1975) in a study similar tothe present one. In this procedure, six factor solutions are derived usingthree types of factor analysis: incomplete principal components analysis(Harmon, 1967), canonical component analysis (Rao, 1955), and alpha factoranalysis (Kaiser and Caffrey, 1965); and two types of rotation: orthogonal
and oblique. The type of orthogonal rotation used was the varirnax proceduredeveloped by Kaiser (1958), and the type of oblique rotation used was developedby Harris and Kaiser (1964). The six solutions were calculated using thedefault option procedures of subprogram Factor in the Statistical Package forthe Social Sciences (Nie, et al., 1975). A variable was considered to belongto a factor ifrit had a factor loading of .40 or greater on four of the six
derived solutions. This procedure was considered to constitute a conservativeapproach to factor analysis where the final factor structure is not overlydependent on the type of factor analysis employed.
Factors which emerged from this procedure were classified as eithercomparable common factors or comparable specific factors as defined by Dobbinsand Rarick (1975). In this definition, a comparable common factor is onewhich has at least three variables which load at .40 or better on four out ofthe six derived solutions. A comparable specific factor is defined as onewhich has one or two variables which load at .40 or bettor on four out of thesix derived solutions.
Since the final factor structure is directly dependent upon the number andtype of variables included in the analysis, some care was taken to include onlythose items which had demonstrated good reliability. In addition, variableswhich had been computed from other variables (e.g., sum of the skinfolds, sumof the grips, softball throw for velocity) were not entered into the factoranalysis. It also should be noted that the factor analyses performed on thedata for orthopedically impaired subjects were calculated with different setsof variables than those performed on data from the normal and the sensoryimpaired groups. This was necessary because, as discussed earlier, some testitems were deemed inappropriate for certain orthopedic disabilities. Table 4.1presents the variables included in the factor analysis for each group of sub-jects. An "X" is placed next to those variables included in the factor analysisfor each group of subjects.
188
222
10

al,
189
TABLE 4.1. TEST SCORES INCLUDED IN FACTOR ANALYSIS CATEGORIZED BY GROUP.
Test Items
Normal Auditory VisualCerebralPalsy
ParaplegicWheelchair
SpinalNeuromuscular
Triceps Skinfold X X X X X
Abdominal Skinfold X X X X X
Subscapular Skinfold X X X X X
Sit-Ups X X X X
Leg Raise X X X X
Trunk Raise X X X
Mat Creep X X X X
Shuttle Run X X X X X
Sit and Reach X X X
Right Grip X X X X X
Left Grip X X X X X
Arm Hang X X X X X
Pull-Ups X X X X X
SO-Yard Dash X X X X X
Standing Broad Jump X X X
Softball Distance X X X X X
Long Distance Run (Yardsper Minute) '
X X X X X
Seventeen test items were factor analyzed for the normal, auditory impaired,and visually impaired subject groups. Fourteen items were factor analyzed fromcerebral palsied subjects, and 11 were factor analyzed for paraplegic wheelchairspinal neuromuscular participants. Only subjects who took all the items listedunder the appropriate group in Table 4.1 were included in the factor analysis.Since many subjects had missing data for a variety of reasons, the number ofsubjects entered in the factor analysis was considerably less than the numberof subjects tested as part of the entire study. Table 4.2 presents a breakdownof the number of subjects entered into the factor analysis by group membershipand sex.
TABLE 4.2. NUMBER OF SUBJECTS IN THE FACTOR ANALYSIS CATEGORIZED BY GROUPAND SEX.
Boys Girls Uncategorized
Normal 209 336
Auditory Impaired 491 38S
Visually Impaired 244 167
Cerebral Palsy SS 42
Paraplegic Wheelchair - - 61
223

190
An attempt was made to interpret the extracted factors including theassignment of factor names; however, the reader is cautioned as to the subjectivenature of this task. To help identify, interpret, and label extracted factors,the time-duration classification schema presented by Edington and Edgerton (1976)pertaining to strength, power, and endurance was consulted and modified forthis study. In essence, test items characterized by.maximum or near maximumeffort of an activity and/or which were performed in zero to one second werelabeled as strength. A power label was applied to those factors in whichaverage performance was performed from one second to two minutes. The emergenceof three power items necessitated a further distinction. A power-speed labelwas applied to factors characterized by the predominance of movement for thepurpose of speed and moderate load involvement. A power-strength label wasapplied to a power factor in which the continued exertion of a relatively highload predominated. Since these power items were associated with a 30-secondinterval, they required near maximum contraction. A power-endurance labelwas applied to power factors performed within a 30-second to two-minuteinterval. These items were characterized by lighter load. In cases in whichthere was an overlapping of time duration, factors were designated in terms ofthe closest factor.
While this model was convenient for interpreting and classifying activitieswhich require muscular strength/endurance, it was not sufficient to interpretall Project UNIQUE test items. The skinfold measures and the sit and reachtest had no applicability to this model. The long distance run, althoughexpressed in terms of yards per minute, was not rated in terms of the modelbecause it was conceptualized and generally characterized as a submaximalcardiorespiratory endurance activity rather than a strength/endurance factor.Factors which included these variables, therefore, were interpreted exclusiveof this system. They were interpreted, instead, in terms of generally acceptednotions of body composition, flexibility, and cardiorespiratory endurance.
The cerebral palsied subjects included in the factor analysis had NASCPclassifications of VA or higher in order not to unduly restrict test itemsselected. Only ambulatory cerebral palsied subjects were, thus, entered intothe analysis. In view of small subject numbers and/or not to unduly restricttest items selected, only subjects categorized as paraplegic wheelchair of thespinal neuromuscular group were included in the factor analysis.
The factor loadings presented in the factor structure tables in thefollowing section have been rounded to two places, and the minus signs forspeed variables have been dropped.
When a negative factor loading appears in the tables, it is due to thefact that that variable is at the opposite end of the continuum when contrastedto the other variables which load on that factor.
Results of the Factor Analyses
Factor structures were obtained on both raw score and residual (agecontrolled) intercorrelation matrices. Both structures are presented for eachsubject group. For those structures obtained from the raw score matrices, noattempt was made to control for possible differences in factor structure dueto age. Extracting a factor structure from the residual matrices represented
224

191
an effort to statistically control the effects of age. Factor analyses onresidual correlation matrices have been reported previously in the physicaleducation literature (Jackson and Prankiewicz, 1975; Rarick and Dobbins, 197S).An advantage to controlling for age is that it partials out the effects of avariable which may be strongly related to fitness test performance, in general,and therefore may yield a more resolute factor structure. A disadvantage ofcontrolling for age is that the lesulting factor structure may be somewhatartificial because it was not based on the actual scores obtained by subjects.In the following discussion of factor structures, the structure obtained fromthe raw score intercorrelation matrix is presented first, and the structureobtained from the residual intercorrelation matrix is reported second foreach group ofsubjects.
Factor Structure of the Normal Girls
The resw-s of the factor analyses calculated from the raw score inter-correlatio, crix for the normal girls are presented in Table 4.3.
TABLE 4.3. FACTOR STRUCTURE OF PHYSICAL FITNESS TEST ITEMS (RAW SCORE MATRIX)FOR NORMAL GIRLS.
-------aihogonal Solutions Oblique SolutionsFactors PC RAO Al'ha PC RAO Al'ha
Factor 1Triceps Skinfold .88 .87 .90 .88 .88 .90
Abdominal Skinfold .88 .87 .88 .90 .90 .91
Subscapular Skinfold .84 .86 .83 .88 .88 .86
Factor 2Shuttle Run .73 .71 .74 .78 .77 .79
50-Yard Dash .72 .73 .72 .78 .78 .78
Broad Jump .57 .60 .55 .71 .- .72 .70
Sit-Ups .53 .S1 .54 .64 .63 .65
Mat Creep .4R .48 .47 .56 .S6 .56.
Factor 3Right Grip .93 .90 .93 .96 .94 .96
Left Grip .87 .89 .87 .92 .93 .92
Softball Distance .43 .43 .43 .50 .50 .50
Factor 4Trunk Raise .51 .53 .49 .57 .60 .56Sit and Reach .49 .47 .49 .S3 .51 .53
Leg Raise .46 .48 .53 .47 .55
Factor 5Arm Hang .66 .68 .67 .73 .75 .74
Pull-Ups .57 .57 .55 .59 .59 .S8
.-11.
225

192
Five factors - -four comparable common and one comparable specific--wereextracted from the raw score matrix for normal girls. Factor 1 is representedby the three skinfold measures and, therefore, appears to be a body compositionfactor. Factor 2 consists of muscular strength/endurance items which requirepower. Speed of movement and coordination appear to characterize performancein this factor. Factor 2 appears to be a power-speed factor. The grip strength.measures and the softball throw (distance) constitute Factor 3. Factor 3 ischaracterized by maximal, non-repetitive effort and, thus, seems to be pre-dominantly a strength factor. Factor 4 is characterized by low back and hipregion involvement of the body, flexibility, and a submaximal sustained effort.Factor 4 may have emerged because normal girls who did well on the two measuresof strength/endurance (especially trunk raise) did so because of greaterflexibility which allowed for greater mechanical advantage. Applying thislogic, Factor 4 might be considered a trunk/hip flexibility/power-endurancefactor. Factor 5 is a comparable specific factor characterized by the armhang and pull-up tests. Naming specific factors is especially hazardous, butarm/shoulder power-strength is offered as a tentative label. The five com-parable factors which were extracted from the raw score intercorrelation matrixfor normal girls accounted for 68.1 percent of the total variance of the 17test items.
The results of the factor analyses performed on the residual inter-correlation matrix for the normal girls are presented in Table 4.4.
TABLE 4.4. FACTOR STRUCTURE OF PHYSICAL FITNESS TEST ITEMS (RESIDUAL MATRIX)
FOR NORMAL GIRLS.
FactorsOrthogonal SolutionsPC RAO Alpha
Oblique SolutionsPC RAO Alpha
Factor 1Abdominal Skinfold .89 .88 .89 .91 .90 .92
Triceps Skinfold .89 .88 .89 .88 .87 .89
Subscapular Skinfold .84 .86 .82 .86 .89 .86
Factor 2Shuttle Run .74 .76 .40 .76 .78 .56
50 -Yard Dash .66 .71 - .72 .75 .48
Broad Jump .59 .61 - .69 .71 .47
Sit-Ups .59 .56 - .66 .65 .51
Long Distance Run .49 .44 - .55 .52 .51
(Yards per Minute)
Mat Creep .48 .48 - .56 .57 .43
Factor 3Right Grip .95 .91 .89 .97 .93 .88
Left Grip .85 .89 .81 .88 .92 .82
Softball Distance - - .42 .41 .43 .46
Mat Creep - - .45 .41 .43 .50
Factor 4Arm Hang .67 .63 .71 .74 .71 .74
Pull-Ups .56 .59 .46 .59 .61 .48
Sit-Ups .54 .50 .51 .63
Broad Jump .51 .46 .45 .61
22.

193
Four comparable common factors were extracted from the residual inter-correlation matrix. Factor 1 contains the three skinfold measures and,consequently, appears to be a body composition factor. Factor 2 appears to bea strength/endurance factor emphasizing a power-speed dimension. Factor 3 iscomprised of the grip strength measures, the softball throw, and the matcreep. Factor 3 appears to be a muscular strength/endurance factor in whichmaximum or near maximal effort predominates. Thus, Factor 3 is identifiedas a strength factor. Factor 4 consists of the flexed arm hang, pull-ups,sit-ups, and standing broad jump, and could be considered to be a power-strengthfactor with less emphasis on strength than Factor 3 and less emphasis on speedthan Factor 2. Thus, Factor 4 may be conceived as a power-strength factor.The four comparable common factors derived from the residual intercorrelationmatrix for normal girls accounted for 61.7 percent of the total variance ofthe 17 test items.
The factor structures obtained from the raw score and residual inter-correlation matrices for the normal girls appear similar but not identical.Factor 1 (body composition), Factor 2 (power-speed), and Factor 3 (strength)seem to be fairly consistent across the two structures. The existence of rawscore Factor 4 (trunk/hip flexibility/power-endurance) is not supported bythe residual structure. A factor containing the arm hang and pull-ups wouldseem to be supported as a power-strength factor, although it is not clearwhether it should be considered a comparable common or a comparable specificfactor for normal girls.
Factor Structure of the Normal Boys
The results of the factor analyses calculated on the raw score data forthe normal boys are presented in Table 4.S.
Three comparable common factors were extracted from the raw score inter-correlation matrix for normal boys. Factor 1 consists of the three skinfold
measures and the flexed arm hang variable. The arm hang variable has a negativeloading, indicating a negative relationship with the skinfolds. This wouldseem to support, at least for normal boys, the criticism that the arm hangtest is biased against participants with greater amounts of body fat.Factor 1 appears to be a body composition factor. Factor 2 is comprised of alarge number of items and might best be described as a general power factor,although the variables with the highest loadings are similar to the variablesthat load on Factor 2 for the normal girls and described as power-speed.Factor 3 is predominated by the grip strengths, although it should be notedthat in the alpha solutions, the grips loaded higher on Factor 2. The strengthlabel seems appropriate for Factor 3. The three comparable factors which wereextracted from the raw score intercorrelation matrix for normal boys accountedfor 64.0 percent of the total variance of the 17 test items.
The results of the factor analyses obtained on the residual intercorrela-tion matrix for normal boys are presented in Table 4.6.
Four factors--three comparable common and one comparable specific--wereextracted from the residual intercorrelation matrix for normal boys. Factor 1is predominated by the skinfold measures and appears to be a body compositionfactor. As with the raw score factor structure for normal boys, flexed arm
227

194
TABLE 4.5. FACTOR STRUCTURE OF PHYSICAL FITNESS TEST ITEMS (RAW SCORE MATRIX)FOR NO MAL BOYS.
FactorsOrthogonal SolutionsPC RAO Alpha
Oblique SolutionsPC RAO Alpha
Factor 1Abdominal Skinfold .91 .9V .92 .90 .88 .91
Subscapular Skinfold .86 .88 .87 .87 .87 .88
Triceps Skinfold .81 .83 .77 .83 .86 .79
Arm Hang -.45 -.46 -.42 -.51 -.53 -.49
Factor 2
Shuttle Run .70 .81 .78 .82 .87 .83Mat Creep .68 .71 .53 .71 .71 .58
SO-Yard Dash .65 .81 .89 .83 .90 .91
SitUps .64 .65 .60 .74 .71 .67
Softball Distance .48 .64 .77 .63 .71 .77
Long Distance Run .47 .50 .53 .62 .60 .60
(Yards per Minute)
PullUps .46 .49 .60 .64 .62 .66
Leg Raise .45 - - .49 .43 .41
Arm Hang .43 - . .56 .46 .46
Broad Jump .42 .63 .79 .64 .75 .80
Right Grip - .44 .82 .53 .63 .81
Left Grip - .43 .83 .52 .63 .82
Factor 3Left Grip .93 .87 .96 .97
Right Grip .91 .86 .95 .97
Broad Jump .65 .46 .74 .45
Softball Distance .59 .42 - .70 .65
Shuttle Run .48 - .65 .61 .46
Pull-Ups .44 .54 .52 .44
228

19S
TABLE 4.6. FACTOR STRUCTURE OF PHYSICAL FITNESS TEST ITEMS (RESIDUAL MATRIX)FOR NORMAL BOYS.
FactorsOrthogonal SolutionsPC RAO Alpha
Oblique SolutionsPC RAO Alpha
Factor 1Abdominal Skinfold .90 .87 .93 .92 .89 .93Subscapular Skinfold .83 .8S .83 .88 .89 .86Triceps Skinfold .81 .83 .79 .84 .86 .81
Arm Hang - - -.47 -.49 -.45 -.S6
Factor 2SO-Yard Dash .83 .80 .8S .87 .86 .89
Shuttle Run .76 .77 .7S .81 .82 .80Mat Creep .70 .70 .69 .72 .73 .71Sit-Ups .S6 .S6 .S6 .6S .6S .64
Softball Distance .51 .S2 .S3 .S4 .S4 .SS
Broad Jump .S1 .S0 .S0 .S7 .S7 .S7
Factor 3Left Grip .97 .91 1.00 1.00 .9S 1.02Right Grip .86 .90 .79 .90 .94 .83
Factor 4Sit-Ups .60 .48 - .4S .46 -
Arm Hang .S9 .73 .43 .68 .81 .S4
PullUps .41 .54 - .51 .64 -
229

196
hang loads at the opposite end of the continuum. Factor 2 is characterizedby speed, coordination, and strength and, thus, contains items which place apremium on power-speed. Factor 3 is a comparable specific factor consistingsolely of the grip strength measures and is labeled as a strength factor.The variables in Factor 4 seem to require a lesser degree of strength thanFactor 3 but greater strength and lesser speed than Factor 2. Thus, Factor 4might be appropriately labeled a power-strength factor. The four factorswhich emerge from the residual matrix account for 62.8 percent of the totalvariance of the 17 test items.
The factor structures obtained from the raw score and residual inter-correlation matrices for the normal boys appear to confirm the fact that, atleast for this group of subjects, age operated as a variable which contributedto the production of an artificially large general factor. The factor structureresolution from the residual matrix is much clearer than that obtained fromthe raw score matrix which appears to yield at least one exaggerated commonfactor (Factor 2). There remain, however, similarities between the twostructures. Factor 1 (body composition) is virtually identical for bothstructures. Although Factor 2 in the raw score structure is confused by theapparent generalizing affect of age, the variables which tend to have thehighest loadings are similar to the variables which constitute Factor 2 (power-speed) in the residual structure. The residual matrix appears to separatepower items emphasizing strength and speed. The grip strength measures appearto comprise a factor for normal boys, but it is unclear whether that factorshould be considered a comparable common or a comparable specific factor.Factor 4 (power-strength) was not supported by both structures. The variableswhich constitute Factor 4 may have been subsumed as part of the generalFactor 2 in the raw score factor structure.
Factor Structure of the Auditory Impaired Girls
The results of the factor analyses extracted for the raw score inter-correlation matrix for auditory impaired girls are presented in Table 4.7.
Five comparable common factors emerged from the raw score matrix ofthe auditory impaired girls. Factor 1 is comprised of the skinfold measuresand appears to be a body composition factor. Factor 2 consists of variablesexhibiting a speed/force/coordination relationship. It appears to be apower-speed factor. Factor 3 is comprised of variables which require a singlemaximal effort on behalf of the participant. Factor 3 seems to be a strengthfactor. The measures contained in Factor 4 all involve the action of thelow back and/or lower extremities. Since measures of power-endurance andflexibility load on Factor 4, the label of trunk/hip flexibility/power-endurance
seems logical. Factor S is more difficult to describe. However, since itconsists of the arm hang and pull-ups and emphasizes high load to a greaterextent than Factor 2, it is logically considered a power-strength factor.The fact that the long distance run appears may be due to the strength/endurancerelationship required by test items, i.e., the endurance element required inarm hang and the strength/power element required in the long distance run.Thus, Factor S might be labeled as power-strength factor. The five extractedfactors accounted for 70.9 percent of the total variance of the 17 test itemsfor auditory impaired girls.
230

4,
197
TABLE 4.7. FACTOR STRUCTURE OF PHYSICAL FITNESS TEST ITEMS (RAW SCORE MATRIX)FOR AUDITORY IMPAIRED GIRLS.
Orthogonal Solutions Oblique SolutionsFactors PC RAO Alpha PC RAO Alpha
Factor 1Abdominal Skinfold .87 .88 .87 .88 .89 .88
Subscapular Skinfold .86 .86 .86 .88 .88 .88
Triceps Skinfold .82 .82 .82 .82 .82 .82
Factor 2
Shuttle Run .82 .82 .81 .86 .86 .86
Mat Creep .77 .78 .76 .82 .83 .82
50 -Yard Dash .69 .69 .70 .79 .79 .79
Factor 3Right Grip .94 .94 .91 .95 .95 .92
Left Grip .91 .93 .88 .93 .9S .90
Softball Distance .58 .55 .62 .62 .59 .66
Broad Jump .49 .45 .52 .56 .53 .59
Factor 4Sit and Reach .55 .58 .52 .59 .61 .57
Sit-Ups .54 .55 .53 .67 .67 .66
Leg Raise .50 .4'. .52 .56 .S2 .58
Trunk Raise .47 .44 .49 .49 .46 .51
Broad Jump .43 .48 .58 .62 .54
Factor 5Arm Hang .79 .78 .79 .83 .83 .83Pull-Ups .59 .59 .57 .60 .61 .59
Long Distance Run .46 .45 .46 .52 .52 .52
(Yards per Minute)
23 i

d
198
The factor structure derived from the residual intercorrelation matrix ofthe auditory impaired girls is presented in Table 4.8.
TABLE 4.8. FACTOR STRUCTURE OF PHYSICAL FITNESS TEST ITEMS (RESIDUAL MATRIX)FOR AUDITORY IMPAIRED GIRLS.
FactorsOrthogonal SolutionsPC RAO Alpha
Oblique SolutionsPC RAO AI ha
Factor 1
Abdominal Skinfold .87 .87 .87 .88 .88 .88Subscapular Skinfold .85 .85 .85 .87 .88 .87
Triceps Skinfold .81 .81 .81 .81 .81 .82
Factor 2Shuttle Run .82 .82 .82 .85 .85 .85
Mat Creep .77 .77 .77 .82 .83 .82SO-Yard Dash .69 .68 .70 .78 .78 .79
Factor 3Right Grip .94 .94 .90 .95 .95 .91Left Grip .91 .93 .87 .92 .95 .89
Softball Distance .55 .51 .59 .58 .55 .61
Broad Jump .45 .41 .49 .51 .48 .55
Factor 4Sit and Reach .54 .55 .51 .57 .58 .55
Sit-Ups .54 .55 .52 .66 .67 .65Leg Raise .47 .44 .49 .S2 .49 .55Trunk Raise .46 .42 .48 .48 .45 .50
Broad Jump .42 .46 - .55 .58 .51
Factor 5Arm Hang .79 .78 .79 .83 .83 .83Pull-Ups .58 .59 .57 .60 .61 .59Long Distance Run .46 .45 .47 .53 .53 .53
Five comparable common factors were extracted from the residual inter-correlation matrix of the auditory impaired girls. Factor 1 contains thethree skinfold measures and may be considered a body composition factor.Factor 2 consists of variables which place a premium on speed of movemant,Factor 2 appears to be a power-speed factor. The items which compriseFactor 3 require a single maximal effort for successful execution and appearsto reflect a strength factor. Factor 4 consists of measures of power-endurance,as well as a measure of flexibility, which involves the lower trunk and/or hipregion. Trunk/hip flexibility/power-endurance would seem to be a logicallabel for Factor 4. Using the same logic as presented in connection with theraw score matrix, Factor 5 is tentatively labeled as a power-strength factor.The five factors derived from tht residual matrix for the auditory impairgirls accounted for 69.7 percent of the total variance of the 17 test items.
232

199
The factor structures obtained from the raw score and residual scoreintercorrelation matrix for the auditory impaired girls are virtually identical.Unlike the group of normal boys, which is apparently influenced by thegeneralizing effect of age, no such influence appears for the auditory impairedgirls. The existence of all five factors is supported by their presence onboth factor structures.
Factor Structure of the Auditory Impaired Boys
The results of the factor analyses obtained from the raw score matrix forauditory impaired boys is presented in Table 4.9.
TABLE 4.9. FACTOR STRUCTURE OF PHYSICAL FITNESS TEST ITEMS (RAW SCORE MATRIX)FOR AUDITORY IMPAIRED BOYS.
Orthogonal Solutions Oblique Solutions
JFactors PC RAO Alpha PC RAO Alpha
Factor 1Abdominal Skinfold .92 .91 .91 .92 .92 .91
Subscapular Skinfold .86 .87 .86 .37 .88 .87
Triceps Skinfold .82 .83 .81 .82 .83 .81
Factor 2Shuttle Run .83 .83 .81 .91 .91 .89
Mat Creep .80 .81 .80 .83 .83 .83
SO-Yard Dash .72 .73 .72 .8S .8S .84
Factor 3Right Grip .91 .90 .84 .94 .96 .87
Left Grip .87 .90 .79 .90 .9S .82
Broad Jump .68 .S9 .78 .79 .73 .85
Softball Distance .64 .56 .68 .71 .67 .74
50-Yard Dash .44 - .49 .60 .S7 .63
Pull-Ups .41 - .56 .51 .45 .61
Factor 4Arm Hang .68 .73 .S8 .72 .75 .65
Leg Raise .58 .54 .59 .61 .S7 .63
Sit-Ups .54 .52 .53 .63 .61 .62
Pull-Ups .46 .59 - .S6 .66 .41
Long Distance Run .44 .47 - .S2 54 .4S
(Yards per Minute)
Broad Jump - .50 - .S6 .65 .46
Four comparable common factors emerged from the raw score intercorrelationmatrix of the auditory impaired boys. Factor 1 is represented by the threeskinfold measures. Factor 1 appears to be a body composition factor. Factor 2consists of measures which place an emphasis on a force/time/coordinationdimension and might be terr:ed a power-speed factor. A strength factor appearsto dominate Factor 3. Factor 4 consists of a rather diverse group of variables
233

-
reflecting high power or strength and power-endurance factors. Due to thepredominance of the arm hang, this factor is viewed tentatively as a power-strength factor. The four factors extracted from the raw data matrix of theauditory impaired boys accounted for 67.4 percent of the total variance ofthe 17 test items.
The results of the factor analyses performed on the residual inter-correlation matrix for the auditory impaired boys is presented in Table 4.10.
200
TABLE 4.10. FACTOR STRUCTURE OF PHYSICAL FITNESS TEST ITEMS (RESIDUAL MATRIX)FOR AUDITORY IMPAIRED BOYS.
FactorsOrthogonal SolutionsPC RAO Alpha
Oblique SolutionsPC RAO Alpha
Factor 1Abdominal Skinclld .90 .90 .87 .92 .92 .89
Subscapular Skinfold .85 .86 .82 .88 .89 .85
Triceps Skinfold .84 .83 .8S .84 .83 .84
Factor 2Shuttle Run .85 .8S .84 .88 .88 .88
Mat Creep .79 .80 .79 .81 .82 .81
50-Yard Dash .79 .79 .80 .84 .83 .85
Factor 3Right Grip .93 .91 .86 .94 .93 .88Left Grip .85 .90 .77 .86 .91 .80
Softball Distance .43 - .50 .49 .45 .54
Broad Jump .42 - .49 .51 .47 .55
Factor 4Trunk Raise .61 .63 .54 .61 .63 .54
Sit-Ups .49 .4:: .54 .57 .55 .62
Leg Raise .43 .48 .49 .47 .53
Factor 5Pull-Ups .73 .74 .59 .77 .76 .66
Arm.flang .59 .62 .57 .67 .68 .66
Four comparable common and one comparable specific factor emerged fromthe residual intercorrelation matrix for the auditory impaired boys. Factor 1is characterized by the skinfold measures and appears to be a body compositionfactor. Factor 2 consists of three variables which are associated withpower-speed. Factor 3 is comprised of measures which require one short maximumeffort for successful execution. Factor 3 might be appropriately labeled astrength factor. Factor 4 contains three power-endurance variables whichinvolve the low trunk or hip areas. Factor 4 might be a trunk/hip power-endurance factor. Factor 5 is a comparable specific factor defined by thepull-ups and flexed arm hang tests. Although labeling a specific factor isespecially hazardous, Factor S might he tentatively viewed as an arm/shoulderpower-strength factor. The five factors extracted from the residual
234

201
intercorrelation matrix for the auditory impaired boys accounted for 67.9percent of the total variance of the 17 test items.
The residual intercorrelation matrix appears to yield a more resolutefactor structure than the raw score Aatrix for the auditory impaired boys.One additional factor emerged from the residual matrix. In essence, theresidual matrix separated power-strength factors from the power-endurancefactors found in the raw score matrix. The existence of the three remainingfactors (body composition, power-speed, and strength) is supported by virtueof their extraction from both matrices.
Factor Structure of the Visually Impaired Girls
The results of the factor analyses obtained on the raw score matrix forvisually impaired girls is presented in Table 4.11.
TABLE 4.11. FACTOR STRUCTURE OF PHYSICAL FITNESS TEST ITEMS (RAW SCOLEMATRIX) FOR VISUALLY IMPAIRED GIRLS.
FactorsOrthogonal SolutionsPC RAO Alpha
Oblique SolutionsPC RAO Alpha
Factor 1Abdominal Skinfold .88 .88 .87 .89 .90 .89
Subscapular Skinfold .87 .87 .86 _88 .88 .88 '
Triceps Skinfold .86 .86 .86 .87 .87 .86
Factor 250-Yard Dash .77 .78 .76 .81 .83 . .80
Broad Jump .!3 .73 .71 .79 .80 .78
Softball Distance .62 .6/ .57 .64 .69 .60Shuttle Run .55 .53 .56 .S4 .S2 .S5
Mat Creep .S4 .54 .S2 .58 .60 .S7Long Distance Run .S0 .46 .53 .53 .50 .SS
(Yards per Minute)Sit-Ups .48 .46 .48 .53 .S2 .S3
Factor 3Right Grip .85 .84 .82 .94 .94 .91
Left Grip .84 .84 .84 .93 .94 .f:2
Broad Jump .42 .60 .S9 .63
Factor 4Leg Raise .70 .63 .72 .72 .65 .74
Trunk Raise .62 .67 .64 .6S .69 .67Sit and Reach .47 .44 .47 .S2 .49 .52
Factor 5Pull-Ups .79 .79 .7S .80 .80 .76Arm Hang .40 .50 .S1 .SC
235

202
Five factors--four comparable common and one comparable specific--emergedfrom the raw score intercorrelation matrix of the visually impaired girls.Factor 1 consists of the three skinfold measures and appears to be a bodycomposition factor. Factor 2 is characterized by items which possess aforce/time/coordination dimension and might be appropriately labeled apower-speed factor. Factor 3 contains the grip strength measures and thestanding broad jump test. It appears to be a strength factor. Factor 4 con-sists of two power-endurance items and one flexibility item which involvethe lower back and/or hip region. Factor 4 might be considered a trunk/hipflexibility/power-endurance factor. Factor S is a comparable specific factordefined by the pull-ups and flexed arm hang test items. Factor S is tentativelylabeled a power-strength factor. The five factors extracted from the rawdata matrix of the visually impaired girls accounted for 70.0 percent of thetotal variance of the 17 test items.
The results of the factor analyses performed on the residual inter-correlation matrix of the visually impaired girls is presented in Table 4.12.
TABLE 4.12. FACTOR STRUCTURE OF PHYSICAL FITNESS TEST ITEMS (RESIDUAL MATRIX)FOR VISUALLY IMPAIRED GIRLS.
Factors
Orthogonal SolutionsPC kW Alpha
Oblique SolutionsPC RAO Alpha
Factor 1
Abdominal Skinfold .88 .88 .87 .89 .89 .88
Subscapular Skinfold .87 .88 .87 .89 .89 .89Triceps Skinfold .86 .86 .86 .86 .87 .86
Facor 2SO-Yard Dash .77 .77 .7S .80 .81 .79
Broad Jump .72 .72 .70 .78 .78 .76
Softball Distance .60 .64 .56 .62 .6S .S8
Mat Creep .S8 .60 .S6 .63 .6S .61
Long Distance Run .S3 .S0 .SS .S6 .S3 .S7
(Yards per Minute)Shuttle Run .S2 .S0 .S4 .51 .49 .S3
Sit-Ups .47 .4S .47 .51 I) .SO .S0
Factor 3Right Grip .90 .87 .84 .96 .93 .90
Left Grip .84 .86 .8S .91 .93 .92
Factor 4Leg Raise .69 .62 .70 .70 .63 .72
Trunk Raise .61 .6S .64 .63 .66 .66
Sit and Reach
Factor SPulI -Ups .80 .79 .74 .82 .81 .76Arm Mang .40 .43 .SO .51 .53
236

203
Three comparable common factors and two comparable specific factors wereextracted from the residual intercorrelation matrix for visually impairedgirls. Factor 1 contains the three skinfold items and appears to be a bodycomposition factor. Factor 2 consists of a number of variables which arecharacterized by speed and appears to be a power-speed factor. Factor 3 isa comparable specific factor defined by the two grip strength measures.Factor 3 might be considered a strength factor, Jthough as mentioned previously,naming comparable specific factors is an especially hazardous undertaking.Factor 4 is characterized by two power-endurance items and one flexibilityitem which involve the low back and/or hip regions of the body. Factor 4appears to be a trunk/hip flexibility/power-endurance factor. Factor S is acomparable specific factor which consists of pull-ups and flexed arm hangmeasures. It is tentatively labeled an arm/shoulder power-strength factor.The five factors extracted from the residual intercorrelation matrix for thevisually impaired girls accounted for 69.3 percent of the total variance ofthe 17 test items.
The factor structures obtained from the raw score intercorrelationmatrix and the residual intercorrelation matrix for the visually impairedgirls appear to be quite similar. In fact, the only major distinction appearsto be that the standing broad jump test loads on Factor 3 for the raw scorefactor matrix, but does not appear with Factor 3 for the residual intercorrela-tion matrix factor structure. The result is that Factor 3 for the raw scorefactor structure is considered to be a comparable common factor, while Factor 3for the residual matrix factor structure is interpreted as a comparable specificfactor. The existence of the remaining factors is supported by their extractionfrom both matrices.
Factor Structure of the Visually Impaired Boys
The results of the factor analyses performed on the raw score matrix forvisually impaired boys is presented in Table 4.13.
Four comparable common factors emerged from the raw score intercorrelationmatrix of the visually impaired boys. Factor I appears to be a body compositionfactor, as it contains the three skinfold measures. With the exception ofthe grip strength measures, Factor 2 is predominated by items which placea premium on a fo-ce/speed/coordination relationship and, thus, mightbe considered a power-speed factor. factor 3 is defined by the grip strengthmeasures and the pull-up test. Factor 3 appears to be an upper limb strengthfactor. Variables predominating in Factor 4 appear to emphasize the exertionof maximal or near maximal effort in a relatively short time period. Factor 4
appears to be a power-strength factor. The four factors extracted from theraw data matrix of the visually impaired boys accounted for 66.4 percent ofthe total variance of the 17 test items.
The results of the factor analyses performed on the residual intercorrela-tion matrix for the visually impaired boys in presented in Table 4..14.
Three comparable common factors and one comparable specific factor emergedfrom the residual intercorrelation matrix of the visually impaired boys.Factor 1 consists of the three skinfold measures and appears to be a bodycomposition factor. Factor 2 is characterized by time/speed/coordination and
237

TABLE 4.13. FACTOR STRUCTURE OF PHYSICAL FITNESS TESTMATRIX) FOR VISUALLY IMPAIRED BOYS.
Ort.hogonal
204
ITEMS (RAW SCORE
Oblique SolutionsSolutionsPC RAO AlphaFactors PC RAO Alpha
Factor 1
Abdominal SkinfoldSubscapular SkinfoldTriceps Skinfold
Factor 250-Yard DashBroad JumpSoftball DistanceMat CreepLong Distance Run(Yards per Minute)
Shuttle RunRight GripLeft Grip
Factor 3Left Grip
Right GripPull-Ups
Factor 4Pull-Ups
Arm HangSit-UpsLong Distance Run(Yards per Minute)
Leg Raise
.96 .94
.89 .92
.83 .83
.73 .72
.69 .71
.64 .67
.58 .60
.55 .55
.49 .48
.85
.82
.95
.89
.83
.77
.72
.66
.54
.55
.51
.44
.44
.83 .76
.84 .74
.57
.65 .74 .42
.57 .66 .42
.56 .49 .46
.54 .49 .41
.50 .42 .55
.96
.90
.86
.79
.84
.73
.62
.69
.51
.56
.56
.95
.93
.43
.73
.64
.66
.68
.95
.92
.85
.78
.85
.75
.63
.68
.51
.55
.55
.96
.96
.41
.94
.89
.84
.82
.85
.73
.59
.68
.52
.60
.61
.86
.84
.65
.81 .56
.72 .53
.62 .59
.65 .57
.52 .45 .58
238

205
TABLE 4.14. FACTOR STRUCTURE OF PHYSICAL FITNESS TEST ITEMS (RESIDUAL MATRIX)
FOR VISUALLY IMPAIRED BOYS.
FactorsOrthogonal SolutionsPC RAO Alpha
Oblique SolutionsPC RAO Alpha
Factor 1
Abdominal Skinfold .95 .93 .93 .94 .95 .93
Subscapular Skinfold .89 .91 .87 .90 .92 .88
Triceps Skinfold .84 .84 .85 .87 .87 .86
Factor 250-Yard Dash .71 .69 .74 .75 .73 .77
Broad Jump .69 .70 .69 .80 .81 .81
Softball Distance .63 .65 .61 .67 .69 .66
Mat Creep .62 .64 .59 .67 .68 .65 .
Long Distance Run .53 .53 .54 .66 .65 .65
(Yards per Minute)
Shuttle Run .46 .45 .46 .46 .45 .46
Factor 3Left Grip .91 .88 .84 .97 .94 .89
Right Grip .84 .88 .79 .90 .94 .85
Factor 4Pull-Ups .64 .73 .44 .70 .78 .54
Arm Hang .56 .65 .43 .62 .70 .51
Sit-Ups .54 .47 .45 .62 .59 .56
Lcng Distance Run .52 .46 .41 .64 .61 .55
(Yards per Minute)Leg Raise .47 - .55 .47 - .55
239

,.206
could be considered to be a power-speed factor. Factor 3 is a comparablespecific factor defined by the two grip strength measures. It might betentatively labeled as a strength factor. Factors predominating in Factor 4appear to require near maximum force in a relatively short time period. Thelogical label for Factor 4 might be power-strength factor. The four factorsextracted from the residual intercorrelation matrix for the visually impairedboys accounted for 63.6 percent of the total variance of the 17 test items.
The factor structures obtained from the raw score intercorrelation matrixand the residual intercorrelation matrix for the visually impaired boys appearto be quite similar, although the residual matrix structure may be slightlymore resolute. Factor 1 (body composition), Factor 2 (power-speed), andFactor 4 (power-strength) would appear to be supported for the visually impairedboys by virtue of their emergence on both factor structures. The existenceof a factor containing the grip strength measures would also seem to besupported, although it is unclear whether that factor should be considered acomparable common factor or a comparable specific factor.
Factor Structure of the Cerebral Palsied Girls
The results of the factor analyses obtained on the raw score matrix forcerebral palsied girls is presented in Table 4.15.
TABLE 4.15. FACTOR STRUCTURE OF PHYSICAL FITNESS TEST ITEMS (RAW SCORE MATRIX)FOR CEREBRAL PALSIED GIRLS.
Factors
Ort ogonal SolutionsPC R40 Alpha
Oblique SolutionsPC RAO Alpha
Factor 1Subscapular Skinfold .91 .86 .93 .92 .86 .94
Triceps Skinfold .91 .93 .90 .91 .93 .90Abdominal Skinfold .89 .91 .89 .91 .92 .90
Mat Creep -.47 -.46 -.46 -.51 -.47 -.50
Factor 2Shuttle Run .92 .85 .90 .98 .90 .96
Mat Creep .55 .61 .52 .61 .66 .5850 -Yard Dash .53 .S2 .60 .56 .54 .62
Factor 3Right Grip .89 .83 1.00 .91 .85 1.02Left Grip .85 .92 .75 .86 .92 .76
Factor 4Pull-Ups .73 - .73 .73 .73Softball Distance .64 - .65 .69 - .69Arm Hang .54 - .55 .59 - .58
Factor 5Long Distance Run .93 .82 .96 .95 .85 .99(Yards per Minute)
Sit-Ups .56 .65 .52 .61 .67 .58
240

207
Three comparable common factors and two comparable specific factorswere extracted from the raw score matrix for cerebral palsied girls. Factor 1
consists of the three skinfold measures and the mat creep item. As indicated
by the negative loading, cerebral palsied girls with large skinfolds hadgreater difficulty with the mat creep test. Factor 1 appears to be a body
composition factor. Factor 2 consists of three measures which place a premium
on the exertion of submaximal force in time. However, unlike previously
discusse- groups, scores on the shuttle run and dashes exceed 30 seconds.Thus, Factor 2 appears to be a power-endurance factor. Factor 3 is a comparable
specific factor defined by the grip strength measures. Factor 3 might be
tentatively labeled a strength factor. Factor 4 is comprised of three variableswhich involve the arm and shoulder musculature and which are characterized bythe exertion of maximal or near maximal effort in a relatively short timeperiod. Factor 4 appears to be an arm/shoulder power-strength factor.Factor 5 is a comparable specific factor consisting of the long distance runand the sit-ups. In view of its sustaining Characteristics, Factor 5 mightbe tentatively labeled a power-endurance factor. It is distinguished fromFactor 2 in that more emphasis on endurance is placed on Factor 5. The five
factors extracted from the raw score matrix for cerebral palsied girls accounted
for 77.2 percent of the total variance of the 14 test items.
The results of the factor analyses performed on the residual inter-correlation matrix for the cerebral palsied girls is presented in Table 4.16.
TABLE 4.16. FACTOR STRUCTURE OF PHYSICAL FITNESS TEST ITEMS (RESIDUAL MATRIX)FOR CEREBRAL PALSIED GIRLS.
Factors
Orthogonal SolutionsPC RAO Alpha
Oblique SolutionsPC RAO Alpha
Factor 1Triceps Skinfold .94 .94 .93 .92 .92 .91
Abdominal Skinfold .92 .93 .91 .92 .93 .91
Subscapular Skinfold .88 .87 .90 .89 .88 .90
Mat Creep -.54 -.52 -.54 -.59 -.57 -.58
Shuttle Run -.40 -.44 -.49 -.48 -.52
Factor 2Long Distance Run .72 .74 .76 .73 .77 .76
(Yards p'er Minute)
SO-Yard Dash .68 .64 .70 .68 .62 .70
Shuttle Run .63 .56 .63 .68 .60 .69Sit-Ups .56 .61 .53 .57 .63 .55
Factor 3Right Grip .82 .78 .93 .84 .79 .95
Left Grip .74 .77 .66 .72 ./9 .67
Factor 4Pull-Ups .75 .61 .77 .74 .61 .76
Softball Distance .69 .80 .66 .73 .84 .70Arm Hang .49 .51 .55 .47 .57
241
A

00-
208
The residual intercorrelation matrix yielded three comparable commonfactors and one comparable specific factor for the cerebral palsied girls.Factor 1 is comprised of the three skinfold measures, mat creep, and shuttlerun test items. Factor I might be considered to be a body composition factorwhich has a negative effect on certain speed items of cerebral palsied girls.Factor 2 is comprised of items which were labeled as power-endurance factorsin the raw score matrix. It is possible that these test its are combinedbecause the scores of cerebral palsied girls are lower in dash and shuttle runtest items which move performance toward a power-endurance factor. Factor 2,thus, may be labeled a power-endurance factor. Factor 3 is a comparablespecific factor comprised of the two grip strength measures. It might tenta-tively be labeled a strength factor. Factor 4 contains three variables whichall involve the musculature of the arms and shoulders. Factor 4 appears tobe an arm/shoulder power-strength factor. The factors extracted from theresidual intercorrelation matrix of the cerebral palsied girls accounted for70.6 percent of the total variance of the 14 test items.
The factor structure derived from the residual intercorrelation matrixfor the cerebral palsied girls did not necessarily yield a more resolutefactor strudfurethan that derived from the raw score intercorrelation matrix.Each solution yielded three comparable common factors. The existence ofFactor 1 (body composition), ractor 2 (power-endurance), and Factor 4 (arm/shoulder power-strength) would seem to be supported for the cerebral palsiedgirls. The power-speed factor, which is characteristic of preceeding groups,appears to be replaced by a power- endurance factor An the cerebral palsiedgirls groups because of the lower performance scores obtained by cerebralpalsied girls on the dash and shuttle run. Furthermore, a comparable specificfactor, defined by the grip strengths and labeled as a strength factor, wouldalso seem to be confirmed.
Factor Structure for the Cerebral Palsied Boys
The results of the factor analyses ooained from the raw score matrix forcerebral palsied boys is presented in Table 4.17.
Three comparable commor dnd one comparable specific factor emerged fromfile raw score intercorrelation matrix of the cerebral palsied boys. Factor 1consists of the three skinfold measures and is clearly a body compositionfactor. Factor 2 is comprised of variables which place a premium on a force/time/coordination dimension. Since average performance on the dash and shuttleapproaches or exceeds 30 seconds, Factor 2 might be termed a power-endurance
factor. Factor 3 is defined by variables which involve force and power.Factor 3 appears to be an upper limb power-strength factor. Factor 4 is acomparable specific factor which consists solely of the leg raise item. Noattempt will be made to attach a label to Factor 4. The three comparablecommon factors and one comparable specific factor extracted from the raw scoreintercorrelation matrix of the cerebral palsied boys accounted for 72.6 percentof the total variance of the 14 test items.
The results of the factor analyses performed on the residual intercorrela-tion matrix of the cerebral palsied boys Is presented in Table 4.18.
The factor structure obtained from the residual intercorrelation matrixfor thy cerebral palsied boys consist: of three comparable common factors and
242

209
TABLE 4.17. FACTOR STRUCTURE OF PHYSICAL FITNESS TEST ITEMS (RAW SCORE MATRIX)FOR CEREBRAL PALSIED BOYS.
FactorsOrthogonal SolutionsPC RAO Alpha
Oblique SolutionsPC RAO Alpha
Factor 1Triceps Skinfold .90 .89 .85 .90 .89 .86
Abdominal Skinfold .88 .89 .88 .89 .90 .89
Subscapular Skinfold .83 .83 .84 .82 .83 .84
Factor 250-Yard Dash .89 .90 .90 .91 .91 .91
Shuttle Run .84 .86 .84 .84 .85 .84
Long Distance Run .78 .75 .80 .78 .75 .81
(Yards per Minute)
Mat Creep .60 .62 .58 .60 .62 .59
Softball Distance .58 .60 .57 .59 .61 .58
Sit-Ups .56 .55 .57 .56 .55 .56
Factor 3Pull-Ups .90 .89 .81 .91 .90 .82
Arm Hang .78 .86 .73 .79 .87 .14
Left Grip .71 .54 .78 .71 .b9 .78
Right Grip .60 .43 ..63 .60 .49 .62
Factor 4Leg_Raise .40 - .74 .41 .76
TABLE 4.18. FACTOR STRUCTURE OF PHYSICAL FITNESS TEST ITEMS (RESIDUAL MATRIX)FOR CEREBRAL PALSIED BOYS.
FactorsOrthogonalPC
SolutionsRAO Alpha
Oblique SolutionsPC RAO Al ha
Factor 1Triceps Skinfold .96 .94 .93 .96 .94 .94Abdominal Skinfold .87 .88 .86 .88 .90 .87Subscapular Skinfold .84 .84 .84 .84 .84 .83
Factor 250-Yard Dash .90 .90 .90 .91 .91 .90Shuttle Run .82 .84 .83 .83 .84 .83Long Distance Run .19 .76 .83 .80 .77 .83(Yards per Minute)
Softball Distance .67 .68 .65 .67 .68 .65Mat Creep .58 .58 .58 .60 .60 .60Sit-Ups .57 .57 .56 .56 .56 .55
Factor 3Pull-Ups .87 .8S .83 .88 .85 .84Arm Hang .77 .82 .69 .78 .83 .70Left Grip .49 .46 .58 .49 .46 .58
Factor 4Leg Raise .73 .71 .76 .74 .72 .77
243

210
one comparable specific factor. The three skinfold measures comprise Factor 1.Factor 1 appears to be a body composition factor. Factor 2 is defined byvariables which are dependent upon time and/or explosive coordinated movementfor their successful completion. In view of raw scores, Factor 2 seems to bea power-endurance factor. Factor 3 consists of items which involve the muscula-ture of the hands and arms. Consequently, an upper limb strength/power-strengthlabel seems appropriate. Factor 4 is represented solely b the timed legraise test item; no attempt will be made to name this factor. The threecomparable common and one comparable specific factors that define the factorstructure derived from the residual intercorrelation matrix for cerebral palsiedboys accounted for 70.1 percent of the total variance of the 14 test items.
The factor structures obtained for the cerebral palsied boys appear tobe very similar. The major difference between the factor structure derivedfrom the raw score matrix, when compared to the structure derived from theresidual matrix, is that the right hand grip strength measure failed to loadon Factor 3 in the residual matrix factor structure. The existence of thethree comparable common factors (body composition, power-endurance, and upperlimb strength/power-strength) and one comparable specific factor would seemto be supported for cerebral palsied boys.
Factor Structure of the Paraplegic WheelchairSpinal Neuromuscular Participants
Due to the relatively low number of paraplegic wheelchair participantstested for this study, males and females were combined for the factor analyses.The results of the factor analyses extracted from the raw score matrix forparaplegic wheelchair participants is presented in Table 4.19.
TABLE 4.19. FACTOR STRUCTURE CF PHYSICAL FITNESS TEST ITEMS (RAW SCORE MATRIX)FOR PARAPLEGIC WHEELCHAIR SPINAL NEUROMUSCULAR PARTICIPANTS.
FactorsOrthogonal SolutionsPC RAO Alpha
Oblique SolutionsPC RAO Alpha
Factor 1
Subscapular Skinfold .88 .87 .90 .88 .88 .90
Triceps Skinfold .82 .86 .78 .81 .86 .77
Abdominal Skinfold .77 .77 .77 .77 .77 .77
Factor 2
Shuttle Run .84 .87 .83 .87 .90 .86
50-Yard Dash .82 ,79 .82 .82 .80 .81
Long Distance Run .66 .66 .67 .72 .72 .72
(Yards per Minute)
Factor 3Left Grip .80 .89 .70 .82 .92 .73
Right Grip .79 .90 .69 .81 .92 .71
Softball Distance .61 .54 .60 .66 .61 .65
Arm Hang .58 .40 .66 .61 .45 .68
Pull-Ups .52 - .58 .52 - .58
244

211
Three comparable common factors emerged from the raw score intercorrela-tion matrix of the paraplegic wheelchair participants. Factor 1 appearsto be a body composition factor, as it is comprised by the three skinfoldmeasures. Factor 2 consists of three variables which place an emphasis on atime/force dimension. Since wheelchair participants straddle 30 seconds intheir performance on the dash and shuttle run, Factor 2 might be labeled apower-speed or power-endurance item. For consistency with other groups, thiswill be labeled as a power-speed factor. Factor 3 consists of variables whichrequire strength. Factor 3 appears to be an upper limb strength factor. Thethree comparable common factors extracted from the raw score intercorrelationmatrix for the paraplegic wheelchair participants accounted for 72.8 percentof the total variance of the 11 test items.
Tte results of the factor analyses obtained from the residual inter-correlation matrix of the paraplegic wheelchair participants is presented inTable 4.20.
TABLE 4.20. FACTOR STRUCTURE OF PHYSICAL FITNESS TEST ITEMS (RESIDUAL MATRIX)FOR PARAPLEGIC WHEELCHAIR SPINAL NEUROMUSCULAR PARTICIPANTS.
FactorsOrthogouts1 SolutionsPC RAO Alpha
ObliquePC
SolutionsRAO Alpha
Factor 1Subscapular Skinfold .89 .88 .90 .89 .88 .90
Triceps Skinfold .80 .83 ,79 .80 .83 .79
Abdominal Skinfold .76 .75 .76 .75 .15 .75
Factor 2Shuttle Run .83 .83 .84 .88 .88 .87
50-Yard Dash .83 .82 .81 .82 .83 .80
Long Distance Run .65 .64 .67 .71 .70 .72
(Yards per Minute)
Factor 3Right Grip .83 .90 ,75 .87 .93 .81
Left Grip .79 .88 .72 .84 .91 .73
Arm Hang .65 .53 .71 .66 .SS .72
Softball Distance .63 .61 .60 .68 .66 .66
Pull-Ups .53 .43 .57 .53 .43 .57
Three comparable common factors emerged from the residual intercorrelationmatrix for he paraplegic wheelchair participants. Factor 1 is defined by thethree skinfold measures and appears to be a body composition factor. Factor 2
consists of variables which are dependent upon time and wheelchair propulsion.Factor 2 appears to be a power-speed factor. Factor 3 is comprised of variableswhich predominantly involve the musculature of the upper limbs. Factor 3 mightbe labeled an upper limb strength factor. The three comparable common factorsextracted from the residual intercorrelation matrix of the paraplegic wheel-chair ,,articipants accounted for 73.7 percent of the total variance of the11 test items.
245

212
The factor structures obtained from the raw score intercorrelation matriand the residual intercorrelation matrix were very similar. Age did notappear to have a generalizing effect upon this group of subjects. The existenceof the three factors which emerged on each solution would seem to be supported.In the case of wheelchair participants, three, rather than four, :!actorsemerged. This was due to the combining of power - strength items such as thearm hang and pull-up merging with grip strength items. Since the grip itemswere more predominant, the factor was identified as a strength factor.
The factors of body composition and power-endurance, although perhapsless resolute, were both extracted for cerebral palsied subjects. The power-speed factor, which was characteristic of the normal, auditory, end visualgroups, appeared as a power-endurance factor since the scores of cerebralpalsied subjects were relatively larger on dash and shuttle run items. Cerebralpalsied boys exhibited a strength/power-strength factor, whereas cerebralpalsied girls exhibited separate factors for strength and power-strength,
Body composition, power-endurance, and strength/power-strength emergedas factors for paraplegic wheelchair participants. This corresponded to tilefactor structure exhibited by cerebral palsied boys.
muary
Although not tested statistically for similarities, it can be reported,with some degree of confidence, that the factor structures of the subjectgroups exhibited similar (but certainly not identical) patterns. Some dif-ferences between factor structures derived from the raw score and residualintercorrelation matrices were observed. The extent of these differencesvaried from group to group.
The most roln.st factors extracted were those labeled body composition.
Regardless of the subject group or intercorrelation matrix analyzed, the bodycomposition factor emerged.
For the normal, auditory impaired, and visually impaired groups, supportwas also found for factors of strength, power-speed, an power-strength.Normal and visually impaired girls exhibited five extractei factors while the
'boys from these groups had only four. This was apparently due 1:o partitioningpower-strength into a factor containing power-strength (flexed arm hang andpull-ups), and another consisting primarily of trunk/hip flexibility power-endurance (sit and reach, trunk raise, and leg raise). The partitioning mayhave been due, in part, to the suppiosition that flexibility (as measured bythe sit and reach) was related to the power-endurance measures (especiallytrunk raise) in that it provided the flexible performer a mechanical advantageon the endurance task which was unavailable to those less,flexible.
In summary, factors of body composition, strength, power-strength, power-speed, and power-endurance appear to hest reflect the factor structure of thegroups and test items considered. In the case of cerebral palsied boys andwheelchair spinal neuromuscular participants, the strength and power-strength "
factors were combined to form a combined factor. 73 power -speed factoremerging for normal, auditory impaired, and visually impaired groups emerged
246
I
213
for the cerebral palsied and wheelchair spinal neuromuscular groups. However,the factor was identified as power-endurance in the latter groups becausemean performance straddled or exceeded 30 seconds. The only other power-endureTice factor which emerged without flexibility as an influencl was foundfor the sample of auditory impaired boys. A hip/trunk flexibility/power-endurance emerged in either the raw score or residual matrices for normalgirls, auditory impaired girls, and visually impaired girls. Finally, theleg raise appeared as a specific factor for cerebral palsied boys. No attemptwas made to label this factor.
The hypothesized factor structure, as reported in Chapter 1, was amendedon the basis of the factor analysis. The body composition factor was theonly factor maintained as an intact factor. The items which comprised thehypothesized muscular strength/endurance factor were partitioned into factorsof strength, power-speed, power-strength, or power-endurance in the factoranalysis. The hypothesized speed and agility factors were merged to define apower-speed or power-endurance factor.
.Separate factors of flexibility and cardiorespiratory endurance did notclearly emerge from the factor analysis. This could be due to the fact thatonly one test item was used to define each of these factors. With no otheritems hypothetically related to these constructs, it became especially difficultto extract these factors from the data. The fact that flexibility and cardio-respiratory endurance did not clearly emerge, therefore, was due, to a largeextent, to the absence of other items which may have lilped to better definethese constructs. The items which comprised the flexibility (sit and reach)and cardiorespiraory (long distance run) hypothesized factors loaded on otherfactors. The sit and reach test emerged for normal, auditory, and visuallyimpaired girls on a factor which included the trunk raise and leg raise. It wassuggested, however, that the emergence of this factor was due to the flexibility
component.
The long distance run item loaded either on the power-speed or power-strength factors. In addition to the cardiorespiratory demands of the task,the long distance run makes demands on the muscular system as well. This isapparently a reason why the long distance run loaded on power-related factors,particularly in the absence of other cardiorespiratory items in the design.
In view of test item selection, the flexibility and cardiorespiratorycomponents were not supported or unsupported by the physical fitness factoranalysis conducted in this study. Thus, they can be maintained and justifiedon the basis of past research and logic.
; =
CHAPTER V
SYNTHESIS, SUMMARY, AN!) IMPLICATIONS
Introduction
This chapter primarily presents a synthesis and summary of the results
of the study and applies the results of the study to the development of a
valid and reliable test of physical fitness and to an identification of
other curricular implications pertaining to the physical fitness abilities
of orthopedically and sensory impaired children and youth.
In originally
designing the study, seven objectives were delineated.
These seven objectives
appear in Chapter I and serve as the basic underlying structure for the material
presented in this chapter.
Essentially, the chapter begins with an analysis
of physical fitness performance as a function of group/condition.
From this
beginning, age trends pertaining to the physical fitness development of normal,
orthopedically, and sensory impaired boys and girls are analyzed, identified, and
compared.
The third part of the chapter summarizes and presents
an analysis of
sex influences on the physical fitness of normal, orthopedically impaired, and
sensory impaired boys and girls.
The next section summarizes an analysis
of physical fitness in terms of associated factors includinj physical education
experiences, geographical location, community size, and educational environment.
The fifth part of the chapter identifies and compares the factor structure of
physical fitness abilities of normal, orthopedically impaired, and sensory
impaired boys and girls.
The results of factor analysis leads to the next
section of the chapter in which a physical fitness test based on the factor
structure is proposed for normal, sensory impaired, and orthopedically impaired
children and youth.
The last part of the chaptei identifies additional
curricular implications pertaining tc physical fitness on the basis of the
results of this study.
the
Normal, Orthopedically, and Sensory Impaired Boys and Girls
Physical Fitness Performance and Handicapping Condition
In comparing the performance of normal subjects with auditory impaired
subjects, it was found that the performance of normal subjects was never
exceeded significantly by the performance of the auditory impaired group
(skinfolds excluded).
It was also found that for a number of test items, no
significant differences were found between normal and auditory impaired subjects.
These items included the standing broad jump, the 50-yard dash, mat creep, right
and left grip strength, long distance run, pull-ups, triceps skinfold (boys),
sit and reach (boys), and softball throw (girls).
Significant differences
were found at one age or more for abdominal skinfold, subscapular skinfold,
sit-ups, leg raise, trunk raise, shuttle run, arm hang, triceps skinfold
(girls), sit and reach (girls), and softball throw for distance (boys).
While
significant differences between normal and auditory impaired subjects were found,
the magnitude of difference between normal and auditory impaired subjects, in no
test item, exceeded one standard deviation.
In fact, most standard deviation
scale units between these groups (lid not exceed 0.25.
Individuals with auditory
impairments were found to exceed tae median performance of normal subjects to
a
214
248

215
relatively (compared to other groups) great extent. Thus, the performancestandards attained by normal subjects are well within the reach of subjects withauditory impairments.
In comparing the performance of normal subjects and subjects with visualimpairments, it was also found that the performance of normal subjects wasnever exceeded by the performance of the visually impaired group (skinfoldsexcluded). The number of test items on which significant differences werefound between normal and visually impaired subjects was greater than thatfound between normal and auditory impaired subjects. Specifically, no signi-ficant differences were found between normal and visually impaired subjects onpull-ups, triceps skinfold (boys), and sit and reach (boys). Significantdifferences between normal and visually impaired subjects were found at oneage or more for abdominal skinfold and subscapular skinfold (visually impairedhad larger skinfolds), sit-ups, leg raise, trunk raise, mat creep, shuttlerun, right and left grip strength, flexed arm hang, SO-yard dash, softballthrow for distance, standing broad jump, long distance run, triceps skinfold(girls), and sit and reach (girls).
The largest differences between normal and visually impaired subjectstended to occur in softball distance and those items involving moving to avisual target in the fastest possible time. Although individuals with visualimpairments were at an obvious disadvantage in running with a partner orguide wire, analysis of data indicated that below normal performance could notbe attributed solely to differences in ambulation, i.e., there appear to bereal differences in physical fitness. The magnitude of differences betweennormal boys and those with visual impairments is least in items pertaining toflexibility, certain items involving muscular strength/endurance, and skinfoldmeasurements. In regard to girls; the magnitude of differences between normalgirls and visually impaired girls I's smallest in pull-ups. This could beattributed to the fact that neither group performed well on this test item.Results pertaining to coefficient of variation indicate that individuals withvisual impairments appear to be more variable in their performance than normalsubjects. Although many individuals with visual impairments exceed medianperformance values of normal subjects, individuals with visual impairments, asa group, do not exceed the median performance values of normal subjects to asgreat an extent as do indivii.aals with auditory impairments. Skinfold measure-ments, grip strength, and sit and reach are the areas in which male individualswith visual impairments compare most favorably with normal boys. Females withvisual impairments compare most favorably with normal girls on skinfold, legraise, arm hang, sit and reach, and the long distance run. The poorestperformances of males with visual impairments in comparison with normal males interms of percent of subjects above the median occurred in softball throw fordistance, long distance run, sit-ups, mat creep, and shuttle run. The poorestperformances of females relative to percent of individuals above the medianoccurred in shuttle run, mat creep, SO-yard dash, softball distance, broadjump, right grip strength, ;rid sit-ups.
In regard to comparisons between auditory and visually impaired subjects,no significant differences were found on triceps skinfold, abdominal skinfold,subscapular skinfold, sit-ups, leg raise:, sit and reach, and pull-ups (girls).Significant differences between the auditory impaired and visually impairedsubjects were found at one age or more on the following items: trunk raise,
249
4

216
mat creep, shuttle run, right grip, left grip, flexed arm hang, 50-yard dash,standing broad jump, softball distance, long distance run, and pull-ups (boys).The performance of auditory impaired subjects generally exceeded that ofchildren and youth with visual impairments.
In comparing the performance of normal subjects with cerebral palsiedsubjects, it was found that, with the exception of the skinfold measures, theperformance of girls on the pull-up test, and the performance of I7-year oldgirls on left grip, significant differences favoring normal subjects werefound on all test items in which comparisons were made. The cerebral palsygroup was the only major group which generally did not differ significantlyfrom normal subjects on skinfold measures.
Relative to test items measuring muscular strength/endurance, individut4swith cerebral palsy are generally between one and two standard deviationsbelow the performance of normal subjects. In "running" test items, they arefar below performance of normal subjects. Although differences in "running"test items may be attributed, in part, to differences in methods of ambulation,they also appear to be attributable, to some extent, to real differences inphysical fitness. Except in skinfold measurements, subjects with cerebral palsyare more variable in their performance than normal subjects. Unfortunately,few individuals with cerebral palsy were found to exceed median performancelovels of normal individuals in Project UNIQUE test items. Most favorablecomparisons with normal youngsters were ip skinfold measurements.
Spinal neuromuscular and normal subjects were compared on seven ProjectUNIQUE test items to determine whether significant differences existed betweenthe two groups. Except for skinfolds, the scores of the normal subjects weregenerally significantly superior to those of the spinal neuromuscular subjectson grip strength, arm hang, and pull-ups. No significant differences, however,were found between younger (10-13) normal and spinal neuromuscular boys on thegrip strength measures. In addition, no significant differences were foundbetween older (14-17) normal and spinal neuromuscular girls on left hand gripstrength, or between normal and spinal neuromuscular girls (both age groups) onpull-ups. Although not all comparisons were significant, there was a trendfor spinal neuromuscular subjects to have a larger skinfold than normal subjects.
In terms of variability of performance, as determined by coefficients ofvariation, inoividuals with spinal neuromuscular conditions are more variablethan normal subjects, but somewhat less variable in their scores than indivi-duals with cerebral palsy. Most youngsters labeled as spinal nenromuscularwho exceeded median level points of normal subjects did so in the area ofskinfold measurements.
In regard to individuals with congenital anomalies or amputations,comparisons with normal subjects were limited in this study. Test resultswere not tested for significant differences. Descriptive results are similarto those found in the other two groups included in the orthopedic categoryin regard to magnitude of differences in performance or percent of subjectsscoring above median points for normal subjects. Individuals with congenitalanomalies/amputations appeared to be more variable in their performance thannormal subjects.
250

217
Physical Fitness Test Performance as aFunction of Severity of Handicapping Condition
One of the factors that has been believed and found to affect physicalfitness has been the severity of handicapping condition. Information pertainingto severity of handicapping condition was pursued as a part of Project UNIQUE.elative to the auditory impaired sample, the visually impaired sample,cerebral palsied subjects, and spinal neuromuscular subjects for whom site ofspinal cord lesion was reported.
Auditory impaired subjects were subclassified as either hard of hearingor deaf, and comparisons in performance were made based on these subclassifi-cations. Results from Project UNIQUE data indicated that, with two exceptions,
'no significant differences were found between hard of hearing and deafparticipants on 17 Project UNIQUE test items. In one exception, 13-yearold deaf students had significantly higher left hand grip strength scores than13-year oldthard of hearing students. In the second exception, 16-year olddeaf students performed significantly more sit-ups than 16-year old hard ofhearing students. These results are based on analyzing data on 157 hard ofhearing boys, 666 deaf boys, 108 hard of hearing girls, and 537 deaf girls.
In relationship to the visually impaired sample, the analysis which wasconducted investigated performance between partially sighted and blindsubjects. Subjects for the study included 18S partially sighted girls, 304partially sighted boys, 77 blind girls, and 83 blind boys. The results of thestudy indicated that degree of visual impairment was found to be a significantfactor on six of the Project UNIQUE test items. On each of these items, thedifference between the means favored the partially sighted subjects. Five ofthese items were characterized by some form of movement through space (jumping)or moving through space toward a target (running, creeping). The sixth iteminvolved throwing. Activities which require movement through space (particularlyrunning to visual cues) and throwing have been previously identified as tasksin which blind individuals score low because of their sight disadvantages(Winnick, 1979).
In analyzing the effects of severity of condition on performance in thecerebral palsy group, comparisons were made between subjects in Classes IIIthrough VII in terms of the 1979 NASCP Classification System. The numbers ofsubjects in each of the classes were as followed: Class III, N=62; Class IV,14=37; Class VA, Nu25; VB, Nu64; Class VI, N=43; and Class VII, N290.The results of the analysis indicated that the severity of the condition asdefined by the NASCP system was a significant factor on approximately one-halfof the test battery administered to cerebral palsied subjects. SignificantF ratios were recorded for sit-ups, mat creep, shuttle run, the two gripstrength measures, 50-yard dash, standing broad jump, softball throw, and longdistance run. In general, the higher classes (less severely involved) achievedsuperior scores when compared to the lower classes on these items. The mostnotable exception appeared to be the performance of Class IV participants onthe grip strength measures. Class membership was not a significant factorrelative to skinfold measures, leg raise, trunk raise, sit and reach, aria hang,
or oull-ups.
251

218
In regard to individuals with spinal neuromuscular conditions, severityof condition was defined by the site of spinal cord lesion and was similarto the classification system utilized by the National Wheelchair AthleticAssociation. The site of spinal cord lesion was operationally defined bythe following categories: cervical region (N=7), lesions between T1 and TSinclusive (N=5), lesions between 16 and TIO inclusive (N=36), lesions betweenIll and L2 inclusive (N=39), and lesions at L3 or below (N=33). Because ofthe low number of subjects in the first two categories, they were eliminatedfrom the analysis. Of the 11 Project UNIQUE test items which were appropriatelyadministered to these individuals, a multivariate ANOVt indicated that siteof lesion was not a significant factor on Project UNIQUE test items. Thus,
the project UNIQUE battery did not discriminate between performances of spinalcord injured participants with lesions occurring at 16 or Lelow.
Physical Fitness Test Performance as aFunction of Onset of Handicapping Condition
In view of the contention that physical fitness scores of visuallyimpaired individuals are affected by age of onset of handicapping conftition,data were analyzed in terms of the variable of onset of handicapping conditionin the case of visually impaired subjects. Age of onset categories and numbersof subjects included: congenital, N=476; occurring between birth and agesix, N=I25; and occurring aft,a- age six, N=48. Each of these categories was
i alsO grouped with condition (partially sighted or blind). Results of thestudy indicated nonsignificant differences for age of onset and the interactionbetween the age of onset and condition. Because of this finding, it wasconcluded that age of onset was not a significant variable in the perfo-manceof Project UNIQUE physical fitness measures.
Performance of Run Items as aFunction of Method of Ambulation
In this study, test items involving running were modified in terms ofthe abilities of participants. These modifications resulted in differentmethods of ambulation which needed to be considered as procedural modificationsand in data analysis for visually impaired subjects and for the orthopedicallyimpaired subgroups. Since these were major modifications, it was necessary tocode method of ambulation and to analyze data in terms of these methodologicaldifferences. In their performance, visually impaired participants employedone of three running methods when performing the dash, the shuttle run, andthe long distance run. Depending on tht visual condition, subjects could runwith a partner, with the aid of a rope or guide wire, or unassisted. A one-wayunivariate ANOVA procedure found that subjects who performed the running eventsunassisted obtained superior scores to subjects who ran with the use of aguide wire. Unassisted subjects also significantly exceeded the performanceof partner-assisted subjects on the SO-yard dasa; however, no statisticaldifference was found between unassistee subjects and partner-assisted subjectson either the shuttle run or the long distance run. The performance ofpartner-assisted and guide wire-assisted subjects differed significantly onlyon the shuttle run where verbal and/or tactual cues provided by the partnermay have been helpful in improving performance. ',Clic some subjects wereclassified as blind and did run unassisted, the majority of blind subjects ranwith assistance and the majority of the partially sighted subjects ranunassisted.
252

219
Since running method was found to be a significant factor on performance,an additional analysis was performed to compare visually impaired subjects whoran unassisted with normal subjects on the three running items. This analysiswas performed to determine if differences observed between normal and visuallyimpaired subjects on running items discussed earlier were due solely todifferences in procedures (running methods). This analysis found that thedifferences between visually impaired and normal subjects was significant onall three running items and confirmed that this difference was not due solelyto variations in running method.
The relationship of running method and performance by cerebral palsiedsubjects was also analyzed for the SO-yard dash, the shuttle run, and thelong distance run. The running methods consisted of wheelchair participation,the use of an assistive device (cane, crutches, or walker), and unassisted.(The number of subjects per running method for each event is provided inTable 3.19.) Significant differences were found among running methods on allthree running items. Subjects who ran without assistance made superior scoresto subjects who performed in wheelchairs on each running item. Unassistedrunners also significantly surrassed the performance of runners who usedassistive devices on the shuttle run and long distance run. Despite a20-second mean difference in performance, the means of the unassisted andthe assistive device groups did not differ significantly on t:.e SO-yard dash.Participants using assistive devices significantly exceeded the performance ofwheelchair participants on the SO-yard dash and shuttle run, but no significantdifference was found between these groups on the long distance run. It wasconsidered particularly interesting that subjects who used assistive deviceswere significantly faster than wheelchair counterparts over a shorter distance(shuttle run or dash) but not over longer distances (long distance run).
Since running method or method of ambulation was found to be a significantfactor within the cerebral palsy group, an additional r.aalysis was performedto determine whether running performance between norm' and cerebral palsiedsubjects could be attributable solely to differences in procedures. In thisanalysis, unassisted cerebral palsied youngsters were contrasted with normalrunners. As expected, the result of this analysis indicated that differencesin running items were not due solely to differences in methods of ambulation.
Based on the analysis of performance as a function of method of ambulation,it is clear that scores are affected by method of ambulation. However, differencesin the methods of ambulation employed in this study did not account solely forthe differences in scores between normal youngsters and youngsters withhandicapping conditions. Based on the results of this study, it is necessaryto take into account methods of ambulation when administering appropriatetest iLems to determine youngsters level of functioning and in planningactivities for them.
Age Trends and Physical Fitness Performance
The influence of age on skinfold measures and performance on physicalfitness items was studied for the five major groups in this study: normal,
auditory impaired, visually impaired, cerebral palsy, and spinal neuromuscular.In analyzing the influence of age, each specific age from 10 to 17 wasindependently considered for the normal, auditory impaired, visually impaired,
253

220
and cerebral palsy groups. In the case of the spinal neuromuscular group,ages were combined to form two groups: a 10 to 13 year age group and a 14 to17 year age group. Ages in the spinal neuromuscular group were combinedbecause of the lack of adequate subject numbers at each specific age from10 to 17.
Generally speaking, age was found to be a significant factor on skinfoldmeasurements. The results of the study generally indicated that as age in-creases, skinfold measurement increases. Girls in each of the five major groupsof the study had increased triceps skinfold with age. The only exception to this
pattern was in the case of triceps skinfold for normal boys, boys with auditoryimpairments, boys with visual impairments, and boys classified as cerebralpalsied. In each of these groups, older boys had smaller triceps skinfoldsthan younger boys. Age was not a significant factor for spinal neuromuscularboys. In regard to abdominal skinfold, skinfolds increased with age in the caseof both boys and girls in each of the five major groups of the study. In thecase of subscapular skinfold, the skinfold was greater with age for both boysand girls in the case of normal subjects, visually impaired subjects, auditoryimpaired subjects, and the cerebral palsied subjects. Age was not a significantfactor relative to the abdominal skinfolds of spinal neuromuscular subjects.
In analyzing the performance of normal subjects, auditory impaired subjects,and visually impaired subjects on other (non-skinfold) test items, it was foundthat performance tended to improve with age. Significant improvement wasfound for both boys and girls on the leg raise, standing broad jump, 50-yarddash, mat creep, sit and reach, right grip strength, left grip strength, andsoftball throw for distance. Significant differences for boys, but not girls,were found on sit-ups, pull-ups, the long distance run, and the flexed armhang. Age was not a significant factor for girls on the long distance run,pull-ups, flexed arm hang (ages 11-13), and the shuttle run. Interestingly,in the shuttle run, age was a significant factor for normal and auditoryimpaired boys (older subjects attained higher scores), but was not significantfor normal girls, auditory impaired girls, visually impaired boys, and visuallyimpaired girls. Where improvements were made with increasing age in thecase of boys, improvements were noted throughout the 10-17 age range. On theother hand, girls showed a leveling off at age 12 in the broad jump and the50-yard dash. The rate of improvement was greater for boys than girls at age 14in the right grip strength measure and at age 13 in the left grip strengthmeasure. On the flexed arm hang, age was not significant for girls betweenthe ages of Ii and 13, but was significant between 13 and 16 years of age
(performance increased). In the softball throw for distance, age was asignificant factor for both boys and girls for normal, auditory impaired,and visually impaired subjects, but the rate of improvement was greater forboys than girls (especially for normal boys and auditory impaired boys).Overall, when considering the normal, auditory impaired, and visually impairedsamples, performance tended to improve with age with some leveling off oncertain items for girls between ages 12 and 14. Also, the rate of improvementwa round to be greater for boys than for girls at later age levels on certaintest items.
In relationship to subjects with orthopedic impairments, age was foundto be a significant factor for cerebral palsied subjects in only three non-skinfold test items. These items included right grip strength and left grip
254

221
strength for both boys and girls, and pull-ups for boys. In each of thesecases, performance improved with age.
In regard to subjects with spinal neuromuscular conditions, age wassignificant for these subjects on right grip (older subjects had higher gripstrength), for spinal neuromuscular girls on left hand grip strength (oldersubjects with higher scores), and for spinal neuromuscular boys on pull-ups(older ooys with higher scores). Thus, in relationship to the spinal neuro-muscular group and the cerebral palsied group, age was a factor for rightgrip, left grip, and pull-ups. In regard to grip strength, performance improvedwith age. In regard to pull-ups, boys improved with age and girls did notchange significantly.
On the basis of the results of this study, it is clear that age must beconsidered as a factor in physical fitness test results in the case of normalsubjects, auditory impaired subjects, and visually impaired subjects. In thecase of subjects with orthopedic impairments, age did not play as great a roleon physical fitness test items (skinfolds excluded). In the case of skinfoldmeasurements, age should be considered for subjects with orthopedic impairmentsas well. Finally, where age was a factor, performance scores generally improvedwith age. Exceptions were noted in certain cases in which girls tended tolevel off. Also, in certain instances, the rate of improvement for boystended to be greater than for girls.
Sex Trends and Physical Fitness
Svx was found to be a significant factor on most test items for mostsubject groups. When normal, auditory impaired, and visually impaired subjectswere analyzed, sex was found to have a similar effect on the performance ofeach group. Generally speaking, girls were found to have significantly largerskinfolds than boys and higher sit and reach scores than boys. With theexception of the trunk raise where no sex difference was found, boys exceededthe performance of girls or, all other test items. There were three exceptionsto this pattern. The difference between normal boys and girls on the tricepsskinfold was not found to be significant, and no statistically significantdifferences were found between visually impaired boys and girls on eithershuttle run or sit and reach.
Fewer significant sex differences existed for subjects with cerebral palsyor spinal neuromuscular conditions. For cerebral palsied subjects, girls werefound to have larger triceps and abdominal skinfolds than boys. Cerebralpalsied boys surpassed the performance of cerebral palsied girls on leg raise,arm hang, 50-yard dash, standing broad jump, and softball throw. No differenceswere found between cerebral palsied boys and girls on subscapular skinfold,sit-ups, trunk raise, mat creep, shuttle run, sit and reach, grip strength,pull-ups, or long distance run. For spinal neuromuscular subjects, sex wasfound to be a significant factor on only one test item. Boys with spinalneuromuscular conditions threw the softball farther than girls with spinalneuromuscular conditions. No differences were found between spinal neuromuscularboys and girls on the remaining test items (skinfold, grip strength, arm hang,pull-ups, 50-yard dash, and long distance run).
255

222
Physic Fitness Performance ag a Function of Community Size,Geographical Location, Educational Environment,
and Physical Fitness Experiences
One of the objectives of the project was to study the physical fitnessperformance of subjects included in the study as a function of associatedfactors influencing performance. For the purposes of this study, the associatedfact, s include community size, geographical location, educational environment,and y. ysical ed "cation experiences. In studying these factors, not all majorsubgroups of the subject population were considered for each factor. In thecase of community size, only the normal population was considered. The analysisof educational environment was limited to groups with handicapping conditionssince institutionalization and residence are not applicable to the normalpopulation. An analysis of physical education experiences and geographicalregions as factors influencing physical performance pertain to all major subjectgroups.
Community Size
In analyzing data of normal subjects as a function of community size, itwas necessary to define community size. Community size was conceptualizedas either urban (population of 200,000 or greater), suburban (population equalto or greater than 10,000 but less than 200,000), and rural (population lessthan 10,000). Of the 681 girls involved in the normal sample, 180 were educatedin an urban community, 319 in a suburban community, and 182 in a rural community.Of the 511 boys involved in the normal sample, 92 were determined to be educatedin an urban community, 304 in a suburban community, and 115 in a rural community.The results of the analysis indicated that community size was a significant maineffect in the absence of significant interaction (community size x sex) for three
items: leg raise, trunk raise, and standing broad jump. Suburban subjects were
found to have significantly higher scores than either urban or rural subjects on
the leg raise. On the timed trunk raise, suburban subjects were found to be
superior to urban subjects. Urban subjects exceeded the performance of suburbanand rural subjects on the standing broad jump.
Significant community size by sex interaction emerged on eight additional
test items: triceps skinfold, abdominal skinfold, subscapular skinfold, sit-ups,mat creep, right grip strength, left grip strength, and flexed arm hang. Forboys, signifi:ant differences were found on sit-t.n, mat creep, and flexedarm hang only. In the sit-up, suburban boys significantly exceeded the performanceof urban and rural boys. In the mat creep, suburban boys significantly exceededthe performance of urban boys; however, rural boys did not differ significantlyfrom either group. In the flexed arm hang, rural boys had significantly higherflexed arm hang times than either suburban or urban boys. Although theseresults are interesting, no definitive pattern of differences was apparentrelative to bo)s.
A somewhat greater number of differences existed for girls than boys. For
girls, significant differenc,s were found in triceps and abdominal skinfolds(urban girls had significantly larger skinfolds than either suburban or ruralgirls), subscapular skinfold (urban girls were found to have significantlylarger skinfolds than rural girls and rural girls were found to have significantlylarger skinfolds than subt:ban girls), mat creep (suburban and rural girls
256

223
recorded significantly faster mat ceep times than urban girls), and right andleft grip strength (rural girls had significantly higher grip strength scoresthan urban girls; suburban girls clic: not differ significantly from either group).Thus, there appeared to be a tendency for the test item performance (skinfoldsexcluded) of urban girls to be inferior to that of suburban and rural girls,and for girls in urban settings to po:,sess larger skinfolds than girls in theother community settings. An exception to this was the standing broad jumptest in which girls in urban settings exceeded the performance of those insuburban and rural settings.
The results pertaining to the relationship of community size and physicalfitness performance should be considered exploratory at this point. In viewof the lack of a definite pattern emerging in relationship tc this question,no implications will be or are recommended.
Geographical Location
Another relatively minor objective of Project UNIQUE was to study thephysical fitness of subjects as a function of geographical location, i.e., asa function of .Lortheast, southeast, central, northwest, or southwest area'* ofthe United States. Unfortunately, there was a wide disparity in the numberof subjects tested in each of these areas. The actual number of subjects andpercent total by each region was: northeast, N=1,450, 37.1%; southeast, N=614,15.70; central, N=1,196, 30.5%; northwest, N=149, 3.8%; southwest, N=505, 12.9%.An analysis of subjects tested by geographical areas indicated t5at a di:proportionate number of subjects were tested within regions, and insufficientnumbers of subjects were tested in the northwest and southwest regions. Forexample, in the northwest region, only four boys and three girls with orthopedicimpairments were tested. In view of the disparity of subjects tested withinregions, the lack of subject numbers in certain subgroups, the fact that hiswas a very minor part of the study (for which the study was not primarilydesigned), and because of percehed limited implications, the influence ofgeographic loaction on performance was not pursued.
Educational Ervironment
For this study, educational environment was essentially defined i..i termsof schcol placement and residence. Impaired subjects were classified as eitherinstitutionalized residents, institutionalized nonresidents, or non-institutionalized. Subjects were considered to be institutionalized if allstudents attending the subject's school were deemed handicapped, i.e., asegregated setting. Thus, an institution was considered either a publicor private segregated school. If normal subjects attended the same schoolas a handicapped individual, the school and, of course, the subject wereconsidered non-institutionalized. This was true even if a subject was educatedin a self-contained special class within the school. Subjects residing at aninstitution were identified as institutionalized resident. On the other hand,individuals who attended institutions which were segregated but who did notreside at the institution were identified as institutionalized nonresidents.
4
The number of auditory impaired subjects according to educationalenvironment has as follows: girls - 365 institutionalized resident, 197 insti-tutionalized nonresident, and 83 non-institutionalized; boys - 4q0 institutionalized
257

224
resident, 227 institutionalized nonresident, and 116 non-institutionalized.In regard to the auditory impaired sample, educational setting was found to bea significant factor on 15 of the 17 Project UNIQUE test items. Eleven of thetest items yielded significant main effect F values for educational settingin the absence of significant interaction. On four items, a significant edu-cational setting by sex interaction emerged. Although the superiority of groupsand subgroups varies from item to item, there was a trend for the performance ofnon-institutionalized subjects to be generally inferior to the performance ofinstitutionalized subjects. This conception of trend is based on the fact thatof 12 of 13 performance items (skinfolds excluded), the performance of the non-institutionalized group was surpassed by the performance of at least one of theinstitutionalized groups. In addition, on the triceps skinfold, the institu-tionalized resident group had significantly larger skinfolds than institutionalizednonresidents, and institutionalized residents had significantly larger abdominalskinfolds than institutionalized nonresidents and non-institutionalizedsubjects at the .05 level (this was the only instance in which a significantF value favored the non-institutionalized subgroup). It appears that, ingeneral, auditory impaired subjects who were "institutionalized" were moresuccessful in physical fitness test items than those who were "non-institutionalized."
In analyzing the performance of visually impaired subjects as a functionof educational settings, the following sample sizes were involved: girls -146 institutionalized resident subjects, 40 institutionalized nonresidentsubjects, and 76 non-institutionalized subjects; boys- 242 institutionalizedresident subjects, 47 institutionalized nonresident subjects, and 98 non-institutionalized subjects. the results of the data analysis indicated thateducational setting was found to be a significant factor on nine of the 17Project UNIQUE physical fitness items which were analyzed. Of the nine items,three were skinfold items. Of the remaining six items, the nor- institutionaiizedgroup was found to be inferior to at least one of the institutionalized groupsin every case. Relative to the skinfold measures, the non-institutionalizedgroup was found to have significantly lower skinfolds than the institutionalizedsubjects. Although educational setting was not significant on as many variablesas was true for auditory impaired subjects, the results pertaining to thevisually impaired subjects were similar in that subjects from institutionalizedsettings were superior to the non - institutionalized group in each case wheresignificance occurred ( skinfolds not included).
In regard to the cerebral palsied subjects, the following numbers and
categories existed: girls - 21 institutionalized nonresidents, 38 institution-alized residents, 119 non-institutionalized; boys - 25 institutionalizednonresidents, 40 institutionalized resident, and 147 non-institutionalized.In the case of the cerebral palsy group, the main effect of educational settingwas significant on only three items: mat creep, shuttle run, and right handgrip strength. On the mat creep and shuttle run, non-institutionalizedsubjects made significantly faster times than institutionalized nonresidents.Institutionalized residents had significantly higher scores than institution-alized nonresidents on the right hand grip strength (.OS level). These resultssupport the contention that educational setting is not generally a significantfactor for cerebral palsied subjects.
For the analysis pertaining to individuals with spinal neuromuscularconditions, the number and classification of subjects included: girls - eightinstitutionalized nonresident, 18 institutionalized residents and 47
258

225
non-institutionalized; boys - 10 institutionalized nonresidents, 16 institu-tionalized residents, and 48 non-institutionalized. Multivariate ANOVA resultsindicated that neither the interaction of educational setting and sex nor themain effect of educational setting was significant. Thus, it may be concludedthat educational setting was net a significant factor relative to the physicalfitness performance of subjects with spinal neuromuscular conditions.
On the basis of the analysis that was conducted relative to educationalenvironment, it becomes clear that educational environment was not a factorin the orthopedic subgroups. On the other hand, educational environmentappeared to be related to physical fitness performance in groups identifiedas sensory impaired. Where significance was found in regard to the sensoryimpaired groups, it was generally in favor of the institutionalized subjects.More test items were significantly affected for auditory impaired subjects thanfor visually impaired subjects. The data eminating from this analysis are notin agreement with the prevalent conception that the performance of individualsin non-institutional settings exceeds that of individuals in institutionalizedsettings.
Factor Structure of Physical Fitness
As a result of the activities involved :n this study, a factor structureof physical fitness for the major groups of the study was developed and adopted.Although not tested statistically for similarities, it can be reported, withsome degree of confidence, that the factor structures of the major subjectgroups exhibited similar but not identical patterns.
The most robust factors extracted from the data were those labeled bodyvumpositiun. Regaidlesb of the suligiuup (it imeiLuil:lation matrix analyzed,the body composition factor emerged. It was also evident that all groupsexhibited common factors within the generic area labeled muscular strength/endurance. For the normal, auditory impaired, and visually impaired groups,support was found for factors of strength, power-speed, and power-strength.Normal and visually impaired girls exhibited five extracted factors, while theboys from these groups had only four. This was apparently due to partitioningpower-strength into a factor containing power-strength (flexed arm hang andpull-ups) and another consisting primarily of trunk-hip flexibility power-endurance (sit and reach, trunk raise, and leg raise).
The procedures and test items selected in this study resulted in theidentification of strength, power-speed, and power-strength factors fornormal subjects, individuals with auditory impairments, and individuals withvisual impairments. In the case of individuals with cerebral palsy, factorsof power-strength, strength, and power-endurance were supported, to at leastsome extent, in the cases of both boys and girls. The power-speed factorwas not exhibited in the cerebral palsy group because the SO-yard/meter dash,which was a reflection of power-speed in the normal, auditory, and visualgroups, was designated as a power-endurance factor in the case of individualswith cerebral palsy. A strength and power-endurance factor was evidenced forparaplegic wheelchair spinal neuromuscular subjects. The fact that the power-endurance rather than a power-speed factor emerged was attributed to the needfor individuals participating in wheelchairs to take more time in executingthe SO-yard/meter dash. (In view of the lack of subject numbers, a factor
259

1
226
structure was not developed in connection with the congenital anomalies/amputees subject sample. Since individuals with these impairments areessentially able-bodied, except for involvement of one or more extremities,the factor stricture presented in connection with the normal population wasadopted for this group.)
The data militating from this study did not identify a factor structureof physical fitness which included flexibility and cardiorespiratory endurance.This could be due to the fact that only one test item was used to define eachof these factors. With no other -cells hypothetically related to theseconstructs, it became especially difficult to extract these factors fromthe data. These two components were essentially hypothesized in the originalconceptualizati ' n and were not supported or unsupported by this study.
Thus, the hypothesized factor structure as reported in Chapter I wasamended on the basis of the factor analysis. The body composition factorwas maintained as an intact factor. The items which comprised the hypothesizedmuscular strength/endurance factor were partitioned into factors of strength,power-speed, power-strength, or power-endurance as a result of factor analyzingproject data. The hypothesized speed and agility factors merged to defineeither the power-spee0 or power-endurance factor. As mentioned previously,flexibility and cardi....espiratory endurance, which were hypothesized originally,were not supported or unsupported by the data.
In view of the data that were collected and analyzed, previous research,and on the basis of logical considerations, it is believed that the factorstructu.e of physical fitness of the groups involved in the present studyincludes body composition, muscular strength/endurance, flexibility, andcardiorepiratory endurance. Based on this factor structure, a rest and
training program (presented in the appendices) have been developed to assessand improve the physical fitness abilities of the groups involved.
Physical Fitness Performance as a Functionof Physical Education Experiences
Although never conceived as a major part of the study, a part of oneof the major objectives was to determine the effect of physical educationexperiences on physical fitness performance. In order to answer this question,it was originally planned to compare performance of persons receiving physicaleducation with those not receiving physical education, comparing performanceas a function of time spent per week for physical education, and by comparingthe physical fitness performance of individuals receiving physical educationfrom a professional physical educator with individuals receiving physicaleducation from non-physical educators.
In order to help answer these questions, a survey was conducted relative
to these questions. The survey was completed by local testers or coordinatorsfor approximately 83 percent of the subjects involved in the study. Theresults appear in Table 5.1. Results indicate that 99 percent of the subjectssurveyed received physical education, and that the physical education providedwas almost always(99%) offered by a professional physical educator. Sirice
this was the case, it was not considerej appropriate to analyze the data interms of physical education versus no .!ical education, or in terms of the
1111
effects of physical fitness performance as a function of the type of instructor.
260

TABLE 5.1. SURVEY RESULTS PERTAINING TO PHYSICAL EDUCATION EXPERIENCES.
MajorSubject
Groups
Total Numberof Subjectsin the Study
Number andPercent ofSubjects inSurvey
Number andPercent ofSubjectsReceivingPhysicalEducation
Number andPercent ofSubjectsTaught byProfessionalPhysicalEducators
Number and Percentof Subjects X Minutes per Week
of Physical Education
SO or
less
31-60 61-90 91 ormore
Normal 1192 1028 1028 1028 0 0 171 857(86%) (100%) (100%) (0%) (0%) (17%) (83%)
Visual 649 575 575 537 2 3 164 406Impairment (89%) (100%) (93%) (0%) (0%) (29%) (71%)
Auditory 1468 1279 1272 1272 37 14 162 1066Impairment (87%) (99%) (99%) (03%) (01%) (13%) (83%)
Orthopedic 605 378 364 364 88 97 132 61
Impairment (62%) (96%) (96%) (23%) (26%) (35%) (16%)
Total 3914 3260 3239 3239 127 114 629 2390(83%) (99%) (99%) '04%) (04%) (19%) (73%)
261

228
The results of the survey also indicated that 92
percent of the subjects in
the study had physical education at least one hour
per week, and 73 percent
received physical education for 91 minutes or more
per week,
Again, in view
of the relatively large percentage of individuals in these categories as
opposed to those who received physical education less than one hour per week,
it was considered not appropriate to analyze the data from that perspective.
The data presented in Table 5.1 indicate that the offering of physical -
education to individuals with orthopedic impairments
compared least favorably
to that of other groups.
Individuals with orthopedic impairments not only
received physical education less often, but the physical education duration
for this group was less than that for the othergroups in the study.
Possible
explanations are that physical education is simply offered less often or that
physical education is replaced by physical or occupational therapy.
Unfortunately,
the exploratory nature of the data collected in regard to this objective
pro-
hibits definite conclusions in regard to these questfons.
In summary, although original plans called for the project '4o study the
influente of physical education in greater depth, it was not possible to
arrive at definitive answers because the subjects involved in the study were
almost exclusively individuals who were receiving physical education, who were
receiving physi :al education from a professional physical educator, and who
receiving physical education for 91 minutes or more per week.
There were
ih.lequate numbers in corresponding comparati/e groups.
Thus, comparisons were
if:appropriate,
Unfortunately, _Ime and financial constraints prohibited adding
additional subjects or compa :ativft groups in this study.
263

229
Physical Fitness Test
Another very important objective of the project was to develop a validand reliable test of physical fitness for sensor, and orthopedically impairedboys and girls, between the ages of 10 and 17, on the basis of data whichhas been collected. In this section, the criteria for the selection of testitems, the actual items selected, and information pertaining to test itemvalidity, reliability of tests, and intercorrelations will be presented. Thetest is presented in its entirety in Appendix B. The test manual presentedin the Appendix includes an introduction; the conceptual basis for the physicalfitness test; target populations; procedures for selecting subjects for datacollection; information pertaining to project coordinators and field testerswho collected data; the criteria for the selection of test items; validity oftest items; reliability of tests and trend analysis; intercorrelations;procedures for selecting test items for individuals; methods of determiningheight, weight, and age; the actual listing and description of test items andtheir modifications; inf "rmation pertaining to norm-referenced appraisals;norms; test forms; a description of the award system associated with the test;and a Libliography of related information.
Criteria for the Selection of Test Items
Test items included in the Project UNIQUE Physical Fitness Test wereselected from an original battery of 16 measures. These measures includedskinfolds, sit-ups, leg raise, trunk raise, shuttle run, rise-to-stand, matcreep, modified stork test, sit and reach, grip strength, flexed arm hang,pull-ups, SO-yard/meter dash, standing broad jump, softball throw (distanceand velocity), and the long distance run. The final list of test itemsincluded in the project physical fitness test was selected on the basis ofboth primary and secondary criteria.
The first primary criterion was to select items which were included inthe &AMER Youth Fitness Test and the AMIPERD Health Related Fitness Test.This criterion was applied so that comparisons between persons with and withouthandicapping conditions would be enhanced. This resulted, in a sense, in"mainstreaming" test items, so that children with handicapping conditionscould take the same items as their non-impaired peers (although test proceduresmight be modified and score comparisons might be made with different norms).Thus, participants with handicapping conditions would not need to be separatedout of a testing situation or have special test items created for them.
A second major criterion was that of validity. Test items which werefinally selected .:ere those which best measured a particular physical fitnessfactor. This determination was made on the basis of logical considerations,support from related literature, and factor analytic results performed withProject UNIQUE data. In selecting est items on the basis of factor analysis,the two main criteria uhich were applied were the size of the test's factorloading on its primary factor and the purity with which the test itemmeasured this factor.
The third major criterion was the extent to which test items could beused for different classes of individuals. In selecting test items, preferencewas given to those items _hat could be administered to both boys and girls,could be administered to children and youth between the ages of 10 and 17 years
264

230
of age, and could be administered to both individuals with and 'iithouthandicapping conditions. It must be emphasized, however, that no one itemcould be administered without modifications to every class of individuals.In certain cases, items had to be modified for individuals with handicappingconditions and, in other cases, it was necessary to eliminate items.
The next criterion of primary importance in the selection of test itemswas to select test items which had low intercorrelations. This criterionwas employed so that each item in the test added new information about theability of the participant. Tes, items which duplicated information wereeliminated.
The final criterion of primary importance was test reliability. Otherthings being equal, items which were most reliable were selected for thetest.
In addition to the above-mentioned primary criteria, additional secondarycriteria were employed in the selection of test items. In essence, items whichwere selected included those which are or should be reasonably familiar tophysical educators. those that require little or no expensive or elaborateequipmeAt, and those which require a minimal zmount of time to administer.
Physical Fitness Test Items
The Project UNIQUE Physical Fitness Test includes test items to measurebody composition, flexibility, cardiorespiratory endurance, and factors encom-
passed within the rubric of muscular strength /endurance. Triceps skinfold,subscapular skinfold, and sum of triceps and subscapular skinfolds (an AAHPERD1i.11th-Related test item) have been selected to reflect body composition in allmajor groups involved in the study: normal, auditory impaired, visuallyimpaired, and the orthopedic impaired.
Muscular strength/endurance was separated into four factors or subcomponentsfor the purposes of the Project UNIQUE Physical Fitness Test: strength, power-strength, power-speed, and endurance. Right grip strength, left grip strength,and sum of grips (to account for possible differences in hand preference) wereselected to measure the strergth of normal subjects, auditory impaired subjects,visually impaired subjects, cerebral palsied girls, strength of wheelchairspinal neuromuscular subjects, and the strength of individuals classified ascongenital anomaly/amputee. The grip measures were also selected to measurethe power-strength of boys with cerebral palsy. No test item was selected tomeasure the strength .factor of boys with cerebral palsy, since the grip testsloaded on the power-strength factor with this group.
The SO-yard/meter dash was selected to measure the power-speed of normal,auditory impaired, and visually impaired subjects. In addition, the SO-yard/meter dash was selected to measure power-speed of individuals with congenitalanomalies/amputations. In the case of individuals with cerebral palsy andthose classified as paraplegic wheelchair spinal neuromuscular, the SO-yard/meterdash was employed as a measure of power-endurance.
The sit-up test item was selected as a measure of power-strength ofindividuals classified as normal, auditory impaired, and visually impaired.It may be used for individuals with congenital anomalies/amputations in cases
265

231
where the sit-up is appropriate for members of these subgroups. The sit-up isnot Included as a test item in the case of individuals with cerebral palsy orindividuals with spinal neuromuscular conditions.
The softball throw for distance is ri measure of power-strength for girlswith cerebral palsy and is administered, eliminated, or modified for subgropswithin this group, as appropriate. (The softball throw for distance may beadded for cerebral palsied boys if the tester desires to have the boys takethe same items as the girls. The tester should be aware, however, that thesoftball throw appears to be a more valid measure of power-endurance for zheboys.)
The sit and reach test was selected as a measure of flexibility for allgroups of the study in which the administration of this test item is appropriate.Normal ar.d sensory impaired subjects may always include the sit acid reach testitem. Individuals classified as cerebral palsied or congenital anomaly/amputeeshyuld only be administered the sit and reach item where appropriate. The sitand reach is not a test item for individuals classified as spinal neuromuscular.
The long distance "run" was selected as a test item for all individualsin the study. However, it may be necessary to modify long distance "run"procedures for all groups except the auditory impaired group and normal subjects.
Since it is not possible for certain individuals to take certain itemson the basic Project UNIQ Physical Fitness Test, certain substitutions havebeen recommenied. The arm hang test is suggested as a substitute for the gritstrength test to measure power-strength in the case of boys with cerebral palsy.The arm han,7 test is also a suggested substitute measure of strength forparaplegic wheelchair spinal neuromuscular boys and for boys classified ascongenital anomaly/amputee. The softball throw for distance may be substitutedfor the grip strength test to measure strength in the case of boys and girlsclassified as paraplegic wheelchair spinal neuromuscular. In addition, thesoftball throw for distance item, in which subjects are seated, may be sub-stituted for the sit-up as a measure of power-strength in the case of boys andsirls classified as congenital anomaly/amputee where the sit-up is not appro-priate as a test Item.
The broad jump is suggested as a substitute measure of strength for gripstrength measures in the case of subjects identified as normal, auditory impaired,and visually impaired. In addition, the broad jump may be substituted for thearm hang or grip strength test as a strength measure for those individualswith congenital anomalies/amputations who may have uppe. limb involvement butable-bodied lower extremities. Test items by ma;or groups and physical fitnesscomponents are presented in Tables 5.2 and 5.3.
Reliability of T.:sst Items
The reliability of Project UNIQUE Physical Fitness Test items has beendetermined through the research of Daquila (1982) using Project UNIQUE dataand information which has been found in related research. This information ispresented in detail in CLapter 2, In this section, information pertaining tothe reliability of items selected for the Project UNIQUE Physical Fitness Testis summarized.
2663

232
TABLE 5.2. PROJECT UNIQUE PHYSICAL FITNESS TEST FOR NORMAL, SENSORY IMPAIRED,
AND ORTHOPEDICALLY IMPAIRED CHILDREN AND YOUTH: COMPONENTS ANDTEST ITEMS.
Comonent/Factor
Body Composition
Basic TestTest Itea Comments
Muscular Strength/Endurance
Strength orPower-Strength
Power-Speed orPower-Endurance
Power-Strength
Triceps SkinfoldSubscapular SkinfoldSum of Triceps andSubscapular Skin-folds
Right Grip
Left GripSum of Grips
SO-Yard/Meter Dash
Sit-Ups
Skinfold test items are admin-iste-'ed to all subject groupsexcept in cases where inappro-priate due to congenital anomalyor amputation.
The grip measures are admin-istered to all subject groupsexcept in cases where inappro-priate due to physical condi-tion. The grip tests are usedas a measure of the strengthfactor in subject groups exceptboys with cerebral palsy. Thegrip tests are used as a measureof 'sower- strength for boys with
cerebral palsy.
The 50-yard/meter dash is admin-istered to all subject groupsexcept where inappropriate dueto physical condition. Pro-
cedures for the dash are modi-fied for certain subject group".The dash is used as a measure ofpower-speed for a!? groupsexcept the cerebral palsy andspinal neuromuscular groups.Relative to these groups, thedash is a measure of power-endurance.
The sit-up is administered as ameasure of power-strength to allmajor subject groups except thecerebral palsy group and spinalneuromuscular groups. In the
case of individuals with con-genital anomalies /Rinputees, it
may be necessary to eliminate ormodify the test for certain sub-groups or substitute the soft-ball throw for distance as ameasure of power-strength.
267

0
233
TABLE 5,2. (cont.)
Basic Test
Component/Factor Test Item Comments
Muscular Strength/Endurance
Power-Strength Softball Throw The softball throw for distanceis a measure of power-strengthfor girls with cerebral palsyand is administered, eliminated,or modified for subgroups, asappropriate.
Flexibility Sit and Reach The sit and reach test is admin-istered as a measure of flex-ibility to normal and sensoryimpaired groups. It is a testitem not administered to indivi-duals with spinal neuromuscularconditions and, although admin.-
/ istered to other orthopedicallyimpaired groups, may requiremodification or elimination incertain orthopedic subgroups.
Cardioresoiratory Long Distance Run Th4. long distance run is admin.Lndurance istered to all groups. In
certain instances, there is anced to modify procedures,
Sohstitutions
Strength Broad Jump The broad jump is a substitute.item for grip tests in thefollowing groups: normal,auditory impaired, visuallyimpaired, congenital anomaly/amputee (as appropriae).
Strength or Arm Hang The arm hang a substitutePower-Strength test item for grip tests for
boys with cerebral palsy, para-plegic wheelchair spinal neuro-muscular boys, and boys classi-fied as congenital anomaly/amputee (as appropriate). In
the case of boys with cerebralpalsy, tho arm hang is ameasure of power-strength,
268

234
TAM 5.2. (cont.)
Component/FactorSubstitutions
Test Item Cooments
Strength or'Power-Strength
Softball Throw for The softball thro for distanceDistance may be substituted as a measure
of power-strength for indivi-duals classified as congenitalanomaly/amputee. It is used asa substitute measure of strengthin the case of paraplegicwheelchair spinal neuromuscularsubjects.
269
4

235
1AbLE 5.3. PROJECT UNI PHYSICAL FI1NESS TEST ITE:IS X MAJOR SUBJECT GROUPS.
Subject Group Test Items*
Normal, Auditory Impaired,and Visually Impaired
Cerebral Palsy
Paraplegic WheelchairSpinal Neuromuscular
Conwnitai Nnonaly/Amputee
Basic Test: body composition: triceps skin-fold, subscapular skinfold, stun of tricepsand subscapular skinfolds; strength: right
grip, left grin, sum of grips; power-speed:50-yard/meter dash; power-strength: sit-ups;flexibility: sit and reach; cardiorespiratoryendurance: long distance run.
Substitutions: The broad jump may be substi-tuted for grip strength tests as a measureof strength.
Basic Test: The basic test includes the sameitems as recommended for normal individualsexcept that the sit-up test is eliminatedand girls substitute the softball throw fordistance as a measure of power-strength. The50-yard/meter dash is a measure of power-endurance. In the case of cerebral palsyboys, grip tests are measures of power-strength.
Substitutions: The arm hang may be substitutedfor grip tests as measures of power-strengthfor boys.
Basic Test: The basic test includes the sameitems as recommended for normal individualsexcept that the sit-up and sit and reachtests are eliminated. The 50-yard/meter dashis used as a measure cf power-endurance.
Substitutions: The arm hang or softball throwfor distance may he substituted for gripstrength measures (strength factor) for malesubjects. The softball throw may be sub-stituted for grip strength measures (strengthfactor) for female subjects.
Basic Test: The basic test items for taisgroup are the same as eor normal subjects.
Suostitutions: As a substitute for grip tests,boys may substitute the broad jump or amnang and girls nay substitute the broad jumpas iLeasures of the strength factor, asappropriate. The softball throw for distancema) be substitut(' for sit-ups (as a ower-strentAh factor) in cases where the sit-upwould be considered inappropriate.
*in certain cases, test items may Se modified for particular groups and beeliminated for subgroups within grouns when the administration of a particulartest iteLi 4uuld be inappropriate.
270

236
Daquila (1982), analyzing Project UNIQUE data in an unpublished master'sthesis, determined the test reliability, as represented by alpha coefficients,of the following test items: skinfold measurements, sit and reach, gripstrength test items, flexed arm hang, broad jump, and softball throw fordistance. To determine alpha coefficients, Daquila randomly selected 50Project UNIQUE subjects from each of the major subject categories (normal,auditory impaired, visually impaired, and orthopedically impaired). The resultsof Daquila's work is included in Table 5.4 relative to test items selected forthe Project UNIQUE Physical Fitness Test and also is presented in Chapter II ingreater detail.
In addition to Daquila's research, information pertaining to the reli-ability of these test items was reviewed in related research and literature andis presented in summary form in Table 5.4. In the case of sit-ups, the 50-yard/meter dash, and the long distance run, reliability coefficients were summarize)from related research because Daquila's study did not include these test items.These results are also presented in Table 5.4. The results presented inTable 5.4 indicate that reliability coefficients pertaining to tests selectedfor the Project UNIQUE Physical Fitness Test are high. The alpha coefficientsfound by Daquila were, in general, superior to those found in other studies forsimilar items, Brief review of this table will indicate very acceptablereliability coefficients.
Specifically, in regard to skinfold measures, reliability coefficientsreported by Colgan (1978) and Daquila (1982) are .90 or above. AAHPERD (1980)has reported that test-retest correlation coefficients associated with skinfoldtests have exceeded .95 in experienced testers.
In regard to test items measuring factors related to muscular strength/endurance, reliability have also been very acceptable. In regard to gripstrength tests, within day reliability coefficients are generally in the .80'sand .90's. Daquila (1982) reported alpha coefficients of .97 or better. Flexedarm hang reliability coefficients are generally high, i.e., generally in thehigh .80's and .90's. These reliability coefficients were found by Vodola(1978), Bolonchuk (1971), Colgan (1978), and Avent (1963). Daquila, usingProject UNIQUE data, reported reliability coefficients pertaining to the flexedarm hang ranging from .84, in the case of the visually impaired subjects, to.96 for subjects classified as orthopedically impaired. The standing long jumpor broad jump has been studied by several investigators. A review of Table 5.4will indicate very acceptable reliability coefficients in regard to the standinglong jump. Daquila (1982), using Project UNIQUE data, found reliabilitycoefficients of .94 or above in all major subject groups in which he admin-istered three trials. The reliability of the softball throw for distance testhas been studied by Pleishman (1964b), Klesius (1968), Marmis, et al. (1969),Keogh (1965), and Bolonchuk (1971). Reliability coefficients in these studieswere relatively high, ranging from .83 to .99, W.th most coefficients above.90. Daquila (1982), using Project UNIQUE data, found the alpha coefficientsranging from .86 for orthopedically impaired subjects to as high as .99 ingroups identified as visually impaired and auditory impaired. In regard tosit-ups, Vodola (1978) reported reliability coefficients ranging from .89 to.99 in the various groups which he studied. Klesius (1968) reported some of thelowest reliability coefficients in the literature. His reliability coefficientsrange from .68 to .94 ( AAHPERD, 1980). In regard to the 50-yard dash,
271

272
TABLE 5.4. RELIABILITY COEFFICIENTS OF PROJECT UNIQUE PHYSICAL FITNESS TEST ITEMS.*
Item Source ProcedureTrials (t)Days (d)
SampleRel.
Coef.
'Skinfold ColganMeasurement:, (1978)
Triceps, Sub- Daquilascapular, and (1982)
AbdominalSkinfolds
Grip Strength Fleishman(1964b)
Rarick,
Dobbins, &Broadhead(1976)
between day,test-retestcorrelationcoefficients
It - 2d1 week apart
within day, 3t - Id fortest-retest all groupsalpha coeffi-cients for tri-ceps, abdominal,and subscapularmeasures
test-retestcorrelationcoefficients
within day,test-retestcorrelationcoefficients
not given
3t
164 males and 162 femalesages 10-18
SO normal males and femalesages 10-17
Triceps:.93f.96m
Subscapular:.94f.90m
.99 (allsites)
SO visually impaired males andfemales ages 10-17 .90-.99
SO auditory impaired males andfemales ages 10-17 .98-.99
SO orthopedically impairedmales and females ages 10-17 .97-.99
20,000 males and femalesages 12-18 91
Rt Lft.
71 males ages 6-9 .911 .959
65 retarded males ages 10-13 .927 .941
71 retarded males ages 6-9 .902 .917
74 females ages 6-9 .882 .896
61 retarded females ages 10-13 .975 .959
64 retarded females ages 6-9 .917 .934
*The information presented in this table was summarized by the authors and depends heavily onDaquila, Gene A. "Reliability of Selected Health and Performance Related Test Items from the ProjectUNIQUE Physical Fitness Test Inventory," Unpublished Master's Thesis, SUNY College at Brockport, 1982.
-.

3.
,*-* - <-.
TABLE 5.4. (cont.)
Item
Grip Strength(cont.)
Flexed ArmHang
274
Source ProcedureTrials (t)Days (d)
Sample
Keogh Pearson product- 2t 2d 23 1st grade males and females(1965) moment, test-
retest2-6 weeks apart 23 3rd grade males and females
Keogh(1965)
within day,Pearson product-moment, test -
retest
2t 23 1st grade males and females
23 3rd grade males and females
Avent(1963)
between day,test-retest,
Pearson product-moment
2t - 2d3-8 weeks apart
50 females ages 9-12
Daquila within day, 3t - ld 50 normal males and females(1982) test-retest (alternating ages 10-17
alphacoefficients
R/L)50 visually impaired males andfemales ages 10-17
50 auditory impaired males andfemales ages 10-17
50 orthopedically impairedmales and females ages 10-17
Vodola(1978)
between day,
test-retest,Pearson product-moment
one elybetween tests
30 females age 1533 males age 1519 females age 7
Bolonchuk(1971)
test-retest,Pearson prod act -
moment
2t 25 5th and 6th grade females
r
Rel.
Coef.
Rt.
.85 .79
.75 .70
.76 (righthand only).84 (right
hand only)
.654 .797
.98 .98
.99 .97
.97 .98
.98 .99
.97
.89
.88
.95
275.00
fit
co

1r
ir
21
TABLE 5.4. (cont.)
Item
Flexed ArmHang (cont.)
Standing BroadJump
6
Source ProcedureTrials (t)Days (d)
SampleRel.
Coef.
Colgan(1978)
between day,test-retestcorrelaticncoefficients
It -2dweek apart
164 males and 162 femalesages 10-18
.96m
.89f
Avent(1963)
betl*sten day,
test-retest,
Pearson product-moment
2t - 2d3-8 weeks apart(underhand gripused)
SO females ages 9-12 .868
Daquila(1982)
within day,test-retestalphacoefficients
2t - ld SO normal males and femhlesages 10-17
SO visually impaired males andfemales ages 10-17
.93
.84
50 auditory impaired males andfemales ages J0-17 .92
SO orthopedi, ally impaired males
and females ages 10-17 .96.
Klesius
0968)within day,test-retestcorrelationcoefficientsbetween trials
3t 1S0 10th grade males .82-.88
Marmis, etal. (1969)
within day,test-retestcorrelationcoefficients
;t 1,122 males ages 5.7.-18
938 females ages 9-18
.73-.95
.75-.95
Vodol a between day, one day 30 females age 15 .9S
(1978) tes.0-retest, between testf- 33 males age 1S .98
?earson,nroduct- 13 males age 6 .49
moment 19 females age 7 .89
277

TABLE 5.4. (cont.)
7.
Item Source Procedlare
Standing BroadJump (cont.)
Rarick,
Dobbins, &Broadhead(1976)
Kane &Meredith(952)
Kane &
Meredith(1952)
Keogh(1965)
Keogh(1965)
Baumgartner& Jackson(1970)
Bolonchuk(1971)
within day,test-retest
correlationcoefficients
within day,test-retest,Pearson product-moment
between day,
test-retest,Pearson product-moment
between day,test-retest,Pearson product-moment
within day,test-retest,
Pearson product-moment
test-retest,ANOVA procedure(intraclasscorrelation)
Pearson product-momait, test-retest
278
Trials (t)Days (d)
4t
12t (best trial
and second besttrial)
12L - 2d (bestscore on bothdays)
3t 2d
2-6 weeks apart
3t (best andsecond bestused)
best trialgrouping from6 trials
3t
SampleRel.
Coef.
71 males ages 6-965 retarded males ages 10-1371 retarded males ages 6-974 femalepr.ges 6-961 retarded females ages 10-1364 retarded females ages 6-9
.8{*
.917
.947
.906
.953
.9*7'
300 males ages 7, 9, 11 .97-.99300 females ages 7, 9, 11 .98-.99
75 males age 7 .83
75 females age 7 .86
21 15t grade males & females .90
27 3rd grade males & females .77
Not given .91
95 Junior-high males .96
82 Senior-high males .97
20 Sth & 6th grade males .89
25 5th & 6th grade females .82
279

t
k 250
TABLE 5.4. (cont.)
Item Source ProcedureTrials (t)Days (d)
SampleRel.C
Standing Broad Avent between da. ,c - 2d 50 females ages 9-12 .68]
Jump (cont.) (1963) test-retef.,
Pearson product-moment
3-8 weeks apart
Anhalt(1958)
between day,
test-retest,Pearson 2roduct-moment
3t - 2d
1 week apart32 4th-Sth-6th grade females .913
Colgan between day, it - 2d 164 males ages 10-18 .81m
(1978) test-retestcorrelationcoefficients
1 week apart 162 females ages 10-18 .82f
Daquila(1982)
within day,
test-retest
3t -id SO normal males and femalesages 10-17 .96
(alpha
coefficients)50 visually impaired males and
females ages 10-17 .94
SO auditory impaired males andfemales ages 10-17 .98
21 orthopedically impaired malesand females ages 10-17 .99
Softball Throw(Distance)
Fleishman(1964b)
test-retest,
correlationcoefficients
no given 20,000 males ant femalesages 12-18 .93
Klesius(1968)
within day,test-retest
correlationcoefficientsbetween trials
3t 1S0 10th grade males ,90-.94
281

TABLE 5.4. (cont.)
Item Source ProcedureTrials (t)Days (d)
Softball T'trow Marmis, et(Distance) al. (1969)
(cont.)
Sit-Ups
282
Keogh(1965)
Bolonchuk(1971)
Daquila(1982)
Vodola(1978)
Klesius(1968)
Colgan(1978)
test-retest,
correlationcoefficients
Pearson product-moment, betweenday, test-retest
test-retest,Pearson product-moment
within day,test-retestalphacoefficients
test-retest,between day,
Pearson product-moment
test-retestcorrelationcoefficientsbetween trials
between day,Lest-retest,
correlationcoefficients
3t
3t 2d
2-6 weeks apart
3t
3t Id
It - 2d
lt - 2d1 day between
trials
lt - 2d1 week apart
SampleRel.
Coef.
1,122 males ages 9-18 .86-.94938 females ages 9-18 .83-.97
10 1st grade males & females .97
27 3rd grade males & females .88
20 5th & 6th grade males .94
25 5th & 6th grade females .93
SO normal males and femalesages 10-17 .95
50 visually impaired males andfemales ages 10-17 .99
SO auditory impaired males andfemales ages 10-17 .99
SO orthopedically impaired malesand females ages 10-17 .86
30 females age 15 .99
33 males age 15 .90
10 males age 7 .89
150 10th grade males .55-.68
164 males ages 10-18 .80m
162 females ages 10-18 .84f
283

TABLE 5,4. (cont.)
Item Source ProcedureTrials (t)Days (d)
SampleRel.
Coef.
SO-Yard Dash Klesius(1968)
test-retest,
correlationcoefficientsbetween trials
3t 150 10':n grade males .83-.88
Jackson 4 test-retest 2t ld 76 male physical education majors .949
Baumgartner ANOVA Procedures(1969) (intraclass
correlation)
Colgan between day, lt - 2d 164 males ages 10-12 94m
(1978) test-retestcorrelationcoefficients
1 week apart 162 females ages 10-18 .88f
Sit and Ra.ch Colgan between day, lt - 2d 164 males ages 10-18 .84m
(1978) test-retest 1 week apart 162 feaalas ages 10-18 .95f
Daquila(1982)
within day,test-retest
2t - ld SO normal males and femalesages 10-17 .99
(alphacoefficients)
SO visually impaired males andfemales ages 10-17 .93
SO auditory impaired males andfemales ages 10-17 .99
38 orthopedically impaired malesand females ages 10-17 .99
Long DistanceRun
Vodola(1978)
test-retest,between day
lt - 2d 90 males and females ages 14-17 ,80
Pearson product-moment
Doolittle& Bigbee(1968)
test-retest,
Pearson product-moment
lt - 2dS days apart
153 9th grade gales .94

TABLE 5.4. (cont.)
Source ProcedureTrials (t)Daya (d)
SampleRel.
Coef.Item
Long Distance Doolittle, test-retest lt - 2d 100 9th -10th grade females .89
Run (cont.) Dominic, & 45 9th grade females .89
Doolittle(1969)
Mile Run Colgan between day, lt - 2d 164 males ages 10-18 .96m(1978) test-retest
correlationcoefficients
1 week apart 162 females ages 10-18 .87f
286 287
,
NIAA

245
Jackson and Baumgartner (1969) reported an intraclass reliability coefficientof .949, Colgan (1978) reported correlation coefficients of .88 (females) and.94 (males), and Klesius (1968) reported correlation coefficients in the .80's.
The sit and reach has been studied by Colgan (1978). Colgan (1978)reported reliability coefficients of .84 for male subjects and .95 for femalesubjects. Daquila, using Project UNIQUE data, reported extremely high correla-tion coefficients. Daquila (1982) reported alpha coefficients of .98 and .99in the various major groups studied in Project UNIQUE. AAHPERD (1980) hasreported reliability coefficients of .70 or above in summarizing researchpertaining to the sit and reach test.
Based on the research of Colgan (1978); Vodola (1978); Doolittle andtigbee (1968); and Doolittle, Dominic, and Doolittle (1969), reliability coef-ficients for long distance runs are generally high (.80 to .96).
Validity
The validity of test items for the Project UNIQUE Physical Fitness Testwas determined in consideration of construct validity, criterion relatedvalidity, and logical validity. Construct validity was established as a partof Project UNIQUE and consisted of a factor analysis of test items in considera-tion of the various groups involved in the project. The results of this studywill be presented first in this section. Construct, criterion related, andlogical validity have also been determined on the basis of related literatureand research and is presented in the second portion of this section.
The principal component factor loadings (orthogonal solutions) pertainingto the test items selected for each group on the Project UNIQUE Physical FitnessTest are presented in Table 5.5. In Chapter IV, more detailed information ispresented pertaining to factor structure. In Chapter IV, Principal Component (PC),Rao Canonical (RAO), and alpha factoring are presented for orthogonal andoblique solutions for males and females using raw score as well as residualmatrices for the major subject groups in the study.
As may be noted from Table 5.5, the inclusion of recommended test itemsis generally supported by the obtained factor loadings. Factor loadings arehigh for most recommended items. This is particularly true of primary itemsas opposed to substitute items. Loadings for the skinfold measures, asrepresentative of body composition, are very high (.80 or above). The inclusionof the 50-yard dash appears justified as a measure of power-speed for normal andsensory impaired subjects based on factor loadings which fall between .65 and.83. The inclusion of the dash as a measure of power-endurance for orthopedicallyimpaired subjects is supported by factor loadings ranging from .53 to .90. Thesit-up test is recommended as a power-strength measure for normal and sensoryimpaired subjects. The data in Table 5.5 generally would seem to support thisdecision for boys, as four out of the six loadings are at .54 or higher. Theinclusion of sit-ups for girls is not supported by the data in Table 5.5;however, this item is also recommended for girls because it is an AAHPERD HealthRelated Physical Fitness Test item for girls and it generally loaded on otherpower-related components in the factor analysis. For cerebral palsied girls,the softball throw is recommended as an indicator of power-strength (.64-.69).Grip strength is selected to represent the power-strength component for cerebral
288

TABLE 5.5. PRINCIPAL COMPONENT FACTOR LOADINGS (ORTNAL SOLUTIONS) ONPROJECT UNIQUE PHYSICAL FITNESS TEST
Component/Test Item
Factor
246
Principal Coalmen'. Pri4cipal ComponentRaw Score Matrix Res:dual Matrix
Female Male Combined Femalc, Male Combined
BodyComposition
TricepsSkinfoldA .88 .81 .89 .81
.82 .82 .81 .84
C .86 .83 .86 .84
D .91 .90 .94 .96
C .82 .80
SubscapularSkinfoldA .84 .86 .84 .83
B .86 .86 .8S .85
C .87 .89 .87 .89
D .91 .83 .88 .84
E .88 .89
MuscularStrength/
Endurance
Power- :,0-Yard DashSpeed A .72 .65 .66 .83
.69 .72 .69 .79C .77 .73 .77 .71
Power-Endurance D .53 .89 .68 .90
E .82 .83
Power- Sit-UpsStrength A - - - .60B- .54 -
C - .56 - .54
Softball Throw(Distance)
D .64 .69
Right GripD .60
Left GripD .71 .49
(continued)
Legend; A - Normal SubjectsB - Auditory Impaired SubjectsC - Visually Impaired SubjectsD - Cerebral Palsied SubjectsE - Wheelchair Paraplegic Spinal Neuromuscular Subjects
289

247
TABLE 5.5. (cont.)
ractor Test ItemPrincipal ComponentRaw Score Matrix
Female Male Combint.a
Principal Component1.esidua1 Matrix
Fetufe Male Combined
Power- Arm Mang*Strength(cont.)
D .78 .77
Strength Right GripA .93 .91 .95 .P0
11 .94 .91 .94 .93C .85 .82 .90 .84
D .89 .82
E .79 .83
Left GripA .87 .93 .85 .91
I; .91 .8? .91 .85C .84 .85 .84 .91
I) .85 .74
.8() .79
Arn Mane *.58 .65
.()=.tball*Throb
(N stance)
E .61 .63
Oroad Jump *A .65
b .49 .68 .45
C -_.42
-
*recommended as a substitute item
Legend: A - %ormal subjects- Auditory Impaired Subjects
C - Visually Impaired Su:jects- Cerebral Palsied Subjects
t - Lbeelchair Paraplegic Spinal Neuromuscular Subjects
290

tA01.1. S.6. rm:rog LABELS BY GROdPS. dml1248
Factor Normal
Girls toys
AuditoryImpairee
Girls Boys
Visua!lvImpaired
Girls 134.1- :171:=1.-
Certbral
Nasy
!loye
Paraplegic/SpinalNouro-
muscularLheelchair
nody (X) (X) (X) (X) (X) (X) (X) (X) (X)
Composition
Strength (X) (X) (X) (X) (X) (X) (X) (X)
Power -Spec d (X) (X) (X) (X) (X) (X) (N)
Power- CO (I) (X) (X) (X) (X) (X) (X)
Strent;t4
Ouer- ( ) (X,X) (X)
Ladurince
flexioility/ X (X) (X)
Power -
indurance
Leg Raise (X)
X - raw score mat-ix
( ) - residual matrix
291.

249
palsied boys (three of the four loadings are .49 qr hAnet). The grip ,strengths
are recommended as measures of strength for all oth.-e groups of subjects(.74-.95). The use of the arm hang, softball thr.i4 f,r distance, and broad;limp as measures of strength or power-strength is leas defensible as determinedby factor loadings and, consequently, are recommended as substitute items only.
In addition to the components of the Project UtIQUE Physical FitnessTest presented in Table 5.5, cardiorespiratory eniulancc and flexibility arecomponents included within the test. The long distance run and the sit andreach test were selected to measure these components of physical fitness. Thefactor analysis employed in this study did not identify separate factors offlexibility and cardiorespiratory endurance. This could be due to the fact thatonly one test item was used to define each of these factors. With no otheritems hypothetically related to these constructs, it became especially difficultto extract these factors from the data. The fact that flexibility and cardio-respiratory endurance did not clearly emerge, therefore, was due, to a largeextent, to the absence of other items which may have helped to better definethese constructs. The items which comprise flexibility (sit and reach) andcardiorespiratory endurance (long distance run) did load, to some extent, onother factors. The sit and reach test emerged for normal, auditory, andvisually impaired girls on each factor which included the trunk raise and legraise. It was suggested that the emergence of this factor was due to flexibilitycomponents. The long distance run item loaded either on the power-speed orpower-strength factors. In addition to the cardiorespiratory demands of thetest, the long distance run makes demands on the muscular system as well. Thisis apparently a reason why the long distance run loaded on power-related factors,particularly in the absence of other cardiorespiratory items in the design.In the final analysis, the flexibility and cardiorespiratory components werenot supported or unsupported by the physical fitness factor analysis conductedir this study. Thus, they are selected and justified on the basis of pastresearch and logic. Detailed information on the factor structure of test itemsstudied in Project UNIQUE is presented in Chapter IV.
In addition to the factor analytic information presented in connectionwith Project UNIQUE data, justification for the selection of test items, interms of validity, may be found from related literature and research. In
regard to items pertaining to muscular strength/endurance, the validity of thegrip strength test as a measure of strength has-been supported by studies byRarick, Dobbins, and Broadhead (1976) and Fleishman (1964a, 1964b). Flint (1965),using electromyographic techniques, showed that the bent-knee sit-ups involvesaction of the abdominal nuscles, including the upper and lower rectus abdominusand the external and internal obliques. On the basis of her review of research,Safrit (1981) has reported that the standing broad jump has generally beenaccepted as an adequate measure of muscular power.
In regard to the softball throw for distance, the literature is lesssupportive. In regard to softball velocity as a test item, Rarick, Dobbins,and Broadhead (1976) founi that it was correlated moderately with the standinglong jump (.54 to .71) and the vertical jump (.51 to .62). Rarick, Dobbins,and Broadhead (1976) also indicated that the time dimension more accuratelyreflected the actual force applied to the ball than using distance informationonly. In collecting Project UNIQUE data, however, it was found to be extremelydifficult to measure time of throw and to determine the height of release. In
addition, computation of velocity in a field setting is much more laborious
2f

250
than simply recording distance. Also a reasonably hi e% reirrelation was foundbetween softball throw for distance and softball thrsw f.:r velocity usingProject UNIQUE data. Thus, the softball throw for lis:ant-e %;as selected inpreference to softball throw for velocity. Previous research by otherinvestigators have warned about the relatively lower perfomcnce of visuallyhandicapped youngsters in the softball throw and attribute this to a learningfactor. In view of this related research, softball throw for instance was notemployed as a test item for visually impaired subPictc. however, it was offeredas an alternative in the case of girls with cerebral palsy and individuals withcongenital anomalies who exhibited upper limb disabilities and who were requiredto throw from a seated position.
The SO-yard/meter dash was selected primarily on the basis of a logicalconsideration and the result of factor analysis of Project UNIQUE data. It hasin the past, been often selected as a speed item in notable tests of physicalfitness. In regard to the flexed arm hang, Cotton and Marwitz (1969) found acorrelation coefficient of .72 between the flexed arm hang and the pull-uptest. The disadvantage of the flexed arm hang as a test item appears to bethe fact that it is affected by one's weight. Because of this and some otherconsiderations, it is only suggested as an alternative item for boys withcerebral palsy, boys in the spinal neuromuscular groups, and for individualswith congenital anomalies/amputations who exhibit lower extremity involvement,but who are unable to, for one reason or another, take the grip strength tests.
Height and weight hare long been used as an indicator of body composition;however, it has been, well established that these measures fail to appropriatelytake into account fatness/leanness. In view of this, hydrostatic weighing hasbeen employed to more accurately determine body composition, and skinfold
measures have been used to predict body composition. Coefficients of correlationhave ranged from .70 to .90 when skinfolds have been correlated with hydrostaticweighing (AMMO, 1980).
The sit and reach test has been employed in the Project UNIQUE PhysicalFitness Test as a measure of extensibility in the low back and posterior thighsand has been labeled a flexibility test item. It has been reported that thesit and reach test has correlated highly (.80 to .90) with other tests offlexibility (AAHPERD, 1980). However, since flexibility is known to be specificto particular arqas of the body, validity of this test depends more on a logicalbasis than its relationship to criterion measures.
Although laboratory tests of aerobic capacity are preferred measures ofcardiorespiratory endurance, such tests are limited for use in field situations.Therefore, distance runs of up to 12 minutes have been studied to determinetheir relationship with the results of laboratory tests of aerobic capacity.The results of research indicate that long distance runs have correlated wellwith laboratory tests (AAHPERD, 1980).
Intercorrelations
One of the criteria that was employed in the selection of test items wasthat intercorrelations of test items be low. When this is the case, a
single test item provides more predictive information than when this is notthe case. Low intercorrelations among test items is enhanced when test items
293

r.
251
selected are found to measure different factors. 11ie ekction of test itemswith low intercorrelations was enhanced by the facto. a:.41ysis proceduresemployed in this study. The fact that this crite-Z,on 'Jac stisfactorily metin selection of items for the Project UNIQUE Phytical Fitness Test is demonstratedby the relatively low intercorrelations presented in Table 5.7.
294

TAbLE 5.7. INTIACORRELATIONS OF 'PEST ITEMS BY MAJOR SUBJECT GROUPS.
Test Itemand
Group
TricepsSkin-
fold
Subscap-ularSkin-fold
RightGrip
LeftGrip
AmNang
BroadJump
Soft-ballDis-tance
Sit-ups
SO-
YardDash
Sit and'Reach
ILong
tOstanceRun
TricepsSkinfold
A* - .75 -.15 -.14 -.32 -.26 - -.24 .25 .00 -.37
b* - .73 -.11 -.12 -.25 -.30 - -.24 .23 .08 -.30
C* - .75 .00 -.00 -.32 -.30 - -.18 .24 .02 -.25
D* - .78 .17 -.05 -.19 - -.15 - -.04 - .20
I:* - .82 .41 .35 -.10 - -.02 - -.03 - .03
SnbscapularSkinfold
A .75 - -.02 -.04 -.35 -.27 - -.27 .31 -.03 .30
B .73 - .06 .06 -.29 -.22 - -.25 .22 .07 -.26
C .75 - .15 .15 -.29 -.13 - -.16 .12 .et -.22
!I .78 - .17 .07 -.35 - -.06 - .1'2 - -.11
E .82 - .47 .44 -.08 - .16 - .09 - -.12
Right GripA -.15 -.02 - .95 .38 .66 - .46 -.60 .04 .47
L -.11 .06 - .94 .31 .69 - .37 -.52 .1E .36
C .00 .15 - .93 .32 .64 - .45 -.49 .14 .37
B .17 .17 - .78 .06 - .20 - .23 - .14
E .41 .47 - .91 .14 - .57 - -.11 I .?
Left GripA -.14 -.04 .05 - .40 .67 - .48 ..60 .34
,
B -.12 .0e .94 - .30 .66 - .3S -.51 .;.6 33
C -.00 .15 .93 - .34 .e3 - .44 -.51 .5 .38
D -.05 .07 .78 - .08 .33 .21 .18
E .35 .44 .91 - .24 - .S9 - -.12 - .20
*Legend: A - coefficients of correlation pertaining to normal subjects- coefficients of correlation pertaining to auditory impaired subjects
C - coefficients of correlation pertaining to visually impaired subjectsD - coefficients of correlation pertaining to cerebral palsied subjectsE - coefficients of correlation pertaining to paraplegic wheelchair spinal neuromuscular subjects
295 296

TABLE 5.1. cont.
Test Itemand
Grout.
TricepsSkin-fold
Subsea!).
ularSkin-fold
Right
tripLeft
GripArmHang
BroadJunp
Soft-ballDi a-
tance
Sit-
ups
50-
YardDash
Sit andReach
LongDistanceRun
Arm HangA* -.32 -.35 .38 .40 - .51 - .S0 -.47 .02 .52
B* -.25 -.29 .31 .30 - .52 - .46 -.37 .13 .49
C* -.32 .29 ".)- .34 - .50 - .41 -.33 .14 .44
D* -.19 -.35 .06 .08 - - .25 - -.05 - .41
E* -.10 -.0b .14 .24 - - .53 - .07 - .12
Broad Jump
A -.26 -.27 .66 .67 .51 - - .S7 -.71 .07 .55
B -.30 -.22 .69 .b6 .52 - - .52 -.59 .26 .52
C -.30 -.18 .64 .63 .50 - - .59 -.70 .20 .58
0 - - - - - - - - - - -
SoftballDistanceA- - - - - - - - - -
B - - - - - - - - - -C- - - - - - - - - - -
D -.15 -.06 .20 .33 .25 - - - -.42 - .49
L -.02 .16 .57 .59 -.35 - - - -.35 - 441
Sit-Ups I
A -.24 -.27 .46 .48 .50 .57 - - -.63 .07 .F.0
B -.24 -.25 .37 .35 .46 .52 - - -.51 .12 .41, I
C -.18 -.16 .45 .44 .41 .59 - - -.43 .20 .5oE- - - - _ - - . .
...-
*Legend: A - coefficients of correlation pertaining to normal subjectsB - coefficients of correlation pertaining to auditory impaired subjectsC - coefficients of correlation pertaining to visually impaired subjects
- coefficients of correlation pertaining to cerebral palsied subjectsE - coeffic ants of correlation pertaining to paraplegic wheelchair spinal neuromuscular subjects tg
ti4

Test Itemand
Group
TricepsSkin-fold
Subscap-ularSkin-fold
Right
Grip
Left
GripArmHang
BroadJump
Soft-ballDis-tance
Sit-ups
50-
YardDash
Sit andReach
Lon;DistanceRun
50-Yard DashA* .25 .31 -.60 -.60 -.47 -.71 - -.63 - -.08 -.58B* .23 .22 -.52 -.51 -.37 -.59 - -.51 - -.21 -.34C* .24 .l2 -.49 -.51 -.33 -.70 - -.43 - -.16 -.49D* -.04 .02 .23 .21 -.05 ' - -.42 - - - -.36E* -.03 .09 -.11 -.12 .07 - -.35 - - - -.49
Sit and ReachA .00 -.03 .04 .04 .02 .07 - .07 -.08 - .04
0 .08 .07 .18 .16 .13 .26 - .22 -.21 - .05C .02 .01 .14 .15 .14 .20 - .20 -.16 - .11D- - - - - - - - - - -E- - - - - - - - - - -
Long DistanceRun (Yards/Min.)
A -.37 .30 .47 .48 .S2 .55 - .55 .58 .04 -
B -.30 -.26 .36 .33 .49 .52 - .48 -.34 .05 -
C -.2S -.22 .37 .38 .44 .53 - .56 -.49 .11 -
D .20 -.11 .14 .18 .41 - .49 - -.36 - -
E .03 -.12 .29 .20 .12 - .44 - -.49 -
*Legend: A - coefficients of correlation pertaining to normal subjectsB - coefficients of correlation pertaining to auditory impaired subjectsC - coefficients of correlation pertaining to visually impaired subjectsD - coefficients of correlation pertaining to cerebral palsied subjectsE - coefficients of correlation pertaining to paraplegic wheelchair spinal neuromuscular subjects
299 300

Curricular Implications
One of the objectives of Project UNIQUE was to .dc.cify :urriculurimplications pertaining to physical fitness develoimeK of individuals withsensory and orthopedic impairments. In relationship to this objective,the development of :1 valid and reliable test of physical fitness is an importantimplication and has been discussed and presented in the previous section. In
this part, additional implications will be presente0. Tbb PCCATICP, the curricular
implications to be presented pertain to (1) commonality of factor structure,(2) levels of physical fitness, (3) type and severity of handicapping condition,(4) age, (S) sex differences, (6) educational setting, (7) individualization,(8) educational responsibility, and (9) training materials.
Commonality of Factor Structure
Within the limitations of this study, it is clear that the factor structureof physical fitness of sensory or orthopedically impaired children and youthdoes not differ, to a great extent, from that identified for normal individuals.The fact that the factor structure of physical fitness abilities is similarmeans that the general curricular orientation pertaining to physical fitnessmay be similar. For all groups, attention needs to be given to body composition,muscular strength/endurance, flexibility, and cardiorespiratory endurance. In
cases where satisfactory performance exists, attention must be given to main-taining and improving these components of fitness. Where deficits exist,attention should be given to bringing individuals to appropriate levels.
Levels of Physical Fitness
Although the factor structure of physical fitness is similar for all themajor groups involved in the study, there is little question that individualswith handicapping conditions generally fall below the performance of individualsclassified as normal. An implication of this finding is that it is necessary,at times, to begin physical fitness development programs for the handicappedat very basic levels. In certain instances, it will be necessary to prepareindividuals to move through the environment. This may begin with the simpletask of moving from a lying to a standing position or maintaining standingbalance. Following this beginning, attention can then be given to helping theindividual move through the environment. Subsequently, attention can be givento sustaining movement through the environment. Once the individual has thebasic physical fitness necessary to move through the environment for relativelysustained periods of time, attention can be given to quality of movement,increasing the repertoire of movement capabilities, and enhancing optimaldevelopment of the individual. Although individuals low in fitness may need toengage in less intense activities at the beginning levels of programming,provisions may need to be made to increase the frequency of opportunities tomove and to move for relatively longer periods of time. The latter twoadjustments may be required to compensate for the lower intensity of programs.
Influence of Handicapping Conditions andSeverity of Handicapping Conditions
The results of the study clearly indicate physical fitness differencesbetween subjects with handicapping conditions and normal subjects. In the caseof auditory impaired subjects, differences with normal subjects were less in
3oi

256
degree and number than in the case of other groups l.. zerms of physical fit-
ness, individuals with auditory impairments generally wi:1 not possess uniqueneeds requiring separation from regular programming (wac,rtwlately, this studyfound that individuals in integrated settings perl'orm at !owe' levels inphysical fitness than those who are institutionalized). Individuals withvisual or orthopedic impairments, as a group, will more frequently haveunique needs requiring specially designed programs.
Based on this study, it appears that individuals with orthopedic impairments,in particular, need physical education programs in which physical fitness isgiven more attention. The need for physical activity is necessary to preventatrophy, bone deformities, etc., to enhance mobility, and simply to enhancehealth. Although individuals with orthopedic impairments need physical activityto a greater extent than other persons (based on their relatively low performancescores), they evidently receive less than others. In addition, it appears thatin cases where physical education is provided for individuals with orthopedicimpairments, ifisufficient attention is apparently given to the developmentof physical fitness.
In terms of severity of handicapping condition, the results of this studyindicate that partially sighted subjects exceeded the performance of individualswho are blind, and more severely afflicted subjects with cerebral palsy per-fored less aptly on physical fitness test items than individuals with lesserinvolvement. No significant differences were generally found between hard ofhearing and deaf participants on the Project UNIQUE Physical Fitness test items.In view of these results, type and severity of handicapping condition needsto be considered in physical fitness performance in the case of individualswith visual or orthopedic impairments. Less attention to these factors needsto be given relative to individuals with auditory impairments.
Age as a Factor in Performance
On the basis of the results of this study, it is recommended that age beconsidered as an influencing factor on the performance of physical fitnesstest results in the case of normal subjects, auditory impaired subjects, andvisually impaired subjects. With the exception of the skinfolds, age did notplay as great a role on physical fitness test items in the case of subjectswith orthopedic impairments. In the case of skinfold measurements, age shouldbe considered for subjects with orthopedic impairments as well. The resultsof the study indicate that where age is a factor, performance generally improveswith age; although in some cases, girls tended to plateau at about ages 12 to 14.Another consideration is the rate of improvement between boys and girls. Boystend to increase in their performance from the ages 10 to 17, and their rateof improvement is greater than for girls in certain test items. In regard toskinfolds, it is clear that skinfolds generally increase with age; however, anincrease in skinfolds at a particular age does not necessarily indicate ahigher percent. of body fat.
In view of the results that were attained relative to age influences onphysical fitness performance, it is necessary to consider age when developingnormative data for tests of physical fitness. In addition, program implementersmust consider age in prescribing duration, frequency, and intensity of activity.
302

257
In activities where physical fitness performance is a
it is necessary
to consider the age of participants.
In view of the :frtatf..n tendency relative
to girls, it may be necessary to give greater attent,.on
ionroving the
physical fitness performance of girls starting at pge t2.
Sex Difference and Performance
Sex was found to e a significant factor on mo;t physi..41 fitress test
items for most subject groups.
In the case of norma1, auditory impaired, and
visually impaired subjects, girls were found to have significantly larger
skinfolds than boys and higher sit and reach scores than boys.
In other areas
of performance, boys generally exceeded the performance of girls.
In the case
of subjects with orthopedic impairments, fewer significant sex differences
were found.
Since sex differences in performance do exist, sex differences in
performance must be considered in selecting test items for the measurement of
physical fitness; in the norms provided for physical fitness tests; and level,
duration, and intensity of physical activity in programs.
In view of the results
of this study, grouping individuals on the basis of sex may be warranted in
cases where physical fitness performance is a factor.
Sex differences also
support the need to individualize and personalize programs.
Physical Fitness and Educational Setting
In this study, individuals who were institutionalized exceeded the per-
formance of those who were non - institutionalized on physical fitness test items
where differences existed.
Results pertaining to the sensory impaired indicated
that subjects from institutionalized settings were generally superior to the
non-institutionalized group where significant differences on test items
occurred.
In regard to individuals with orthopedic impairments, educational
environment was not a factor in the performance of the orthopedic subgroups on
physical fitness items administered to them.
Since more severely involved
individuals are, at least theoretically, placed in institutionalized settings,
the results of this study are enlightening.
Certainly, the finding that
individuals in institutions exceeded the performance of individuals who are
non-institutionalized cannot be considered acceptable educational performance
by non-institutionalized schools and agencies 'ducating individuals with
handicapping conditions.
Unfortunately, the procedures of the study do not
enable the investigators to account for these differences.
However, it is
suspected that availability of physical education, the emphasis within the
physical education programs, intramural and athletic opportunities, and staffing
influenced these results.
In addition, the results may be due to inappropriate
placement.
Unfortunately, further study will be needed in order to definitively
account for the results.
The one implication that appears to be warranted is
that more attention should be given to the improvement of physical fitness in
non-institutionalized settings.
Individualization
The need for individualization is clearly evident from the results
obtained in this study.
Individuals with handicapping conditions frequently
are below normal performance in physical fitness, perform physical activities
in different ways than is characteristic of normal individuals, and exhibit
greater variability in performance.
The variability in performance of subjects
with handicapping conditions is particularly acute in the case of individuals
with orthopedic impairments.
303

258
The education of individuals with handicapping coWtie,ns NOM be consideredon a one-to-one basis. It is not appropriate, for ea:: lc. to simply adapt a
physical fitness test for cerebral palsied individuals :td assume that itwill be applicable to all such individuals. In selecting test items, forexample, it is necessary to consider the abilities and disabilities of eachperson. For example, although the grip strength test is a recommended testitem, it may be inappropriate for individuals who hlvcs liiiiuides in inhibiting
the grasp reflex. Even though the grip strength is a test recommended for usefor certain individuals with congenital anomalies, it may be inappropriateas a test in those cases where the individual may not be able to properlygrasp the grip dynamometer. Although the softball throw may be a recommendedtest item for individuals with cerebral palsy, it may be very inappropriate ifthe participant is not able to release the ball properly.
Recognition of Physical Fitnessas an Educational Responsibility
Project UNIQUE results generally show lower levels of physical fitness forindividuals with handicapping conditions. This is particularly true in thecase of individuals with orthopedic impairments. Although the relatively poorperformance of individuals with orthopedic impairments can be documented, the
reasons for this result can only be speculated. Although individuals in
Project UNIQUE samples were generally receiving physical education, it appearsthat the physical education that was provided did not include a great deal ofattention to the development of physical fitness. It may be that one of thereasons for this was the perception that the development of physical fitnesswas not the responsibility of the teacher of phySical education. This possibilityexists even though physical fitness is considered as a part of physicaleducation, and it is accepted that physical fitness development includesdevelopment of muscular strength/endurance, flexibility, and cardiorespiratoryendurance.
If it is recognized that physical fitness is the responsibility of thephysical educator, then physical educators must be prepared to implement suchprograms. Physical educators know the basic principles of development ofphysical fitness for normal individuals. However, teachers of physical educationare often not prepared to provide the modifications necessary to implementeffective programs for the handicapped, particularly for individuals withorthopedic impairments. Space does not permit an exhaustive treatment of thissubject here; however, a couple of examples might suffice. First, physical
educators need to be able to determine the flexibility potential of individualswho exhibit contractures or be able to implement flexibility programs under
medical supervision. Physical educators must be educated so they are able toplan programs which do not overdevelop opposing muscle groups. Thus, for examp1.4
physical educators need to realize that the elbow flexors of individuals withcerebral palsy must not be overdeveloped in relationship to the extensors, eventhough the strength of the elbow flexors may be below that of normal individuals.Implementers of physical education programs must be aware that it is notadequate to simply ask a cerebral palsied individual who is spastic to moveas fast as possiblJ, but to realize the effect of such instruction on performanceand the need to emphasize controlled, purposeful movement and, at the same time,improve speed of movement.
304

259
Another consideration which will enhance the Ovsicil fitness of indivi-duals with handicapping conditions is to know the ros atu responsibility ofeach member of a multidisciplinary team in the devciopri.ni. 0Z physical fitness.In the case of teachers of physical education, it is r.xtrtmely important toknow their role and relationship to physical therapists, occt;pational therapists,and other individuals who have some indirect or direct responsibility for thedevelopment of physical fitness of individuals. Closer cooperatitm needs to beexhibited between physical educators and medical perst.Doei.
Need for Training Materials
In discussing implications eminating from Project UNIQUE, it has beenmentioned that there is a need for individuals to begin programs at the basiclevel of fitness exhibited by each individual, to select and modify appropriateactivities for the development of fitness, to follow and modify principles ofphysical development, as appropriate, and to know the role and responsibilityof individuals involved in physical fitness development of individuals withhandicapping conditions. In order to help teachers and other individuals todevelop the physical fitness of individuals with handicapping conditions involvedin this study, a training manual (appearing as an appendix under separate cover)has been developed by the Project UNIQUE staff. In essence, the training manualprovides an overview of physical fitness, principles of development which arerecommended for normal populations, a description of handicapping conditionsinvolved in the present study, and how the principles of development should bemodified for sensory and/or orthopedically impaired children and youth. It isadvised that teachers use this manual in connection with the Project UNIQUEPhysical Fitness Test so that they will be better able to provide servicesnecessary to improve the physical fitness of youngsters with handicappingconditions.
305

260
BIBLIOGRAPHY
American Alliance for Health, Physical Education, and Recreation. Special
Fitness Test Manual for Mildly Mentally Retarded Persona. Washington,D.C.: American Alliance for Health, Physical Education. and Recreation,1976.
American Alliance for Health, Physical Education, Recreation, and Dance.Lifetime Health Related Ph sical Fitness Test Manual. Reston, Va.:American Alliance or Pealth, Physical Education, Recreation, and Dance,1980.
Anhalt, C. J. "A Reliable and Vali4 Motor Fitness Test Battery for UpperElementary School Girls," Unpublished Mister's Thesis, University ofOregon, 1958
Arnheim, D. D.; D. Auxter; and W. C. Crowe. Principles and Methods ofAdapted Physical Education. St. Louis: C. V. Mosby Co., 569.
Avant, H. H. "Tests of Static and Dynamic Strength for Girls Nine ThroughTwelve Years Old," Unpublished Doctoral Dissertation, Indiana University, 1963(University Microfilms, 1963)
Banks*, K. M. Measuring Functional Motor Rehabilitation of Cerebral PalsiedInfants and Young Children. Rehabilitation Literature, 39:111-116, 1978.
Baumgartner, T. A. and A. S. Jackson. Measurement Schedules for Teats ofMotor Performance. Research Quarterly., 41:10-14, 1970.
Berg, K. Effect of Physical Training of School Children with CerebralPalsy. Acta Paediatrica Scandinavica, Suppl. 204:27-33, 1970.
Berg, K. Remarks on Physical Training of Children with Cerebral Palsy.Acta Paediatrica Scandinavica, Suppl. 217:10b -107, 1971.
Berg, K. and J. Bjure. Methods for Evaluation of the Physical WorkingCapacity of School Children with Cerebral Palsy. Acta PaediatricaScandinavica, Suppl. 204:15-26, 1970.
Berg, K. and B. Isaksson. Body Composition and Nutrition of School Childrenwith Cerebral Palsy. Acta Paediatrica Scandinavica, Suppl. 204:41-52, 1970.
Bleck, E. E. Orthopedic Management of Cerebral Palsy. Philadelphia:W. B. Saunders, 1979.
Bobath, K. and B. Bobath. The Neuro-Developmental Treatment of CerebralPalsy. Physical Therapy, 47:1039-1041, 1967.
Bolonchuk. W. W. A Critical Analysis of the AAHPER Youth Fitness Test.ERIC Document Reproduction Service No. ED 19S 414, 1971.
306

261
Brown, A. Review: Physical Fitness and Cerebral .'ais%. Cidld: Caret.
Health and Development, 1:143-152, 1975.
Buell, C. E. "Motor Performance of Visually Handicaprdd Children,"Unpublished Doctoral Dissertation, University or Califcrnta, Berkeley,
1950a.
Buell, C. E. Motor Performance of Visually HandicEopd Children. Journalof Exceptional Children, 17:69-72, 195.0b.
Buell, C. E. Physical Education for Blind Children. Springfield,Charles C. Thomas, Publishers 1966.
Buell, C. E. l'ildreatioilsicaleducatimaltfortheVisuallHandicatped.Washington, D.C.: 3.ciAmeitAssociatio.and Recreation, 1973.
Colgan, S. N. "A Comparative Study of the American Alliance of Health,Physical Education, and Recreation Youth Fitness Test and a ProposedFitness Test," Master's Thesis, University of Missouri at Columbia, 1978.
Daquila, G. A. "Reliability of Selected Health and Performance Related TestItems from the Project UNIQUE Physical Fitness Test Battery," UnpublishedMaster's Thesis, State University of New York, College at Brockport,
1982.
Dobbins, D. A. and G. L. Rarick. Structural Similarity of the Motor Domain ofNormal and Educable Retarded Boys. Research Quarterly, 46:4:7-456,_1975.
Doolittle, T. L. and R. Bigbee. The Twelve-Minute Run-Walk: A Test ofCardiorespiratory Fitness of Adolescent Boys. Research Quarterly,39:491-495, 1968.
Doolittle, T. L.; J. C. Dominic; and J. Doolittle. The Reliability of SelectedCardiorespiratory Endurance Field Tests with Adolescent Female Population.American Corrective Therapy Journal, 23:135-138, 1969.
Edington, D. W. and V. R. Edgerton. The Biology of Physical Activity.
Boston: Houghton Mifflin Co., 1976.
Fait, H. F. Special Physical Education--Adapted, Corrective, Developmental.Philadelphia: W. B. Saunders, 1972.
Ferguson, G. A. Statistical Analysis in Psychology and Education. New York:
McGraw-Hill, 1971.
Final Regulations of Education of Handicapped Children, Implementationof Part B of the Education of the Handicapped Act. Federal Register,42:163 (Part II), August 23, 1977.
Fleishman, E. A. The Structure and Measurement of Physical Fitness.
Englewood Cliffs, N.J.: Prentice-Hall, 1964a.
307

262
Fleishman, E. A. Examiner's Manual for the Basic FitresIests. Englr.wood
Cliffs, N.J.: Prentice-Hall, 1964b.
Flint, M. 1. An Electromyographic Comparison of the runction of the Iliacusand Rectus Abdominus Muscles. Journal of the American Physical TherapyAssociation, 45:248-253, 1965.
Frisina, D. R. "A Psychological Study of the Menti.11,* Retarded Child,"Unpublished Doctoral Dissertation, Northwestern University, Evanston,1955.
Harmon, H. H. Modern Factor Analysis. Chicago: University of ChicagoPress, 1967.
Harris, M. and C. W. Harris. A Factor Analytic Interpretation Strategy.Educational and Psychological Measurement, 31:589-606, 1971.
Harris, C. W. and H. F. Kaiser. Oblique Factor Analytic Solutions byOrthogonal Transformations. Psychometrika, 39:34 -362, 1964.
Healy, A. "A Comparison of Two Methods of Weight Training for Children withSpastic Type of Cerebral Palsy," Unpublished Master's Thesis, StateUniversity of Iowa, 1957.
Jackson, A. S. and T. A. Baumgartner. Measurement SoJules of SprintRunning. Research Quarterly, 40:708-711, 1969.
Jackson, A. S. and R. J. Frankiewicz. Factorial Expressions of MuscularStrength. Research Quarterly, 46:206-217, 1975.
Kaiser, H. F. The Varimax Criterion for Analytic Rotation in Factor P.alysis.Psychometrika, 23:187-200, t958.
Kaiser, H. F. and J. Caffrey. Alpha Factor Analysis. Psychometrika,
30:1-14, 1965.
Kane, R. J. and H. V. Meredith. Ability in the Standing Broad Jump ofElementary School Children 7, 9, and 11 Years of Age. ResearchQuarterly, 23:198-208, 1952.
Keogh, J. Motor Performance of Elementary School Children. Los Angeles:Physical Education Department, University of California at Los Angeles,1965.
Klesius, S. E. Reliability of the AAHPER Youth Fitness Test Items andRelative Efficiency of the Performance Measures. Research Quarterly,39:809 -811, 1968.
Long, J. A. Motor Abilities of Deaf Children. New York: %,6 Press, Inc.,1972 from the edition New York: Bureau of Publications, Teachers College,Columbia University, 1932.
308

263
Marais, C.; H. J. Montoye; D. A. Cunningham; and A. Roz-.r. Reliability of theMulti -Trial Items of the AAHPER Youth Fitness Research Quarterly,40:240-245, 1969.
Aleditch, C. "Effectiveness of Two Methods of Weight Training for Childrenwith Athetoid Type of Cerebral Palsy," Unpublished Master's Thesis,State University of Iowa, 1961.
Morsch, J. E. Motor Performance of the Deaf. Comparative PsychologicalMonographs, 13:1-51, 1936.
Myklebust, H. R. Auditory Disorders in Children. New York: Grune $ Stratton,Inc., 1954.
Myklebust, H. R. The Psychology of Deafness. New York: Grune $ Stratton,inc., 1964.
National Association of Sports for Cerebral Palsy. Constitution, Rules
Classification and National Records Sports Manual. New Haven, Conn.:National Association of Sports for Cerebral Palsy, 1979.
Nie, N. H. et IL Statistical Package for the Social Sciences. New York:
McGraw-Hill, Inc., 1975.
Norris, M.; P. J. Spaulding; and F. H. Brodie. Blindness in Children.Chicago: University of Chicago Press, 1957.
National Wheelchair Athletic Association. Constitution and Bylaws of theNational Wheelchair Athletic Association. Woodside, N.Y.: NationalUmeldhair Athletic Association, 1979.
Rao, C. R. Estimation and Tests of Significance in Factor Analysis.Psychometrika, 20:93-111, 1955.
Rarick, G. L. and D. A. Dobbins. Basic Components in the Motor Performanceof Educable Mentally RetardedMaren: Implications for curaWEIV-Development. Berkeley, Calif.: Department orPITTUal Uucation,University of California, 1972.
Rarick, G. L.; D. A. Dobbins; and G. D. Broadhead. The Motor Domain and ItsCorrelates in Educationally Handicapped Children. Englewood Cliffs,N.J.: Prentice-Hall, 1976.
Rarick, G. L. and J. P. McQuillan. The Factor Structure of Motor Abilitiesof Trainable Mentally Retarded children: Implications for CurriculumDevelo meet. Final1Report, Project No. H23-2544, for the Department ofHealth, E ucation, and Welfare, U.S. Office of Education, Bureau ofEducition for the Handiuopped, Berkeley, Calif.: Department of PhysicalEducation, University of California, 1977.
Robson, P. Cerebral Palsy and Physical Fitness. Developmental Medicine andChild Neurology, 14:811-813, 1972.
309

264
Royer, D. The Applications of Aerobic and Anaerobiet Trd:nicg to Wheelchair
Athletes. In Steadward, R. D. (ed.) Proceeding f the First Inter-national Conference on Sport and TraininEWTS* Iltsicull Disabled
Athlete. Department of Physical Education, Utaersit; a 4 erta, 1979.
Writ, M. J. Evaluation in Physical Education. Englewood Cliffs, N.J.:Prentice -Hail, 1981.
Stein, J. U. Motor Function and Physical Fitness of the Mentally Retarded: ACritical Review. Rehabilitation Literature, 24:230-242, 1963.
Vodola, T. M. Develo mental and Ada ted Ph sical Education (A.C.T.I.V.E.Motor Ability an s ca fitness rms: or ormal, Mentally Retarded,Learning Disabled, and Emotionally Disturbed Individuals). Oakhurst,N.J.: Township of Ocean School District, 1978.
Winnick, J. P. Early Movement Experiences and DevelopmentHabilitation andRemediation. Philadelphia: X. 8. Saunders, 1979.
310

265
APPENDIX ACONDITION CODES
311

266
CONDITION CODES
Listed below are the categories by which subjects were ca.assified. Testerswere instructed to use the major headings to locate the genrpa condition asubject possessed and then to find th: specific condition that ant accuratelyidentified the condition of the subjezt. Testers vert riaiLher ItLatructed toassign only one three-digit condition code for each, It '.as suggestedto testers that in the event two or more codes seemed appropriate for a givensubject, the subject was probably multiply handicapped and ineligible for thestudy.
I. NON-IMPAIRED
001 = non-impaired
II. AUDITORY IMPAIRED
010 = auditory - hard of hearing011 = auditory - deaf
III. VISUALLY IMPAIRED
020 a partially sighted - congenital021 = partially sighted - onset birth to age 6022 = partially sighted - onset past age 6023 = totally blind - congenital024 = totally blind - onset birth to ace 6025 = totally blind - onset past age 6
IV. ORTHOPEDIC IMPAIRED
ORTHOPEDIC AMPUTEE
For the purpose of this study, an orthopedic amputee was defined assubjects who have a congenital or acauirpd amputation of a limb or a limbpart.
A. ORTHOPEDIC ACQUIRED AMPUTEE
ORTHOPEDIC ACQUIRED AMPUTEE - ONE-ARM INVOLVEMENT
030 = finger hand amputation031 = below elbow amputation032 = above elbow amputation033 = shoulder disarticulation
ORTHOPEDIC ACQUIRED AMPUTEE - TWO-ARM INVOLVEMENT
034 = finger hand/finger hand amputation035 = finger hand/below elbow amputation036 = finger hand/above elbow amputation037 = finger hand/shoulder disarticulation038 = below e.bougbelov elbow amputation039 = below elbow/above elbow amputation040 m below elbow/shoulder disarticulation
312

041 = above elbow/above elbow amputation042 = above elbow/shoulder disarticulation043 = shoulder/shoulder disarticulation
ORTHOPEDIC ACQUIRED AMPUTEE - ONE-LEG INVOLVEMENT
044 it foot amputation045 = below knee amputation046 = above knee amputation047 = hip disarticulation
ORTHOPEDIC ACQUIRED AMPUTEE - TWO-LEG INVOLVEMENT
048 = foot/foot amputation049 = foot/below knee amputation050 = foot/above knee amputation051 = foot/hip disarticulation052 = below knee/below knee amputation053 = below knee/above knee amputation054 = below knee/hip disarticulation055 = above knee/above knee amputation056 = above knee/hip disarticulation057 = hip/hip disarticulation
ORTHOPEDIC ACQUIRED AMPUTEE - ONE-ARM/ONE-LEG INVOLVEMENT
058 = finger hand/foot amputation059 = finger hand/below knee amputation060 = finger hand/above knee amputation061 = finger handftip disarticulation062 = below elbow/foot amputation063 = belou elbow/below knee amputation064 = below elbow/above knee amputation065 = below elbow/hip disarticulation066 = above elbow/foot amputation067 = above elbow/below knee amputation068 = above elbow/above knee amputation069 = above elbow/hip disarticulation070 = shoulder/foot amputation071 = shoulder/below knee amputation072 = shoulder/above knee amputation073 = shoulder/shoulder disarticulation
ORTHOPEDIC ACQUIRED AMPUTEE - TRIPLEGIC INVOLVEMENT
074 = 2 legs/right arm involvement075 = 2 legs/left arm involvement076 = 2 arms/right leg involvement077 = 2 arms/left leg involvement
ORTHOPEDIC ACQUIRED AMPUTEE - WADRIPLEGIC INVOLVEMENT
078 = 4 limb involvement
313
267
ti
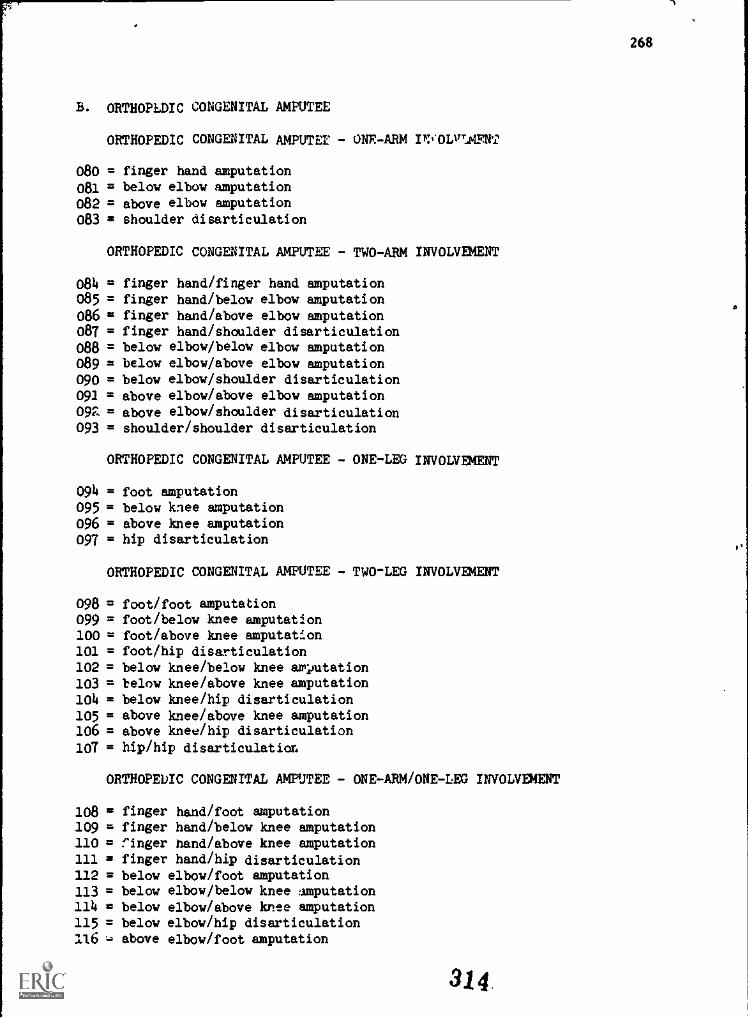
B. ORTHOPEDIC CONGENITAL AMPUTEE
ORTHOPEDIC CONGENITAL AMPUTEr - ONE-ARM In,'OLvLONT
080 = finger hand amputation081 = below elbow amputation082 = above elbow amputation083 = shoulder disarticulation
ORTHOPEDIC CONGENITAL AMPUTEE - TWO-ARM INVOLVEMENT
084 = finger hand/finger hand amputation085 = finger hand/below elbow amputation086 = finger hand/above elbow amputation081 = finger hand/shoulder disarticulation088 = below elbow/below elbow amputation089 = below elbow/above elbow amputation090 = below elbow/shoulder disarticulation091 = above elbow/above elbow amputation09P. = above elbow/shoulder disarticulation093 = shoulder/shoulder disarticulation
ORTHOPEDIC CONGENITAL AMPUTEE - ONE-LEG INVOLVEMENT
094 = foot amputation095 = below knee amputation096 = above knee amputation097 = hip disarticulation
ORTHOPEDIC CONGENITAL AMPUTEE - TWO-LEG INVOLVEMENT
098 = foot/foot amputation099 = foot/below knee amputation100 = foot/above knee amputation101 = foot/hip disarticulation102 = below knee/below knee amputation103 = below knee/above knee amputation104 = below knee/hip disarticulation105 = above knee/above knee amputation106 = above knee/hip disarticulation107 = hip/hip disarticulation
ORTHOPEDIC CONGENITAL AMPUTEE - ONE-ARM/ONE-LEG INVOLVEMENT
108 n finger hand/foot amputation109 = finger hand/below knee amputation110 = finger hand/above knee amputation111 = finger hand/hip disarticulation112 = below elbow/foot amputation113 = below elbow/below knee amputation224 = below elbow/above knee amputation115 = below elbow/hip disarticulation116 3 above elbow/foot amputation
314.
268

117 = above elbow/below knee amputation118 = above elbow/above knee amputation119 = above elbow/hip disarticulation120 = shoulder/foot amputation121 = shoulder/below knee amputation122 = shoulder/above knee amputation123 = Ot:Ailder/hip disarticulation
ORTHOPEDIC CONGENITAL AMPUTEE - TRIPLEGIC INVOLVEMENT
124 = 2 legs/right arm involvement125 = 2 legs/left arm involvement126 = 2 arms/right leg involvement127 = 2 arms/left leg involvement
269
ORTHOPEDIC CONGENITAL AMPUTEE - QUADRIPLEGIC INVOLVEMENT
128 = 4 limb involvement
C. ORTHOPEDIC CONGENITAL ANOMALIES
Subjects identified as possessing congenital anomalies were individualswhose extremities were fully or partly present and were deformed.
ORTHOPEDIC CONGENITAL ANOMALIES - ONE-ARM INVOLVEMENT
130 = finger hand involvement131 = below elbow involvement132 = above elbow involvement133 = shoulder site
ORTHOPEDIC CONGENITAL ANOMALIES - TWO ARM INVOLVEMENT
134 = finger hand/finger hand involvement135 = finger hand/below elbow involvement136 = finger hand/above elbow involvement137 = finger hand/shoulder site138 = below elbow/below elbow involvement139 = below elbow/above elbow involvement140 = below elbow/shoulder site141 u above elbow/above elbow involvement142 = above elbow/shoulder site143 = shoulder site/shoulder site
ORTHOPEDIC CONGENITAL ANOMALIES - ONE-LEG INVOLVEMENT
144 = foot involvement145 = below knee involvet=t146 st above knee involvement147 u hip site
315

270
ORTHOPEDIC =GENITAL ANOMALIES - TWO-LEG THVfa%Er.liT
148 = foot/foot involvement119 = foot/below knee involvement150 = foot/above knee involvement151 = foot/hip site152 = below knee/below knee involvement153 = below knee/above knee involvement154 = below knee/hip site155 = above knee/above knee involvement156 = above knee/hip site157 = hip site/hip site
ORTHOPEDIC CONGENITAL ANOMALIES - ONE-ARM/ONE-LEG INVOLVEMENT
158 = finger hand/foot involvement159 = finger hand/below knee involvement160 = finger hand/above knee involvement161 = finger hand/hip site162 = below elbow /foot involvement163 = below elbow/below knee involvement164 = below elbow/above knee involvement165 = below elbow/hip site166 = above elbow/foot involvement167 = above elbow/below knee involvement168 = al.;:re elbow/above knee involvement
169 = above elbow/hip site170 = shoulder site/foot involvement171 = shoulder site/below knee involvement172 = shoulder site/above knee involvement173 = shoulder site/shoulder site
ORTHOPEDIC CONGENITAL ANOMALIES - TRIPLEGIC INVOLVEMENT
174 = 2 legs/right arm involvement175 = 2 legs/left arm involvement176 = 2 arms/right leg involvement177 = 2 arms/left leg involvement
ORTHOPEDIC CONGENITAL ANOMALIES - QUADRIPLEGIC INVOLVEMENT
178 = 4 limb involvement
D. ORTHOPEDIC CEREBRAL PALSIED
Cerebral palsy was defined as a disorder characterized by disturbancesin voluntary motor functioning resulting from lesions in the brain that affect themotor control centers.
ORTHOPEDIC CEREBRAL PALSIED - SPASTIC
180 = monoplegic - right arm181 = monoplegic - left arm182 = monoplegic - right leg183 = monoplegic - left leg
316

271
184 = diplegic - major involvement in lower 1:e 6s r.id Ainor involvementin upper limbs
185 s triplegic - right arm, left arm, right leg186 = triplegic - right arm, right leg, left leg
triplegil - left arm, right leg, left leg188 = triplegic - right arm, left arm, left leg189 = hemiplegic - right arm, right leg190 a hemiplegic - left arm, left leg191 = paraplegic - right leg, left leg192 = quadriplegic - all four extremities - partial or complete
ORTHOPEDIC CEREBRAL PALSIED - ATHETOID
200 = monoplegic - right arm201 = monoplegic - left arm202 * monoplegic - right leg203 = monoplegic - left leg204 = diplegic - major involvement in lower limbs and minor involvement
in upper limbs205 = triplegic - right arm, left arm, right leg206 = triplegic - right arm, right leg, left leg207 = triplegic - left arm, right leg, left leg208 = triplegic - right arm, left arm, left leg209 = hemiplegic - right arm, right leg210 = hemiplegic - left arm, left leg211 a paraplegic - right leg, left leg212 quadriplegic - all four extremities - partial or complete
ORTHOPEDIC CEREBRAL PALSIED - TREMOR
220 = monoplegic - right arm221 a monoplegic - left arm222 monoplegic - right leg223 = monoplegic - left leg224 = diplegic - major involvement in lower limbs and minor involvement
in upper limbs225 = triplegic - right arm, left arm, right leg226 or triplegic - right arm, right leg, left leg227 = triplegic - left arm, right leg, left leg228 = triplegic - right arm, left arm, left leg229 * hemiplegic - right arm, right leg230 = hemiplegic - left arm, left leg231 = paraplegic - right leg, left leg232 = quadriplegic - all four extremities - partial or complete
ORTHOPEDIC CEREBRAL PALSIED - RIGIDITY
240 = monoplegic - right arm241 a monoplegic - left arm242 = monoplegic - right leg243 = monoplegic - left leg244 = diplegic - major involvement in lower limbs and minor involvement
in upper limbs
317

245 = triplegic - right arm, left are, right leg246 0 triplegic - right arm, right leg, left leg247 0 triplegic - left arm, right leg, left leg248 * triplegic - right arm, left arm, left leg2$ 0 hemiplegic - right arm, right leg250 0 hemiplegic - left arm, left leg251 = paraplegic - right leg, left leg252 0 quadriplegic - all four extremities - pe..tia] or .:amplete
ORTHOPEDIC CEREBRAL PALSIED - ATAXIC
260 0 monoplegic right arm261 = monoplegic - left arm262 * monoplegic - right leg263 0 monoplegic - left leg264 0 diplegic - major involvement in lower limbs and minor involvement
in upper limbs265 0 triplegic - right arm, left arm, right leg266 0 triplegic - right arm, right leg, left leg267 0 triplegic - left arm, right leg, left leg268 0 triplegic right arm, left arm, left leg269 = hemiplegic - right arm, right leg270 m hemiplegic - left arm, left leg271 * paraplegic - right leg, left leg
272 = quadriplegic - all four extremities - partial or complete
ORTHOPEDIC CEREBRAL PALSIED - MIXED
280 = monoplegic - right arm281 0 monoplegic - left arm282 = monoplegic - right leg283 0 monoplegic - left leg284 = diplegic - major involvement in lover limbs and minor involvement
in upper limbs285 = triplegic - right arm, left arm, right leg286 = triplegic - right arm, right leg, left leg287 0 triplegic - left aria, right leg, left leg288 = triplegic - right arm, left arm, left leg289 = hemiplegic - right arm, right leg290 0 hemiplegic = left arm, left leg291 = paraplegic - right leg, left leg292 = quadriplegic - all four extremities - partial or complete
E. ORTHOPEDIC SPINAL NEUROMUSCULAR CONDITION
Spinal neuromuscular conditions were acquired or congenital conditionscharacterized by spinal_lesionmbich directly affected limb functioning.
300 * partial or complete - lesion cite unknown301 0 partial or complete - cervical lesion302 - partial or complete T1 to T5 lesion
303 = partial or complete - T6 toTio lesion
304 0 partial or complete - T11 to L2 lesion
305 0 partial or complete - L3 to below lesion
318