institutional assessment report 2012-13 - marquette university · 1 institutional assessment report...
TRANSCRIPT
1
Institutional Assessment Report 2012-13
The primary purpose for assessment is the assurance and improvement of student learning and
development; results are intended to inform decisions about course and program content, delivery,
and pedagogy. The Institutional Assessment Report summarizes annual assessment processes,
results and success indicators at the program, co-curricular, core and institutional levels.
I. Program assessment
A total of 117 degree and certificate programs and 13 co-curricular units assessed student learning
in 2012-13. Assessment reports reside in the Assessment Reporting Management System (ARMS).
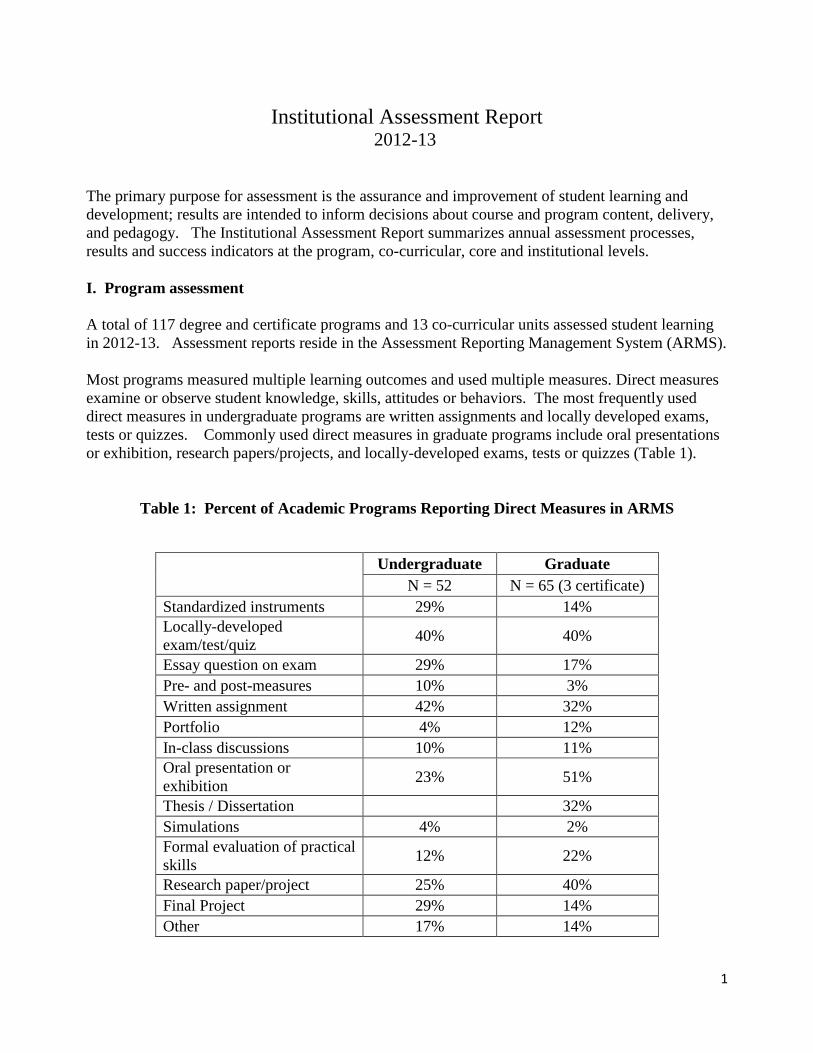
Most programs measured multiple learning outcomes and used multiple measures. Direct measures
examine or observe student knowledge, skills, attitudes or behaviors. The most frequently used
direct measures in undergraduate programs are written assignments and locally developed exams,
tests or quizzes. Commonly used direct measures in graduate programs include oral presentations
or exhibition, research papers/projects, and locally-developed exams, tests or quizzes (Table 1).
Table 1: Percent of Academic Programs Reporting Direct Measures in ARMS
Undergraduate Graduate
N = 52 N = 65 (3 certificate)
Standardized instruments 29% 14%
Locally-developed
exam/test/quiz 40% 40%
Essay question on exam 29% 17%
Pre- and post-measures 10% 3%
Written assignment 42% 32%
Portfolio 4% 12%
In-class discussions 10% 11%
Oral presentation or
exhibition 23% 51%
Thesis / Dissertation 32%
Simulations 4% 2%
Formal evaluation of practical
skills 12% 22%
Research paper/project 25% 40%
Final Project 29% 14%
Other 17% 14%
2
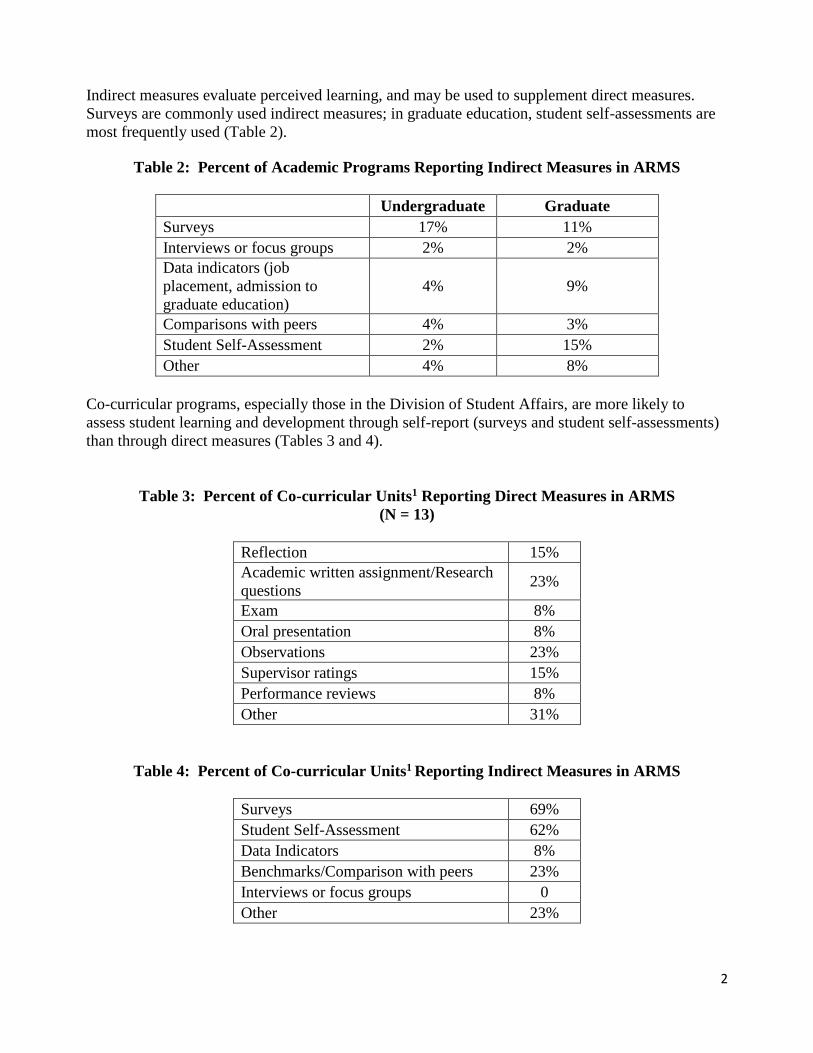
Indirect measures evaluate perceived learning, and may be used to supplement direct measures.
Surveys are commonly used indirect measures; in graduate education, student self-assessments are
most frequently used (Table 2).
Table 2: Percent of Academic Programs Reporting Indirect Measures in ARMS
Undergraduate Graduate
Surveys 17% 11%
Interviews or focus groups 2% 2%
Data indicators (job
placement, admission to
graduate education)
4% 9%
Comparisons with peers 4% 3%
Student Self-Assessment 2% 15%
Other 4% 8%
Co-curricular programs, especially those in the Division of Student Affairs, are more likely to
assess student learning and development through self-report (surveys and student self-assessments)
than through direct measures (Tables 3 and 4).
Table 3: Percent of Co-curricular Units1 Reporting Direct Measures in ARMS
(N = 13)
Reflection 15%
Academic written assignment/Research
questions 23%
Exam 8%
Oral presentation 8%
Observations 23%
Supervisor ratings 15%
Performance reviews 8%
Other 31%
Table 4: Percent of Co-curricular Units1 Reporting Indirect Measures in ARMS
Surveys 69%
Student Self-Assessment 62%
Data Indicators 8%
Benchmarks/Comparison with peers 23%
Interviews or focus groups 0
Other 23%
3
1 Co-curricular units include: Campus Ministry, Residence Life, Career Services, English as a Second
Language, Les Aspin Center, Service Learning, Student Educational Services, Study Abroad, Counseling
Center, Recreational Sports, MU Medical Clinic, Student Athlete Academic Support and Student
Development.
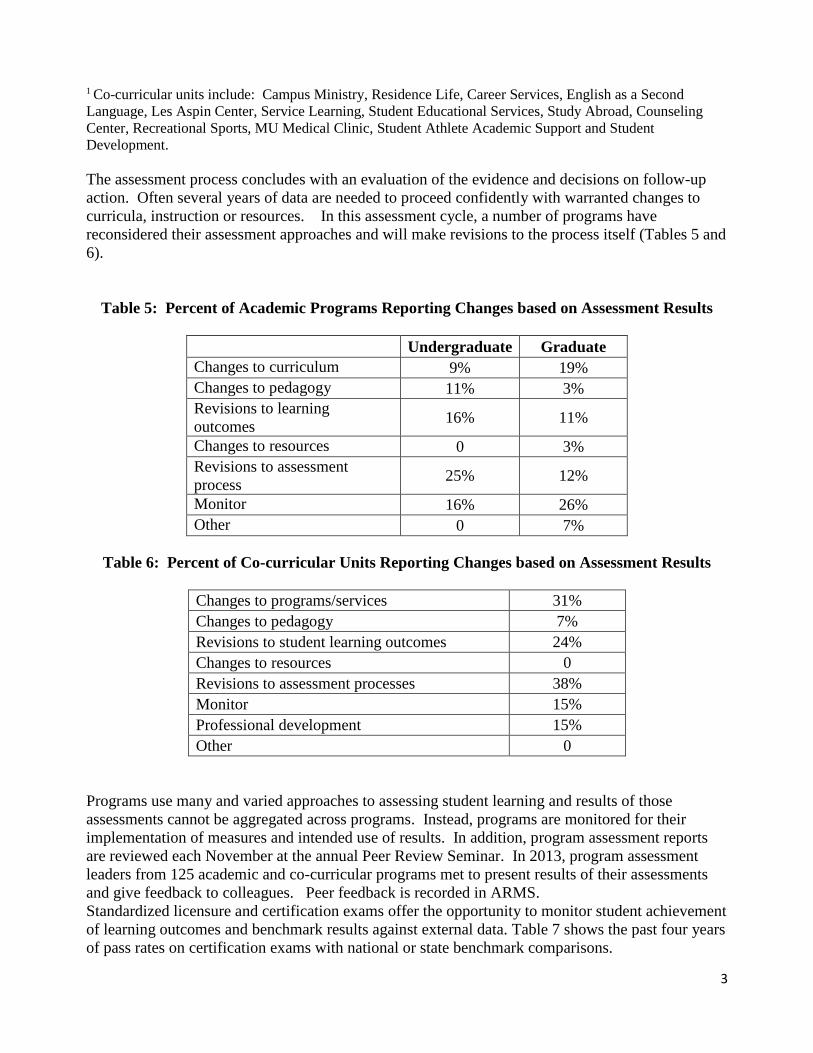
The assessment process concludes with an evaluation of the evidence and decisions on follow-up
action. Often several years of data are needed to proceed confidently with warranted changes to
curricula, instruction or resources. In this assessment cycle, a number of programs have
reconsidered their assessment approaches and will make revisions to the process itself (Tables 5 and
6).
Table 5: Percent of Academic Programs Reporting Changes based on Assessment Results
Undergraduate Graduate
Changes to curriculum 9% 19%
Changes to pedagogy 11% 3%
Revisions to learning
outcomes 16% 11%
Changes to resources 0 3%
Revisions to assessment
process 25% 12%
Monitor 16% 26%
Other 0 7%
Table 6: Percent of Co-curricular Units Reporting Changes based on Assessment Results
Changes to programs/services 31%
Changes to pedagogy 7%
Revisions to student learning outcomes 24%
Changes to resources 0
Revisions to assessment processes 38%
Monitor 15%
Professional development 15%
Other 0
Programs use many and varied approaches to assessing student learning and results of those
assessments cannot be aggregated across programs. Instead, programs are monitored for their
implementation of measures and intended use of results. In addition, program assessment reports
are reviewed each November at the annual Peer Review Seminar. In 2013, program assessment
leaders from 125 academic and co-curricular programs met to present results of their assessments
and give feedback to colleagues. Peer feedback is recorded in ARMS.
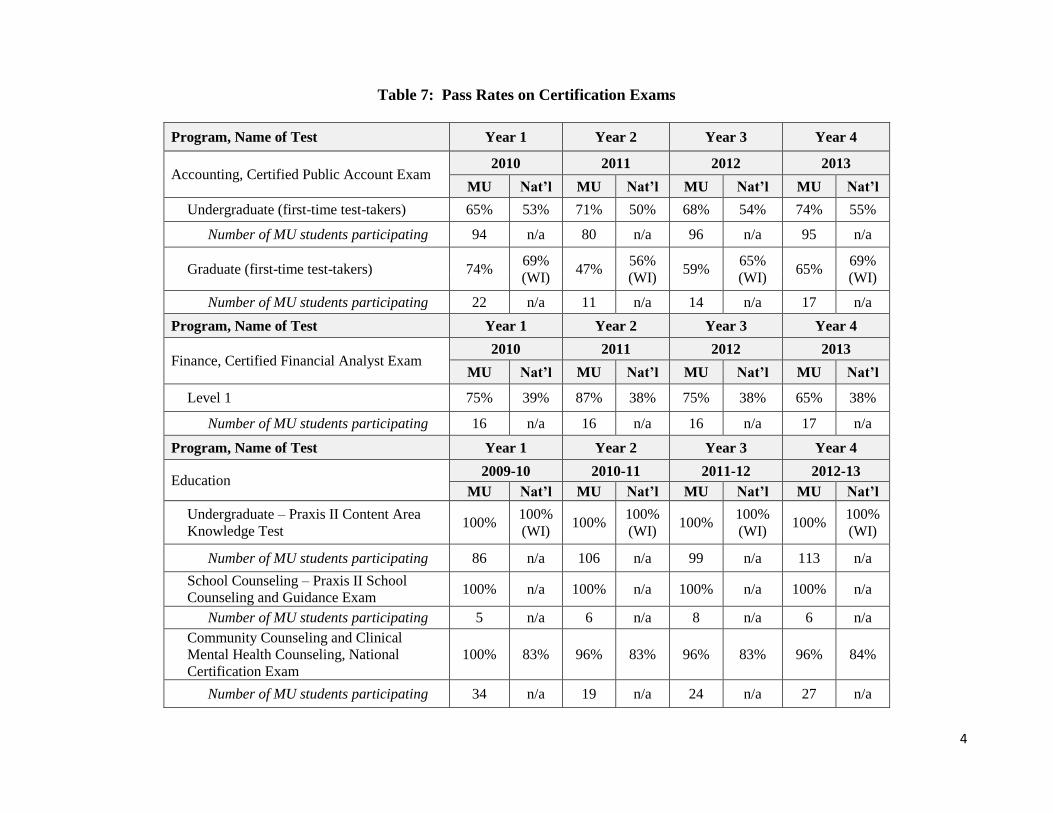
Standardized licensure and certification exams offer the opportunity to monitor student achievement
of learning outcomes and benchmark results against external data. Table 7 shows the past four years
of pass rates on certification exams with national or state benchmark comparisons.
4
Table 7: Pass Rates on Certification Exams
Program, Name of Test Year 1 Year 2 Year 3 Year 4
Accounting, Certified Public Account Exam 2010 2011 2012 2013
MU Nat’l MU Nat’l MU Nat’l MU Nat’l
Undergraduate (first-time test-takers) 65% 53% 71% 50% 68% 54% 74% 55%
Number of MU students participating 94 n/a 80 n/a 96 n/a 95 n/a
Graduate (first-time test-takers) 74% 69%
(WI) 47%
56%
(WI) 59%
65%
(WI) 65%
69%
(WI)
Number of MU students participating 22 n/a 11 n/a 14 n/a 17 n/a
Program, Name of Test Year 1 Year 2 Year 3 Year 4
Finance, Certified Financial Analyst Exam 2010 2011 2012 2013
MU Nat’l MU Nat’l MU Nat’l MU Nat’l
Level 1 75% 39% 87% 38% 75% 38% 65% 38%
Number of MU students participating 16 n/a 16 n/a 16 n/a 17 n/a
Program, Name of Test Year 1 Year 2 Year 3 Year 4
Education 2009-10 2010-11 2011-12 2012-13
MU Nat’l MU Nat’l MU Nat’l MU Nat’l
Undergraduate – Praxis II Content Area
Knowledge Test 100%
100%
(WI) 100%
100%
(WI) 100%
100%
(WI) 100%
100%
(WI)
Number of MU students participating 86 n/a 106 n/a 99 n/a 113 n/a
School Counseling – Praxis II School
Counseling and Guidance Exam 100% n/a 100% n/a 100% n/a 100% n/a
Number of MU students participating 5 n/a 6 n/a 8 n/a 6 n/a
Community Counseling and Clinical
Mental Health Counseling, National
Certification Exam
100% 83% 96% 83% 96% 83% 96% 84%
Number of MU students participating 34 n/a 19 n/a 24 n/a 27 n/a

5
Program, Name of Test Year 1 Year 2 Year 3 Year 4 Year 5
Clinical Laboratory Sciences, Board of
Certification Exam
2010 2011 2012 2013 2014
MU Nat’l MU Nat’l MU Nat’l MU Nat’l MU Nat’l
92% 75% 90% 77% 100% 77% 100% 84% 92% 86%
Number of MU students participating 13 n/a 10 n/a 15 n/a 13 n/a 13 n/a
Physical Therapy, PES National Licensure
Exam (first-time test-takers)
2010 2011 2012 2013 2014
MU Nat’l MU Nat’l MU Nat’l MU Nat’l MU Nat’l
97% 90% 95% 91% 93% 90% 93% 91% 98% 93%
Number of MU students participating n/a n/a n/a n/a 61 n/a 61 n/a 59 n/a
Athletic Training, National Athletic Trainers’
Association (first-time test-takers)
**Information is not yet available.
2010 2011 2012 2013 2014
MU Nat’l MU Nat’l MU Nat’l MU Nat’l MU Nat’l
100% 61% 100% 82% 92% 81% 100% 75% 100% **
Number of MU students participating n/a n/a 12 n/a 12 n/a 11 n/a 10 n/a
Physician Assistant Studies, National
Certification Exam (first-time test-takers)
**Information is not yet available.
2010 2011 2012 2013 2014
MU Nat’l MU Nat’l MU Nat’l MU Nat’l MU Nat’l
100% 94% 100% 91% 100% 93% 100% 94% 100% **
Speech-Language Pathology, Praxis Exam
(first-time test-takers)
**Numbers on the ASHA website do not
represent “first time pass rates”. Rather they
include all test administrations for a given
interval. To the graduate Director’s
knowledge, these scores are not yet available
on a national level. 2013-2014 are not yet
available.
2009-10 2010-11 2011-12 2012-13 2014
MU Nat’l MU Nat’l MU Nat’l MU Nat’l MU Nat’l
100% 86% 100% 86% 100% 86% 100% 90% 100% **

6
Program, Name of Test Year 1 Year 2 Year 3 Year 4
Nursing 2009-10 2010-11 2011-12 2012-13
MU Nat’l MU Nat’l MU Nat’l MU Nat’l
NCLEX-RN (all first-time test takers) 90% 88% 90% 87% 84% 88% 92% 90%
Number of MU students participating 156 n/a 126 n/a 133 n/a 133 n/a
American Nurses Credentialing Center (ANCC) – Adult Primary Care NP Certification Exam
or American Academy of Nurse Practitioners
Certification Program (AANPCP) Adult Primary Care
NP Certification Exam
92% 82%
(ANCC) 94%
82%
(ANCC) 100%
91%
(ANCC) 100%
85%
(ANCC)
Number of MU students participating 12 n/a 17 n/a 14 n/a 26 n/a
ANCC – Adult Acute Care NP Certification
Exam 94%
90%
(ANCC) 95%
92%
(ANCC) 95%
92%
(ANCC) 100%
87%
(ANCC)
Number of MU students participating 18 n/a 19 n/a 12 n/a 16 n/a
ANCC – Pediatric Primary Care NP
Certification Exam or Pediatric Nursing
Certification Board (PNCB) Pediatric Primary
Care NP Certification Exam or ANCC
Pediatric CNS Certification Exam
83% 88%
(PNCB) 88%
90%
(PNCB) 100%
90%
(PNCB) 86%
91%
(PNCB)
Number of MU students participating 6 n/a 8 n/a 15 n/a 7 n/a
PNCB Pediatric Acute Care NP Certification
Exam n/a 77% 86% 81% 80% 81% 75% 84%
Number of MU students participating n/a n/a 7 n/a 5 n/a 4 n/a
ANCC Gerontology NP Certification Exam or
AANPCP Gerontology NP Certification
Exam
100% 85%
(ANCC) 100%
86%
(ANCC) 100%
96%
(ANCC) n/a n/a
Number of MU students participating 3 n/a 2 n/a 3 n/a n/a n/a
American Midwifery Certification Board
(AMCB) Nurse Midwifery Certification
Exam
100% 84% 100% 88% 88% 88% 88% 88%
Number of MU students participating 2 n/a 7 n/a 8 n/a 8 n/a
Commission on Nurse Certification (CNC)
Clinical Nurse Leader Certification Exam 100% 68% 100% 70% n/a 75% 100% 75%
Number of MU students participating n/a n/a n/a n/a n/a n/a 1 n/a

7
II. University Core of Common Studies Learning Outcomes Assessment
The core of common studies is the foundation of all undergraduate degrees, constituting 36 credits
required for graduation. Core outcomes are assessed within each of nine knowledge areas on a
rotating basis, and through the Integrated Core Learning Outcomes (ICLO).
In 2012-13, the knowledge areas of Human Nature and Ethics and Histories of Cultures and
Societies were assessed. The Philosophy Department assessed the outcomes for its two core
courses, PHIL 1001: Philosophy of Human Nature and PHIL 2310: Theory of Ethical Theory,
which together comprise the Human Nature and Ethics knowledge area of the University Core of
Common Studies. The History Department assessed the effectiveness of its core courses through a
student exit questionnaire. Complete reports can be accessed at: http://www.marquette.edu/core-
of-common-studies/outcomes-assessment.php
The four cross-disciplinary ICLOs are measured using senior experience and capstone course
assignments. In 2012-13, a total of 272 students in 15 courses participated in this assessment. The
criteria measured within the courses differed; for example, more students were measured on the
second criterion of ICLO #1 than the other two. Table 8 displays ratings by ICLO criterion.
Table 8: Ratings for Integrated Core Learning Outcomes
ICLO #1
Apply the perspectives, concepts and traditions of multiple disciplines to personal,
professional, intellectual and societal challenges.
Outstanding Proficient Adequate Unacceptable
Independently synthesizes
or draws conclusions by
combining examples, facts,
arguments or theories from
more than one field of study
or perspective.
8 (23%) 15 (43%) 12 (34%) 0
Demonstrates ability to
problem-solve; uses
information from diverse
sources to understand a
problem, generates
alternative solutions,
evaluates alternatives,
implements solutions,
evaluates outcomes.
34 (40%) 29 (33%) 23 (27%) 0
Demonstrates a sense of self
as a learner, building on
prior experiences to respond
to new and challenging
contexts.
17 (49%) 7 (20%) 9 (26%) 2 (5%)
Total 59 (38%) 51 (33%) 44 (28%) 2 (1%)
8
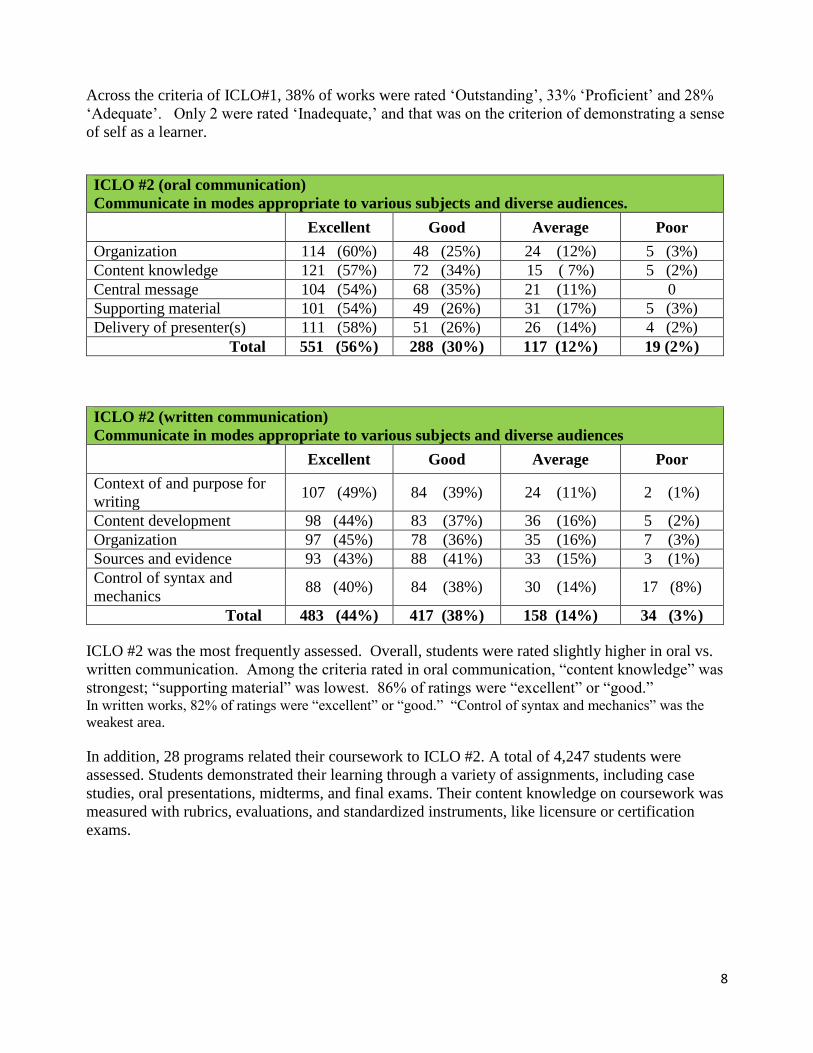
Across the criteria of ICLO#1, 38% of works were rated ‘Outstanding’, 33% ‘Proficient’ and 28%
‘Adequate’. Only 2 were rated ‘Inadequate,’ and that was on the criterion of demonstrating a sense
of self as a learner.
ICLO #2 (oral communication)
Communicate in modes appropriate to various subjects and diverse audiences.
Excellent Good Average Poor
Organization 114 (60%) 48 (25%) 24 (12%) 5 (3%)
Content knowledge 121 (57%) 72 (34%) 15 ( 7%) 5 (2%)
Central message 104 (54%) 68 (35%) 21 (11%) 0
Supporting material 101 (54%) 49 (26%) 31 (17%) 5 (3%)
Delivery of presenter(s) 111 (58%) 51 (26%) 26 (14%) 4 (2%)
Total 551 (56%) 288 (30%) 117 (12%) 19 (2%)
ICLO #2 (written communication)
Communicate in modes appropriate to various subjects and diverse audiences
Excellent Good Average Poor
Context of and purpose for
writing 107 (49%) 84 (39%) 24 (11%) 2 (1%)
Content development 98 (44%) 83 (37%) 36 (16%) 5 (2%)
Organization 97 (45%) 78 (36%) 35 (16%) 7 (3%)
Sources and evidence 93 (43%) 88 (41%) 33 (15%) 3 (1%)
Control of syntax and
mechanics 88 (40%) 84 (38%) 30 (14%) 17 (8%)
Total 483 (44%) 417 (38%) 158 (14%) 34 (3%)
ICLO #2 was the most frequently assessed. Overall, students were rated slightly higher in oral vs.
written communication. Among the criteria rated in oral communication, “content knowledge” was
strongest; “supporting material” was lowest. 86% of ratings were “excellent” or “good.” In written works, 82% of ratings were “excellent” or “good.” “Control of syntax and mechanics” was the
weakest area.
In addition, 28 programs related their coursework to ICLO #2. A total of 4,247 students were
assessed. Students demonstrated their learning through a variety of assignments, including case
studies, oral presentations, midterms, and final exams. Their content knowledge on coursework was
measured with rubrics, evaluations, and standardized instruments, like licensure or certification
exams.
9
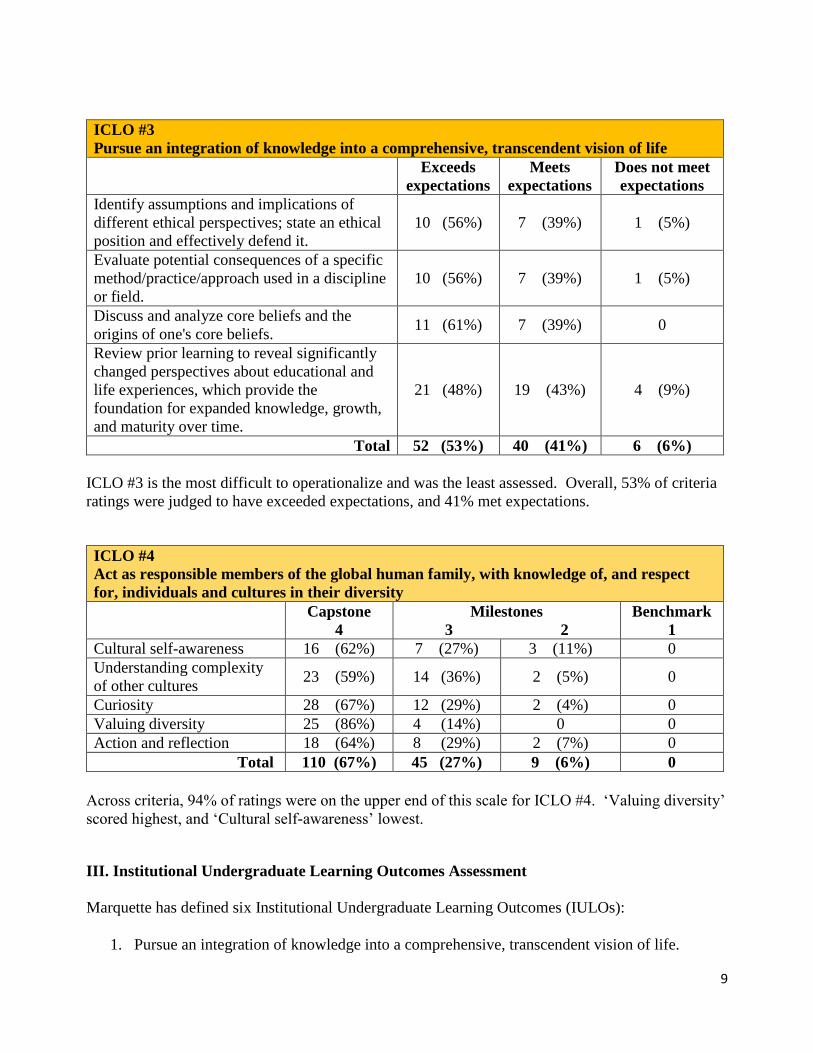
ICLO #3
Pursue an integration of knowledge into a comprehensive, transcendent vision of life
Exceeds
expectations
Meets
expectations
Does not meet
expectations
Identify assumptions and implications of
different ethical perspectives; state an ethical
position and effectively defend it.
10 (56%) 7 (39%) 1 (5%)
Evaluate potential consequences of a specific
method/practice/approach used in a discipline
or field.
10 (56%) 7 (39%) 1 (5%)
Discuss and analyze core beliefs and the
origins of one's core beliefs. 11 (61%) 7 (39%) 0
Review prior learning to reveal significantly
changed perspectives about educational and
life experiences, which provide the
foundation for expanded knowledge, growth,
and maturity over time.
21 (48%) 19 (43%) 4 (9%)
Total 52 (53%) 40 (41%) 6 (6%)
ICLO #3 is the most difficult to operationalize and was the least assessed. Overall, 53% of criteria
ratings were judged to have exceeded expectations, and 41% met expectations.
ICLO #4
Act as responsible members of the global human family, with knowledge of, and respect
for, individuals and cultures in their diversity
Capstone
4
Milestones
3 2
Benchmark
1
Cultural self-awareness 16 (62%) 7 (27%) 3 (11%) 0
Understanding complexity
of other cultures 23 (59%) 14 (36%) 2 (5%) 0
Curiosity 28 (67%) 12 (29%) 2 (4%) 0
Valuing diversity 25 (86%) 4 (14%) 0 0
Action and reflection 18 (64%) 8 (29%) 2 (7%) 0
Total 110 (67%) 45 (27%) 9 (6%) 0
Across criteria, 94% of ratings were on the upper end of this scale for ICLO #4. ‘Valuing diversity’
scored highest, and ‘Cultural self-awareness’ lowest.
III. Institutional Undergraduate Learning Outcomes Assessment
Marquette has defined six Institutional Undergraduate Learning Outcomes (IULOs):
1. Pursue an integration of knowledge into a comprehensive, transcendent vision of life.

10
2. Apply the knowledge and skills of an academic discipline, program, or profession to a career
or graduate study.
3. Utilize critical thinking and reflection to effect positive change in themselves, others and
their communities.
4. Communicate in modes appropriate to various subjects and diverse audiences.
5. Exercise just, responsible and competent leadership in professional, intellectual, and social
contexts.
6. Act for social justice within the diverse global human family.
Assessment of these outcomes relies on student self-reports, primarily through the Graduating
Senior Survey (GSS), National Survey of Student Engagement (NSSE) and survey of students
participating in service learning.
Student responses to relevant items on the GSS are used to assess both core and institutional
outcomes. The first set of items in Table 9 includes student self-assessment on progress in
achieving knowledge area outcomes. The second set relates to IULO assessment.
Table 9: 2013 Graduating Senior Survey (N = 778)
How much did your Marquette education contribute to
your ability to:
A
great
deal
Somewhat A little Not at
all
Write clearly and logically 53% 39% 7% 2%
Analyze quantitative information 54% 33% 11% 2%
Appropriately use the technology and tools of your field 52% 35% 9% 4%
Locate evaluate and effectively use research and information
resources 49% 37% 12% 2%
Give effective oral presentations 46% 42% 10% 3%
Use knowledge from the social sciences to understand
individual and social behavior 45% 37% 16% 2%
Use scientific inquiry to understand problems and evaluate
information 43% 36% 17% 5%
Appreciate the value of history in understanding the past and
present 32% 37% 24% 7%
Enjoy works of literature 28% 34% 28% 9%
Appreciate great works of art, music and drama 22% 28% 32% 18%

11
Compared to when you entered Marquette, how much
have you grown in your ability to:
A
great
deal
Somewhat A little Not at
all
Assume leadership responsibilities in your professional and
community life 67% 26% 6% 1%
Apply what you have learned in class to personal, professional
or societal challenges 66% 28% 5% 1%
Take responsibility for your own behavior 67% 23% 7% 2%
Contribute effectively to a group or team 58% 33% 7% 2%
Practice ethical decision-making 60% 30% 8% 2%
Identify your own core beliefs 57% 30% 11% 2%
Recognize injustice in society 57% 31% 10% 2%
Act in accordance with your core beliefs 55% 33% 9% 2%
Understand the value of community involvement and
contributing to the greater good 53% 34% 10% 2%
Understand and appreciate different cultures 53% 30% 15% 2%
Exhibit compassion toward others in your actions 49% 38% 10% 3%
Work for a more just society 45% 38% 14% 3%
Align your daily activities with principles of your faith 34% 32% 21% 14%
Cultivate a life or prayer and reflection 22% 29% 24% 25%
Graduating seniors are most likely to credit their Marquette education with contributing to their
ability to write, analyze quantitative information, and use technology. They have grown most in
their abilities to assume leadership responsibilities and apply what they have learned to their own
challenges.
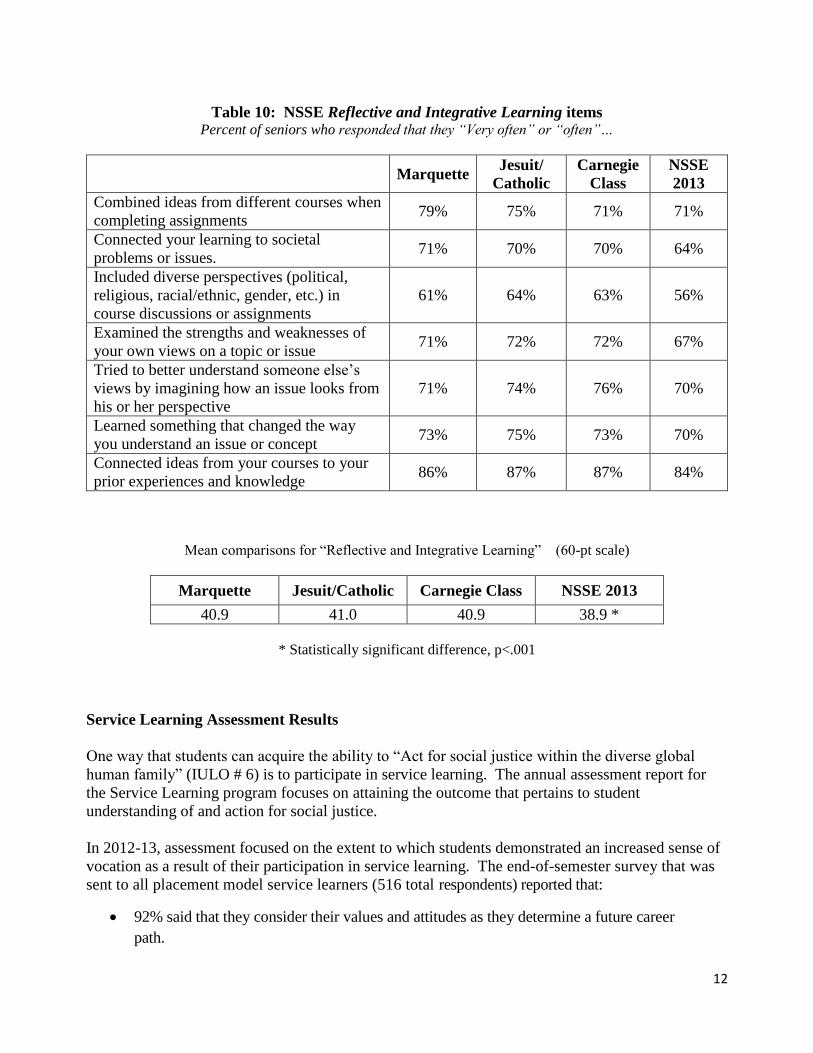
National Survey of Student Engagement (NSSE)
The NSSE includes an engagement indicator for “Reflective and Integrative Learning,” the results
of which are used to assess the extent to which seniors report their progress toward achieving the
ICLOs. Table 10 reports item responses for the 544 Marquette seniors who completed the 2013
NSSE, as compared to seniors in benchmark groups. The average score for this engagement
indicator shows statistically comparable scores for the Jesuit/Catholic and Carnegie Class
comparison groups, and a higher score compared to all institutions included in this NSSE
administration.
12
Table 10: NSSE Reflective and Integrative Learning items Percent of seniors who responded that they “Very often” or “often”…
Marquette
Jesuit/
Catholic
Carnegie
Class
NSSE
2013
Combined ideas from different courses when
completing assignments 79% 75% 71% 71%
Connected your learning to societal
problems or issues. 71% 70% 70% 64%
Included diverse perspectives (political,
religious, racial/ethnic, gender, etc.) in
course discussions or assignments
61% 64% 63% 56%
Examined the strengths and weaknesses of
your own views on a topic or issue 71% 72% 72% 67%
Tried to better understand someone else’s
views by imagining how an issue looks from
his or her perspective
71% 74% 76% 70%
Learned something that changed the way
you understand an issue or concept 73% 75% 73% 70%
Connected ideas from your courses to your
prior experiences and knowledge 86% 87% 87% 84%
Mean comparisons for “Reflective and Integrative Learning” (60-pt scale)
Marquette Jesuit/Catholic Carnegie Class NSSE 2013
40.9 41.0 40.9 38.9 *
* Statistically significant difference, p<.001
Service Learning Assessment Results
One way that students can acquire the ability to “Act for social justice within the diverse global
human family” (IULO # 6) is to participate in service learning. The annual assessment report for
the Service Learning program focuses on attaining the outcome that pertains to student
understanding of and action for social justice.
In 2012-13, assessment focused on the extent to which students demonstrated an increased sense of
vocation as a result of their participation in service learning. The end-of-semester survey that was
sent to all placement model service learners (516 total respondents) reported that:
92% said that they consider their values and attitudes as they determine a future career
path.

13
85% noted that they have honed a skill that will help them in their academic life or in a future
career, with 38% of students honing skills in communication (public speaking, group
facilitation, and interpersonal communication).
42% expressed that service learning helped them to reaffirm their choice of academic
major.
27% expressed that helping others, making a difference, and having an impact on the
community are the most important things that they will consider when choosing a career.
As a result of this assessment, the Service Learning Program has instituted a reflection
session that pushes students to reflect on their values while delving into the connections
between their service learning experiences and their intended career path and greater purpose
in the world.
III. Data Indicators of Student Success
Data indicators for retention, graduation, employment and enrollment in further education are also
evaluated for evidence of success.
On average, 90% of freshmen are retained and about 80% of an entering cohort graduates within 6
years. These rates compare very favorably to other selective universities.
Table 11: Fall to subsequent fall retention rates of subsequent cohorts
2008 to 2009 2009 to 2010 2010 to 2011 2011 to 2012 2012 to 2013
Percent retained 89% 88% 90% 88% 91%
Initial cohort 1,950 1,946 1,928 2,056 1,927
Number retained 1,728 1,722 1,731 1,809 1,748
Table 12: Graduation rates of entering freshmen cohorts
Cohort Size Total Percentage Graduating Within:
4 years 5 years 6 years
2003 1,882 59.8% 78.7% 79.9%
2004 1,802 62.0% 79.8% 81.0%
2005 1,775 61.0% 80.2% 81.4%
2006 1,842 59.5% 78.4% 80.2%
2007 1,811 57.3% 76.8% 78.2%

14
IULO #2 addresses the ability to apply discipline knowledge to a career or to graduate study.
Achievement of this outcome is verified in part by employment data, and information indicating
successful admission to and completion of graduate programs.
The 2013 Undergraduate Post-Graduation Outcomes Survey reports that six months following
graduation, 52% are employed full time; 22% are enrolled in graduate or professional school full-
time; 4% are engaged in full-time post-graduation service, such as the Peace Corps, AmeriCorps or
the Jesuit Volunteer Corps; 3% are in the activity military; 10% are still seeking a post-graduation
activity; and 9% report another activity or are not seeking employment.
Follow-up information from the Student Clearinghouse indicates that after eight years, about 53%
of a given graduation cohort will have pursued additional postsecondary education, and 40% will
have graduated with another degree.
October 8, 2014