institutional effectiveness handbook
TRANSCRIPT

1
Institutional Effectiveness Handbook
A Process for Stating Outcomes, Measuring Accomplishments, and Using the Results to Improve Programming and Services

2
Institutional Effectiveness Handbook
Page
I. Letter from the President 3
II. Introduction to the Handbook 4
III. Contact Information 5
IV. Overview of I.E. Process 6
a. Flowchart 7
V. Writing the Plan 8
VI. I.E. Procedures 9
a. I.E. Calendar 11
b. Sources of assessment information 12
c. Division/Departments participating in I.E 14
VII. I.E. Form 17
a. Directions for completing form 22
b. Questions to answer for each step 23
c. Common mistakes 24
d. Writing a measurable outcome 25
VIII. Examples of measurable outcomes 26
a. Examples of I.E Plans introduction 30
b. Academic – English 31
c. Administrative – Retention Support Services 35
IX. Assessment Links 40
X. Assessment Glossary 41
XI. Action Verbs that Result in Strong Student Learning Outcomes 44
XII. Appendix - Strategic Plan can be located at:
http://volstate.edu/Research/Documents/StrategicPlan1015.pdf

3

4
Introduction to Handbook The Institutional Effectiveness Committee, in conjunction with the Office of Institutional Effectiveness, Research, Planning, and Assessment, has developed this handbook as a tool to assist unit heads and others in the development of their institutional effectiveness plans. The handbook was written as a “how-to” manual that would guide divisions/departments step by step through the institutional effectiveness process. Each section of the handbook addresses a specific area of the process. The handbook begins with an overview of the planning cycle, and specific advice about writing a plan follows. It concludes with institutional information, such as the College’s strategic plan, that is used as a reference point in the development of each division/department’s objectives. Hopefully this information will be helpful in evaluating and improving operations. The Institutional Effectiveness Committee

5
Contact Information If you have any questions or find you need help with the I.E. process, please contact: Kimberly Martin Director of Institutional Effectiveness Ramer Administration Building, Suite 120 615-230-3276 [email protected]

6
Overview of the IE Process During the Institutional Effectiveness (IE) process, “the institution identifies expected outcomes, assesses the extent to which it achieves these outcomes, and provides evidence of improvement based on analysis of the results in each of the following areas: educational programs, to include student learning outcomes; administrative support services; academic and student support services; and community/ public service within its mission.” (SACS) IE is a “top-down” and a “bottom-up” process. Top Down: The process is top down in that it is directly tied to the strategic plan which, in turn, is guided by the institution’s mission. Every objective that a division/department develops relates to a goal and objective in the institution’s strategic plan. Bottom Up: IE is bottom up in that VSCC faculty, staff and administrators collaborate to develop the division/department plans
• What is going to be accomplished next year? • What are the division’s/department’s goals? • What steps need to be taken to achieve these goals? • What improvements will be made? • How will the division/department determine what has been accomplished? • What data will be collected? • What does the analysis of the data reveal? • How will the information gathered be used in planning for next year?
IE is also a “backwards” process. Backwards: IE is a backwards process because we start with the outcome, or end result, that we’re hoping to achieve. Then we develop a plan to reach that outcome and a measurement to help us know whether or not we have been successful. The IE process is ongoing. It requires broad-based participation. It is everyone’s business.

7
The IE Process
College Mission
College Strategic
Plan
Division/Dept IE Plans for
Improvement
Annual Priorities
Measurable Outcomes
Implementation
Evaluation and
Assessment
Use of results/impact on
next year’s IE plan
Budget Allocation
The division/dept. plan will address the annual priorities.

8
Writing the Plan The following sections were included to facilitate each division’s/department’s development of annual I.E. plans. Copies of forms, issues to consider, and specific examples of objectives are provided as a guide. Divisions/departments are encouraged to keep their purpose in mind when developing objectives.

9
Volunteer State Community College Procedures for the Institutional Effectiveness Process
Institutional effectiveness activities are undertaken for the following reasons:
1. Improvement – The activities of the process will result in improvements to the institution. The primary focus of the activities is the creation of college-wide excellence through the concurrent development of people, processes and technology.
2. Accountability – Provides documented proof that the institution is accountable to its constituents. The institution has the ability to provide evidence that citizens will receive a quality education including instruction and support services.
The following must occur on campus to create an environment conducive to institutional effectiveness processes:
1. Public and private endorsements by the President. 2. Participation and endorsement at the Vice President level to include free flow of
information and sharing of ideas and thoughts. 3. Repository to obtain information from Academic Affairs, Student Services, Business and
Finance, Resource Development, and Executive offices. 4. Access to information from the Office of Institutional Effectiveness. 5. The institutional effectiveness process must be seamless and become part of the daily
operational processes of the institution. All divisions/departments will participate in the following activities:
1. Each department (division) will submit institutional effectiveness plans to the Office of Institutional Effectiveness through the appropriate supervisor and/or Vice President.
2. Institutional effectiveness plans will be developed with input from all personnel in the department.
3. The institutional effectiveness plan must be linked to the five-year strategic plan and mission of the institution.
4. All divisions/departments will define a purpose. The purpose identifies the function of the division/department as it relates to the larger context of the overall mission of the institution. The development of the purpose of the department will be accomplished with input from all personnel employed by the department.
5. The Budgetary Unit Head/Dean will be responsible for the coordination of the departmental institutional effectiveness plan and serve as the contact person.
6. All divisions/departments will define objectives. At a minimum objectives will: a. Specify what the department will achieve. b. Identify criteria to be used by the department to determine whether the objectives
have been achieved. c. Be measurable, and may include both quantitative and qualitative measures. d. Be specific to the department, and must be understood by all employees within the
department. e. Must cite the source of information, measures to be utilized, and how success will be
determined. 7. For academic units, at least one objective must be related to student learning outcomes. 8. Each division/department (division) will identify methods to assess the intended
objectives. Two or more methods of assessment are preferable while in some instances only one method may be available. Assessment activities may require more than one year for implementation and must be noted in the institutional effectiveness plan.
9. Improvement plans will be developed based on the information gleaned from reviewing the results of the assessments for each of the specified objectives.
10
10. The division/department will implement the assessment methods developed to achieve the objectives and to determine the effectiveness of the objectives.
11. The division/department will identify the impact on the quality of what the department does based on the improvement(s) made as a result of the implementation of the institutional effectiveness plan.
12. The plan is linked directly to the budget – if funding is used to support an IE, this funding should be documented on the IE form.
Institutional Effectiveness initiatives will result in:
1. Clarification of the division/departmental purpose and mission of the institution. 2. Improvement in the use of resources. 3. Identification of institutional priorities and division/departmental priorities in support of the
overall institution. 4. Improved student and employee performance. 5. Enhancement of student learning.

11
Institutional Effectiveness Calendar June 30 Final institutional effectiveness plans for the following fiscal year are due
to the Office of Institutional Effectiveness. July – June Divisions/departments implement institutional effectiveness plans. Mid - October Institutional Effectiveness Linkages Sub-Committee conducts a review of
institutional effectiveness plans for the following fiscal year to determine linkage to the Five-Year Strategic Plan.
Mid - November Institutional budget and planning priorities distributed to campus
personnel for use in the development of institutional effectiveness division/departmental plans for the following fiscal year.
Mid - November Office of Institutional Effectiveness provides feedback on the upcoming
fiscal year plans through feedback forms. Individual sessions may be scheduled with the divisions/departments as needed.
January 15 Divisions/departments prepare and submit a mid-year progress report for
each institutional effectiveness initiative for the current year to the Office of Institutional Effectiveness.
June 30 Departments submit final progress report on implementation activities for
the current year of the institutional effectiveness plan. Departments must demonstrate and provide evidence of improvements made as a result of the institutional effectiveness initiative.

12
Sources of Assessment Information
1. Job Placement Rates – Percent of graduates obtaining employment in a field related to their major.
2. Student Satisfaction Inventory - Satisfaction with college experience. 3. Alumni survey – Overall experience at the institution. Based on a 4-point scale. 4. Percent of students graduating or transferring – Students are tracked for six years to
determine if they graduated or transferred to another institution. 5. Degrees and certificates awarded – Number of degrees and certificates awarded for the
specified time period. 6. Percent of first-time freshmen continuing the next year – First-time full-time freshmen
enrolling at the institution the following year after initial enrollment. 7. Full-time faculty percentage of total full-time employments – Based on October
personnel file. 8. Ratio of full-time students to full-time faculty. 9. Annual state dollars per full-time students – State appropriations per full-time students. 10. Five year average private giving – Includes actual dollars, securities, and in-kind
amounts given to the institution. 11. Private giving as percent of total budget – Percent of E and G expenditures. 12. Percent of freshmen receiving financial aid – National Center for Statistics National
Survey. 13. Average freshmen student debt – National Center for Statistics National Survey. Debt is
based on average student loans which is institutional support. 14. Percent of programs accredited – The percentage of academic programs accredited by
an accrediting agency. 15. Percent of standards met in academic audit – The percentage of standards met by
programs participating in academic audit. 16. Licensure examination results 17. Employer satisfaction survey results 18. General Education Review:
a. ETS Academic Proficiency Profile i. total scaled score ii. proficiency levels iii. content areas
b. Rubrics 19. Major Field Testing 20. Community College Survey of Student Engagement (CCSSE) 21. National Community College Benchmark Study 22. Institutional Goals and Initiatives 23. State Strategic Plan Goals 24. Student Right-to-Know Graduation and Transfer Rates 25. Entering ACT scores 26. Entering high school GPA 27. Persistence rates (students meeting 12, 24, and 36 hour benchmarks) 28. Grade distribution 29. Course completion rates 30. Mid-term deficiency analysis 31. Library satisfaction analysis 32. VSCC employee evaluations 33. Evaluation of instructional delivery 34. Adequacy of facilities 35. Adequacy of equipment 36. Standardized tests or common exams

13
37. Analysis of portfolios or other student work 38. Analysis of rubrics 39. Pre- and Post-Testing of students 40. Use of outside examiners from business, industry and the professions to provide
feedback on student’s presentations or projects. 41. Design final exam questions to capture cumulative learning in the major. 42. Compare student writing samples at different levels of courses to assess student
progress in writing. 43. Unduplicated headcount enrollment in distance education courses. 44. Unduplicated headcount in subpopulations (Adults, African Americans, Hispanics,
Veterans, Low Income, Community College Transfers, AA/AS/AST Transfers, Dual Enrollment)
45. Fall to spring progression rate 46. Number of associate degrees or certificates awarded 47. Number of graduates in subpopulations (Adults, African Americans, Hispanics, Low
Income, Veterans, First Generation) 48. Number of students with 12, 24, or 36 hours at the end of the spring semester 49. Overall satisfaction rating on survey item, “academic advising system meets student
needs” 50. Number of items at or above the peer mean score on the CCSSE survey 51. Number of courses re-engineered for QEP 52. Percentage of programs with an international component 53. First time pass rates on licensure or certification exams 54. Percentage of graduates scoring 70% or higher on exit exams 55. Percentage of accreditable programs with full accreditation 56. Percentage of programs eligible for approval that receive full approval 57. Number of third party grants, contracts, agreements, or partnerships 58. Percentage increase in outside revenue 59. Percentage increase in workforce development contact hours 60. Number of crisis management drills conducted 61. Number of new donor relationships

14
Department (within Division) ContactPresident's Office Jerry Faulkner
Internal Audit Nancy BatsonPublic Relations Tami WallaceV.P. Academic Affairs Bruce Scism
Asst. V.P. Academic Affairs Michael TorrenceDistance Learning Christine MayerLivingston Center Mike PowellHighland Crest Center Kelly MillerMedia Services Terry HeinenLearning Commons Kay DaytonSupplemental Instruction Toni MuradOff-Campus/Dual Enrollment/PerkinsYolanda EllisonCohort Programs Kristi Huffine
Asst. V.P. Continuing Educ. & Econ Devel. Hilary MarabetiTennessee Small Business Development Center
Charles Alexander
Center of Emphasis Terri CrutcherCont. Ed. (Pers. Enrichment) Lisa HaleyCont. Ed. (Workforce Devel.) Bob Jankiewicz
Career Placement/Coop Rick ParrentLibrary Services Louise KellyInternational Education Ann-Marie RuttenburQuality Enhancement Plan Jennifer PittsAllied Health Division Elvis Brandon
Dental Assistant Desiree SutphenEMT/Paramedic (EMS) Robert DavisFire Science Travis FordHealth Information Tech. Valerie BowlingMedical Lab Tech. Adam FredetteOpthalmic Tech. Alisha CornishPhysical Therapy Asst. Carolyn MooreRadiologic Tech. Monica KorpadyRespiratory Care Cory MartinSleep Diagnostic Mel MatthewsSonography Jennifer Carroll
Business Division John EspeyBusiness Studies (General Bus. Admin. Disciplines, Bus. & Commerce Disciplines)
John Espey
Computer Information Systems Rob MorrisLogistics George WilsonOffice Management Technology Teresa MooreGeneral Technology John EspeyParalegal Loretta Calvert
Division
Divisions and Departments Participating in Institutional Effectiveness

15
Humanities Division Alycia EhlertEntertainment Media Steve BishirCommunication Len AssanteWVCP Radio Station Howard EspravnikLearning Support Writing & Reading Laura BlackEnglish Laura BlackESOL Karen HutsonForeign Language Len AssanteLanguage Center Suzanne PreviteVisual & Performing Arts James Story
Math & Science Division Nancy MorrisBiological Science Robert CarterLearning Support Math Kim CaldwellMath & Engineering Kim CaldwellVeterinary Technology/Animal Care Douglas ShawPhysical Science Robert Carter
Social Science Division Phyllis FoleyCriminal Justice Kevin CookEducation (Early Childhood and AST) Susan BrandtHistory Grady EadesHonors Program George PimentelP.E./Health Ed. Bobby HudsonPsychology, Sociology, and Carol Topping Human Services
V.P. Business & Finance Beth CookseyAsst. V.P. of Business/Finance Kathy Y. Johnson
Business Office Renee AustinPayroll Ann SlaytonBookstore Kathy Y. JohnsonFood Services Kathy Y. JohnsonPurchasing Terry McGovern
Information Technology Brian KrausMaintenance Glenn Riggs, Kim Morris &
Michelle Boyd Campus Police William RoganHuman Resources Lori Cutrell
V.P. Development Office Karen MitchellAlumni Lori JohnsonGrants Saranne Winfield
V.P. Institutional Effect.,Res.,Plan., & Assess Jane McGuireInstitutional Research Ann Marie CalderonInstitutional Effectiveness Kimberly MartinData Design Holly Chason & Mohua
Hazra

16
V.P. Student Services Patty PowellAsst. V.P. Student Services, Enrollment Mgmt. Emily Short
Records and Registration Tim AmyxAdmissions Tim AmyxAdvising Center Terry BubbRetention Support Services Heather HarperFinancial Aid Sue Pedigo
Disability Services Kathy SowellStudent Life and Diversity Kenny YarbroughAthletics Bobby HudsonEvening Student Services Brenda BuffingtonTesting Teresa BrownTRIO Andrea Boddie
17
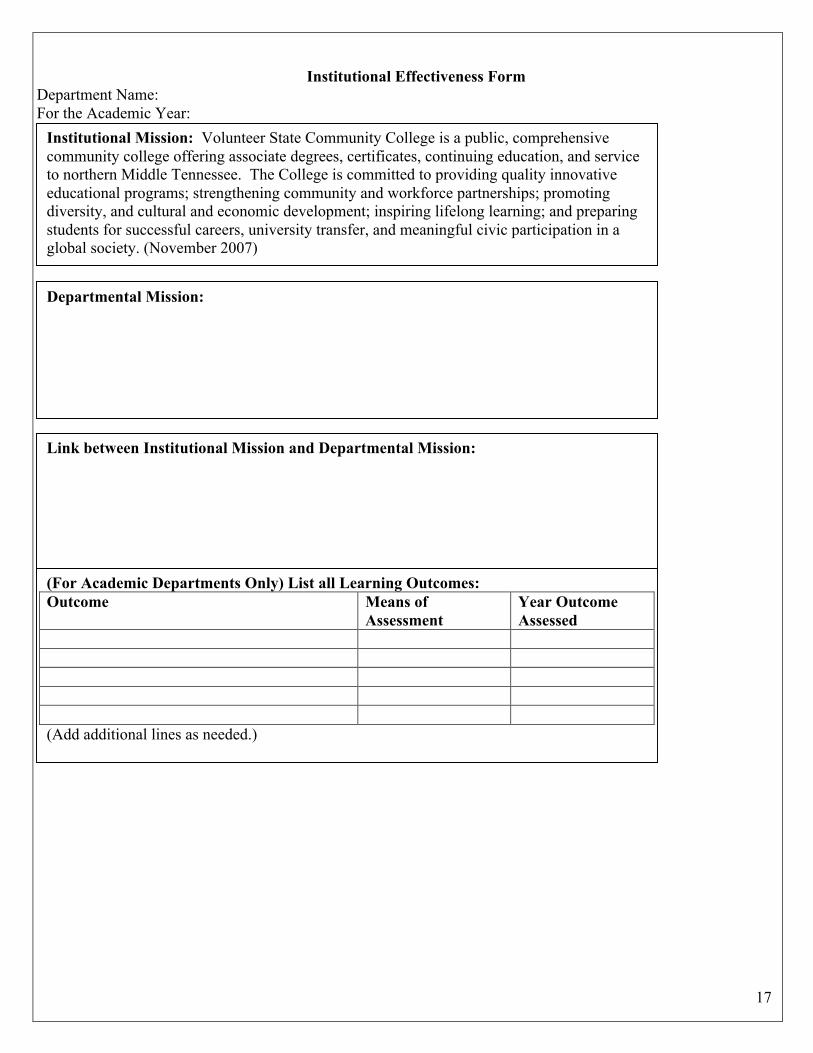
Institutional Effectiveness Form
Department Name: For the Academic Year: Institutional Mission: Volunteer State Community College is a public, comprehensive
community college offering associate degrees, certificates, continuing education, and service to northern Middle Tennessee. The College is committed to providing quality innovative educational programs; strengthening community and workforce partnerships; promoting diversity, and cultural and economic development; inspiring lifelong learning; and preparing students for successful careers, university transfer, and meaningful civic participation in a global society. (November 2007)
Departmental Mission:
Link between Institutional Mission and Departmental Mission:
(For Academic Departments Only) List all Learning Outcomes: Outcome Means of
Assessment Year Outcome Assessed
(Add additional lines as needed.)
18
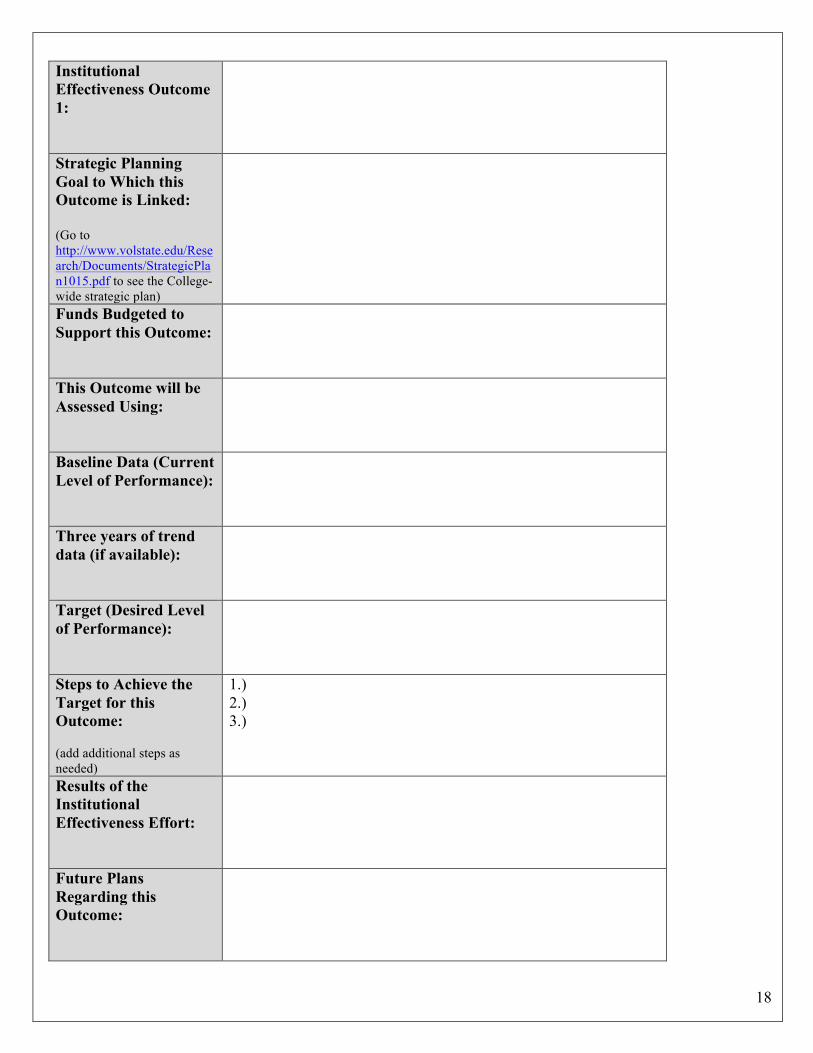
Institutional Effectiveness Outcome 1:
Strategic Planning Goal to Which this Outcome is Linked: (Go to http://www.volstate.edu/Research/Documents/StrategicPlan1015.pdf to see the College-wide strategic plan)
Funds Budgeted to Support this Outcome:
This Outcome will be Assessed Using:
Baseline Data (Current Level of Performance):
Three years of trend data (if available):
Target (Desired Level of Performance):
Steps to Achieve the Target for this Outcome: (add additional steps as needed)
1.) 2.) 3.)
Results of the Institutional Effectiveness Effort:
Future Plans Regarding this Outcome:

19
Institutional Effectiveness Outcome 2:
Strategic Planning Goal to Which this Outcome is Linked: (Go to http://www.volstate.edu/Research/Documents/StrategicPlan1015.pdf to see the College-wide strategic plan)
Funds Budgeted to Support this Outcome:
This Outcome will be Assessed Using:
Baseline Data (Current Level of Performance):
Three years of trend data (if available):
Target (Desired Level of Performance):
Steps to Achieve the Target for this Outcome: (add additional steps as needed)
1.) 2.) 3.)
Results of the Institutional Effectiveness Effort:
Future Plans Regarding this Outcome:

20
Institutional Effectiveness Outcome 3:
Strategic Planning Goal to Which this Outcome is Linked: (Go to http://www.volstate.edu/Research/Documents/StrategicPlan1015.pdf to see the College-wide strategic plan)
Funds Budgeted to Support this Outcome:
This Outcome will be Assessed Using:
Baseline Data (Current Level of Performance):
Three years of trend data (if available):
Target (Desired Level of Performance):
Steps to Achieve the Target for this Outcome: (add additional steps as needed)
1.) 2.) 3.)
Results of the Institutional Effectiveness Effort:
Future Plans Regarding this Outcome:

21
General Directions for Completing Institutional Effectiveness Plans a. First page of the form – This page will likely stay the same for several years. Enter your
department name and the academic year for which you are writing the IE plan. Enter your department’s mission statement. In the third box, explain how your department helps to fulfill the college’s mission statement (in box 1). The fourth box is only for academic departments—administrative departments should leave this box blank. Academic departments should enter their student learning outcomes, how each outcome is assessed, and the next year that the outcome will be assessed on the IE plan.
b. Institutional Effectiveness Outcome – Identify the measurable outcome you hope to improve in this year. For academic departments, at least one IE each year must be a student learning outcome.
c. Strategic Planning Goal to Which this Outcome is Linked – Enter the College strategic plan goal and objective from the 5-year strategic plan. Ex: Access Initiative 1 or A.I.1
d. Funds Budgeted to Support this Outcome – Enter the funds you expect to spend on this outcome in the coming year, whether or not the funds are coming from an increase in your departmental budget. If the funds are from an increase in your departmental budget, please state that.
e. This Outcome will be Assessed Using – Enter how you will measure improvement in this outcome.
f. Baseline Data – Identify the baseline level (current state) of performance in this area. g. Three Years of Trend Data – If you have been measuring this outcome for several years,
enter the three most recent years of data available in this box. If you are just starting to measure this outcome, enter “N/A” or “Not applicable” in this box.
h. Target – Enter your desired level of performance on the outcome in this box. i. Steps to Achieve the Target for this Outcome - Describe the specific steps to be taken to
complete the outcome. These should be the steps your department will take this year to make an improvement in the stated outcome.
The following steps are to be completed for the end of year report. j. Results of the Institutional Effectiveness Effort – At the end of cycle, you will report the
results of each assessment that was completed. Provide detailed information concerning what improvements were made, how these have or will impact student learning or a process, and what will continue to be implemented.
k. Future Plans Regarding this Outcome – In this box, you should report how the results of each assessment will impact planning for the next cycle. Will this outcome appear on your IE plan for next year with new steps to improve in this area? Is this a student learning outcome that you will assess again in three years? Enter that information here.
EACH IE PLAN SHOULD HAVE AT LEAST THREE OUTCOMES EACH YEAR.

22
Questions To Consider Before Writing Your Annual IE Plan
You may find it helpful to try to answer the following questions before attempting to write each objective of your IE plan.
Establishing Division/Department Objectives • What should we focus on doing well or better this year?
Or • Is there some aspect of our operation that we need to evaluate to find out if we are doing
it well?
Writing Measurable Outcomes and Locating Assessment Data • What would indicate to us that our departmental objectives are being accomplished? • Where can we find the data necessary to find out how well we’ve done?
Or • How can we develop a data source that will tell us how well we’ve done? • What results will have to occur for us to know how well we have accomplished what we
intended?
Determining Steps to Take and Resources Needed to Accomplish Objectives • Will we need any other department’s help to accomplish our objective? Which other
department(s)? Can they provide the assistance needed? Have we asked them? • What steps do we have to take to make this happen? • What resources—human, financial, physical, etc.—will be required to make this happen?
Are these resources available? If not, should we request a budget increase? • What is our timeline for making this happen?

23
Common Mistakes Failure to tie IEs to the college’s strategic plan. Failure to distinguish objectives from measurable outcomes. Failure to include at least three IEs on the plan. Failure to include a student learning outcome (for academic departments or programs). Failure to note a baseline level of performance. Failure to specify how performance will be measured. Failure to include budget implications of the IE. Failure to list steps necessary to accomplish objectives. Failure to specify a target level of performance. Failure to specify the results in terms of the measurement tool used. Failure to link results of evaluation to improvement and future planning.
24
Writing a measurable outcome An area has been identified for improvement. An intervention has been designed to bring the targeted positive change. Assessment data has guided the decision that improvement is needed. After the implementation, was there improvement in the assessment data? Once the data is gathered, it must be analyzed to determine if the expected outcome has been realized. But before any of this activity can be carried out, a measurable outcome must be written in order to give direction to the solution of the problem. These outcomes should answer 5 questions: Who or what, how, where, when, and how much? The Outcome Statement:
• Who (or what) will change? For instance, it may have been determined that a group of staff members in a certain office needs to perform a process with greater efficiency. This group should be identified in the outcome statement. In an academic application, a group of students in a learning support course have exhibited a deficiency in the subject treated in the course merely by being placed in the course. The students in the course, not individually but as a group, should be identified in the outcome statement.
• How will it change? This part of the outcome statement should state, in measurable
terms, just exactly what change will occur, i.e. the process that will experience an improvement in efficiency, or the material that will be acquired by the students in the learning support course.
• Where will the change occur? The exact location of where the change will occur should
be specified.
• When will the change occur? Outcome statements should not be open ended. There should be a definite point in time specified when the change will be complete.
The Target:
• How much change is expected? The amount of change must be quantified. Therefore, the data must be measurable in some form, whether it is in conventional measuring units or in terms of a percentage of change that will occur.
25
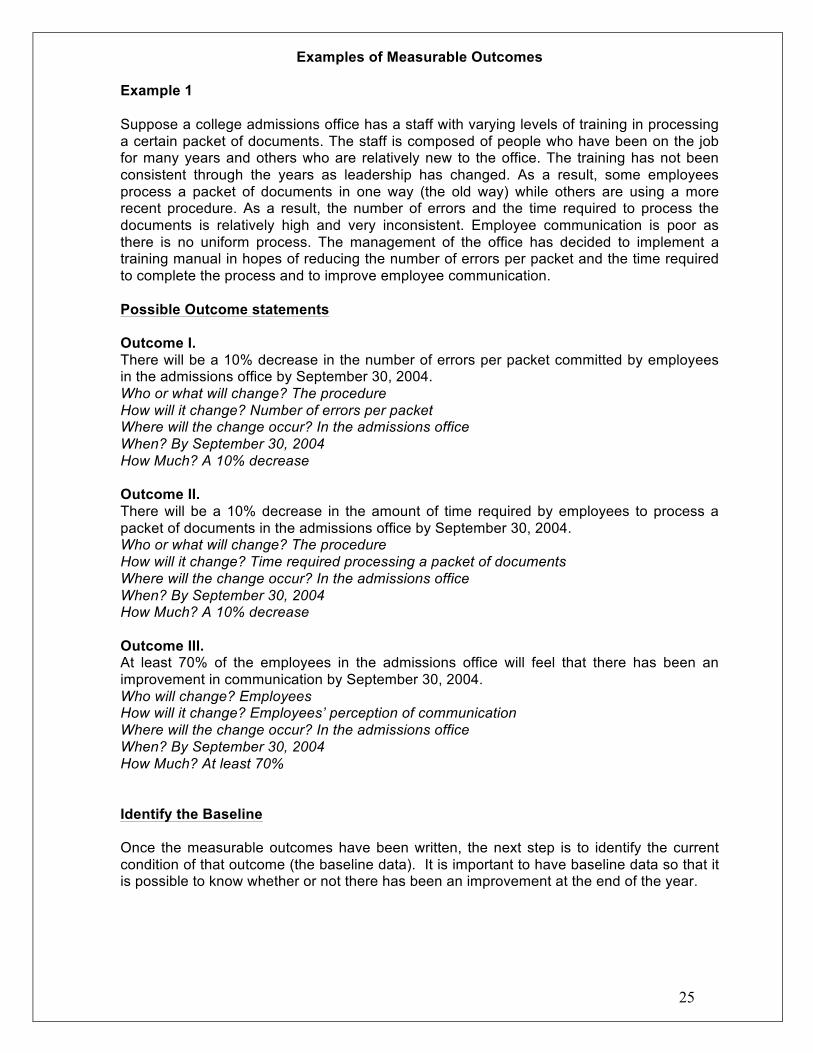
Examples of Measurable Outcomes Example 1 Suppose a college admissions office has a staff with varying levels of training in processing a certain packet of documents. The staff is composed of people who have been on the job for many years and others who are relatively new to the office. The training has not been consistent through the years as leadership has changed. As a result, some employees process a packet of documents in one way (the old way) while others are using a more recent procedure. As a result, the number of errors and the time required to process the documents is relatively high and very inconsistent. Employee communication is poor as there is no uniform process. The management of the office has decided to implement a training manual in hopes of reducing the number of errors per packet and the time required to complete the process and to improve employee communication. Possible Outcome statements Outcome I. There will be a 10% decrease in the number of errors per packet committed by employees in the admissions office by September 30, 2004. Who or what will change? The procedure How will it change? Number of errors per packet Where will the change occur? In the admissions office When? By September 30, 2004 How Much? A 10% decrease Outcome II. There will be a 10% decrease in the amount of time required by employees to process a packet of documents in the admissions office by September 30, 2004. Who or what will change? The procedure How will it change? Time required processing a packet of documents Where will the change occur? In the admissions office When? By September 30, 2004 How Much? A 10% decrease Outcome III. At least 70% of the employees in the admissions office will feel that there has been an improvement in communication by September 30, 2004. Who will change? Employees How will it change? Employees’ perception of communication Where will the change occur? In the admissions office When? By September 30, 2004 How Much? At least 70%
Identify the Baseline Once the measurable outcomes have been written, the next step is to identify the current condition of that outcome (the baseline data). It is important to have baseline data so that it is possible to know whether or not there has been an improvement at the end of the year.

26
Outcome I. Errors per packet will be counted and recorded for a 1 month period prior to the implementation of the training manual and then again for a 1 month period following the implementation of the manual. Outcome II. Processing time for a packet of documents will be measured for 1 month prior to the implementation of the training manual and then again for a 1 month period following the implementation of the training manual. Outcome III. A survey will be conducted for employees of the admissions office following the implementation of the training manual. The survey will contain questions pertaining to interoffice communication. Plan for Gathering Data Once the baseline has been identified, it is necessary to establish precisely how the data will be gathered. Outcome I. An auditing team will be identified. A random sample of 100 packets of documents processed before the implementation of the training manual will be selected and the number of errors recorded. Likewise, a random sample of 100 packets of documents processed after the implementation of the training manual will be selected and the number of errors recorded. Outcome II. Employees will use a time sheet to record the time required to process a packet of documents for a 1 month period prior to the implementation of the training manual and then again for a 1 month period following the implementation of the training manual. Outcome III. An effort will be made to identify and acquire an already existing office communication survey. If such a survey cannot be located and acquired within a reasonable amount of time, a survey will be developed within the office of admissions. Analyze the Data Now that the data has been identified and gathered, it is time to analyze the data and determine whether the outcome has been realized. Outcome I. The mean number of errors per packet will be calculated for the sample of documents processed prior to the implementation of the training manual and for the sample of documents processed after the implementation of the training manual. The following calculation will be made:
100*before errors ofnumber Mean
following errors ofnumber Mean before errors ofnumber Mean -
If this value is positive and greater than 10%, then the outcome will be realized.
27
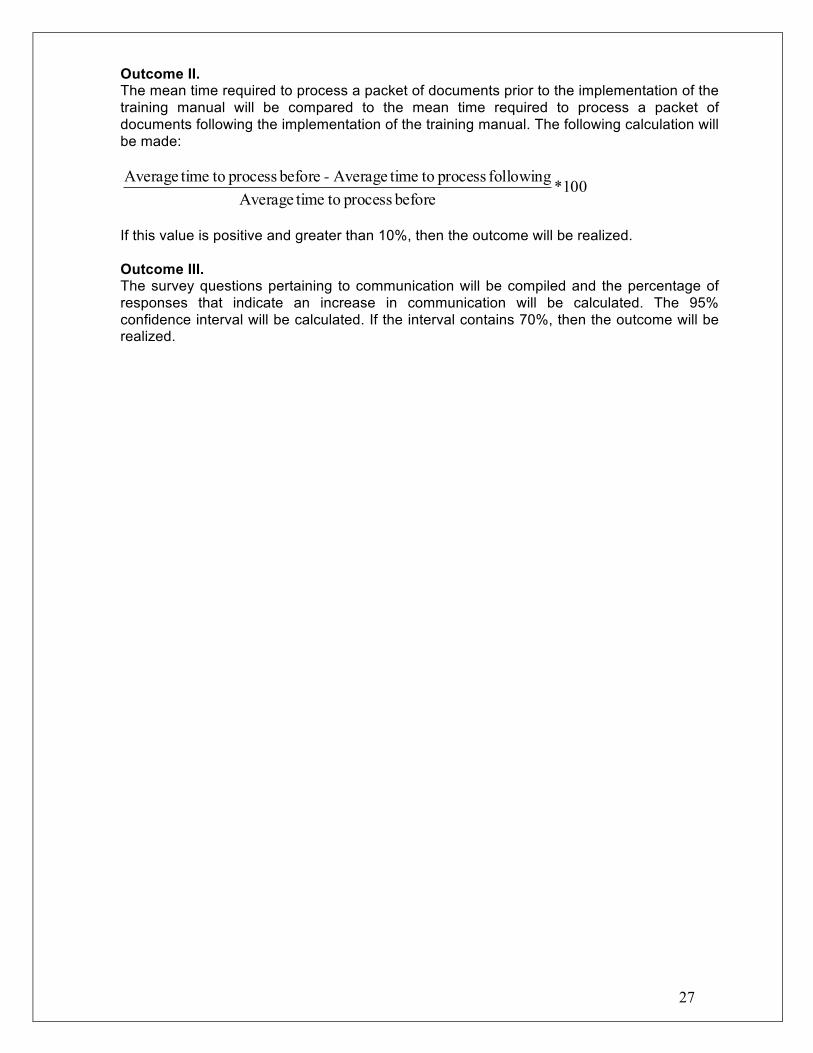
Outcome II. The mean time required to process a packet of documents prior to the implementation of the training manual will be compared to the mean time required to process a packet of documents following the implementation of the training manual. The following calculation will be made:
100*before process to timeAverage
following process to timeAveragebefore process to timeAverage -
If this value is positive and greater than 10%, then the outcome will be realized. Outcome III. The survey questions pertaining to communication will be compiled and the percentage of responses that indicate an increase in communication will be calculated. The 95% confidence interval will be calculated. If the interval contains 70%, then the outcome will be realized.

28
Example 2 Some mathematics faculty members have expressed an increase in concern over the ability to properly manipulate and simplify rational expressions by students enrolled in the college algebra course. The faculty has agreed to cooperate and have designed a lesson plan that they hope will improve this skill. Institutional effectiveness outcome statement Student Learning Outcome: Students in college algebra will demonstrate knowledge of manipulating and simplifying rational expressions. At least 80% of the students enrolled in the college algebra course at Volunteer State Community College will be able to manipulate and simplify rational expressions by the end of the fall semester.
Who will change? Students How will it change? Ability to properly manipulate and simplify rational expressions Where will the change occur? VSCC When? By end of fall semester, 2006 How Much? An 80% success rate
Identify the Data Students will be tested using a common exam containing questions that measure knowledge of manipulating and simplifying rational expressions. The results from problems on the exam pertaining to the manipulation and simplification of rational expressions will be identified and recorded. Plan for Gathering Data A college algebra end of course exam will be designed by the faculty teaching college algebra. The exam will be given to all students taking college algebra at VSCC each semester. Analyze the Data The results will be compiled and analyzed according to the formula
100*exam on the questions expression rational ofNumber correctly answered questions expression rational ofNumber
If the result of this calculation is at least 80%, then the objective will be met. If not, the faculty will search for an improvement to the lesson plan.
29
Examples of IE Plans The following examples have been created as examples only. Each division/departmental objective will be unique to the division/department.
30
Institutional Effectiveness Form
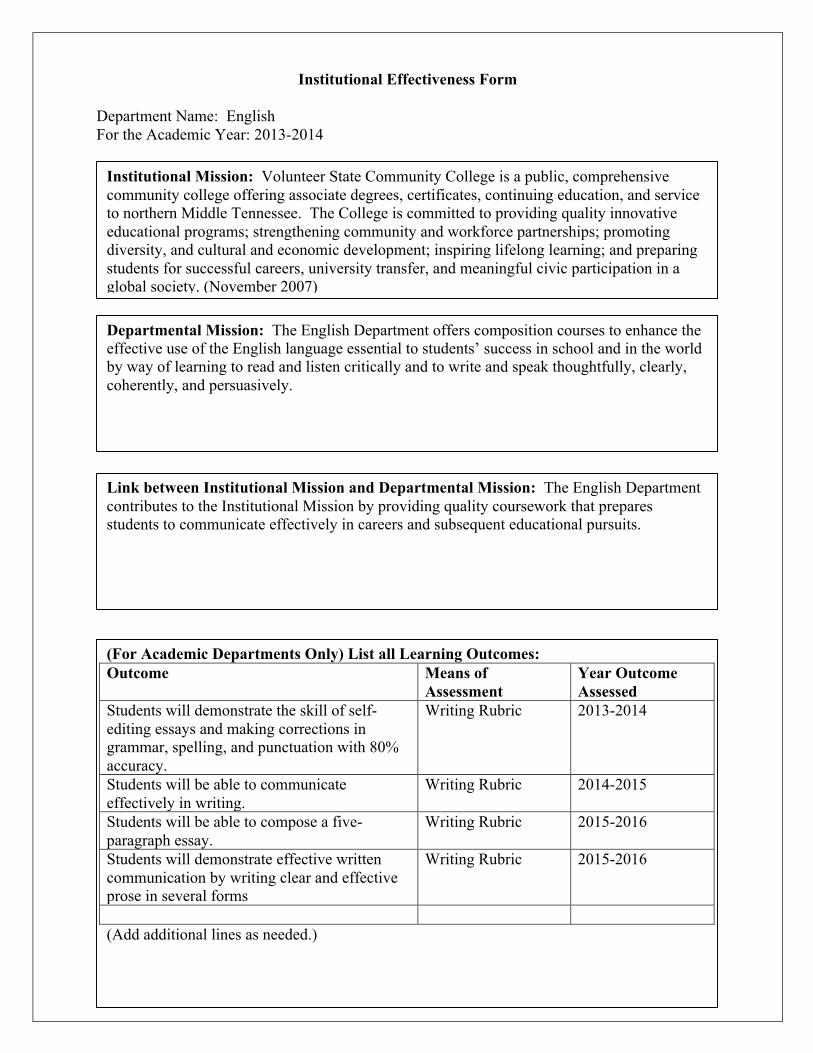
Department Name: English For the Academic Year: 2013-2014 Institutional Mission: Volunteer State Community College is a public, comprehensive
community college offering associate degrees, certificates, continuing education, and service to northern Middle Tennessee. The College is committed to providing quality innovative educational programs; strengthening community and workforce partnerships; promoting diversity, and cultural and economic development; inspiring lifelong learning; and preparing students for successful careers, university transfer, and meaningful civic participation in a global society. (November 2007) Departmental Mission: The English Department offers composition courses to enhance the effective use of the English language essential to students’ success in school and in the world by way of learning to read and listen critically and to write and speak thoughtfully, clearly, coherently, and persuasively.
Link between Institutional Mission and Departmental Mission: The English Department contributes to the Institutional Mission by providing quality coursework that prepares students to communicate effectively in careers and subsequent educational pursuits.
(For Academic Departments Only) List all Learning Outcomes: Outcome Means of
Assessment Year Outcome Assessed
Students will demonstrate the skill of self-editing essays and making corrections in grammar, spelling, and punctuation with 80% accuracy.
Writing Rubric 2013-2014
Students will be able to communicate effectively in writing.
Writing Rubric 2014-2015
Students will be able to compose a five-paragraph essay.
Writing Rubric 2015-2016
Students will demonstrate effective written communication by writing clear and effective prose in several forms
Writing Rubric 2015-2016
(Add additional lines as needed.)

31
Institutional Effectiveness Outcome 1:
Students will demonstrate the skill of self-editing essays and making corrections in grammar, spelling, and punctuation with 80% accuracy.
Strategic Planning Goal to Which this Outcome is Linked: (Go to http://www.volstate.edu/Research/Documents/StrategicPlan1015.pdf to see the College-wide strategic plan)
Q.3
Funds Budgeted to Support this Outcome:
none
This Outcome will be Assessed Using:
End of course paper graded using writing rubric
Baseline Data (Current Level of Performance):
2005-2006: 78% of students demonstrated the ability to self-edit their essay, with an accuracy rate of 80%.
Three years of trend data (if available):
2010-2011: 74% with accuracy of 80% 2011-2012: 80% with accuracy of 80% 2012-2013: 79% with accuracy of 80%
Target (Desired Level of Performance):
85% of students will be able to self-edit their essays with an accuracy rate of 80%.
Steps to Achieve the Target for this Outcome: (add additional steps as needed)
1.) Instructors will review assigned writings with students on a daily basis. 2.) Students will begin editing other students work and share their findings during scheduled class discussions. 3.) Students will be given a graded editing assignment.
Results of the Institutional Effectiveness Effort:
82% of students demonstrated the skills to self-edit their essay with an accuracy rate of 80%.
Future Plans Regarding this Outcome:
The results improved, but the target was not met. We will continue these interventions in the 2014-2015 and 2015-2016 years and will reassess on the 2016-2017 IE plan.

32
Institutional Effectiveness Outcome 2:
Increase total enrollment in English courses through expanded course offerings.
Strategic Planning Goal to Which this Outcome is Linked: (Go to http://www.volstate.edu/Research/Documents/StrategicPlan1015.pdf to see the College-wide strategic plan)
S.1
Funds Budgeted to Support this Outcome:
None; will use existing faculty at this time
This Outcome will be Assessed Using:
Enrollment in English courses
Baseline Data (Current Level of Performance):
3,571 enrolled in English courses in 2010
Three years of trend data (if available):
2011-2012: 3495 enrolled 2012-2013: 4261 enrolled 2013-2014: 3796 enrolled
Target (Desired Level of Performance):
4000 enrolled in English courses
Steps to Achieve the Target for this Outcome: (add additional steps as needed)
1.) Identify potential new courses. 2.) Survey students regarding interest in proposed new courses. 3.) Review survey results. 4.) Decide whether or not to offer courses; if decision is made to offer a course, begin designing the course.
Results of the Institutional Effectiveness Effort:
2014-2015: 3800 enrolled. The target was not met. Survey results showed that students are not interested in a Russian Literature offering at Vol State.
Future Plans Regarding this Outcome:
We will continue to work on this IE goal on the 2014-2015 plan.
33
Institutional Effectiveness Outcome 3:
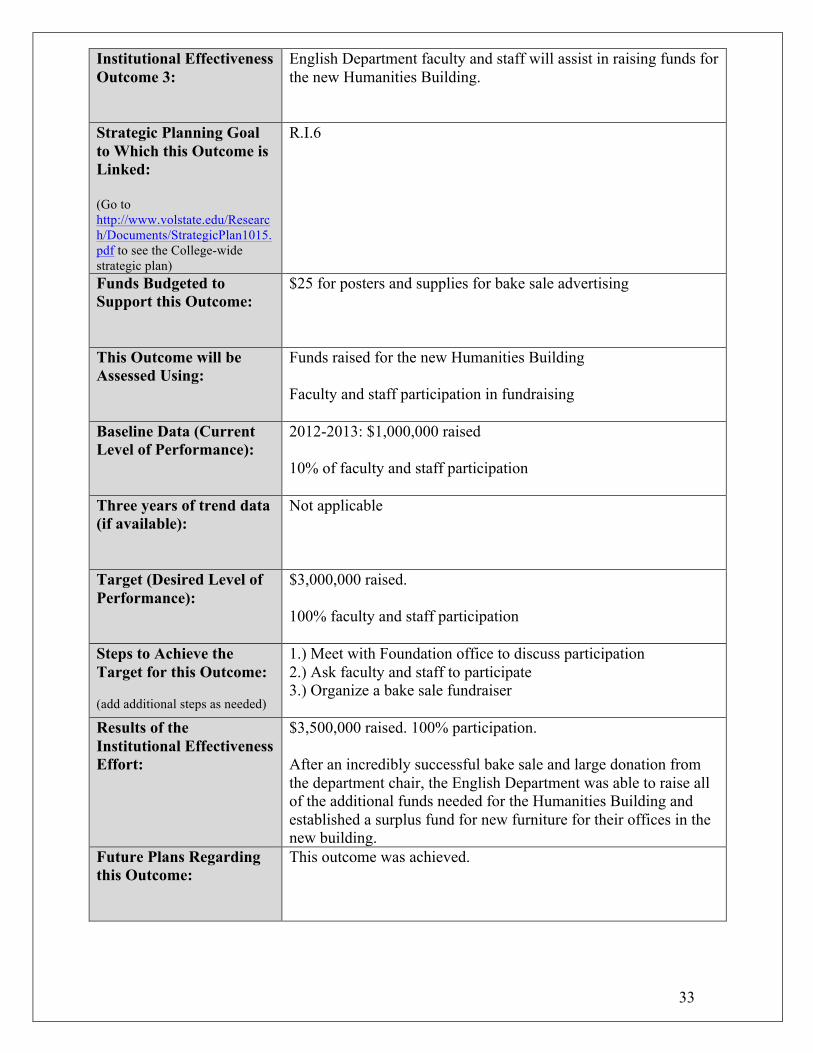
English Department faculty and staff will assist in raising funds for the new Humanities Building.
Strategic Planning Goal to Which this Outcome is Linked: (Go to http://www.volstate.edu/Research/Documents/StrategicPlan1015.pdf to see the College-wide strategic plan)
R.I.6
Funds Budgeted to Support this Outcome:
$25 for posters and supplies for bake sale advertising
This Outcome will be Assessed Using:
Funds raised for the new Humanities Building Faculty and staff participation in fundraising
Baseline Data (Current Level of Performance):
2012-2013: $1,000,000 raised 10% of faculty and staff participation
Three years of trend data (if available):
Not applicable
Target (Desired Level of Performance):
$3,000,000 raised. 100% faculty and staff participation
Steps to Achieve the Target for this Outcome: (add additional steps as needed)
1.) Meet with Foundation office to discuss participation 2.) Ask faculty and staff to participate 3.) Organize a bake sale fundraiser
Results of the Institutional Effectiveness Effort:
$3,500,000 raised. 100% participation. After an incredibly successful bake sale and large donation from the department chair, the English Department was able to raise all of the additional funds needed for the Humanities Building and established a surplus fund for new furniture for their offices in the new building.
Future Plans Regarding this Outcome:
This outcome was achieved.

34
Institutional Effectiveness Form
Department Name: Retention Support Services For the Academic Year: 2013-2014 Institutional Mission: Volunteer State Community College is a public, comprehensive
community college offering associate degrees, certificates, continuing education, and service to northern Middle Tennessee. The College is committed to providing quality innovative educational programs; strengthening community and workforce partnerships; promoting diversity, and cultural and economic development; inspiring lifelong learning; and preparing students for successful careers, university transfer, and meaningful civic participation in a global society. (November 2007) Departmental Mission: The Office of Retention Support Services exists to develop and implement student-centered programs focused on student success through promoting quality interactions and experiences for students.
Link between Institutional Mission and Departmental Mission: Retention Support Services helps the College achieve its mission by helping students be successful while enrolled so that they can achieve degrees or certificates and pursue careers or additional education after graduating from Vol State.
(For Academic Departments Only) List all Learning Outcomes: Outcome Means of
Assessment Year Outcome Assessed
(Add additional lines as needed.)

35
Institutional Effectiveness Outcome 1:
Increase retention of students who attend orientation.
Strategic Planning Goal to Which this Outcome is Linked: (Go to http://www.volstate.edu/Research/Documents/StrategicPlan1015.pdf to see the College-wide strategic plan)
A.I.1
Funds Budgeted to Support this Outcome:
$1000 for new orientation programming and supplies
This Outcome will be Assessed Using:
The percentage of students who attend orientation and are retained through the following semester of classes. Survey results from post-orientation survey.
Baseline Data (Current Level of Performance):
2011-2012 retention rate for orientation attendees was 55%.
Three years of trend data (if available):
2008-2009: 52% 2009-2010: 45% 2010-2011: 48%
Target (Desired Level of Performance):
80% of students who attend orientation will be retained to the following semester. 85% of students will be satisfied with their orientation and advising experience.
Steps to Achieve the Target for this Outcome: (add additional steps as needed)
1.) Develop a new on-campus orientation program promoting early interaction and relationship building with faculty and staff. 2.) Continue to require mandatory on-campus orientation for all students who are new freshmen, transfer and certificate students. 3.) Work with Academic Affairs, faculty, and Student Services personnel to target specific cohort advisors for new students. 4.) Train cohort advisors 5.) Work with Institutional Effectiveness to develop an assessment tool to provide students at the beginning of the semester. 6.) Ensure cohort advisors engage advisees monthly throughout the semester. 7.) Administer post-semester survey to gauge effectiveness of student success and engagement.
Results of the Institutional Effectiveness Effort:
75% of students who attended orientation were retained to the following semester. 95% of students indicated they were satisfied or very satisfied with their orientation and advising experience.
36
Future Plans Regarding this Outcome:
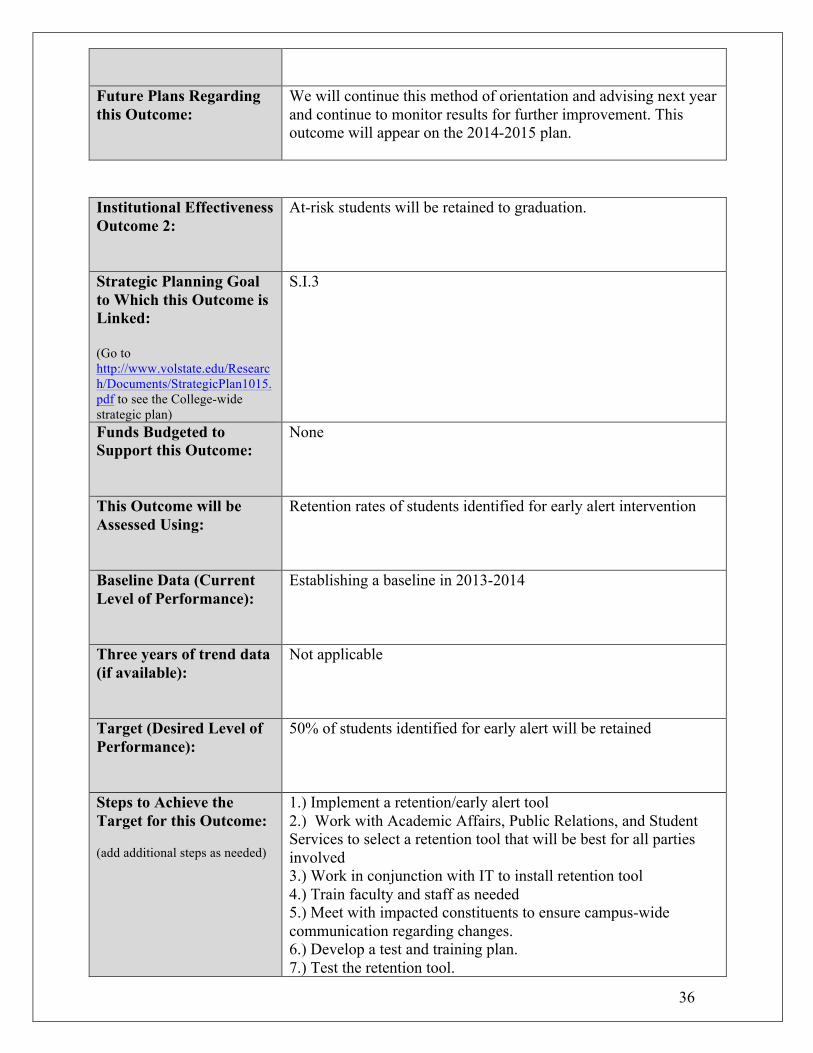
We will continue this method of orientation and advising next year and continue to monitor results for further improvement. This outcome will appear on the 2014-2015 plan.
Institutional Effectiveness Outcome 2:
At-risk students will be retained to graduation.
Strategic Planning Goal to Which this Outcome is Linked: (Go to http://www.volstate.edu/Research/Documents/StrategicPlan1015.pdf to see the College-wide strategic plan)
S.I.3
Funds Budgeted to Support this Outcome:
None
This Outcome will be Assessed Using:
Retention rates of students identified for early alert intervention
Baseline Data (Current Level of Performance):
Establishing a baseline in 2013-2014
Three years of trend data (if available):
Not applicable
Target (Desired Level of Performance):
50% of students identified for early alert will be retained
Steps to Achieve the Target for this Outcome: (add additional steps as needed)
1.) Implement a retention/early alert tool 2.) Work with Academic Affairs, Public Relations, and Student Services to select a retention tool that will be best for all parties involved 3.) Work in conjunction with IT to install retention tool 4.) Train faculty and staff as needed 5.) Meet with impacted constituents to ensure campus-wide communication regarding changes. 6.) Develop a test and training plan. 7.) Test the retention tool.

37
8.) Make adjustments as needed and test again, repeating until outcomes are successful. 9.) Complete any and all needed staff training. 10.) Go live.
Results of the Institutional Effectiveness Effort:
The Early Alert System was implemented. The system will be ready to use starting in the Fall 2013 semester.
Future Plans Regarding this Outcome:
This outcome will be included on the 2013-2014 plan. We will begin to use the Early Alert System and will be able to measure retention of students referred using the system.
Institutional Effectiveness Outcome 3:
Volunteer State Community College Students will be retained to graduation.
Strategic Planning Goal to Which this Outcome is Linked: (Go to http://www.volstate.edu/Research/Documents/StrategicPlan1015.pdf to see the College-wide strategic plan)
S.I.3
Funds Budgeted to Support this Outcome:
Not applicable
This Outcome will be Assessed Using:
IPEDS retention rate from the fall enrollment survey
Baseline Data (Current Level of Performance):
2009: 57% full time / 45% part time
Three years of trend data (if available):
2009: 57% full time / 45% part time 2010: 54% full time / 45% part time 2011: 50% full time / 43% part time
Target (Desired Level of Performance):
60% full time / 60% part time
Steps to Achieve the Target for this Outcome:
1.) Develop a database that is devoted strictly to issues of retention 2.) Working with Institutional Research, identify all available

38
(add additional steps as needed)
retention-related data. 3.) Identify the data sets that will require having a Banner report written to pull the data. 4.) Work with Institutional Research to have Banner reports written and to format the database. 5.) Have at least 75% of the data in the database by the end of March 2013.
Results of the Institutional Effectiveness Effort:
The database was constructed and will be ready to use in Fall 2013. At this point, we will be able to use the database to identify warning signs for attrition and to develop plans for improving retention rates.
Future Plans Regarding this Outcome:
This outcome will be included on the 2013-2014 plan. We will begin to use the database and will be able to improve retention of students using the system.

39
Assessment Links Learning Outcomes: Recommended Reading http://www.wwu.edu/depts/assess/slo.htm Best Practices of Electronically Offered Degree and Certificate Programs http://www.wcet.info/resources/accreditation/index.asp Internet Resources for Higher Education Outcomes Assessment http://www2.acs.ncsu.edu/UPA/assmt/resource.htm Institutional Effectiveness Resources on the Internet http://www.dixie.edu/effective/inet-res.htm Center for the Study of College Student Retention http://www.cscsr.org/ Assessment and Evaluation Clearinghouse http://www.psu.edu/president/pia/cqi/index.htm National Center for Educational Statistics (NCES) http://nces.ed.gov/ Southern Regional Education Board http://www.sreb.org
Other Links Tennessee VSCC Office of Institutional Effectiveness, Research, Planning and Assessment http://www.volstate.edu/research Tennessee Board of Regents http://www.tbr.state.tn.us Tennessee Higher Education Commission http://www.state.tn.us/thec/ Tennessee Association of Institutional Research (TENNAIR) http://www.tennair.org/ National and Regional U.S. Department of Education http://www.ed.gov/index.html Southern Association of Colleges and Schools (SACS) http://www.sacs.org American Association of Higher Education Forums http://www.aahe.org/assessment/ Association of Institutional Research (AIR) http://airweb.org Southeastern Association of Community College Research (SACCR) http://www.tcc.edu/welcome/collegeadmin/OIE/SACCR/index.htm Southern Association of Institutional Research (SAIR) http://www.sair.org
40
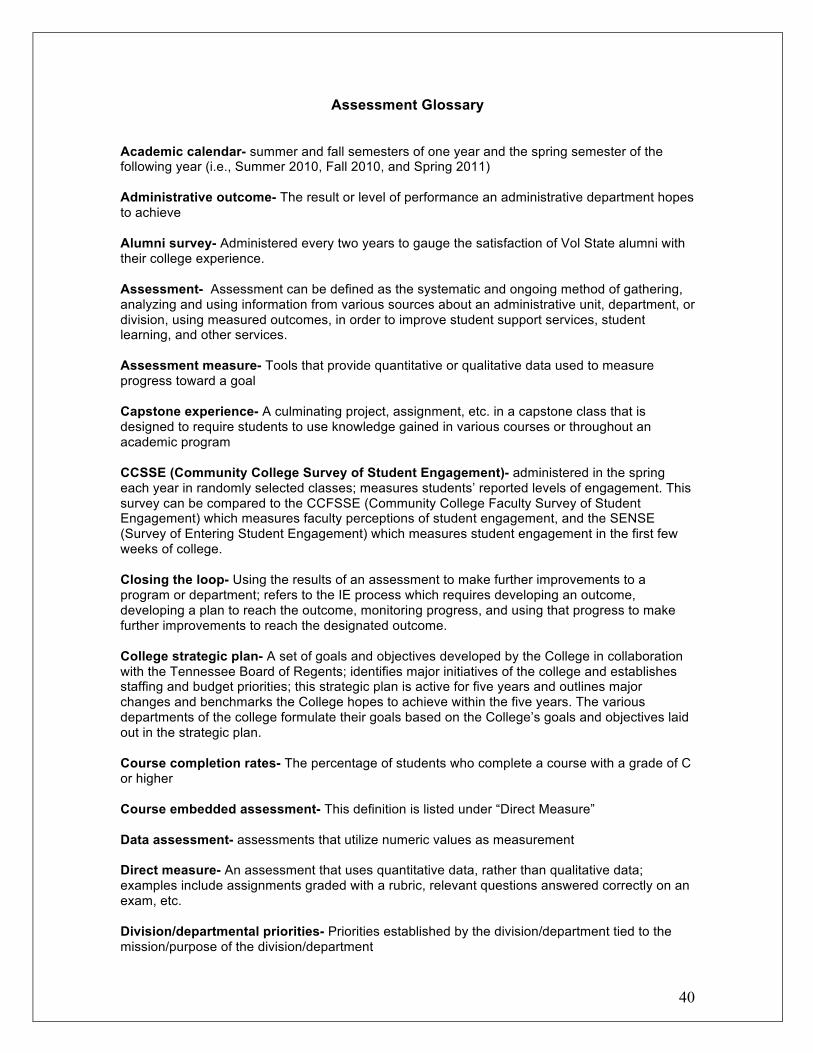
Assessment Glossary Academic calendar- summer and fall semesters of one year and the spring semester of the following year (i.e., Summer 2010, Fall 2010, and Spring 2011) Administrative outcome- The result or level of performance an administrative department hopes to achieve Alumni survey- Administered every two years to gauge the satisfaction of Vol State alumni with their college experience. Assessment- Assessment can be defined as the systematic and ongoing method of gathering, analyzing and using information from various sources about an administrative unit, department, or division, using measured outcomes, in order to improve student support services, student learning, and other services. Assessment measure- Tools that provide quantitative or qualitative data used to measure progress toward a goal Capstone experience- A culminating project, assignment, etc. in a capstone class that is designed to require students to use knowledge gained in various courses or throughout an academic program CCSSE (Community College Survey of Student Engagement)- administered in the spring each year in randomly selected classes; measures students’ reported levels of engagement. This survey can be compared to the CCFSSE (Community College Faculty Survey of Student Engagement) which measures faculty perceptions of student engagement, and the SENSE (Survey of Entering Student Engagement) which measures student engagement in the first few weeks of college. Closing the loop- Using the results of an assessment to make further improvements to a program or department; refers to the IE process which requires developing an outcome, developing a plan to reach the outcome, monitoring progress, and using that progress to make further improvements to reach the designated outcome. College strategic plan- A set of goals and objectives developed by the College in collaboration with the Tennessee Board of Regents; identifies major initiatives of the college and establishes staffing and budget priorities; this strategic plan is active for five years and outlines major changes and benchmarks the College hopes to achieve within the five years. The various departments of the college formulate their goals based on the College’s goals and objectives laid out in the strategic plan. Course completion rates- The percentage of students who complete a course with a grade of C or higher Course embedded assessment- This definition is listed under “Direct Measure” Data assessment- assessments that utilize numeric values as measurement Direct measure- An assessment that uses quantitative data, rather than qualitative data; examples include assignments graded with a rubric, relevant questions answered correctly on an exam, etc. Division/departmental priorities- Priorities established by the division/department tied to the mission/purpose of the division/department
41
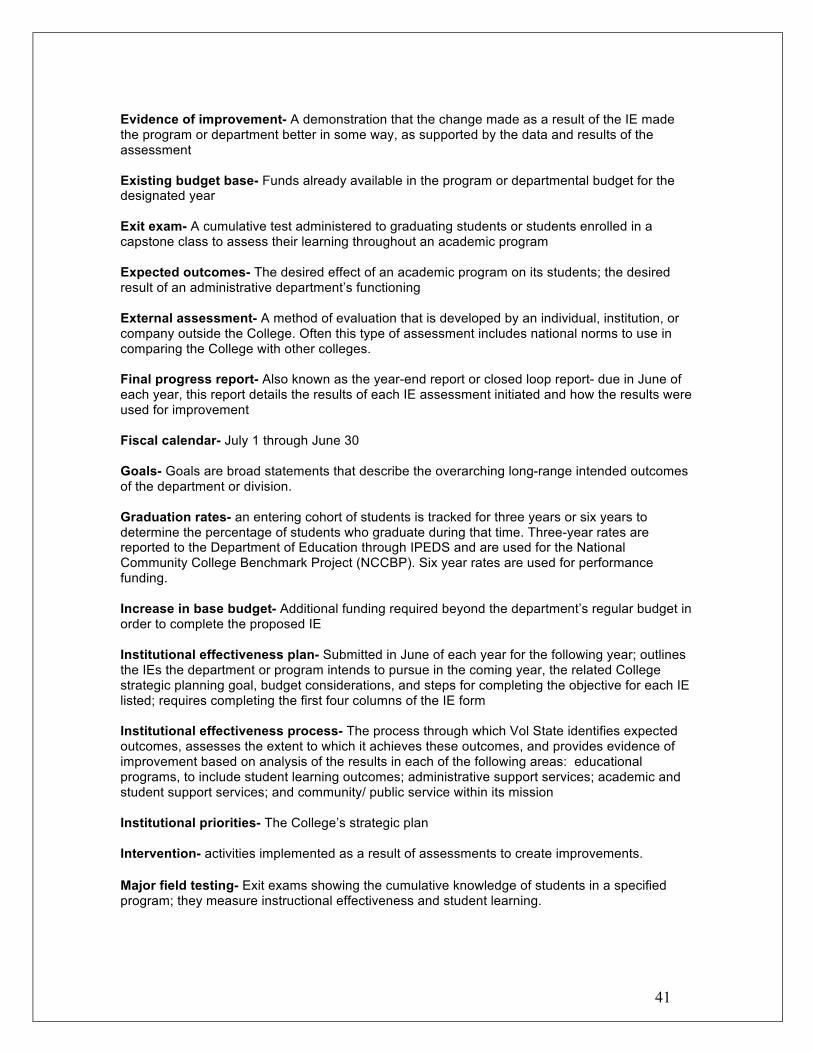
Evidence of improvement- A demonstration that the change made as a result of the IE made the program or department better in some way, as supported by the data and results of the assessment Existing budget base- Funds already available in the program or departmental budget for the designated year Exit exam- A cumulative test administered to graduating students or students enrolled in a capstone class to assess their learning throughout an academic program Expected outcomes- The desired effect of an academic program on its students; the desired result of an administrative department’s functioning External assessment- A method of evaluation that is developed by an individual, institution, or company outside the College. Often this type of assessment includes national norms to use in comparing the College with other colleges. Final progress report- Also known as the year-end report or closed loop report- due in June of each year, this report details the results of each IE assessment initiated and how the results were used for improvement Fiscal calendar- July 1 through June 30 Goals- Goals are broad statements that describe the overarching long-range intended outcomes of the department or division. Graduation rates- an entering cohort of students is tracked for three years or six years to determine the percentage of students who graduate during that time. Three-year rates are reported to the Department of Education through IPEDS and are used for the National Community College Benchmark Project (NCCBP). Six year rates are used for performance funding. Increase in base budget- Additional funding required beyond the department’s regular budget in order to complete the proposed IE Institutional effectiveness plan- Submitted in June of each year for the following year; outlines the IEs the department or program intends to pursue in the coming year, the related College strategic planning goal, budget considerations, and steps for completing the objective for each IE listed; requires completing the first four columns of the IE form Institutional effectiveness process- The process through which Vol State identifies expected outcomes, assesses the extent to which it achieves these outcomes, and provides evidence of improvement based on analysis of the results in each of the following areas: educational programs, to include student learning outcomes; administrative support services; academic and student support services; and community/ public service within its mission Institutional priorities- The College’s strategic plan Intervention- activities implemented as a result of assessments to create improvements. Major field testing- Exit exams showing the cumulative knowledge of students in a specified program; they measure instructional effectiveness and student learning.

42
Measurable outcome- The intended outcome should be one for which it is feasible to collect accurate and reliable data. Having clearly defined outcomes is an integral part of assessment. Outcomes state expected accomplishments or improvements that the department or division has identified, after careful consideration of the critical processes and functions. Measurement- Data gathered to document an IE Mission- A mission statement is a broad statement of the department or divisions direction. Ensure that the mission statement clearly supports the institution’s mission. Does your statement distinguish you from other departments or divisions? Mission distinctive institutional goals- goals established by the institution that recognize the college’s uniqueness, such as allied health programs. Nationally normed- An assessment that generally is purchased from an outside company who offers the same assessment to institutions nation-wide and compiles the results from all institutions. These results, or national norms, are given to all participating institutions so that they can compare their results with the averages of all schools. Normed/norms- Averages used for comparison purposes Operating budget- Funds given to each department or program annually to cover the expenses of general activities for the year Program outcome- What students should know or be able to do upon completion of a program. Program review- Review of academic program conducted by at least one qualified, out-of-state, external reviewer after the college prepares a self-study. Purpose- List of reason(s) why the department or division performs major activities or operations. QEP – Problem solving- Quality Enhancement Plan; a QEP is required by SACS, the College’s accrediting agency, with every 10 year reaffirmation. It is designed to foster improvement in an area of need designated by the College. The College determines its plan for initiating the improvement, the plan is approved by SACS, and then the College enacts the plan and reports its progress to SACS; the focus of the College’s current QEP is enhancing students’ problem solving skills. Qualitative results- Assessment measures based on subjective responses, such as student opinions gathered from a survey. Quantitative measure- Assessment results based on objective data, such as correct or incorrect answers, job placement rates, or licensure exam pass rates. Quantitative Results- Summary of objective responses on a questionnaire or program evaluation; statistics about use by students and various population subgroups; needs assessments, follow-up studies, and self-study reports; institutional research reports and fact books; comparative or benchmark data at local, regional or national level. Reliability- Likelihood that the results of an assessment can be replicated if the assessment is repeated. Results-oriented- The outcome should aid in identifying where program improvements are needed. It should state where you would like to be within a specified time period (e.g., 10% increase in funding within one year, 90% satisfaction rating for next year, 10% improvement in student performance within two years).

43
Rubric- A scale that measures assessment outcomes by designating criteria that must be met in order for each score to be awarded. SACS- Southern Association of Colleges and Schools; Vol State’s regional accrediting body Student Satisfaction Inventory- SSI; a survey administered to students during the spring semester that measures their level of satisfaction and the level of importance they place on numerous aspects of the College including student services, business office policies, advising, security, instruction, etc. State strategic goal- established by the governor and specifies the priorities of the state. Success rates- The percentage who meet a goal, such as course completion, graduation, passing a licensure exam, etc. Target- A goal Time- When will change occur? The outcome should indicate the timeframe for assessment, e.g., every spring term. Top-down process- An initiative started by the highest level of administration, who request participation from lower level employees Triangulation- Using multiple measures of assessment data to demonstrate progress toward an IE goal; this is particularly useful when using qualitative data Use of results- Demonstration that assessment data has been used by the program or department to improve its activities in some way.

44
Action Verbs that Result in Strong Student Learning Outcomes
Add Analyze Apply Appraise Arrange Assess Associate Breakdown Calculate Categorize Change Classify Combine Compare Compile Complete Compose Compute Conclude Contrast Convert Count Create Criticize Critique Defend Define Demonstrate Describe Design Detect Determine Develop Devise Diagram Differentiate Discover Discriminate Discuss
Distinguish Divide Draw Drive Estimate Examine Explain Extend Extrapolate Generalize Generate Give examples Grade Graph Group Identify Illustrate Infer Integrate Interpolate Interpret Judge Justify Labels List Manipulate Match Measure Modify Name Operate Order Organize Outline Outlines Paraphrase Plan Point out Predict
Prepare Prescribe Produce Propose Quote Rank Rate Read Rearrange Recall Recite Recognize Reconstruct Record Relate Related Reorganize Repeat Reproduces Revise Rewrite Select Selects Separate Show Solve Specify State Subdivide Subtract Summarize Support Test Transform Translate Use Utilize Write