institutional information concepts and definitions - unsd · biomass stock per hectare would imply...
TRANSCRIPT

Goal 15: Protect, restore and promote sustainable use of terrestrial ecosystems, sustainably manage
forests, combat desertification, and halt and reverse land degradation and halt biodiversity loss.
Target 15.2: By 2020, promote the implementation of sustainable management of all types of
forests, halt deforestation, restore degraded forests and substantially increase afforestation and
reforestation globally.
Indicator 15.2.1: Progress towards sustainable forest management
Institutional information
Organization(s):
Food and Agriculture Organization of the United Nations (FAO)
Concepts and definitions
Definition:
“Sustainable forest management” (SFM) is a central concept for Goal 15 and target 15.1 as well as for
target 15.2. It has been formally defined, by the UN General Assembly, as follows:
[a] dynamic and evolving concept [that] aims to maintain and enhance the economic, social and
environmental values of all types of forests, for the benefit of present and future generations” (Resolution
A/RES/62/98)
The indicator is composed of five sub-indicators that measure progress towards all dimensions of
sustainable forest management. The environmental values of forests are covered by three sub-indicators
focused on the extension of forest area, biomass within the forest area and protection and maintenance
of biological diversity, and of natural and associated cultural resources. Social and economic values of
forests are reconciled with environmental values through sustainable management plans. The sub-
indicator provides further qualification to management of forest areas, by assessing areas which are
independently verified for compliance with a set of national or international standards.
The sub-indicators are:
Forest area annual net change rate
Above-ground biomass stock in forest
Proportion of forest area located within legally established protect areas
Proportion of forest area under a long term forest management plan
Forest area under an independently verified forest management certification scheme
A dashboard is used to assess progress related to the five sub-indicators. The adoption of the dashboard
approach provides for clear view of areas where progress towards sustainable development goals has
been achieved.

Rationale:
The definition of SFM by the UN General Assembly contains several key aspects, notably that sustainable
forest management is a concept which varies over time and between countries, whose circumstances –
ecological, social and economic – vary widely, but that it should always address a wide range of forest
values, including economic, social and environmental values, and take intergenerational equity into
account.
Clearly a simple measure of forest area, while essential, and used for target 15.1, is insufficient to
monitor sustainable forest management as a whole. The significance of the five sub-indicators can be
briefly explained as follows:
1. Trends in forest area are crucial for monitoring SFM. The first sub-indicator focuses on both the
direction of change (whether there is a loss or gain in forest area) and how the change rate is
changing over time; the latter is important in order to capture progress among countries that are
losing forest area, but have managed to reduce the rate of annual forest area loss.
2. Changes in the above-ground biomass stock in forest indicate the balance between gains in biomass
stock due to forest growth and losses due to wood removals, natural losses, fire, wind, pests and
diseases. At country level and over a longer period, sustainable forest management would imply a
stable or increasing biomass stock per hectare, while a long-term reduction of biomass stock per
hectare would imply either unsustainable management of the forests and degradation or unexpected
major losses due to fire, wind, pests or diseases.
3. The change in forest area within legally protected areas is a proxy for trends in forest biodiversity
conservation and a clear indication of the political will to protect and conserve forest biodiversity.
This indicator is related to the CBD Aichi Target 11 which calls for each country to conserve at least
17 per cent of terrestrial and inland water areas.
4. The fourth sub-indicator looks at the forest area that is under a long term forest management plan.
The existence of a documented forest management plan is the basis for long term and sustainable
management of the forest resources for a variety of management objectives such as for wood and
non-wood forest products, protection of soil and water, biodiversity conservation, social and cultural
use, and a combination of two or several of these. An increasing area under forest management plan
is therefore an indicator of progress towards sustainable forest management.
5. The fifth sub-indicator is the forest area that is certified by an independently verified forest
management certification scheme. Such certification schemes apply standards that generally are
higher than those established by the countries’ own normative frameworks, and compliance is
verified by an independent and accredited certifier. An increase in certified forest area therefore
provides an additional indication of progress towards sustainable forest management. It should
however be noted that there are significant areas of sustainably managed forest which are not
certified, either because their owners have chosen not to seek certification (which is voluntary and
market-based) or because no credible or affordable certification scheme is in place for that area.
Concepts:
See Annex 1 with Terms and Definitions.
Comments and limitations:
The five sub-indicators chosen to illustrate progress towards sustainable forest management do not fully
cover all aspects of sustainable forest management. In particular, social and economic aspects are poorly

reflected in the current set of sub-indicators. Furthermore, there are some data gaps, and the trends of
some of the sub-indicators reflect different sets of countries. While the dashboard illustrates the progress
on the individual sub-indicators, there is no weighting of the relative importance of the sub-indicators.
Methodology
Computation Method:
At national level, forest area, biomass stock, forest area within protected areas, forest area under
management plan and forest area under an independently verified forest management certification
scheme are reported directly to FAO for pre-established reference years. Based on the country reported
data, FAO then makes country-level estimates of the forest area net change rate using the compound
interest formula, and also the proportion of forest area within protected area and under management
plan.
No dashboard traffic lights are made at country level.
Disaggregation:
No further disaggregation of this indicator.
Treatment of missing values:
At country level
For countries and territories where no information was provided to FAO for FRA 2015 (79 countries
and territories representing 1.2 percent of the global forest area), a report was prepared by FAO
using existing information from previous assessments and literature search.
At regional and global levels
See above.
Regional aggregates:
See Annex 2 – Methodology. It should be noted that for those sub-indicators where there are gaps in the
data set, only the countries that reported a complete time series are included in the regional and global
aggregates. Annex 2 also shows how the dashboard traffic lights are applied at global and regional level.
Sources of discrepancies:
The national figures in the database are reported by the countries themselves following a standardized
format, definitions and reporting years, thus eliminating any discrepancies between global and national
figures. The reporting format ensures that countries provide the full reference for original data sources as
well as national definitions and terminology. Separate sections in the reporting format (country reports)
deal with the analysis of data (including any assumptions made and the methods used for estimates and
projections to the common reporting years); calibration of data to the official land area as held by FAO;
and reclassification of data to the classes used in FAO’s Global Forest Resources Assessments.

Methods and guidance available to countries for the compilation of the data at the national level:
Data on all sub-indicators are provided to FAO by countries in the form of a country report following a
standard format, which includes the original data and reference sources and descriptions of how these
have been used to estimate the forest area for different points in time. Data on forest certification is
prefilled with information provided by the major certification schemes and countries review and amend
this information as necessary.
Detailed methodology and guidance on how to prepare the country reports and to convert national data
according to national categories and definitions to FAO’s global categories and definitions is found in the
document “Guide for country reporting for FRA 2015”, http://www.fao.org/3/a-au190e.pdf.
Quality assurance
Once received, the country reports undergo a rigorous review process to ensure correct use of definitions
and methodology as well as internal consistency. A comparison is made with past assessments and other
existing data sources. Regular contacts between national correspondents and FAO staff by e-mail and
regional/sub-regional review workshops form part of this review process.
All country reports (including those prepared by FAO) are sent to the respective Head of Forestry for
validation before finalization and publishing of data. The data are then aggregated at sub-regional,
regional and global levels by the FRA team at FAO.
Data Sources
Description:
Data on the sub-indicators are collected periodically (until now every 5 years) by FAO’s Global Forest
Resources Assessment (FRA) programme. All data are provided to FAO by countries in the form of a
country report following a standard format, which includes the original data and reference sources and
descriptions of how these have been used to estimate the forest area for different points in time.
Once received, the country reports undergo a rigorous review process to ensure correct use of definitions
and methodology as well as internal consistency. A comparison is made with past assessments and other
existing data sources. Regular contacts between national correspondents and FAO staff by e-mail and
regional/sub-regional review workshops form part of this review process. All country reports (including
those prepared by FAO) are sent to the respective Head of Forestry for validation before finalization. Data
are then aggregated at sub-regional, regional and global levels by the FRA team at FAO.
Collection process:
Officially nominated national correspondents and their teams prepare the country reports for the
assessment. Some prepare more than one report as they also report on dependent territories. For the
remaining countries and territories where no information is provided, a report is prepared by FAO using
existing information and a literature search.
Once received, the country reports undergo a rigorous review process to ensure correct use of definitions
and methodology as well as internal consistency. A comparison is made with past assessments and other
existing data sources. Regular contacts between national correspondents and FAO staff by e-mail and
regional/sub-regional review workshops form part of this review process. All country reports (including
those prepared by FAO) are sent to the respective Head of Forestry for validation before finalization. Data
are then aggregated at sub-regional, regional and global levels by the FRA team at FAO.
In order to obtain internationally comparable data, countries are requested to provide national
categories and definitions, and in case these are different than the FAO categories and definitions,
countries are requested to perform a reclassification of national data to correspond to the FAO
categories and definitions and to document this step in the country report. Countries are also requested
to use interpolation or extrapolation of national data in order to provide estimates for the specific
reporting years.
Data Availability
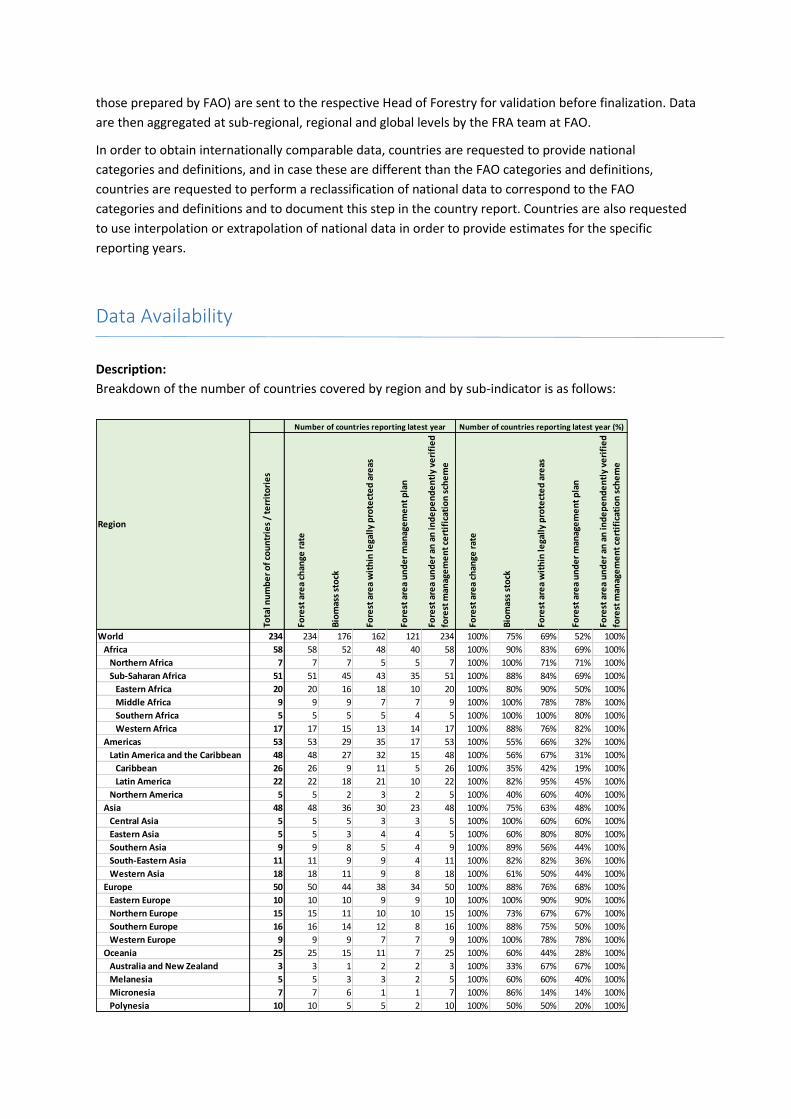
Description:
Breakdown of the number of countries covered by region and by sub-indicator is as follows:
Tota
l nu
mb
er
of
cou
ntr
ies
/ te
rrit
ori
es
Fore
st a
rea
chan
ge r
ate
Bio
mas
s st
ock
Fore
st a
rea
wit
hin
lega
lly
pro
tect
ed
are
as
Fore
st a
rea
un
de
r m
anag
em
en
t p
lan
Fore
st a
rea
un
de
r an
an
ind
ep
en
de
ntl
y ve
rifi
ed
fore
st m
anag
em
en
t ce
rtif
icat
ion
sch
em
e
Fore
st a
rea
chan
ge r
ate
Bio
mas
s st
ock
Fore
st a
rea
wit
hin
lega
lly
pro
tect
ed
are
as
Fore
st a
rea
un
de
r m
anag
em
en
t p
lan
Fore
st a
rea
un
de
r an
an
ind
ep
en
de
ntl
y ve
rifi
ed
fore
st m
anag
em
en
t ce
rtif
icat
ion
sch
em
e
World 234 234 176 162 121 234 100% 75% 69% 52% 100%
Africa 58 58 52 48 40 58 100% 90% 83% 69% 100%
Northern Africa 7 7 7 5 5 7 100% 100% 71% 71% 100%
Sub-Saharan Africa 51 51 45 43 35 51 100% 88% 84% 69% 100%
Eastern Africa 20 20 16 18 10 20 100% 80% 90% 50% 100%
Middle Africa 9 9 9 7 7 9 100% 100% 78% 78% 100%
Southern Africa 5 5 5 5 4 5 100% 100% 100% 80% 100%
Western Africa 17 17 15 13 14 17 100% 88% 76% 82% 100%
Americas 53 53 29 35 17 53 100% 55% 66% 32% 100%
Latin America and the Caribbean 48 48 27 32 15 48 100% 56% 67% 31% 100%
Caribbean 26 26 9 11 5 26 100% 35% 42% 19% 100%
Latin America 22 22 18 21 10 22 100% 82% 95% 45% 100%
Northern America 5 5 2 3 2 5 100% 40% 60% 40% 100%
Asia 48 48 36 30 23 48 100% 75% 63% 48% 100%
Central Asia 5 5 5 3 3 5 100% 100% 60% 60% 100%
Eastern Asia 5 5 3 4 4 5 100% 60% 80% 80% 100%
Southern Asia 9 9 8 5 4 9 100% 89% 56% 44% 100%
South-Eastern Asia 11 11 9 9 4 11 100% 82% 82% 36% 100%
Western Asia 18 18 11 9 8 18 100% 61% 50% 44% 100%
Europe 50 50 44 38 34 50 100% 88% 76% 68% 100%
Eastern Europe 10 10 10 9 9 10 100% 100% 90% 90% 100%
Northern Europe 15 15 11 10 10 15 100% 73% 67% 67% 100%
Southern Europe 16 16 14 12 8 16 100% 88% 75% 50% 100%
Western Europe 9 9 9 7 7 9 100% 100% 78% 78% 100%
Oceania 25 25 15 11 7 25 100% 60% 44% 28% 100%
Australia and New Zealand 3 3 1 2 2 3 100% 33% 67% 67% 100%
Melanesia 5 5 3 3 2 5 100% 60% 60% 40% 100%
Micronesia 7 7 6 1 1 7 100% 86% 14% 14% 100%
Polynesia 10 10 5 5 2 10 100% 50% 50% 20% 100%
Number of countries reporting latest year
Region
Number of countries reporting latest year (%)

Time series:
2000, 2005, 2010, 2015
Calendar
Data collection:
Source collection is next planned for 2018.
Data release:
Expected dates of release of new data: 2019
Data providers
National Forest Authorities, through officially nominated National Correspondents to FRA.
Data compilers
Food and Agriculture Organisation of the United Nations (FAO)
References
URL: http://www.fao.org/forest-resources-assessment/en/

Annex 1 – Terms and Definitions1
FOREST
Land spanning more than 0.5 hectares with trees higher than 5 meters and a canopy cover of more than 10 percent, or
trees able to reach these thresholds in situ. It does not include land that is predominantly under agricultural or urban
land use.
Explanatory notes
1. Forest is determined both by the presence of trees and the absence of other predominant land uses. The trees should be able to reach a minimum height of 5 meters.
2. Includes areas with young trees that have not yet reached but which are expected to reach a canopy cover of at least 10 percent and tree height of 5 meters or more. It also includes areas that are temporarily unstocked due to clear-cutting as part of a forest management practice or natural disasters, and which are expected to be regenerated within 5 years. Local conditions may, in exceptional cases, justify that a longer time frame is used.
3. Includes forest roads, firebreaks and other small open areas; forest in national parks, nature reserves and other protected areas such as those of specific environmental, scientific, historical, cultural or spiritual interest.
4. Includes windbreaks, shelterbelts and corridors of trees with an area of more than 0.5 hectares and width of more than 20 meters.
5. Includes abandoned shifting cultivation land with a regeneration of trees that have, or are expected to reach, a canopy cover of at least 10 percent and tree height of at least 5 meters.
6. Includes areas with mangroves in tidal zones, regardless whether this area is classified as land area or not.
7. Includes rubberwood, cork oak and Christmas tree plantations.
8. Includes areas with bamboo and palms provided that land use, height and canopy cover criteria are met.
9. Excludes tree stands in agricultural production systems, such as fruit tree plantations, oil palm plantations, olive orchards and agroforestry systems when crops are grown under tree cover. Note: Some agroforestry systems such as the “Taungya” system where crops are grown only during the first years of the forest rotation should be classified as forest.
ABOVE-GROUND BIOMASS
All living biomass above the soil including stem, stump, branches, bark, seeds, and foliage.
Explanatory note
1. In cases where forest understorey is a relatively small component of the aboveground biomass carbon pool, it is acceptable to exclude it, provided this is done in a consistent manner throughout the inventory time series.
PROTECTED AREAS
Areas especially dedicated to the protection and maintenance of biological diversity, and of natural and associated
cultural resources, and managed through legal or other effective means.
1 Global Forest Resources Assessment 2015 – Terms and Definitions. http://www.fao.org/docrep/017/ap862e/ap862e00.pdf
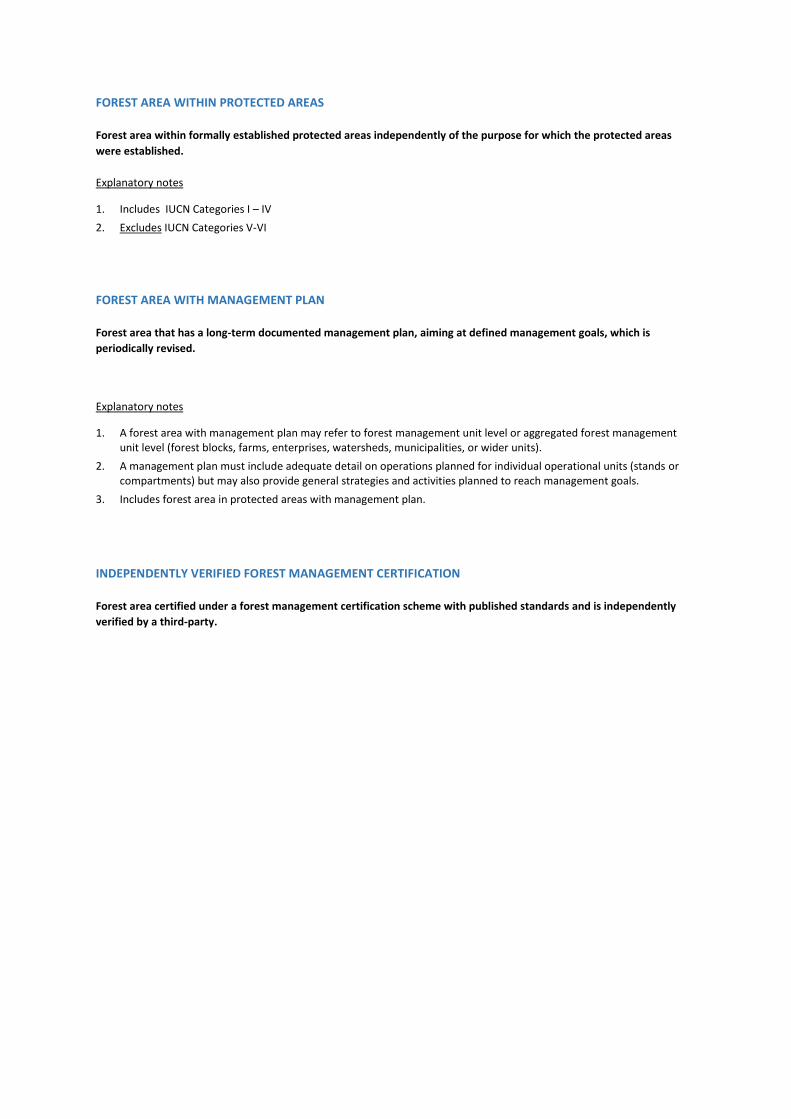
FOREST AREA WITHIN PROTECTED AREAS
Forest area within formally established protected areas independently of the purpose for which the protected areas
were established.
Explanatory notes
1. Includes IUCN Categories I – IV
2. Excludes IUCN Categories V-VI
FOREST AREA WITH MANAGEMENT PLAN
Forest area that has a long-term documented management plan, aiming at defined management goals, which is
periodically revised.
Explanatory notes
1. A forest area with management plan may refer to forest management unit level or aggregated forest management unit level (forest blocks, farms, enterprises, watersheds, municipalities, or wider units).
2. A management plan must include adequate detail on operations planned for individual operational units (stands or compartments) but may also provide general strategies and activities planned to reach management goals.
3. Includes forest area in protected areas with management plan.
INDEPENDENTLY VERIFIED FOREST MANAGEMENT CERTIFICATION
Forest area certified under a forest management certification scheme with published standards and is independently
verified by a third-party.

Annex 2 – Methodology
Sub-indicator 1 - Forest area annual net change rate
Unit: Percent
Reference period: Most recent period
Method of estimation: Compound interest formula
Translation to dashboard/traffic light:
The following flowchart explains the logic behind the translation of this indicator to a
dashboard/traffic light:
The forest area change direction is determined by examining the value of the forest area change
rate for the most recent period, a negative value indicate a loss of forest area, a zero value
means that forest area is stable and a positive value means that forest area has increased. The
change in forest area loss rate is based on a comparison of the current forest area net change
rate with the baseline forest area net change rate for the period 2010-2015.
Comments:
This traffic light takes into consideration both the direction of forest area change (if forest area
increases or decreases) as well as changes in the rate of forest area loss – the latter important in
order to indicate progress among countries that are losing forest area but manage to reduce the
loss rate.
For annual reporting, FAO can provide countries with imputed values based on previous trends
that they can use in case they don’t have new/updated information. The baseline should be
updated every 5 years, so in 2020 a new baseline is calculated. Also, at country level, if a
country gets new information and updates the historical time series, the baseline for the country
will be recalculated, respecting the 2010-2015 period.
Forest area
change
direction
Forest area stable
or increasing
Forest area
decreasing
Change in
forest area
loss rate
Loss rate
decreasing
Loss rate stable
or increasing

Sub-indicator 2 – Above-ground biomass stock in forest
Unit: tonnes/hectare
Reference year: Latest reporting year
Method of estimation: Biomass stock in forest (tonnes) / forest area (ha)
Translation to dashboard/traffic light:
The indicator value for the latest reporting year is compared with the indicator value for
previous reporting year for assessment of continuity of progress since last report.
The ratio (r) between the current indicator value and the previously reported value is calculated;
r>1 means an increase in stock per hectare, r<1 means a decrease while 1 indicates no change. A
narrow interval for r has been established to indicate a stable condition, and traffic-light colors
are assigned as follows:
r ≥ 1.01
0.99 < r < 1.01
r ≤ 0.99
Sub-indicator 3 – Proportion of forest area located within legally established protected areas.
Unit: Percent
Reference year: Latest reporting year
Method of estimation: Forest area within legally established protected areas / forest area 2015
* 100
Translation to dashboard/traffic light:
The indicator value for latest reporting year is compared the indicator value for previous
reporting year for assessment of continuity of progress since last report.
The ratio (r) between the current indicator value and the previously reported value is calculated;
r>1 means an increase in forest area within protected areas, r<1 means a decrease while 1
indicates no change. A narrow interval for r has been established to indicate a stable condition,
and traffic-light colors are assigned as follows:
r ≥ 1.01
0.99 < r < 1.01
r ≤ 0.99
Comment:
Using forest area in 2015 as denominator for estimating this indicator ensures that the time
series of percentages reflect real changes in the forest area within legally established protected
areas and is not affected by changes (losses or gains) in total forest area.
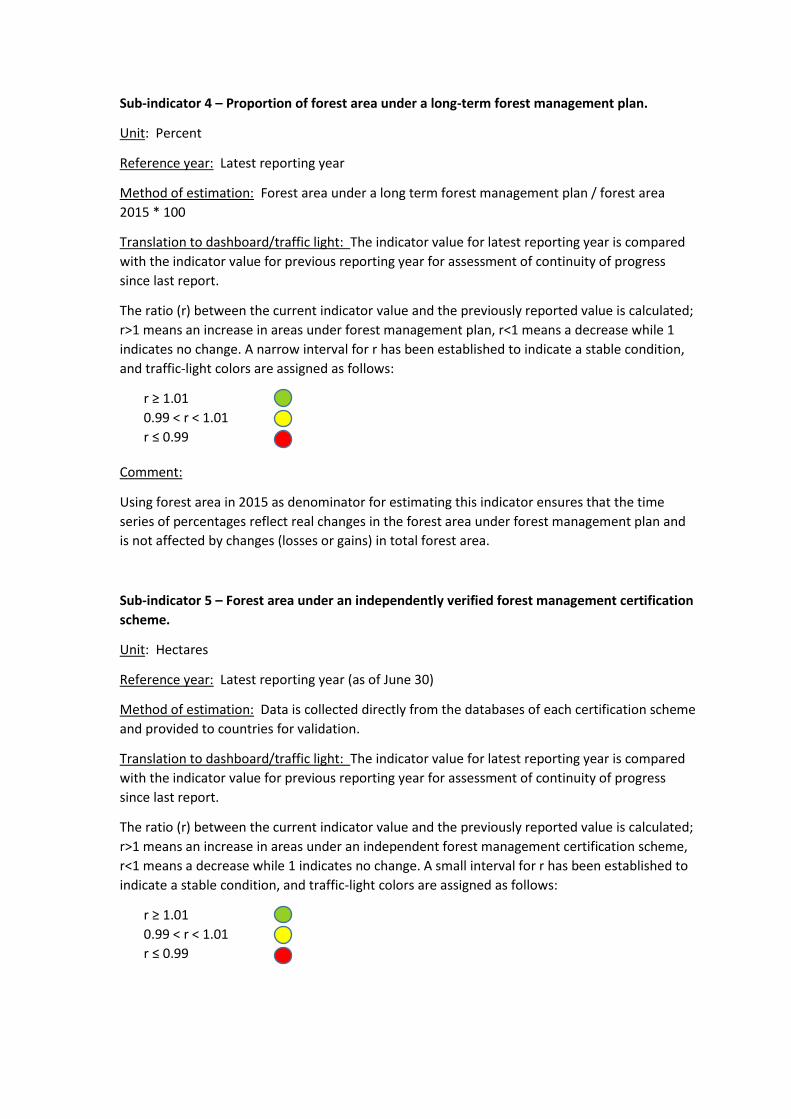
Sub-indicator 4 – Proportion of forest area under a long-term forest management plan.
Unit: Percent
Reference year: Latest reporting year
Method of estimation: Forest area under a long term forest management plan / forest area
2015 * 100
Translation to dashboard/traffic light: The indicator value for latest reporting year is compared
with the indicator value for previous reporting year for assessment of continuity of progress
since last report.
The ratio (r) between the current indicator value and the previously reported value is calculated;
r>1 means an increase in areas under forest management plan, r<1 means a decrease while 1
indicates no change. A narrow interval for r has been established to indicate a stable condition,
and traffic-light colors are assigned as follows:
r ≥ 1.01
0.99 < r < 1.01
r ≤ 0.99
Comment:
Using forest area in 2015 as denominator for estimating this indicator ensures that the time
series of percentages reflect real changes in the forest area under forest management plan and
is not affected by changes (losses or gains) in total forest area.
Sub-indicator 5 – Forest area under an independently verified forest management certification
scheme.
Unit: Hectares
Reference year: Latest reporting year (as of June 30)
Method of estimation: Data is collected directly from the databases of each certification scheme
and provided to countries for validation.
Translation to dashboard/traffic light: The indicator value for latest reporting year is compared
with the indicator value for previous reporting year for assessment of continuity of progress
since last report.
The ratio (r) between the current indicator value and the previously reported value is calculated;
r>1 means an increase in areas under an independent forest management certification scheme,
r<1 means a decrease while 1 indicates no change. A small interval for r has been established to
indicate a stable condition, and traffic-light colors are assigned as follows:
r ≥ 1.01
0.99 < r < 1.01
r ≤ 0.99

Comments:
Using June 30 as the date for reporting, allows for the certification bodies to have their
databases updated so they can provide information to FAO by end of the year, and then be
included in the annual reporting to SDG in the beginning of the following year.