institutional presentation - 2q14
TRANSCRIPT

Aug 8th, 2014

2
Company Defense & Security
Metallurgy & Plastics
Guidance Results Strategies
3
Company
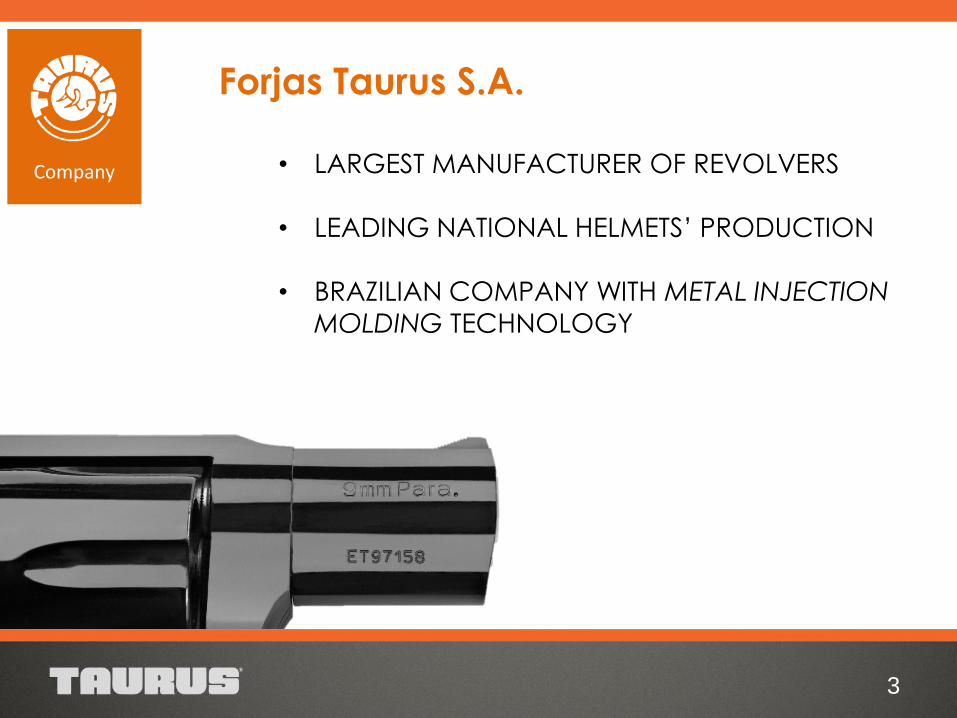
Forjas Taurus S.A.
• LARGEST MANUFACTURER OF REVOLVERS
• LEADING NATIONAL HELMETS’ PRODUCTION
• BRAZILIAN COMPANY WITH METAL INJECTION
MOLDING TECHNOLOGY
4
Company
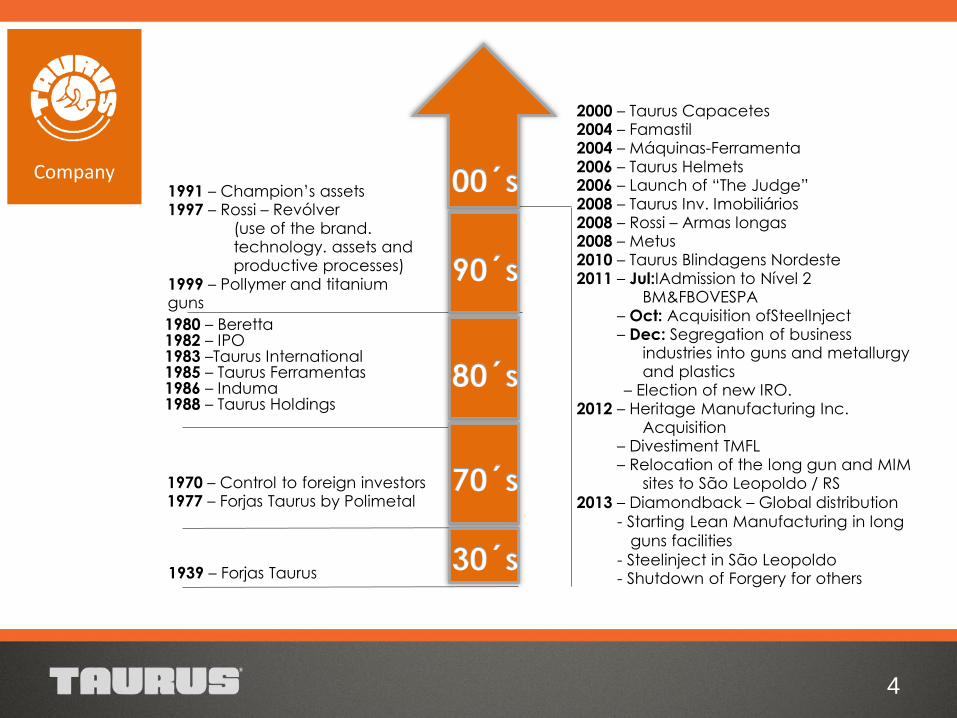
1980 – Beretta 1982 – IPO 1983 –Taurus International 1985 – Taurus Ferramentas 1986 – Induma 1988 – Taurus Holdings
2000 – Taurus Capacetes 2004 – Famastil 2004 – Máquinas-Ferramenta 2006 – Taurus Helmets 2006 – Launch of “The Judge” 2008 – Taurus Inv. Imobiliários 2008 – Rossi – Armas longas 2008 – Metus 2010 – Taurus Blindagens Nordeste 2011 – Jul:IAdmission to Nível 2
BM&FBOVESPA – Oct: Acquisition ofSteelInject – Dec: Segregation of business
industries into guns and metallurgy and plastics
– Election of new IRO. 2012 – Heritage Manufacturing Inc.
Acquisition – Divestiment TMFL – Relocation of the long gun and MIM
sites to São Leopoldo / RS
2013 – Diamondback – Global distribution
- Starting Lean Manufacturing in long
guns facilities
- Steelinject in São Leopoldo - Shutdown of Forgery for others
00´s
30´s
70´s
80´s
90´s
1939 – Forjas Taurus
1970 – Control to foreign investors 1977 – Forjas Taurus by Polimetal
1991 – Champion’s assets 1997 – Rossi – Revólver
(use of the brand. technology. assets and productive processes)
1999 – Pollymer and titanium guns
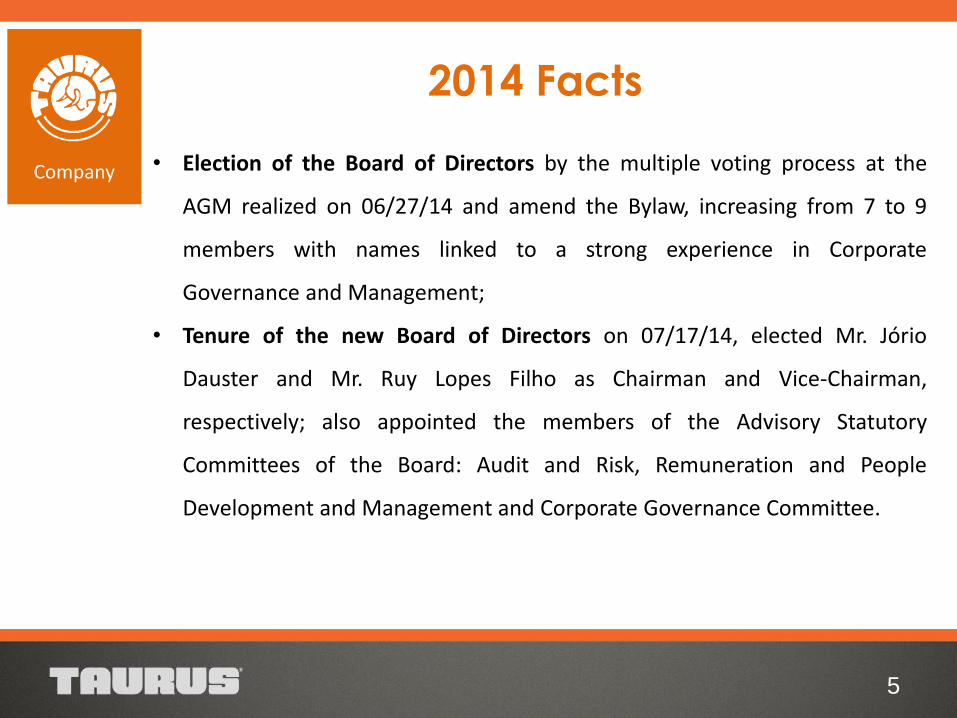
2014 Facts
• Election of the Board of Directors by the multiple voting process at the
AGM realized on 06/27/14 and amend the Bylaw, increasing from 7 to 9
members with names linked to a strong experience in Corporate
Governance and Management;
• Tenure of the new Board of Directors on 07/17/14, elected Mr. Jório
Dauster and Mr. Ruy Lopes Filho as Chairman and Vice-Chairman,
respectively; also appointed the members of the Advisory Statutory
Committees of the Board: Audit and Risk, Remuneration and People
Development and Management and Corporate Governance Committee.
5
Company
• Actions for operational improvement: a process and products review in
order to reduce costs and expenses, measured by indicators that show a
reduction in staff and product portfolio (from 5,500 SKUS on Dec/13 to 400
on Dec/14);
• Actions for administrative improvemet: implementation of new ERP
modules, review of the entire value chain, balancing costs and the structure
of products and local and international sales, aiming to better internal
controls and compliance with market requirements;
6
Company
2014 Facts
• Trends and benefits of these transformations:
• Results-oriented strategic focus in the medium and long term;
• Resumption slow but gradual and continuos of the Company’s
perfomance, according to market conditions and productivity;
• Projects seeking greater productivity, quality and profitability;
• Recovery of margins and profitability;
• Continuos pursuit of maximazing shareholder value added; and
• Benefits will come through structural changes, causing the Company
to re-grow consistently and sustainably.
7
Company
2014 Facts
• Capital Increase
8
Company
• After two rounds of leftovers and period of review, 48,522,214
common shares and 85,703 preferred shares have been
subscribed, of the total of 48,528,020 common shares and
97,056,038 preferred shares, without par value, to be issued by
the Company;
• With the end of the review period, the subscribed shares
totaled BRL 67.078.925,46;
• The process of capital increase was completed and an
Extraordinay General Meeting has been convened for 08/20/14
in order to resolve their approval.
2014 Facts
9
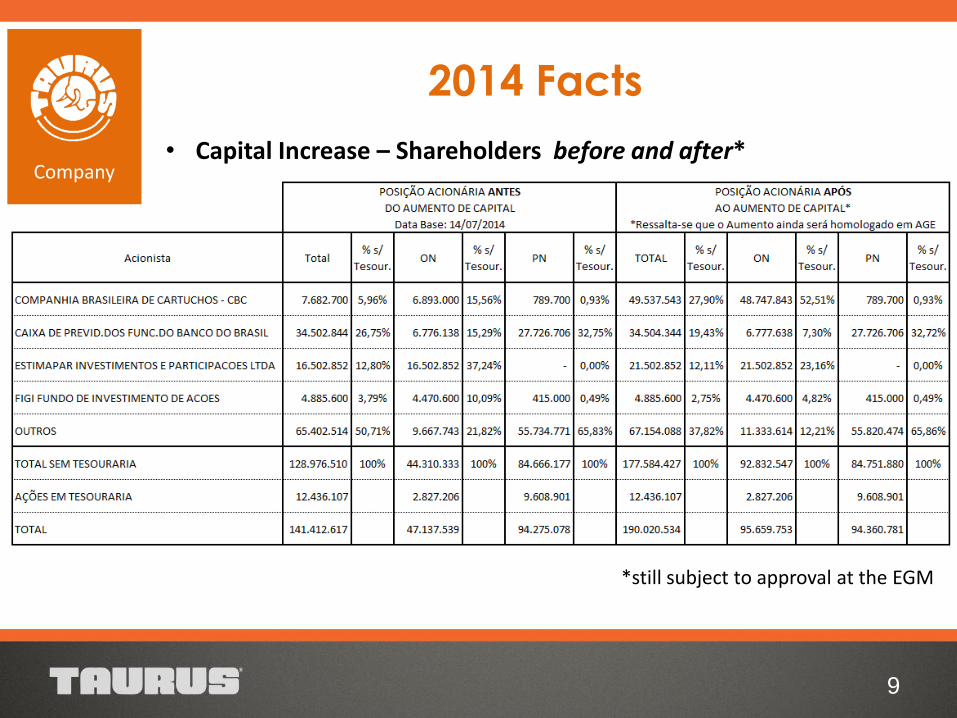
Company • Capital Increase – Shareholders before and after*
*still subject to approval at the EGM
2014 Facts
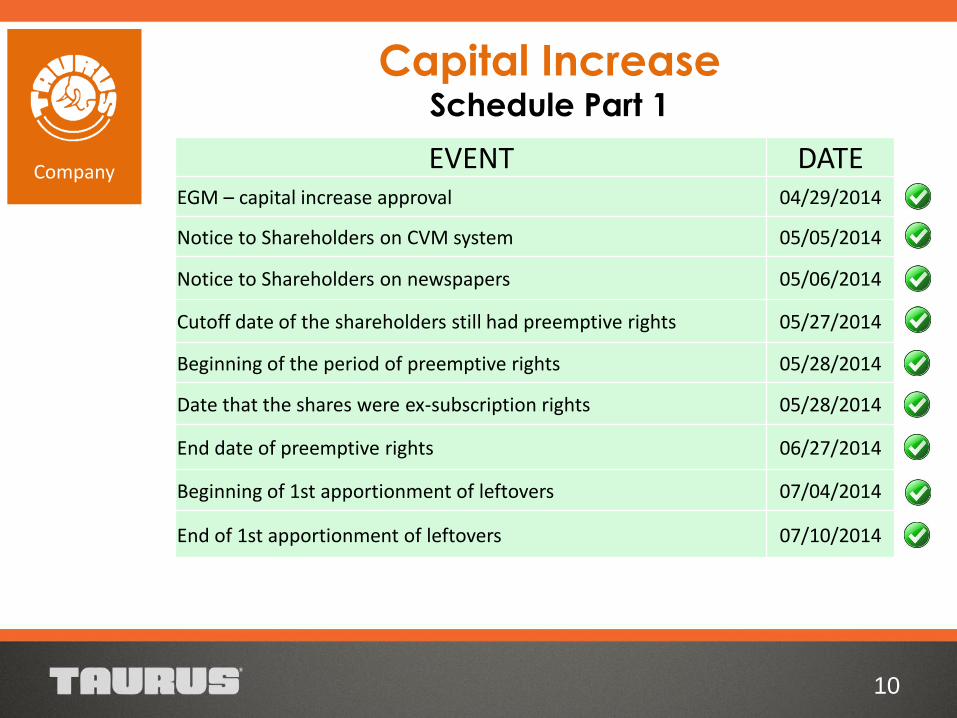
Capital Increase Schedule Part 1
10
Company EVENT DATE EGM – capital increase approval 04/29/2014
Notice to Shareholders on CVM system 05/05/2014
Notice to Shareholders on newspapers 05/06/2014
Cutoff date of the shareholders still had preemptive rights 05/27/2014
Beginning of the period of preemptive rights 05/28/2014
Date that the shares were ex-subscription rights 05/28/2014
End date of preemptive rights 06/27/2014
Beginning of 1st apportionment of leftovers 07/04/2014
End of 1st apportionment of leftovers 07/10/2014
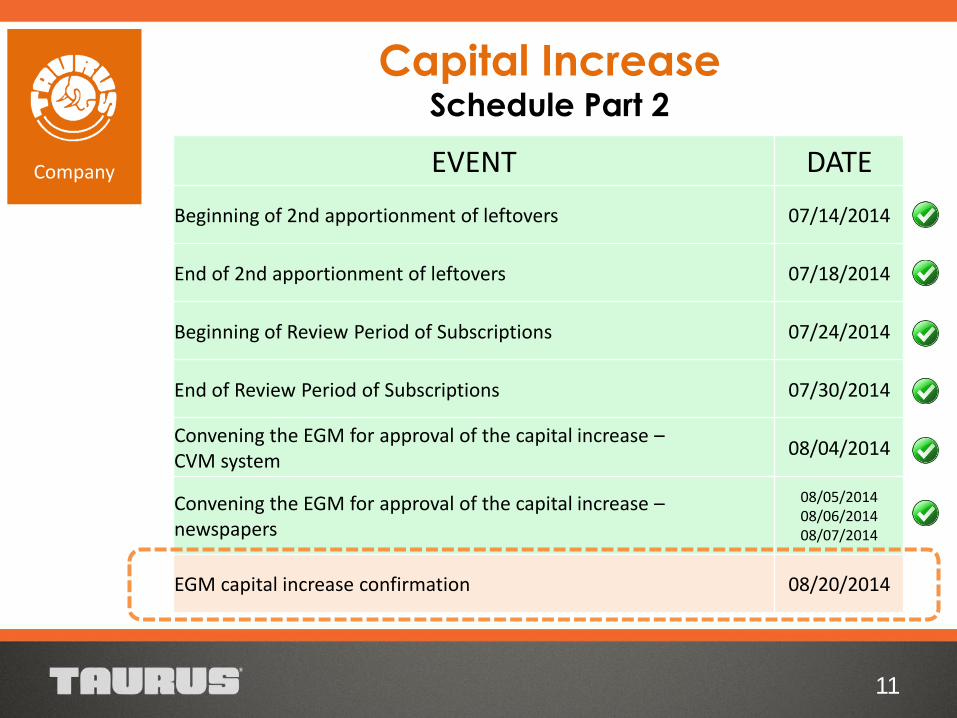
11
Company EVENT DATE
Beginning of 2nd apportionment of leftovers 07/14/2014
End of 2nd apportionment of leftovers 07/18/2014
Beginning of Review Period of Subscriptions 07/24/2014
End of Review Period of Subscriptions 07/30/2014
Convening the EGM for approval of the capital increase – CVM system
08/04/2014
Convening the EGM for approval of the capital increase – newspapers
08/05/2014 08/06/2014 08/07/2014
EGM capital increase confirmation 08/20/2014
Capital Increase Schedule Part 2
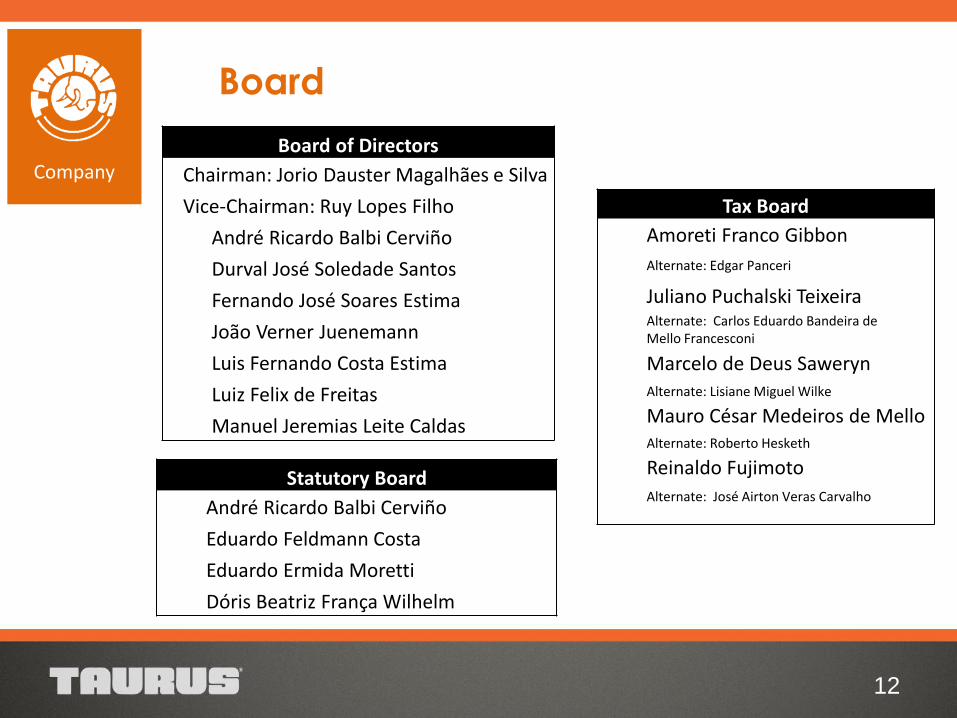
Board of Directors
Chairman: Jorio Dauster Magalhães e Silva
Vice-Chairman: Ruy Lopes Filho
André Ricardo Balbi Cerviño
Durval José Soledade Santos
Fernando José Soares Estima
João Verner Juenemann
Luis Fernando Costa Estima
Luiz Felix de Freitas
Manuel Jeremias Leite Caldas
Tax Board
Amoreti Franco Gibbon
Alternate: Edgar Panceri
Juliano Puchalski Teixeira Alternate: Carlos Eduardo Bandeira de Mello Francesconi
Marcelo de Deus Saweryn Alternate: Lisiane Miguel Wilke
Mauro César Medeiros de Mello Alternate: Roberto Hesketh
Reinaldo Fujimoto
Alternate: José Airton Veras Carvalho
12
Company
Statutory Board
André Ricardo Balbi Cerviño
Eduardo Feldmann Costa
Eduardo Ermida Moretti
Dóris Beatriz França Wilhelm
Board
13
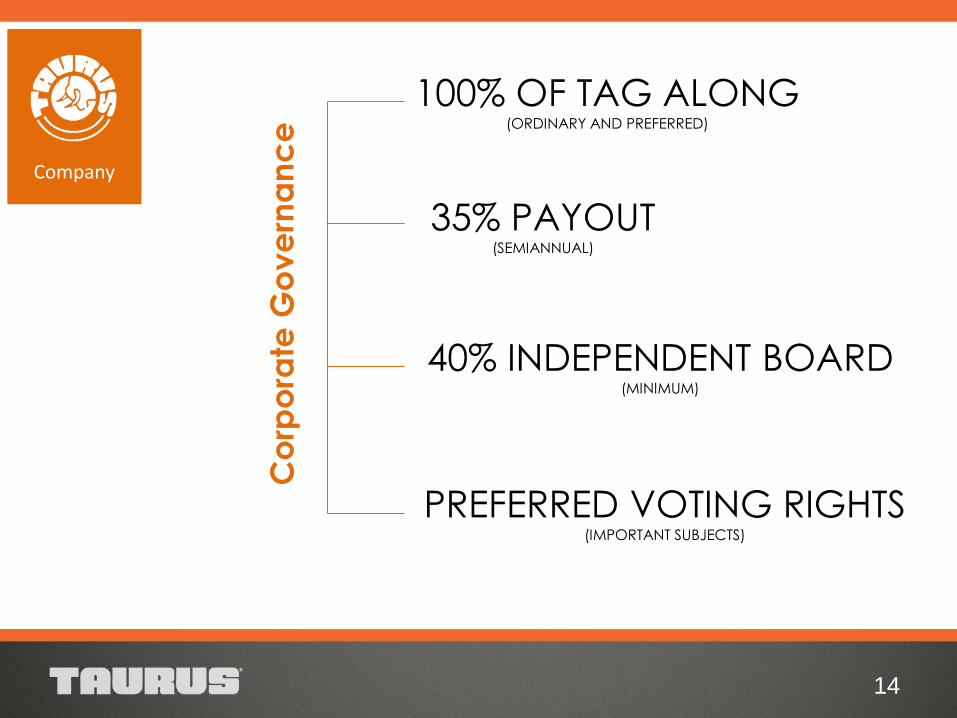
Company
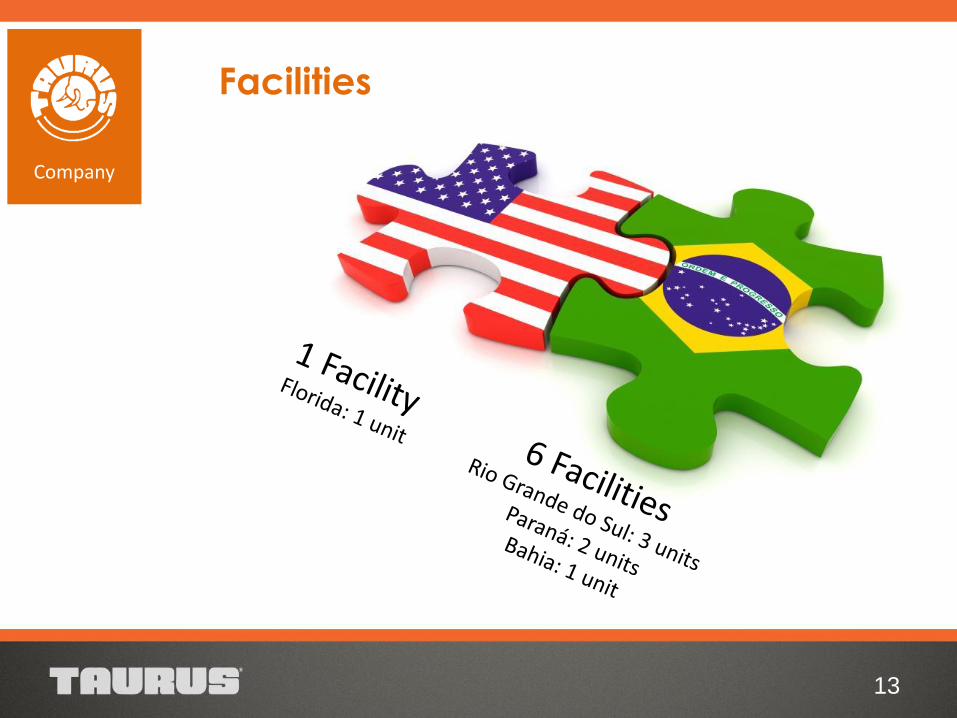
Facilities
Co
rpo
rate
Go
ve
rna
nc
e
14
Company
100% OF TAG ALONG (ORDINARY AND PREFERRED)
35% PAYOUT (SEMIANNUAL)
PREFERRED VOTING RIGHTS (IMPORTANT SUBJECTS)
40% INDEPENDENT BOARD (MINIMUM)
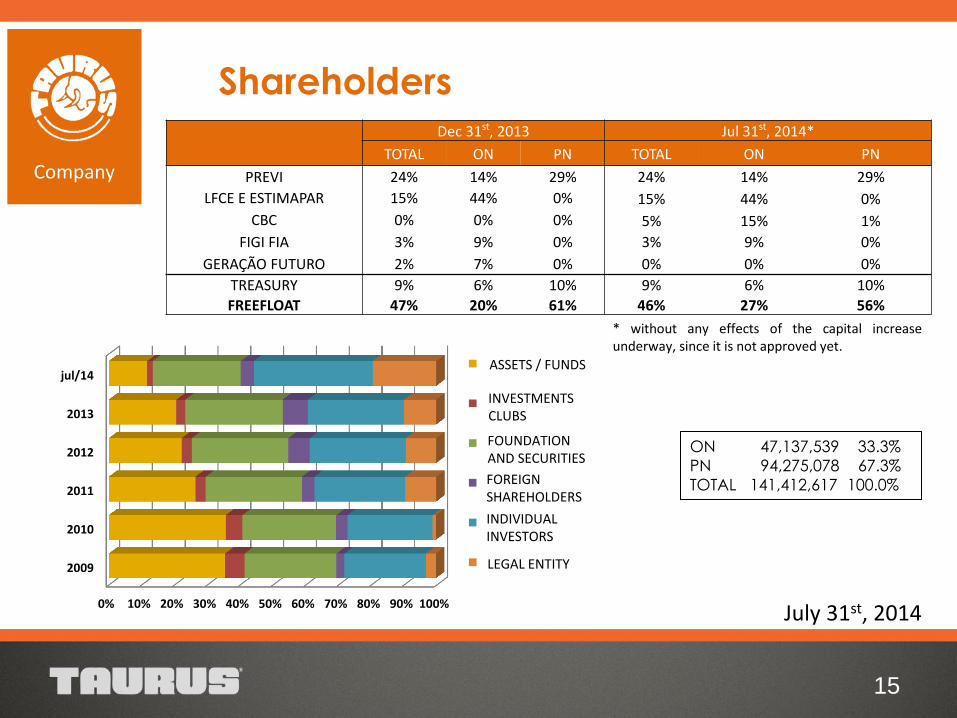
ON 47,137,539 33.3%
PN 94,275,078 67.3%
TOTAL 141,412,617 100.0%
Dec 31st, 2013 Jul 31st, 2014*
TOTAL ON PN TOTAL ON PN
PREVI 24% 14% 29% 24% 14% 29%
LFCE E ESTIMAPAR 15% 44% 0% 15% 44% 0%
CBC 0% 0% 0% 5% 15% 1%
FIGI FIA 3% 9% 0% 3% 9% 0%
GERAÇÃO FUTURO 2% 7% 0% 0% 0% 0%
TREASURY 9% 6% 10% 9% 6% 10%
FREEFLOAT 47% 20% 61% 46% 27% 56%
15
July 31st, 2014
Company
Shareholders
* without any effects of the capital increase underway, since it is not approved yet.
0% 10% 20% 30% 40% 50% 60% 70% 80% 90% 100%
2009
2010
2011
2012
2013
jul/14ASSETS / FUNDOS
CLUBES DEINVESTIMENTOS
FUNDAÇÕES ESEGURADORAS
ESTRANGEIROS
PESSOA FISÍCA
PESSOA JURÍDICA
ASSETS / FUNDS
INVESTMENTS CLUBS
FOUNDATION AND SECURITIES
FOREIGN SHAREHOLDERS
INDIVIDUAL INVESTORS
LEGAL ENTITY
16
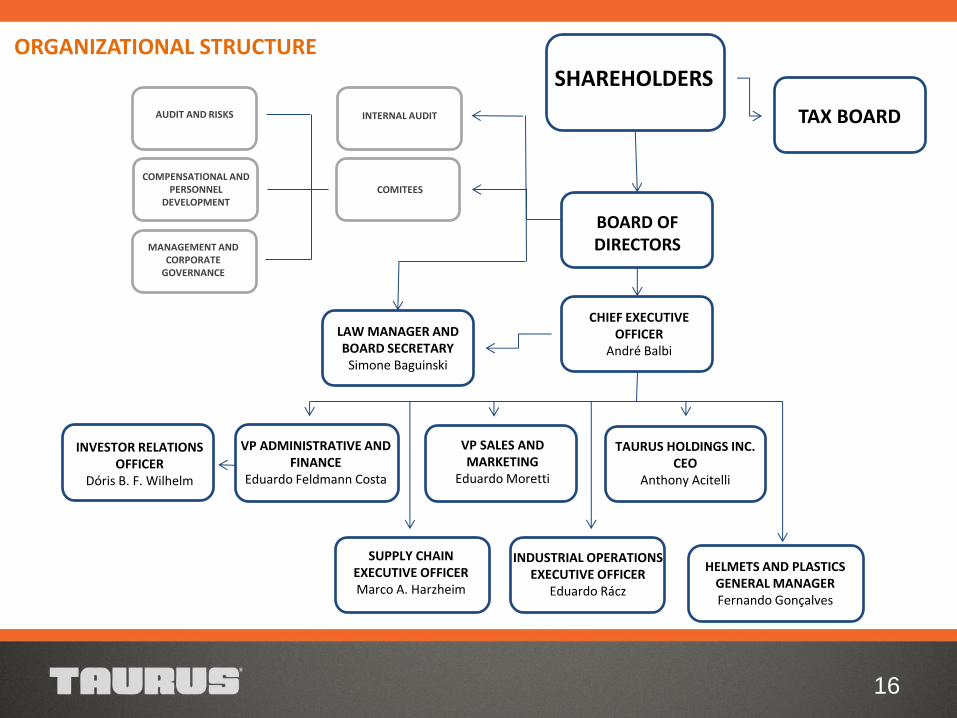
INVESTOR RELATIONS OFFICER
Dóris B. F. Wilhelm
VP ADMINISTRATIVE AND FINANCE
Eduardo Feldmann Costa
SHAREHOLDERS
BOARD OF DIRECTORS
CHIEF EXECUTIVE OFFICER
André Balbi
TAURUS HOLDINGS INC. CEO
Anthony Acitelli
INTERNAL AUDIT
COMITEES
LAW MANAGER AND BOARD SECRETARY
Simone Baguinski
COMPENSATIONAL AND PERSONNEL
DEVELOPMENT
AUDIT AND RISKS
MANAGEMENT AND CORPORATE
GOVERNANCE
VP SALES AND MARKETING
Eduardo Moretti
HELMETS AND PLASTICS GENERAL MANAGER Fernando Gonçalves
TAX BOARD
INDUSTRIAL OPERATIONS EXECUTIVE OFFICER
Eduardo Rácz
ORGANIZATIONAL STRUCTURE
SUPPLY CHAIN EXECUTIVE OFFICER Marco A. Harzheim
17
Company
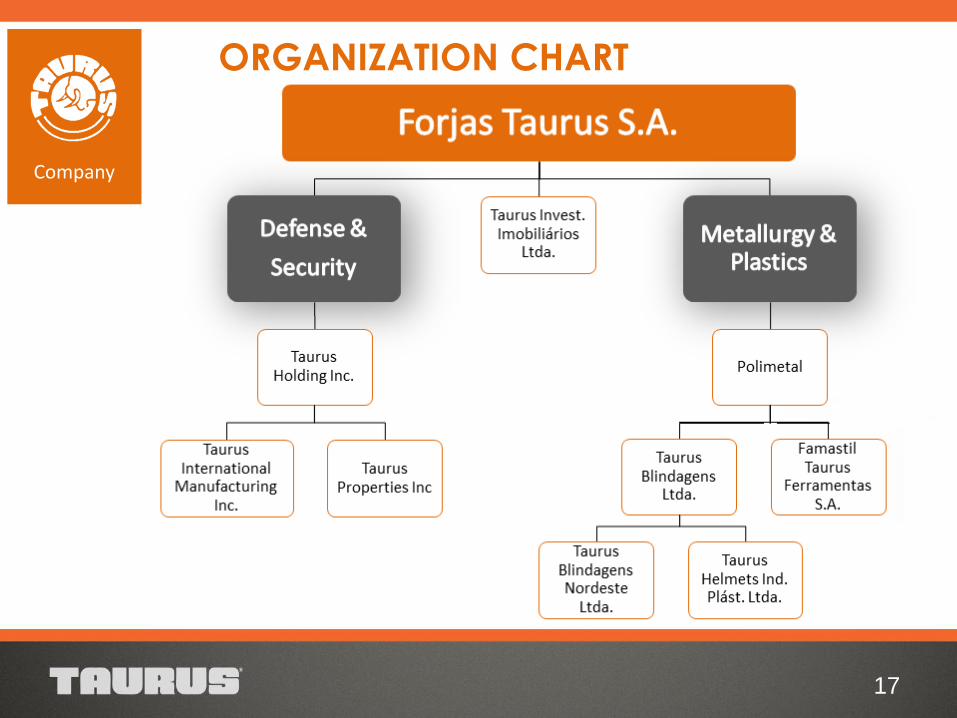
ORGANIZATION CHART
18
SOCIAL COMMITMENT
Company
• Kids of the Future
• Library
• Digital Space
• Sign Language Course
• Educational Benefits
• Impulsor News

19
Company Defense & Security
Metallurgy & Plastics
Guidance Results Strategies
IMPACT FACTORS
20
Defense & Security
Seasonality Mass Events
Trade Fairs
Hunting Season
Regulatory Fear
Demand Innovation
Quality
Auctions
Economics Currency
Macroeconomics
Trademarks and Patents
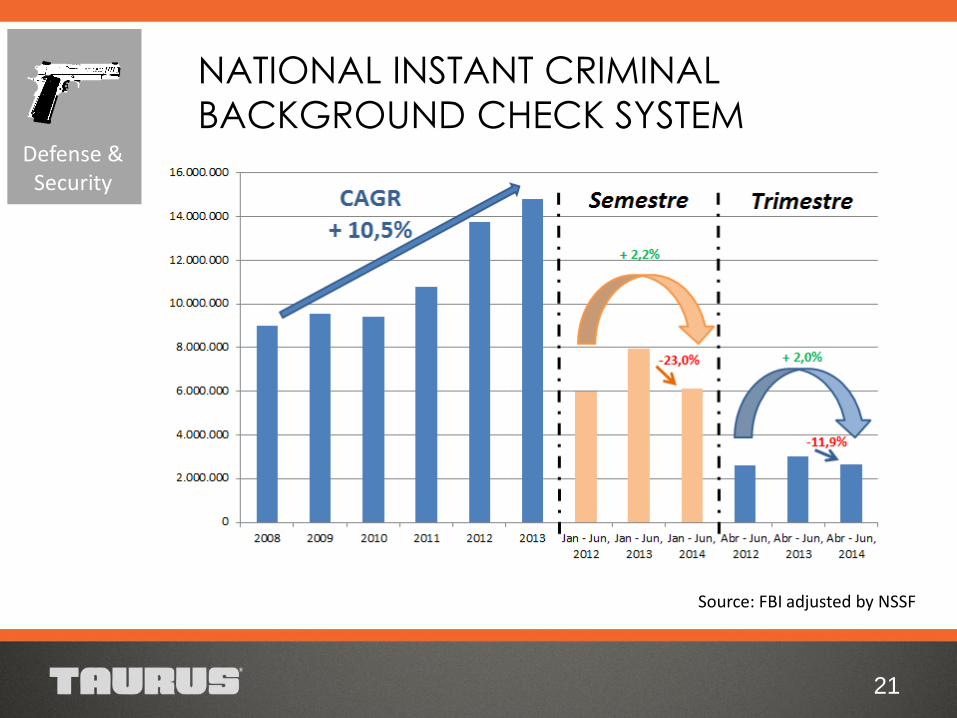
NATIONAL INSTANT CRIMINAL
BACKGROUND CHECK SYSTEM
21
Defense & Security
Source: FBI adjusted by NSSF
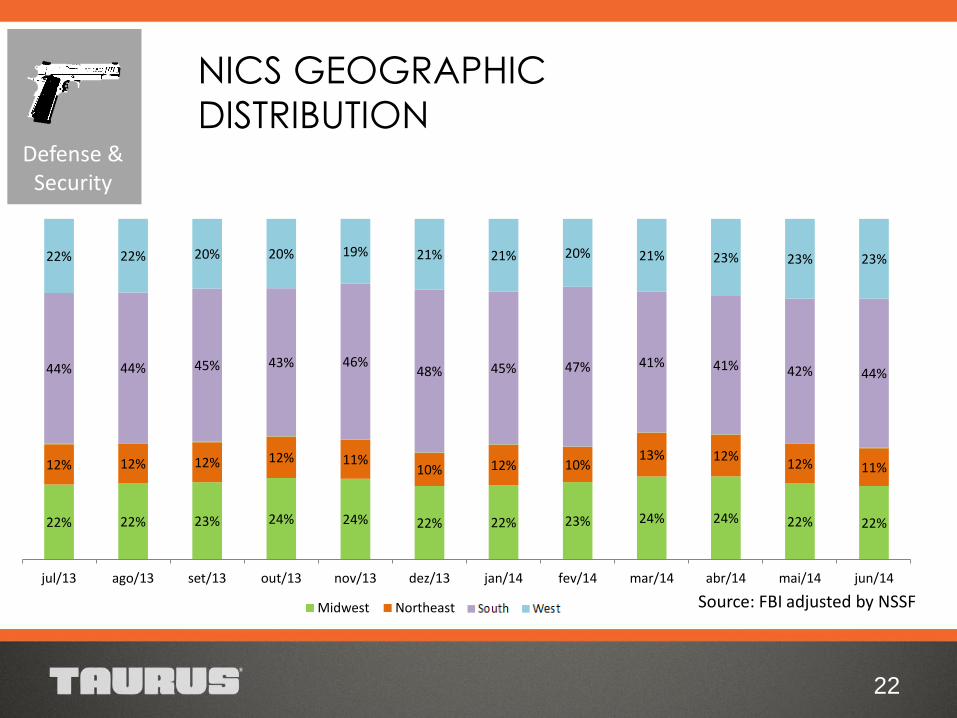
22% 22% 23% 24% 24% 22% 22% 23% 24% 24% 22% 22%
12% 12% 12% 12% 11% 10% 12% 10%
13% 12% 12% 11%
44% 44% 45% 43% 46% 48% 45% 47% 41% 41% 42% 44%
22% 22% 20% 20% 19% 21% 21% 20% 21% 23% 23% 23%
jul/13 ago/13 set/13 out/13 nov/13 dez/13 jan/14 fev/14 mar/14 abr/14 mai/14 jun/14
Midwest Northeast Other South West
NICS GEOGRAPHIC
DISTRIBUTION
22
Defense & Security
Source: FBI adjusted by NSSF
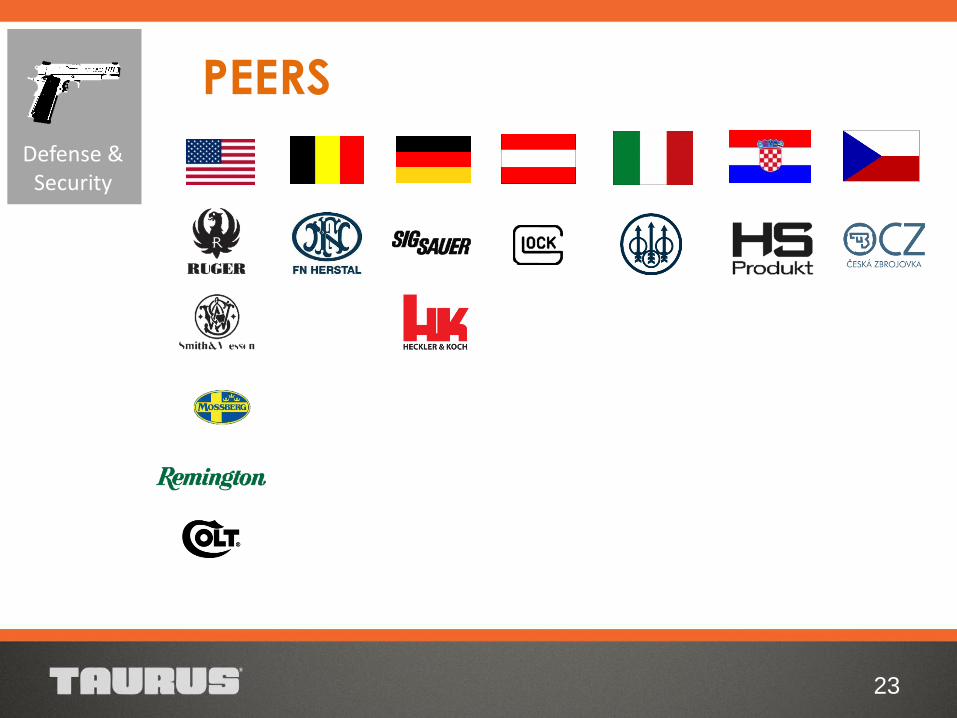
PEERS
23
Defense & Security
PRODUCTION
24
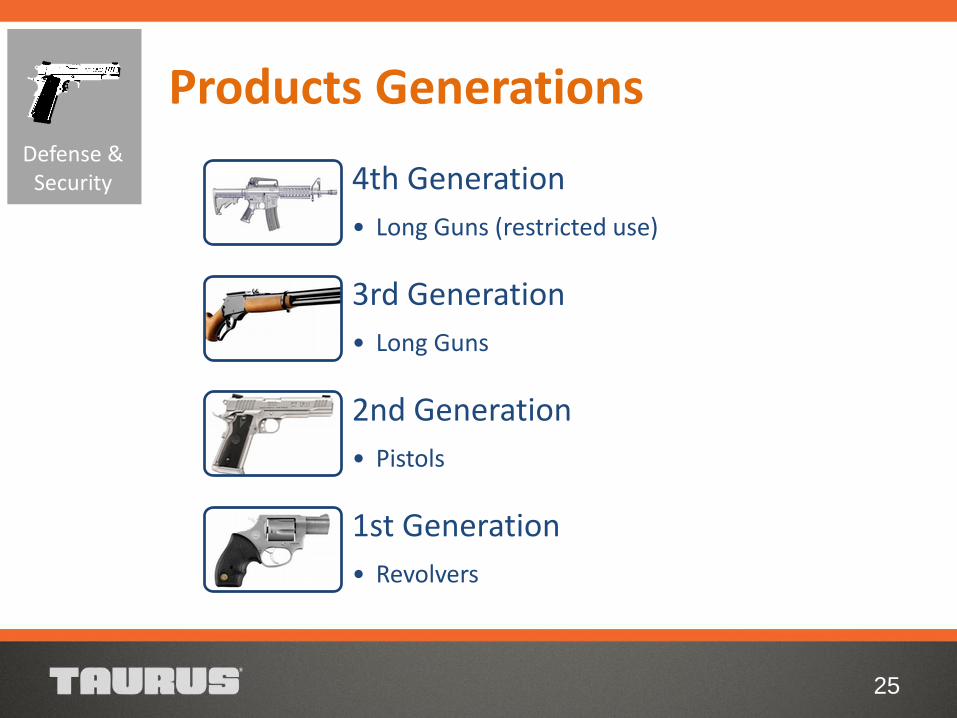
25
Defense & Security 4th Generation
• Long Guns (restricted use)
3rd Generation
• Long Guns
2nd Generation
• Pistols
1st Generation
• Revolvers
Products Generations
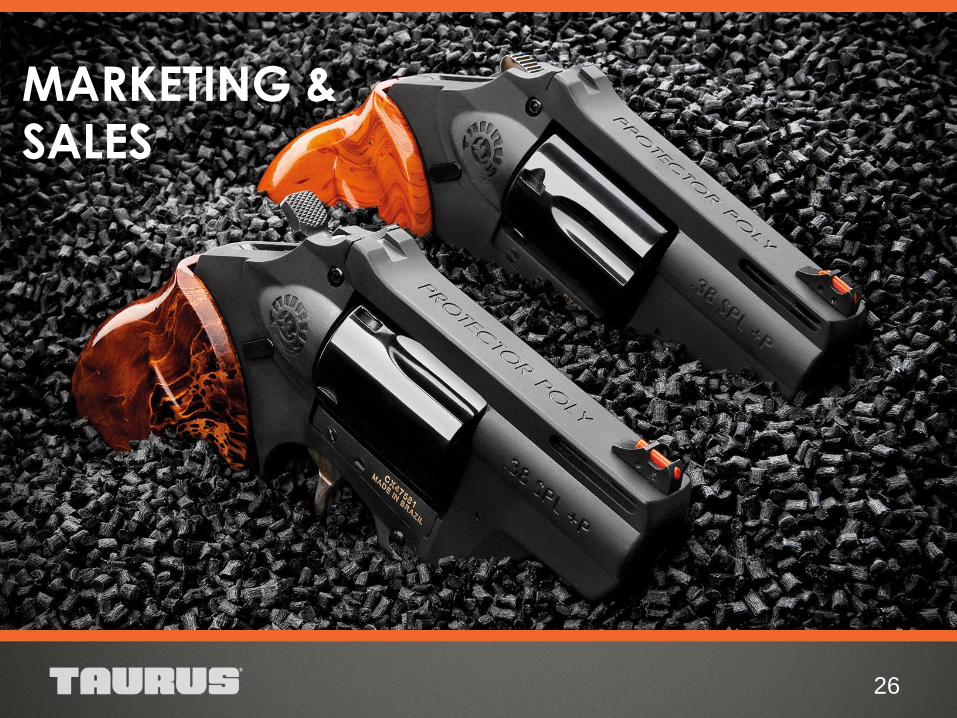
MARKETING &
SALES
26
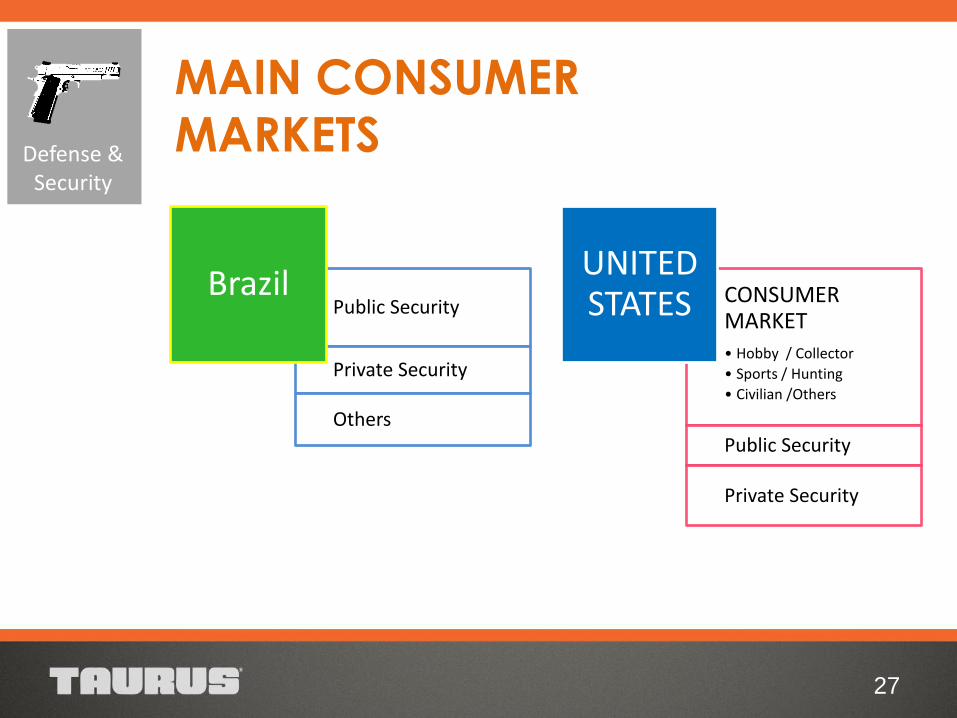
27
Public Security
Private Security
Others
Brazil CONSUMER MARKET
• Hobby / Collector
• Sports / Hunting
• Civilian /Others
Public Security
Private Security
UNITED STATES
MAIN CONSUMER
MARKETS Defense & Security
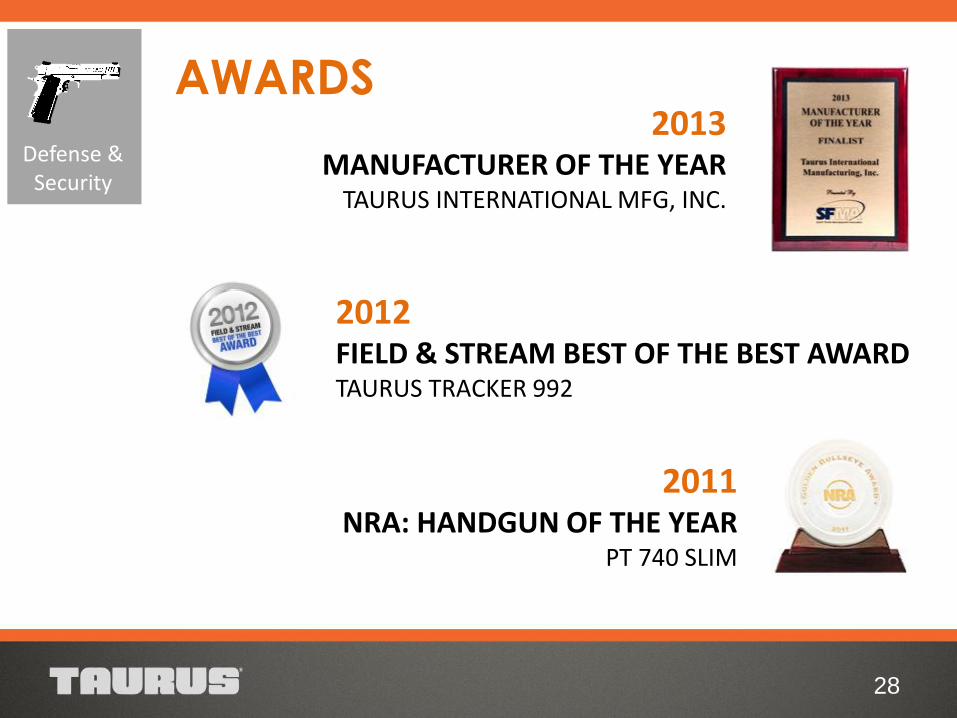
28
2012 FIELD & STREAM BEST OF THE BEST AWARD TAURUS TRACKER 992
2011 NRA: HANDGUN OF THE YEAR
PT 740 SLIM
2013 MANUFACTURER OF THE YEAR
TAURUS INTERNATIONAL MFG, INC.
AWARDS
Defense & Security
29
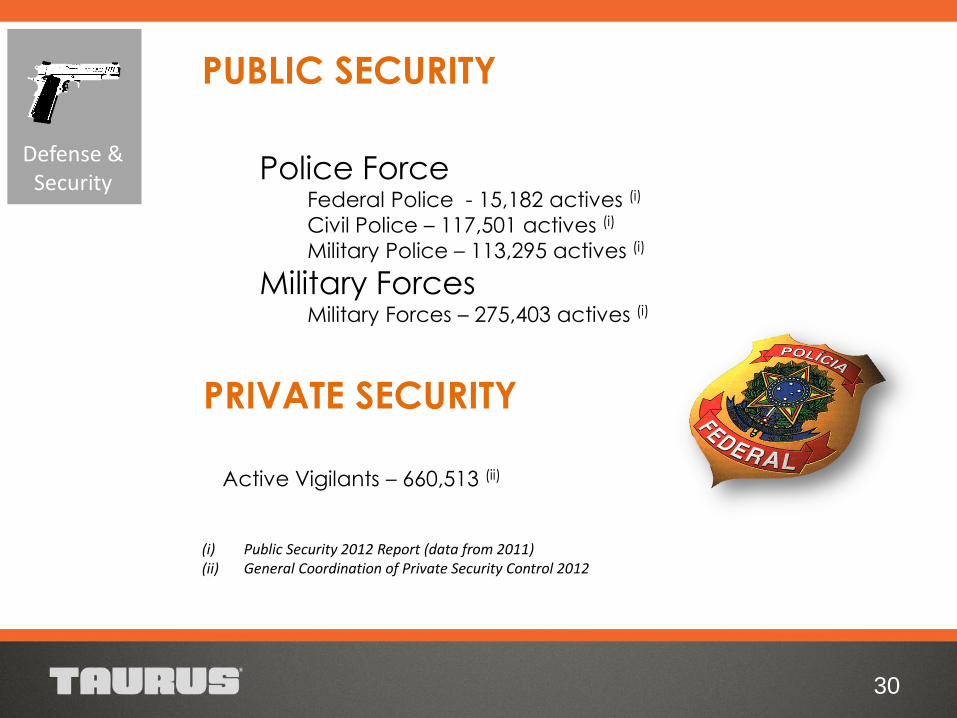
Police Force Federal Police - 15,182 actives (i)
Civil Police – 117,501 actives (i)
Military Police – 113,295 actives (i)
Military Forces Military Forces – 275,403 actives (i)
PUBLIC SECURITY
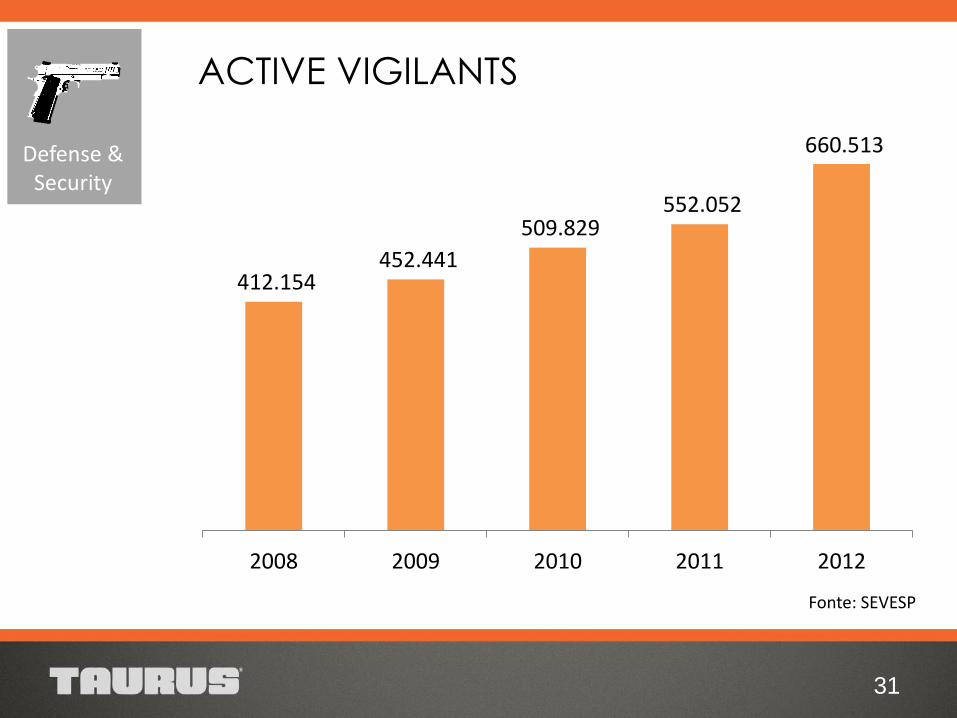
PRIVATE SECURITY
30
Active Vigilants – 660,513 (ii)
(i) Public Security 2012 Report (data from 2011) (ii) General Coordination of Private Security Control 2012
Defense & Security
31
412.154 452.441
509.829 552.052
660.513
2008 2009 2010 2011 2012
ACTIVE VIGILANTS
Defense & Security
Fonte: SEVESP
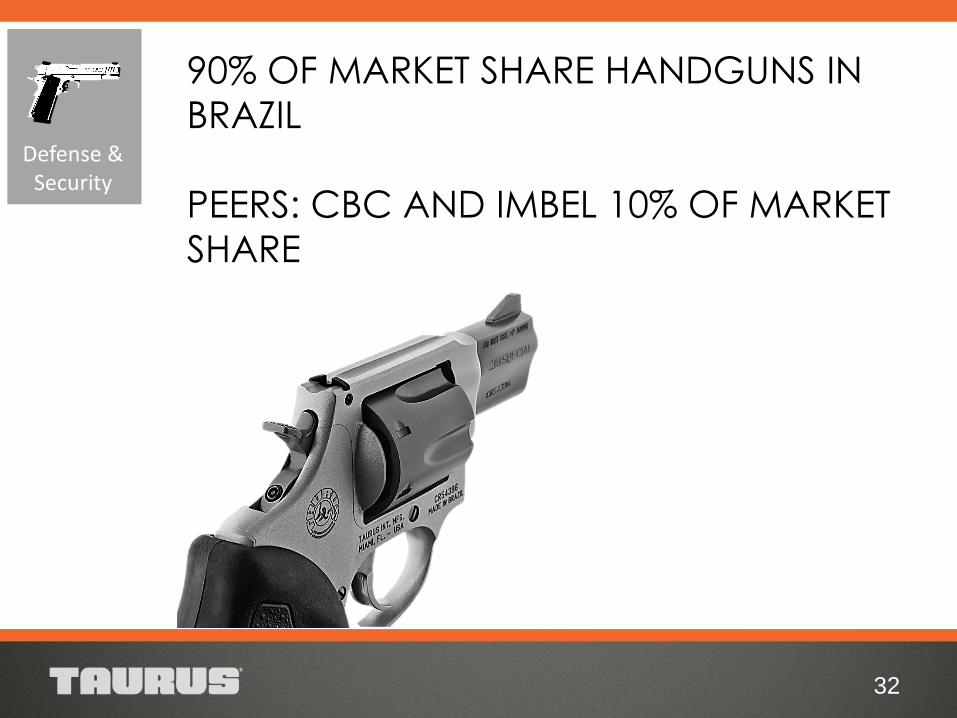
90% OF MARKET SHARE HANDGUNS IN
BRAZIL
PEERS: CBC AND IMBEL 10% OF MARKET
SHARE
32
Defense & Security
FOREIGN MARKET
33
34
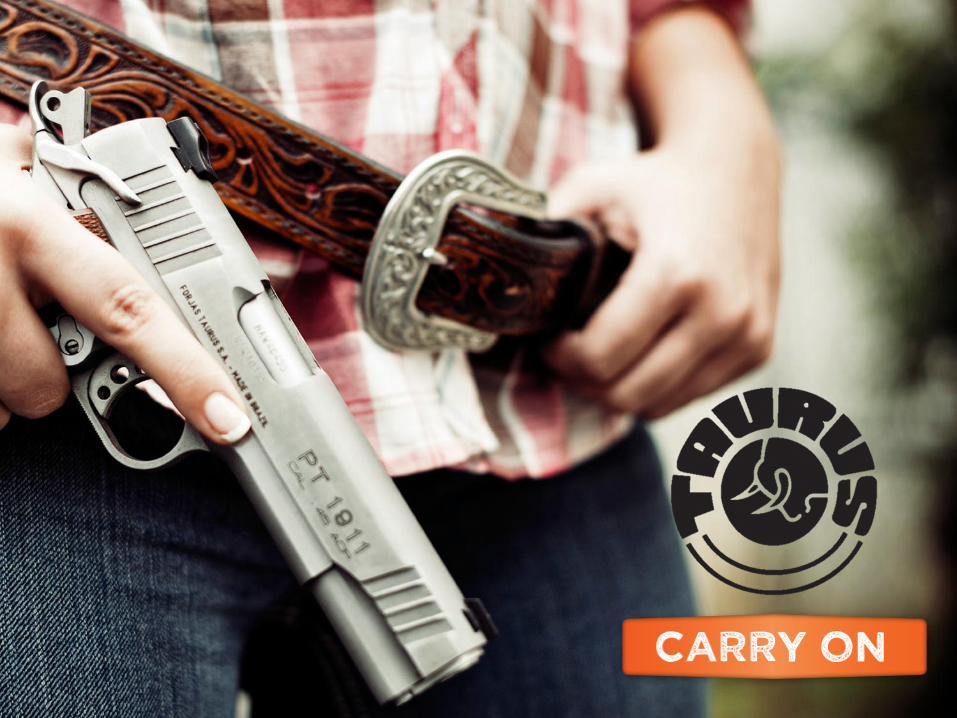
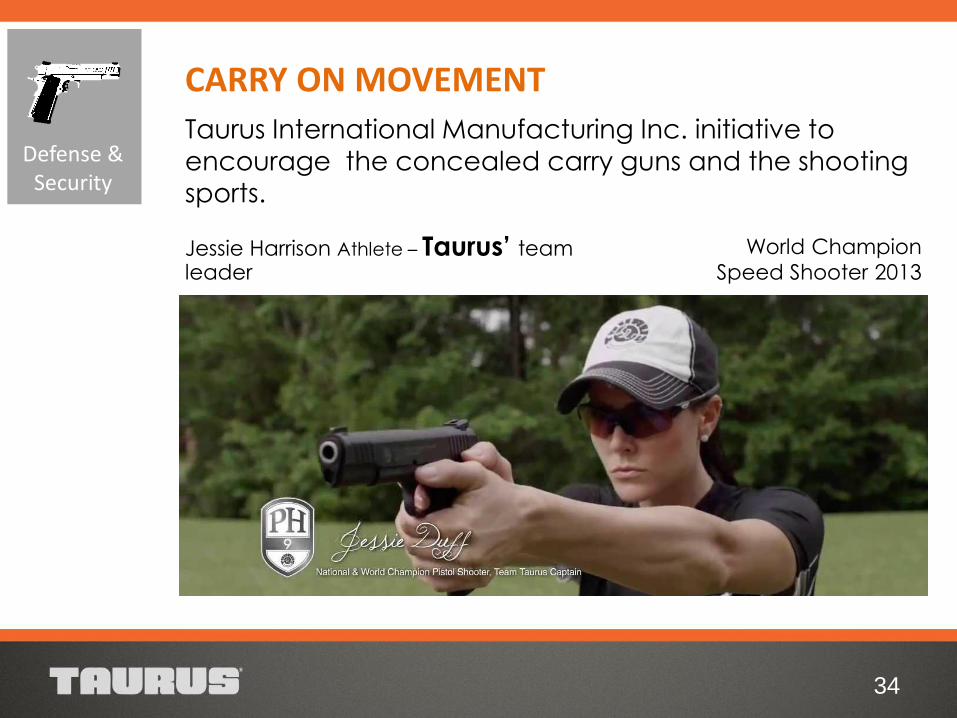
CARRY ON MOVEMENT
World Champion
Speed Shooter 2013 Jessie Harrison Athlete – Taurus’ team leader
Taurus International Manufacturing Inc. initiative to
encourage the concealed carry guns and the shooting
sports.
Defense & Security
35
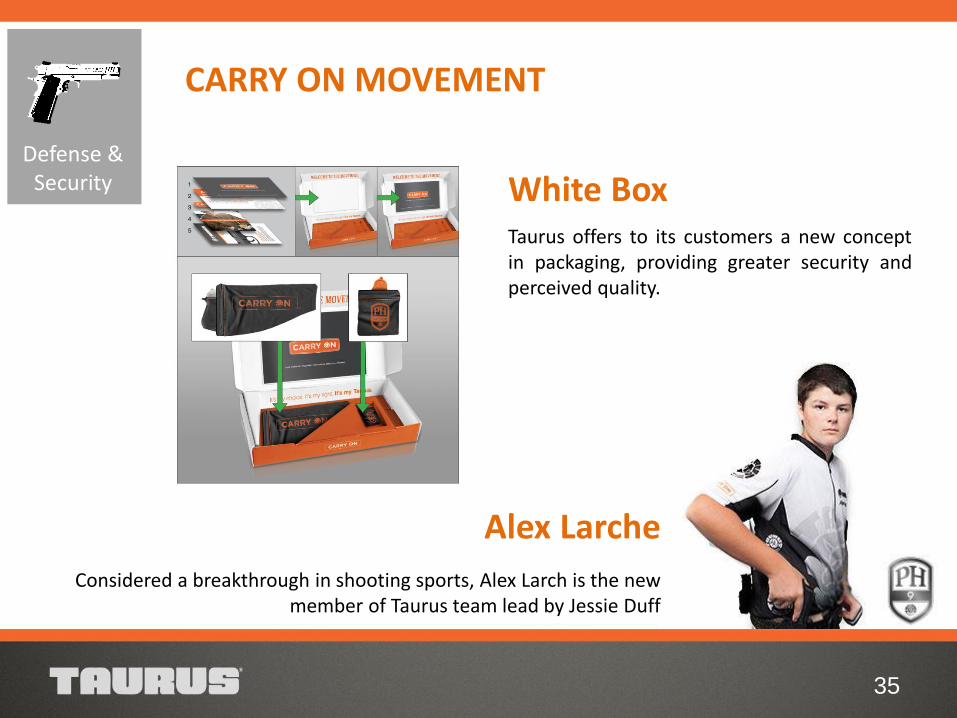
Considered a breakthrough in shooting sports, Alex Larch is the new member of Taurus team lead by Jessie Duff
Alex Larche
Taurus offers to its customers a new concept in packaging, providing greater security and perceived quality.
White Box
CARRY ON MOVEMENT
Defense & Security
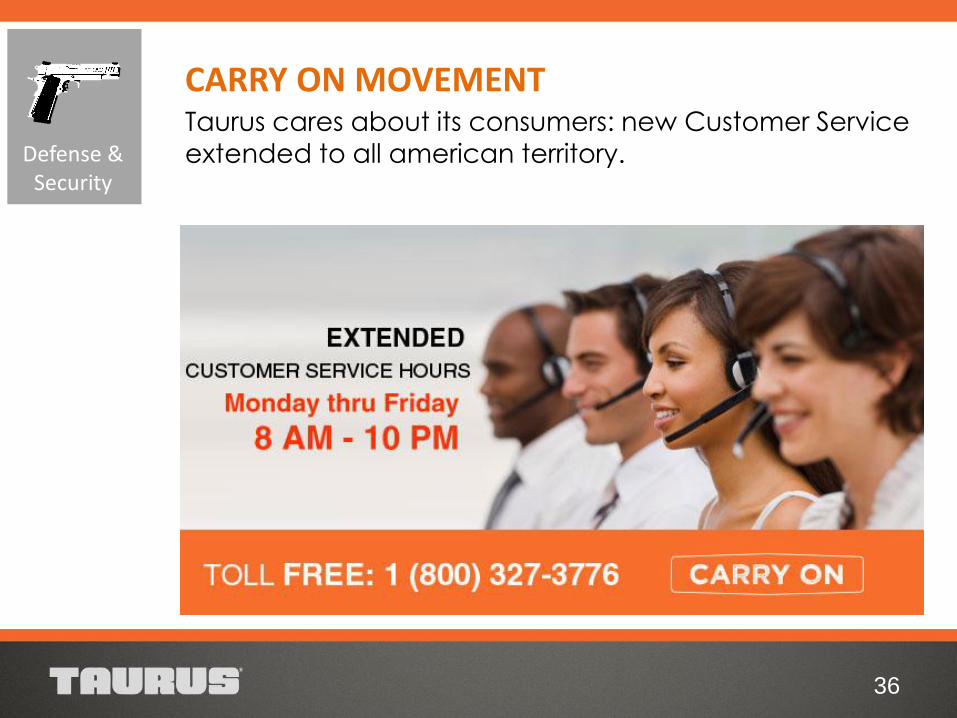
Taurus cares about its consumers: new Customer Service
extended to all american territory.
36
CARRY ON MOVEMENT
Defense & Security
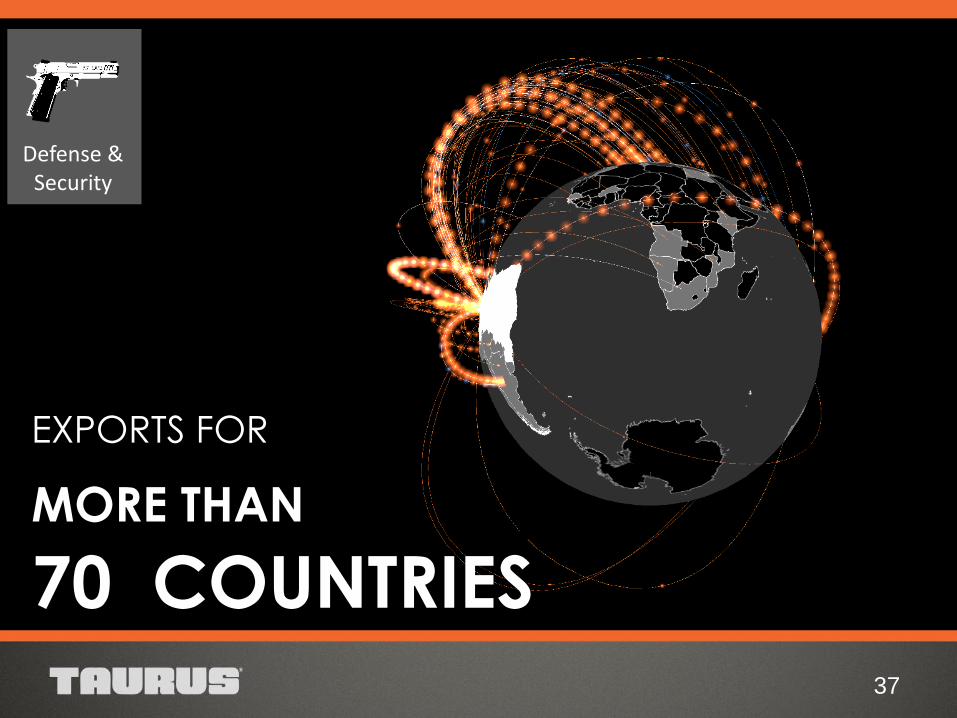
EXPORTS FOR
MORE THAN
70 COUNTRIES 37
Defense & Security

38
Company Defense & Security
Metallurgy & Plastics
Guidance Results Strategies
IMPACT FACTORS
39
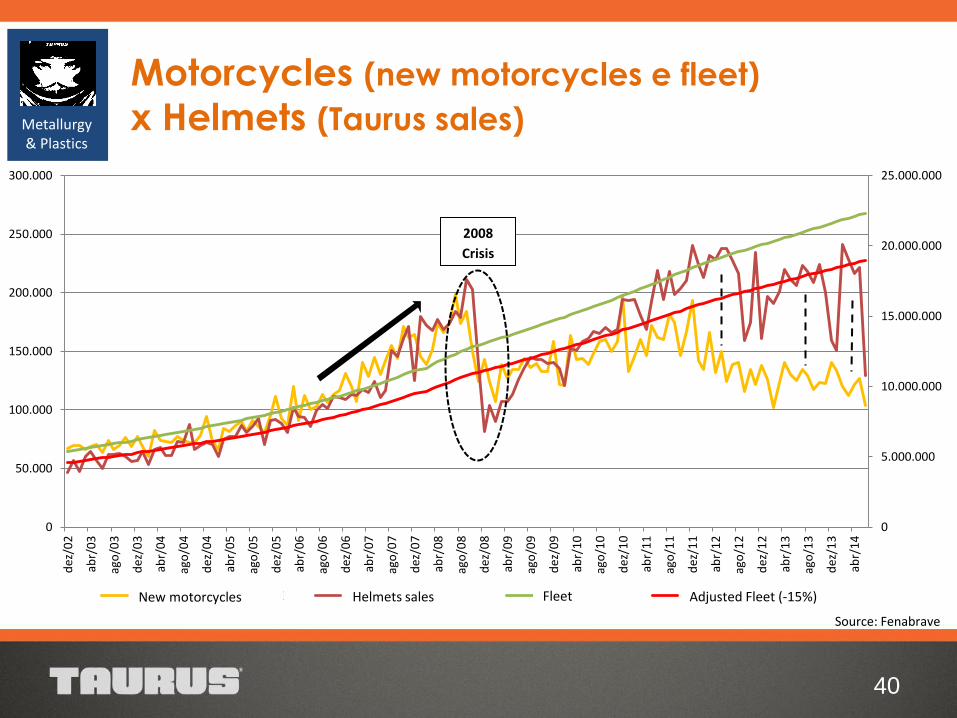
Metallurgy & Plastics Motorcycle Sales
Car substition for motorcycle
Mobility and traffic saving
Delivery Services
Motocab
Credit Defaults’ growth
Restricted credit concession
% of down payments’ value
Number of installments
Motorcycle maintenance X Helmet acquisition
Inexistence of financing for used low cilinder
motocycles
0
5.000.000
10.000.000
15.000.000
20.000.000
25.000.000
0
50.000
100.000
150.000
200.000
250.000
300.000
dez
/02
abr/
03
ago
/03
dez
/03
abr/
04
ago
/04
dez
/04
abr/
05
ago
/05
dez
/05
abr/
06
ago
/06
dez
/06
abr/
07
ago
/07
dez
/07
abr/
08
ago
/08
dez
/08
abr/
09
ago
/09
dez
/09
abr/
10
ago
/10
dez
/10
abr/
11
ago
/11
dez
/11
abr/
12
ago
/12
dez
/12
abr/
13
ago
/13
dez
/13
abr/
14
Emplacamentos FENABRAVE Venda Capacetes Taurus Frota Circulante Frota Circulante Ajustada (-15%)
2008
Crisis
40
Motorcycles (new motorcycles e fleet)
x Helmets (Taurus sales)
Source: Fenabrave
Metallurgy & Plastics
New motorcycles Helmets sales Fleet Adjusted Fleet (-15%)
41
Source: Denatran and FENABRAVE
Motorcycles (new motorcycles e fleet) Metallurgy & Plastics
0
500.000
1.000.000
1.500.000
2.000.000
2.500.000
0
5.000.000
10.000.000
15.000.000
20.000.000
25.000.000
Motorcycles Fleet x New Motorcycles
Frota Circulante Emplacamentos FENABRAVE
7%
15%
25%
33%
13%
-16%
12% 8%
-16%
-7% -2%
14% 14% 16% 18% 17%
12% 12% 12% 9% 8%
3%
-20%
-10%
0%
10%
20%
30%
40%
2004 2005 2006 2007 2008 2009 2010 2011 2012 2013 2014*
Growth Rates New Motorcycles x Fleet
Crescimento de Emplacamentos Crescimento da Frota
*2014 new motorcycles LTM until June/2014
New Motorcycles Fleet Motorcycles Growth Rate Fleet Growth Rate
42
Source: Taurus
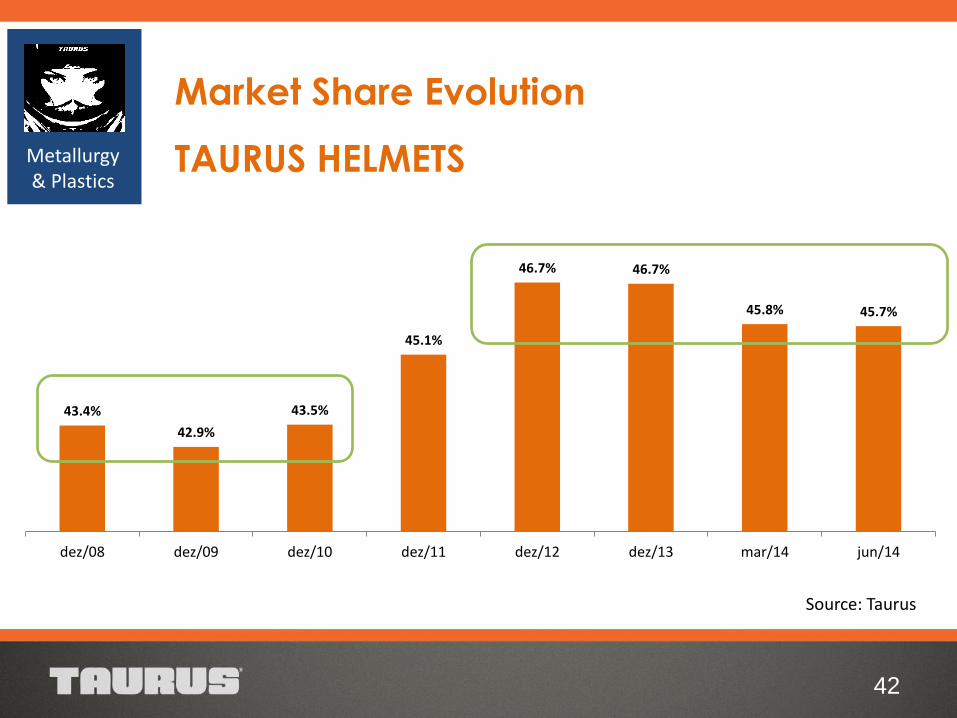
Market Share Evolution
TAURUS HELMETS Metallurgy & Plastics
43.4%
42.9%
43.5%
45.1%
46.7% 46.7%
45.8% 45.7%
dez/08 dez/09 dez/10 dez/11 dez/12 dez/13 mar/14 jun/14
IN BRAZIL, ON AVERAGE, ARE
1.5 HELMETS
PER MOTORCYCLE FLEET
WITH REPLACEMENT
EVERY 6 YEARS
43
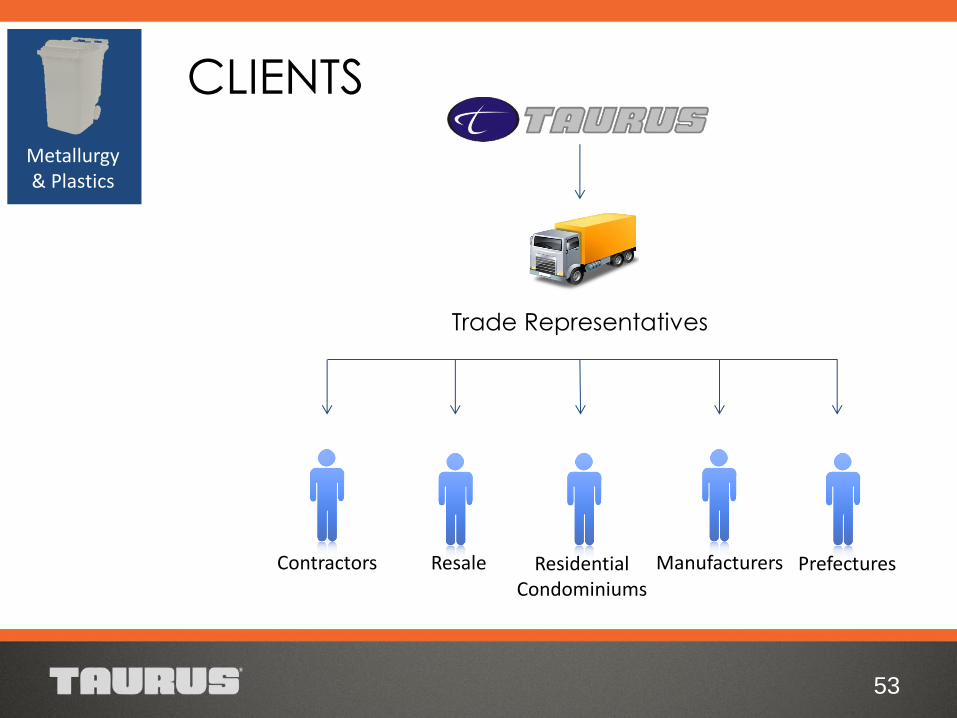
Metallurgy & Plastics
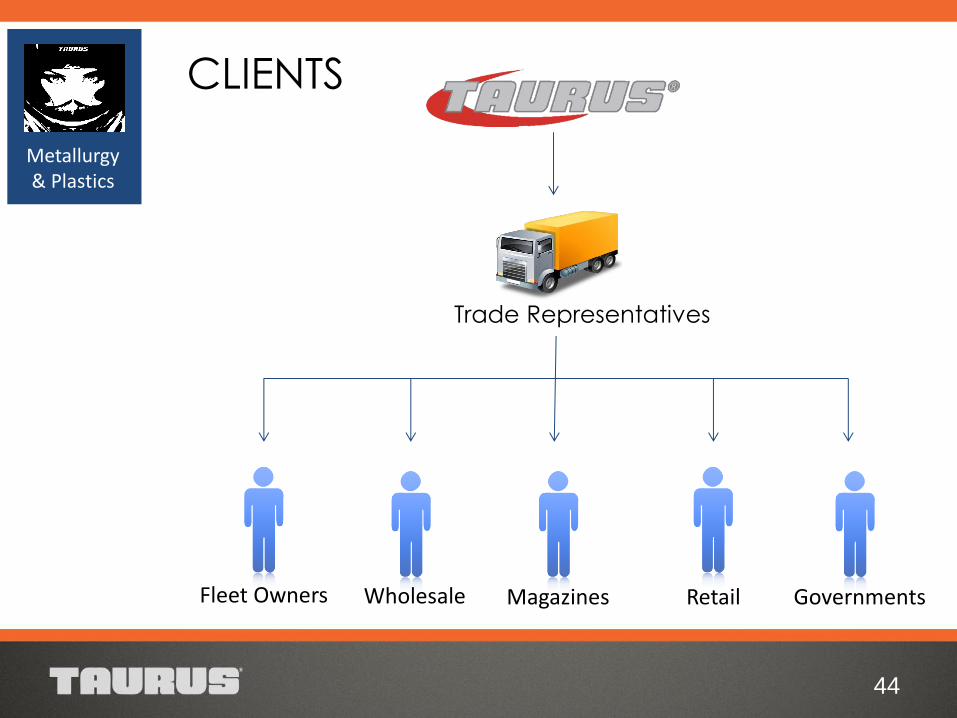
Retail Wholesale Magazines Fleet Owners Governments
Trade Representatives
CLIENTS
44
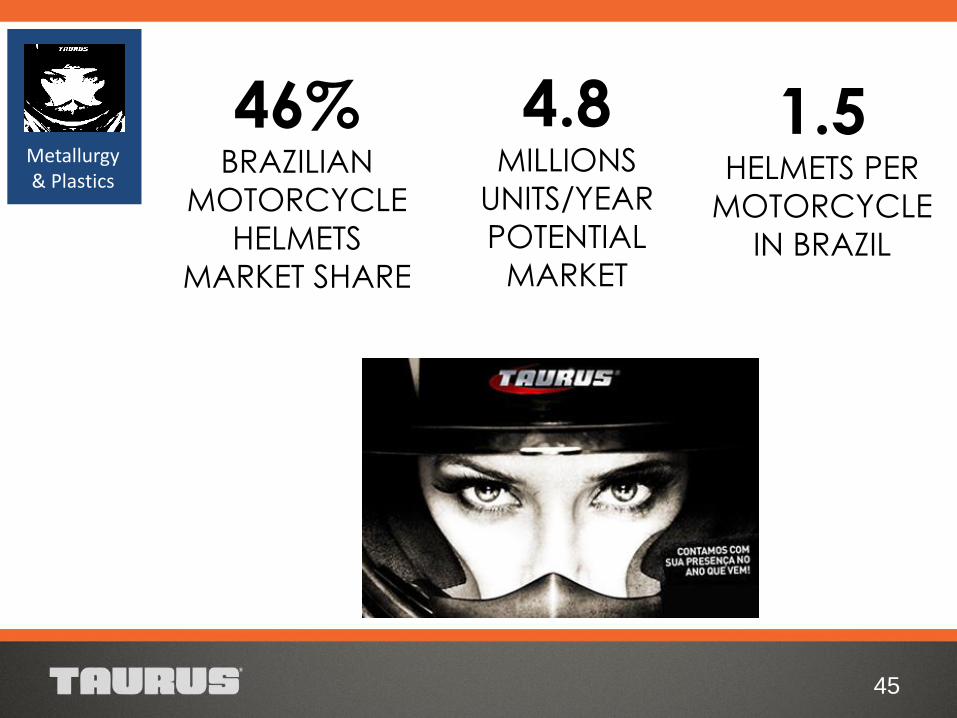
Metallurgy & Plastics
45
Metallurgy & Plastics
46%
BRAZILIAN
MOTORCYCLE
HELMETS
MARKET SHARE
1.5 HELMETS PER
MOTORCYCLE
IN BRAZIL
4.8 MILLIONS
UNITS/YEAR
POTENTIAL
MARKET
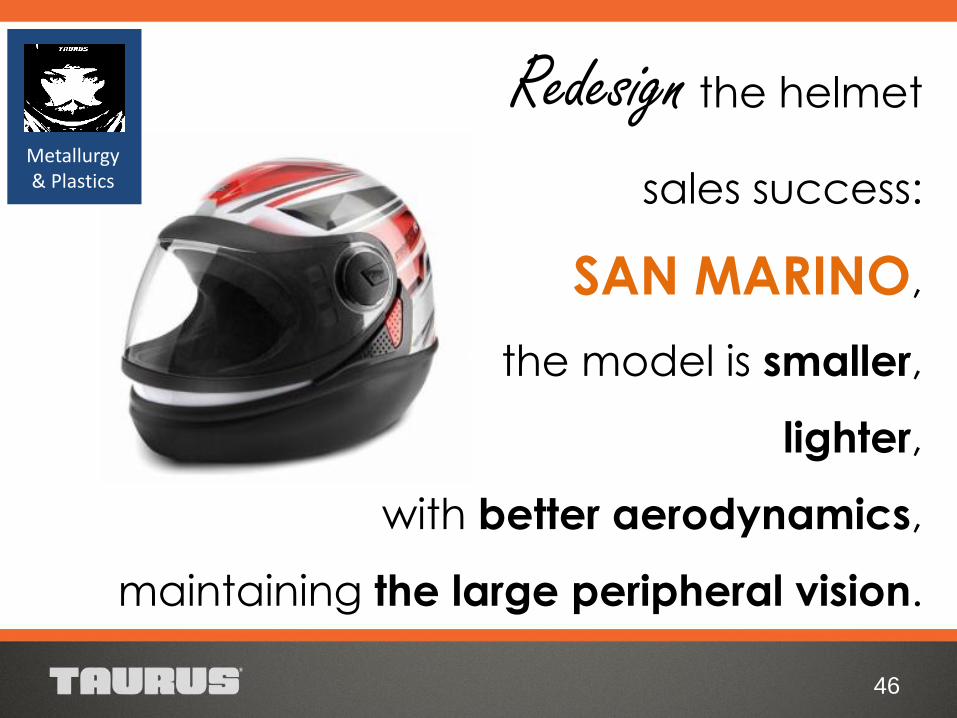
Redesign the helmet
sales success:
SAN MARINO,
the model is smaller,
lighter,
with better aerodynamics,
maintaining the large peripheral vision.
46
Metallurgy & Plastics
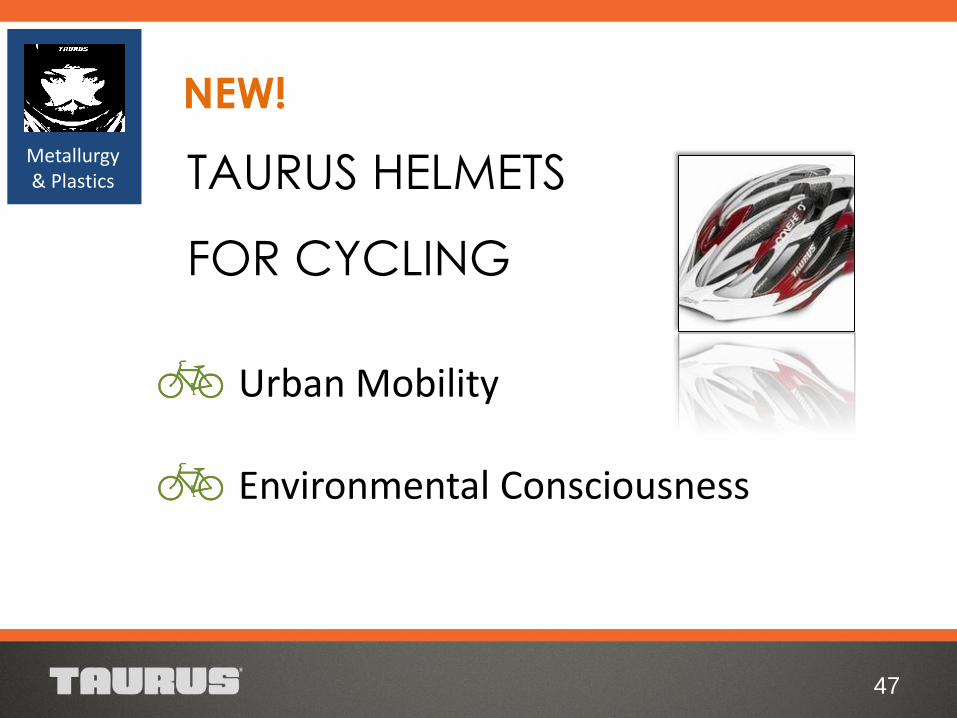
TAURUS HELMETS
FOR CYCLING
47
Metallurgy & Plastics
Urban Mobility
Environmental Consciousness
NEW!
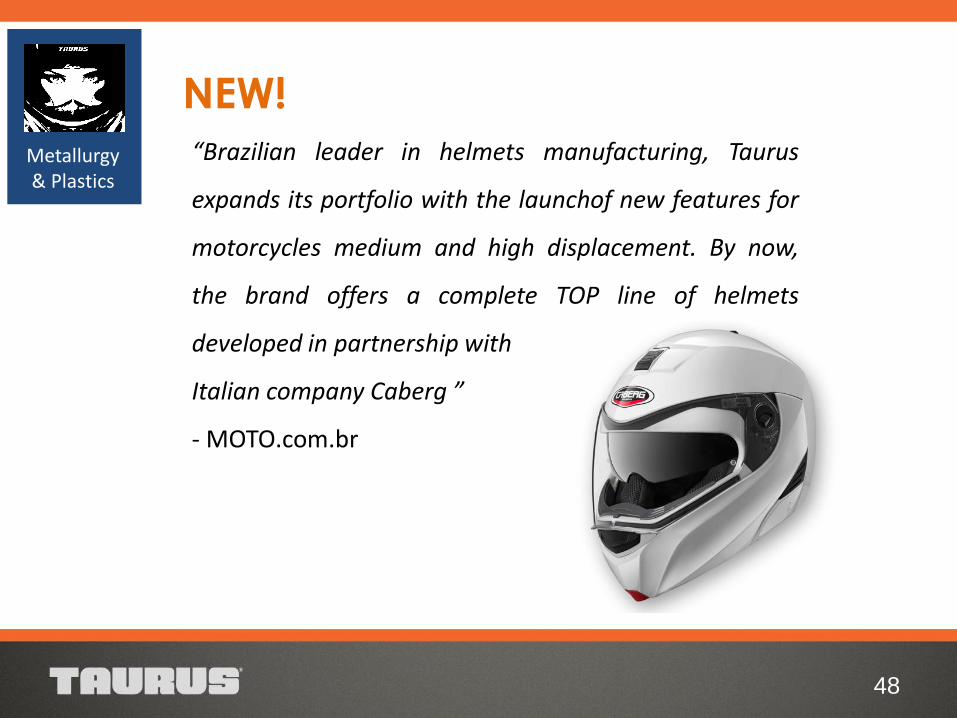
48
NEW!
“Brazilian leader in helmets manufacturing, Taurus
expands its portfolio with the launchof new features for
motorcycles medium and high displacement. By now,
the brand offers a complete TOP line of helmets
developed in partnership with
Italian company Caberg ”
- MOTO.com.br
Metallurgy & Plastics
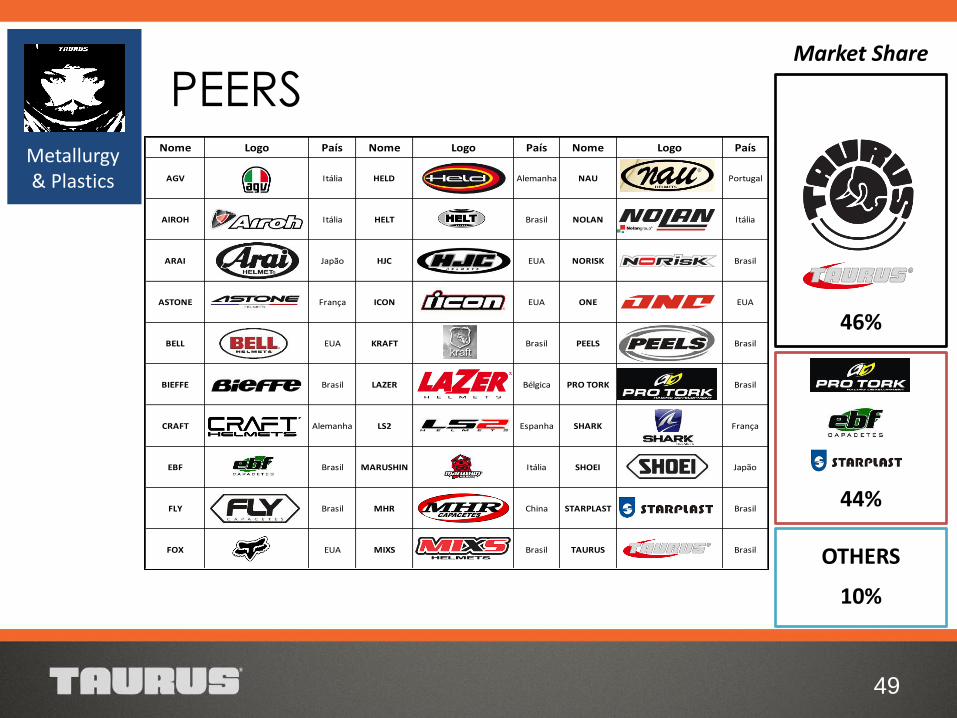
PEERS
49
Metallurgy & Plastics
46%
44%
10%
OTHERS
Market Share
Nome Logo País Nome Logo País Nome Logo País
AGV Itália HELD Alemanha NAU Portugal
AIROH Itália HELT Brasil NOLAN Itália
ARAI Japão HJC EUA NORISK Brasil
ASTONE França ICON EUA ONE EUA
BELL EUA KRAFT Brasil PEELS Brasil
BIEFFE Brasil LAZER Bélgica PRO TORK Brasil
CRAFT Alemanha LS2 Espanha SHARK França
EBF Brasil MARUSHIN Itália SHOEI Japão
FLY Brasil MHR China STARPLAST Brasil
FOX EUA MIXS Brasil TAURUS Brasil
HARLEY-
DAVIDSONEUA MT Espanha VAZ Brasil

COMPETITIVE ADVANTAGES
Quality
Raw material from recognized suppliers
Compliance with brazilian quality standard (NBR 7471/2001)
Adaptation to european standards
Production scale
Design
Updated and innovative design
Artwork with excellent finishing
50
Metallurgy & Plastics
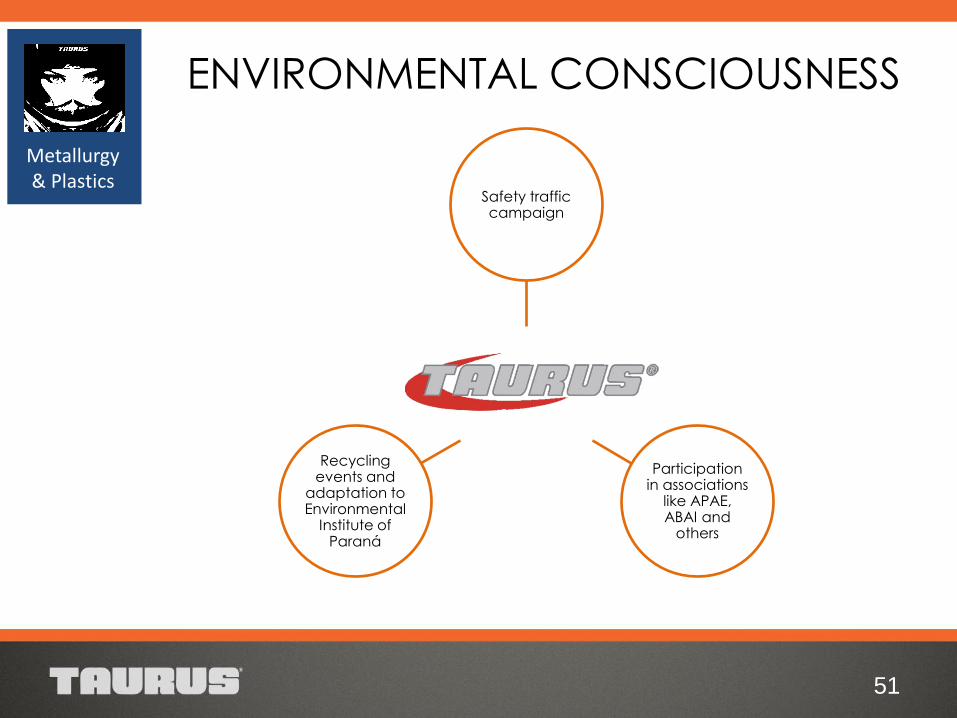
Safety traffic campaign
Participation in associations
like APAE, ABAI and
others
Recycling events and
adaptation to Environmental
Institute of Paraná
ENVIRONMENTAL CONSCIOUSNESS
51
Metallurgy & Plastics
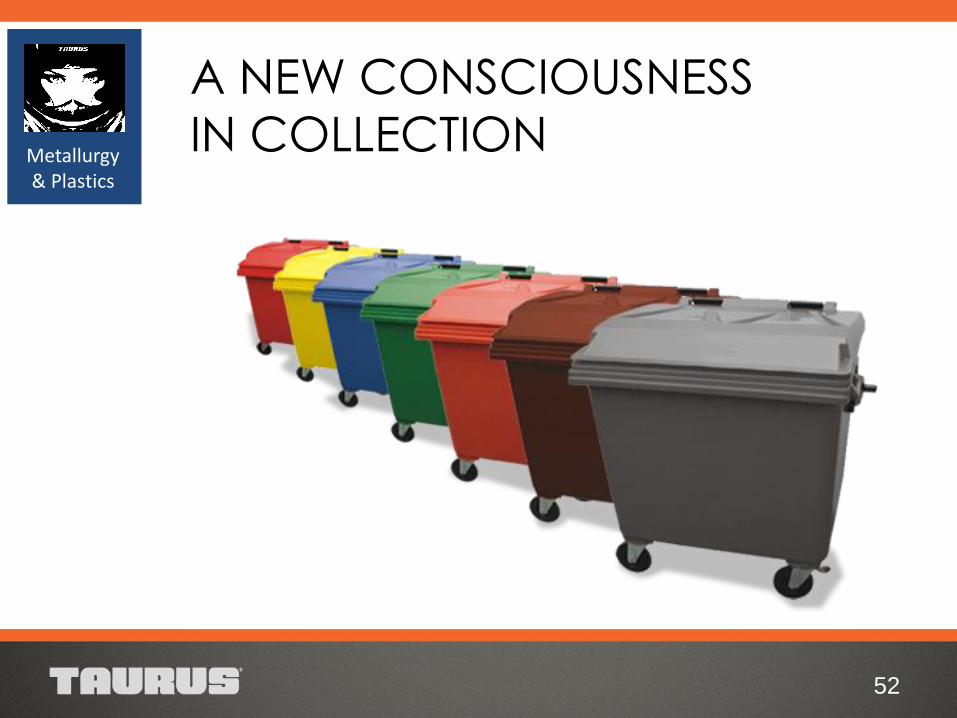
A NEW CONSCIOUSNESS
IN COLLECTION
52
Metallurgy & Plastics
CLIENTS
Trade Representatives
Contractors Resale Residential Condominiums
Manufacturers Prefectures
53
Metallurgy & Plastics
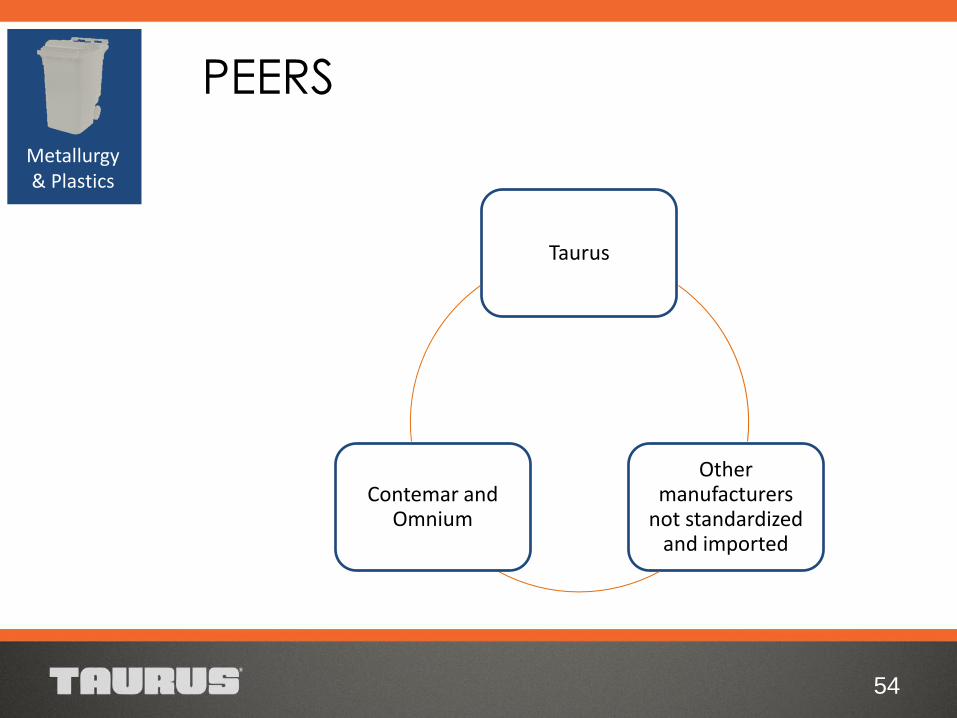
Taurus
Other manufacturers
not standardized and imported
Contemar and Omnium
PEERS
54
Metallurgy & Plastics
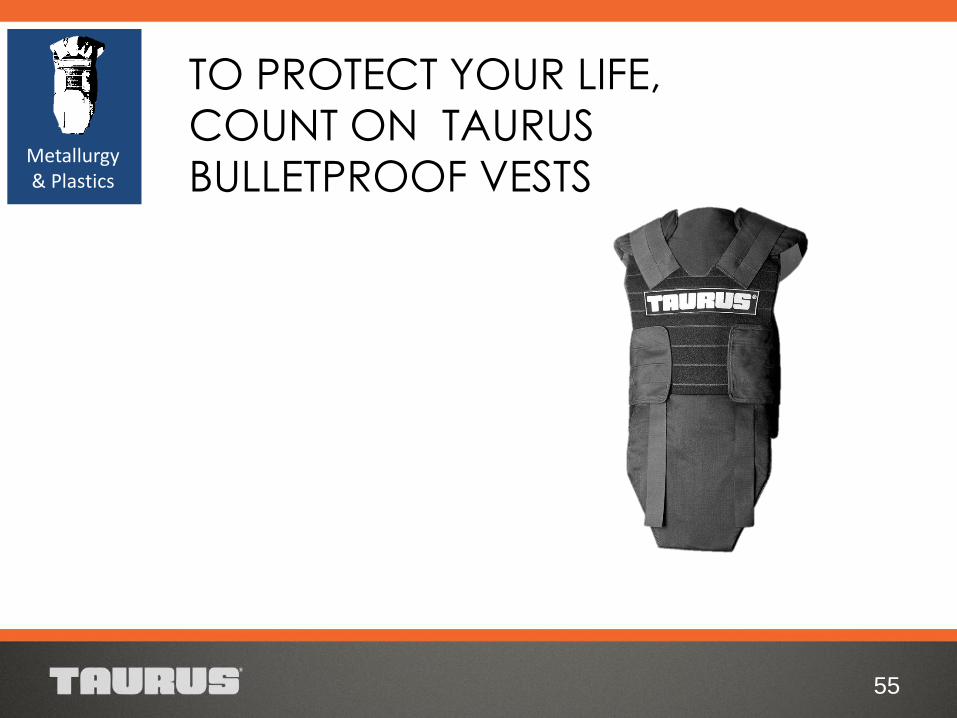
TO PROTECT YOUR LIFE,
COUNT ON TAURUS
BULLETPROOF VESTS
55
Metallurgy & Plastics
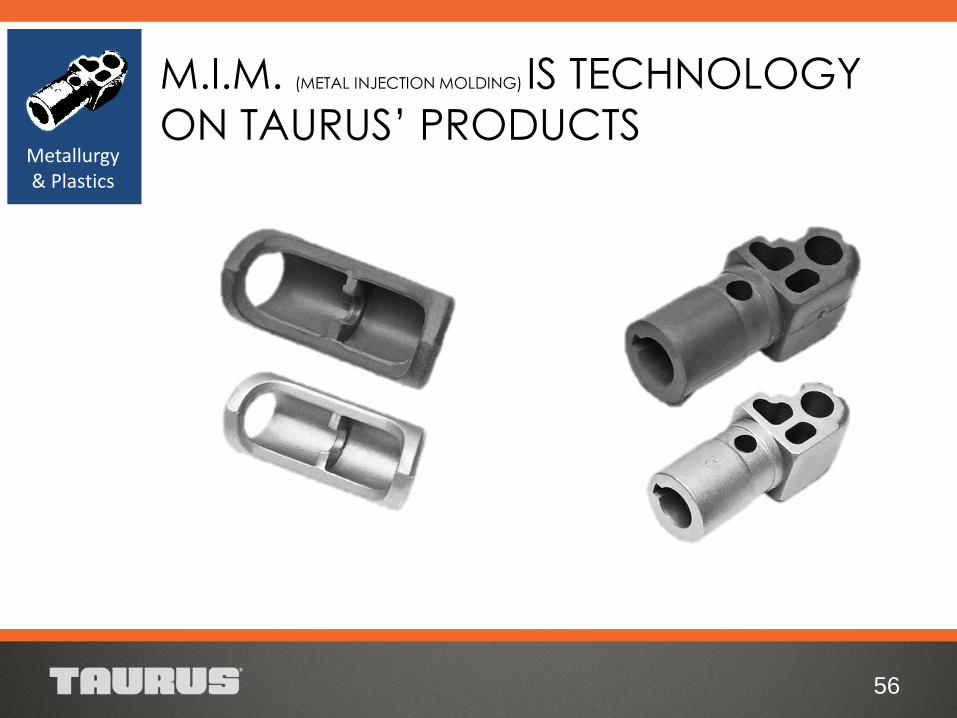
M.I.M. (METAL INJECTION MOLDING) IS TECHNOLOGY
ON TAURUS’ PRODUCTS
56
Metallurgy & Plastics
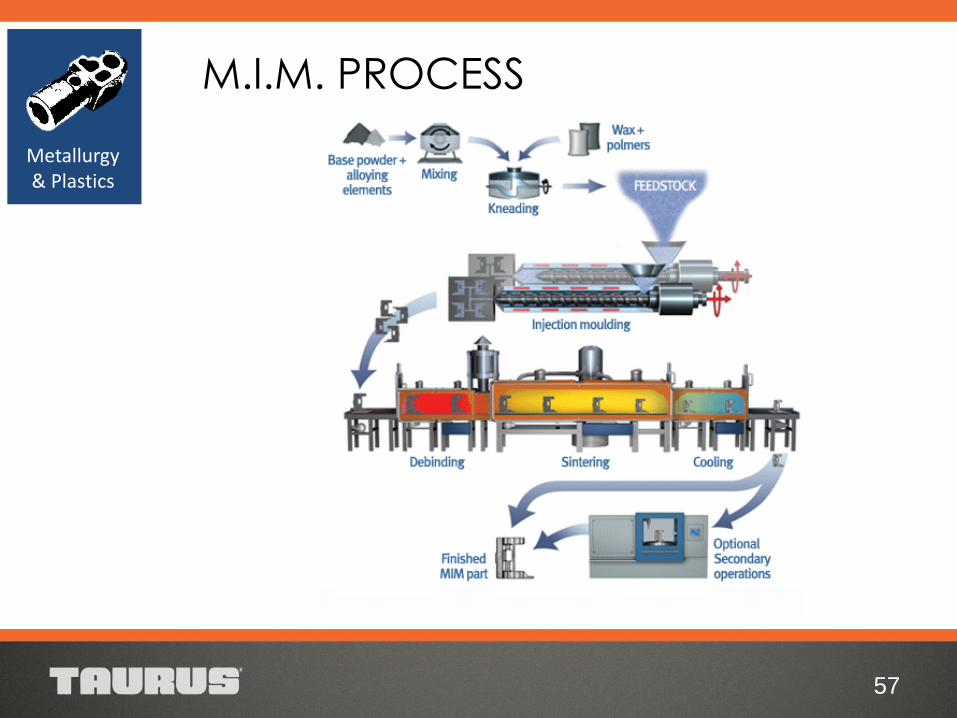
M.I.M. PROCESS
57
Metallurgy & Plastics
58
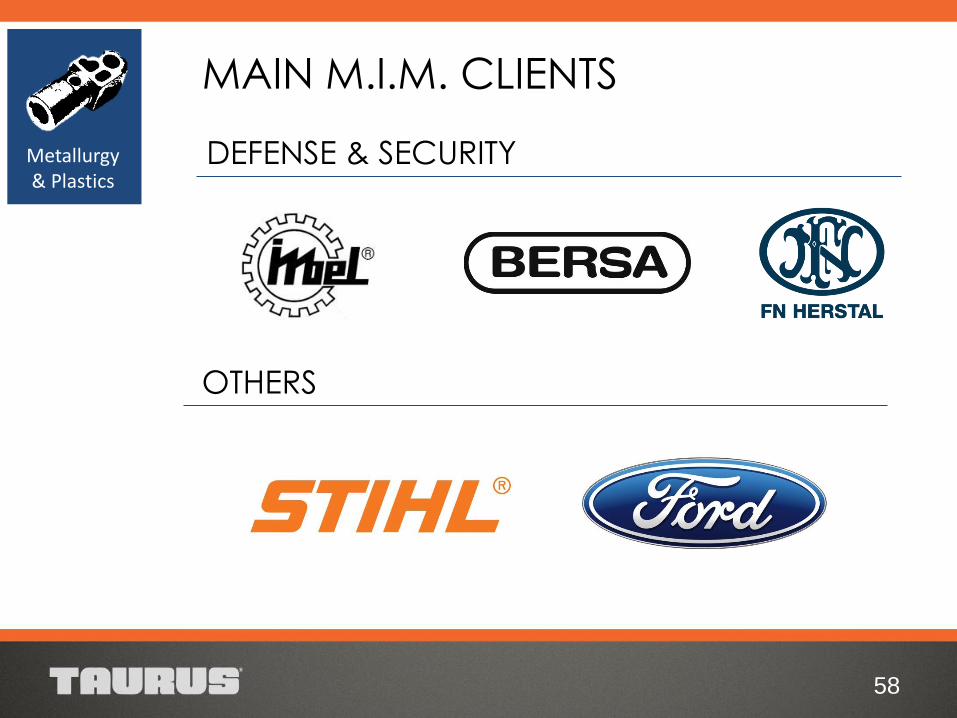
MAIN M.I.M. CLIENTS
DEFENSE & SECURITY
OTHERS
Metallurgy & Plastics
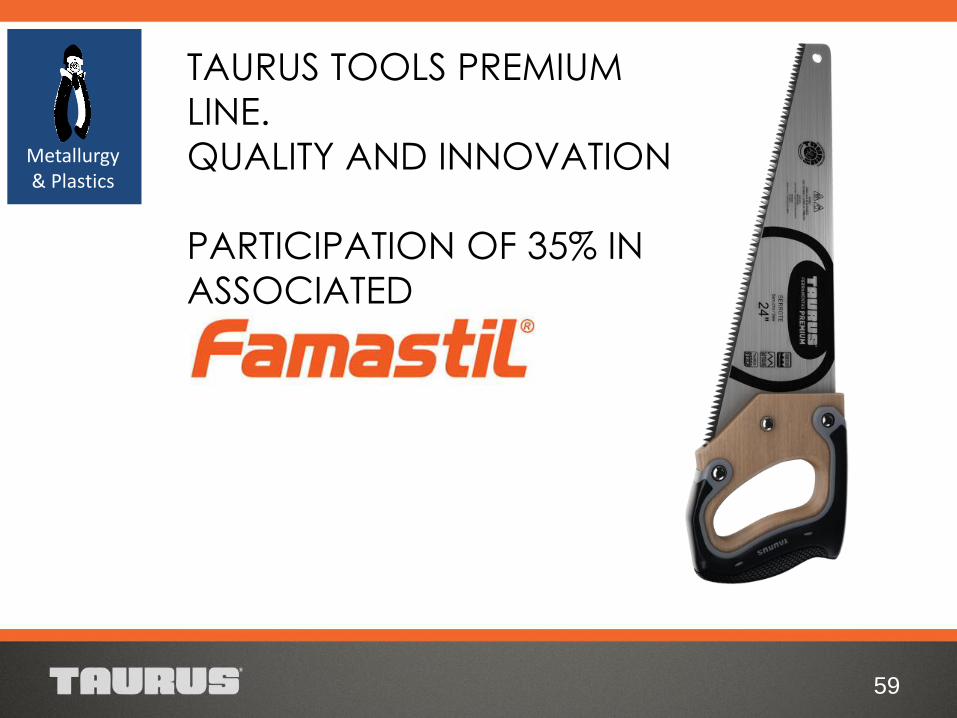
TAURUS TOOLS PREMIUM
LINE.
QUALITY AND INNOVATION
PARTICIPATION OF 35% IN
ASSOCIATED
59
Metallurgy & Plastics

60
Company Defense & Security
Metallurgy & Plastics
Guidance Results Strategies
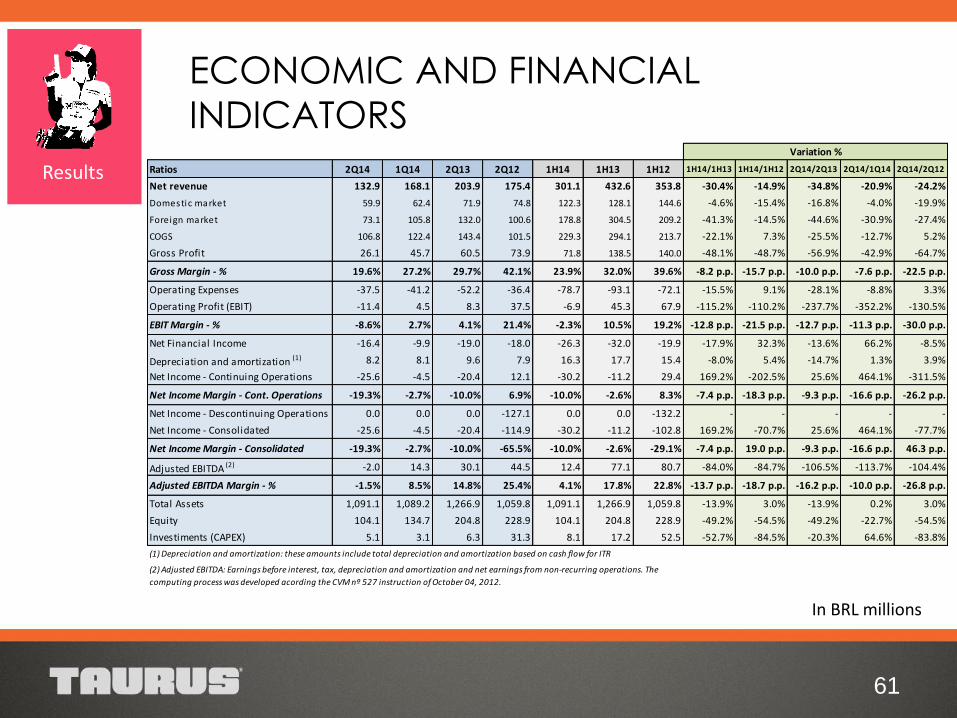
ECONOMIC AND FINANCIAL
INDICATORS
61
Results
In BRL millions
Variation %
Ratios 2Q14 1Q14 2Q13 2Q12 1H14 1H13 1H12 1H14/1H13 1H14/1H12 2Q14/2Q13 2Q14/1Q14 2Q14/2Q12
Net revenue 132.9 168.1 203.9 175.4 301.1 432.6 353.8 -30.4% -14.9% -34.8% -20.9% -24.2%
Domestic market 59.9 62.4 71.9 74.8 122.3 128.1 144.6 -4.6% -15.4% -16.8% -4.0% -19.9%
Foreign market 73.1 105.8 132.0 100.6 178.8 304.5 209.2 -41.3% -14.5% -44.6% -30.9% -27.4%
COGS 106.8 122.4 143.4 101.5 229.3 294.1 213.7 -22.1% 7.3% -25.5% -12.7% 5.2%
Gross Profit 26.1 45.7 60.5 73.9 71.8 138.5 140.0 -48.1% -48.7% -56.9% -42.9% -64.7%
Gross Margin - % 19.6% 27.2% 29.7% 42.1% 23.9% 32.0% 39.6% -8.2 p.p. -15.7 p.p. -10.0 p.p. -7.6 p.p. -22.5 p.p.
Operating Expenses -37.5 -41.2 -52.2 -36.4 -78.7 -93.1 -72.1 -15.5% 9.1% -28.1% -8.8% 3.3%
Operating Profit (EBIT) -11.4 4.5 8.3 37.5 -6.9 45.3 67.9 -115.2% -110.2% -237.7% -352.2% -130.5%
EBIT Margin - % -8.6% 2.7% 4.1% 21.4% -2.3% 10.5% 19.2% -12.8 p.p. -21.5 p.p. -12.7 p.p. -11.3 p.p. -30.0 p.p.
Net Financial Income -16.4 -9.9 -19.0 -18.0 -26.3 -32.0 -19.9 -17.9% 32.3% -13.6% 66.2% -8.5%
Depreciation and amortization (1) 8.2 8.1 9.6 7.9 16.3 17.7 15.4 -8.0% 5.4% -14.7% 1.3% 3.9%
Net Income - Continuing Operations -25.6 -4.5 -20.4 12.1 -30.2 -11.2 29.4 169.2% -202.5% 25.6% 464.1% -311.5%
Net Income Margin - Cont. Operations -19.3% -2.7% -10.0% 6.9% -10.0% -2.6% 8.3% -7.4 p.p. -18.3 p.p. -9.3 p.p. -16.6 p.p. -26.2 p.p.
Net Income - Descontinuing Operations 0.0 0.0 0.0 -127.1 0.0 0.0 -132.2 - - - - -
Net Income - Consolidated -25.6 -4.5 -20.4 -114.9 -30.2 -11.2 -102.8 169.2% -70.7% 25.6% 464.1% -77.7%
Net Income Margin - Consolidated -19.3% -2.7% -10.0% -65.5% -10.0% -2.6% -29.1% -7.4 p.p. 19.0 p.p. -9.3 p.p. -16.6 p.p. 46.3 p.p.
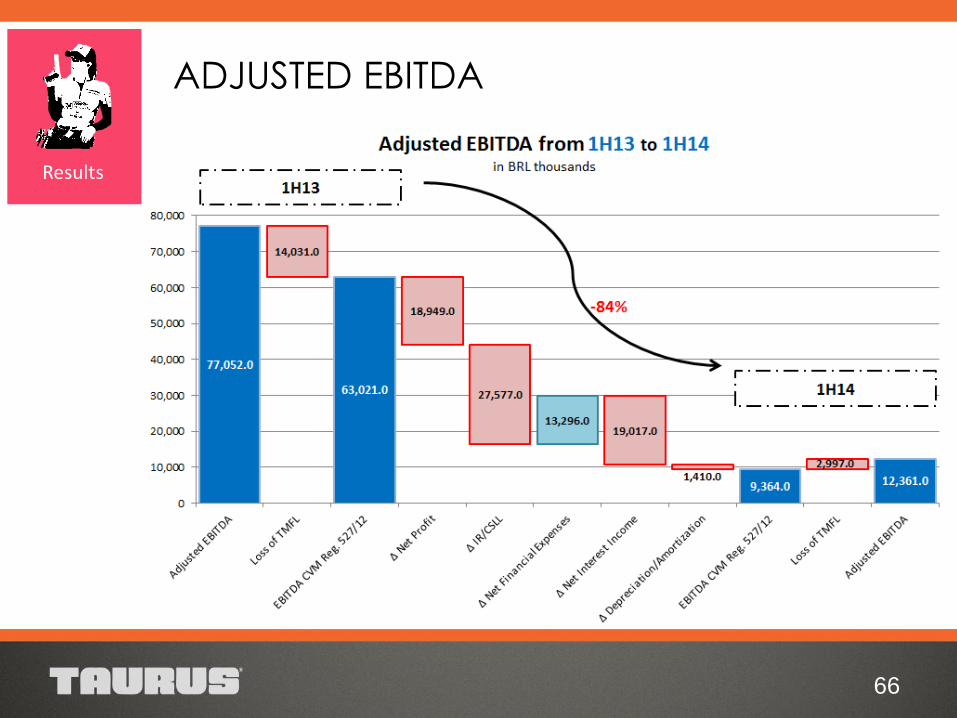
Adjusted EBITDA (2) -2.0 14.3 30.1 44.5 12.4 77.1 80.7 -84.0% -84.7% -106.5% -113.7% -104.4%
Adjusted EBITDA Margin - % -1.5% 8.5% 14.8% 25.4% 4.1% 17.8% 22.8% -13.7 p.p. -18.7 p.p. -16.2 p.p. -10.0 p.p. -26.8 p.p.
Total Assets 1,091.1 1,089.2 1,266.9 1,059.8 1,091.1 1,266.9 1,059.8 -13.9% 3.0% -13.9% 0.2% 3.0%
Equity 104.1 134.7 204.8 228.9 104.1 204.8 228.9 -49.2% -54.5% -49.2% -22.7% -54.5%
Investiments (CAPEX) 5.1 3.1 6.3 31.3 8.1 17.2 52.5 -52.7% -84.5% -20.3% 64.6% -83.8%
(1) Depreciation and amortization: these amounts include total depreciation and amortization based on cash flow for ITR
(2) Adjusted EBITDA: Earnings before interest, tax, depreciation and amortization and net earnings from non-recurring operations. The
computing process was developed acording the CVM nº 527 instruction of October 04, 2012.
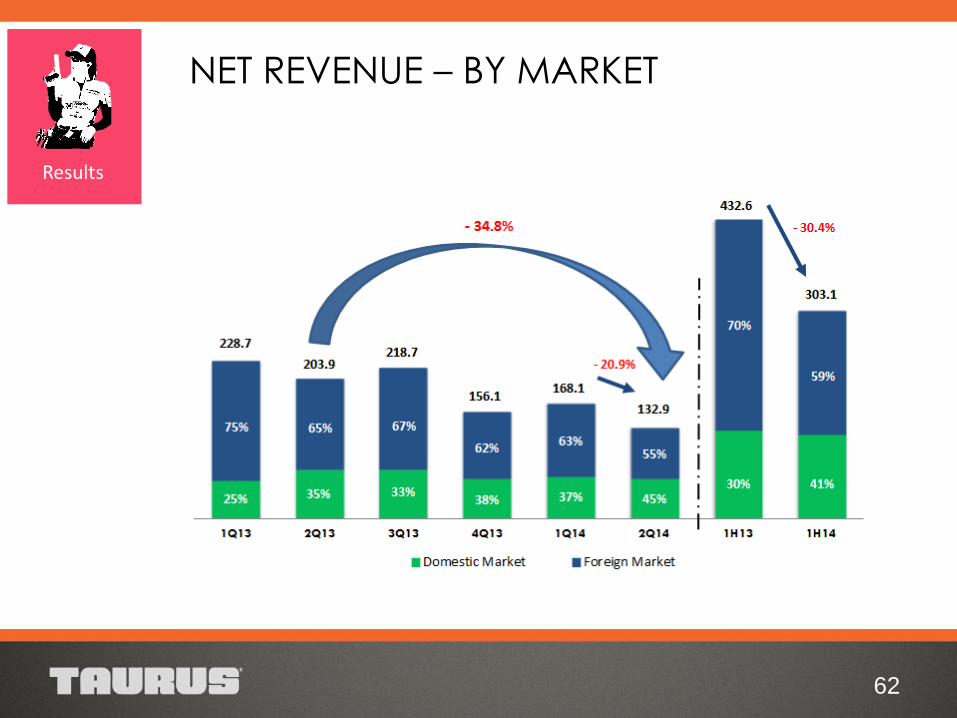
NET REVENUE – BY MARKET
62
Results
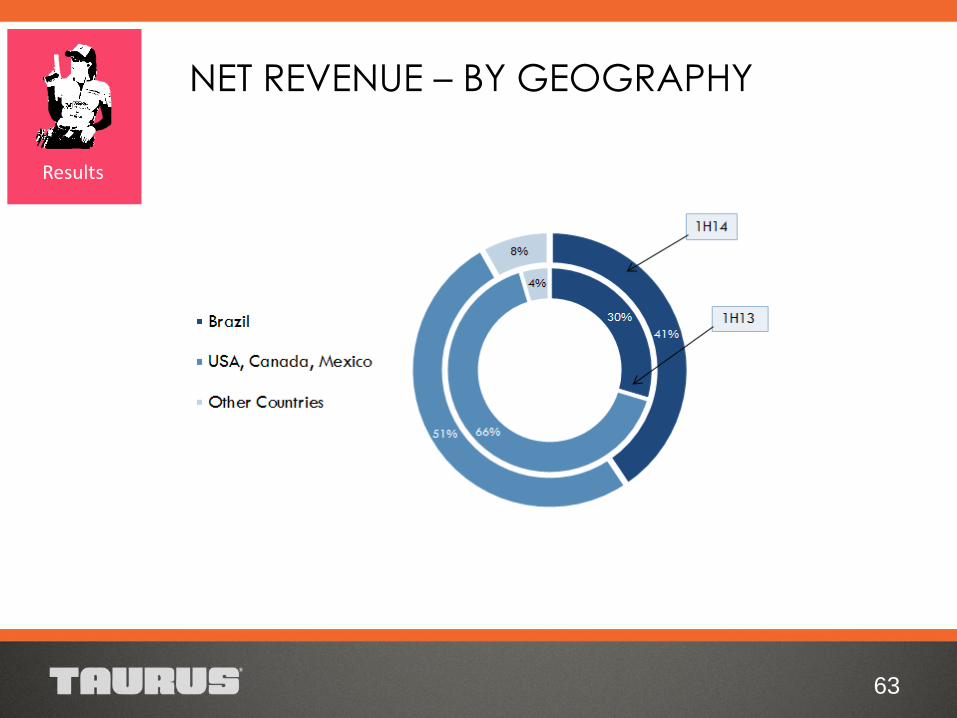
NET REVENUE – BY GEOGRAPHY
63
Results
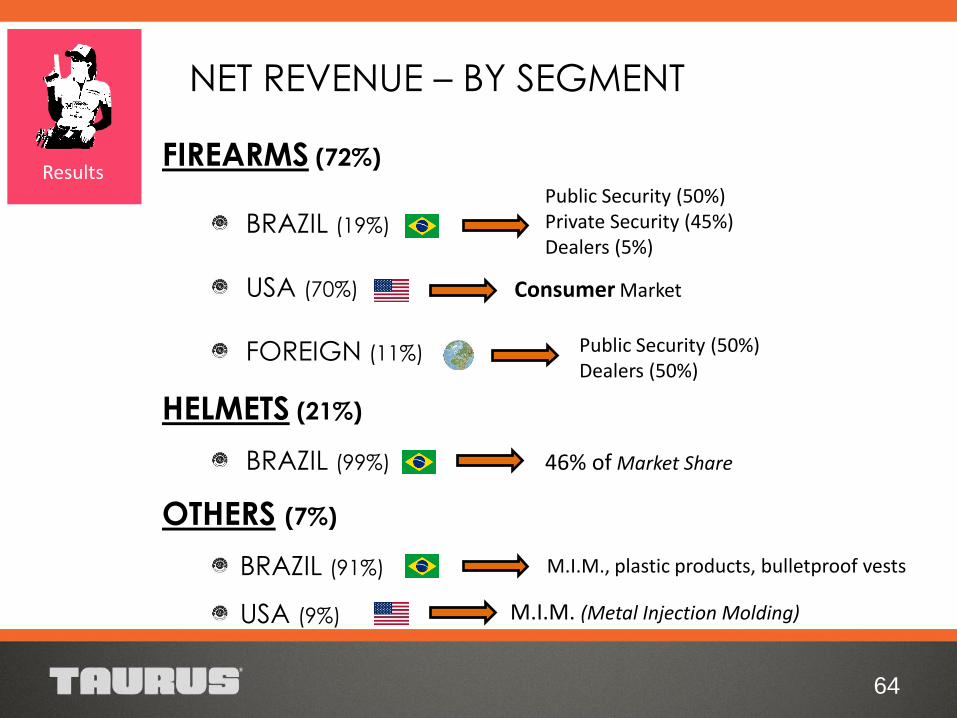
64
FIREARMS (72%)
BRAZIL (19%)
USA (70%)
FOREIGN (11%)
HELMETS (21%)
BRAZIL (99%)
OTHERS (7%)
BRAZIL (91%)
USA (9%)
Public Security (50%) Private Security (45%) Dealers (5%)
Consumer Market
Public Security (50%) Dealers (50%)
46% of Market Share
NET REVENUE – BY SEGMENT
Results
M.I.M. (Metal Injection Molding)
M.I.M., plastic products, bulletproof vests
65
Results
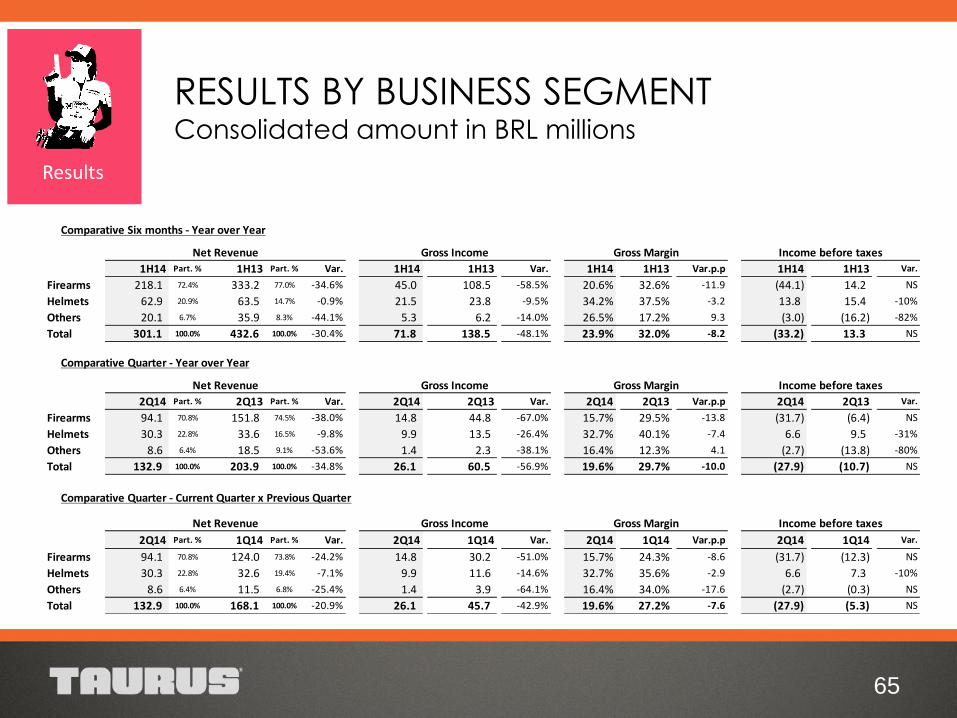
RESULTS BY BUSINESS SEGMENT Consolidated amount in BRL millions
1H14 Part. % 1H13 Part. % Var. 1H14 1H13 Var. 1H14 1H13 Var.p.p 1H14 1H13 Var.
Firearms 218.1 72.4% 333.2 77.0% -34.6% 45.0 108.5 -58.5% 20.6% 32.6% -11.9 (44.1) 14.2 NS
Helmets 62.9 20.9% 63.5 14.7% -0.9% 21.5 23.8 -9.5% 34.2% 37.5% -3.2 13.8 15.4 -10%
Others 20.1 6.7% 35.9 8.3% -44.1% 5.3 6.2 -14.0% 26.5% 17.2% 9.3 (3.0) (16.2) -82%
Total 301.1 100.0% 432.6 100.0% -30.4% 71.8 138.5 -48.1% 23.9% 32.0% -8.2 (33.2) 13.3 NS
2Q14 Part. % 2Q13 Part. % Var. 2Q14 2Q13 Var. 2Q14 2Q13 Var.p.p 2Q14 2Q13 Var.
Firearms 94.1 70.8% 151.8 74.5% -38.0% 14.8 44.8 -67.0% 15.7% 29.5% -13.8 (31.7) (6.4) NS
Helmets 30.3 22.8% 33.6 16.5% -9.8% 9.9 13.5 -26.4% 32.7% 40.1% -7.4 6.6 9.5 -31%
Others 8.6 6.4% 18.5 9.1% -53.6% 1.4 2.3 -38.1% 16.4% 12.3% 4.1 (2.7) (13.8) -80%
Total 132.9 100.0% 203.9 100.0% -34.8% 26.1 60.5 -56.9% 19.6% 29.7% -10.0 (27.9) (10.7) NS
2Q14 Part. % 1Q14 Part. % Var. 2Q14 1Q14 Var. 2Q14 1Q14 Var.p.p 2Q14 1Q14 Var.
Firearms 94.1 70.8% 124.0 73.8% -24.2% 14.8 30.2 -51.0% 15.7% 24.3% -8.6 (31.7) (12.3) NS
Helmets 30.3 22.8% 32.6 19.4% -7.1% 9.9 11.6 -14.6% 32.7% 35.6% -2.9 6.6 7.3 -10%
Others 8.6 6.4% 11.5 6.8% -25.4% 1.4 3.9 -64.1% 16.4% 34.0% -17.6 (2.7) (0.3) NS
Total 132.9 100.0% 168.1 100.0% -20.9% 26.1 45.7 -42.9% 19.6% 27.2% -7.6 (27.9) (5.3) NS
Net Revenue Gross Income Gross Margin Income before taxes
Comparative Quarter - Year over Year
Net Revenue Gross Income Gross Margin Income before taxes
Comparative Quarter - Current Quarter x Previous Quarter
Comparative Six months - Year over Year
Net Revenue Gross Income Gross Margin Income before taxes
66
Results
ADJUSTED EBITDA
67
Results
WORKING CAPITAL
68
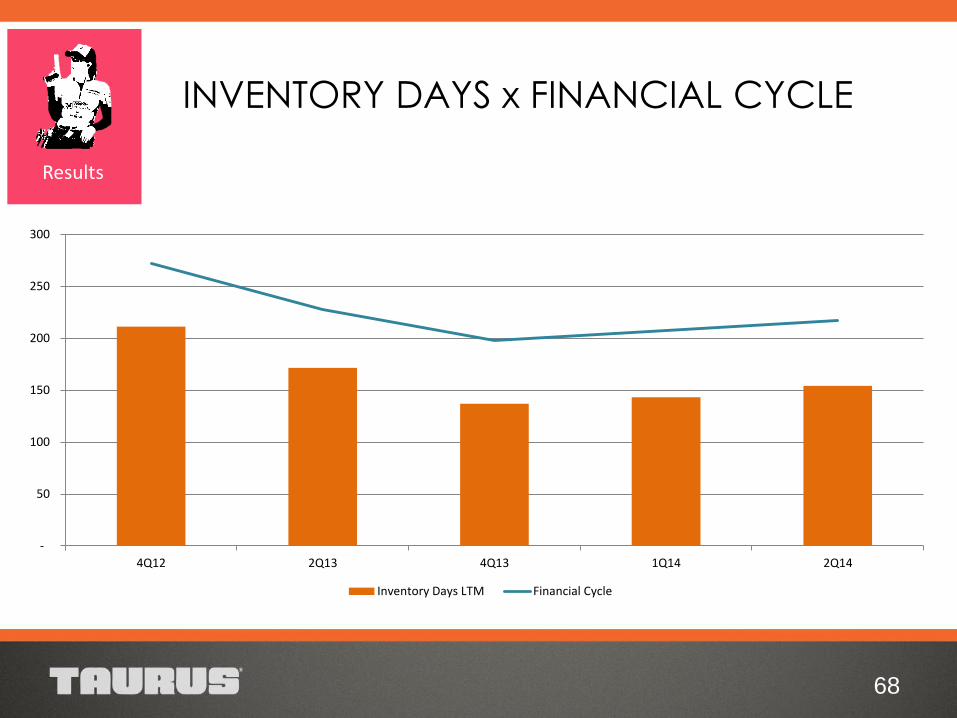
INVENTORY DAYS x FINANCIAL CYCLE
Results
-
50
100
150
200
250
300
4Q12 2Q13 4Q13 1Q14 2Q14
Inventory Days LTM Financial Cycle

69
WORKING CAPITAL NEEDS
Results
0
50.000
100.000
150.000
200.000
250.000
300.000
350.000
400.000
2011 2012 2013 1Q13 2Q13 3Q13 4Q13 1Q14 2Q14
70
Results
DEBT
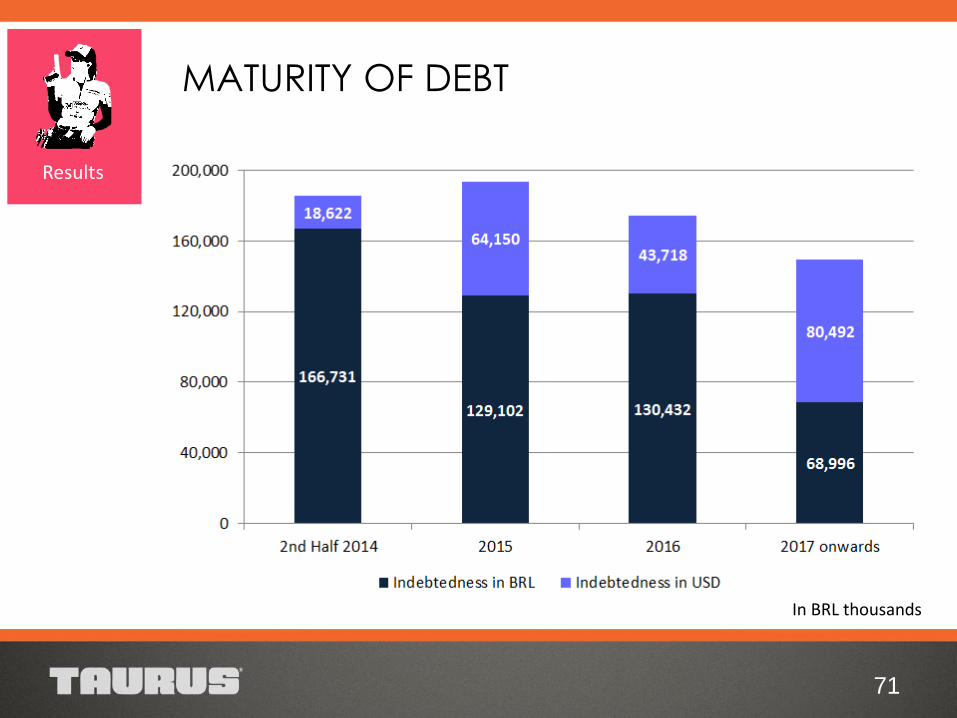
MATURITY OF DEBT
71
Results
In BRL thousands
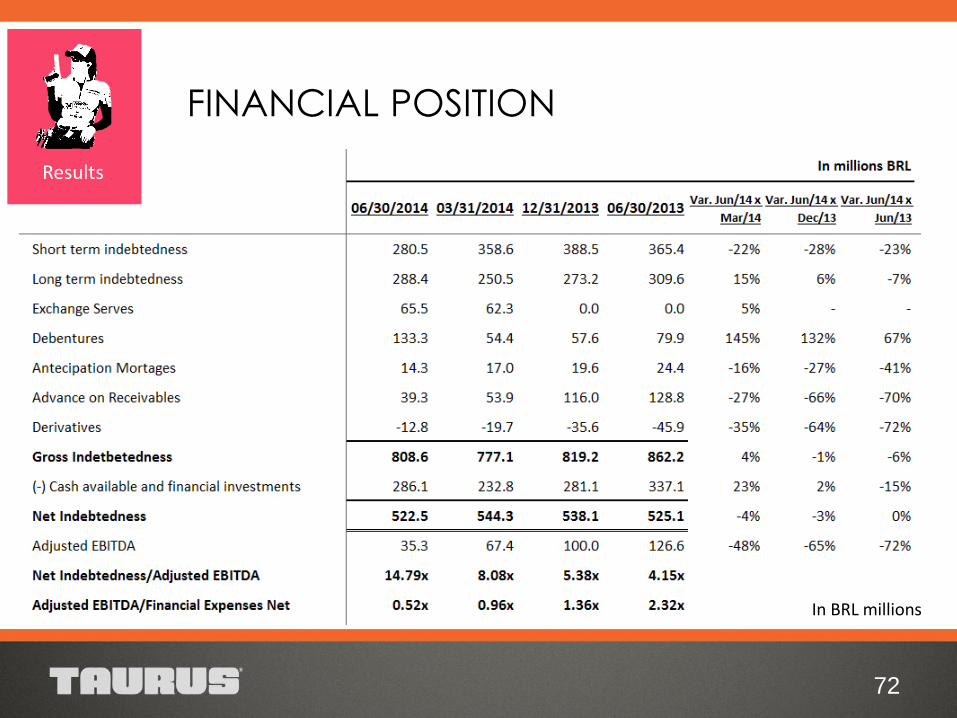
FINANCIAL POSITION
72
Results
In BRL millions
73
Results
INVESTIMENTS
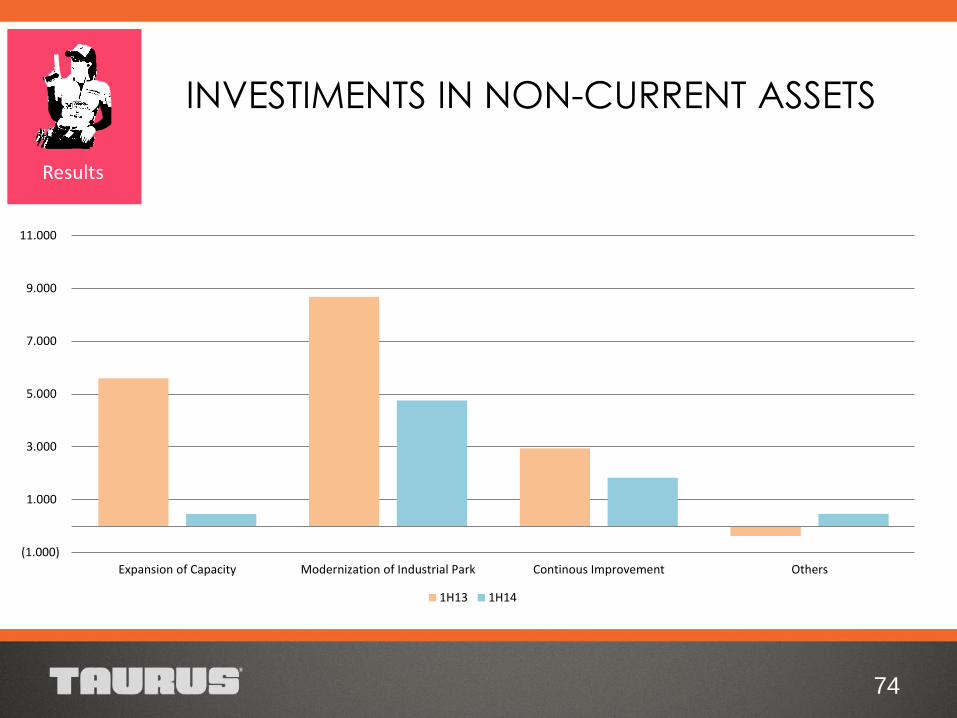
INVESTIMENTS IN NON-CURRENT ASSETS
74
Results
(1.000)
1.000
3.000
5.000
7.000
9.000
11.000
Expansion of Capacity Modernization of Industrial Park Continous Improvement Others
1H13 1H14
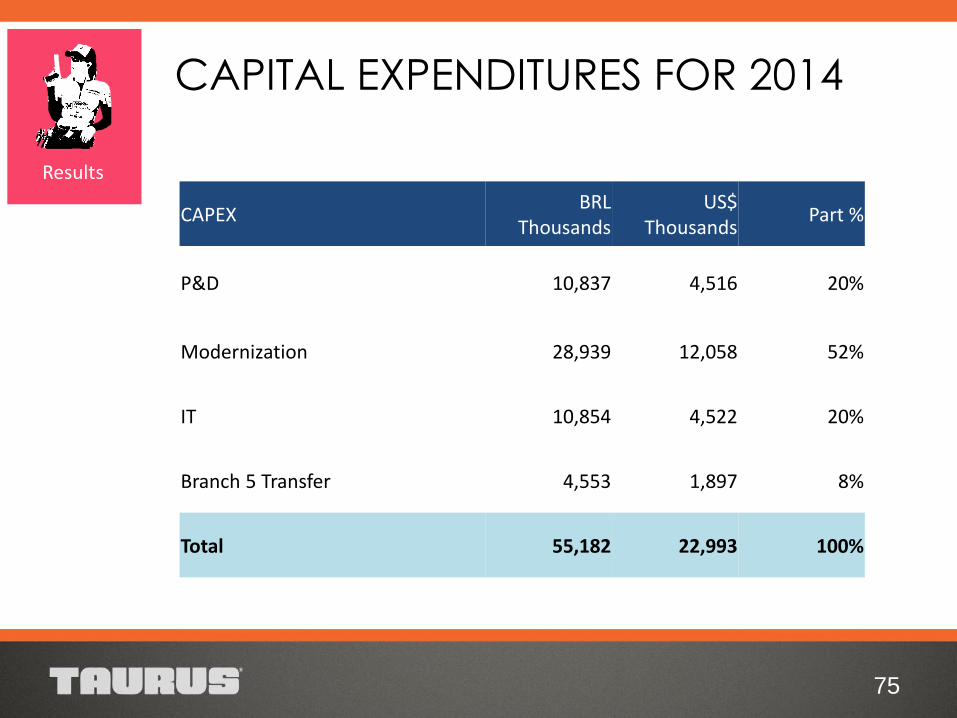
CAPITAL EXPENDITURES FOR 2014
75
Results
CAPEX BRL
Thousands US$
Thousands Part %
P&D 10,837 4,516 20%
Modernization 28,939 12,058 52%
IT 10,854 4,522 20%
Branch 5 Transfer 4,553 1,897 8%
Total 55,182 22,993 100%
76
Company Defense & Security
Metallurgy & Plastics
Guidance Results Strategies
GUIDANCE 2014
77
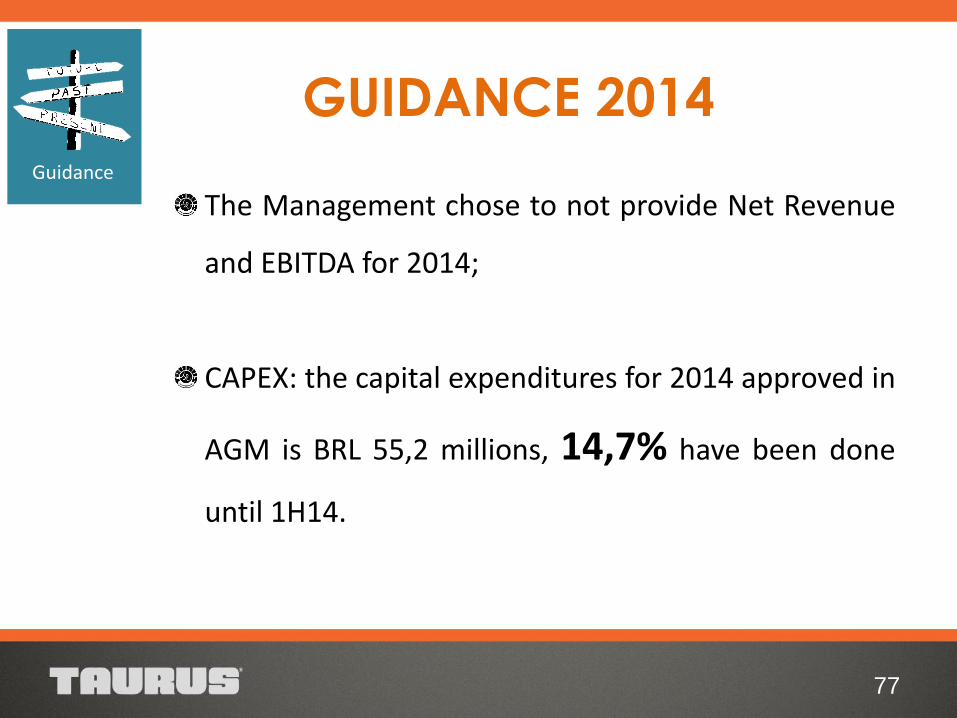
Guidance
The Management chose to not provide Net Revenue
and EBITDA for 2014;
CAPEX: the capital expenditures for 2014 approved in
AGM is BRL 55,2 millions, 14,7% have been done
until 1H14.

78
Company Defense & Security
Metallurgy & Plastics
Guidance Results Strategies
79
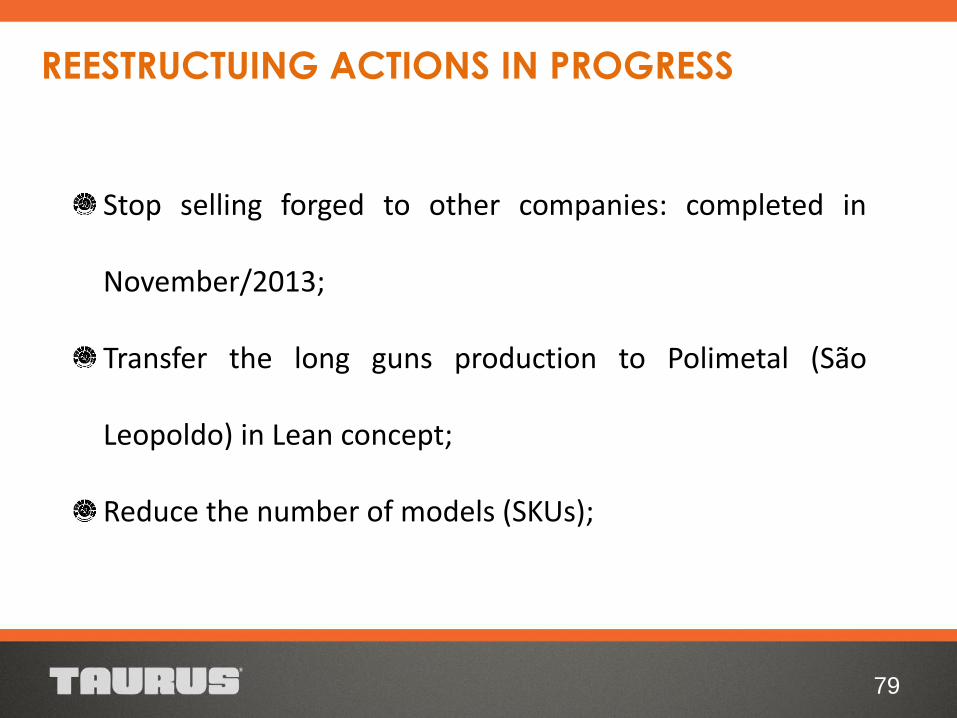
Stop selling forged to other companies: completed in
November/2013;
Transfer the long guns production to Polimetal (São
Leopoldo) in Lean concept;
Reduce the number of models (SKUs);
REESTRUCTUING ACTIONS IN PROGRESS
80
Reimplementation the Management of Manufacturing System;
Reduced costs and resources used in production;
Structuring the Supply Chain department;
Review of the entire logistics chain (use of new modes and
reducing inventories).
REESTRUCTUING ACTIONS IN PROGRESS
81
Update and introduce new modules on ERP system,
improving internal controls and management reports;
Integrate the operations between Brazil and the USA;
Expand M.I.M. markets to other markets, promoting
profitability increase of the segment;
MAIN ACTIONS FOR 2014
82
Reduce dependence on the american market by increasing
the volume of exports to other countries;
Expand supply the armed forces, taking advantage of our
condition of Strategic Defense Company;
Preparing the Company to provide services of products
maintanance.
MAIN ACTIONS FOR 2014
FELIPE G. OLIVEIRA
Investor Relations Analyst
DORIS B. F. WILHELM
Investor Relations Officer
83
EDUARDO F. COSTA
Vice-President Administrative & CFO
FORJAS TAURUS S.A. 55 51 3021 3001
www.taurusri.com.br