institutional presentation - university of florida · disclaimer the material that follows is a...
TRANSCRIPT


Disclaimer
► The material that follows is a presentation of general background information about Sonae Sierra Brasil S.A. and its subsidiaries (the “Company”) as of the date of the presentation. It is information in summary form and does not purport to be complete. It is not intended to be relied upon as advice to potential investors and does not form the basis for an informed investment decision. This presentation is strictly confidential and may not be disclosed to any other person. No representation or warranty, express or implied, is made concerning, and no reliance should be placed on, the accuracy, fairness or completeness of the information presented herein.
► This presentation may contain statements that are forward-looking within the meaning of Section 27A of the U.S. Securities Act of 1933, as amended (the “Securities Act”) and Section 21E of the U.S. Securities Exchange Act of 1934. Such forward-looking statements are only predictions and are not guarantees of future performance. Investors are cautioned that any such forward-looking statements are and will be, as the case may be, subject to many risks, uncertainties and factors relating to the operations and business environments of the Company and its subsidiaries that may cause the actual results of the Company to be materially different from any future results expressed or implied in such forward-looking statements. No person has any responsibility to update any such information.
► This presentation does not constitute an offer, or invitation, or solicitation or an offer, to subscribe for or purchase any securities. Neither this presentation nor anything contained herein shall form the basis of any contract or commitment.
2

Index
3
4 Company Fundamentals
11 Our Portfolio
16 Growth Strategy
7 Market and Sector Fundamentals
20 Operational and Financial Indicators
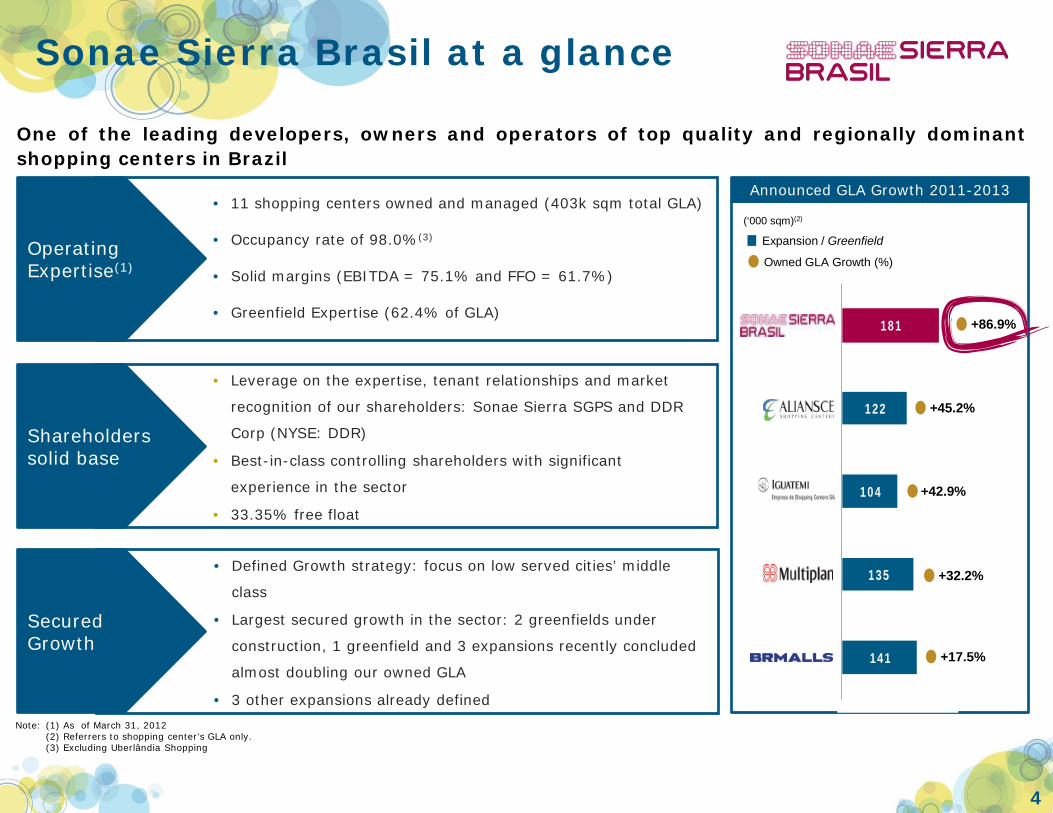
• Leverage on the expertise, tenant relationships and market
recognition of our shareholders: Sonae Sierra SGPS and DDR
Corp (NYSE: DDR)
• Best-in-class controlling shareholders with significant
experience in the sector
• 33.35% free float
• Defined Growth strategy: focus on low served cities’ middle
class
• Largest secured growth in the sector: 2 greenfields under
construction, 1 greenfield and 3 expansions recently concluded
almost doubling our owned GLA
• 3 other expansions already defined
• 11 shopping centers owned and managed (403k sqm total GLA)
• Occupancy rate of 98.0%(3)
• Solid margins (EBITDA = 75.1% and FFO = 61.7%)
• Greenfield Expertise (62.4% of GLA)
141
135
104
122
181
+42.9%
+86.9%
+45.2%
+32.2%
+17.5%
Sonae Sierra Brasil at a glance
4
Operating Expertise(1)
Shareholders solid base
Secured Growth
Note: (1) As of March 31, 2012 (2) Referrers to shopping center’s GLA only. (3) Excluding Uberlândia Shopping
One of the leading developers, owners and operators of top quality and regionally dominant shopping centers in Brazil
Expansion / Greenfield
(‘000 sqm)(2)
Owned GLA Growth (%)
Announced GLA Growth 2011-2013

Ownership Structure
5
Sonae Sierra Brasil benefits from best-in-class corporate governance and globally recognized sector expertise, arising from a solid and engaged controlling shareholders
Free Float Sierra Brazil 1 B.V.
66.65% 33.35%
50.0%
• Over 45 years of history
• One of the largest developers and operators of shopping centers in US
• 12 million of sqm in total GLA
• NYSE listed and Sox Compliant
• Equity value of US$4.1 billion (1)
50.0%
• Over 21 years of history
• One of the largest developers and operators of shopping centers in Europe
• Over 2 million of sqm in total GLA
• NAV: €1.1 billion (1)
• The largest business group of Portugal, with operations in over 40 countries
• Operations in retail, properties, shopping centers and telecommunications
• Market Value: €854 million (2)
• British company with over 300 years of history in the properties market
• Over 1,000 properties under management with a total value of £10.9 billion
• Properties in retail, commercial and residential segments
Sonae Sierra Brasil S.A.
50.0% 50.0%
Note: (1) As of June 30, 2012 (2) As of August 13, 2012
Index
6
4 Company Fundamentals
11 Our Portfolio
16 Growth Strategy
7 Market and Sector Fundamentals
20 Operational and Financial Indicators

Macro Economic Scenario
7
Despite uncertainties in the global macro economic scenario, perspectives are compelling for Brazil
IPCA Rate (%) Retail Sales Growth (%)
5.7%
3.1%
4.5%
5.9%
4.3%
5.9%
6.5%
5.2%5.6%
5.2% 5.1%
2005 2006 2007 2008 2009 2010 2011 2012e 2013e 2014e 2015e
18.00%
13.25%
11.25%
13.75%
8.75%
10.75% 11.00%
7.50% 7.50% 7.50%
10.00%
2005 2006 2007 2008 2009 2010 2011 2012e 2013e 2014e 2015e
3.2%3.9%
6.1%
5.2%
-0.3%
7.5%
2.7%
1.7%
3.9% 4.2%3.8%
2005 2006 2007 2008 2009 2010 2011 2012e 2013e 2014e 2015e
4.8%
6.2%
9.8%9.1%
5.9%
10.9%
6.7%
2005 2006 2007 2008 2009 2010 2011
Selic Rate (%) GDP Growth Rate (%)
Source: MCM
Source: MCM Source: MCM
Source: IBGE
-
500
1,000
1,500
2,000
2,500
USA
Can
ada
Euro
pe
Chi
le
Mex
ico
Col
ombi
a
Peru
Bra
zil
DF SP
PR AM
GO
MG
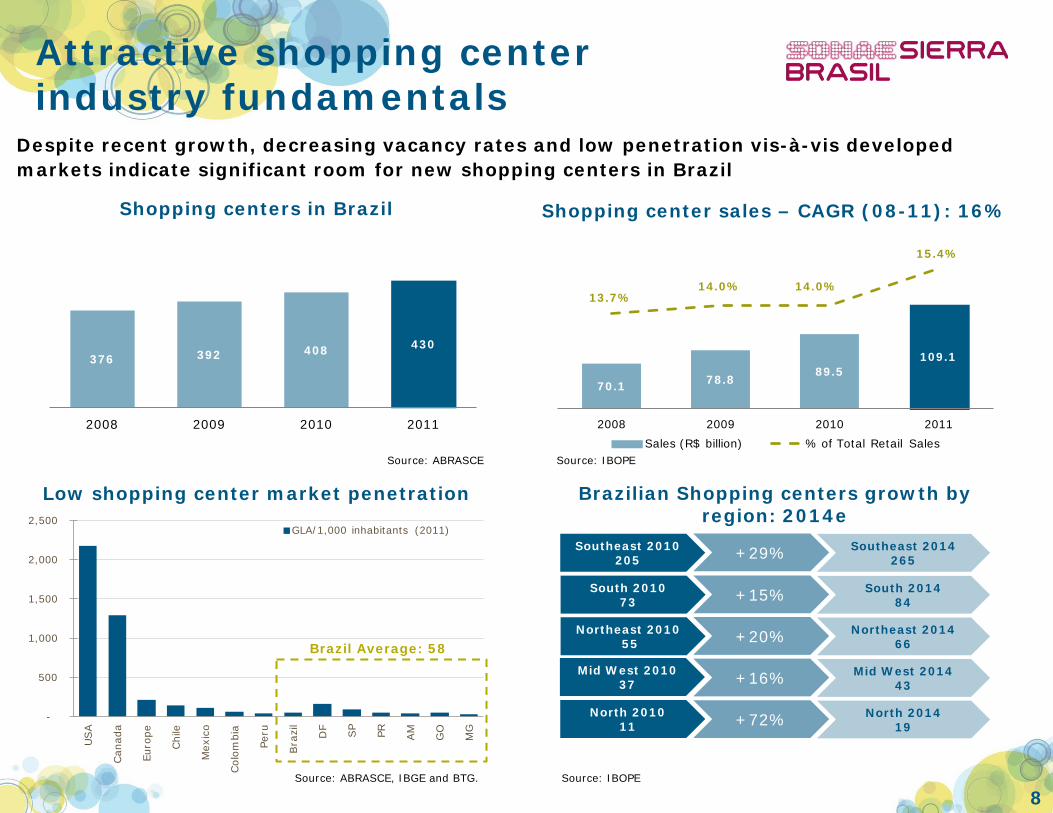
GLA/1,000 inhabitants (2011)
Attractive shopping center industry fundamentals
8
Despite recent growth, decreasing vacancy rates and low penetration vis-à-vis developed markets indicate significant room for new shopping centers in Brazil
Shopping centers in Brazil Shopping center sales – CAGR (08-11): 16%
Low shopping center market penetration Brazilian Shopping centers growth by region: 2014e
Source: ABRASCE, IBGE and BTG. Source: IBOPE
Southeast 2010 205
South 2010 73
Northeast 2010 55
Mid West 2010 37
North 2010 11
+29%
+15%
+20%
+16%
+72%
Southeast 2014 265
South 2014 84
Northeast 2014 66
Mid West 2014 43
North 2014 19
70.1 78.889.5
109.1
13.7%14.0% 14.0%
15.4%
2008 2009 2010 2011Sales (R$ billion) % of Total Retail Sales
Source: IBOPE Source: ABRASCE
Brazil Average: 58
376 392 408 430
2008 2009 2010 2011

Fast growing middle class
9
Over 40 million people have moved upwards into the middle class, while middle class disposable income has tripled
Increasing middle class Middle class: disposable income(1) (R$/month)
Consumer credit still underpenetrated in Brazil
Source: Cetelem “O Observador 2012”
51% 24%
34%
54%
22% 15%
2005 2011
Population: 182 mm Population: 191 mm
+16 mm people
+40 mm people
A+B
C
D+E
Up
per
cla
ss
Mid
dle
cla
ss
Low
er c
lass
- 48 mm people
R$ 30 billion increase in monthly disposable income
Note: (1) Income available for spending and saving Source: Cetelem “O Observador 2012”, Euromonitor and Raymond James
Sonae Sierra Brasil is strategically positioned to capture the middle class consumption growth, as it entails over 80% of its
target audience
122 363
2005 2011
25%26%
16%15%
11%
6%4%
28%26%
16%14%
10% 10%
4%
Chile USA Spain Germany Argentina Brazil Mexico
2006 2011

Index
10
4 Company Fundamentals
11 Our Portfolio
16 Growth Strategy
7 Market and Sector Fundamentals
20 Operational and Financial Indicators

Focus on dominant malls in underserved medium and large cities, targeting middle class customers
11
Sonae Sierra Brasil has an established footprint in the State of São Paulo and its growth strategy is based on offering high quality, market dominant developments in underserved regions
Core portfolio: 9 properties Development strategy: 2 opened and 2 greenfields
Core Portfolio of Assets
Strong track record in Brazil’s most dynamic region Growth strategy focused on underserved regions
Parque D. Pedro
• Campinas (SP) • Population: 1,089k • GLA: 121.1k sq m • Occupancy rate:
97.2% • Over 20 mm visits in
2010
Total GLA 2010: 298k sq m
Owned GLA 2010: 151k sq m
Greenfield
Manauara Shopping
• Manaus (AM) • Population: 1,832k • GLA: 46.8k sq m • Occupancy rate:
99.1%
# of competitors in area of influence
Parque D. Pedro 2
Boavista 2
Penha 2
Franca 1
Tivoli 1
Metrópole 2
Pátio Brasil 2
Plaza Sul 1
Campo Limpo 2
Total GLA 2013: 552k sq m
Owned GLA 2013: 389k sq m
# of cities with more than 300k
inhabitants in Brazil
+ 81 Shopping centers
Recently opened mall
Shopping centers
Manaus
Uberlândia
Goiânia
Londrina
Owned GLA concentration
São Paulo Other States
54.9% 45.1%

Portfolio
12
Our portfolio is composed by 11 operating shopping malls, totaling 2,228 stores, 403 thousand sqm of total GLA and 254 thousand sqm of owned GLA. Until 2013 there will be more 2 new malls, adding 118 thousand sqm of owned GLA to the portfolio
Greenfield
Shopping centers
4
5
1 8
9 3 2
6
7
11
13
12
10
1. Parque D. Pedro • Campinas (SP) • GLA (sqm): 121.0
• Stores : 401
2. Boavista Shopping • São Paulo (SP) • GLA (sqm): 15.9
• Stores : 147
3. Shopping Penha • São Paulo (SP) • GLA (sqm): 29.7
• Stores : 196
4. Franca Shopping • Franca (SP) • GLA (sqm): 18.5
• Stores : 106
5. Tivoli Shopping • Santa Barbara
d'Oeste (SP) • GLA (sqm): 22.1
• Stores : 144
7 Pátio Brasil • Cidade: Brasília
(DF) • GLA (sqm): 29.0 • Stores : 235
8. Shopping Plaza Sul • São Paulo (SP) • GLA (sqm): 23.2
• Stores : 221
9. Shopping Campo Limpo • São Paulo (SP) • GLA (sqm): 22.3
• Stores : 148
10. Manauara Shopping • Manaus (AM) • GLA (sqm): 46.8
• Stores : 231
12 Boulevard Londrina Shopping • Londrina (PR) • GLA (sqm): 47.8
• Opening; 1Q13
13 Passeio das Águas Shopping • Goiânia (GO) • GLA (sqm): 78.1
• Opening: 4Q13
11. Uberlândia Shopping • Uberlândia (MG) • GLA (sqm): 45.3
• Stores : 218
6. Shopping Metrópole • São Bernardo do
Campo (SP) • GLA (sqm): 28.6
• Stores : 181
Data on 06/30/12

Controlling interests in most of shopping centers
13
Sonae Sierra Brasil average ownership stake is 63% in its 11 operating properties. It will reach 70% when all three greenfield developments are completed
Shopping Center City State GLA (‘000 sqm) Stake Management
Parque D. Pedro(1) Campinas SP 121.0 51.0% Penha São Paulo SP 29.7 51.0% Metrópole São Bernardo SP 28.6 100.0% Tivoli Santa Bárbara
d’Oeste SP 22.1 30.0% Pátio Brasil Brasília DF 29.0 10.4% Boavista São Paulo SP 15.9 100.0% Franca Franca SP 18.5 67.4% Plaza Sul São Paulo SP 23.2 60.0% Campo Limpo São Paulo SP 22.3 20.0% Manauara Manaus AM 46.8 100.0% Uberlândia Uberlândia MG 45.3 100.0% Weighted Average 63.1%
Londrina Londrina PR 47.8 84.5%(2) Goiânia Goiânia GO 78.1 100.0% Weighted Average 70.5%
Note: (1) Sonae Sierra and DDR hold an additional 25.9% indirect ownership in Parque D. Pedro through another structure. (2) Ownership considering partner will fully exercise its rights in the project
Rationale
Ability to expand and adapt to market trends
Control the management
services of 100% of the malls
Strategic control of the malls

Uberlândia Shopping
14
Opening March 27th, 2012
Total GLA (‘000 sqm) 45.3
SSB’s ownership 100%
Occupancy rate 93.5%
Number of stores 218
Anchor stores 15
Parking spaces 2,400
Gross Investment R$201 million
With Uberlândia Shopping, Sonae Sierra Brasil reaches 11 malls owned and managed, totaling 410 thousand sqm of total GLA and 254 sqm of owned GLA. Uberlândia Shopping is the 3rd largest mall in the Company’s portfolio, just behind Parque D. Pedro Shopping and Manauara Shopping. Sonae Sierra Brasil’s average ownership interest increased to 63.1%.

Index
15
4 Company Fundamentals
11 Our Portfolio
16 Growth Strategy
7 Market and Sector Fundamentals
20 Operational and Financial Indicators

Owned GLA Growth
Sonae Sierra Brasil has a solid new development and expansion pipeline which will increase the Company’s owned GLA by over 53% until the end of 2013.
16
254
389
40
78
17
2012 Boulevard Londrina (Londrina, PR)
Passeio das Águas (Goiânia, GO)
Expansions* 2013
Owned GLA Growth ('000 sqm)
*Expansions in Shopping Metrópole, Parque D. Pedro and Tivoli scheduled for 2013.
+53.2%

Greenfields: Boulevard Londrina Shopping
Greenfield Details City Londrina State PR Expected Opening 1Q13 GLA ('000 sqm) 47.8 SSB's Ownership Interest* 84.5% Committed GLA 75% Gross Capex Incurred (R$ MM) 140.4
Scheduled to open in 1Q13, the shopping mall is part of a big renovation project of an old industrial region in downtown Londrina
* Ownership considering partner will fully exercise its rights in the project.
17
Shopping center construction site Project Illustration
Data on 06/30/12

Greenfields: Passeio das Águas Shopping
Scheduled to open in 2H13, the biggest project of our portfolio and is located within the growth sector of Goiânia
Greenfield Details City Goiânia State GO Expected Opening 4Q13 GLA ('000 sqm) 78.1 SSB's Ownership Interest 100% Committed GLA 53% Gross Capex Incurred (R$ MM) 137.2
18
Shopping center construction site Project Illustration
Data on 06/30/12

Index
19
4 Company Fundamentals
11 Our Portfolio
16 Growth Strategy
7 Market and Sector Fundamentals
20 Operational and Financial Indicators

Shopping Center Sales
Shopping Center Tenant Sales(R$ thousand) 2Q12 2Q11 Var. % 1H12 1H11 Var. %Shopping Penha 88,640 81,289 9.0% 167,153 152,288 9.8%Shopping Metrópole 85,780 67,180 27.7% 158,534 122,821 29.1%Tivoli Shopping 47,396 43,485 9.0% 89,235 80,774 10.5%Franca Shopping 41,944 34,907 20.2% 78,052 68,197 14.4%Pátio Brasil 83,459 83,759 -0.4% 160,047 160,486 -0.3%Parque D. Pedro Shopping 310,978 291,328 6.7% 602,444 564,508 6.7%Boavista Shopping 61,593 57,859 6.5% 118,446 109,539 8.1%Shopping Plaza Sul 99,114 91,939 7.8% 182,933 170,538 7.3%Shopping Campo Limpo 71,064 57,248 24.1% 130,151 106,008 22.8%Manauara Shopping 151,843 125,070 21.4% 291,254 239,617 21.5%Uberlândia Shopping 68,439 - - 68,439 - -Total 1,110,251 934,063 18.9% 2,046,688 1,774,776 15.3%
20
831 934 1,110 1,575
1,775 2,047
2Q10 2Q11 2Q12 1H10 1H11 1H12
Shopping Center Tenant Sales (R$ million)
18.9%
15.3%

SSS and SSR
21
9.5%
11.1%
12.7% 13.0% 12.7% 12.1%13.1%
4Q10 1Q11 2Q11 3Q11 4Q11 1Q12 2Q12
Same-Store Rents Growth evolution
947.1
1,034.4
899.7
985.9
2Q11 2Q12 1H11 1H12
9.2%
9.6%
Same-Store Sales per sqm
Same-store Sales (per sqm) 2Q12 2Q11 Var. %Satellite 1,568.4 1,424.2 10.1%Anchor 861.4 796.6 8.1%Leisure 200.5 185.5 8.1%Total 1,034.4 947.1 9.2%
Same-store Rents (per sqm) 2Q12 2Q11 Var. %Satellite 109.4 97.3 12.4%Anchor 25.4 22.4 13.3%Leisure 22.6 18.2 24.6%Total 59.1 52.2 13.1%

Occupancy ratio
22
97.7% 97.5% 97.4%
98.8% 98.5%97.4%
98.0%
1Q11 2Q11 3Q11 4Q11 1Q12 2Q12 2Q12 w/o Uberlândia
Occupancy ratio (% of GLA)
Data on 06/30/12
The vacancy ratio in our shopping centers are historically low, showing the resilience of the portfolio
(%) 6/30/2012Shopping Penha 97.3%Shopping Metrópole 99.7%Tivoli Shopping 99.4%Franca Shopping 98.9%Patio Brasil 97.3%Parque D. Pedro* 97.2%Boavista Shopping 94.7%Shopping Plaza Sul 99.4%Shopping Campo Limpo 99.4%Manauara Shopping 99.1%Uberlândia Shopping 93.5%Total 97.4%
Shopping center occupancy ratio

Financial Performance
23
53.2 65.3
102.9121.9
2Q11 2Q12 1H11 1H12
Net Revenue (R$ million)
22.7%
18.4%
50.963.4
98.6119.3
2Q11 2Q12 1H11 1H12
NOI (R$ million)
24.5%
21.0%
40.7 49.878.7 91.5
76.6% 76.3% 76.4% 75.1%
30.0%35.0%40.0%45.0%50.0%55.0%60.0%65.0%70.0%75.0%80.0%
-10.0
10.0
30.0
50.0
70.0
90.0
110.0
130.0
150.0
2Q11 2Q12 1H11 1H12
EBITDA (R$ million) and Margin
22.3%
16.3%
44.4 40.878.8 75.3
83.5%
62.5%
76.6%
61.7%
0.0%10.0%20.0%30.0%40.0%50.0%60.0%70.0%80.0%90.0%
0.020.040.060.080.0
100.0120.0140.0160.0180.0
2Q11 2Q12 1H11 1H12
FFO (R$ million) and Margin
-8.2%
-4.5%

Financial Performance (51% PDP)
24
42.052.5
80.997.6
2Q11 2Q12 1H11 1H12
Net Revenue (R$ million)
25.1%
20.7%
59.2
106.4121.7 128.5
2Q11 2Q12 1H11 1H12
Net Income (R$ million)
79.9%
5.6%
30.9 39.359.4 70.7
73.7% 74.8% 73.4% 72.5%
30.0%35.0%40.0%45.0%50.0%55.0%60.0%65.0%70.0%75.0%80.0%
-10.0
10.0
30.0
50.0
70.0
90.0
110.0
130.0
2Q11 2Q12 1H11 1H12
EBITDA (R$ million) and Margin
27.1%
19.1%
34.4 30.059.1 54.0
81.9%
57.2%
73.1%
55.3%
0.0%10.0%20.0%30.0%40.0%50.0%60.0%70.0%80.0%90.0%
0.020.040.060.080.0
100.0120.0140.0160.0180.0
2Q11 2Q12 1H11 1H12
FFO (R$ million) and Margin
-12.6%-8.7%

Cash Position and Leverage
25
Fixed19%
CDI19%
TR33%
IPCA29%
Contracted Debt Financing
Committed Amount (R$
MM)
Term (years) Interest Rate
Balance as of 06/30/12
(R$ million)
Working Capital 20 5 CDI + 2.85% 15
Working Capital 27 6 CDI + 3.30% 23
Manauara Shopping 112 12 8.50% 133
Metrópole Shopping - Expansion I 53 8 TR + 10.30% 53
Uberlândia Shopping 81 15 TR + 11.30% 55
Boulevard Londrina Shopping 120 15 TR + 10.90% 78
Passeio das Águas Shopping 200 12 TR + 11.00% 55
Debentures - 1st series 95 5 CDI + 0.96% 97
Debentures - 2nd series 205 7 IPCA + 6.25% 207
Total 914 715
Weighted Average 10.2 10.78%
Considering LTM TR at 0.92% p.a., CDI at 8.35% p.a. and IPCA at 4.92% as of June 30th, 2012
Net Debt (R$ MM) Debt Amortization (R$ MM)
Debt Profile
715.4
80.1
635.4
Total Debt Cash and cash equivalents
Net Debt
19.6 44.8 49.1 50.2 93.4 88.9
369.5
2012 2013 2014 2015 2016 2017 2018 and beyond
Data on 06/30/12

Thank you!
Investor Relations Website: www.sonaesierrabrasil.com.br/ir Email: [email protected] Phone: +55 (11) 3371-4188