institutions and foreign direct investment: china versus the rest of the world
TRANSCRIPT
World Development Vol. 37, No. 4, pp. 852–865, 2009� 2008 Elsevier Ltd. All rights reserved
0305-750X/$ - see front matter
www.elsevier.com/locate/worlddevdoi:10.1016/j.worlddev.2008.07.016
Institutions and Foreign Direct Investment: China versus
the Rest of the World
JOSEPH P.H. FANChinese University of Hong Kong, Hong Kong
RANDALL MORCKUniversity of Alberta and NBER, Canada
LIXIN COLIN XUWorld Bank Group, Washington, DC, USA
and
BERNARD YEUNG *
New York University, USAPeking University, China
Summary. — Weak institutions impede foreign direction investment (FDI), yet China attracts massive FDI despite global media spot-lighting its institutional infirmities. Standard institutional quality variables poorly track rapid transformations, like China’ regime shiftfollowing Den Xiaoping’s 1993 Southern Tour. Economy track record usefully augments these variables in such cases. Cross-countryregressions controlling for institutional quality and economy track record reveal China’s FDI inflow unexceptional. Rather, China’sFDI inundation resembles analogous post-reform East Bloc events. Arguments that China’s FDI inflow is inefficiently large becauseweak institutions deter domestic investment while special initiatives attract FDI are thus either unsupported or not unique to China.� 2008 Elsevier Ltd. All rights reserved.
Key words — institution, FDI, cross-country, China
* We are grateful to Robert Cull, Philip Keefer, Yasheng Huang, Ivan Png,
the organizers of the joint China conference of the CERC of Stockholm
School of Economics and CCER of Peking University, seminar partici-
pants at the National University of Singapore, two anonymous referees,
Yao Yang, and Linda Yueh for useful comments and discussions. Finalrevision accepted: July 7, 2008.
1. INTRODUCTION
China now receives more foreign capital in the form of for-eign direct investment (FDI) than any other country, despiteongoing, and sometimes vociferous criticism of the qualityof its government in the foreign media. This is curious becauseFDI involves much irreversible fixed investment, which is sen-sitive to investors’ perceptions of public policies and propertyrights. Does the quality of China’s government explain its FDIallure, or is China’s inflow of FDI in some sense ‘‘exceptional”given the quality of its government?
This question has broad implications. The development lit-erature shows financial development, investment, and thusgrowth depending critically on the construction and mainte-nance of sound institutions—fundamental tasks of govern-ment and defining norms of ‘‘good government.” FDI canbe less affected by institutional deficiencies than domesticinvestment if foreign investors have better access to capital,or backing from their home governments in protecting theirproperty rights. In such situations, FDI can serve a criticaldevelopment role. Of course, arguments to the contrary arealso plausible, for foreign investors can confront informationasymmetries and discriminatory sentiments. Hence this paperhas multiple objectives. On a broad level, it explores the rela-tionships between various aspects of government quality andinward FDI. On a country-specific level, it explores, withinthe context of such relationships, possible differences betweenFDI inflows to China and other countries at similar levels ofdevelopment (as captured by per capita GDP).
852
We first show how FDI inflows correlate across countrieswith three key dimensions of ‘‘good government.” These are
1. The general quality of government. To measure this, weuse appraisals of official respect for private property rightsand freedom from official corruption.2. The strength of constraints on executive power. Hereagain we use appraisals, but focusing specifically on thefreedom of action the country’s institutions accord its headof government. Intuitively, constraints on executive powerprevent a country’s head of government from ruling bydecree, arbitrarily nullifying or modifying contracts orproperty rights, and capriciously altering the rules of theeconomic game in other ways. If executive actions hingeon legislatures being consulted and court rulings beingsought amid an open competition for the right to govern,a country’s future policy direction is less likely to be arbi-trary and opportunistic.3. The government’s track record. A government that hasoverseen more impressive economic growth in the past islikely to draw more FDI than other countries with similarly
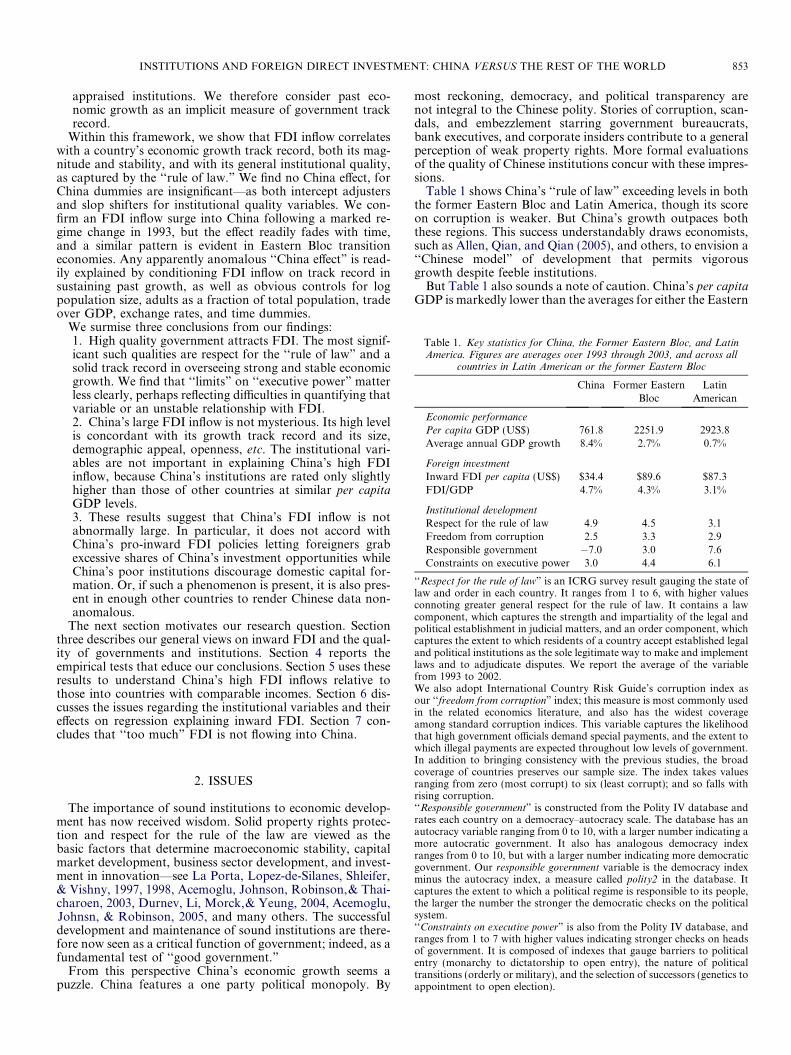
Table 1. Key statistics for China, the Former Eastern Bloc, and LatinAmerica. Figures are averages over 1993 through 2003, and across all
countries in Latin American or the former Eastern Bloc
China Former EasternBloc
LatinAmerican
Economic performance
Per capita GDP (US$) 761.8 2251.9 2923.8Average annual GDP growth 8.4% 2.7% 0.7%
Foreign investment
Inward FDI per capita (US$) $34.4 $89.6 $87.3FDI/GDP 4.7% 4.3% 3.1%
Institutional development
Respect for the rule of law 4.9 4.5 3.1Freedom from corruption 2.5 3.3 2.9Responsible government �7.0 3.0 7.6Constraints on executive power 3.0 4.4 6.1
‘‘Respect for the rule of law” is an ICRG survey result gauging the state oflaw and order in each country. It ranges from 1 to 6, with higher valuesconnoting greater general respect for the rule of law. It contains a lawcomponent, which captures the strength and impartiality of the legal andpolitical establishment in judicial matters, and an order component, whichcaptures the extent to which residents of a country accept established legaland political institutions as the sole legitimate way to make and implementlaws and to adjudicate disputes. We report the average of the variablefrom 1993 to 2002.We also adopt International Country Risk Guide’s corruption index asour ‘‘freedom from corruption” index; this measure is most commonly usedin the related economics literature, and also has the widest coverageamong standard corruption indices. This variable captures the likelihoodthat high government officials demand special payments, and the extent to
INSTITUTIONS AND FOREIGN DIRECT INVESTMENT: CHINA VERSUS THE REST OF THE WORLD 853
appraised institutions. We therefore consider past eco-nomic growth as an implicit measure of government trackrecord.
Within this framework, we show that FDI inflow correlateswith a country’s economic growth track record, both its mag-nitude and stability, and with its general institutional quality,as captured by the ‘‘rule of law.” We find no China effect, forChina dummies are insignificant—as both intercept adjustersand slop shifters for institutional quality variables. We con-firm an FDI inflow surge into China following a marked re-gime change in 1993, but the effect readily fades with time,and a similar pattern is evident in Eastern Bloc transitioneconomies. Any apparently anomalous ‘‘China effect” is read-ily explained by conditioning FDI inflow on track record insustaining past growth, as well as obvious controls for logpopulation size, adults as a fraction of total population, tradeover GDP, exchange rates, and time dummies.
We surmise three conclusions from our findings:1. High quality government attracts FDI. The most signif-icant such qualities are respect for the ‘‘rule of law” and asolid track record in overseeing strong and stable economicgrowth. We find that ‘‘limits” on ‘‘executive power” matterless clearly, perhaps reflecting difficulties in quantifying thatvariable or an unstable relationship with FDI.2. China’s large FDI inflow is not mysterious. Its high levelis concordant with its growth track record and its size,demographic appeal, openness, etc. The institutional vari-ables are not important in explaining China’s high FDIinflow, because China’s institutions are rated only slightlyhigher than those of other countries at similar per capitaGDP levels.3. These results suggest that China’s FDI inflow is notabnormally large. In particular, it does not accord withChina’s pro-inward FDI policies letting foreigners grabexcessive shares of China’s investment opportunities whileChina’s poor institutions discourage domestic capital for-mation. Or, if such a phenomenon is present, it is also pres-ent in enough other countries to render Chinese data non-anomalous.
The next section motivates our research question. Sectionthree describes our general views on inward FDI and the qual-ity of governments and institutions. Section 4 reports theempirical tests that educe our conclusions. Section 5 uses theseresults to understand China’s high FDI inflows relative tothose into countries with comparable incomes. Section 6 dis-cusses the issues regarding the institutional variables and theireffects on regression explaining inward FDI. Section 7 con-cludes that ‘‘too much” FDI is not flowing into China.
which illegal payments are expected throughout low levels of government.In addition to bringing consistency with the previous studies, the broadcoverage of countries preserves our sample size. The index takes valuesranging from zero (most corrupt) to six (least corrupt); and so falls withrising corruption.‘‘Responsible government” is constructed from the Polity IV database andrates each country on a democracy–autocracy scale. The database has anautocracy variable ranging from 0 to 10, with a larger number indicating amore autocratic government. It also has analogous democracy indexranges from 0 to 10, but with a larger number indicating more democraticgovernment. Our responsible government variable is the democracy indexminus the autocracy index, a measure called polity2 in the database. Itcaptures the extent to which a political regime is responsible to its people,the larger the number the stronger the democratic checks on the politicalsystem.‘‘Constraints on executive power” is also from the Polity IV database, andranges from 1 to 7 with higher values indicating stronger checks on headsof government. It is composed of indexes that gauge barriers to politicalentry (monarchy to dictatorship to open entry), the nature of politicaltransitions (orderly or military), and the selection of successors (genetics toappointment to open election).
2. ISSUES
The importance of sound institutions to economic develop-ment has now received wisdom. Solid property rights protec-tion and respect for the rule of the law are viewed as thebasic factors that determine macroeconomic stability, capitalmarket development, business sector development, and invest-ment in innovation—see La Porta, Lopez-de-Silanes, Shleifer,& Vishny, 1997, 1998, Acemoglu, Johnson, Robinson,& Thai-charoen, 2003, Durnev, Li, Morck,& Yeung, 2004, Acemoglu,Johnsn, & Robinson, 2005, and many others. The successfuldevelopment and maintenance of sound institutions are there-fore now seen as a critical function of government; indeed, as afundamental test of ‘‘good government.”
From this perspective China’s economic growth seems apuzzle. China features a one party political monopoly. By
most reckoning, democracy, and political transparency arenot integral to the Chinese polity. Stories of corruption, scan-dals, and embezzlement starring government bureaucrats,bank executives, and corporate insiders contribute to a generalperception of weak property rights. More formal evaluationsof the quality of Chinese institutions concur with these impres-sions.
Table 1 shows China’s ‘‘rule of law” exceeding levels in boththe former Eastern Bloc and Latin America, though its scoreon corruption is weaker. But China’s growth outpaces boththese regions. This success understandably draws economists,such as Allen, Qian, and Qian (2005), and others, to envision a‘‘Chinese model” of development that permits vigorousgrowth despite feeble institutions.
But Table 1 also sounds a note of caution. China’s per capitaGDP is markedly lower than the averages for either the Eastern
854 WORLD DEVELOPMENT
Bloc or Latin America. This low starting point gives Chinamore room than most countries to grow simply by catchingup. Even though many equally poor countries do not manageto grow rapidly, a low starting point makes China’s rapid percapita GDP growth rate less impressive: any capital allocatedto any entrepreneur may well generate quick economic growth.
A full analysis of the importance of political economy toeconomic development is clearly beyond the scope of thisstudy. We focus on only one factor in the economic develop-ment—FDI inflow—and thus investigate only one small partof a greater picture. We adopt this focus because investmentis a key determinant of growth. Foreigners’ capital is morefootloose than domestic capital, and is thus more sensitiveto outside opportunities. Foreign investment ought thereforeto be more sensitive to institutional deficiencies.
If foreign capital flowing into China is unaffected by theinstitutional factors that determine the allocation of foreigncapital elsewhere, there may well be a distinct ‘‘Chinese mod-el.” One plausible possibility is that foreign investors are unde-terred by China’s inadequate institutions because the Chinesegovernment favors them (Huang, 2003). Another is that for-eign investors are overenthusiastic about China’s potential.But if the same determinants affect FDI allocation in Chinaas elsewhere, Chinese exceptionalism is rendered dubious. Ofcourse, its domestic savings might still be allocated uniquely;but even if this were so, our study narrows the scope for anypossible Chinese singularity.
China surpassed the United States as the world’s largestFDI recipient in 2001. But China is a very large country—eco-nomically and geographically as well as in terms of popula-tion. Comparisons across countries must be scaled bycountry size. Table 1 shows China’s inward FDI as a fractionof GDP is larger than in either Latin America or the formerEastern Bloc, but smaller if measured per capita. This makes
010
2030
40FD
I per
cap
ita
1990 1995 2000 2005
YearChina
5010
015
020
025
030
0FD
I per
cap
ita
1990 1995Ye
World Average
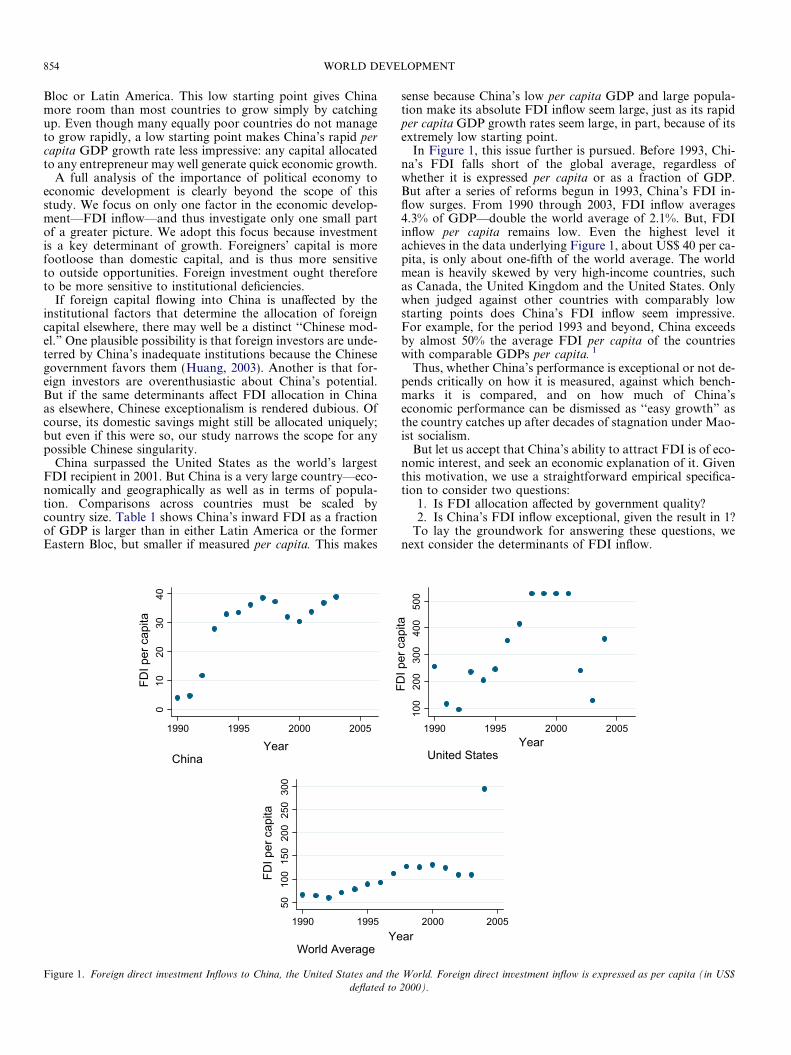
Figure 1. Foreign direct investment Inflows to China, the United States and the
deflated to
sense because China’s low per capita GDP and large popula-tion make its absolute FDI inflow seem large, just as its rapidper capita GDP growth rates seem large, in part, because of itsextremely low starting point.
In Figure 1, this issue further is pursued. Before 1993, Chi-na’s FDI falls short of the global average, regardless ofwhether it is expressed per capita or as a fraction of GDP.But after a series of reforms begun in 1993, China’s FDI in-flow surges. From 1990 through 2003, FDI inflow averages4.3% of GDP—double the world average of 2.1%. But, FDIinflow per capita remains low. Even the highest level itachieves in the data underlying Figure 1, about US$ 40 per ca-pita, is only about one-fifth of the world average. The worldmean is heavily skewed by very high-income countries, suchas Canada, the United Kingdom and the United States. Onlywhen judged against other countries with comparably lowstarting points does China’s FDI inflow seem impressive.For example, for the period 1993 and beyond, China exceedsby almost 50% the average FDI per capita of the countrieswith comparable GDPs per capita. 1
Thus, whether China’s performance is exceptional or not de-pends critically on how it is measured, against which bench-marks it is compared, and on how much of China’seconomic performance can be dismissed as ‘‘easy growth” asthe country catches up after decades of stagnation under Mao-ist socialism.
But let us accept that China’s ability to attract FDI is of eco-nomic interest, and seek an economic explanation of it. Giventhis motivation, we use a straightforward empirical specifica-tion to consider two questions:
1. Is FDI allocation affected by government quality?2. Is China’s FDI inflow exceptional, given the result in 1?
To lay the groundwork for answering these questions, wenext consider the determinants of FDI inflow.
100
200
300
400
500
FDI p
er c
apita
1990 1995 2000 2005Year
United States
2000 2005ar
World. Foreign direct investment inflow is expressed as per capita (in US$
2000).

INSTITUTIONS AND FOREIGN DIRECT INVESTMENT: CHINA VERSUS THE REST OF THE WORLD 855
3. THE ROLE OF ‘‘GOOD GOVERNMENT’’ INATTRACTING FDI
The literature on FDI, though voluminous, points toward arelatively simple generic empirical specification.
The starting point of the modern FDI literature is the Coas-ean Theory of the Firm (Buckley & Casson, 1976; Coase, 1937;Caves, 1971, 1995, and others). In essence, prospective multi-national firms are envisioned as possessing information-basedfirm-specific capabilities that they could profitably apply inforeign countries. Indeed, these capabilities compensate for lo-cal firms’ ‘‘home court advantage” to let multinationals earnreturns high enough to justify their investments abroad (Mor-ck & Yeung, 1991, 1992). Agency problems, informationasymmetries, and property rights protection problems renderinformation-based assets inalienable, and so prevent thesefirms from selling or leasing their capabilities to foreign firms.To apply their unique capabilities abroad profitably, multina-tionals must thus establish controlled foreignoperations—thatis, engage in FDI. The fundamental principle, however, is thatFDI is an investment like any other—aiming to capture quasi-rents to realize a positive net present value (NPV).
The NPV of a corporate investment project of this sort de-pends on a multitude of factors. Caves (1995) draws attentionto economy size in this context: a larger economy gives aninvestment project with higher fixed costs a higher NPV; soFDI inflow, all else equal, should be larger into larger econo-mies. The NPV a firm foresees also depends positively on localproduct and factor market development, growth potential,and the availability of financing; and negatively on marketrisks and costs of doing business. The last is especially empha-sized, and linked to high taxes, high wages relative to produc-tivity, and generally poor infrastructure. 2
All these factors, including the development of the financialsystem, depend on an economy’s institutional environment—its rules, regulations, and informal codes of behavior. As de-scribed above, the commercial success of FDI hinges on howwell a firm protects its property rights and overcomes a rangeof agency and information asymmetry problem; and foreignfirms are particularly handicapped in achieving these goals,giving local firms their above-mentioned home court advan-tage (Zaheer & Mosakowski, 1997). But if locals make trans-parent and predictable use of practicable norms, legal systems,and political institutions to adjudicate disputes, this homecourt advantage diminishes and FDI flows in more abun-dantly. This consideration echoes the more general financeand growth literature, which emphasizes how sound andwell-enforced rules and regulations, like property rights pro-tection and information disclosure, encourage economic devel-opment in general and capital market development inparticular (King & Levine, 1993; La Porta, Lopez-de-Silanes,Shleifer, & Vishny, 1997, 1998). This is because such rulesand regulations constrain opportunistic behavior and buildtransactional trust between contracting parties (North, 1990).
Establishing and administering sound rules and regulationsrequire ‘‘good government.” Governments that are less cor-rupt have more efficient bureaucracies, and that impose lessburdensome regulations foster economic development. Alfaro,Kalemli-Ozcan, and Volosovych (2005) show that weak insti-tutions explain why very little capital flows from rich to poorcountries. Globerman and Shapiro (2002) find preliminary evi-dence that FDI flows toward locations with sounder gover-nance infrastructure, which includes how well the legalsystem enforces contracts and protects property rights, howfree the government is from corruption, and how efficientthe government is; that is, how well regulators and other
bureaucrats avoid imposing unnecessarily burdensome regula-tions. 3 Their result could reflect countries with better institu-tions having stronger growth opportunities, which attractmore FDI.
Governments are, of course, staffed by people. Sound insti-tutions require high quality government, and this requireswell-qualified politicians and civil servants. Just as good cor-porate executives are products of good internal corporate gov-ernance, high quality politicians, and civil servants arise fromsound public institutions. This circularity can lock in eithergood or bad government.
The sort of circle into which a country fits determines criti-cally its appeal as an FDI destination. Transparent and or-derly political competition, along with constraints onexecutive power, seems paramount. Acemoglu and Johnson(2005) find stronger constraints on government associatedwith less corruption and more predictable policies and regula-tions. They unbundle institutions into those protecting con-tracts and those protecting property. The former facilitatecontractual arrangements between transacting parties; the lat-ter constrain public officials from acting arbitrarily for per-sonal gains. Investment and growth appear better explainedby property rights protection, while the former influencemainly the form of contracting that occurs.
Constraints on executive power may be particularly worthyof attention when we examine countries that feature recentphenomenal growth. These countries, of which China is one,need external capital to capture their growth opportunities.To attract foreign capital, their governments should be partic-ularly enthusiastic about implementing and enforcing propertyrights, honoring policy commitments, and avoiding burden-some regulations. But foreign investors’ concern is often notabout such governments’ current stances, but about how theymight act once the investments are in place—especially ifgrowth and investment opportunities become less profuse.Constraints on executive power prevent heads of governmentfrom abruptly altering property rights, revising policies, reneg-ing on commitments, and capriciously imposing new regula-tions. In short, they prevent short-term actions, likeprecipitous expropriations, in the event of negative shocks.Executive constraints, especially if safeguarded by politicalcompetition, should reinforce the attractiveness of currentsound policies to FDI by credibly assuring the permanenceof those policies.
In summary, basic economic and institutional factors attractFDI inflow. The economic factors include the size of the mar-ket, the current level of development, and factors like educa-tion and infrastructure development that affect productivityand future development potential. Obviously, other economicfactors, notably trade openness and the host country’s cur-rency (see, e.g., Froot & Stein, 1991), affect the FDI flowstoo. The institutional factors include general measures of‘‘good government” such as the instillation of law and orderin the public, high quality public officials, and the strengthof constraints on executive power.
4. EMPIRICAL FINDINGS
This section examines the international allocation of inwardFDI, as tabulated in the World Bank WDI database. Ourdependent variable is per capita FDI in constant 2000 US$,winsorized at 5%. 4 We add a constant to this quantity becausesome countries have negative FDI inflows (negative FDI in-flow represents repatriation of previous investment). 5 Drop-ping the negative FDI inflow observations leads to
856 WORLD DEVELOPMENT
qualitative similar results. However, we are not aware of per-suasive economic reasons to exclude these observations.
We reiterate here our twofold intentions. First, we wish toinvestigate empirically our thesis that ‘‘good government” at-tracts FDI. Second, we wish to see if the FDI flowing into Chi-na behaves similarly to that flowing into other countries. Tothese ends, following the discussion above, we regress eachcountry’s FDI inflow on a set of country characteristics asso-ciated with the quality of government, along with some basicmeasures of the level of development and other country char-acteristics such as the population size, demographic character-istics, and trade policies. We include China in these regressionsand then ask whether China-specific dummies are significant.
(a) Focal-independent variables
Our focal independent variables are ‘‘quality of govern-ment” measures. Following the discussion above, we includethree sets of these.
(i) Constraints on executive powerWe use two variables to capture the strength of constraints
on executive power.Executive constraints, from the Polity IV database, ranges
from 1 to 7. It is composed of indexes that gauge barriers topolitical entry (monarchy through dictatorship to open entry),the nature of political transitions (orderly or military), and theselection of successors (genetics through appointment to openelection). This variable therefore captures the strength of insti-tutionalized constraints on the decision making power of acountry’s chief executives. The larger the number is, the stron-ger the constraints.
Responsible government is constructed from the Polity IVdatabase and rates each country on a democracy–autocracyscale. First, in the database an autocracy variable is available,ranging from 0 to 10, with a larger number indicating a moreautocratic government. Also available is an analogous democ-racy index that ranges from 0 to 10, but with a larger numberindicating a more democratic government. Our responsiblegovernment variable is the democracy index minus the autoc-racy index, a measure called polity2 in the database. It cap-tures the extent to which a political regime is responsible toits people, the larger the number the stronger the democraticchecks on the political system.
(ii) General institutional qualityIn addition to our executive power limitation variables, we
consider a commonly used measure of the general quality ofgovernment: the rule of law index from ICRG. This is a surveyresult gauging the state of law and order in each country. Itranges from 1 to 6, with higher values connoting greater gen-eral respect for the rule of law. 6 It contains a law component,which captures the strength and impartiality of the legal andpolitical establishment in judicial matters, and an order com-ponent, which captures the extent to which residents of acountry accept established legal and political institutions asthe solely legitimate way to make and implement laws andto adjudicate disputes.
We also adopt International Country Risk Guide’s corrup-tion index as our freedom from corruption index; this measureis most commonly used in the related economics literature,and also has the widest coverage of the standard corruptionindices. This variable gauges corruption as the incidence ofthe high government officials demanding special payments,and of illegal payments being expected throughout the low lev-els of government. In addition to being consistent with the pre-
vious studies, the variable has the advantage of having thebroadest coverage of countries, which maximizes our samplesize. The index itself takes on values ranging from zero (mostcorrupt) to six (least corrupt), and hence falls with rising cor-ruption.
(iii) Government track recordA government’s track record plays an interesting role. As ex-
plained in the previous section, FDI is large where foreign cor-porate investors regard investment opportunities highly.Obviously, investment opportunities are more abundant whereinstitutions are better, where government officials are less cor-rupt, bureaucracies are more efficient, and the rule of law ismore generally upheld. Yet positive shocks to investmentopportunities can also entice governments seeking to attractforeign capital to provide such institutions. Hence, a simplerelationship between measures of government quality andFDI could be misleading. At the very least, to sort this out,our empirical investigation should incorporate a proxy forthe presence of profitable investment opportunities. This isthe track record of the government, which we measure intwo ways.
Growth trend is a country’s per capita GDP growth rate,averaged over the prior five years. We interpret rapid pastgrowth as indicative of both profitable investment opportuni-ties and a government able to foster, or at least not impede,their exploitation.
Macro volatility is the standard deviation of per capita GDPgrowth over the prior five years. Less stable growth, all elseequal, is less conducive to FDI, and is less indicative of soundand predictable government policies.
(b) Control variables
Alongside our focal-independent ‘‘quality of government”measures, we also include set of variables capturing othereconomy characteristics that are likely to be associated witha higher FDI inflow. These are:
(i) General economy developmentWe gauge general development using the following vari-
ables: log of per capita GDP in 2000 constant US$; educationmeasured by the log of years of schooling, averaged acrossall the country’s residents; infrastructure quality, representedby telephones per thousand residents; and level of urbaniza-tion, 7 urban population as a fraction of total population. Thisset of variables is commonly used elsewhere in the literature(see e.g., Coughlin et al., 1991).
(ii) Other economy characteristicsBased on the discussion in the previous section, we include
set of country characteristics. We include country size, mea-sured as the log of total population, to control for scale econ-omies attainable in each country. Because a country’sproductivity and growth are positively associated with the pro-portion of its population who are working age adults (Mason,2007), we also include adults as a fraction of the population. 8
China is currently enjoying a demographic growth dividend;the decline in its birth rate since 1949, and particularly so since1959, is now swelling its working age adult population.
We further include a measure of openness, import plus ex-port as a fraction of GDP, for two reasons. 9 Openness reducesthe utility of FDI for jumping trade barriers. But more opencountries are also more attractive places to site, for example,vertically related FDI. Openness might also reduce informa-tion asymmetry for potential foreign investors, and might
INSTITUTIONS AND FOREIGN DIRECT INVESTMENT: CHINA VERSUS THE REST OF THE WORLD 857
correlate with a variety of positive economy features. The var-iable is lagged one period to mitigate endogeneity issues.
We also include the exchange rate of each country’s currencyrelative to the US$, normalized by the 2000 rate. This means ahigher value of exchange rate implies a more depreciated localcurrency. Countries with undervalued currencies, all elseequal, attract more FDI (see e.g., Froot & Stein, 1991).
While we introduce these variables as controls, they are also,in part at least, reflections on the quality of each country’sgovernment and institutions. Better governed countries typi-cally have more telephones per capita, more educated people,more trade openness, and currencies that better hold their val-ues. This may even apply to population, for emigration is acommon response to misrule. Including these controls thusbiases our analysis against finding significant results for ourfocal ‘‘quality of government” variables.
(c) China dummies
Because our objective is to see if China’s FDI inflow is‘‘exceptional,” we include a China dummy, dChina, in the regres-sions. If this variable is significant, China differs on averagefrom other countries after conditioning on the variables men-tioned above.
We further employ a regime shift dummy. Observers of Chi-nese economy know that 1993 marks a turning point—DengXiaoping’s Southern Tour—which sent a strong signal to theworld of China’s commitment to economic liberalization.Such a regime shift can cause a surge of investment (Henry,2000) that subsequently abates over time. We therefore createa post 1993 dummy, dt> 1993, and include in the regression twoadditional variables: China post 1993 � dChina � dt> 1993, andChina post 1993 trend � dChina � dt> 1993 � (t � 1993), wheret measures time; the former captures the response of FDI to asignificant regime shift, and latter detects the extent to whichthe effect fades with time.
(d) Regression specification and sample
Our regression specification is thus
lnðFDI PCitÞ ¼ a0 þ a1dchina it þ X0itbþ Z0itc
þ d0China post 1993it
þ d1China post 1993 trendit þ et þ eit ð1Þwhere Xit is a vector of variables related to general develop-ment and economy characteristics—including log GDP per ca-pita, log (mean years of schooling), telephone density, urbanshare of population, adult share of population, log popula-tion, exchange rate, and openness—and Zit is a vector of insti-tutional quality measures. We divide these into two parts: inst,containing responsible government, executive constraint, ruleof law, and control of corruption, and track, containing mea-sures of the government’s track record—the growth trend of acountry and the volatility of growth rate in the prior 5 years.Since our institutional variables exhibit little variation overtime, and fixed effects would exacerbate measurement problem(Griliches & Hausman, 1986), we rely on ordinary least squareto estimate our regressions, but cluster by country when esti-mating standard errors (Moulton, 1986). Using random-effectsestimation generates qualitatively similar results.
Data from 1961 to 2003 for the following 61 countries areincluded in specifications using the institutional variables exec-utive constraints or responsible government (both from thePolityIV database): Albania, Argentina, Armenia, Australia,Azerbaijan, Belarus, Belgium, Benin, Bolivia, Brazil, Canada,
Chile, China, Colombia, Dominican Republic, Ecuador,Egypt, El Salvador, Eritrea, Estonia, Ethiopia, Finland,Gabon, Ghana, Greece, Guinea-Bissau, Hungary, India, Iran,Israel, Italy, Jamaica, Japan, Jordan, Kenya, Lao PDR,Liberia, Mali, Mexico, Nicaragua, Norway, Pakistan,Panama, Papua New Guinea, Peru, Poland, Russian Federa-tion, Rwanda, Saudi Arabia, Senegal, Swaziland, Syrian,Tunisia, Turkey, Turkmenistan, Uganda, Ukraine, UnitedStates, Uzbekistan, Venezuela, and Yemen. In specificationsfor which the institutional variable is the rule of law (fromICRG), we can use data for 120 countries from 1982 to 2001for the ICRG-based regressions. 10 Our sample is thus con-strained by the differing coverage of the two datasets. Obser-vations with the missing data for any variables are dropped.Rule of law is missing less frequently than executive constraintor responsible government, but is available over a shorter pa-nel—1982 through 2001. Restricting all our regressions to thisshorter period generates qualitatively identical results.
(e) Summary statistics
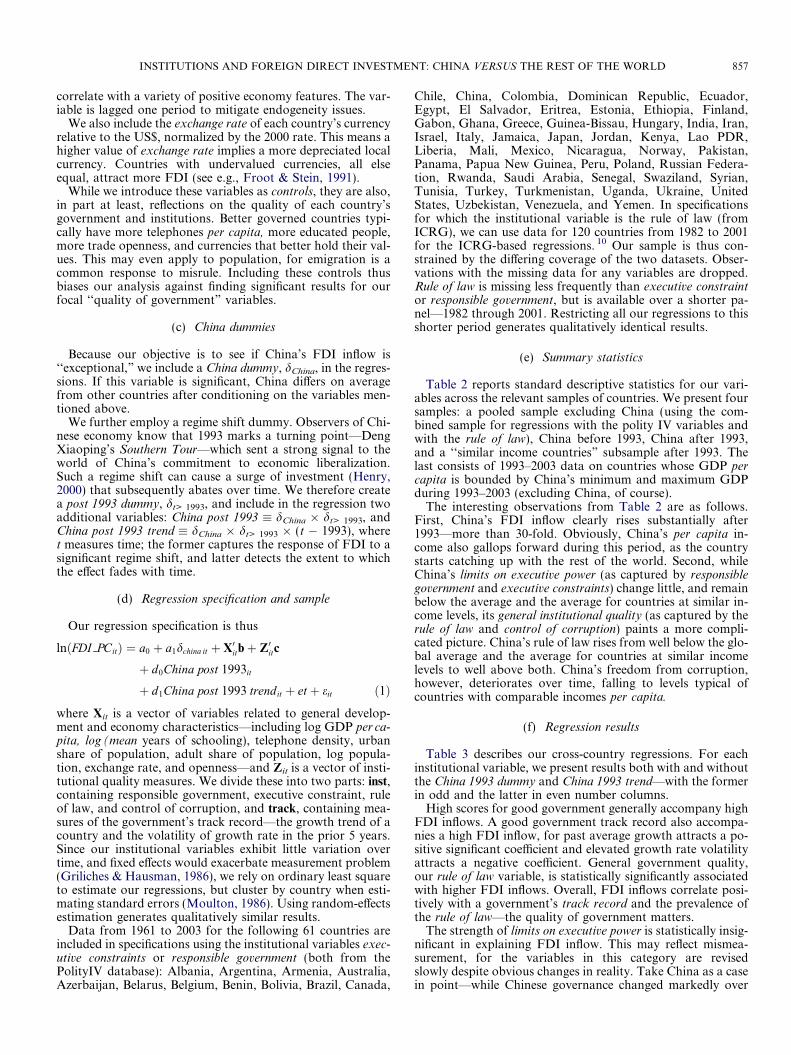
Table 2 reports standard descriptive statistics for our vari-ables across the relevant samples of countries. We present foursamples: a pooled sample excluding China (using the com-bined sample for regressions with the polity IV variables andwith the rule of law), China before 1993, China after 1993,and a ‘‘similar income countries” subsample after 1993. Thelast consists of 1993–2003 data on countries whose GDP percapita is bounded by China’s minimum and maximum GDPduring 1993–2003 (excluding China, of course).
The interesting observations from Table 2 are as follows.First, China’s FDI inflow clearly rises substantially after1993—more than 30-fold. Obviously, China’s per capita in-come also gallops forward during this period, as the countrystarts catching up with the rest of the world. Second, whileChina’s limits on executive power (as captured by responsiblegovernment and executive constraints) change little, and remainbelow the average and the average for countries at similar in-come levels, its general institutional quality (as captured by therule of law and control of corruption) paints a more compli-cated picture. China’s rule of law rises from well below the glo-bal average and the average for countries at similar incomelevels to well above both. China’s freedom from corruption,however, deteriorates over time, falling to levels typical ofcountries with comparable incomes per capita.
(f) Regression results
Table 3 describes our cross-country regressions. For eachinstitutional variable, we present results both with and withoutthe China 1993 dummy and China 1993 trend—with the formerin odd and the latter in even number columns.
High scores for good government generally accompany highFDI inflows. A good government track record also accompa-nies a high FDI inflow, for past average growth attracts a po-sitive significant coefficient and elevated growth rate volatilityattracts a negative coefficient. General government quality,our rule of law variable, is statistically significantly associatedwith higher FDI inflows. Overall, FDI inflows correlate posi-tively with a government’s track record and the prevalence ofthe rule of law—the quality of government matters.
The strength of limits on executive power is statistically insig-nificant in explaining FDI inflow. This may reflect mismea-surement, for the variables in this category are revisedslowly despite obvious changes in reality. Take China as a casein point—while Chinese governance changed markedly over
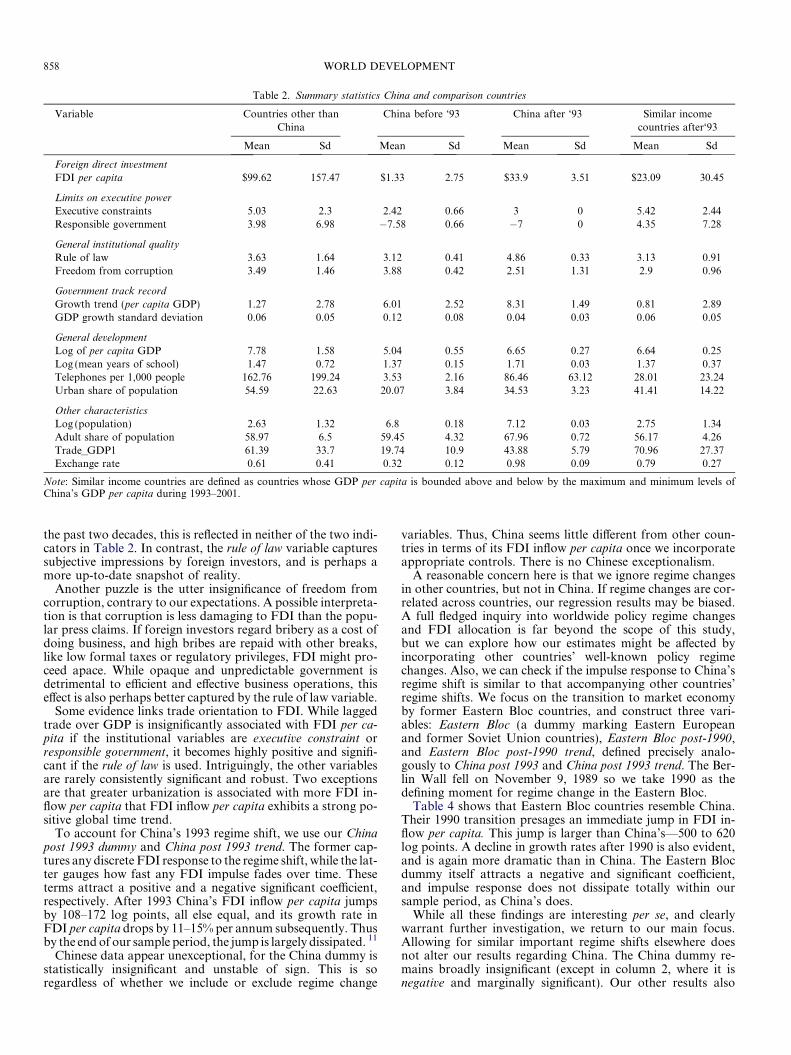
Table 2. Summary statistics China and comparison countries
Variable Countries other thanChina
China before ‘93 China after ‘93 Similar incomecountries after‘93
Mean Sd Mean Sd Mean Sd Mean Sd
Foreign direct investment
FDI per capita $99.62 157.47 $1.33 2.75 $33.9 3.51 $23.09 30.45
Limits on executive power
Executive constraints 5.03 2.3 2.42 0.66 3 0 5.42 2.44Responsible government 3.98 6.98 �7.58 0.66 �7 0 4.35 7.28
General institutional quality
Rule of law 3.63 1.64 3.12 0.41 4.86 0.33 3.13 0.91Freedom from corruption 3.49 1.46 3.88 0.42 2.51 1.31 2.9 0.96
Government track record
Growth trend (per capita GDP) 1.27 2.78 6.01 2.52 8.31 1.49 0.81 2.89GDP growth standard deviation 0.06 0.05 0.12 0.08 0.04 0.03 0.06 0.05
General development
Log of per capita GDP 7.78 1.58 5.04 0.55 6.65 0.27 6.64 0.25Log (mean years of school) 1.47 0.72 1.37 0.15 1.71 0.03 1.37 0.37Telephones per 1,000 people 162.76 199.24 3.53 2.16 86.46 63.12 28.01 23.24Urban share of population 54.59 22.63 20.07 3.84 34.53 3.23 41.41 14.22
Other characteristics
Log (population) 2.63 1.32 6.8 0.18 7.12 0.03 2.75 1.34Adult share of population 58.97 6.5 59.45 4.32 67.96 0.72 56.17 4.26Trade_GDP1 61.39 33.7 19.74 10.9 43.88 5.79 70.96 27.37Exchange rate 0.61 0.41 0.32 0.12 0.98 0.09 0.79 0.27
Note: Similar income countries are defined as countries whose GDP per capita is bounded above and below by the maximum and minimum levels ofChina’s GDP per capita during 1993–2001.
858 WORLD DEVELOPMENT
the past two decades, this is reflected in neither of the two indi-cators in Table 2. In contrast, the rule of law variable capturessubjective impressions by foreign investors, and is perhaps amore up-to-date snapshot of reality.
Another puzzle is the utter insignificance of freedom fromcorruption, contrary to our expectations. A possible interpreta-tion is that corruption is less damaging to FDI than the popu-lar press claims. If foreign investors regard bribery as a cost ofdoing business, and high bribes are repaid with other breaks,like low formal taxes or regulatory privileges, FDI might pro-ceed apace. While opaque and unpredictable government isdetrimental to efficient and effective business operations, thiseffect is also perhaps better captured by the rule of law variable.
Some evidence links trade orientation to FDI. While laggedtrade over GDP is insignificantly associated with FDI per ca-pita if the institutional variables are executive constraint orresponsible government, it becomes highly positive and signifi-cant if the rule of law is used. Intriguingly, the other variablesare rarely consistently significant and robust. Two exceptionsare that greater urbanization is associated with more FDI in-flow per capita that FDI inflow per capita exhibits a strong po-sitive global time trend.
To account for China’s 1993 regime shift, we use our Chinapost 1993 dummy and China post 1993 trend. The former cap-tures any discrete FDI response to the regime shift, while the lat-ter gauges how fast any FDI impulse fades over time. Theseterms attract a positive and a negative significant coefficient,respectively. After 1993 China’s FDI inflow per capita jumpsby 108–172 log points, all else equal, and its growth rate inFDI per capita drops by 11–15% per annum subsequently. Thusby the end of our sample period, the jump is largely dissipated. 11
Chinese data appear unexceptional, for the China dummy isstatistically insignificant and unstable of sign. This is soregardless of whether we include or exclude regime change
variables. Thus, China seems little different from other coun-tries in terms of its FDI inflow per capita once we incorporateappropriate controls. There is no Chinese exceptionalism.
A reasonable concern here is that we ignore regime changesin other countries, but not in China. If regime changes are cor-related across countries, our regression results may be biased.A full fledged inquiry into worldwide policy regime changesand FDI allocation is far beyond the scope of this study,but we can explore how our estimates might be affected byincorporating other countries’ well-known policy regimechanges. Also, we can check if the impulse response to China’sregime shift is similar to that accompanying other countries’regime shifts. We focus on the transition to market economyby former Eastern Bloc countries, and construct three vari-ables: Eastern Bloc (a dummy marking Eastern Europeanand former Soviet Union countries), Eastern Bloc post-1990,and Eastern Bloc post-1990 trend, defined precisely analo-gously to China post 1993 and China post 1993 trend. The Ber-lin Wall fell on November 9, 1989 so we take 1990 as thedefining moment for regime change in the Eastern Bloc.
Table 4 shows that Eastern Bloc countries resemble China.Their 1990 transition presages an immediate jump in FDI in-flow per capita. This jump is larger than China’s—500 to 620log points. A decline in growth rates after 1990 is also evident,and is again more dramatic than in China. The Eastern Blocdummy itself attracts a negative and significant coefficient,and impulse response does not dissipate totally within oursample period, as China’s does.
While all these findings are interesting per se, and clearlywarrant further investigation, we return to our main focus.Allowing for similar important regime shifts elsewhere doesnot alter our results regarding China. The China dummy re-mains broadly insignificant (except in column 2, where it isnegative and marginally significant). Our other results also
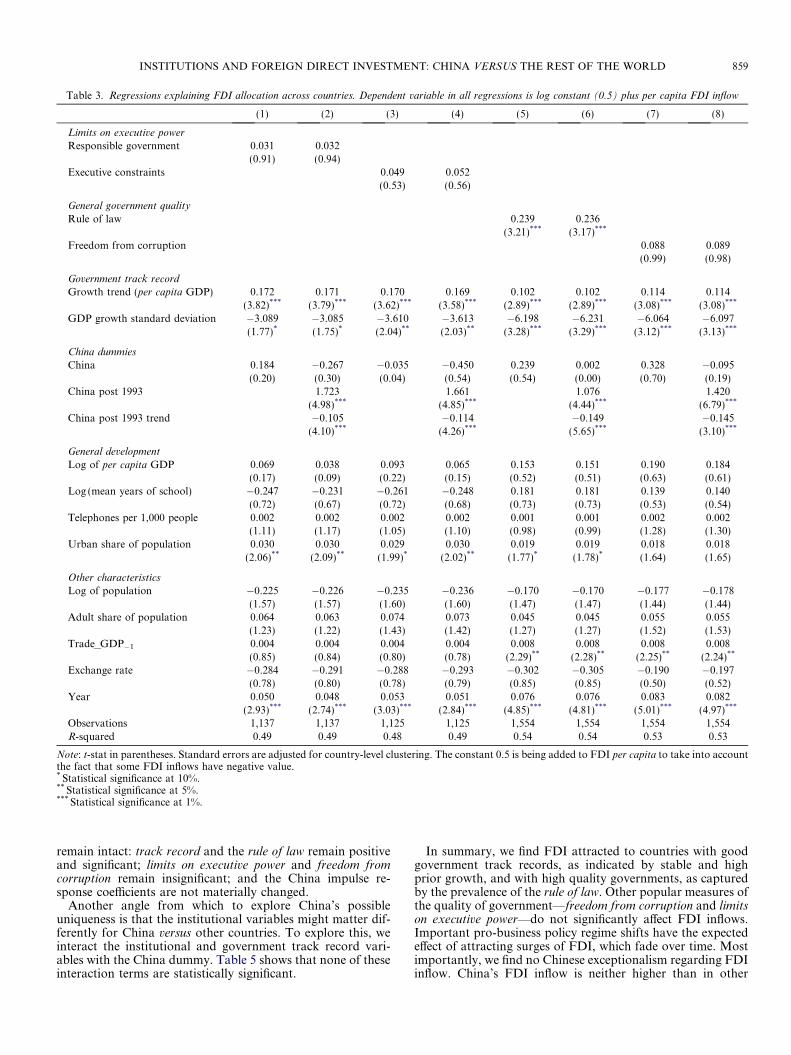
Table 3. Regressions explaining FDI allocation across countries. Dependent variable in all regressions is log constant (0.5) plus per capita FDI inflow
(1) (2) (3) (4) (5) (6) (7) (8)
Limits on executive power
Responsible government 0.031 0.032(0.91) (0.94)
Executive constraints 0.049 0.052(0.53) (0.56)
General government quality
Rule of law 0.239 0.236(3.21)*** (3.17)***
Freedom from corruption 0.088 0.089(0.99) (0.98)
Government track record
Growth trend (per capita GDP) 0.172 0.171 0.170 0.169 0.102 0.102 0.114 0.114(3.82)*** (3.79)*** (3.62)*** (3.58)*** (2.89)*** (2.89)*** (3.08)*** (3.08)***
GDP growth standard deviation �3.089 �3.085 �3.610 �3.613 �6.198 �6.231 �6.064 �6.097(1.77)* (1.75)* (2.04)** (2.03)** (3.28)*** (3.29)*** (3.12)*** (3.13)***
China dummies
China 0.184 �0.267 �0.035 �0.450 0.239 0.002 0.328 �0.095(0.20) (0.30) (0.04) (0.54) (0.54) (0.00) (0.70) (0.19)
China post 1993 1.723 1.661 1.076 1.420(4.98)*** (4.85)*** (4.44)*** (6.79)***
China post 1993 trend �0.105 �0.114 �0.149 �0.145(4.10)*** (4.26)*** (5.65)*** (3.10)***
General development
Log of per capita GDP 0.069 0.038 0.093 0.065 0.153 0.151 0.190 0.184(0.17) (0.09) (0.22) (0.15) (0.52) (0.51) (0.63) (0.61)
Log (mean years of school) �0.247 �0.231 �0.261 �0.248 0.181 0.181 0.139 0.140(0.72) (0.67) (0.72) (0.68) (0.73) (0.73) (0.53) (0.54)
Telephones per 1,000 people 0.002 0.002 0.002 0.002 0.001 0.001 0.002 0.002(1.11) (1.17) (1.05) (1.10) (0.98) (0.99) (1.28) (1.30)
Urban share of population 0.030 0.030 0.029 0.030 0.019 0.019 0.018 0.018(2.06)** (2.09)** (1.99)* (2.02)** (1.77)* (1.78)* (1.64) (1.65)
Other characteristics
Log of population �0.225 �0.226 �0.235 �0.236 �0.170 �0.170 �0.177 �0.178(1.57) (1.57) (1.60) (1.60) (1.47) (1.47) (1.44) (1.44)
Adult share of population 0.064 0.063 0.074 0.073 0.045 0.045 0.055 0.055(1.23) (1.22) (1.43) (1.42) (1.27) (1.27) (1.52) (1.53)
Trade_GDP�1 0.004 0.004 0.004 0.004 0.008 0.008 0.008 0.008(0.85) (0.84) (0.80) (0.78) (2.29)** (2.28)** (2.25)** (2.24)**
Exchange rate �0.284 �0.291 �0.288 �0.293 �0.302 �0.305 �0.190 �0.197(0.78) (0.80) (0.78) (0.79) (0.85) (0.85) (0.50) (0.52)
Year 0.050 0.048 0.053 0.051 0.076 0.076 0.083 0.082(2.93)*** (2.74)*** (3.03)*** (2.84)*** (4.85)*** (4.81)*** (5.01)*** (4.97)***
Observations 1,137 1,137 1,125 1,125 1,554 1,554 1,554 1,554R-squared 0.49 0.49 0.48 0.49 0.54 0.54 0.53 0.53
Note: t-stat in parentheses. Standard errors are adjusted for country-level clustering. The constant 0.5 is being added to FDI per capita to take into accountthe fact that some FDI inflows have negative value.* Statistical significance at 10%.** Statistical significance at 5%.*** Statistical significance at 1%.
INSTITUTIONS AND FOREIGN DIRECT INVESTMENT: CHINA VERSUS THE REST OF THE WORLD 859
remain intact: track record and the rule of law remain positiveand significant; limits on executive power and freedom fromcorruption remain insignificant; and the China impulse re-sponse coefficients are not materially changed.
Another angle from which to explore China’s possibleuniqueness is that the institutional variables might matter dif-ferently for China versus other countries. To explore this, weinteract the institutional and government track record vari-ables with the China dummy. Table 5 shows that none of theseinteraction terms are statistically significant.
In summary, we find FDI attracted to countries with goodgovernment track records, as indicated by stable and highprior growth, and with high quality governments, as capturedby the prevalence of the rule of law. Other popular measures ofthe quality of government—freedom from corruption and limitson executive power—do not significantly affect FDI inflows.Important pro-business policy regime shifts have the expectedeffect of attracting surges of FDI, which fade over time. Mostimportantly, we find no Chinese exceptionalism regarding FDIinflow. China’s FDI inflow is neither higher than in other

Table 4. Regressions explaining FDI allocation across countries. Dependent variable in all regressions is log constant (0.5) plus per capita FDI inflow
(1) (2) (3) (4)
Limits on Executive Power
Responsible government 0.002(0.08)
Executive constraints �0.021(0.30)
General government quality
Rule of law 0.250(3.34)***
Freedom from corruption 0.083(0.90)
Government track record
Growth trend (per capita GDP) 0.178 0.181 0.103 0.116(4.11)*** (4.07)*** (2.89)*** (3.13)***
GDP per capita growth standard deviation �3.991 �4.335 �6.537 �6.390(2.58)** (2.69)** (3.50)*** (3.32)***
China effects
China �1.081 �1.188 �0.050 �0.120(1.52) (1.75)* (0.11) (0.23)
China post 1993 1.554 1.516 1.077 1.443(4.95)*** (4.85)*** (4.43)*** (6.95)***
China post 1993 trend �0.094 �0.097 �0.146 �0.147(3.82)*** (4.01)*** (5.39)*** (3.05)***
Eastern Bloc dummies
Eastern Bloc �4.199 �4.564 �3.512 �3.110(11.71)*** (12.87)*** (10.83)*** (8.72)***
Eastern Bloc post-1990 5.859 6.226 5.073 5.115(14.78)*** (18.40)*** (27.42)*** (22.93)***
Eastern Bloc post-1990 trend �0.169 �0.174 �0.144 �0.192(4.34)*** (4.40)*** (3.84)*** (4.22)***
General development
Log of per capita GDP 0.051 0.053 0.153 0.191(0.12) (0.12) (0.51) (0.63)
Log (mean years of schooling) �0.031 �0.004 0.191 0.142(0.11) (0.01) (0.77) (0.54)
Telephones per 1,000 people 0.001 0.001 0.001 0.002(0.69) (0.66) (0.80) (1.21)
Urban share of population 0.024 0.024 0.019 0.018(1.77)* (1.71)* (1.78)* (1.65)
Other characteristics
Log of population, adult share of population, Trade/GDPt�1, exchange rate, year Yes Yes Yes YesObservations 1,137 1,125 1,554 1,554R-squared 0.52 0.53 0.55 0.54
Note: t-stat in parentheses. Standard errors are adjusted for country-level clustering. The constant 0.5 is being added to FDI per capita. The coefficients of‘‘other characteristics” are similar to in Table and unreported.* Statistical significance at 10%.** Statistical significance at 5%.*** Statistical significance at 1%.
860 WORLD DEVELOPMENT
countries nor differently related to institutional quality vari-ables once obvious controls are included.
5. FDI ALLOCATION—CHINA AND THE WORLDCOMPARED
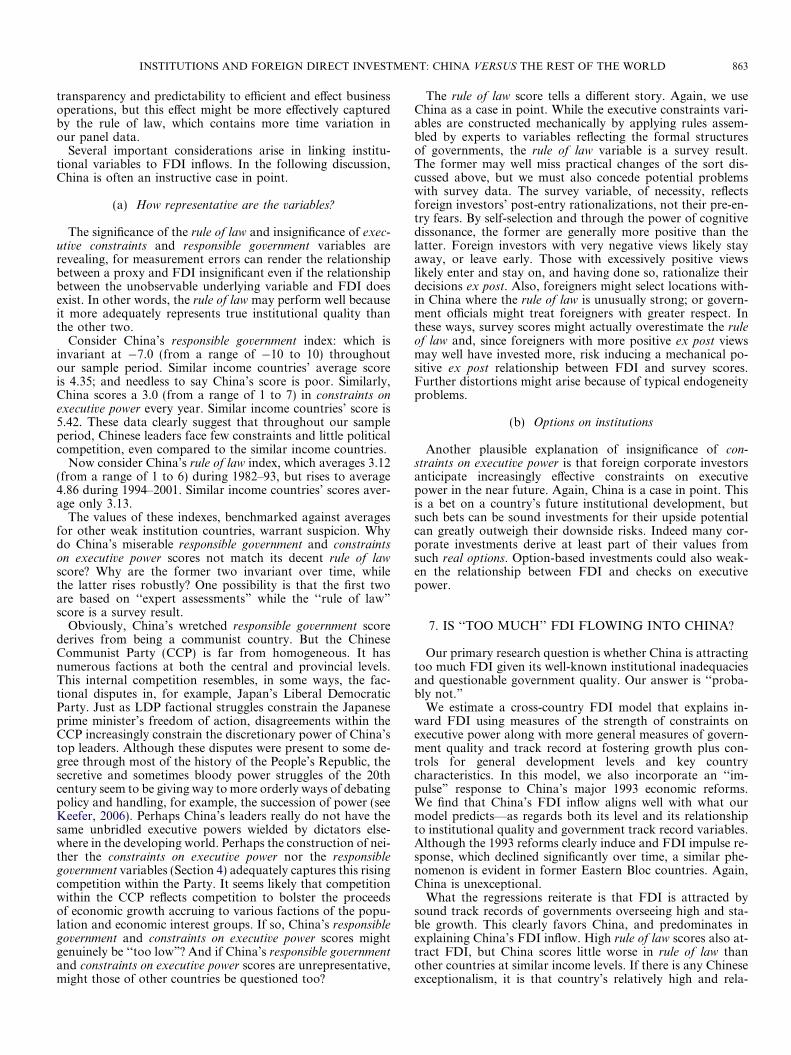
We now turn to the economic significance of our regressionfindings in comparing FDI inflows into China and other coun-tries. For comparison, we select a comparison group (CG) ofcountries whose GDP per capita during 1993–2003 is boundedby China’s minimum and maximum GDP in the same period.China’s FDI per capita exceeds that for the comparison group
by 101 log points in 1993, and 121 log points in 2001. 12 Giventhis, how do our regression results explain China’s per capitaFDI premium with differences in the values of the regressors?
Regression [1] lets us decompose the per capita FDI inflowdifferential between China and the CG into a component ex-plained by the observable variables, Z (limits on executivepower, general government quality, government track record,general development proxies, and proxies for other characteris-tics) and by the China-specific unobservables as captured bythe China dummies in Eqn. (1). For expository convenience,we focus on two years: 1993, is the water shed year of China’scommitment to economic reforms signaled by Deng Xiaop-ing’s Southern Tour and 2001, and the end of the year of

Table 5. Regressions Explaining FDI Allocation across Countries. Dependent variable in all regressions is log constant (0.5) plus per capita FDI inflow
(1) (2) (3) (4) (5)
Expected GDP per capita growth 0.172 0.170 0.102 0.102 0.102(3.83)*** (3.62)*** (2.89)*** (2.89)*** (2.89)***
Expected GDP per capita growth * China dummy 0.023(0.46)
volatility in GDP per capita growth �3.089 �3.610 �6.215 �6.189 �6.229(1.77)* (2.05)** (3.28)*** (3.27)*** (3.29)***
GDP per capita growth volatility * China dummy 5.258(0.81)
Responsible government 0.031(0.91)
Responsible government * China dummy �0.026(0.20)
Executive constraints 0.049(0.53)
Executive constraints * China dummy �0.011(0.04)
Rule of law 0.238 0.239 0.238(3.20)*** (3.22)*** (3.21)***
Rule of law * China dummy 0.076(0.73)
Observations 1,137 1,125 1,554 1,554 1,554R-squared 0.49 0.48 0.54 0.54 0.54
Note: t-stat in parentheses. Standard errors are adjusted for country-level clustering. The constant 0.5 is being added to FDI per capita to take into accountthe fact that some FDI inflows have negative value. We also control for other variables that are controlled in Table 3.* Statistical significance at 10%.** Statistical significance at 5%.*** Statistical significance at 1%.
INSTITUTIONS AND FOREIGN DIRECT INVESTMENT: CHINA VERSUS THE REST OF THE WORLD 861
our sample. In percentage terms, the observables explain thepremium by bZðZchina;t � ZCG;tÞ=ðY china;t � Y CG;tÞ while theunobservable explains the premium by ðachina þ c1Þ=ðY china;t � Y CG;tÞ in 1993 and by ðachina þ c1 þ 8� c2Þ=ðY china;t � Y CG;tÞ in 2001. The results are reported in Table 6,the four column panels correspond to the regressions 2, 4, 6,and 8 in Table 3, respectively.
First, most obviously the chief factor that propels China’sper capita FDI above countries of similar income is its eco-nomic track record—the past high and stable average growthaccount for about 46% to more than 100% of the FDI pre-mium. The effect is larger in the year 2001 than in the year1993.
Second, equally impressive is the contribution of adult (age15–64) population share to China’s FDI premium, which ac-counts for 45–80% of China’s FDI premium over similar in-come countries. While the magnitude is slightly small in2001 than in 1993, the difference is limited. Clearly, the attrac-tion of China’s working age adult for FDI exists. Perhaps, thatis part of China’s demographic dividends. The track record ongrowth and the demographic attraction together essentially ac-counts for more than a 100% of the China FDI inflow pre-mium.
Third, China’s large population naturally serves to dampenthe magnitude of China’s per capita FDI inflow. When wecombine this factor with the demographic composition factor,which provides the opposite effect, the net magnitude is very‘‘tame,” about 21% in 1993 and 15% on the down size of thedifference between FDI inflow in China and similar incomecountries. However, we add the caveat here that both the pop-ulation and the adult population share variables are not signif-icant explanatory variables in the base regressions in Table 3.
Fourth, the collection of the general development factorsserves to press China’s per capita FDI inflow below similar in-come countries in 1993, but the effect reverses sign in 2001 as a
result of China’s fast development. Among the factors, urban-ization is the most critical factor: in 1993, the lack of urbani-zation presses China’s FDI inflow down by 28% of the gap ithas with similar income countries; the magnitude shrinks to9.5% in 2001. Our most preferred setup, which is the third pa-nel where the institutional variable used, the rule of law, is sig-nificant in the original regression reported in Table 3. In thissetup, the general development factors lift China per capitaFDI above similar countries and account for 30% of the pre-mium.
Fifth, China’s lower degree of openness reduces its FDIattraction, compared to the similar countries. But the effectis rather limited; it presses China’s FDI inflow down the gapit has with similar income countries by 16% and 13% in1993 and 2001, respectively. But these magnitudes are muchsmaller than that those due to China’s growth track record.Note that the exchange rate factor has negligible economic sig-nificance.
Six, the set of China dummies reveals that the ‘‘impulse re-sponse” to China’s 1993 strong signal for economic reformsraises the FDI inflows, but the effect is dampened substantiallyin 2001. In our most preferred setup, reported in the third col-umn panel, the effect all but disappeared, as we also describedearlier.
Seven, institutions do not play any significant role in causingthe gap between the FDI inflow to China and similar incomecountries. Compared with the similar income countries, Chinahas worse limits on executive power but actually a better surveyrecord on the rule of law, the former negatively and the latterpositively impact on China’s inflow FDI premium over similarincome countries. The control for corruption gives a moremixed picture: China was on record better than similar incomecountry in 1993 and worse in 2001. Given that among the fourvariables only the rule of law is significant (see Table 3), we fo-cus on it. The variable contributes 44% to China’s inflow FDI

Table 6. The relative importance of various factors in explaining China’s FDI premium over countries with similar GDP per capita
Institutional variable is:
Responsible government Executive constraint Rule of law Control of corruption
China 1993versus similar
countries
China 2001versus similar
countries
China 1993versus similar
countries
China 2001versus similar
countries
China 1993versus similar
countries
China 2001versus similar
countries
China 1993versus similar
countries
China 2001versus similar
countries
Difference in ln (FDIper capita)
1.01 1.21 1.01 1.21 1.01 1.21 1.01 1.21
Government track record
(1) Expected growth 103.9 91.4 102.3 89.9 62.1 54.6 69.4 61(2) GDP growthstandard deviation
�8.1 11.9 �9.5 13.9 �16.3 24 �16 23.5
(1 + 2) 95.8 103.3 92.8 103.8 45.8 78.6 53.4 84.5
(3) Adult share ofpopulation
69.4 62.6 80 72.1 49.4 44.6 60.3 54.4
(1 + 2 + 3) 165.2 165.8 172.8 175.9 95.2 123.2 113.7 138.9
(4) China dummyeffects total
143.4 50.7 119.4 24.6 106.3 �9.7 130.5 13.8
General development
(5) ln (GDP per
capita)�1.6 0.6 �2.8 1 �6.4 2.2 �7.9 2.7
(6) Log (mean yearsof school)
�6.4 �7.2 �6.9 �7.7 5 5.6 3.9 4.4
(7) Telephones per1,000
�2.9 20 �2.8 19 �1.5 10.2 �2.2 15.2
(8) Urban share ofpopulation
�34.9 �11.8 �34.4 �11.6 �22.2 �7.5 �21 �7.1
(5 + 6 + 7 + 8) �45.8 1.6 �46.9 0.7 �25.1 30.3 �27.2 15.2
Other characteristics
(9) ln (population) �96.1 �82.2 �100.5 �86 �72.4 �62 �75.7 �64.8(10) Trade_GDPt�1 �10.5 �8.6 �9.8 �8 �21.7 �17.6 �22.1 �17.9(11) Exchange rate 2.8 �5 2.8 �5 2.9 �5.2 1.9 �3.4(9 + 10 + 11) �103.8 �68.6 �107.5 �99.0 �91.2 �84.8 �95.9 �86.1
Institution variable �36.1 �30.4 �12.5 �10.5 43.6 17 14 �14
Note: The numbers, starting from the second row with numbers, are percentage.
862 WORLD DEVELOPMENT
premium over similar countries in 1993 and only 17% in 2001.These magnitudes, while not negligible, are substantially smal-ler than the effects due to China’s growth track record anddemography, especially in 2001.
In summary, we find that China’s per capita FDI premiumover similar income countries is largely due to its record ofhigh and stable growth rate and its demographic appeal. Chi-na’s fast growth allows it to catch up with similar incomecountries in infrastructure development, and urbanization sothat these factors do not cause much difference between per ca-pita FDI inflows into China and similar income countries. Thesame applies to China’s openness and exchange rate policies.Finally, while we find that the rule of law attracts FDI, surveyrecord on China’s rule of law is actually better than similar in-come countries and it positively impacts on China’s FDI pre-mium, although the dominant forces are still China’s highlyregarded growth record and demographic appeal.
6. DO INSTITUTIONS MATTER?
One prime objective of our investigation is on whether FDIallocation is affected by the quality of government and morebroadly institutions. Answer to the question is not obvious.On the one hand, the law and development literature leadmany to believe that a positive relationship exists; in particu-lar, foreign investors face exacerbated information asymmetry
and institutional discrimination problems. On the other hand,FDI, compared to domestic investment, might be less affectedby inadequate institutions because foreign investors may havebetter access to capital and may have home authorities’ back-ing in protecting their rights. Multinationals often have a largenetwork of subsidiaries and can utilize the extensive system toraise its bargaining power against rent-extracting politiciansand thus its ability to protect property rights (Zhao, 2006).Moreover, while poor institutions discourage domestic capitalformation, politicians may actually show favoritism to foreigndirect investors. (Huang’s (2003) suggestion leads to a substi-tution of some domestic investment by foreign direct invest-ment in the case of China. 13)
Our results show a qualified affirmative answer: based oncross-country panel data, we show that both the ‘‘rule of law”and a good government track record, as registered by high andstable prior growth, attract FDI. A more conservative inter-pretation of the result is that, controlling for past growth re-cord to proxy for expectations of future growth, ‘‘rule oflaw” attracts FDI. However, FDI inflows are not reliably re-lated to limits on executive power or freedom from corruption.These mixed results are worthy of further discussion.
The insignificance of freedom from corruption is not inexpli-cable. Bribes can become part of the cost of doing business;and for foreign firms with bargaining power, high bribes canbe offset with tax or regulatory privileges. This does notnecessarily undermine previous work relating government
INSTITUTIONS AND FOREIGN DIRECT INVESTMENT: CHINA VERSUS THE REST OF THE WORLD 863
transparency and predictability to efficient and effect businessoperations, but this effect might be more effectively capturedby the rule of law, which contains more time variation inour panel data.
Several important considerations arise in linking institu-tional variables to FDI inflows. In the following discussion,China is often an instructive case in point.
(a) How representative are the variables?
The significance of the rule of law and insignificance of exec-utive constraints and responsible government variables arerevealing, for measurement errors can render the relationshipbetween a proxy and FDI insignificant even if the relationshipbetween the unobservable underlying variable and FDI doesexist. In other words, the rule of law may perform well becauseit more adequately represents true institutional quality thanthe other two.
Consider China’s responsible government index: which isinvariant at �7.0 (from a range of �10 to 10) throughoutour sample period. Similar income countries’ average scoreis 4.35; and needless to say China’s score is poor. Similarly,China scores a 3.0 (from a range of 1 to 7) in constraints onexecutive power every year. Similar income countries’ score is5.42. These data clearly suggest that throughout our sampleperiod, Chinese leaders face few constraints and little politicalcompetition, even compared to the similar income countries.
Now consider China’s rule of law index, which averages 3.12(from a range of 1 to 6) during 1982–93, but rises to average4.86 during 1994–2001. Similar income countries’ scores aver-age only 3.13.
The values of these indexes, benchmarked against averagesfor other weak institution countries, warrant suspicion. Whydo China’s miserable responsible government and constraintson executive power scores not match its decent rule of lawscore? Why are the former two invariant over time, whilethe latter rises robustly? One possibility is that the first twoare based on ‘‘expert assessments” while the ‘‘rule of law”score is a survey result.
Obviously, China’s wretched responsible government scorederives from being a communist country. But the ChineseCommunist Party (CCP) is far from homogeneous. It hasnumerous factions at both the central and provincial levels.This internal competition resembles, in some ways, the fac-tional disputes in, for example, Japan’s Liberal DemocraticParty. Just as LDP factional struggles constrain the Japaneseprime minister’s freedom of action, disagreements within theCCP increasingly constrain the discretionary power of China’stop leaders. Although these disputes were present to some de-gree through most of the history of the People’s Republic, thesecretive and sometimes bloody power struggles of the 20thcentury seem to be giving way to more orderly ways of debatingpolicy and handling, for example, the succession of power (seeKeefer, 2006). Perhaps China’s leaders really do not have thesame unbridled executive powers wielded by dictators else-where in the developing world. Perhaps the construction of nei-ther the constraints on executive power nor the responsiblegovernment variables (Section 4) adequately captures this risingcompetition within the Party. It seems likely that competitionwithin the CCP reflects competition to bolster the proceedsof economic growth accruing to various factions of the popu-lation and economic interest groups. If so, China’s responsiblegovernment and constraints on executive power scores mightgenuinely be ‘‘too low”? And if China’s responsible governmentand constraints on executive power scores are unrepresentative,might those of other countries be questioned too?
The rule of law score tells a different story. Again, we useChina as a case in point. While the executive constraints vari-ables are constructed mechanically by applying rules assem-bled by experts to variables reflecting the formal structuresof governments, the rule of law variable is a survey result.The former may well miss practical changes of the sort dis-cussed above, but we must also concede potential problemswith survey data. The survey variable, of necessity, reflectsforeign investors’ post-entry rationalizations, not their pre-en-try fears. By self-selection and through the power of cognitivedissonance, the former are generally more positive than thelatter. Foreign investors with very negative views likely stayaway, or leave early. Those with excessively positive viewslikely enter and stay on, and having done so, rationalize theirdecisions ex post. Also, foreigners might select locations with-in China where the rule of law is unusually strong; or govern-ment officials might treat foreigners with greater respect. Inthese ways, survey scores might actually overestimate the ruleof law and, since foreigners with more positive ex post viewsmay well have invested more, risk inducing a mechanical po-sitive ex post relationship between FDI and survey scores.Further distortions might arise because of typical endogeneityproblems.
(b) Options on institutions
Another plausible explanation of insignificance of con-straints on executive power is that foreign corporate investorsanticipate increasingly effective constraints on executivepower in the near future. Again, China is a case in point. Thisis a bet on a country’s future institutional development, butsuch bets can be sound investments for their upside potentialcan greatly outweigh their downside risks. Indeed many cor-porate investments derive at least part of their values fromsuch real options. Option-based investments could also weak-en the relationship between FDI and checks on executivepower.
7. IS ‘‘TOO MUCH’’ FDI FLOWING INTO CHINA?
Our primary research question is whether China is attractingtoo much FDI given its well-known institutional inadequaciesand questionable government quality. Our answer is ‘‘proba-bly not.”
We estimate a cross-country FDI model that explains in-ward FDI using measures of the strength of constraints onexecutive power along with more general measures of govern-ment quality and track record at fostering growth plus con-trols for general development levels and key countrycharacteristics. In this model, we also incorporate an ‘‘im-pulse” response to China’s major 1993 economic reforms.We find that China’s FDI inflow aligns well with what ourmodel predicts—as regards both its level and its relationshipto institutional quality and government track record variables.Although the 1993 reforms clearly induce and FDI impulse re-sponse, which declined significantly over time, a similar phe-nomenon is evident in former Eastern Bloc countries. Again,China is unexceptional.
What the regressions reiterate is that FDI is attracted bysound track records of governments overseeing high and sta-ble growth. This clearly favors China, and predominates inexplaining China’s FDI inflow. High rule of law scores also at-tract FDI, but China scores little worse in rule of law thanother countries at similar income levels. If there is any Chineseexceptionalism, it is that country’s relatively high and rela-
864 WORLD DEVELOPMENT
tively stable prior growth. Parsing the difference between FDIinto China and into countries at similar income levels supportsno other conclusion.
Our results cast doubt on the hypothesis of a uniquely Chi-nese institutional bias favoring inward FDI. This bias ishypothesized because China’s weak institutions may deterdomestic firms from realizing investment opportunities evenas tax incentives, special property rights protection, and other
government policies favoring FDI present those same oppor-tunities to foreign firms. If this were the case, our China dum-my should have attracted a significant positive coefficient, orsignificantly shifted the slopes of key institutional variables.This is not observed. Either FDI is not crowding out domesticfirms’ investment in China or a similar phenomenon is suffi-ciently widespread in other developing economies as to renderChina again unexceptional.
NOTES
1. This point is elaborated in Table 2, discussed below.
2. Coughlin, Terza, and Arromdee (1991) provide empirical support forthese factors influencing inward FDI, though they do not considerfinancial development. Froot and Stein (1991), while showing thatundervalued host country currencies attract inward FDI, also stressbarriers firms confront in raising capital to finance new investmentprojects. These barriers are particularly daunting for domestic firms ineconomies with underdeveloped capital markets. In such countries, foreignfirms could have an advantage in capturing the NPVs of new investmentprojects because of their access to better functioning foreign capitalmarkets (Foley, Desai, & Hines, 2004). Lane (2007) suggests that foreigninvestors may also invest in abroad because of institutional voids in acountry that allows them to maximize profits. See also Dunning (1993)and Dunning and Zhang (2007) for the relationship between FDI,locational competitiveness, and other factors.
3. Their empirical results do not control for expected growth, soinstitutional factors might proxy for this, or for government behaviorassociated with expected future growth and thus with a need for FDI.
4. Winsorization prevents disproportionate influence of outliers due tomeasurement errors. This variable is highly skewed: its fifth and firstpercentiles value are �0.46 and �79.0, while its ninety-fifth and ninety-ninth percentiles are 527.8 and 1064.0. Its minimum is �2,615 and itsmaximum is 259,837. The results are qualitatively similar when wewinsorize at the first or fifth percentiles. However, giving the 5% thresholdis around 0 (instead of �79 at the 1% level), interpreting magnitudes issimpler, for log (FDI per capita + constant) is closer to log (FDI per
capita) if the constant is 0.5, instead of 80, and log differences can beinterpreted as percentage differences.
5. In total, 6.3% of the observations are negative. We add 0.5 to FDI per
capita so the minimum of the winsorized FDI per capita is positive.
6. ICRG data has the advantage of covering the majority of countriesfrom 1982 on. For details, see Knack & Rahman, 2007.
7. We have also tried including the percent of GDP accounted bymanufacturing and services, and found that they do not matter forattracting FDI after controlling for GDP per capita , urbanization, andother controls.
8. Adults are defined to be between the age of 15 and 64.
9. We thank an anonymous referee for the suggestion.
10. The list of countries is available upon request.
11. For example, using column six, the jump effect and the time trendeffect offset each other in between the 7th and the 8th year, that is, around2000.
12. This is only approximately true. Our dependent variable isln (0.5 + FDI per capita), which is very close to ln (FDI per capita) whenFDI per capita is around 20–30 dollars per capita.
13. The Huang (2003) argument can be interpreted as that the govern-ment’s pro foreign direct investment behavior can create a substitutionbetween domestic and foreign direct investment; yet, the overall poorinstitutions can nevertheless discourage and thus mitigate the level ofinvestment.
REFERENCES
Acemoglu, D., Johnson, S., & Robinson, J. (2005). Institutions as thefundamental cause of long-run growth. NBER Working Paper 10481,The handbook of economic growth. North-Holland: Elsevier.
Acemoglu, D., & Johnson, S. (2005). Unbundling Institutions. Journal ofPolitical Economy, 113(October), 949–995.
Acemoglu, D., Johnson, S., Robinson, J., & Thaicharoen, Y. (2003).Institutional causes, macroeconomic symptoms: Volatility, crises, andgrowth. Journal of Monetary Economics, 50(January), 49–123.
Alfaro, L., Kalemli-Ozcan, S., & Volosovych, V. (2005). Why doesn’tcapital flow from rich to poor countries? An empirical investigation.NBER Working Paper 11901.
Allen, F., Qian, J., & Qian, M. (2005). Law, finance, and economic growthin China. Journal of Financial Economics, 77, 57–116.
Buckley, P. J., & Casson, M. (1976). The future of multinational enterprise.New York: Holmes & Meier Publishers Inc.
Caves, R. (1971). International corporations: The industrial economics offoreign investment. Economica, 38(February), 1–27.
Caves, R. (1995). Multinational enterprise and economic analysis (2nd ed.).Cambridge: Cambridge University Press.
Coase, R. (1937). The nature of the firm. Economica, 4, 386–405.Coughlin, C. C., Terza, J. V., & Arromdee, V. (1991). State characteristics
and the location of foreign direct investment within the US. Review ofEconomics and Statistics, 73, 675–683.
Dunning, J. (1993). Multinational enterprises and the global economy. MA:Addison-Wesley.
Dunning, J., & Zhang, F. (2007). Foreign direct investment and thelocational competitiveness of countries. Paper presented at the meeting ofexperts on FDI, technology and competitiveness, UNCTAD, Geneva.
Durnev, A., Li, K., Morck, R., & Yeung, B. (2004). Capital markets andcapital allocation: Implications for economies in transition. Economicsof Transition, 12(4), 593–634.
Foley, C. F., Desai, M. A., & Hines, J. R. Jr., (2004). A multinationalperspective on capital structure choice and internal capital markets.Journal of Finance, 59(6), 2451–2488.
Froot, K. A., & Stein, J. C. (1991). Exchange rates and foreign directinvestment and imperfect capital market approach. Quarterly Journalof Economics, (November), 1191–1217.
Globerman, S., & Shapiro, D. (2002). Global foreign direct investmentflows: The role of governance infrastructure. Industry Canada.
Griliches, Z., & Hausman, J. (1986). Errors in variables in panel data.Journal of Econometrics, 31(1), 93–118.
Henry, P. B. (2000). Do stock market liberalizations cause investmentbooms? Journal of Financial Economics, 58(1–2), 301–334.
Huang, Y. (2003). Selling China. Cambridge University Press.Keefer (2006). Governance and economic growth in China and India.
Worldbank Working Paper.
INSTITUTIONS AND FOREIGN DIRECT INVESTMENT: CHINA VERSUS THE REST OF THE WORLD 865
King, R. G., & Levine, R. (1993). Finance, entrepreneurship, and growth:Theory and evidence. Journal of Monetary Economics, 32(3), 513–542.
Knack, S., & Rahman, A. (2007). Donor fragmentation and bureaucraticquality in aid recipients. Journal of Development Economics, 83(1),176–197.
La Porta, R., Lopez-de-Silanes, F., Shleifer, A., & Vishny, R. (1997).Legal determinants of external finance. Journal of Finance, 52(3),1131–1150.
La Porta, R., Lopez-de-Silanes, F., Shleifer, A., & Vishny, R. (1998). Lawand finance. Journal of Political Economy, 106(6), 1113–1155.
Lane, C. (2007). Comparative institutions and international business.Paper presented at the academy of international business annualconference, London, UK.
Mason, A. (2007). Demographic dividends: The past, the present, and thefuture. In Andrew Mason, & Mitoshi Yamaguchi (Eds.), Population
Available online at www
change, labor markets and sustainable growth: Towards a new economicparadigm. Elsevier Press.
Morck, R., & Yeung, B. (1991). Why investors value multinationality.Journal of Business, 64(2), 165–187.
Morck, R., & Yeung, B. (1992). Internalization: An event study test.Journal of International Economics, 33(August), 41–56.
Moulton, B. (1986). Random group effects and the precision of regressionestimates. Journal of Econometrics, 32, 385–397.
North, D. C. (1990). Institutions, institutional change, and economicperformance. New York: Cambridge University Press.
Zaheer, S., & Mosakowski, E. (1997). The dynamics of the liability offoreignness: A global study of survival in financial services. StrategicManagement Journal, 18, 439–464.
Zhao, M. (2006). Doing R&D in countries with weak intellectual propertyrights protection. Management Science, 56(7), 1185–1199.
.sciencedirect.com