institutt for farmasi
TRANSCRIPT

INSTITUTT FOR FARMASI Metabolic profiling of marine sponges as a tool to discover novel natural products By Kine Lethigangas Søderholm Master thesis for the degree Master of Pharmacy, May 2014

1
Acknowledgement
The work presented in this thesis was carried out at MabCent- a Centre for Research-based
innovation on Marine Bioactives and Drug Discovery and at Smallstruct, the Department of
Chemistry at the University of Tromsø during the period from October 2013 to May 2014.
First, I would like to thank my supervisors Espen Hansen and Terje Vasskog, both have been
more than helpful with answering questions and proofreading this thesis. Especially Espen,
who have been my go-to-guy for guidance, patience and an optimistic perspective on the
project that never failed to put me at ease. I would also like to extend my sincere appreciation
to everyone at MabCent who have contributed to this work. Thank you all for all of your help,
support and for always making time to answer my questions. To Johan Isaksson, for feedback
and help with NMR, thank you.
Finally, I would like to thank Tore and my sister and roommate Ida for your support and for
putting up with me during this project. And at last but not least, to Tine, Anne and Marion
whose devil-may-care attitude always puts me in a good mood, thank you!
2
Contents
Acknowledgement ................................................................................................................................. 1
Abstract .................................................................................................................................................. 4
List of abbreviation ............................................................................................................................... 5
Introduction ........................................................................................................................................... 6
Natural Products Drug Discovery ....................................................................................................... 6
Marine bioprospecting ......................................................................................................................... 7
Metabolomics ...................................................................................................................................... 8
Metabolomics-based natural products drug discovery ........................................................................ 9
Extractions ......................................................................................................................................... 11
High-Performance Liquid Chromatography & Ultra-Performance Liquid Chromatography ........... 12
Ion Source & Mass Spectrometry...................................................................................................... 13
Data processing (MarkerLynx).......................................................................................................... 15
Nuclear magnetic resonance spectroscopy (NMR) ........................................................................... 15
Marine Sponges ................................................................................................................................. 17
Geodia barretti .................................................................................................................................. 18
Geodia macandrewii ......................................................................................................................... 19
The aim of the thesis ............................................................................................................................ 20
MabCent-SFI ....................................................................................................................................... 20
Materials and methods ........................................................................................................................ 21
Sampling and storage ........................................................................................................................ 21
Extractions of G. baretti and G. macandrewii .................................................................................. 21
Preparation of the samples for MS analysis ...................................................................................... 23
UPLC-HR-MS analysis ..................................................................................................................... 23
Preparation of sample 5 for HPLC isolation of MBC-169 ................................................................ 25
1st HPLC isolation of MBC-169 ........................................................................................................ 26
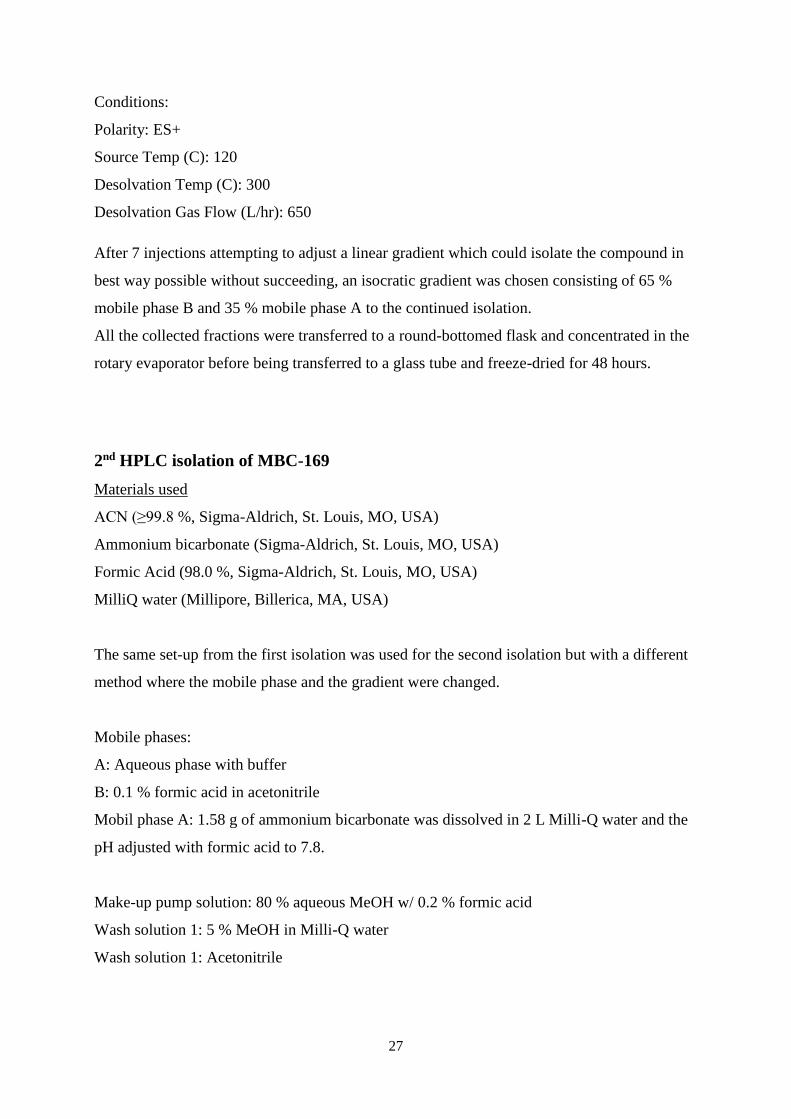
2nd HPLC isolation of MBC-169 ....................................................................................................... 27
H1-NMR-analysis ............................................................................................................................... 28
Cellular Antioxidant Activity Assays ................................................................................................ 29
Kinase RR-analysis: PKA and ABL inhibition testing ..................................................................... 33
Minimum Inhibiting Concentration (MIC) Assay ............................................................................. 36
Results .................................................................................................................................................. 39
Extractions ......................................................................................................................................... 39
UPLC-HR-MS analysis of sponge extracts ....................................................................................... 40

3
Identification of biomarkers using MarkerLynx ............................................................................... 42
Identification: .................................................................................................................................... 45
HPLC Isolation of MBC-169 ............................................................................................................ 50
Structure Elucidation ......................................................................................................................... 51
Bioactivity ......................................................................................................................................... 57
Antioxidant Activity Assays.......................................................................................................... 57
Kinase RR-analysis: Inhibition of PKA and ABL ......................................................................... 58
MIC ............................................................................................................................................... 59
Discussion ............................................................................................................................................. 60
Conclusion and future perspective..................................................................................................... 63
References ............................................................................................................................................ 64
Appendix .............................................................................................................................................. 65

4
Abstract
In this project metabolic profiling was explored as a means for finding unique and novel
natural products. Natural products have had a vital role in drug discovery throughout history
and in recent times, that includes the world oceans more and more. Therefore two related
species of marine sponges, where the samples were collected from different locations, was
chosen to test the methodology. This project was performed at MabCent, a research center
which focuses on bioactive compounds from Arctic and sub-Arctic organisms. A high-
resolution mass spectrometer (HR-MS) was used to provide data for the analysis and a
processing software program was used for interpretation of the data. The sponge`s metabolic
profiles clearly grouped according to species. A known bioactive compound, barettin, was
present in all the samples although in different amounts. One of the species contained a
unique compound that was not present in the samples from the other species. The compound
now labeled MBC-169 had an m/z: 400 and an elemental composition of C21H37NO4S, which
was determined by the MS software. MBC-169 was isolated with the help of preparative high
performance liquid chromatography (HPLC) before the structure was determined with the
combination of HR-MS and nuclear magnetic resonance (NMR) data. After the structure
elucidation MBC-169 was tested for antioxidant activity in two different assays as well as
antibiotic activity, and for kinase inhibiting properties. In addition this thesis provides
background information of challenges when natural products are used as a source for
discovering novel bioactive compounds and how those challenges were overcome in this
particular project.

5
List of abbreviation
AAPH 2,2- Azobis (2- methylpropionamidine dihydrochloride)
ACN Acetonitrile
API Atmospheric Pressure Ionization
CAA Cellular Antioxidant Activity
CLPAA Cellular Lipid Peroxidation Antioxidant Activity
COSY Correlation Spectroscopy
DCFH-DA 2,7 dichlorofluorescin diacetat
DCM Dichloromethane
DMSO Dimethyl Sulfoxide
EMRT Exact Mass Retention Time
EtOH Ethanol
ESI Electrospray Ionization
FBS Fetal Bovine Serum
GC Gas Chromatography
GM Growth Medium
HMBC Heteronuclear Multiple-Bond Correlation
HPLC High Performance Liquid Chromatography
HR High Resolution
HSQC Heteronuclear Single-Quantum Correlation
HTS High Throughput Screening
LC Liquid Chromatography
MeOH Methanol
MIC Minimum Inhibition Concentration
MS Mass Spectrometer
MVDA Multivariete Data Analysis
NMR Nuclear Magnetic Resonance
PCA Principal Component Analysis
PBS Phosphate Buffered Saline Solution
TM Treatment Medium
TOF Time of Flight
UPLC Ultra Performance Liquid Chromatography

6
Introduction
Natural Products Drug Discovery
Throughout history natural products and their derivatives has undeniably been a leading
source of therapeutic agents. One of the earliest documented cases, around 2600 BC in
Mesopotamia, describes the use of approximately 1000 plant derived substances. An example
from more recent time, is from 2007 when a complex alkaloid isolated from the colonial
tunicate Ecteinascidia turbinate, was approved under the name Yondelis® for treatment of
soft tissue sarcoma [1]. Natural products have several characteristics that make them
favourable as lead structures for drug discovery, like remarkable chemical diversity and
biochemical specificity [2]. These characteristics are already being utilized in approved
synthetic drugs. When comparing synthetic compounds from the database WOMBAT to
natural products, it is confirmed that natural products show the same bioactivity as the
synthetic compound. The fact that the natural products have more complex chemical
properties could prove an advantage when it comes to discovering novel leads with unique
properties [3]. Their large, complex structures can provide new scaffolds with very specific
target interactions. On the downside there are challenges in screening mixtures filled with
several different types of these structurally complex compounds. Such challenges are
considered one of the reasons for the decline in the field of natural products drug discovery.
Pharmaceutical research into natural products reached its peak in western medicine in 1970-
1980, since then it has slowly declined during the past 20 years. However, recent
technological advances in separation and structure-determination have lowered these
obstacles and combined with advances in similar fields the extraordinary chemical diversity
of natural products can again offer exciting novel drug discoveries [4]. This type of discovery
is also an ambitious goal with this thesis, but with an untraditional course of action.

7
Marine bioprospecting
Biodiversity prospecting, or -bioprospecting in short, has been defined as “The process of
collecting or surveying a large set of flora (or fauna) for the purpose of the biological
evaluation and isolation of lead compounds” [5]. Although the bioprospecting have by far
been done mostly on land, the relatively unexplored marine environment has become more
relevant in recent times [6]. Marine invertebrates have proven to be a rich source of bioactive
compounds, which biotechnical potential now attracts scientific interest all over the world.
The prospect of finding novel drug leads and possible profit also awakens interest from the
pharmaceutical industry. For instance the anticancer agent salinosporamide A® which is a
result of the cooperation of academic researchers and the pharmaceutical industry and
demonstrates the oceans potential to yield novel drug leads [7]. The probability of finding
previously undiscovered bioactive compounds in the world`s oceans is in its own a reason to
support the field of marine bioprospecting. When in addition it has been claimed that marine
organisms are more likely to yield anticancer drugs than terrestrial sources, the field is more
than promising [8].

8
Metabolomics
Metabolomics has been defined as “the comprehensive analysis of all metabolites in a
system” [9]. It is important to notify that in this particular project metabolomics is not used as
previously defined. It is only the metabolites that reside in an organic extract that are subject
to metabolic analysis. This is due to the extraction process and compounds it is optimised to
extract. The desired compound properties will be elaborated under the extraction section.
To put metabolomics in a simpler term: it provides snapshots of the metabolites (the
metabolome) present in an organism, at a given time. Several analytical methods can be put to
use for this “snapshot”, where the purpose is not to target a specific molecule but often to
identify and quantitate multiple targets. Development in ionization and mass detection where
differences in molecular weights and polarities are detected makes mass spectrometry (MS) a
helpful tool in metabolomics. There are several different techniques within MS that have been
found suited for metabolomics, depending on the raw material and the aim of the project. Gas
chromatography (GC) coupled to MS have been used for identification and structure
elucidation in several projects. Liquid chromatography (LC) has been found useful when
investigating non-volatile plant metabolites. An arrangement containing a quadrupole time-of-
of-flight (QTOF) - MS was developed for detection of and identification of semipolar
secondary metabolites. However, there are some limitations when applying MS to
metabolomics, the different sensitivity of the detection of molecules and its reproducibility
due to the different detector response. Nuclear magnetic resonance (NMR) spectrometry has
many advantages and fulfils the criteria for reproducibility in a metabolomics technology
platform. The NMR can therefore be a useful supplement to MS in metabolomics-based
projects. Another aspect of metabolomics- based work is the high dimensional data that
require multivariate data analysis (MVDA). Like most of the metabolomics data, this project
is also based on the classifications of samples into different groups. There are several
approaches to classification, in this project principal component analysis (PCA) was used
[10].

9
Metabolomics-based natural products drug discovery
The metabolome is in constant change due to cellular processes and environmental changes
and previously the vast possibilities of bioactive compounds in these gene expression end
products have not been fully understood or exploited [11]. Partially due to the traditional
reductionist approach to drug development and partially caused by challenges connected to
dealing with a matrix abundant with different compounds. Some examples of these challenges
are the interaction between metabolites in the partially purified mixtures, or the presence of
antagonisms or synergisms that might take place. Such a complex matrix requires extensive
purification to isolate new compounds, and getting to the root of antagonism or synergism
often poses a great intellectual challenge as well as being very time consuming [10]. Another
example of the challenges when dealing with natural products is one of the efforts made to
reduce the drug discovery timeline and costs, high throughput screening (HTS). HTS enables
the screening of more than 100 000 compounds a day [12] but might be incompatible with
natural products. The sheer amount of source material needed is often a problem in itself
when it comes to natural products. The source material should ideally be found in abundance
in an easily accessible area, or even better, thrive in an artificial manmade environment at a
low cost. With that in mind it is not hard to appreciate that the collection of several kg of a
marine sponge from 200 meters depths in the ocean is anything but ideal. Also the number of
fractions needed to screen over a hundred thousand compounds will be hard for any lab to
produce. However, several strategies are now being used to overcome some of the challenges
dealing with natural products. Applications of new technologies, like connecting
metabolomics with multivariate data analysis (MVDA) and a high quality natural products
library can at least speed up limiting steps. Generating these comprehensive metabolic
profiles provides a massive amount of data to process but also provides better understanding
of the link between the changes in profiles and alterations in underlying biochemistry. This in
turn will provide knowledge on altered physiology, disease etiology, toxic side effects and
better drug targeting [11]. In this project the benefits from metabolomics is combined with
bioprospecting in a new approach to search for novel drug leads, where the traditional
pathway of bioassay guided fractionation has been diverted from. The main principle with
bioassay guided fractionation is to split a sample into fractions and test to see which fraction
contains a possible hit and then repeat that process until what is left is a small, concentrated
fraction containing the hit, before structure elucidation and further testing can be done. This
thesis differs from that route because metabolomics has been used to look for compounds that
are unique in a sample and test that compound for bioactivity, and also to search for new and

10
exciting possible drug leads in a marine organism known to produce bioactive metabolites.
Figure 1 illustrates the two different pathways, and the different steps for the route chosen in
this project will be further elaborated in the oncoming sections.
Conventional natural Metabolomics- based natural
products drug discovery products drug discovery
Figure 1: Comparing the conventional natural products drug discovery pathway to the metabolomics-based used
in this project.
Extraction Extraction
Prefractionation
Screening
Biological profiling
Structure elucidation
Isolation/purification
MS - profiling
Fractionation
Structure elucidation
Biological profiling

11
Extractions
There are several extraction methods available for marine natural products, and which method
that is chosen depends on the nature of the raw material and the purpose of the extraction
[13]. In general the extraction process is designed to obtain one or more compounds from a
solid mass or withdrawal of a solute from a liquid to another liquid or solid mass. If the
sample is solid, it is usually cut into small pieces or grounded to fine particles to facilitate
solvent penetration and prevent any hydrophilic compounds from being enveloped in
membrane pockets or protected by lipophilic substances. Stirring or shaking can increase the
diffusion rate.
In this project we wanted to extract as many compounds with the desirable characteristics
from the sample as possible. Therefore, water was first used to extract the hydrophilic
compounds and thereafter a mixture of dichloromethane and methanol was used to extract the
compounds with lipophilic characteristics. Another reason for separating the sample into an
aqueous phase and an organic phase is the high content of salt in marine samples. The salts
will reside in the aqueous phase with the rest of the hydrophilic compounds. This extraction
protocol provides a broad spectrum of compounds available for bioactivity testing without the
interference of hydrophilic compounds. In this case the small, lipophilic compounds are the
ones of interest, since the goal is finding a novel drug lead [13]. Drugs need to be sufficiently
lipophilic to cross membranes in the human body, hence the focus on the lipophilic
compounds. However, if a compound is too lipophilic it will precipitate in the blood
vessels[5]. This is accounted for later in the project, when preparing the extract for high
performance liquid chromatography, where the extract is liquid-liquid extracted with
acetonitrile and hexane in a separating funnel. The acetonitrile phase is where the compounds
of interest may reside, and the hexane phase is where the most lipophilic compounds reside.
Therefore the acetonitrile phase is the one used for further examination.

12
High-Performance Liquid Chromatography & Ultra-Performance Liquid
Chromatography
High Performance Liquid Chromatography (HPLC) is a chromatographic method used to
separate compounds in a liquid. The HPLC normally consist of an injector, a column, a pump,
mobile phases and a detector. It relies on the pump to pass the pressurized mobile phase
containing the sample mixture through the column, which is filled with a solid adsorbent
material. Different compounds in a sample will interact with the adsorbent material in the
column according to their physical properties. The perhaps most commonly used column is
the reverse phased column, where the stationary phase in the column is non-polar. The
mechanism of retention is mainly van der Waals forces, which causes the small hydrophilic
molecules to elute first. Due to the hydrophobic molecules higher affinity to the non-polar
stationary phase, they will be held back. The hydrophobic molecules will therefore have the
longest retention time. Retention time is the time it takes for a compound to traverse the
column and enter the detector, and can give an indication on the characteristics of the
compound eluted. The detector measures one or several characteristics of the compound,
depending on which types of detector are being used. This is then converted to a signal and
displayed as a chromatogram, showing the signal versus time of elution. Most HPLC
instruments also have a column oven that allows for adjusting the temperature the separation
is performed at. Ultra Performance Liquid Chromatography (UPLC) is a development of
HPLC with the same principle; however it involves smaller particles, lesser internal diameters
of the column and a higher counter pressure that translates into a higher resolution of the
analyses. This allows for en effective separation of the many compounds in a sample in a
short time, a property much needed for this project where the organic extract contains a vast
number compounds. Various detectors are in common use, such as photodiode array (PDA)
an UV/Vis detector, or based on mass spectrometry like the ones used for this thesis.

13
Ion Source & Mass Spectrometry
Mass spectrometry (MS) is an analytical method where molecules are ionized and the ions are
subsequently separated according to their mass-to-charge (m/z) ratio and detected in a
detector. There are several different ion sources and mass separators. In this project the
instruments had electrospray ionization (ESI) coupled with a single quadrupole mass
separator for isolation and ESI coupled with time-of-flight (TOF) mass separator for analysis.
ESI is an atmospheric pressure ionization (API) technique which means that it takes place
under atmospheric pressure making protonated [M+H]+, or deprotonated [M-H]- molecular
ions and in addition form adducts. These formations are non-covalent complexes formed
between the compound of interest and any other of the compounds present in the ionized
sample. Some adducts are common to find under given circumstances depending on mobile
phase, which buffer are present and whether a positive or negative potential is applied. The
presence of these adducts can help verify the presence of a suggested compound.
Table 1: Adducts that often occur when using ESI.
Positive ionization Negative ionization
Na+ Cl-
K+ CH3COO-
NH4+
CH3CNH+
The Single Quadrupole
The single quadrupole is made up of four parallel rods, in opposing pairs that are electrically
connected. A radio frequency voltage is applied to guide the ions down the quadrupole
between the rods. For a given ratio of voltage only ions with a certain m/z will reach the
detector, other ions will have an unstable trajectory and will collide with the rods. This means
the quadrupole can be used as both a specific or general detector; by varying the voltage
applied it can scan for either ions with a specific m/z or a range of m/z –values. On the
downside the quadrupole instruments has a lower mass unit resolution meaning the separation
of ions with very similar m/z can be difficult. It is also a not multi-channel instrument, and
therefore cannot analyze every incoming ion simultaneously.

14
Time of flight (TOF) mass spectrometry
The TOF- MS is a high- resolution (HR) mass filter, meaning that ions with very similar
masses can be separated. The principle behind the TOF is that a population of ions is
accelerated with the same kinetic energy; the ions with the lower mass will have greater
velocity when travelling and therefore reach the detector faster than the ions with a greater
mass. Each ion with a particular m/z ratio will then have a unique time of flight. Even though
the exact same energy is applied to the ions, minor differences in initial kinetic energy will
occur due to position of the ions etc. That is why a reflector, called the reflectron, is used to
compensate for these differences [14]. The reflectron will focus the beam as it redirects the
ions towards the detector. When the ions strike the detector, their mass-dependent flight time
will be recorded and the instrument can calculate the mass. This technique can be more
accurate in terms of separation than the quadrupole because it will provide a higher resolution.
It also means that the instrument can detect all ions that are being produced by an ionization
event, due to the separation by time-of-flight, and therefore has a so-called multi-channel
advantage. For this project separating compounds with similar mass is crucial. The aim is to
detect potential unknown natural compounds in a complex mixture of other similar
compounds. To achieve this one is depended on an instrument with high resolution to separate
these compounds. By using the TOF-MS it is possible to separate the compounds and
determine their exact mass, and in turn calculate the elemental composition.
Figure 2: ESI-TOF MS with double reflectors, illustration provided by Waters Corporation.

15
Data processing (MarkerLynx)
The UPLC-HR-MS analysis supplies a lot of information and it generates a vast amount of
data to process, therefore an efficient processing tool is needed. MarkerLynx is a post-
acquisition processing package that can be applied to MS and LC/MS data files. Its operation
can be divided into three steps where the first is detecting chromatographic peaks. The second
step is organizing the results in a table, and the last step is conducting principal components
analysis (PCA). This is a multivariate statistical approach that facilitates the identification of
differences or similarities between groups. The MarkerLynx identifies peaks and builds a
results matrix of exact mass, retention time (EMRT) and intensity pairs. The PCA allows us to
identify the EMRTs that are responsible for dissimilarities in the samples.
Nuclear magnetic resonance spectroscopy (NMR)
When determining the molecular structure of a novel compound the use of NMR is crucial. It
is a non-destructive analytical method that is based on the magnetic spin in the nucleus of
magnetically active elements and NMR provides information about the molecular bond
network and about conformation and configuration that cannot be acquired with other
methods for structure elucidation. In a NMR spectrometer the sample is placed in a static
magnetic field making all the active nuclei in the sample spin with a frequency from 60 to
1000 MHz, depending on the strength of the magnetic field (in this project the instrument
used operated at 599.934 MHz for 1H). The sample is then irradiated by radiofrequency
pulses. This causes the orientation (the spin) of the protons in the nucleus to change, and thus
change their energy levels, which in turn is measured by the 1H-NMR [15]. The spectrum
that the NMR provides is absorption of energy as a function of frequency, often referred to as
resonance frequency. The radiofrequency pulses perturb the spins of all nuclei and rotate them
out of plane. When the pulses are turned off, the spins slowly return to equilibrium by a
rotating motion that is recorded by a detector in the instrument and converted to a readable
spectrum. For the spectrum to have more than one single peak for all the protons a compound,
it is necessary to be able to tell them apart from another. This is possible because every proton
in a molecule is shielded by its electron cloud, which density will differ depending on the
chemical surroundings. Meaning the degree of shielding of a proton will depend on the
inductive effect of other groups attached to the carbon atom. The NMR instrument will
exploit this effect and measure the difference in the resonance frequency of a particular proton
from the resonance frequency of a reference proton. These measurements are called the
chemical shift of the particular nuclei, labeled as δ or with the unit ppm and are independent

16
of the spectrometers operated frequency [16]. This explains how the NMR can give
information about the number of H in a compound and by using the chemical shift values it
can give indirect information about other possible elements the carbon is attached to.
Therefore it can indicate element composition, especially when the molecular weight has been
established in prior experiments. However, to determine the molecular structure it is also
necessary to know how the “building blocks” are put together. Different radiofrequency
pulsing schemes will produce different kinds of NMR experiments in one or more
dimensions. HSQC (Heteronuclear Single-Quantum Correlation) and HMBC (Heteronuclear
Multiple-Bond Correlation) are 2D Heteronuclear experiments that are often acquired
together to provide information. HSQC demonstrates correlation between two different nuclei
separated by one bond, for example, where each unique proton coupled to a carbon has a
peak. The HMBC will show correlations between protons and carbons over a longer range
approximately 2-4 bonds. Another technique often used is COSY (Correlation Spectroscopy).
This is a 2D homonuclear experiment that uses 2-3 bonds 1H-1H correlations (“neighbor-
hydrogen”) to reveal which protons are located on neighboring carbons in the molecule.

17
Marine Sponges
In this project, marine sponges were chosen to test if it was possible to use metabolomics to
search for unique and novel compounds from the sponges extract. Marine sponges are animals
of the phylum Porifera (meaning "pore bearers") and are sessile metazoans (multicellular
immobile animals).The sponges comes in many different shapes and sizes, the smallest is only
2 millimeters high, while others can become more than 2 meters in height/diameter. They are
the most primitive of the multicellular organisms, with no actual tissue or organs and they
lack nervous, digestive and circulatory systems. Instead, the marine sponges rely on water
flowing through their pores to obtain oxygen, nutrients and to dispose of waste. With their
complex cell types and their symbiosis with a great number of bacteria, they have developed a
very efficient defense system against harmful bacteria, fungi and virus [17]. Research show
that several bioactive compounds previously thought to be of animal origin may be produced
by their symbiotic microorganism instead [5]. It is this complex defense system that has
awakened scientific interest and it represents a great possibility for new drug leads [17]. It is
also the reason why, in addition to the fact that sponges are the foremost providers of marine
bioactive compounds, two related species of the organism has been selected for this project
[8].

18
Geodia barretti
Geodia barretti is a large, globular sponge in the class Demospongiae. Their normal size is 30
cm in diameter, but they can grow up to 50 cm in diameter and weigh up to 24 kg. They are
light brown or grey in color and the smooth surface is only broken by a few large pores
(osculum). The sponge is found in the north-east Atlantic Ocean, on the north side of
Spitsbergen, by the coast of Greenland and on the south coast of northern Spain [17].
As previously mentioned marine sponges have an efficient chemical defense system, which is
sorely needed for the immobile organisms to keep their surface free from fouling organisms.
One of G. barretti`s defenses is the compound barettin, which has previously been proven to
have anti-fouling properties [18]. This compound has also showed antioxidant activity as well
as anti-inflammatory activity in biochemical assays and cell assays, and the combination of
these two properties are of interest as drug leads. For instance as treatment of cardiovascular
diseases such atherosclerosis, for which there are no direct targeting treatment in western
medicine today (with the exception of cholesterol lowering drugs) [19].
Figure 3: The picture shows the marine sponge Geodia barretti. Photo: © Sten-Richard Birkely, Marbank/IMR

19
Geodia macandrewii
Geodia macandrewii is another marine sponge in the class of Demospongiae that resembles
G. barretti. These two sponges are equal in size, but G. macandrewii has got a more
symmetrical shape and the osculus are usually located on a flattened top of the sponge. It
thrives in deeper waters (below 150 meter) but can occasionally be found in the shallow
waters (depth 20 meter) in the fjords [17]. The close relations to G. barretti makes the sponge
interesting since its “cousin” has known bioactive metabolites, it could mean G. macandrewii
also contains or produce metabolites with similar properties.
Figure 4: Marine sponge, Geodia macandrewii. Photo: © Erling Svensen

20
The aim of the thesis
The aim of this project was to use metabolomics to investigate organic extracts from two
marine sponges, one with known bioactive metabolites and one closely related to the first one
for potential novel and unique compounds. If possible the molecular structure of novel
compounds would be determined and tested for antioxidant and antibacterial activity, as well
as kinase inhibiting properties.
MabCent-SFI
The project was carried out at MabCent-SFI, which is a centre for research-based innovation
on marine bioactives and drug discovery. It was established by the Research Council of
Norway in March 2007 and is hosted by the University of Tromsø. Here scientists within
MabCent have focused their efforts on the study of marine organisms inhabiting the Arctic
waters with the long term goal of novel drug discovery and development. In the Mabcent-SFI
program, Marbank collects and stores marine organisms for further taxonomy studies and
extract production. Purification, screening and identification of bioactive compounds are
performed by the analytical platform Marbio. Here they screen for novel bioactivities against
bacteria, viruses and tumours as well as antioxidant, anti-diabetics, immunostimulants and
anti-inflammatory activities. Over 260 000 screenings have been performed so far and in
cooperation with four commercial partners, Mabcent-SFI has identified and characterized the
structure of more than 40 bioactive molecules, out of which 2 have been patented [20].

21
Materials and methods
Sampling and storage
Table 2: Date, depth and location of the sampling of G. Barretti and G. Macandrewii
Species Sampling
date
Location Depth
(meter)
Labelling
G. barretti
11.05.13 Saltfjorden, Nordland 127 1
G. barretti
11.05.13 Bliksvær, Nordland 125 2
G. barretti 13.05.13 Lekshammeren,
Trondheimsfjorden
193 3
G. barretti 14.05.13 Borgenfjorden,
Trondheimsfjorden
246 4
G. macandrewii 11.05.13 Bliksvær, Nordland 127
5
G. macandrewii 09.05.13 Saltfjorden, Nordland 129 6
All the biomass samples were stored at -22ºC in the dark.
Extractions of G. baretti and G. macandrewii
Materials used
DCM (≥99.8 %, Sigma-Aldrich, St. Louis, MO, USA)
MeOH (≥99.9 %, Sigma-Aldrich, St. Louis, MO, USA)
MilliQ water (Millipore, Billerica, MA, USA)
Equipment used
A11 Basic grinder (IKA Works, Staufen, Germany)
Centrifuge: Heraus Multifuge 3 S-R (Hanau, Germany)
Freeze-drier: Heto PowerDry PL9000 and Heto PowerDry PL6000 (Thermo Fisher Scientific,
Waltman, MA, USA)
Mortar and pestle: MTC Haldenwanger (W.Haldenwanger Technische Keramik, Berlin,
Germany)
Rotary evaporator: Heidolph Laborata 4002 (Nürnberg, Germany)
Scale: Mettler Toledo PB3002-S Fact ( Greifensee, Switzerland)
Whatman filter paper 125 Ø (no.3) (Springfield Mill, England)

22
Sample preparation
The sponges were cut into approximately 1 cm3 pieces while still frozen before transferring
the material to Pyrex dishes. The dishes were covered with perforated aluminium foil and
freeze-dried for 2 days.
Aqueous extraction
The freeze-dried sponges were pulverized and transferred to tared 1 L Duran bottles and
weighed. The material was then transferred to 0.6 L centrifuge bottles and MilliQ water was
added, approximately ten times the weight of the dry weight of the material, and shaken until
the suspension got a slurry consistency. The extraction was performed at 5ºC to minimize the
risk of bacterial decomposition of the compounds and to maintain sample stability. The
suspension was centrifuged at 3400 g, at 5ºC for 30 minutes. The water supernatant was
transferred to Pyrex dishes and the pellet re-extracted with MilliQ water, approximately half
of the amount used in the first round but enough to give the suspension the slurry consistency.
The suspension was shaken and put in the refrigerator for a minimum of approximately 40
minutes before it was centrifuged again at 3400 g, at 5ºC for 30 minutes. After the
centrifugation the supernatant was first transferred to Pyrex dishes, and then the pellet was
transferred to separate Pyrex dishes. All the dishes were covered with perforated aluminium
foil and stored at -22ºC until freeze-drying. The water extracts were frozen at -80ºC for 30-45
minutes before freeze-drying for 3 days. The material was grinded with mortar and pestle,
transferred to 50 ml centrifuge tubes and stored at -22ºC.
Organic extract
The freeze-dried pellet left over from the aqueous extraction was grinded and transferred to
tara 1 L Duran bottles before extraction with the solvent mixture DCM-MeOH (1:1, v/v),
approximately ten times the weight of the material, until the suspension got a slurry
consistency. The suspension was stored in the refrigerator until the next day when it was
vacuum filtrated with Whatman filters. Afterwards the solid material was transferred back
into the Duran bottle and re-extracted with the solvent mixture DCM/MeOH (1:1, v/v),
approximately half of the amount used in the first round but enough to give the suspension the
slurry consistency. The suspension was shaken and stored in the refrigerator for
approximately 40 minutes before repeating the filtration process. The filtrate was then
concentrated to 10-20 mL using a rotavapor before transferred to a 50 ml round flask and
evaporated under reduced pressure in the rotavapor until dry and stored at -22ºC.

23
Preparation of the samples for MS analysis
Materials used
MeOH (≥99.9 %, Sigma-Aldrich, St. Louis, MO, USA)
Approximately 150 mg of the organic extract from each of the samples was dissolved in
sufficient amount of MeOH to achieve 100 mg/ml of sample.
Table 3: Amount of organic extract dissolved in amount of MeOH and the concentration of the solution.
Organic extract (mg) MeOH (mL) Sample concentration (mg/mL)
150,1 1,501 100
150,2 1,502 100
150,6 1,506 100
151,2 1,512 100
150,3 1,503 100
151,2 1,512 100
UPLC-HR-MS analysis
Materials used
ACN (≥99.8 %, Sigma-Aldrich, St. Louis, MO, USA)
Formic Acid (98.0%, Sigma-Aldrich, St. Louis, MO, USA)
MeOH (≥99.9 %, Sigma-Aldrich, St. Louis, MO, USA)
MilliQ water (Millipore, Billerica, MA, USA)
Equipment used
Acquity UPLC ® BEH, 2.1×100 mm, 1.7 µm column (Waters, Milford, MA, USA)
Waters Acquity UPLC
Waters LCT Premier detector
Mobile phases:
A: 0.1 % formic acid in Milli-Q water
B: 0.1 % formic acid in acetonitrile

24
Table 4: Gradient used for UPLC-HR-MS analysis
Time Flow (mL/min) % A % B
Initial 0.6 90 10
10 0.6 0 100
12 0.6 0 100
13 0.6 90 10
Injection volume: 100 µL
Each sample was injected 6 times.
Instrument parameters
Polarity: ES+
Analyser: W Mode
Capillary (V): 2600.0
Sample Cone (V): 50.0
Desolvation Temp (C): 300.0
Source Temp (C): 120.0
Cone Gas Flow: 5.0
Desolvation Gas Flow: 500.0
MarkerLynx processing parameters
Mass: 150-1500 Da
Marker treshold: 500 counts
Retention time window: 0.2 minutes
Mass window: 0.1 Da
The program was set to de-isotope, meaning it would remove signals from common isotopes
such as 13C.
The MarkerLynx analysis detected a potential novel compound that was labelled MBC-169 in
sample 5 and 6. Therefore, MBC-169 had to be isolated and sample 5 was the chosen sample.

25
Preparation of sample 5 for HPLC isolation of MBC-169
Materials used
ACN (≥99.8 %, Sigma-Aldrich, St. Louis, MO, USA)
Formic Acid (98.0%, Sigma-Aldrich, St. Louis, MO, USA)
Hexane (≥99.8 %, Sigma-Aldrich, St. Louis, MO, USA)
MilliQ water (Millipore, Billerica, MA, USA)
Rotary evaporator: Heidolph Laborata 4002 (Nürnberg, Germany)
4.0031 g of the organic extract was dissolved in 200 ml hexane, and subsequently liquid-
liquid extracted twice with 100 ml 90% ACN. Under the first liquid-liquid extraction there
was a slight problem separating the two phases when the ACN phase also showed a cluster of
particles due to saturation. This was removed and added 50 ml ACN and shaken until the
particles was dissolved and the ACN phases was then combined before the second liquid-
liquid extraction. Both phases were collected and concentrated using a rotavapor, the hexane
phase until dryness and the ACN phase to approximately 10 ml. The hexane phase was then
stored in the freezer and the ACN phase was used in the continued process. 1 ml of sample
from the ACN phase was then added 2 ml MeOH and used in HPLC isolation.

26
1st HPLC isolation of MBC-169
Materials used
ACN (≥99.8 %, Sigma-Aldrich, St. Louis, MO, USA)
Formic Acid (98.0%, Sigma-Aldrich, St. Louis, MO, USA)
MeOH (≥99.9 %, Sigma-Aldrich, St. Louis, MO, USA)
MilliQ water (Millipore, Billerica, MA, USA)
Equipment used
Atlantis ® Prep C18, 10 µm, 10×250 mm column
Freeze-drier: Heto PowerDry PL9000 (Thermo Fisher Scientific, Waltman, MA, USA)
Rotary evaporator: Heidolph Laborata 4002 (Nürnberg, Germany)
Software: MassLynx 4.1
Waters 600 Controller (Milford, MA, USA)
Waters 2996 photodiode array detector
Waters 3100 mass detector
Waters 2767 sample manager
Waters flow splitter
Waters prep degasser
Waters 515 HPLC pump
Mobile phases:
A: 0.1 % formic acid in Milli-Q water
B: 0.1 % formic acid in acetonitrile
Make-up pump solution: 80 % aqueous MeOH w/ 0.2 % formic acid
The make-up pump maintains the flow from the splitter necessary to provide a stable signal.
Wash solution 1: 5 % MeOH in Milli-Q water
Wash solution 1: Acetonitrile
Injection volume: 250 µL
27
Conditions:
Polarity: ES+
Source Temp (C): 120
Desolvation Temp (C): 300
Desolvation Gas Flow (L/hr): 650
After 7 injections attempting to adjust a linear gradient which could isolate the compound in
best way possible without succeeding, an isocratic gradient was chosen consisting of 65 %
mobile phase B and 35 % mobile phase A to the continued isolation.
All the collected fractions were transferred to a round-bottomed flask and concentrated in the
rotary evaporator before being transferred to a glass tube and freeze-dried for 48 hours.
2nd HPLC isolation of MBC-169
Materials used
ACN (≥99.8 %, Sigma-Aldrich, St. Louis, MO, USA)
Ammonium bicarbonate (Sigma-Aldrich, St. Louis, MO, USA)
Formic Acid (98.0 %, Sigma-Aldrich, St. Louis, MO, USA)
MilliQ water (Millipore, Billerica, MA, USA)
The same set-up from the first isolation was used for the second isolation but with a different
method where the mobile phase and the gradient were changed.
Mobile phases:
A: Aqueous phase with buffer
B: 0.1 % formic acid in acetonitrile
Mobil phase A: 1.58 g of ammonium bicarbonate was dissolved in 2 L Milli-Q water and the
pH adjusted with formic acid to 7.8.
Make-up pump solution: 80 % aqueous MeOH w/ 0.2 % formic acid
Wash solution 1: 5 % MeOH in Milli-Q water
Wash solution 1: Acetonitrile

28
Table 5: Gradient used for isolation of MBC-169
Time Flow (mL/min) % A % B
Initial 6 55 45
10 6 45 55
11 6 0 100
15 6 0 100
16 6 55 45
Injection volume: 100 µL
Afterwards all of the tubes containing the isolated compound were transferred to a round-
bottomed flask and concentrated in the rotary evaporator before being transferred to a glass
tube and freeze-dried for 24 hours.
H1-NMR-analysis
Johan Isaksson at Smallstruct, the Department of Chemistry at the University of Tromsø
performed this procedure and interpretation of data.
The NMR data was acquired on a Varian (now Agilent) Inova spectrometer operating at
599.934 MHz for 1H, equipped with a cryogenically enhanced inverse triple resonance probe
(HCN).
Data & software: All data was acquired using VnmrJ 3.2A and chempack 6, using standard
pulse sequences, where applicable, gradient- and adiabatic pulse- versions with homospoils
between scans were utilized. For heteronuclear experiments, BIP versions with gradient
selection and sensitivity enhancement were used. All spectra processing and spectra
simulations were made in Mnova 8.1.2.

29
Cellular Antioxidant Activity Assays
Materials and equipment used
2, 7 dichlorofluorescin diacetat (DCFH-DA, Sigma-Aldrich, St.Louis, MO, USA)
AAPH (Cayman)
Bodipy ® 581/591 C11 (Lipid peroxidation Sensor, Invitrogen)
Bürkes Countingchamber
CumOOH (Sigma-Aldrich, St.Louis, MO, USA)
DMSO (99.5 %, Sigma-Aldrich, St.Louis, MO, USA)
Ethanol (EtOH, 96 % Sigma-Aldrich, St.Louis, MO, USA)
Fetal Bovine Serum (Biochrom)
Growth medium (GM): E-mem (Biochrom) with 10 % FBS, 500 mL:
- Gentamycin 500 µL
- NEA 5 mL
- Sodium Pyruvate 5 mL
- L-Alanyl-glutamin 5 mL
- FBS 50 ml
Hank`s saline solution (Biochrom)
Heidolph Incubator 1000 (VWR International)
Luteolin (Cayman)
Milli-Q water (Millipore, Billerica, MA, USA)
Microscope
Microtiter plates; black 96-well plates with optical bottom (Costar, Cornings)
Multichannel pipette
Phosphate buffered saline solution (PBS)
Shaking apparatus: Edmund Bühler GmbH SM 30
Treatment medium without FBS
- Same as growth medium, only without FBS
Trypan blue (VWR International)
Trypsin (Gibco, NY, USA)
Victor 3 Multilabel Counter (Perkin Elmer, Waltham MA, USA)

30
Cell splitting and seeding
HepG2- cells are humane hepatocellular cells from a 15 year old boys liver tissue. The cells
are epithelial, chromosome no.55.
Phosphate buffered saline solution (PBS) and treatment medium (TM) were preheated to 37ºC
in the incubator, and trypsin to room temperature. The cells were inspected in a microscope to
ensure a healthy cell population before the cell medium was decanted and 10 mL PBS was
added to the cell layer. The container with cells and PBS was gently tilted from side to side to
make sure all the cells were washed before the PBS was pipetted out. 4 mL trypsin was added,
the container tilted from side to side to cover the cells with trypsin and then the surplus of
trypsin was poured out carefully to avoid loss of cells. The container was incubated at 37ºC
for 5 minutes and inspected in the microscope to ensure that the cells had unlatched from the
surface of the container. Then 20 mL growth medium (GM) were added and the suspension
was resuspended several times to avoid the cells to clump together. In order for the cells to be
counted 200 µL of the cell suspension was added to 200 µL of Trypan blue and mixed
together. 10 µL was put in a Bürkes counting chamber and counted under the microscope.
From the grid, the cell numbers in 5 squares were counted and the average from those 5 was
used to calculate cells/mL:
2 (adjusting for trypan blues contribution) x no. cells counted x 104
The formula used to calculate cell concentration:
C1 x V1 = C2 x V2
C1 = concentration of cells in the suspension till this point
V1 = the unknown volume
C2 = desired concentration of cells (CAA = 80 000 cell/well, CLPAA = 90 000 cell/well)
V2 = desired volume of cell suspension
The suspension was then again suspended several times before transferred to the plates, 100
µL to each well. The plates were then incubated over 24 hours in 37ºC and 5 % CO2.

31
Cellular Antioxidant Activity (CAA) Assay
1st screening:
PBS and TM were heated up (10 mL for each plate). The cells were inspected in a
microscope. A healthy cell population will form peninsula shapes and cover most of the
bottom of the wells with little space between each cell. If the cells are circular and far apart,
the cells are damaged and cannot be used in this assay. Cell medium from the day before was
removed from the cells using a vacuum pipette. The pipetting was done carefully to avoid
damage or loss of cells. TM with DCFH-DA was made immediately prior to use. 15.6 µL of
DCFH-DA was added to 10 mL TM (for each plate). The wells were then washed with 100
µL PBS. 20 µL of the compound being tested were added to four wells, 80 µL TM was added
to the same wells and to the control wells. The rest of the wells not containing the compound
being tested for this thesis are being used to test other compounds by Mabcent with slightly
different concentrations (5 µL of a given test compound and 95 µL TM). 20 µL of the known
antioxidant Luteolin (250 µL/mL) were added to four wells, also 20 µL MQ-H2O to the (+)
and (-) controls. The plates were then incubated for 1 hour at 37ºC and 5 % CO2. See table #
for a schematic set up.
Reading:
The instrument was set to 37ºC. A 600 µM AAPH in Hank`s solution was prepared (30 µL
AAPH was added to 10 mL Hank`s for each plate). The cell medium added an hour earlier
was then removed with a vacuum pipette and the plate washed with 100 µL PBS. 100 µL of
Hank`s was added the negative control wells (-). Then 100 µL of the prepared Hank`s with
AAPH was added to all the remaining wells. Fluorescence was measured at 485/520 nm in
Victor plate reader with 12 readings every 240th second. The plates were then incubated for 1
hour at 37ºC and 5 % CO2 and the absorbance was measured again.
Cellular Lipid Peroxidation Antioxidant Activity (CLPAA) Assay
C11-BODIPY were dissolved in DMSO to 6.25 mM and stored in -80ºC prior to the
experiment. Immediately prior to use 15.9 µL BODIPY (6.25 Mm) was added 11 mL TM,
which resulted in 10 µM concentration on the plate. The CumOOH was also prepared
immediately prior to use as following; 10 µL 6M CumOOH was added to 590 µL 70% EtOH.
Then diluted to 50 µM by adding 5 µL 0.1 M CumOOH to 9995 µL Hanks.

32
1st screening:
PBS and TM were heated up (11 mL for each plate). The cells were inspected in a
microscope. (A healthy cell population will form peninsula shapes and cover most of the
bottom of the wells with little space between each cell. If the cells are circular and far apart,
the cells are damaged and cannot be used in this assay). Cell medium from the day before was
removed from the cells using a vacuum pipette. The pipetting was done carefully to avoid
damage or loss of cells. Then the wells were washed with 100 µL PBS. TM with 10 µM C11-
Bodipy was made immediately prior to use. 100 µL TM with Bodipy was added to the control
wells and then the plates were incubated 37ºC and 5 % CO2 for 30 minutes to enable the cells
to absorb the fatty compound Bodipy. Afterwards the TM was removed from the wells with a
manual pipette. 80 µL of TM without Bodipy was added to all the sample wells, and 80 µL of
TM without Bodipy was added to the control wells. 20 µL of the compound being tested were
added to four wells. (The rest of the wells not containing the compound being tested for this
thesis are being used to test other compounds by Mabcent). 20 µL Luteolin (250 µL/mL) were
added to four wells, also 20 µL MQ-H2O to the (+) and (-) controls. The plates were then
incubated for 1 hour at 37ºC and 5 % CO2. See table # for a schematic set up.
Reading:
The instrument was set to 37ºC. A 50 µM CumOOH in Hank`s solution was prepared.
The cellmedium added earlier was removed with a pipette and the plate was washed with 100
µL PBS. 100 µL of the prepared Hank`s with CumOOH was added to all the wells except the
four control wells, where 100 µL of Hank`s without CumOOH was added. Fluorescence was
measured at 590/632 nm in a Victor plate reader (CW-lamp at 10 000) for red fluorescence
with a reading every 3rd minute for an hour, 21 readings total. Followed by a new measuring
at 485/520 nm (CW-lamp at 20 000) for green fluorescence also every 3rd minute for an hour.

33
Table 6: Assay set up for CAA and CLPAA. The outer wells were not used for the samples due to edge effect.
Negative controls are marked with (-), positive controls with (+). The known antioxidant Luteolin were marked
(L). Compounds tested for this thesis: (C) and the rest marked (X) were compounds tested by MabCent.
C X X X X X X X - -
C X X X X X X X - -
C X X X X X X X + +
C X X X X X X X + +
X X X X X X X X L L
X X X X X X X X L L
Kinase RR-analysis: PKA and ABL inhibition testing
Materials and equipment used
ABL (ProQinase, Boston, MA, USA)
Centrifuge: Heraeus multifuge 1 S
Dithriotreitol (DTT, Sigma-Aldrich, St.Louis, MO, USA)
DMSO (99.5 %, Sigma-Aldrich, St.Louis, MO, USA)
Glasscontainer
Kinase RR-kit (Biothema)
Milli-Q water (Millipore, Billerica, MA, USA)
Peptidsubstrate (KEMP-TID, ABL-TID)
Pipettes (10 µL, 100 µL, 1000 µL)
PKA (ProQinase, Boston, MA, USA)
Plates: 384- well plates with flat, white bottoms (Perkin Elmer Optiplate -384)
Shaking apparatus: Edmund Bühler GmbH SM 30
Staurosporin (10 µM, Sigma-Aldrich, St.Louis, MO, USA)
EnVision (Perkin Elmer, Waltham MA, USA)
Controls:
- Blank: No peptidsubstrate (KEMP-TID or ABL-TID) = Inactive mix + Milli-Q water
- Control: Active mix + Milli-Q water
- Positive control: Active mix + 1 µM staurosporin

34
MBC-169 was already dissolved in 100% DMSO to 10mg/mL. It was diluted to 500 µg/mL,
250 µg/mL and 5 µg/mL, making the concentration in the wells 100 µg/mL, 50 µg/mL and 1
µg/mL. 5 µL of each concentration was added to individual wells on the plates (one plate for
PKA and one plate for ABL). The master mix was prepared according to the Kinase RR- kit.
The content is presented in table 7.
Table 7: PKA- and ABL- master mix
PKA- master mix
ABL-master mix
7500 µL Kinase RR-buffer
7500 µL Kinase RR-buffer
1200 µL ATP-reagent-SL
1200 µL ATP-reagent-SL
37.5 µL 0.4 M DTT
37.5 µL 0.4 M DTT
74161 µL Millie-Q water
161 µL Milli-Q water
7.8 µL PKA-enzyme (dilute to 1:10 from stock)
Take out 117.5 µL for blank control
Ad 2.5 µL Milli-Q water for this
19 µL ABL-enzyme
Take out 117.5 µL for blank control
Ad 2.5 µL Milli-Q water for this
184 µL KEMP-TID (KEMP2)-substrate (2 mM)
92 µL ABL-TID-substrate (4 mM)
15 µL of the master mix was pipetted to each well except for the blank controls. The controls
were added as following:
Blank (b): 5 µL Milli-Q water + 15 µL inactive mix were added to well B7, B8 and B9.
Control (c): 5 µL Milli-Q water + 15 µL active mix were added to well D7, D8 and D9.
Positive control (pc): 5 µL staurosporin + 15 µL active mix were added to well F7, F8 and F9.

35
Table 8: Set-up for PKA and ABL inhibition testing, where (x) is MBC-169 and (b), (c), (pc) are the controls.
The shaded wells are used by MabCent to test other compounds.
1 2 3 4 5 6 7 8 9 10 11 12 13 14 15 16 17 18 19 20 21 22 23
A
B b b b
C
D c c c
E
F pc pc pc
G
H x x x
I
J x x x
K
L x x x
M
N
O
P
5 µL of ATP was added to each well before the plates were centrifuged for 1 minute at 190 G,
then shaken for 2 minutes in the minishaker. The plates were read in the platereader.

36
Minimum Inhibiting Concentration (MIC) Assay
Materials and equipment used
Bacteria (ATCC):
- Enterococcus coli
- Enterococcus faecalis
- Pseudomonas aeruginosa
- Streptococcus aureus
- Streptococcus agalactiae
Bloodplate
Brain Heart Infusion (BHI broth, Merck)
Erlenmeyerflask (sterile)
Falcontubes
LB-plates
Microtiterplates
Milli-Q water (sterile, Millipore, Billerica, MA, USA)
Mueller-Hinton (MH broth, Oxoid Ltd)
Multichannelpipette
NaCl, 0.9% (sterile, Sigma-Aldrich, St.Louis, MO, USA)
Loops
Shaking incubator: Heidolph Unimax 1010, Heidolph Inkubator 1000)
Victor 3 Multilabel Counter (Perkin Elmer, Waltham MA, USA)
The sample was diluted until the final concentration on the plate was 50µg/mL.
On the first day bacterial strains were sown from the blood plates to 8 mL growth medium
and incubated in suitable atmosphere overnight. The growth medium was chosen by two
criteria. The first is that it had to be a good growth environment for the bacteria. The second is
that it could not have any influence on the sample being tested.
On the second day 2 mL of the bacterial suspension from day one were transferred to 25 mL
fresh medium for exponential growth. The bacterial suspension was incubated in the shaking
incubator according to table 9. The differences in incubation time in the table are due to
differences in the bacterial strains; some take longer time to go into log-phase and the
incubation time was adapted accordingly. Bacterial growth was sufficient when the turbidity
reached 0.5 McFarland standards (1.0×10⁸ bacteria/ mL).

37
Table 9: Demonstrating incubation time and growth medium for each of the different bacterial strains and the
appropriate bacterial density.
Bacterial strain Growth medium Incubation time Bacterial density
S.aureus MH- broth 2.5 hours 0.5-3×10⁵ CFU/mL (2500-15000 CFU/ well)
E.coli MH- broth 1.5 hours 0.5-3×10⁵ CFU/mL (2500-15000 CFU/ well)
E.faecalis BHI- broth 1.5 hours 0.5-3×10⁵ CFU/mL (2500-15000 CFU/ well)
P.aeruginosa MH- broth 2.5 hours 3-7×10⁴ CFU/mL (2500-15000 CFU/ well)
S.agalactiae BHI- broth 1.5 hours 0.5-3×10⁵ CFU/mL (2500-15000 CFU/ well)
50 µL of sample were added in 4 parallels on the microtiterplates for each strain (the rest of
the places were used for testing of other compounds by MabCent). The different bacterial
strains were placed on different mikrotiterplates, so that each plate only tested one bacterial
strain. The bacterial suspension was diluted, first 1:100 and then 1:10 in the growth medium
before adding 50 µL of the diluted suspension to the plates. To uphold viable cell density, the
bacterial suspension was added within 30 minutes after the standardization. The plates were
incubated for approximately 20 hours at 37ºC.
Table 10: Assay set up for MIC. Positive controls are marked with (P), negative controls with (N). The
compound tested in this thesis is marked (C), and the rest are fractions tested by Mabcent marked (X).
1 2 3 4 5 6 7 8 9 10 11 12
A N X X X X X X X X X X P
B N X X X C X X X X X X P
C N X X X C X X X X X X P
D N X X X C X X X X X X P
E N X X X X X X X X X X P
F N X X X X X X X X X X P
G N X X X X X X X X X X P
H N X X X X X X X X X X P
Controls:
Negative controls: 50 µL growth medium + 50 µL sterile Milli-Q water.
Positive controls: 50 µL sterile Milli-Q water + 50 µL bacterial suspension.

38
Gentamycin was used as control for the set up and for precision between each experiment.
To achieve measurable values of the bacteria the solution was diluted to approximately
1×10²- 1×10³ bacteria/mL. The dilution was done in 0.9% NaCl as following: 1) 1:100, 2)
1:100, 3) 1:10, 4) 1:10. Then 100 µL were plated out from the final dilution in two parallels
on LB-plates and incubated overnight
The plates were read visually, where visual turbidity indicates inactive compound (I). Wells
without visual turbidity indicates inhibition of bacteria and active compound (A). When in
doubt, the compound is set as questionable (Q). A photometric reading using the Victor
platereader was performed, where absorbance units (AU) was used to classify the compound.
AU: < 0.05 = A, AU: 0.05-0.09 = Q, AU: > 0.09 = I.

39
Results
Extractions
The biomass of each sample was weighed before and after freeze-drying and afterwards all
the samples show a far lower dry weight. The dry biomass sample was used for the aqueous
extraction which yielded from 65% to 80% in the samples. The pellet from the aqueous
extraction was freeze dried and used in the organic extraction which yielded from 1.4% to
2.5% in the samples. The exact weight from each step of the extraction for each species is
described in table 11.
Table 11: Sample no. for this project, species, sample location, sample weight, dry weight, yield from aqueous
and organic extraction.
Sample
no.
Species Location Sample
weight (g)
Sample
dry weight (g)
Aqueous
extract (g)
Organic
extract
(g)
1 G. barretti
Saltfjorden, Nordland 2935.70 602.94 405.65 10.1078
2 G. barretti
Bliksvær, Nordland 2081.46 382.29 251.63 6.6433
3 G. barretti Lekshammeren,
Trondheimsfjorden
748.73 164.19 123.36 4.0741
4 G. barretti Borgenfjorden,
Trondheimsfjorden
3381.71 599.46 425.55 13.7616
5 G. macandrewii
Bliksvær, Nordland 2230.52 370.14 239.15 8.6572
6 G. macandrewii
Saltfjorden, Nordland 3490.29 954.52 766.02 14.0362

40
UPLC-HR-MS analysis of sponge extracts
The six samples were analyzed using UPLC- HR- MS to look for novel compounds for
potential drug discovery and the data from this analysis are the base for the metabolic profile
that are presented in this thesis. A chromatogram from each sample is included in the
appendix, see figures 28-33. In all the chromatograms the cluster of peaks eluted after
approximately eight minutes are mostly residue from the plastic containers previously used.
The signals before the eight-minute mark are components of interest and the biomarker
software MarkerLynx was used to analyze the data, so the manual inspection of the data was
kept to a minimum prior to the analysis.
Figure 5: Top chromatogram: G. macandrewii collected in Bliksvær, Nordland 11.05.13.
Bottom chromatogram : G. barretti collected in Saltfjorden, Nordland 11.05.13. ESI in positive mode.
In figure 5 two HR-MS chromatograms from each species are displayed for comparison.
There is a signal with m/z: 419 in both chromatograms, however G. macandrewii with a less
intense signal than G. barretti. The signal m/z: 400 are only present in the G. macandrewii
chromatograms. The other signals in these chromatograms, such as m/z: 496, 466 and 423,
have been analyzed by MarkerLynx and are present in all the samples, although in varied
amounts.

41
Figure 6: Chromatogram of one of the G. baretti samples demonstrating the number of compounds found in an
organic extract from a marine sponge. ESI in positive mode.
In figure 6 a chromatogram from a selected sample is shown to illustrate the amount of
different signals detected from the organic extract of a marine sponge. The rest of the
chromatograms have been normalized to the highest peak, hence the signals that have very
low intensity will not be visible. The potentially unique signals will still be detected and
analyzed by the processing program MarkerLynx.

42
Identification of biomarkers using MarkerLynx
The MarkerLynx with its principal components analysis separates the samples into groups
based on the similarities in their metabolic profiles, which provides an opportunity to pin
point exactly which metabolites that extinguish one sample from another. Three injections of
each sample have been done to compensate for instrument variation, where a data point
represents each injection. The MarkerLynx have been set to de-isotope and common isotopes
such 13C isotopes will not be taken into account during the analysis, however the software is
not sophisticated enough to distinguish all isotopes, such as the ones that occur with
brominated molecules like barettin.
Figure 7: Scores plot of all the samples where; G. barretti collected in Saltfjorden, Nordland = G.baretti,
Nordland 1, G. barretti collected in Bliksvær, Nordland = G.baretti, Nordland 2, G. barretti collected in
Lekshammeren, Trondheimsfjorden = G.baretti, Trøndelag 1, G. barretti collected in Borgenfjorden,
Trondheimsfjorden = G.baretti, Trøndelag 2, G. macandrewii collected in Bliksvær, Nordland = G.macandrewii,
Nordland 1, G. macandrewii collected in Saltfjorden, Nordland = G.macandrewii, Nordland 3
In figure 7 the scores plot describes the samples relationships, comparing similarities and
dissimilarities in the metabolites from the samples organic extract. It is apparent that both the

43
G.macandrewii samples, represented with six data points, are similar to each other in
metabolic profile but differs from the metabolic profile of the G.baretti samples. The
projection and the direction of the G.macandrewii data points from the variable origin
indicate dissimilarities from the G.baretti samples and the two G.macandrewii samples are
therefore placed in one group as shown in figure 7. The G.baretti samples also demonstrate a
similarity in metabolomic composition and are placed in their own group. There is one
G.baretti sample (G.baretti, Nordland 2), represented by three data points to the right in
negative part in figure 7, that differs from the other G.baretti samples, meaning there is
something in that sample that distinguishes it from the others.
Figure 8: Scores plot of Geodia macandrewii collected in Bliksvær, Nordland 11.05.13 and
Geodia barretti collected in Saltfjorden, Nordland 11.05.13.
In order to find the biomarkers responsible for the dissimilarities between the species, two and
two samples have to be compared. A sample of each species collected from the same place at
the same time was chosen for this comparison. In figure 8, the two samples are represented
with three data points each and again the two species are clearly separated from each other.
The variation in the data points from the same species is caused by instrument variation.

44
Figure 9: S-plot of Geodia barretti collected in Saltfjorden, Nordland 11.05.13 in the positive range and Geodia
macandrewii collected in Bliksvær, Nordland 11.05.13 in the negative range.
The S-plot describes the variables relationship but it is also a means for further interpretation
by demonstrating which of the variables are causing similarities and dissimilarities. In the plot
in figure 9 each variable is representing a metabolite from the chosen sample`s organic extract
and the plot describes similarities and dissimilarities in their metabolic profile. The further
away from the variable origin and the cluster of marks the more significant the variable is for
dissimilarity. In this case the G.baretti sample is in the positive range and the variables
marked on the far right is m/z: 419 and m/z: 421. The other two variables on the right,
clustered closely together, are m/z: 421 and m/z: 423. In the negative range is the
G.macandrewii sample and the variable marked to the far left is due to the compound with
m/z: 400. The S-plot confirms that this biomarker makes a considerable contribution to the
differences in metabolic profiles previously demonstrated in the scores plot (figures 7 and 8)
and the compound is subject to bioactivity testing, structure elucidation, and therefore needs
to be isolated.

45
Identification:
The marine sponge G.baretti is known to produce the bioactive compound barettin with
following elemental composition C17H19BrN6O2. To help verify the m/z: 419 as the protonated
molecule barettin, [M+H]+, an isotope spectrum in figure 10 has been used to demonstrate the
different isotopes of the monobrominated compound.
Figure 10: HR-MS isotope spectrum of barettin from the G. barretti sample collected in Saltfjorden, Nordland
11.05.13. ESI in positive mode.
In figure 10, the isotope spectrum shows two signals with similar intensity that are two mass
units apart, m/z: 419 and 421. There are two other signals with lower intensity, m/z: 420 and
422, which are also two mass units apart. The natural occurrence of carbon isotopes
(12C: 98.93% and 13C: 1.07%) and bromine isotopes (79Br: 50.69% and 81Br: 49.31%)
provides a very characteristic isotope pattern when analyzed. The same pattern as displayed in
figure 10 and the connection between isotopes and signals is illustrated in table 12.
Table 12: Connecting the different signals from the spectrum illustrated in figure 10 to different isotopes of
barettin.
Signal (m/z) 419 420 421 422
C/Br isotope 12C/79Br 13C/79Br 12C/81Br 13C/81Br

46
Since barettin is an already known compound, a search in the database was done to compare
retention time. Previously performed experiments at MabCent demonstrated the same
retention time for barettin as the retention time for m/z: 419 in this project. Therefore, it can
be concluded that m/z: 419 is barettin. The structure and exact mass of barettin are illustrated
in figure 11.
Figure 11: Structure of barettin where the exact mass is 418.0753 Da and chemical formula: C17H19BrN6O2.

47
The G. macandrewii samples had a prominent signal at m/z: 400, a signal for a novel
compound that was not present in any of the four G. barretti samples and therefore a target
for further examination. To help verify the m/z: 400 as a protonated molecule (and not an
adduct of another molecule) the spectrum from the UPLC-HR-MS analysis in figure 12 is
used to demonstrate the presence of common adducts often found when using ESI in positive
mode. The m/z: 400 is the protonated molecule [M+H]+ , meaning the actual molecule has a
mass of 399 Da. The less intense signal at m/z: 401 suggest the same molecule`s 13C isotope.
The signal at m/z: 422 is likely the common adduct [M+Na]+ and the m/z: 441 indicates the
acetonitrile adduct [M+CH3CNH]+. Another signal indicating that the m/z: 400 represents an
actual molecule is m/z: 799, which shows a protonated dimer of the molecule, [2M+H]+.
Figure 12: HR-MS spectrum of the compound m/z: 400 from the G. macandrewii sample collected in Bliksvær,
Nordland 11.05.13. ESI in positive mode.

48
The spectrum in figure 13 from the UPLC-HR-MS analysis with ESI in negative mode are
also presented to help verify the m/z: 400 as a protonated molecule of an actual molecule with
399 Da. In negative mode the intense signal m/z: 398 are the deprotonated molecule, and the
m/z: 399 and m/z: 400 represents the 13C isotopes of the same molecule. The deprotonated
dimer of the 399 Da compound with m/z: 797 is also found in the spectrum in figure 13.
Figure 13: HR-MS spectrum of the compound m/z: 400 from the G. macandrewii sample collected in Bliksvær,
Nordland 11.05.13. ESI in negative mode.

49
All of these signals help confirm the m/z: 400 signal as a protonated molecule, the m/z: 398 as
the deprotonated molecule and that these signals represent an actual compound with 399 Da.
The software was used to process the signals from the UPLC-HR-MS analysis with ESI in
negative mode to suggest the elemental composition. Figure 14 displays the results from the
software with suggestions to elemental composition, where C21H36NO4S are ranged as the
most likely elemental composition. This means the actual elemental composition when the
compound is not deprotonated would be C21H37NO4S.
Figure 14: Elemental composition suggestions based on the data from the analysis performed with the UPLC-
HR-MS with ESI in negative mode. The elemental compositions are ranged after percentage of likelihood.
With a probable elemental composition in place, structure elucidation are the next natural step
before bioactivity testing of the compound. In order to determine the structure the compound
needs to be isolated.

50
HPLC Isolation of MBC-169
For the bioactivity testing and structure elucidation the compound had to be isolated. The first
round of purification was not sufficient; it was difficult to get the compound to elute as a
symmetrical peak and instead the peak was broad and asymmetrical. Therefore a second
round of purification was needed in order to obtain a pure compound. Achieving a satisfying
chromatogram with clearly separated signals for MBC-169 was challenging at first and use of
different columns were attempted: XTerra ® Prep RP18, 10 µm, 10×250 mm, XTerra ® Prep
C8, 10µm, 10×250 mm and X-Select CSH ® Prep, Fluoro-phenyl, 5 µm, 10×250 mm,
Atlantis ® Prep C18, 10 µm, 10×250 mm column without a satisfying result. However, when
using the same column as used in the first round of isolation (Atlantis ® Prep C18, 10 µm,
10×250 mm) and changing to a basic mobile phase and thereby changing (pH = 8), the
chromatography improved significantly. The second round of purification therefore had a
better result as the compound eluted in a narrow peak and the signal m/z: 400 were
dominating the fraction collected by the instrument. The HPLC isolation of MBC-169 yielded
14.0 mg after the first round and 0.7 mg after the second round.
Figure 15: Chromatograms from the second round of isolation of the compound. Top chromatogram with ESI in
positive mode and set to show compounds with 400 m/z. The middle chromatogram UV 250-500 nm and the
bottom chromatogram with ESI in positive mode and set to show total ion count (TIC).

51
Structure Elucidation
Figure 16 of the 1H-NMR reveals the number of hydrogen (H) in the compound with the
intensity of the peaks. The chemical shift value ppm indicates the chemical surroundings of an
H, meaning the H with the same ppm have the same chemical surroundings.
Figure 16: One dimensional 1H-NMR specter of the purified compound. The peaks are numbered according to
the structure of MBC 169 and the solvents are indicated. Chemical shift (ppm) is on the x-axis and the peak
intensity is on the y-axis.

52
Figure 17: HSQC superimposed on HMBC. The peaks are numbered according to the structure of MBC 169 and
the solvents are indicated. The HSQC experiment is displayed in red and blue markings, where red = CH and
CH3 groups, and blue= CH2 groups. The HMBC experiment is displayed as black markings. 1H chemical shift
(ppm) is on the x-axis and the 13C chemical shift (ppm) is on the y-axis. HSQC peaks indicate HC pairs coupled
to each other through 1 bond and HMBC peaks indicate HC pairs coupled to each other through 2-4 bonds.

53
Figure 18: Band selective (15-45) ppm) HMBC specter to assign nearly overlapped carbon resonances. The
peaks are numbered according to the structure of MBC 169 and the solvents are indicated. The chemical shift
(ppm) for proton is on the x-axis and the chemical shift (ppm) for carbon is on the y-axis.

54
Figure 19: Band selective (120-140) ppm) HMBC specter to assign nearly overlapped carbon resonances. The
peaks are numbered according to the structure of MBC 169 and the solvents are indicated. The chemical shift
(ppm) for proton are on the x-axis and the chemical shift (ppm) for carbon are on the y-axis.

55
Figure 20: Two-dimensional COSY spectrum where the peaks are numbered according to the structure of MBC
169 and the solvents are indicated. Cross peaks indicate neighboring protons coupled through 2-3 bonds.
To further verify the structure of MBC-169 as illustrated in figure 22, a structure with selected
COSY and HMBC correlations have been made. The 1H- NMR and 13C-NMR assignments of
MBC-169 with HMBC-and COSY correlations are also presented in table 13.
Figure 21: Structure of MBC-169 with selected COSY -and HMBC- NMR correlation indicated. The
blue arrows indicates COSY correlation and the red arrows indicates HMBC correlations.

56
Table 13: 1H- NMR and 13C-NMR assignments of MBC-169 with HMBC- and COSY correlations. The position
of the atoms numbered in the table can be found in figure 22.
Atom no. δ13C (ppm) δ1H (ppm) COSY 1H↔1H HMBC 13C↔1H
1 17.77 0.96 2
2 39.61 2.13 1, 3 1
3 34.00 1.51/ 1.24 2, 4 1, 4
4 25.36 1.86 5 5
5 123.92 5.07 4 4, 7
6 134.52 4, 7, 8, 9
7 15.74 1.54 5, 8
8 39.16 1.93 9 7, 9, 10
9 26.04 2.02 8, 10 8, 10
10 123.92 5.07 9 8, 9, 12
11 134.30 12, 13, 14
12 17.58 1.55 10, 13
13 39.19 1.93 14 12, 14, 15
14 26.19 2.02 13, 15 13, 15
15 124.12 5.07 14 13, 14, 17, 18
16 130.63 14, 17, 18
17 15.84 1.54 18
18 25.52 1.63 15, 17
19 174.77 1, 2, 3, 20, 21
20 7.65 21
21 35.43 3.31/ 3.26 20, 22 22
22 50.65 2.51 21 21
Figure 22: Molecular structure of MBC 169. The atoms numbered correlates to the atoms numbered in table 13.

57
Bioactivity
MBC-169 was tested for bioactivity in four different assays, two assays tested for antioxidant
activity, one for kinase inhibiting properties and one for antibacterial activity.
Antioxidant Activity Assays
Figure 23: Column chart of the CLPAA assay illustrating antioxidant activity with 50 µg/mL MBC-169 and the
control 50 µg/mL Luteolin.
Figure 24: Column chart of the CAA assay illustrating antioxidant activity with 50 µg/mL MBC-169 and the
control 50 µg/mL Luteolin.
In the antioxidant assays the control used was 50 µg/mL Luteolin. As demonstrated in figure
23 and 24 Luteolin show strong antioxidant activity. The negative value for MBC-169 was
-40
-20
0
20
40
60
80
100
120
140
MBC-169 Luteolin
% A
nti
oxid
ant
acti
vit
y
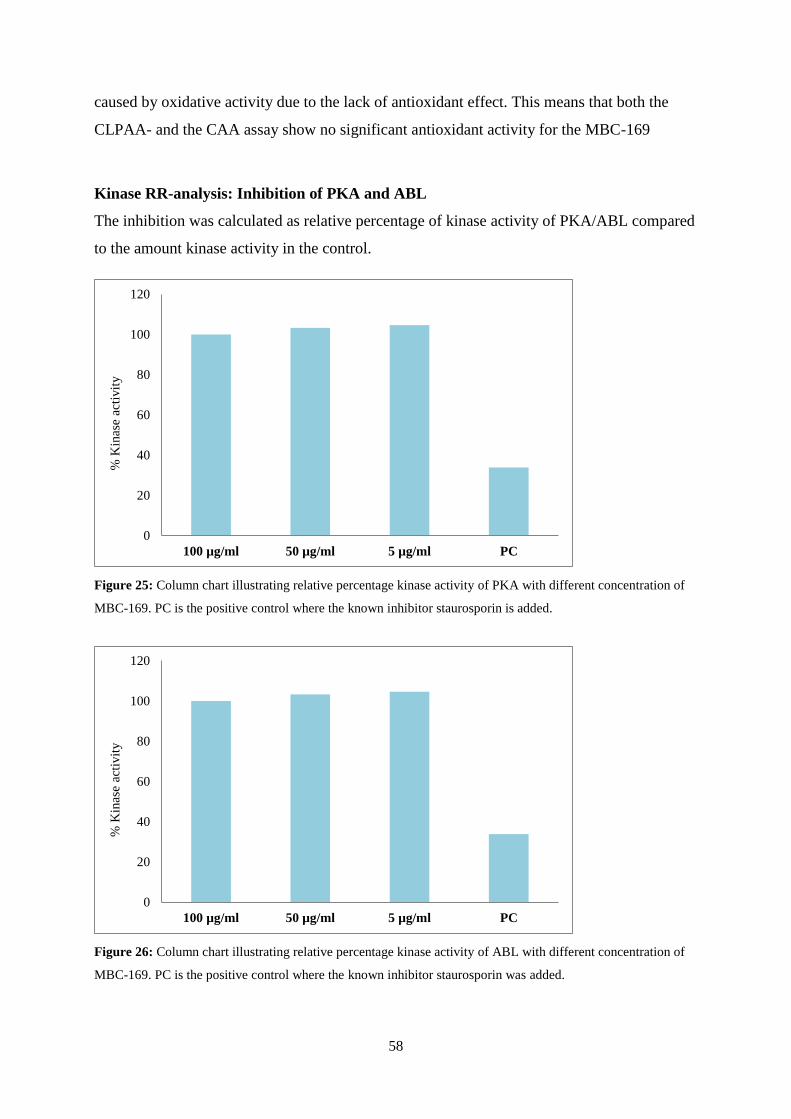
58
caused by oxidative activity due to the lack of antioxidant effect. This means that both the
CLPAA- and the CAA assay show no significant antioxidant activity for the MBC-169
Kinase RR-analysis: Inhibition of PKA and ABL
The inhibition was calculated as relative percentage of kinase activity of PKA/ABL compared
to the amount kinase activity in the control.
Figure 25: Column chart illustrating relative percentage kinase activity of PKA with different concentration of
MBC-169. PC is the positive control where the known inhibitor staurosporin is added.
Figure 26: Column chart illustrating relative percentage kinase activity of ABL with different concentration of
MBC-169. PC is the positive control where the known inhibitor staurosporin was added.
0
20
40
60
80
100
120
100 µg/ml 50 µg/ml 5 µg/ml PC
% K
inas
e ac
tivit
y
0
20
40
60
80
100
120
100 µg/ml 50 µg/ml 5 µg/ml PC
% K
inas
e ac
tivit
y

59
The positive control containing staurosporin show 34 % kinase activity in both column charts
in figure 25 and 26. The MBC-169 demonstrates approximately 100 % kinase activity in all
three concentrations, in other words MBC-169 does not show any kinase inhibition.
MIC
The minimum inhibition concentration assay tests a compounds ability to inhibit growth in
bacterial strains. At MabCent the known antibiotic compound gentamycin is used as a
negative control and for precision between testing. The assay is visually inspected and
absorbance that reflects bacterial density is measured. Since the degree of inhibition will vary
from bacterial strain to bacterial strain the negative control does not have a specific cut-off
value. Instead a cut-off absorbance value that can be applied to all the bacterial strains used by
MabCent have been set. The cut-off absorbance value for being classified as an active
compound is <0.05 absorbance units (AU).
Figure 27: Column chart of the MIC assay illustrating absorbance after overnight incubation of 50 µg/mL MBC-
169 with the following bacterial strains: S.aureus, E.coli, E.faecalis, P.aeruginosa, S.agalactiae.
The column chart in figure 27 illustrates that none of the bacterial strains shows efficient
enough inhibition for the MBC-169 to be classified as an active compound. The E.faecalis
shows 0.21 AU, the E.coli: 0.15 AU, the P.aeruginosa: 0.35 AU, the S.aureus: 0.38 AU and
the S.agalactiae: 0.23 AU. Absorbance at 0.05-0.09 AU is classified as questionable, and
absorbance >0.09 AU is classified as inactive. Since all of the strains show absorbance over
0.09, the MBC-169 (50 µg/mL) is classified as an inactive compound.
0
0,05
0,1
0,15
0,2
0,25
0,3
0,35
0,4
0,45
E.faecalis E.coli P.aeroginosa S.aureus S.agalactiae
Ab
sorb
ance
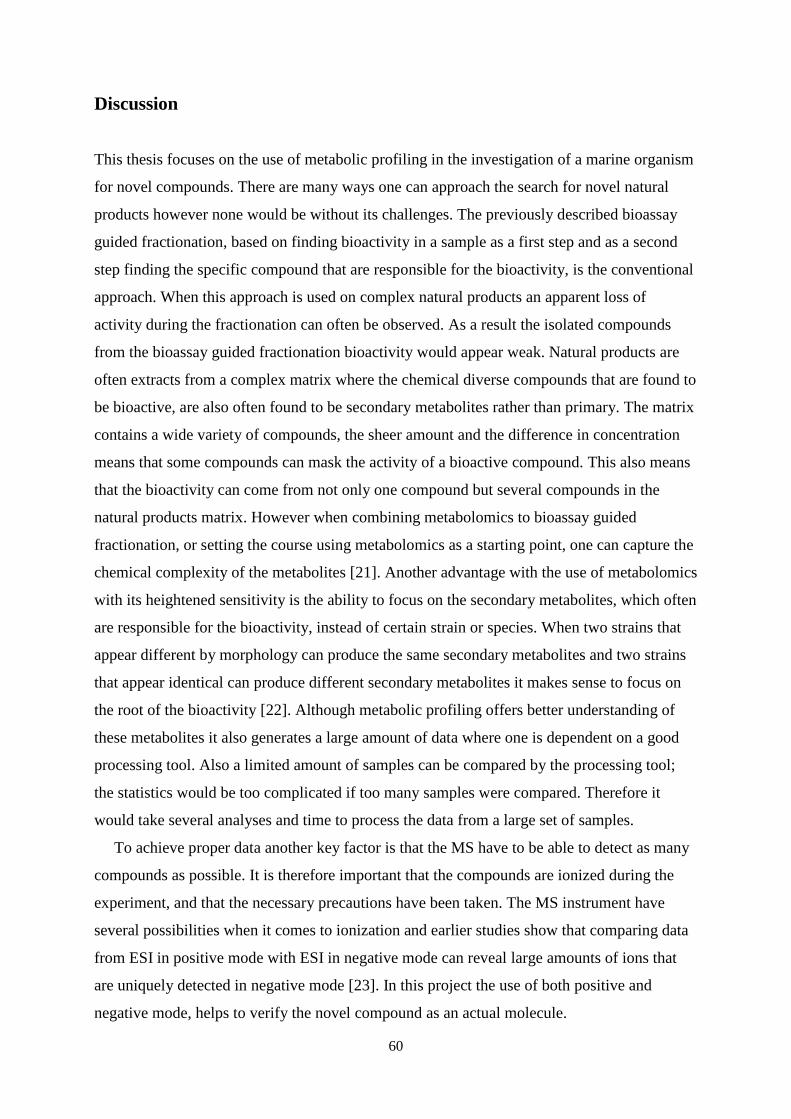
60
Discussion
This thesis focuses on the use of metabolic profiling in the investigation of a marine organism
for novel compounds. There are many ways one can approach the search for novel natural
products however none would be without its challenges. The previously described bioassay
guided fractionation, based on finding bioactivity in a sample as a first step and as a second
step finding the specific compound that are responsible for the bioactivity, is the conventional
approach. When this approach is used on complex natural products an apparent loss of
activity during the fractionation can often be observed. As a result the isolated compounds
from the bioassay guided fractionation bioactivity would appear weak. Natural products are
often extracts from a complex matrix where the chemical diverse compounds that are found to
be bioactive, are also often found to be secondary metabolites rather than primary. The matrix
contains a wide variety of compounds, the sheer amount and the difference in concentration
means that some compounds can mask the activity of a bioactive compound. This also means
that the bioactivity can come from not only one compound but several compounds in the
natural products matrix. However when combining metabolomics to bioassay guided
fractionation, or setting the course using metabolomics as a starting point, one can capture the
chemical complexity of the metabolites [21]. Another advantage with the use of metabolomics
with its heightened sensitivity is the ability to focus on the secondary metabolites, which often
are responsible for the bioactivity, instead of certain strain or species. When two strains that
appear different by morphology can produce the same secondary metabolites and two strains
that appear identical can produce different secondary metabolites it makes sense to focus on
the root of the bioactivity [22]. Although metabolic profiling offers better understanding of
these metabolites it also generates a large amount of data where one is dependent on a good
processing tool. Also a limited amount of samples can be compared by the processing tool;
the statistics would be too complicated if too many samples were compared. Therefore it
would take several analyses and time to process the data from a large set of samples.
To achieve proper data another key factor is that the MS have to be able to detect as many
compounds as possible. It is therefore important that the compounds are ionized during the
experiment, and that the necessary precautions have been taken. The MS instrument have
several possibilities when it comes to ionization and earlier studies show that comparing data
from ESI in positive mode with ESI in negative mode can reveal large amounts of ions that
are uniquely detected in negative mode [23]. In this project the use of both positive and
negative mode, helps to verify the novel compound as an actual molecule.

61
A different issue when using metabolomics to look for novel, bioactive compounds is that the
compounds bioactivity is tested as a “final” step. Therefore the potentially time consuming
task of purification and structure elucidation may result in a novel but inactive compound.
When it came to isolating, or rather purifying, MBC-169 it was not done without
difficulty. The purification was done in two steps. In the first step finding the proper gradient
of mobile phases was an issue, after trying out several different gradients an isocratic one was
chosen. The chromatography was not ideal, with a broad peak for m/z: 400 (MBC-169) and
clearly not completely separated from other compounds in the mixture, still it was better than
other gradients. The column used was a C18 column and the MBC-169 had a long retention
time. To improve the chromatography the use of several different columns with higher
polarity were attempted but none provided a better result. In order to obtain a pure compound
another step of purification was done with a basic mobile phase. The second step was far
more successful, the chromatography showed that the compound MBC-169 eluted in a narrow
peak. One theory could be that this is caused by the MBC-169s chemical properties and more
specifically its change in affinity to the lipophilic material in the column. As illustrated in
figure 22 the compound is made up by a rather large non-polar part and a polar part with two
potentially “chargeable” groups. The non-polar part seemed to have a high affinity to the
column first of all because the compound took a long time to elute. Second, it would also
explain, to some extent why it would not elute in a narrow peak under the first purification
and why the other mobile phase gradients resulted in an even wider peak and a poor
chromatography. As mentioned the polar part consists of two polar groups where one is a
sulfonic acid group (pKa: 0-1 and thereby a relatively strong weak acid [5]) which is likely to
be charged in both steps of the purification. A theory as to why the purification was
problematic is that the other chargeable group, the amide- group (NH) was charged by the
mobile phase in some molecules and an equilibrium between molecules with charged and
uncharged amid-groups occurred. This would result in a wide peak in the chromatogram.
Another, more plausible theory is that the amide-group was not charged in the first step of the
purification. However, when the mobile phase was changed and the pH increased in the
second step, the amide-group was charged and therefore resulted in better chromatography.
Even though a common reason is often different types of interactions between the column
material and a molecule, it is a close to impossible to pinpoint exactly which interaction
caused the improved chromatography in the second step of the purification.
The structure of MBC-169 that might be causing these effects on the chromatography have
got a positive aspect when taking into account that the non-polar part might be able cross

62
membranes in the human body and the polar part might interact with different targets.
Meaning the compound has got druglike qualities. Although, having a druglike structure it
does not necessarily mean the compound is bioactive. The MBC-169 was only bioactivity
tested with a selected handful of assays, where none of them showed bioactivity at an
interesting level. The MIC assay was only tested with MBC-169 50 µg/mL, due to the small
amount left of the MBC-169. However, it could have effect at a higher concentration.
Therefore effect as an antibacterial agent cannot be completely ruled out. Other fields such as
enzymes, immunomodulation, type- II diabetes and anti-inflammation are also being tested at
the moment at MabCent and the MBC-169 could be bioactive within these fields [20].
The dissimilarity in one of the G.baretti samples was caused by different levels of barettin.
The sample that stood out from the rest had a higher level of the barettin compound. Barettin
has previously shown strong antioxidant activity in biochemical assays and in a lipid
peroxidation cell assay [19]. It seems the higher level of barettin in the G. barretti collected in
Lekshammeren, Trondheimsfjorden in the 13th of May in 2013 compared to the other G.
barretti samples is connected to their respective geographic location. Lots of bioactive
compounds are a result of the organism’s natural habitat, secondary metabolites initiated as
defense mediators due to hostile environment [24]. This production might be lowered or
completely stopped when grown in monoculture without competing species or predators
providing a selection pressure. If barettin is to be utilized as a drug in the future obtaining
information about the natural production of barettin could be important. In general it could
prove valuable to know more about which type of environment causes a marine organism to
produce chemical defenses, especially when these defenses also have bioactive properties and
are potential drug leads. With this information one possibility is to cultivate the sponge that
produces barettin instead of collecting it from a remote location. Experiences with cultivation
of an organism in order to obtain its secondary metabolites have shown that recreating the
natural habitat with all of the particular organisms competing species and predators can be a
challenge. Therefore synthesizing barettin seems a far more cost friendly and timesaving
option. Several drugs on the marked today are after all just simple synthetic modifications or
copies of natural product derived secondary metabolites [25].

63
Conclusion and future perspective
The aim of this project was to use metabolomics to investigate organic extracts from two
species of the marine sponge Geodia for unique and potential novel compounds. If possible
the molecular structure of any active compounds would be determined and tested for
antioxidant and antibacterial activity, as well as kinase inhibiting properties. In the extracts
from G. macandrewii a novel compound was discovered. The structure of the compound was
determined and its bioactivity was tested. A handful of assays were selected; cellular
antioxidant activity (CAA), cellular lipid peroxidation antioxidant activity (CLPAA),
minimum inhibiting concentration (MIC) and kinase RR-analysis: PKA and ABL inhibition
testing, but sadly none of the assays displayed the desired bioactivity.
The project has produced a novel natural product and proven that it is not only possible but
also useful to use metabolomics in the search for novel compounds and also to identify which
compounds are responsible for dissimilarities between samples. With the high sensitivity of
metabolomics, one is more likely to avoid missing out on novel bioactive compounds that
resides in a complex matrix. Although the bioactivity testing with MBC-169 did not have
positive results, further testing can be executed. Testing with a higher concentration than 50
µg/mL in the MIC assay and testing for bioactivity in other assays available will probably be
performed in the future. Another finding in this project was the elevated level of the known
bioactive compound barettin in the G. barretti collected in Lekshammeren,
Trondheimsfjorden compared to the other samples, indicating geographical differences of
barettin production. Further investigation of the reasons behind this high level of barettin can
be useful not only to understanding the compound barettin, but also to provide a better
understanding of the environment that causes marine sponges to produce bioactive secondary
metabolites.

64
References
1. Cragg, G.M. and D.J. Newman, Natural products: a continuing source of novel drug leads. Biochim Biophys Acta, 2013. 1830(6): p. 3670-95.
2. Grabowski, K., K.-H. Baringhaus, and G. Schneider, Scaffold diversity of natural products: inspiration for combinatorial library design. Natural product reports, 2008. 25(5): p. 892-904.
3. Rosen, J., et al., Novel chemical space exploration via natural products. J Med Chem, 2009. 52(7): p. 1953-62.
4. Koehn, F.E. and G.T. Carter, The evolving role of natural products in drug discovery. Nat Rev Drug Discov, 2005. 4(3): p. 206-20.
5. Clark, A., Foye`s Principles of Medicinal Chemistry. 2002: Lippincott Williams & Wilkins. 6. Haefner, B., Drugs from the deep: marine natural products as drug candidates. Drug
discovery today, 2003. 8(12): p. 536-544. 7. Fenical, W., et al., Discovery and development of the anticancer agent salinosporamide A
(NPI-0052). Bioorg Med Chem, 2009. 17(6): p. 2175-80. 8. Rocha, J., et al., Cnidarians as a source of new marine bioactive compounds--an overview of
the last decade and future steps for bioprospecting. Mar Drugs, 2011. 9(10): p. 1860-86. 9. Monteiro, M.S., et al., Metabolomics analysis for biomarker discovery: advances and
challenges. Curr Med Chem, 2013. 20(2): p. 257-71. 10. Yuliana, N.D., et al., Metabolomics for bioactivity assessment of natural products. Phytother
Res, 2011. 25(2): p. 157-69. 11. Robertson, D.G. and U. Frevert, Metabolomics in drug discovery and development. Clin
Pharmacol Ther, 2013. 94(5): p. 559-61. 12. Szymanski, P., M. Markowicz, and E. Mikiciuk-Olasik, Adaptation of high-throughput
screening in drug discovery-toxicological screening tests. Int J Mol Sci, 2012. 13(1): p. 427-52. 13. McCloud, T.G., High throughput extraction of plant, marine and fungal specimens for
preservation of biologically active molecules. Molecules, 2010. 15(7): p. 4526-63. 14. Chernushevich, I.V., A.V. Loboda, and B.A. Thomson, An introduction to quadrupole-time-of-
flight mass spectrometry. J Mass Spectrom, 2001. 36(8): p. 849-65. 15. Johnson, A.W., Invitation to Organic Chemistry, ed. A.W. Johnson. 1999, USA: Jones and
Bartlett Publishers. 16. Silverstein Robert M., W.F.X., Kiemle David J., Spectrometric Identification of Organic
Compounds. Seventh ed. 2005: John Wiley and Sons, Inc. 17. Moen, F.E., Dyreliv i Havet: Nordeuropeisk marin fauna. 2008: Kom Forlag. 18. Hedner, E., et al., Antifouling activity of a dibrominated cyclopeptide from the marine sponge
Geodia barretti. J Nat Prod, 2008. 71(3): p. 330-3. 19. Lind, K.F., et al., Antioxidant and anti-inflammatory activities of barettin. Mar Drugs, 2013.
11(7): p. 2655-66. 20. Svenson, J., MabCent: Arctic marine bioprospecting in Norway. Phytochem Rev, 2013. 12: p.
567-578. 21. Inui, T., et al., Unbiased evaluation of bioactive secondary metabolites in complex matrices.
Fitoterapia, 2012. 83(7): p. 1218-25. 22. Hou, Y., et al., Microbial strain prioritization using metabolomics tools for the discovery of
natural products. Anal Chem, 2012. 84(10): p. 4277-83. 23. Nordstrom, A., et al., Multiple ionization mass spectrometry strategy used to reveal the
complexity of metabolomics. Anal Chem, 2008. 80(2): p. 421-9. 24. Dias, D.A., S. Urban, and U. Roessner, A historical overview of natural products in drug
discovery. Metabolites, 2012. 2(2): p. 303-336. 25. Hussain, M.S., et al., Current approaches toward production of secondary plant metabolites.
Journal of pharmacy & bioallied sciences, 2012. 4(1): p. 10.

65
Appendix
Figure 28: HR-MS chromatogram of G. barretti collected in Saltfjorden, Nordland 11.05.13. ESI in positive
mode.
Figure 29: HR-MS chromatogram of Geodia barretti collected in Bliksvær, Nordland 11.05.13. ESI in positive
mode.

66
Figure 30: HR-MS chromatogram of G. barretti collected in Lekshammeren, Trondheimsfjorden 13.05.13. ESI
in positive mode.
Figure 31: HR-MS chromatogram of G. barretti collected in Borgenfjorden, Trondheimsfjorden 14.05.13. ESI
in positive mode.

67
Figure 32: HR-MS chromatogram of G. macandrewii collected in Bliksvær, Nordland 11.05.13. ESI in positive
mode.
Figure 33: HR-MS chromatogram of G. macandrewii collected in Saltfjorden, Nordland 09.05.13. ESI in
positive mode.