instructional delivery system - oklahoma best... · instructional delivery system ospr – best...
TRANSCRIPT

Page 2-1
Chapter 2
Instructional Delivery System
This chapter addresses several areas within the instructional delivery system as reviewed by the
Office of Educational Quality & Accountability in the following sections:
A. Professional Learning Community
B. Curriculum
C. Instructional Delivery and Assessments
D. Student Performance
E. Special Service Programs
F. Student Services
The primary purpose of any school system is educating children. Effective schools deliver
quality instruction based upon a district’s capacity to manage and implement a rigorous, relevant
curriculum. The education process requires robust policies and procedures that direct the
instructional process, provide well-designed programs to meet the needs of all students, and
provide resources to support program implementation. The monitoring and evaluation of
program effectiveness based upon student performance data are also essential.
A. PROFESSIONAL LEARNING COMMUNITY
Through ample educational research over the years, it has been confirmed that when schools and
districts effectively implement professional learning communities (PLC) there is considerable
improvement in student learning as well as adult learning (Annenberg, 20141; Leana, 20112).
Although the PLC concept has been misinterpreted and defined differently in multiple contexts,
OEQA has adopted the definition provided by DuFour, DuFour, Eaker, & Many (2008)3:
PLCs are defined as educators committed to working collaboratively in ongoing
processes of collective inquiry and action research to achieve better results for the
students they serve. Professional learning communities operate under the assumption that
the key to improved learning for students is continuous, job-embedded learning for
educators. (p. 14)
Within the context of this definition, school districts should create the structures for the
successful implementation of PLCs by providing the time, space, expectations, accountability,
and leadership needed for overall school improvement. Research has shown that when the
relationships among teachers in a school are characterized by high trust and frequent
interaction—that is, when social capital is strong—student achievement scores improve (Leana).
DuFour, et al. (2008) suggested six characteristics that contribute to successful PLCs:
1 http://annenberginstitute.org/sites/default/files/product/270/files/ProfLearning.pdf 2 Leana, C. (2011). The Missing Link in School Reform.
http://www.ssireview.org/articles/entry/the_missing_link_in_school_reform/ 3 Dufour, DuFour, and Eaker. Revisiting Professional Learning Communities at Work: New Insights for Improving
Schools, Bloomington, IN: Solution Tree Press, 2008
Instructional Delivery System OSPR – Best Practices
Page 2-2
• Shared vision, mission, values, and goals focused on student learning
• A collaborative culture with a focus on learning
• Collective inquiry into best practice and current reality
• Action orientation – learning by doing
• A commitment to continuous improvement
• Results orientation – based on results rather than intention or assumptions
Creating strong professional learning communities holds several potential advantages for schools
and districts. Among the positive outcomes reported in the research are: increased efficacy, both
collectively and individually; collective responsibility for student learning; reduction in teacher
isolation; substantial learning about good teaching and increased content knowledge; higher
morale, greater job satisfaction, greater teacher retention rates, and enthusiasm (Annenberg,
2004). Based on these findings and the benefits of PLCs, it is important to commend districts
who actively promote these communities in their schools and to support districts that are
involved in the earlier stages of PLC development.
FINDING 2-1
It was apparent to the consulting teams during many performance reviews of the instructional
delivery program that although school staff and administrative staff advocated a collaborative
culture for learning, there were usually no formalized processes in place for an accountable and
effective PLC. Some districts allowed sufficient time for vertical/horizontal collaborative team
meetings or content-specific meetings while others had not prioritized this crucial element of an
effective PLC culture. However, without formalizing the collaborative process by including the
essential structures and tools then the current informal efforts will not produce the critical growth
needed in student achievement and teacher development.
One of the important aspects a school or district should consider in ensuring a productive PLC is
to create structures for the initiative. To accomplish this mission, the school leaders – both
formal and informal – must take the lead on examining what structures are currently in place
and/or not in place to support formalized collaboration among staff. Structural elements that
should be considered to ensure successful implementation may include:
• Values – what we believe and aspire to make happen
• Procedures – expectations, norms, agendas, accountabilities
• Time – specific time delegated weekly for collaborative teams
• Space – designated data rooms, meeting rooms
• Materials – formative assessments, multiple sets of data;
• Technologies – software to support PLC actions
• Human Resources – professional development of teachers and leaders

OSPR – Best Practices Instructional Delivery System
Page 2-3
RECOMMENDATION
School leaders should formalize the PLC collaboration process by incorporating supportive
structures and tools to propel improvement of student achievement and contribute to the
professional growth of teachers.
The district/school leaders must take the lead on examining what structures are in place or not in
place to support the PLC Initiative. In schools reviewed, consulting teams noted some common
values shared by many staffs such as the importance of working together as a commitment to
continuous improvement. Exhibit 2-1 provides the results of one question from a sampling of
archived staff surveys. Teachers were asked if they often collaborate on projects related to the
curriculum. The sampling data conveyed that most, 74 percent, of the staff surveyed were
involved in a collaborative effort as it related to curriculum.
Exhibit 2-1
Sampling of Staff Survey Results Regarding Collaborative Efforts
Survey Questions Agree No Opinion Disagree
Teachers often collaborate on
projects related to the curriculum.
74%
15% 11%
Source: OEQA Sampling from Archived District Surveys 2012-2017
In the past decade there has occurred a deeper understanding of what steps and procedures
should be in place in moving teachers from isolation or even from a collaborative “hit and miss”
approach to a more structured result-oriented event.4 Providing only the element of time for
teachers to meet is not sufficient and will not affect school improvement if the focus is on issues
that do not directly impact student learning. When school leaders consider a procedural approach
that is focused on student learning and purposeful strategies then educators will engage in
collaboration that impacts both students and adult learning.5
Teaching staff should consider developing agreed upon norms that are drafted by the group
(vertical teams or horizontal teams) to follow each meeting. Norms make collaboration and
group meetings more effective by guiding team behavior. Adopting norms enable team members
to hold each other accountable for any behavior that is negatively impacting the success of the
team. Clearly assigned roles and responsibilities help the team build internal capacity for
planning and holding effective and focused meetings.6
Next, there should be an emphasis to facilitate team meetings that are conducted based on best
practices that produce optimal gains for both teachers and students. During reviews it was noted
that some schools had not crafted time or space needed for these collaborative team meetings and
lacked the procedures for successful facilitation. This can be accomplished with implementing
expectations and attainable outcomes for each collaborative team meeting that is guided with a
4 DuFour, et. al., (2008). Revisiting Professional Learning Communities at Work. 5 Ibid 6 http://www.schoolimprovementcoach.org/manual/7%20Norms%20and%20Roles.pdf
Instructional Delivery System OSPR – Best Practices
Page 2-4
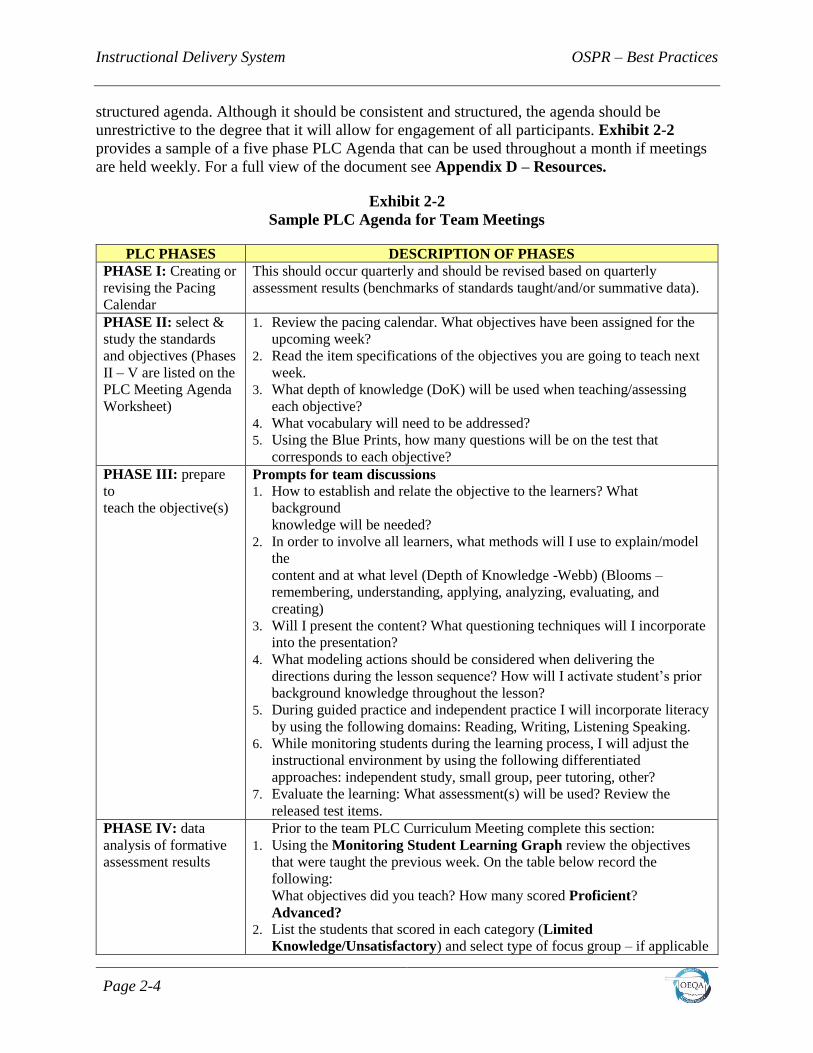
structured agenda. Although it should be consistent and structured, the agenda should be
unrestrictive to the degree that it will allow for engagement of all participants. Exhibit 2-2
provides a sample of a five phase PLC Agenda that can be used throughout a month if meetings
are held weekly. For a full view of the document see Appendix D – Resources.
Exhibit 2-2
Sample PLC Agenda for Team Meetings
PLC PHASES DESCRIPTION OF PHASES PHASE I: Creating or
revising the Pacing
Calendar
This should occur quarterly and should be revised based on quarterly
assessment results (benchmarks of standards taught/and/or summative data).
PHASE II: select &
study the standards
and objectives (Phases
II – V are listed on the
PLC Meeting Agenda
Worksheet)
1. Review the pacing calendar. What objectives have been assigned for the
upcoming week?
2. Read the item specifications of the objectives you are going to teach next
week.
3. What depth of knowledge (DoK) will be used when teaching/assessing
each objective?
4. What vocabulary will need to be addressed?
5. Using the Blue Prints, how many questions will be on the test that
corresponds to each objective?
PHASE III: prepare
to
teach the objective(s)
Prompts for team discussions
1. How to establish and relate the objective to the learners? What
background
knowledge will be needed?
2. In order to involve all learners, what methods will I use to explain/model
the
content and at what level (Depth of Knowledge -Webb) (Blooms –
remembering, understanding, applying, analyzing, evaluating, and
creating)
3. Will I present the content? What questioning techniques will I incorporate
into the presentation?
4. What modeling actions should be considered when delivering the
directions during the lesson sequence? How will I activate student’s prior
background knowledge throughout the lesson?
5. During guided practice and independent practice I will incorporate literacy
by using the following domains: Reading, Writing, Listening Speaking.
6. While monitoring students during the learning process, I will adjust the
instructional environment by using the following differentiated
approaches: independent study, small group, peer tutoring, other?
7. Evaluate the learning: What assessment(s) will be used? Review the
released test items.
PHASE IV: data
analysis of formative
assessment results
Prior to the team PLC Curriculum Meeting complete this section:
1. Using the Monitoring Student Learning Graph review the objectives
that were taught the previous week. On the table below record the
following:
What objectives did you teach? How many scored Proficient?
Advanced?
2. List the students that scored in each category (Limited
Knowledge/Unsatisfactory) and select type of focus group – if applicable
OSPR – Best Practices Instructional Delivery System
Page 2-5
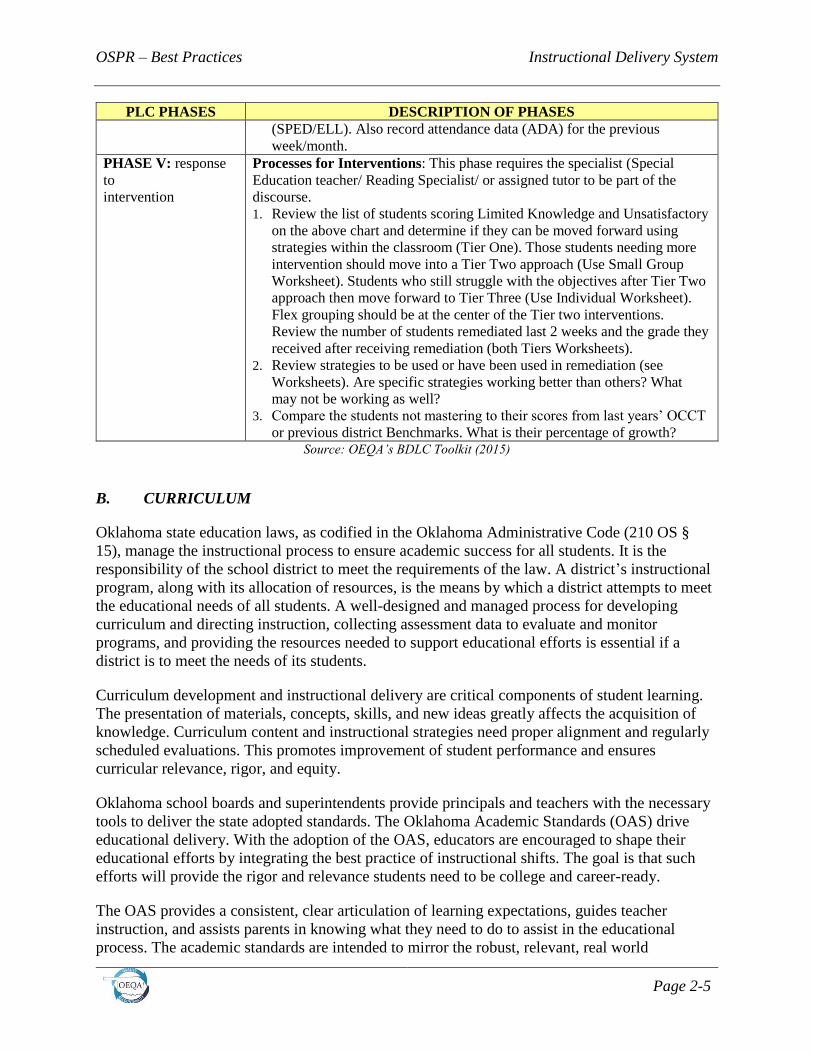
PLC PHASES DESCRIPTION OF PHASES (SPED/ELL). Also record attendance data (ADA) for the previous
week/month.
PHASE V: response
to
intervention
Processes for Interventions: This phase requires the specialist (Special
Education teacher/ Reading Specialist/ or assigned tutor to be part of the
discourse.
1. Review the list of students scoring Limited Knowledge and Unsatisfactory
on the above chart and determine if they can be moved forward using
strategies within the classroom (Tier One). Those students needing more
intervention should move into a Tier Two approach (Use Small Group
Worksheet). Students who still struggle with the objectives after Tier Two
approach then move forward to Tier Three (Use Individual Worksheet).
Flex grouping should be at the center of the Tier two interventions.
Review the number of students remediated last 2 weeks and the grade they
received after receiving remediation (both Tiers Worksheets).
2. Review strategies to be used or have been used in remediation (see
Worksheets). Are specific strategies working better than others? What
may not be working as well?
3. Compare the students not mastering to their scores from last years’ OCCT
or previous district Benchmarks. What is their percentage of growth? Source: OEQA’s BDLC Toolkit (2015)
B. CURRICULUM
Oklahoma state education laws, as codified in the Oklahoma Administrative Code (210 OS §
15), manage the instructional process to ensure academic success for all students. It is the
responsibility of the school district to meet the requirements of the law. A district’s instructional
program, along with its allocation of resources, is the means by which a district attempts to meet
the educational needs of all students. A well-designed and managed process for developing
curriculum and directing instruction, collecting assessment data to evaluate and monitor
programs, and providing the resources needed to support educational efforts is essential if a
district is to meet the needs of its students.
Curriculum development and instructional delivery are critical components of student learning.
The presentation of materials, concepts, skills, and new ideas greatly affects the acquisition of
knowledge. Curriculum content and instructional strategies need proper alignment and regularly
scheduled evaluations. This promotes improvement of student performance and ensures
curricular relevance, rigor, and equity.
Oklahoma school boards and superintendents provide principals and teachers with the necessary
tools to deliver the state adopted standards. The Oklahoma Academic Standards (OAS) drive
educational delivery. With the adoption of the OAS, educators are encouraged to shape their
educational efforts by integrating the best practice of instructional shifts. The goal is that such
efforts will provide the rigor and relevance students need to be college and career-ready.
The OAS provides a consistent, clear articulation of learning expectations, guides teacher
instruction, and assists parents in knowing what they need to do to assist in the educational
process. The academic standards are intended to mirror the robust, relevant, real world
Instructional Delivery System OSPR – Best Practices
Page 2-6
knowledge and skills that students need for success in college and careers. The OAS defines the
content, knowledge, and skills students should gain during their K-12 educational careers. It
prepares high school graduates for success in college courses and in workforce environments.
Exhibit 2-3 further explains the OAS standards.
Exhibit 2-3
Oklahoma Academic State Standards
What the OAS Does What the OAS Does Not Do
Focus on deep thinking, conceptual
understanding, and real world problem solving
skills
Set expectations for students to be college,
career, and citizenship ready
Incorporate literacy in science, social studies,
and technical subjects
Emphasize the use of citations and examples
from texts when creating opinions and
arguments
Increase rigor and grade level expectations
Determine the full range of support for
English language learners and students with
special needs
Dictate how teachers should teach
Mandate a specific curriculum
Limit advanced work beyond the standards
Require the purchase or development of
entirely new instructional materials
Prescribe all that can or should be taught
Limit efforts to prepare students for college,
career, or citizenship readiness
Prescribe interventions for students below
grade level
Source: SDE, 2017
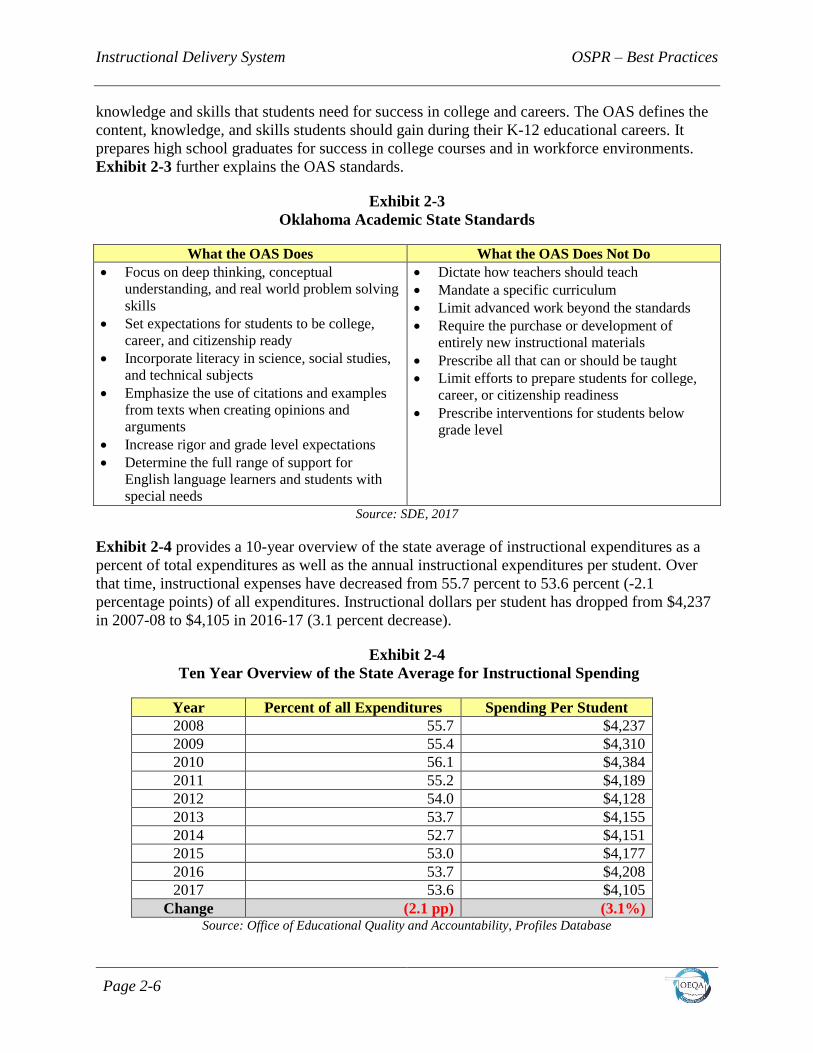
Exhibit 2-4 provides a 10-year overview of the state average of instructional expenditures as a
percent of total expenditures as well as the annual instructional expenditures per student. Over
that time, instructional expenses have decreased from 55.7 percent to 53.6 percent (-2.1
percentage points) of all expenditures. Instructional dollars per student has dropped from $4,237
in 2007-08 to $4,105 in 2016-17 (3.1 percent decrease).
Exhibit 2-4
Ten Year Overview of the State Average for Instructional Spending
Year Percent of all Expenditures Spending Per Student
2008 55.7 $4,237
2009 55.4 $4,310
2010 56.1 $4,384
2011 55.2 $4,189
2012 54.0 $4,128
2013 53.7 $4,155
2014 52.7 $4,151
2015 53.0 $4,177
2016 53.7 $4,208
2017 53.6 $4,105
Change (2.1 pp) (3.1%) Source: Office of Educational Quality and Accountability, Profiles Database

OSPR – Best Practices Instructional Delivery System
Page 2-7
FINDING 2-2
A common theme arose in many of the districts when curriculum was reviewed: There was little
evidence of a comprehensive vertically aligned curriculum. Learning gaps and redundancies
were not comprehensively addressed. There was no process ensuring a seamless transition from
one grade level and content area to the next. Additionally, there was no monitoring to ensure an
appropriate scope and sequence of skills and content was being implemented from one grade to
the next. Interviews and focus group discussions from several districts indicated only isolated
instances of vertical alignment.
In many districts at the elementary level, fourth and fifth grades were departmentalized with
teachers responsible for only one or two subjects or possibly just one subject but teaching that
subject to more than one grade level. It was noted that in some schools departmentalizing began
as early as third grade. Clearly those districts’ graded curriculum documents were more aligned
due to the departmentalized approach. Overall, however, few districts were deliberate in vertical
alignment processes within K-5 or between the elementary and middle grade levels in any core
content area.
Exhibit 2-5 shows that 61 percent of a sampling of staffs surveyed agree there are a district-
adopted pacing calendar. Yet there were cases when the consulting teams did not receive or find
an adopted pacing calendar. The sampling of survey results indicated that 74 percent of teachers
had a working knowledge of the adopted standards, assessment blueprints, and item
specifications provided by the State Department of Education.
Exhibit 2-5
Staff Survey Results Regarding Curriculum Documents
Survey Questions Agree No Opinion Disagree
Teachers know what is to be taught
and when because they have access to
a district adopted Pacing Calendar
that reflects the current Oklahoma
Academic Standards (OAS).
61% 23% 15%
Teachers understand the OAS
objectives, test blueprints, and Item
Specifications that are provided by
the state.
74% 20% 6%
Source: OEQA Sampling from Archived District Surveys 2012-2017
Vertical alignment articulates the logical, consistent order for teaching the standards-based
content in a subject area from one grade level or course to the next. Vertical alignment is
conducted as a multistep process that requires substantial time and input from district staff. In a
standards-based system, vertical alignment provides a structure by which to assess achievement
results. When an aligned curriculum also is aligned with performance or benchmark assessments,
educators can begin to examine differences in instruction across grades and subjects within the
Instructional Delivery System OSPR – Best Practices
Page 2-8
district.7
Vertical alignment is defined as “Ensuring that curriculum objectives are specific and build one
upon another, that prerequisites are mastered, gaps are eliminated, and there is an increasing
sophistication and rigor in concepts, processes, and skills across the grades”8. A process for
vertical alignment asks teachers to address the following issues as they pertain to reading:
align student expectations across grades;
align assessments across grades;
find and fill gaps;
clarify and minimize overlaps;
increase expectations with regard to rigor and sophistication year to year;
build upon prerequisite skills; and
build common vocabulary.9
In the lower elementary grades, many rural or small-town districts have only one teacher per
grade level. This makes horizontal alignment different from larger districts with multiple
teachers assigned to the same grade level. Because there is only one teacher per grade level in the
elementary grades, vertical alignment is a critical component of the curriculum.
The importance of vertical alignment is evident as skills progress over time, and teachers should
have opportunities to collaborate with other grade levels to ensure skills and concepts are taught
effectively and with appropriate tools to prevent gaps and overlaps from occurring within the
curriculum. For example, building a solid foundation for understanding proportional thinking in
mathematics occurs in the early elementary years. Exhibit 2-6 illustrates how this is developed
from elementary to middle school.
7 http://www.centerforcsri.org/files/CenterIssueBriefAug09.pdf 8 Curriculum and Alignment - Arizona Department of Education https://www.azed.gov/ p.12 9 Ibid

OSPR – Best Practices Instructional Delivery System
Page 2-9
Exhibit 2-6
Vertical Alignment - Algebraic Reasoning & Algebra (A)
Grade level OAS Standard
1 1.A.1 Identify patterns found in real world and mathematical situations.
2 2.A.1 Describe the relationship found in patterns to solve real-world and
mathematical problems.
3 3.A.1 Describe and create representations of numerical and geometric patterns.
4 4.A.1 Use multiple representations of patterns to solve real-world and
mathematical problems.
5 5.A.1 Describe and graph patterns of change created through numerical
patterns.
6 6.A.1 Recognize and represent relationships between varying quantities;
translate from one representation to another; use patterns, tables, graphs and
rules to solve real-world and mathematical problems.
7 7.A.1 Understand the concept of proportionality in real-world and
mathematical Situations and distinguish between proportional and other
relationships. Source: OEQA Archived Exhibit (2017)
RECOMMENDATION
Implement processes and procedures to pace and vertically align Kindergarten through
grade 12 curriculum based on state standards and student performance results.
The district should begin a process of vertical alignment of the new Oklahoma Academic
Standards (OAS) for math and reading. This may involve seeking an outside consultant to assist
the district in this challenging but necessary task.
FISCAL IMPACT
Districts should consider an external consultant to assist in the development of its curriculum
alignment. The consulting team estimates that such a consultant will cost $2,500 per year and
may require two years to complete the alignment.
Recommendation 2019-20 2020-21 2021-22 2022-23 2023-24
Implement a vertically
aligned curriculum. ($2,500) ($2,500) $0 $0 $0
FINDING 2-3
During reviews of the curriculum it was noted that many districts that did not actively implement
vertical alignment processes also did not have a comprehensive system in place for pacing the
instruction and assessments of the core content. Some districts had outdated pacing calendars
while others had only used their teacher textbooks to guide and pace their instruction and
assessments. During interviews with instructional staff from various districts, some
acknowledged the value of pacing calendars for new teachers as well as for experienced teachers
Instructional Delivery System OSPR – Best Practices
Page 2-10
especially with the state’s adoption of the Oklahoma Academic Standards (OAS). Others
expressed how the pacing guides/calendars could contribute to eliminating the curriculum gaps
from grade to grade and subject to subject.
A pacing guide is sometimes referred to as a curriculum map, scope and sequence, standards
schedule, instructional calendar, or road map. It is specific to a particular content area and level
(e.g., 5th grade Science) and details when particular content standards should be taught and/or
assessed. While still offering teachers flexibility on how to teach, its integration with common
assessments is crucial to judging student progress. A dialogue among teachers within a
collaborative team may consist of statements such as, "Students didn't know that answer because
I haven't taught that yet" or "I covered that and expected students to do better; now I know some
students require intervention, and I might change the way I'm teaching that". Once districts begin
the process of vertical alignment of the curriculum based on the OAS, the development of a
pacing calendar for math and reading should be upmost in the process for improvement.
RECOMMENDATION
Develop grade level/content specific pacing calendars that reflect standards taught
quarterly; include test items specifications and blue print assessment information.
There are multiple promising outcomes for creating and implementing Pacing Guides/Calendars.
Below are just a few that school districts should consider:
Improve student performance and reduce gaps in student achievement.
Avoid gaps in learning when students transfer from school to school or move from
grade/level to grade/level.
Avoid unintended repetition in learning when students transfer from school to school or
move from grade/level to grade/level.
Render results that inform decisions made concerning (e.g., changes needed in)
instructional strategies, programs, curriculum, etc.
Inform collaboration between educators.
Facilitate the process for updating from the PASS to the Oklahoma Academic Standards
Highlight cross-curricular opportunities.
Help teachers be more effective while making lesson planning easier and saving them
time.
Help teachers and students make the most of their time.
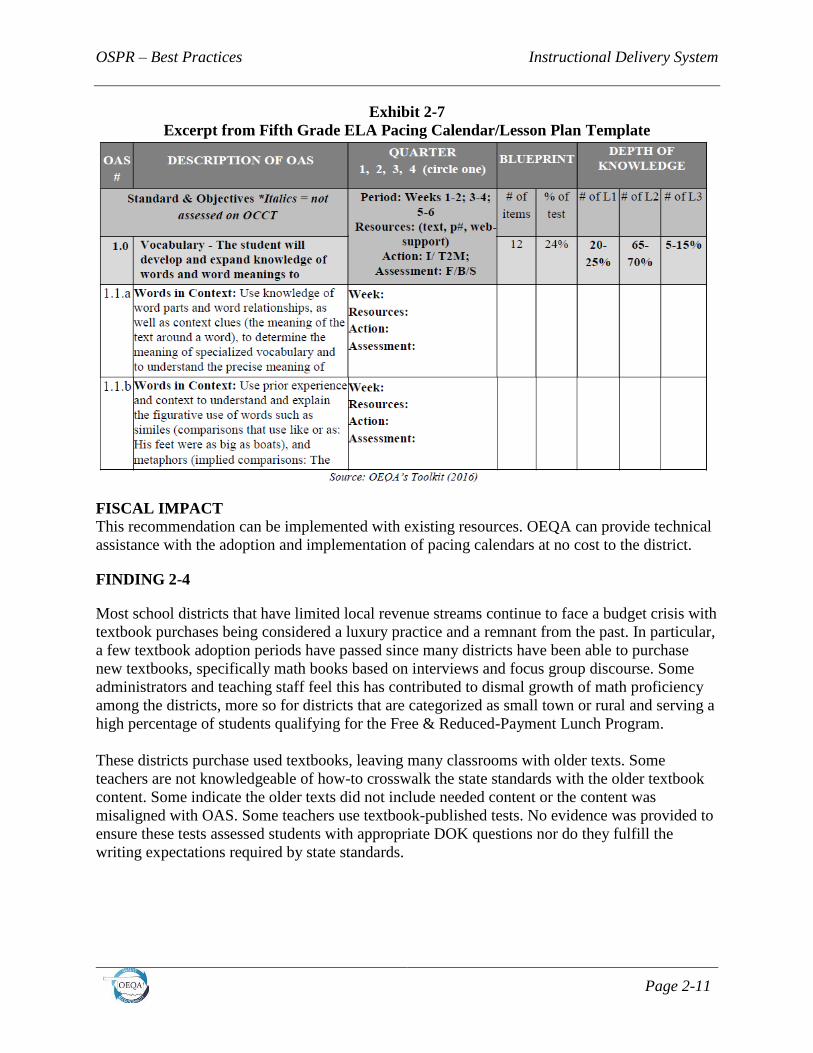
OEQA has developed sample pacing calendar templates that might even serve as lesson plan
templates to provide support for OSPR districts. Exhibit 2-7 presents a section from the fifth
grade English/Language Arts (ELA) pacing calendar/lesson plan template Not shown in the
exhibit is the key that details the levels of DOK, OAS strands for ELA, and Quarter Marks. The
key and full-page exhibits can also be found in Appendix D - Resources.
OSPR – Best Practices Instructional Delivery System
Page 2-11
Exhibit 2-7
Excerpt from Fifth Grade ELA Pacing Calendar/Lesson Plan Template
FISCAL IMPACT
This recommendation can be implemented with existing resources. OEQA can provide technical
assistance with the adoption and implementation of pacing calendars at no cost to the district.
FINDING 2-4
Most school districts that have limited local revenue streams continue to face a budget crisis with
textbook purchases being considered a luxury practice and a remnant from the past. In particular,
a few textbook adoption periods have passed since many districts have been able to purchase
new textbooks, specifically math books based on interviews and focus group discourse. Some
administrators and teaching staff feel this has contributed to dismal growth of math proficiency
among the districts, more so for districts that are categorized as small town or rural and serving a
high percentage of students qualifying for the Free & Reduced-Payment Lunch Program.
These districts purchase used textbooks, leaving many classrooms with older texts. Some
teachers are not knowledgeable of how-to crosswalk the state standards with the older textbook
content. Some indicate the older texts did not include needed content or the content was
misaligned with OAS. Some teachers use textbook-published tests. No evidence was provided to
ensure these tests assessed students with appropriate DOK questions nor do they fulfill the
writing expectations required by state standards.
Instructional Delivery System OSPR – Best Practices
Page 2-12
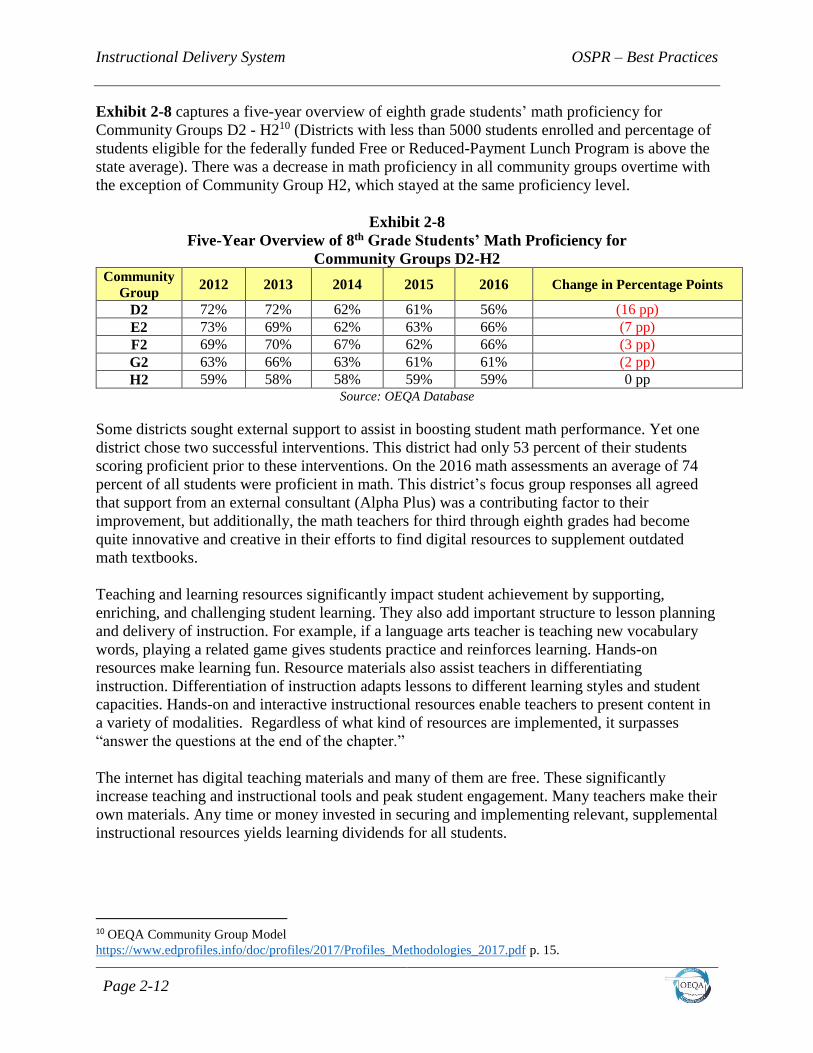
Exhibit 2-8 captures a five-year overview of eighth grade students’ math proficiency for
Community Groups D2 - H210 (Districts with less than 5000 students enrolled and percentage of
students eligible for the federally funded Free or Reduced-Payment Lunch Program is above the
state average). There was a decrease in math proficiency in all community groups overtime with
the exception of Community Group H2, which stayed at the same proficiency level.
Exhibit 2-8
Five-Year Overview of 8th Grade Students’ Math Proficiency for
Community Groups D2-H2 Community
Group 2012 2013 2014 2015 2016 Change in Percentage Points
D2 72% 72% 62% 61% 56% (16 pp)
E2 73% 69% 62% 63% 66% (7 pp)
F2 69% 70% 67% 62% 66% (3 pp)
G2 63% 66% 63% 61% 61% (2 pp)
H2 59% 58% 58% 59% 59% 0 pp Source: OEQA Database
Some districts sought external support to assist in boosting student math performance. Yet one
district chose two successful interventions. This district had only 53 percent of their students
scoring proficient prior to these interventions. On the 2016 math assessments an average of 74
percent of all students were proficient in math. This district’s focus group responses all agreed
that support from an external consultant (Alpha Plus) was a contributing factor to their
improvement, but additionally, the math teachers for third through eighth grades had become
quite innovative and creative in their efforts to find digital resources to supplement outdated
math textbooks.
Teaching and learning resources significantly impact student achievement by supporting,
enriching, and challenging student learning. They also add important structure to lesson planning
and delivery of instruction. For example, if a language arts teacher is teaching new vocabulary
words, playing a related game gives students practice and reinforces learning. Hands-on
resources make learning fun. Resource materials also assist teachers in differentiating
instruction. Differentiation of instruction adapts lessons to different learning styles and student
capacities. Hands-on and interactive instructional resources enable teachers to present content in
a variety of modalities. Regardless of what kind of resources are implemented, it surpasses
“answer the questions at the end of the chapter.”
The internet has digital teaching materials and many of them are free. These significantly
increase teaching and instructional tools and peak student engagement. Many teachers make their
own materials. Any time or money invested in securing and implementing relevant, supplemental
instructional resources yields learning dividends for all students.
10 OEQA Community Group Model
https://www.edprofiles.info/doc/profiles/2017/Profiles_Methodologies_2017.pdf p. 15.
OSPR – Best Practices Instructional Delivery System
Page 2-13
RECOMMENDATION
Implement an in-depth assessment to ensure all teachers have access to, and use, up-to-date
teaching materials, digital resources, or textbooks that align with all aspects of the OAS.
District superintendents and principals need to set clear expectations that all teachers use
effective supplemental instructional resources. It should be clear that hands-on resources are a
valued component in the teaching and learning cycle. The goal is to move teachers toward
“standards driven” curricula. Digital and hands-on resources need to supplement the outdated
textbooks. The internet has many digital resources and most publishers have online resources for
teachers. Today’s classrooms are no longer a teacher lecture followed by chapter reading and
worksheet assignments. Classrooms in the 21st Century are to be student-centered and
characterized by small interactive groups, multiple modes for learning, and digital media.
Professional development days and PLC meetings can be venues for teachers sharing resources.
A portion of professional development days can provide teachers with time to make, search the
internet, and acquire resources that reinforce learning of OAS. Teachers should methodically
peruse the content they teach and selectively determine areas lacking in resource materials. If
there are content standards with a pattern of failure, or the content is difficult to teach, these are
areas to add supplemental resources. It is important that aligning and pacing the curricula works
in concert with selecting relevant, rigorous teaching materials that enhance learning and student
engagement.
FINDING 2-5
In several reviews in the past five years it has been noted that high school students were being
offered a limited number of curriculum units in many of the core areas. Interviews and focus
groups indicated dissatisfaction with the minimal selection and availability of curriculum units
especially in the STEM areas.
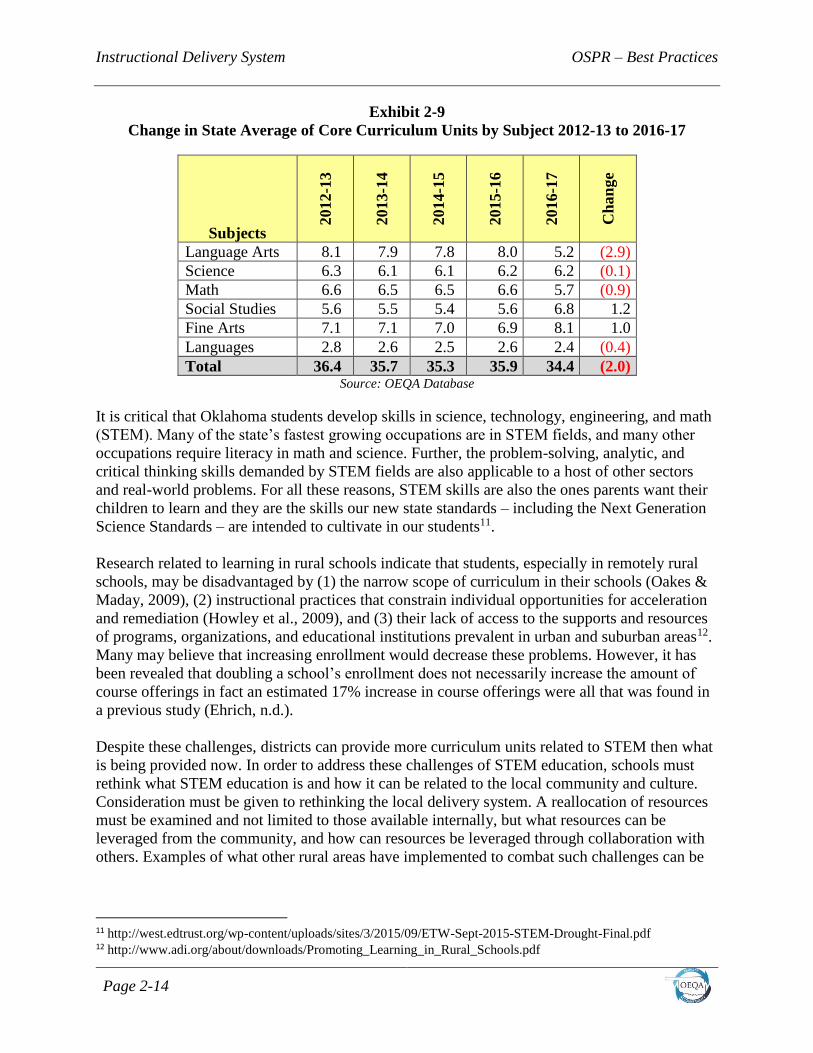
A comparison of the state average of core curriculum units from 2012-13 to 2016-17 shows a
decrease overtime in most all curriculum units with the exception of Social Studies and Fine
Arts. Exhibit 2-9 shows that Language Arts courses have decreased by 2.9 units, which was a
greater loss than any of the other core subjects within that same period. With the sharp focus and
external attention on improving STEM curriculum during this same era, it would be expected to
see an increase in those core units; however, Exhibit 2-9 indicates a slight decrease in Science,
with Math decreasing by 0.9 units. Surprisingly Social Studies and Fine Arts gained during this
period.
Instructional Delivery System OSPR – Best Practices
Page 2-14
Exhibit 2-9
Change in State Average of Core Curriculum Units by Subject 2012-13 to 2016-17
Subjects
2012-1
3
2013-1
4
2014-1
5
2015-1
6
2016-1
7
Ch
an
ge
Language Arts 8.1 7.9 7.8 8.0 5.2 (2.9)
Science 6.3 6.1 6.1 6.2 6.2 (0.1)
Math 6.6 6.5 6.5 6.6 5.7 (0.9)
Social Studies 5.6 5.5 5.4 5.6 6.8 1.2
Fine Arts 7.1 7.1 7.0 6.9 8.1 1.0
Languages 2.8 2.6 2.5 2.6 2.4 (0.4)
Total 36.4 35.7 35.3 35.9 34.4 (2.0) Source: OEQA Database
It is critical that Oklahoma students develop skills in science, technology, engineering, and math
(STEM). Many of the state’s fastest growing occupations are in STEM fields, and many other
occupations require literacy in math and science. Further, the problem-solving, analytic, and
critical thinking skills demanded by STEM fields are also applicable to a host of other sectors
and real-world problems. For all these reasons, STEM skills are also the ones parents want their
children to learn and they are the skills our new state standards – including the Next Generation
Science Standards – are intended to cultivate in our students11.
Research related to learning in rural schools indicate that students, especially in remotely rural
schools, may be disadvantaged by (1) the narrow scope of curriculum in their schools (Oakes &
Maday, 2009), (2) instructional practices that constrain individual opportunities for acceleration
and remediation (Howley et al., 2009), and (3) their lack of access to the supports and resources
of programs, organizations, and educational institutions prevalent in urban and suburban areas12.
Many may believe that increasing enrollment would decrease these problems. However, it has
been revealed that doubling a school’s enrollment does not necessarily increase the amount of
course offerings in fact an estimated 17% increase in course offerings were all that was found in
a previous study (Ehrich, n.d.).
Despite these challenges, districts can provide more curriculum units related to STEM then what
is being provided now. In order to address these challenges of STEM education, schools must
rethink what STEM education is and how it can be related to the local community and culture.
Consideration must be given to rethinking the local delivery system. A reallocation of resources
must be examined and not limited to those available internally, but what resources can be
leveraged from the community, and how can resources be leveraged through collaboration with
others. Examples of what other rural areas have implemented to combat such challenges can be
11 http://west.edtrust.org/wp-content/uploads/sites/3/2015/09/ETW-Sept-2015-STEM-Drought-Final.pdf 12 http://www.adi.org/about/downloads/Promoting_Learning_in_Rural_Schools.pdf

OSPR – Best Practices Instructional Delivery System
Page 2-15
accessed via the National Rural Education Association (NREA)13.
RECOMMENDATION
Increase the number of courses related to the STEM curriculum by forming alliances with
school districts and industry within the region while also utilizing resources that are
currently available within the district.
A large number of like-minded school districts, community colleges, and universities have
formed alliances for working together to address course offerings, professional development,
increasing access to technology, offering dual credit course, and connecting education and
regional development. One such example was found in Ohio. In the 2010 school year 21
Appalachian Ohio school districts established the Ohio Appalachian Cooperative with the idea
“that by joining together, small districts…can leverage the best and brightest to create more
opportunities for kids.”14 Members have been able to stretch their resources by increasing their
purchasing power as a group and entering in to dual enrollment credentialing agreements. Such
actions have allowed increased student access to more demanding coursework including STEM
classes.
An example in Oklahoma of such collaboration among school districts to provide increased
access to STEM curriculum is seen in Kay County. Five school districts within this county have
combined district resources, personnel and finances to enhance instruction. Although many
districts have made great strides in providing concurrent course work for some students via their
partnership with local universities/colleges, this is sometimes limited to only one course directly
related to STEM curriculum. Those courses available include Composition I, U.S. History, and
Algebra. Encouraging universities to provide adjuncts in the STEM areas through the online
connection would benefit all students. Additionally, reaching out to other districts such as
to share credentialed teacher expertise in the areas of STEM would provide effective and
efficient professional development.
Forming alliances with school districts is fundamental, but coupling this with industry
partnerships and alliances would reach a pinnacle for growing the STEM curriculum. For
example, in rural northern Indiana, the Rochester Telephone Company (RTC) focused on
connecting the community; family to family, friend to friend, and business to business. Rural
school districts within this area have been able to become early adopters of online learning and
utilize the RTC telephone system to increase opportunities for student engagement in the STEM
classes. When reviewing the nearest Chamber of Commerce list of businesses and industries, it
is apparent that opportunities for a community to provide support to the local high school are
optimal.
Challenges in STEM education come out of the impact of technology and science on every
vocation. In order to address the challenges of STEM education in district leaders must rethink
what STEM education is and how it can be related to the local community and culture. More
13 http://blog.discoveryeducation.com/blog/2015/08/03/stem-education-in-rural-schools-challenge-opportunity/ 14 http://blog.discoveryeducation.com/blog/2015/08/03/stem-education-in-rural-schools-challenge-opportunity/

Instructional Delivery System OSPR – Best Practices
Page 2-16
importantly, consideration must be given to rethinking the local delivery system. An examination
of current priorities should be addressed with the possibility of reallocating resources in order to
promote a STEM culture through recruiting and building teacher talent that
would catapult any district’s STEM initiative.
FISCAL IMPACT
This recommendation can be implemented with existing resources.
FINDING 2-6
Not all districts have processes and procedures to annually:
evaluate instructional resources, software, enrichment, and remediation resources;
review supplemental resources to determine alignment with OAS, student performance
data, or relevant student need;
evaluate programs to assess the selection, modification, and adjustment of all
instructional resources;
measure the overall effectiveness of curricular and instructional resources; and
evaluate the impact of instructional resources on improved student achievement.
Across districts, there aren’t always defined efforts to routinely collect data to determine the
efficiency and effectiveness of instructional resources and the impact on student achievement.
Consulting teams do not often find evidence of an evaluation process to determine how
supplemental and remedial interventions, instructional strategies, and enrichment activities are
aligned with student need. It is noted that much of the time teachers primarily work in isolation
and select their own supplemental resources. There was no evaluation process to ensure current
supplemental resources aligned with OAS.
Most federal and state instructional resource/programs require individual instructional
resource/program evaluations. However, highly effective schools take the evaluation process to
the next level and evaluate all locally implemented instructional resources/programs. This
ensures instructional resources/programs work in concert and are effective for remediation or
enrichment at each grade level and content area. An annual evaluation process ensures all
instructional resources, programs, and software are not “busy work” but directly improve student
learning. Likewise, an annual evaluation process determines if instructional resource materials
are addressing student learning gaps or redundant and repetitive overlaps. All teachers need
resources that are relevant, support curricula rigor, and most importantly, seamlessly align with
state standards.
Without comprehensive instructional resource/program evaluations, schools risk getting into
curricular and instructional traps. They continue doing what they have always done and serving
students a number of instructional resources without focused intent and alignment to state
standards and targeted student learning needs. Systematically collecting and analyzing
quantitative and qualitative information regarding instructional resources provides district
administrators and teachers with valuable assessment information.
OSPR – Best Practices Instructional Delivery System
Page 2-17
Evaluations should measure and answer questions such as:
Is there a need to improve, modify, or abandon the supplemental instructional resources?
Does the resource yield the intended effect on improved student learning?
Are the resource goals still relevant to student need and aligned to state standards?
Do the resources render unintended outcomes?
Is there a need to change or refine the implementation strategies and procedures?
Are all the individual resource components valuable and effective in improving student
achievement?
Does the instructional resource/program have positive impact on students, teachers,
school climate, and culture?15
Districts can then use the evaluation to make data-driven, informed decisions. The evaluation
should guide the district to keep or abandon instructional resources/programs. Based on data,
modifications, additions, deletions, or revisions to instructional resources/programs can be
determined. Such information is crucial for aligning district funds and resources with new
purchases that are effective instructional resources/programs and best practices. Without
implementing a regularly scheduled evaluation system, districts position themselves to fund
instructional resources/programs that are not meeting student needs or the intent behind their
implementation. Most of all, there needs to be an assurance the district is not spending money
and time on ineffective instructional resource/programs.
RECOMMENDATION
Develop and implement a plan to annually evaluate instructional resources, software,
enrichment, and remediation resources.
High performing districts annually evaluate all instructional resource/programs, new initiatives,
grants, and district processes. The combined data determines if there is need to eliminate
components or discontinue the resource or instructional resource/program. The data should also
provide evidence that the instructional resource/program positively:
impacts improved student learning;
contributes to the relevance and rigor of instruction and curriculum;
meets the intended curricular and instructional purpose, and
supports best instructional practices.
In the long term, instructional resource/program evaluations focus on improving student
achievement. Evaluation is a guide to build upon successes and leads to ongoing improvement in
practices and outcomes.
15 http://ies.ed.gov/ncee/edlabs/regions/pacific/pdf/REL_2014007.pdf
Instructional Delivery System OSPR – Best Practices
Page 2-18
Superintendents, principals, and teachers should develop a list of all curricular and instructional
resources they routinely use to supplement, remediate, or enrich their instruction, and support the
curriculum. The evaluation process includes a rank ordering of total dollars spent on each
implemented resource. The superintendent should then direct evaluation efforts to those with the
highest costs and the strongest correlation to student performance data in the bottom quartiles.
The superintendent and principal must work with teachers to identify and abandon resources and
materials that are no longer robust and relevant to the knowledge base students need for the next
level of study and college and career-readiness. This evaluation and abandonment process must
be simple, easily implemented, and directly focused on supporting improved student
performance.
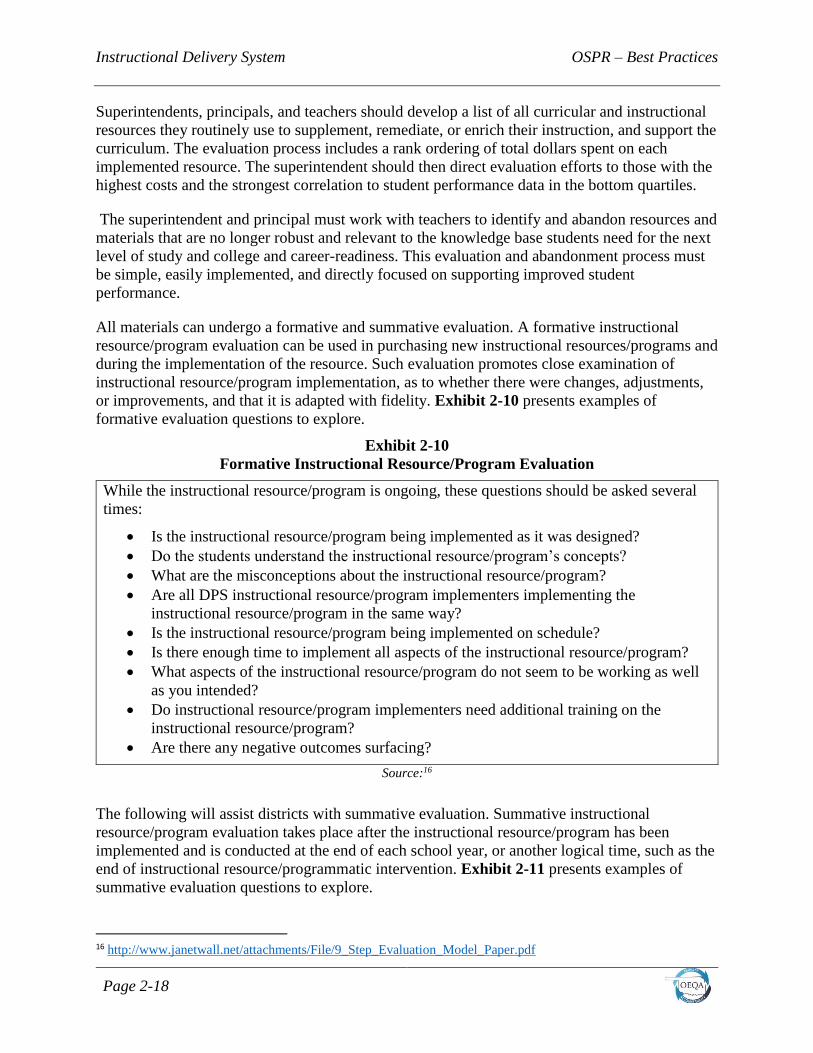
All materials can undergo a formative and summative evaluation. A formative instructional
resource/program evaluation can be used in purchasing new instructional resources/programs and
during the implementation of the resource. Such evaluation promotes close examination of
instructional resource/program implementation, as to whether there were changes, adjustments,
or improvements, and that it is adapted with fidelity. Exhibit 2-10 presents examples of
formative evaluation questions to explore.
Exhibit 2-10
Formative Instructional Resource/Program Evaluation
While the instructional resource/program is ongoing, these questions should be asked several
times:
Is the instructional resource/program being implemented as it was designed?
Do the students understand the instructional resource/program’s concepts?
What are the misconceptions about the instructional resource/program?
Are all DPS instructional resource/program implementers implementing the
instructional resource/program in the same way?
Is the instructional resource/program being implemented on schedule?
Is there enough time to implement all aspects of the instructional resource/program?
What aspects of the instructional resource/program do not seem to be working as well
as you intended?
Do instructional resource/program implementers need additional training on the
instructional resource/program?
Are there any negative outcomes surfacing?
Source:16
The following will assist districts with summative evaluation. Summative instructional
resource/program evaluation takes place after the instructional resource/program has been
implemented and is conducted at the end of each school year, or another logical time, such as the end of instructional resource/programmatic intervention. Exhibit 2-11 presents examples of
summative evaluation questions to explore.
16 http://www.janetwall.net/attachments/File/9_Step_Evaluation_Model_Paper.pdf

OSPR – Best Practices Instructional Delivery System
Page 2-19
Exhibit 2-11
Summative Instructional Resource/Program Evaluation
After an instructional resource/program has been implemented ask:
What did the instructional resource/program accomplish?
Did the instructional resource/program reach its goals and objectives?
What impact did the instructional resource/program have on students?
What were the outcomes?
Who benefited from the instructional resource/program?
How much was the benefit to improved student achievement?
Was the benefit greater with this instructional resource/program when compared with
another instructional resource/program?
Did all types of students benefit from the instructional resource/program?
What were the positive outcomes?
What were the negative outcomes?
What should be improved/changed in the instructional resource/program?
Does the benefit of the instructional resource/program warrant the cost?
Source:17
In addition to asking the above evaluation questions, it is also important to make certain the
instructional resources/programs align tightly with the OAS depth of knowledge (DOK)
expectations, and Oklahoma’s expected student performance levels. Demographics such as
poverty, mobility, ethnicity, and bottom quartile student test scores should also be taken into
consideration for abandonment or retention purposes. Teachers cannot afford to implement
instructional resources/programs and materials that do not have high impact on closing the
achievement gap and improving student performance. There are many free resources available to
gather additional information, including:
https://www.cde.state.co.us/fedinstructional resource/programs/designing-and-
planningyour-instructional resource/program-evaluation offers resources on designing
and planning instructional resource/program evaluation;
https://www.cde.state.co.us/fedinstructional resource/programs/designing-and-
planningyour-instructional resource/program-evaluation is another resource for designing
and planning;
https://managementhelp.org/evaluation/instructional resource/program-evaluation-
guide.htm provides a basic guide to instructional resource/program evaluation; and
17 http://www.janetwall.net/attachments/File/9_Step_Evaluation_Model_Paper.pdf
Instructional Delivery System OSPR – Best Practices
Page 2-20
https://www2.ed.gov/about/offices/list/oese/sst/evaluationmatters.pdf provides an
evaluation matrix and template. Initially, existing DPS monies could be objectively and
fairly evaluated using internal personnel.
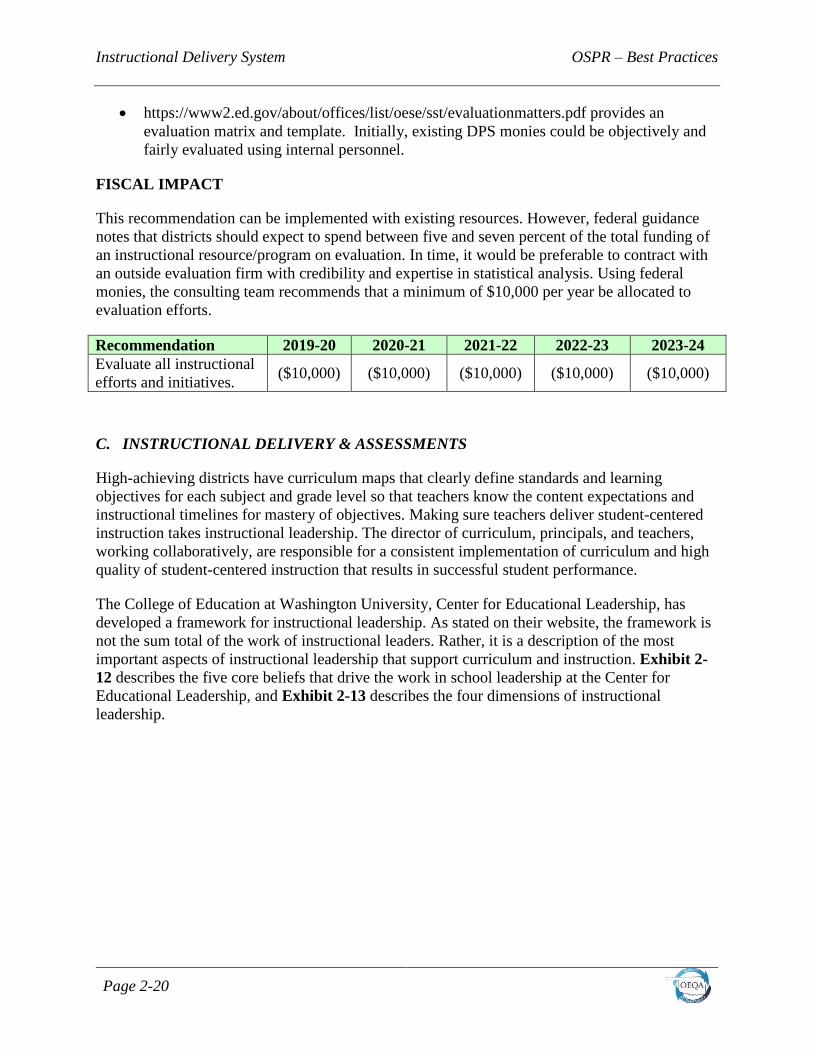
FISCAL IMPACT
This recommendation can be implemented with existing resources. However, federal guidance
notes that districts should expect to spend between five and seven percent of the total funding of
an instructional resource/program on evaluation. In time, it would be preferable to contract with
an outside evaluation firm with credibility and expertise in statistical analysis. Using federal
monies, the consulting team recommends that a minimum of $10,000 per year be allocated to
evaluation efforts.
Recommendation 2019-20 2020-21 2021-22 2022-23 2023-24
Evaluate all instructional
efforts and initiatives. ($10,000) ($10,000) ($10,000) ($10,000) ($10,000)
C. INSTRUCTIONAL DELIVERY & ASSESSMENTS
High-achieving districts have curriculum maps that clearly define standards and learning
objectives for each subject and grade level so that teachers know the content expectations and
instructional timelines for mastery of objectives. Making sure teachers deliver student-centered
instruction takes instructional leadership. The director of curriculum, principals, and teachers,
working collaboratively, are responsible for a consistent implementation of curriculum and high
quality of student-centered instruction that results in successful student performance.
The College of Education at Washington University, Center for Educational Leadership, has
developed a framework for instructional leadership. As stated on their website, the framework is
not the sum total of the work of instructional leaders. Rather, it is a description of the most
important aspects of instructional leadership that support curriculum and instruction. Exhibit 2-
12 describes the five core beliefs that drive the work in school leadership at the Center for
Educational Leadership, and Exhibit 2-13 describes the four dimensions of instructional
leadership.

OSPR – Best Practices Instructional Delivery System
Page 2-21
Exhibit 2-12
Core Beliefs – Center for Educational Leadership
Beliefs
1
Instructional leadership is learning-focused, learning for both students and adults, and
learning which is measured by improvement in instruction and in the quality of student
learning.
2 Instructional leadership must reside with a team of leaders of which the principal serves as
the “leader of leaders.”
3 A culture of public practice and reflective practice is essential for effective instructional
leadership and the improvement of instructional practice.
4 Instructional leadership addresses the cultural, linguistic, socioeconomic, and learning
diversity in the school community.
5 Instructional leadership focuses upon the effective management of resources and of people
– recruiting, hiring, developing, evaluating – particularly in changing environments. Source: http://info.k-12leadership.org/4-dimensions-of-instructional-leadership
Exhibit 2-13
Dimensions of Instructional Leadership
Dimensions
Vision, Mission, and Culture Building
School leaders, committed to collective leadership,
create a reflective, equity-driven, achievement-
based culture of learning focused upon academic
success for every student.
Improvement of Instructional Practice
Based upon a shared vision of effective teaching
and learning, school leaders establish a focus on
learning; nurture a culture of continuous
improvement, innovation, and public practice; and
monitor, evaluate and develop teacher performance
to improve instruction.
Allocation of Resources
School leaders allocate resources strategically so
that instructional practice and student learning
continue to improve.
Management of People and Processes
School leaders engage in strategic personnel
management and develop working environments in
which teachers have full access to supports that help
improve instruction. Source: http://info.k-12leadership.org/4-dimensions-of-instructional-leadership
Waters, Marzano, and McNulty (2003), from the Mid-continent Regional Educational
Laboratory (McREL), synthesized the body of research on the effects of leadership practices on
student achievement. In their research, McREL identified 21 leadership responsibilities and 66
practices that are significantly associated with student achievement. These characteristics and
responsibilities are now integrated into a Balanced Leadership Framework.18 Much of the
18http://files.eric.ed.gov/fulltext/ED544245.pdf
Instructional Delivery System OSPR – Best Practices
Page 2-22
Teacher and Leader Effectiveness (TLE) evaluation process adopted for Oklahoma
administrators uses this research.19
School administrators must have pragmatic knowledge, skills, strategies, and tools to positively
lead and affect curriculum, and instruction, and improve student achievement. They must move
their instructional leadership skill set past abstract and theoretical thinking to concrete, day-to-
day practices to be effective leaders. Instructional leaders understand the need for multi-faceted
strategies that enable them to know when, how, and why leadership action must be taken.
Superintendents, directors, and principals form the core of educational leadership in school
districts. Over the past two decades, the role of the school leader is no longer that of a building
manager who makes sure that schedules are met, the school is maintained, and that discipline is
properly enforced. Today, the educational leader is responsible for consistency of
implementation of an aligned curriculum, the quality of instruction in the classroom, and student
performance. Recent research contends that school leaders influence classroom teaching, and
consequently student learning, by staffing schools with highly effective teachers and supporting
those teachers with effective teaching and learning environments.20 Effective learning
environments begin with strong educational and instructional leadership and include the
following components:
Instructional Vision—ensures that instructional practices are guided by a common, research-
based instructional vision that articulates what students do to learn the subject effectively.
Continuous Improvement of Instruction—aligns resources (i.e., professional development,
allocation of teacher time, budget decisions), policies, and procedures (i.e., school
improvement plans, teacher evaluation) toward continuous improvement of instructional
practice guided by the instructional vision.
High Expectations—sets high expectations for all students academically, behaviorally, and in
all aspects of student well-being.
School Culture—establishes a safe, collaborative, and supportive school culture that places
high priority on ensuring that students are successful in school and life.
FINDING 2-7
OEQA has conducted full performance reviews (all operational areas reviewed) for 63
traditional school districts. Of those 63 districts 29 (46 percent) had a student enrollment of less
than 500 students. Many of these small districts must utilize their administrators for multiple
roles within the school district. Serving in multiple roles can be challenging and may cause the
instructional focus to be blurred if not diminished by these extra responsibilities.
19 http://sde.ok.gov/sde/tle 20 http://cepa.stanford.edu/sites/default/files/Kappan_leadership.pdf.

OSPR – Best Practices Instructional Delivery System
Page 2-23
In small districts, leadership consists of the superintendent and one principal, while other
districts’ superintendent serves as the only administrator. Providing two instructional leaders has
the potential of guiding a school toward continuous and sustainable school improvement.
Although superintendents acknowledge the importance for providing strong instructional
leadership, the effort is somewhat weakened and at times even negated when leaders also serve
in other positions within the district. Roles the superintendent and the principal may have include
serving as teachers, counselors and bus driver.
A study conducted in 2010 sought to identify and describe the roles and responsibilities of small
rural school districts that were perceived to be the most important and the most challenging by
the superintendent/principal. One of the strongest conclusions of this study was that dual role
administrators must prioritize their time as a necessary precedent to effectively enact the role of
instructional leader.13
Exhibit 2-14 provides a sampling of staff survey results from the 29 Community Groups G and
H districts related to the perception of the superintendent and/or principal as instructional leader.
Seventy-three percent of survey respondents agree that the principal and/or superintendent were
effective instructional leaders while 16 percent disagree and 12 percent had no opinion.
Exhibit 2-14
Staff Survey Results Related to the Instructional Leadership
Survey Questions Agree No Opinion Disagree
The principal/superintendent is an
effective instructional leader 73% 12% 16%
Source: OEQA Sampling of Archived Survey Results (2004-2017)
A study of 25 South Dakota rural school districts found that combining the superintendency with
either the elementary or the secondary principalship was not an ideal arrangement. For the
district and teachers, the most consistent disadvantages relate to inadequate instructional
leadership. For the superintendents, the greatest disadvantage is sacrifice of personal and family
time simply to keep the organization functioning.21
Another study conducted in North Dakota found that decreasing enrollments and financial
problems led to considerable restructuring in rural schools. One form of restructuring was the
creation of dual-role administrative positions combining two or all of the roles of superintendent,
elementary principal, and secondary principal. Administrators holding such positions were asked
to complete a survey (Most respondents held proper credentials for all positions). Survey results
revealed the major problem with the dual role was lack of time to do all tasks adequately; when
the superintendency was one of the roles, the principalship was likely to be neglected. Other
problems included missing important professional meetings and workshops due to lack of a
substitute, excessive supervisory responsibility, stress, and a somewhat weak job description
regarding time allocation per area of responsibility. 22
21 Heath, J. A., & Vik, P. (1993). Stretched thin in rural America: A study of districts combining the superintendency and the
principalship. ERS Spectrum, 11(2), 3–9. 22 Klein, R. E. (1988). Combination administrative positions in North Dakota schools. Paper presented at the Annual Conference
Instructional Delivery System OSPR – Best Practices
Page 2-24
RECOMMENDATION
Evaluate the district’s administrative staff’s current duties to determine if re-assignment,
reduced staffing, or abandonment of nonessential duties should be considered in order to
prioritize the important role of an effective instructional leader/coach.
Much of the research on instructional leadership has been focused mostly on the context of urban
or suburban school districts with “fatter” decision making structures.23 There are few studies
focused on the challenges of leadership in rural districts, specifically those districts where there
is only one administrator serving in multiple roles. This problem is confounded by the fact that
some of the mandates passed at the federal level and state level often do not consider this unique
situation of rural educators. In assisting superintendents and principals in their unique roles, it is
important to provide support in understanding which areas within the district need the most
attention in a time of critical teacher shortage and financial crisis within the state of Oklahoma.
To improve the instructional leadership component, district administration should establish goals
that are based on the results of this review then prioritize these goals according to most critical
and attainability. This prioritizing activity may include abandonment of tasks or reassigning staff
positions. As indicated in focus group comments from the staff in many of these small schools,
mentoring/ coaching teachers proved to be a weak area within the instructional leadership
component. Considering the state’s teacher shortage, mentoring/coaching should be marked as a
high priority.
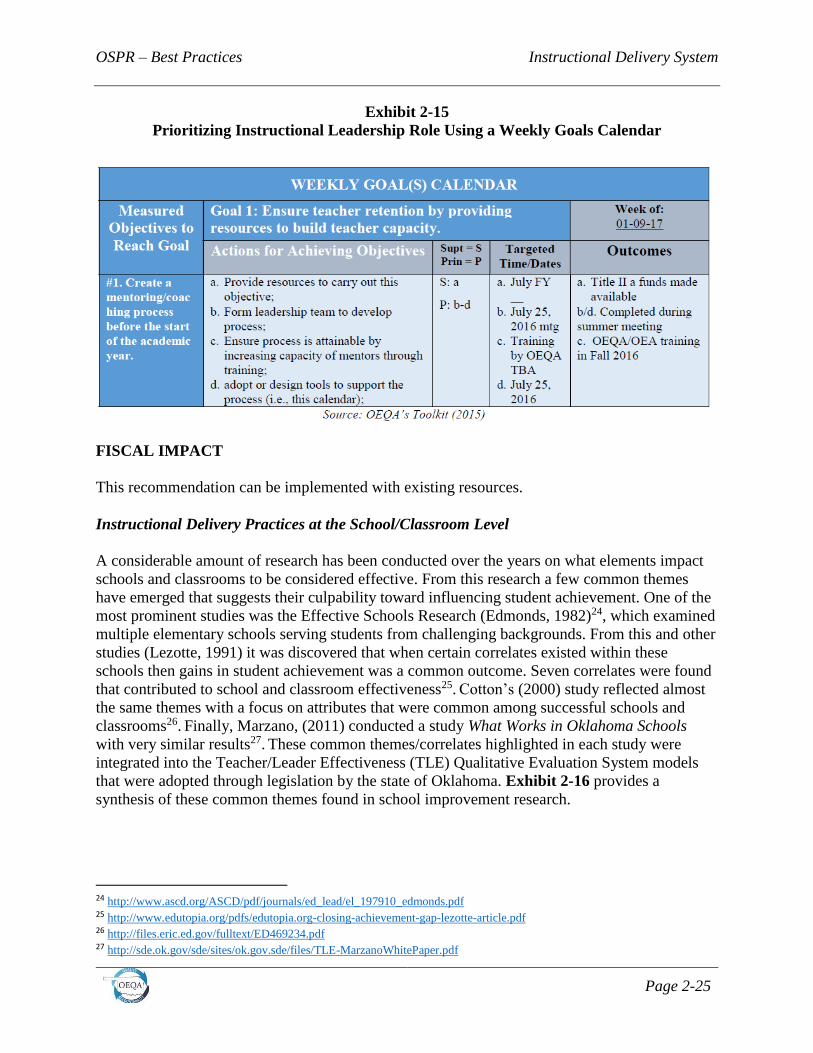
A snapshot sample (Exhibit 2-15) of a Weekly Goals Calendar focuses on the goal of “ensuring
teacher retention by providing resources to build teacher capacity”. Measurable objectives for
accomplishing that goal are written at the time the goal is set into the strategic plan for the new
school year. Later, the Actions for Achieving the Objectives, Targeted Time/Dates and
Description of Outcomes should be written into the calendar. This tool, if adopted, could be used
for implementing the above recommendation (See full example in Appendix D – Chapter 2
Resources).
of the National Rural Education Association, Bismarck, ND. Retrieved from http://www.eric.ed.gov/PDFS/ED309010.pdf 23 http://www.wallacefoundation.org/knowledge-center/school-leadership/key-research/Documents/Investigating-the-Links-to-
Improved-Student-Learning-Key-findings-from-wallace.pdf
OSPR – Best Practices Instructional Delivery System
Page 2-25
Exhibit 2-15
Prioritizing Instructional Leadership Role Using a Weekly Goals Calendar
FISCAL IMPACT
This recommendation can be implemented with existing resources.
Instructional Delivery Practices at the School/Classroom Level
A considerable amount of research has been conducted over the years on what elements impact
schools and classrooms to be considered effective. From this research a few common themes
have emerged that suggests their culpability toward influencing student achievement. One of the
most prominent studies was the Effective Schools Research (Edmonds, 1982)24, which examined
multiple elementary schools serving students from challenging backgrounds. From this and other
studies (Lezotte, 1991) it was discovered that when certain correlates existed within these
schools then gains in student achievement was a common outcome. Seven correlates were found
that contributed to school and classroom effectiveness25. Cotton’s (2000) study reflected almost
the same themes with a focus on attributes that were common among successful schools and
classrooms26. Finally, Marzano, (2011) conducted a study What Works in Oklahoma Schools
with very similar results27. These common themes/correlates highlighted in each study were
integrated into the Teacher/Leader Effectiveness (TLE) Qualitative Evaluation System models
that were adopted through legislation by the state of Oklahoma. Exhibit 2-16 provides a
synthesis of these common themes found in school improvement research.
24 http://www.ascd.org/ASCD/pdf/journals/ed_lead/el_197910_edmonds.pdf 25 http://www.edutopia.org/pdfs/edutopia.org-closing-achievement-gap-lezotte-article.pdf 26 http://files.eric.ed.gov/fulltext/ED469234.pdf 27 http://sde.ok.gov/sde/sites/ok.gov.sde/files/TLE-MarzanoWhitePaper.pdf

Instructional Delivery System OSPR – Best Practices
Page 2-26
Exhibit 2-16
Common Themes Contributing to Effective Schools & Classrooms
Themes
Effective Schools
Research Edmonds, Brookover &
Lezotte (1982)
The Schooling
Practices that Matter
Most Cotton (2000)
What Works in
Oklahoma Schools Marzano (2011)
Instructional Leadership Instructional Leadership Strong Administrative
Leadership Leadership
Vision/Mission/Goals Clear & Focused Mission Primary Focus on
Learning Comprehensive &
Effective Planning
Climate/Culture Safe & Orderly
Environment
Safe & Orderly School/
Supportive Classroom
Environment School Culture
Expectations Climate of High
Expectations X X
Evaluation &
Monitoring Frequent Monitoring of
Student Progress Monitoring Student
Progress Classroom Evaluation
& Assessment
Parental/Home/School Positive Home School
Relations Parent & Community
Involvement Student, Family, &
Community Support
Protected
Teaching/Learning Opportunity to Learn &
Student Time on Task
Clear & Focused
Instruction; Maximizing
Learning Time
Organizational
Structure & Resources;
Curriculum &
Instruction Source: OEQA Synthesis of School Improvement Research (2016)
Once the TLE was adopted, school districts were to select from the available models. A majority
of the Oklahoma Public Schools chose the Tulsa Public Schools’ TLE Observation and
Evaluation System (Tulsa Model) to evaluate the effectiveness of teachers specifically targeting
their capacity for instructional delivery. The Tulsa model is divided into five domains with each
domain having a designated weight within a 100-point system. Two of the domains with the
highest weight are Classroom Management with 30 percent and Instructional Effectiveness
having a weight of 50 percent.
As demonstrated in the distribution of weights, the effectiveness of instructional delivery at the
classroom level is considered as having the most impact on a student’s success in school. Tucker
and Strange (2005) linked the evaluation of teacher effectiveness with student achievement. It is
now known, empirically, that effective teachers have a direct influence in enhancing student
learning. Years of research on teacher quality support the fact that effective teachers not only
make students feel good about school and learning, but also that their work actually results in
increased student achievement. Studies have substantiated that a whole range of personal and
professional qualities are associated with higher levels of student achievement. For example,
verbal ability, content knowledge, pedagogical knowledge, ability to use a range of teaching
strategies skillfully, and enthusiasm for the subject characterize more successful teachers28.
28 http://www.ascd.org/publications/books/104136/chapters/The-Power-of-an-Effective-Teacher-and-Why-We-Should-Assess-
It.aspx
OSPR – Best Practices Instructional Delivery System
Page 2-27
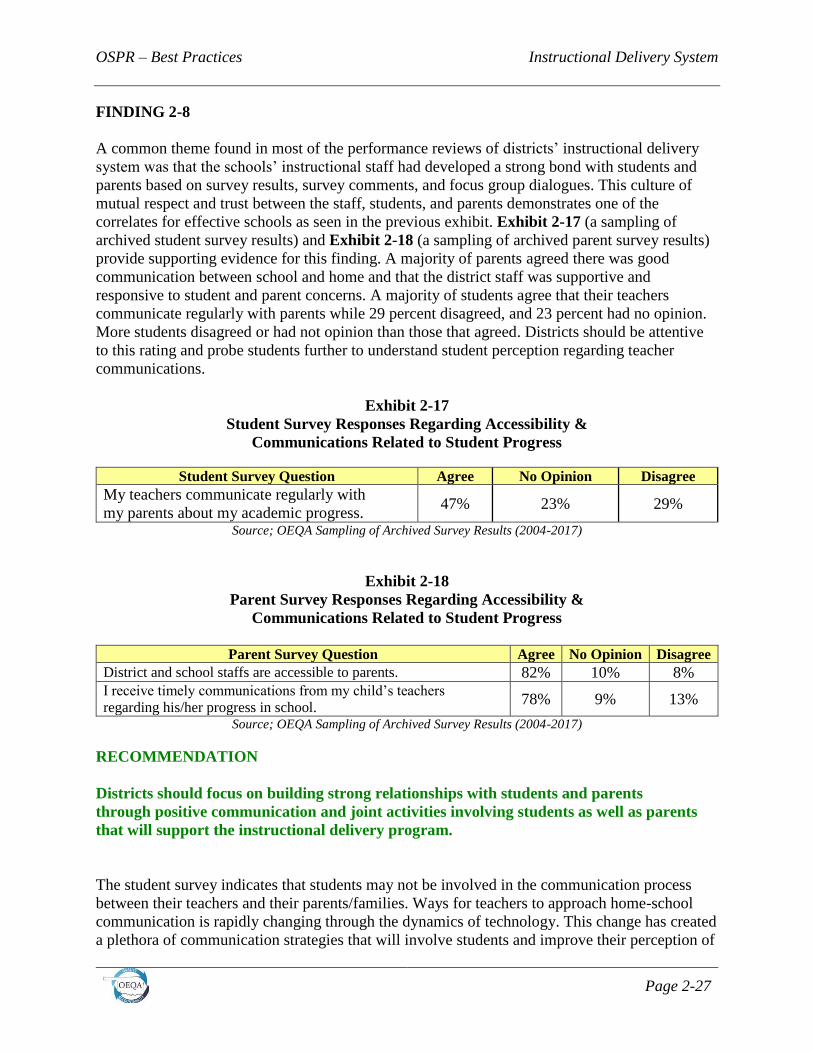
FINDING 2-8
A common theme found in most of the performance reviews of districts’ instructional delivery
system was that the schools’ instructional staff had developed a strong bond with students and
parents based on survey results, survey comments, and focus group dialogues. This culture of
mutual respect and trust between the staff, students, and parents demonstrates one of the
correlates for effective schools as seen in the previous exhibit. Exhibit 2-17 (a sampling of
archived student survey results) and Exhibit 2-18 (a sampling of archived parent survey results)
provide supporting evidence for this finding. A majority of parents agreed there was good
communication between school and home and that the district staff was supportive and
responsive to student and parent concerns. A majority of students agree that their teachers
communicate regularly with parents while 29 percent disagreed, and 23 percent had no opinion.
More students disagreed or had not opinion than those that agreed. Districts should be attentive
to this rating and probe students further to understand student perception regarding teacher
communications.
Exhibit 2-17
Student Survey Responses Regarding Accessibility &
Communications Related to Student Progress
Student Survey Question Agree No Opinion Disagree
My teachers communicate regularly with
my parents about my academic progress. 47% 23% 29%
Source; OEQA Sampling of Archived Survey Results (2004-2017)
Exhibit 2-18
Parent Survey Responses Regarding Accessibility &
Communications Related to Student Progress
Parent Survey Question Agree No Opinion Disagree
District and school staffs are accessible to parents. 82% 10% 8% I receive timely communications from my child’s teachers
regarding his/her progress in school. 78% 9% 13%
Source; OEQA Sampling of Archived Survey Results (2004-2017)
RECOMMENDATION
Districts should focus on building strong relationships with students and parents
through positive communication and joint activities involving students as well as parents
that will support the instructional delivery program.
The student survey indicates that students may not be involved in the communication process
between their teachers and their parents/families. Ways for teachers to approach home-school
communication is rapidly changing through the dynamics of technology. This change has created
a plethora of communication strategies that will involve students and improve their perception of
Instructional Delivery System OSPR – Best Practices
Page 2-28
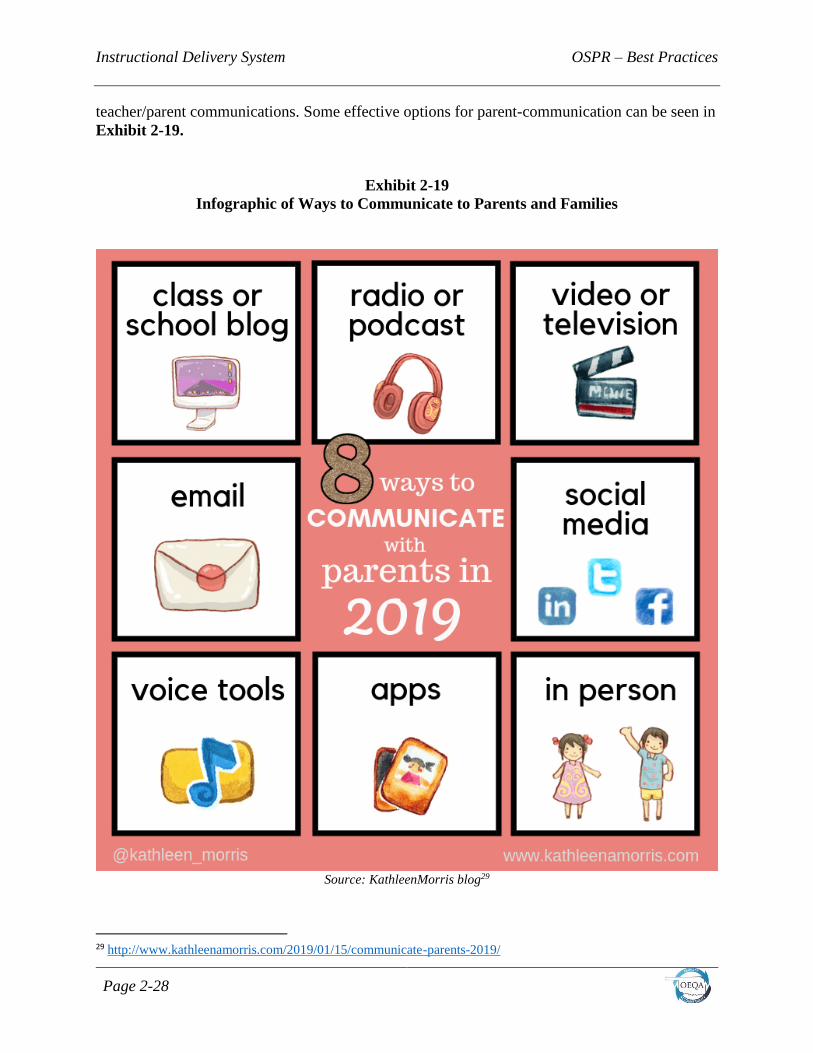
teacher/parent communications. Some effective options for parent-communication can be seen in
Exhibit 2-19.
Exhibit 2-19
Infographic of Ways to Communicate to Parents and Families
Source: KathleenMorris blog29
29 http://www.kathleenamorris.com/2019/01/15/communicate-parents-2019/
OSPR – Best Practices Instructional Delivery System
Page 2-29
Many schools have now initiated a school app for teachers to use to communicate with their
students and parents. An example is the Class Dojo, which allows students to create their own
icons and create portfolios while sending class photos and comments to parents anytime. The app
is free for teachers to use.30
FISCAL IMPACT
This recommendation can be implemented with existing resources.
FINDING 2-9
It was observed that some districts had limited processes of accountability to monitor and ensure
that all Oklahoma Academic Standards (formerly PASS) are taught and tested with fidelity.
There is no evidence to indicate all curricula are paced with the blueprints and presented in an
expedient approach.
The consulting teams found that most districts requested teachers to submit their lesson plans
electronically or hard copy to the principal. In some cases, teachers were required to document
when OAS objectives were taught. However, input from interviews and focus group discussions
indicated lesson plans most generally were not monitored consistently to assess fidelity. It
appears that more feedback of lesson plans could provide teachers with clear directions regarding
curricular adjustments based on assessment.
Lesson plans can be the tool for monitoring and ensuring all standards are taught. In addition to
lesson plans the teacher evaluation process, (TLE), is a primary tool for monitoring the OAS.
The Instructional Effectiveness Domain requires that the “teacher understands and optimizes the
delivery focus of current state standards and the expectations derived from same on student
learning and achievement”. Evidence was limited or not presented to indicate how this was
effectively implemented.
Without a system in place to monitor with consistency whether teachers are delivering
instruction based on the state’s adopted standards and prescribed blueprints, students will
struggle on state assessments. When reviewing a district’s Profile Report (OEQA) over the past
three years (see Exhibits in the Student Performance section of this chapter), it appears that many
students in grades 3-8 are below proficient in the core subjects of math and reading. Ensuring
that critical standards and objectives, as indicated on the blueprints, are introduced and taught to
mastery will strengthen student performance on end of the year assessments.
RECOMMENDATION
Implement an accountability process to ensure all OAS objectives are taught, tested, and
paced with fidelity.
School principals should monitor and set expectations that all instruction is based on OAS
30 https://static.classdojo.com/docs/TeacherResources/PrincipalPD/2018-PrincipalPD.pdf
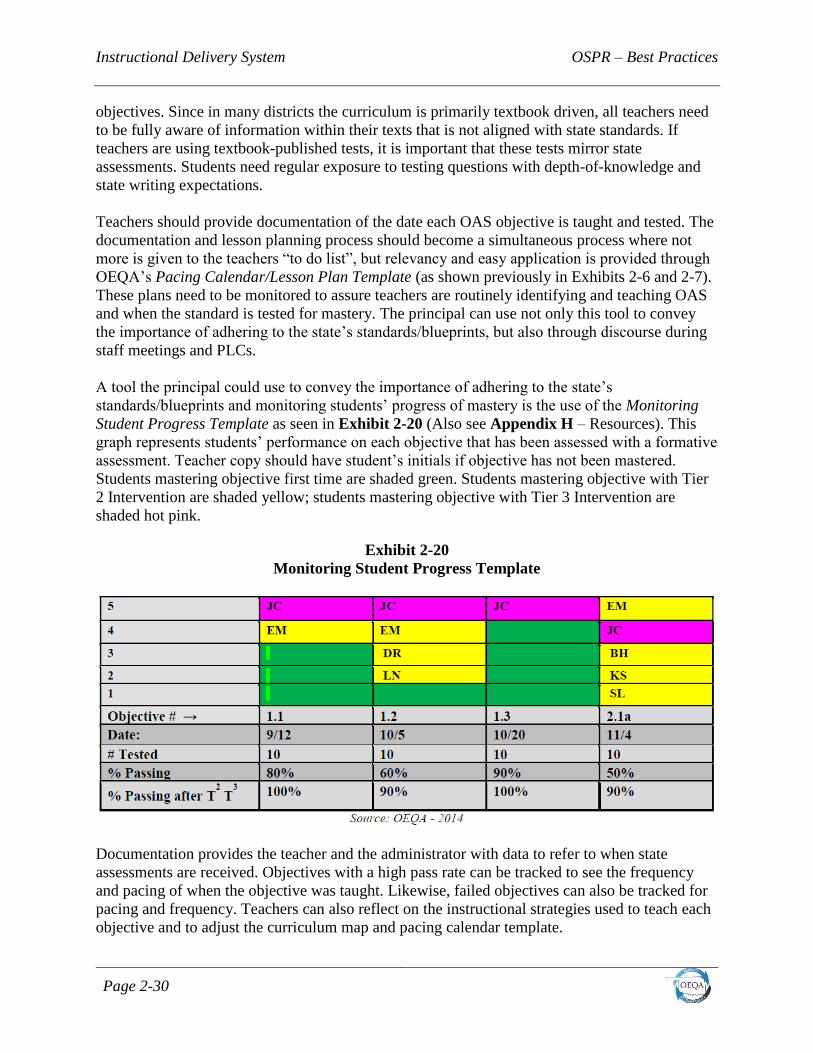
Instructional Delivery System OSPR – Best Practices
Page 2-30
objectives. Since in many districts the curriculum is primarily textbook driven, all teachers need
to be fully aware of information within their texts that is not aligned with state standards. If
teachers are using textbook-published tests, it is important that these tests mirror state
assessments. Students need regular exposure to testing questions with depth-of-knowledge and
state writing expectations.
Teachers should provide documentation of the date each OAS objective is taught and tested. The
documentation and lesson planning process should become a simultaneous process where not
more is given to the teachers “to do list”, but relevancy and easy application is provided through
OEQA’s Pacing Calendar/Lesson Plan Template (as shown previously in Exhibits 2-6 and 2-7).
These plans need to be monitored to assure teachers are routinely identifying and teaching OAS
and when the standard is tested for mastery. The principal can use not only this tool to convey
the importance of adhering to the state’s standards/blueprints, but also through discourse during
staff meetings and PLCs.
A tool the principal could use to convey the importance of adhering to the state’s
standards/blueprints and monitoring students’ progress of mastery is the use of the Monitoring
Student Progress Template as seen in Exhibit 2-20 (Also see Appendix H – Resources). This
graph represents students’ performance on each objective that has been assessed with a formative
assessment. Teacher copy should have student’s initials if objective has not been mastered.
Students mastering objective first time are shaded green. Students mastering objective with Tier
2 Intervention are shaded yellow; students mastering objective with Tier 3 Intervention are
shaded hot pink.
Exhibit 2-20
Monitoring Student Progress Template
Documentation provides the teacher and the administrator with data to refer to when state
assessments are received. Objectives with a high pass rate can be tracked to see the frequency
and pacing of when the objective was taught. Likewise, failed objectives can also be tracked for
pacing and frequency. Teachers can also reflect on the instructional strategies used to teach each
objective and to adjust the curriculum map and pacing calendar template.
OSPR – Best Practices Instructional Delivery System
Page 2-31
FISCAL IMPACT
This recommendation can be implemented with existing resources.
FINDING 2-10
Not all classrooms provide structured transitioning environments that ensure maximized learning
time and optimal student engagement. During onsite visits, the consulting teams noticed a lack of
focused structure in transitioning at both primary and intermediate levels, but more specifically
to be the most distracting at the intermediate level where students are in departmentalized
classrooms.
Providing structure in a departmentalized environment that focuses on maximizing learning time
is critical for student success. Procedures and expectations must play a major role for ensuring
that time is not wasted during transitions. Teachers must have classroom management skills in
addition to their content-area expertise.
Research provides evidence that there are also risks associated with departmentalization:
High poverty students are particularly vulnerable in departmentalization. More than
anything else in a classroom, they need the safe, secure support of a trusted teacher.
When students change teachers several times a day, they may not relate to any of their
teachers as well as they would when they have one teacher. The little research that does
exist on departmentalization suggests that this type of program has negative effects for
elementary children. Several studies have found elementary students in departmentalized
classrooms show lower levels of achievement than children in self-contained
classrooms31.
There was little evidence presented in some districts comprehensively implemented best
practices required for successful departmentalization. The longitudinal test scores, student
demographic data, and the state’s A-F Report Card indicate the need for change in transitioning
practices.
RECOMMENDATION
Maximize learning time by instituting best practices for improving transition efficiency and
effectiveness of departmentalization.
School leaders along with staff involved in departmentalized grades should review current
practices that are used for transitioning students from class to class with a focus for improving
those practices. Some ideas to discuss and to possibly integrate include:
Successful departmentalization takes organizational structure and planning.
31 Canady, R., Retting, M. (1995). The power of innovative scheduling: productive use of time and space. Educational
Leadership. November.
Instructional Delivery System OSPR – Best Practices
Page 2-32
Simultaneously teachers must continually monitor students’ progress, emotional needs,
and behavior issues and communicate with parents.
Organization in daily routine is also crucial.
Daily routines are kept consistent in all classrooms.
Consistent rules, discipline procedures and organizational strategies must be common
among all teachers.
Behavior expectations and standards must be the same throughout all classrooms.
Assignment calendars are necessary, so all teachers know the homework load of
students32.
The critical outcome of “lost time” for instruction is the focus for the improvement effort
recommended here. One of the best investments a district could make for its teachers’
professional learning focus would be to purchase the Tools for Teaching book or E-book33. This
book is filled with excellent strategies for teachers to implement in reducing wasted time and
increasing instructional time. One such concept from this book follows:
For students, no matter how much time you give them for a lesson/class transition, they
will need more. There is no reason to hustle. Students know that as soon as the lesson
transition is over, you will put them back to work. They have a vested interest in
dawdling. For that reason, lesson transitions are one of the great sinkholes of lost learning
time in the classroom. A typical lesson transition takes about five minutes. If students
were to hustle, the transition could be accomplished in 30 seconds. During the course of a
day, the difference between dawdling and hustling adds up to a lot of lost learning time34.
The author (Jones, 2014) suggests giving students a time allowance as compared with a parent
giving an adolescent a money allowance. This allowance is earned and it provides a great
motivator for students to use their time wisely.
Since many of the districts reviewed by OEQA serve a large percentage of students from
poverty, it is imperative to reduce factors that might prevent students from succeeding in school.
Research indicates that self-contained classrooms allow students to become well acquainted with
their teacher. Many of the small district schools have an advantage in that there are only a few (2
or 3) teachers (with additional time with special education teacher for some students) for students
to be accustomed to, thus this risk factor is minimized.
FISCAL IMPACT
This recommendation can be implemented with existing resources. However, the cost of the
suggested E-book is provided below.
32 Burts, D., Charlesworth, R, Hart, C. (1997). Integrated curriculum and developmentally appropriate practice: Birth to eight.
(pp.42-46). Albany: State University of New York Press. 33 http://www.fredjones.com/#!tools-for-teaching/cx3 34http://www.educationworld.com/a_curr/columnists/jones/jones035.shtml
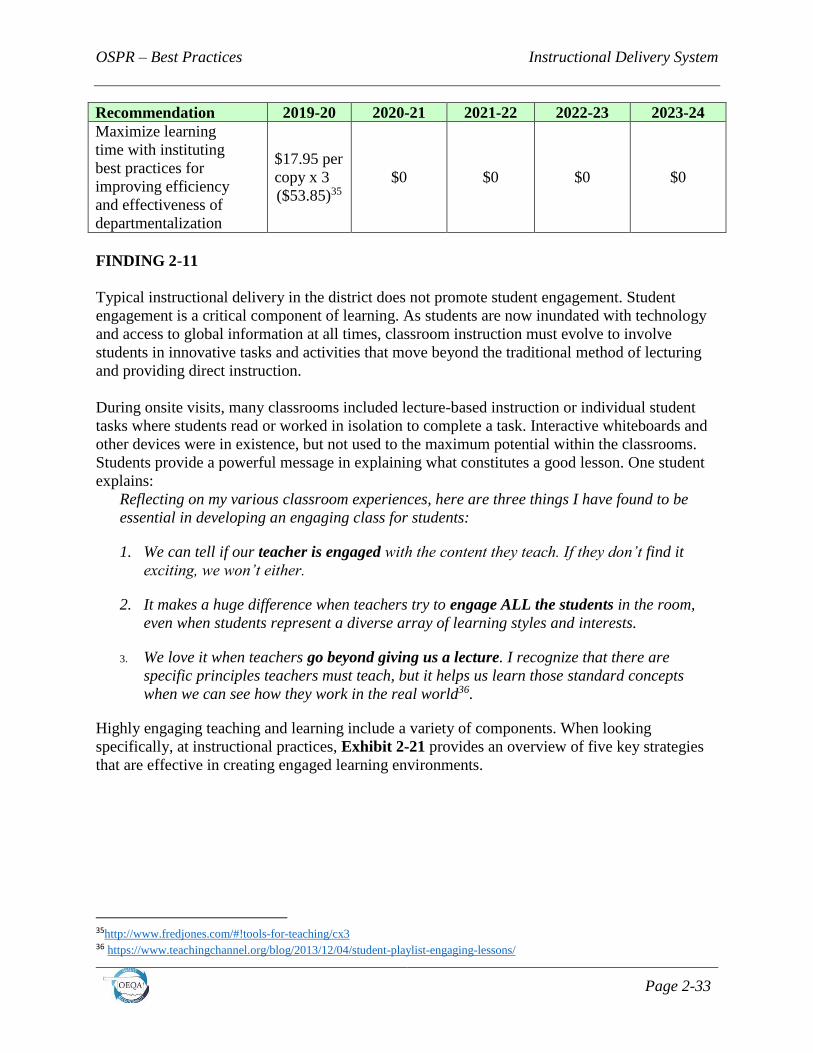
OSPR – Best Practices Instructional Delivery System
Page 2-33
Recommendation 2019-20 2020-21 2021-22 2022-23 2023-24
Maximize learning
time with instituting
best practices for
improving efficiency
and effectiveness of
departmentalization
$17.95 per
copy x 3
($53.85)35
$0 $0 $0 $0
FINDING 2-11
Typical instructional delivery in the district does not promote student engagement. Student
engagement is a critical component of learning. As students are now inundated with technology
and access to global information at all times, classroom instruction must evolve to involve
students in innovative tasks and activities that move beyond the traditional method of lecturing
and providing direct instruction.
During onsite visits, many classrooms included lecture-based instruction or individual student
tasks where students read or worked in isolation to complete a task. Interactive whiteboards and
other devices were in existence, but not used to the maximum potential within the classrooms.
Students provide a powerful message in explaining what constitutes a good lesson. One student
explains:
Reflecting on my various classroom experiences, here are three things I have found to be
essential in developing an engaging class for students:
1. We can tell if our teacher is engaged with the content they teach. If they don’t find it
exciting, we won’t either.
2. It makes a huge difference when teachers try to engage ALL the students in the room,
even when students represent a diverse array of learning styles and interests.
3. We love it when teachers go beyond giving us a lecture. I recognize that there are
specific principles teachers must teach, but it helps us learn those standard concepts
when we can see how they work in the real world36.
Highly engaging teaching and learning include a variety of components. When looking
specifically, at instructional practices, Exhibit 2-21 provides an overview of five key strategies
that are effective in creating engaged learning environments.
35http://www.fredjones.com/#!tools-for-teaching/cx3 36 https://www.teachingchannel.org/blog/2013/12/04/student-playlist-engaging-lessons/
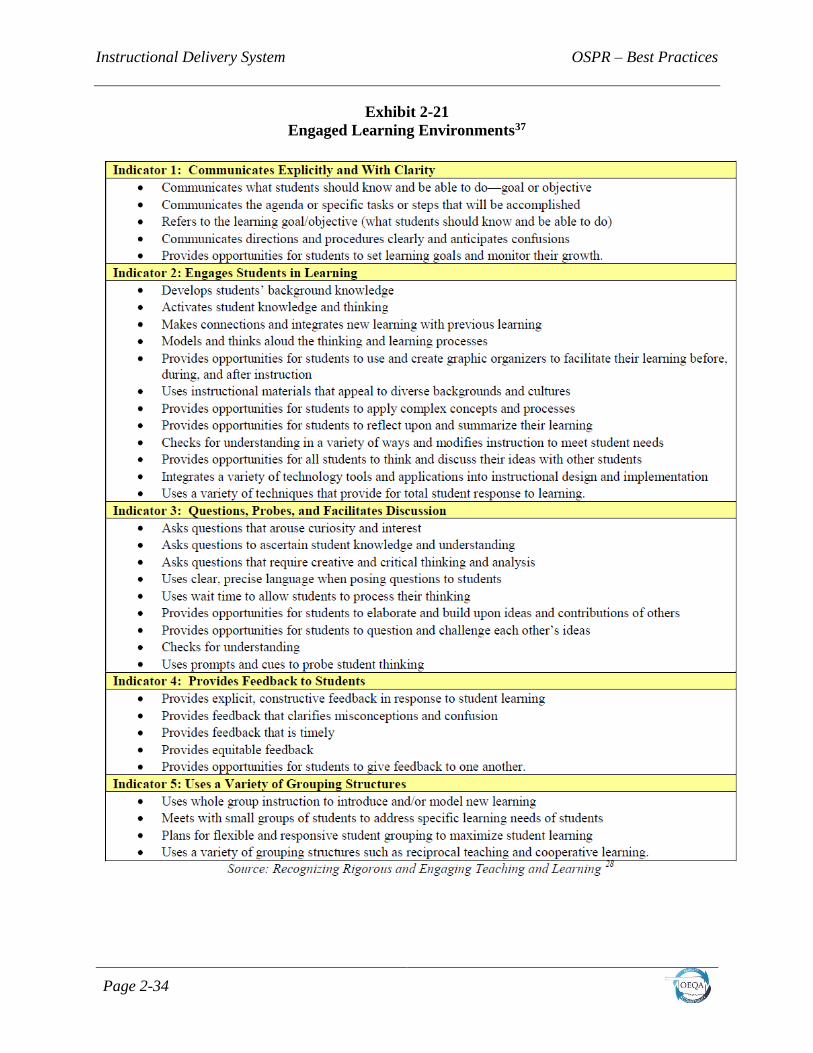
Instructional Delivery System OSPR – Best Practices
Page 2-34
Exhibit 2-21
Engaged Learning Environments37

OSPR – Best Practices Instructional Delivery System
Page 2-35
RECOMMENDATION
Enhance instruction through the use of student engagement strategies and innovative
practices.
Districts should provide additional support for teachers to implement strategies to support
student engagement and innovative practices. Some examples include the use of effective models
that incorporate engagement strategies. Examples of videos from the Teaching Channel include:
Learn by Leading shows students who are invested in what they are doing, and it is
evident how integral the teacher’s role is in this engagement. Rather than sitting at her
desk while students work on their project, she asks them questions that help them better
understand the material. Also, the project provides an example of a strategy for helping
students learn the content using a hands-on approach.
Differentiating with Learning Menus shows how a teacher can find ways to engage all of
the students in the room. The learning menu represents a creative way to try and address
the learning styles of all students. A complex lesson will inevitably reach some students
in certain ways, while other students will respond to different methods and approaches of
teaching the same information. The menu style helps with this challenge. The students
also have positive reactions to the learning menu, which provides evidence that the
strategy is effective.
Making DNA Concrete & Comprehensible uses an engaging lesson strategy showing how
the teacher taught a complex subject in such a fun way. This video provides an example
of the way in which two teachers can teach the exact same lesson but in different ways,
and the outcome can be completely different.38
School leaders should lead a discussion and include reflective questions to help teachers analyze
the impact of the engagement strategies. Examples may include:
What evidence of student engagement did you observe?
How might you utilize one of the strategies in your classroom?
Additional professional development that focuses on effective teaching strategies and innovative
practices with students could further enhance instruction. Some examples of free professional
development available to Oklahoma educators include:
K20 Innovative Learning Institute;39
Oklahoma State Department of Education conferences; and
38 https://www.teachingchannel.org/ 39 http://k20center.ou.edu/index.php/programs/ili/

Instructional Delivery System OSPR – Best Practices
Page 2-36
EdCampOKC.40
FISCAL IMPACT
This recommendation can be implemented with existing resources.
FINDING 2-12
According to student survey responses, school libraries do not meet the needs of all
students. Exhibit 2-22 shows that that 25 percent of students disagree that the school library
meets their needs for books and other resources while 52 percent agree, and 24 percent have no
opinion.
Exhibit 2-22
Student Survey Results Regarding the School Library
Survey Question Agree No Opinion Disagree
The school library meets my needs for
books and other resources. 52% 24% 25%
Source: OEQA Sampling of Archived Surveys (2004-2017)
It was found in many of the schools that the library had limited hours available to students if the
media specialist also served as grade-level or content area teacher. Onsite interviews indicated
that the library might be open for the first three hours of the day for check-in and check-out
purposes, but not open for full service throughout the day. This could possibly lead to the
perception of students that the library is not meeting their needs. Other sites have full-time
library assistants to help with library duties, but do not have the training to ensure appropriate
resources are available and/or sufficient supply of resources on hand.
RECOMMENDATION
Improve Library resources and services to meet the needs of students and staff by
increasing staffing hours and employing existing and emerging technologies to access,
evaluate, and disseminate information for integration into instructional programs.
Further investigation using student focus groups to discover what the students’ needs or desires
are for improving the library is certainly a first step. Also, a review of best practices for school
libraries could contribute to enhancing the current library sources.
Effective libraries and media resources support a strong instructional program. As noted on the
SDE website:
School libraries launch students into a world of new knowledge by providing instant
access to exciting books, online resources, and emerging technologies. They provide
equal opportunities to all students for learning41.
40 http://www.edcampokc.org/ 41 http://ok.gov/sde/library-media

OSPR – Best Practices Instructional Delivery System
Page 2-37
The Oklahoma accreditation standards (210:35-7-74 p.63) outline what should be included in
annual expenditures for library resources:
In establishing a balanced print and nonprint collection…the following may be
included: books, periodicals, pamphlets, manuscripts, reports, prints, posters,
microforms, multimedia packages or kits, specimens, realia, models, audio and
video recording, online databases, slides, computer disks, films, compact discs,
video discs, and computer software.
Schools need a broader coordination and use of library resources and materials within all
classrooms, particularly the upper grades. The PLC process, implemented with fidelity, could
provide the librarian/library assistant with the vehicle to coordinate with classroom teachers and
synchronize the library resources with classroom curriculum and instruction.
Grant programs such as the Innovative Instruction Grant provides for the purchase of many new
learning resources. Read 180 is a scholastic program included in the grant. It will support the
library and teaching staff with materials that enhance the curriculum. Not only does Read 180
provide resources, it does so through the following components:
Whole-Group instruction – teachers begin the class by facilitating systematic instruction
in reading skills and strategies, academic vocabulary, writing, and grammar to the whole
class.
Instructional Technology – students work independently on the READ 180 Software
where they follow an individualized learning path that allows them to work within their
zone of proximal development.
Small Group – students receive individualized, data-driven instruction that meets their
unique learning needs while building meaningful relationships with their teacher.
Independent Reading – students engage with complex, content-rich literature, and
informational texts that they can read with success and apply their newly acquired
vocabulary and comprehension skills42.
Students grow academically and learn from experiencing integrated instruction as described. The
link between the classroom and the library can become the tipping point for turning students on
to learning. The teamwork between the librarian and classroom teachers enables students to
locate resources, design research, and integrate instructional technology into learning activities.
Students can broaden their personal interests and generate the desire to read and to learn. The
library can be the driving force for keeping students engaged in learning.
42 http://www.scholastic.com/read180/read-180-experience/3-models-of-blended-learning.htm
Instructional Delivery System OSPR – Best Practices
Page 2-38
FISCAL IMPACT
This recommendation can be implemented with grant resource.
Instructional Delivery & Local Assessments
Assessments include everything from statewide accountability tests to district benchmarks or
interim tests to everyday classroom tests. In order to contend with what some feel to be an over
use of testing, educators should frame their view of testing as an opportunity to gain valuable
information related to student learning of the content that has been taught. The more information
we have about students, the clearer the picture we have about achievement or where gaps may
occur. The Association for Middle Level Education (AMLE) explains that “in a balanced
assessment system, both summative and formative assessments are an integral part of
information gathering”43.
Summative assessments are given periodically to determine at a particular point in time what
students know and do not know. Summative assessment at the district/classroom level is an
accountability measure that is generally used as part of the grading process. Below are some
examples of summative assessments:
• State assessments (OCCTs, EOIs)
• District benchmark or interim assessments (STAR, Study Island…etc.)
• End-of-unit or chapter tests/ semester exams
• Scores that are used for accountability for schools (A-F Report Cards) and students
(report card grades).
Formative Assessments are a critical part of the instructional process. Such assessments inform
teachers about student understanding at a point when timely adjustments can be made before it is
too late. When integrated into daily practice formative assessments provide the information
needed to adjust teaching and learning while they are happening. These adjustments help to
ensure students achieve targeted standards-based learning goals within a set time frame. AMLE
gives an excellent frame of reference for formative assessments:
There are many classroom instructional strategies that are part of the repertoire of good
teaching. When teachers use sound instructional practice for the purpose of gathering
information on student learning, they are applying this information in a formative way. In
this sense, formative assessment is pedagogy and clearly cannot be separated from
instruction. It is what good teachers do. The distinction lies in what teachers actually do
with the information they gather. How is it being used to inform instruction? How is it
being shared with and engaging students? It's not teachers just collecting information/data
on student learning; it's what they do with the information they collect44.
43 https://www.amle.org/BrowsebyTopic/WhatsNew/WNDet/TabId/270/ArtMID/888/ArticleID/286/Formative-and-Summative-
Assessments-in-the-Classroom.aspx 44 Ibid
OSPR – Best Practices Instructional Delivery System
Page 2-39
FINDING 2-13
Some districts have no system-wide processes for effective use of formative assessments for
frequent monitoring of student academic achievement. In the past some have relied upon various
vendors’ benchmark assessments, which provided a great deal of direction and positive impact
on instruction and student achievement for students in grades 3-8 and high school. However, no
intentional or formalized processes for implementing formative assessments were observed or
shared during several onsite reviews. In order to implement the Teacher Evaluation framework
with fidelity, teachers need a foundational knowledge base and an extensive repertoire of best
practices in the use of formative assessments.
Input from interviews and focus group discussions indicated the teaching staff is not clear in the
expectations and use of formative assessment. Some teachers referred to giving summative tests
for grades at the end of a teaching segment and then moving to new content. Teachers were
aware of the state’s Blueprints, but there was little dialog to indicate how these documents were
used to pace the content or use formative assessments to determine mastery. Formative
assessments do not have to take an inordinate amount of time. Most are quick and easy to
incorporate into daily practice. The time it takes teachers to formatively assess students
can reduce the time it takes for such things as re-teach, remediation, do-overs, ineligibilities, and
course recovery.
RECOMMENDATION
Implement procedures to ensure a sound knowledge base and application of formative
assessments.
As the instructional leader, principals can deepen the formative assessment knowledge base
through the use of dialog and discussion during staff development days, staff meetings, PLC
collaborative meetings, and book studies. Leaders should set clear and explicit expectations for
implementing formative assessments. They must help teachers understand how formative
assessment interfaces with the teacher evaluation process. Leading teachers to resources that will
support their efforts in implementing this recommendation is critical. Cyberspace is saturated
with videos, free ideas, and practical activities and resources for teachers.
If the district implements Professional Learning Communities with fidelity it can also be an
effective vehicle for supporting widespread use of formative assessment. Greater implementation
of formative assessment and use of the data it generates is an important step in continued
movement to student-centered classrooms and improved student achievement. Exhibit 2-23
provides an example of the plethora of formative assessments teachers can incorporate into
teaching segments.45
45 http://images.pcmac.org/SiSFiles/Schools/TN/GreenevilleCity/GreenevilleHigh/Uploads/DocumentsCategories/Documents/form
atvie%20assessment.pdf
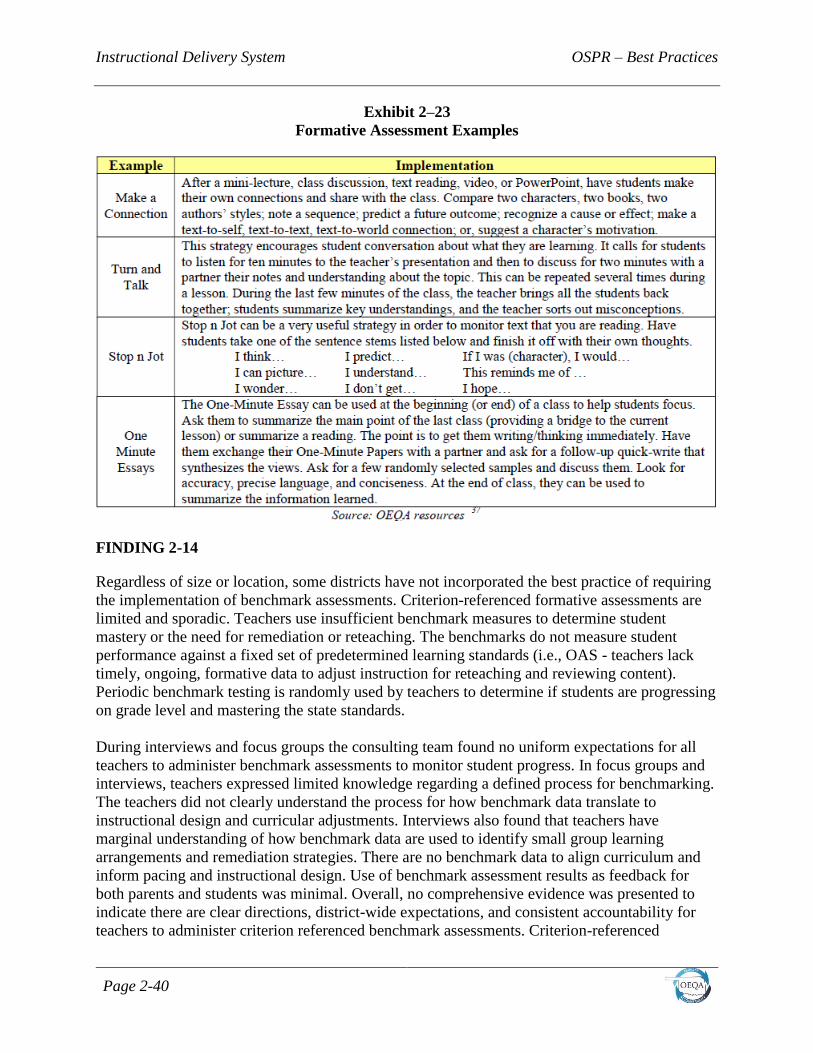
Instructional Delivery System OSPR – Best Practices
Page 2-40
Exhibit 2–23
Formative Assessment Examples
FINDING 2-14
Regardless of size or location, some districts have not incorporated the best practice of requiring
the implementation of benchmark assessments. Criterion-referenced formative assessments are
limited and sporadic. Teachers use insufficient benchmark measures to determine student
mastery or the need for remediation or reteaching. The benchmarks do not measure student
performance against a fixed set of predetermined learning standards (i.e., OAS - teachers lack
timely, ongoing, formative data to adjust instruction for reteaching and reviewing content).
Periodic benchmark testing is randomly used by teachers to determine if students are progressing
on grade level and mastering the state standards.
During interviews and focus groups the consulting team found no uniform expectations for all
teachers to administer benchmark assessments to monitor student progress. In focus groups and
interviews, teachers expressed limited knowledge regarding a defined process for benchmarking.
The teachers did not clearly understand the process for how benchmark data translate to
instructional design and curricular adjustments. Interviews also found that teachers have
marginal understanding of how benchmark data are used to identify small group learning
arrangements and remediation strategies. There are no benchmark data to align curriculum and
inform pacing and instructional design. Use of benchmark assessment results as feedback for
both parents and students was minimal. Overall, no comprehensive evidence was presented to
indicate there are clear directions, district-wide expectations, and consistent accountability for
teachers to administer criterion referenced benchmark assessments. Criterion-referenced
OSPR – Best Practices Instructional Delivery System
Page 2-41
benchmark assessments yield formative data. Criterion-referenced assessments test student
knowledge and performance against a fixed set of content or a state standard. By using
benchmark results teachers learn what needs reviewing with individual students, as well as which
students have attained mastery and need to be challenged. Benchmarking also helps students
keep track of their grade level success and their progress to mastering standards46. With a
plethora of benchmark assessments to choose from, there are districts who have selected Study
Island for most tested subjects and testing grade levels. It is quite prevalent that high school
teachers in these districts, have chosen to use their own teacher created assessments that are
supported by the released items from the state department of education47.
Benchmark assessments are not summative (e.g. end of the year assessments) nor are these
assessments formative. The Assessment and Accountability Policy Center (AAPC) defined
benchmark assessments as follows:
Benchmark assessments are assessments administered periodically throughout the school
year, at specified times during a curriculum sequence, to evaluate students’ knowledge
and skills relative to an explicit set of longer-term learning goals. The design and choice
of benchmark assessments is driven by the purpose, intended users, and uses of the
instruments. Benchmark assessment can inform policy, instructional planning, and
decision-making at the classroom, school and/or district levels48.
Benchmark assessment operates best when it is seen as one component of a balanced assessment
system explicitly designed to provide the ongoing data needed to serve district, school, and
classroom improvement needs. The National Research Council (NRC) defines a quality
assessment system as one that is (a) coherent, (b) comprehensive, and (c) continuous (NRC,
2001)49.
RECOMMENDATION
Develop and implement district-wide processes and procedures for administering criterion-
referenced benchmark assessments to monitor progress and ensure mastery of OAS.
District leadership and teachers must embrace the mindset that benchmark assessments are a key
part of the learning process. Criterion-referenced benchmark assessments are an ongoing check
for student progress and mastery of content and standards. The assessment results guide teachers
in decision-making about future instruction. The principal should use staff meetings, PLC
meetings, and one-on-one dialogue to articulate expectations and raise awareness of the
importance of administering benchmarks.
The district could purchase software that generates benchmark tests assessing OAS. Teachers
can also create their own benchmarks using SDE resources. Several websites offer practical
information and examples of formative assessment. This will help administrators refresh teacher
46 https://www.edglossary.org/criterion-referenced-test/https://www.edglossary.org/criterion-referenced-test/ 47 http://sde.ok.gov/sde/documents/2013-09-05/blue-prints-plds-item-specs#Released Items 48 https://www.cse.ucla.edu/products/policy/R1_benchmark_polbrief_Herman.pdf 49 National Research Council. (2001). Knowing what students know: The science and design of educational assessment.
Washington, DC: National Academy of Sciences.
Instructional Delivery System OSPR – Best Practices
Page 2-42
awareness and understanding of the benefits for administering benchmark assessments.
FISCAL IMPACT
This recommendation can be implemented with existing resources initially. If it is determined
necessary, the district could contact an external firm to provide assistance.
D. STUDENT PERFORMANCE & DATA ANALYSIS
Oklahoma School Testing Program
Student assessment is an integral part of measuring student performance. The Oklahoma School
Testing Program (OSTP) continues implementation of the current standards-based tests that
students must take during the school year. The OCCT consist of Criterion-Referenced Tests
(CRTs) designed to measure student attainment of skills established for core subjects. The OCCT
helps monitor student and school performance relative to the OAS. The OSTP program uses a
phase-in process to increase tested grades and subjects. CRTs are currently administered in 3rd
through 8th grade. Exams are administered for selected grades and courses in this manner:
• third grade: Reading and Mathematics;
• fourth grade: Reading and Mathematics;
• fifth grade: Reading, Mathematics, Science, Social Studies, and Writing;
• sixth grade: Reading and Mathematics;
• seventh grade: Reading, Mathematics, and Geography; and
• eighth grade: Reading, Mathematics, Science, US History, and Writing.
Beginning in 2019, students enrolled in 11th grade are given the Oklahoma College and Career
Ready Assessment (CCRA), which will consist of two parts. For part one, each district
administers either the ACT or SAT, including the writing section. Part two consists of Science
Content Assessment which is aligned to the OAS for Science, and U.S. History Assessment
which is aligned to the OAS for U.S. History. Historically, Oklahoma districts have administered
either the ACT or SAT in 11th grade, as well as tested 10th grade students in science and history.
All students in the tested grades and subjects participate in the OSTP. The test results are for all
students who attend a Full Academic Year (FAY). Current administrative rules define FAY as
any student who has enrolled by October 1st. The SDE uses performance level descriptors
OSPR – Best Practices Instructional Delivery System
Page 2-43
(PLDs) advanced, proficient, basic and below basic in reporting student test scores. Also, test
scores are reported in one of the following four categories:
Advanced – Student demonstrates superior performance on challenging subject matter;
Proficient (called Satisfactory prior to 2009) – Student demonstrates mastery of
appropriate grade level subject matter and is ready for the next grade, course, or level of
education, as applicable;
Limited Knowledge – Student demonstrates partial mastery of the essential knowledge
and skills appropriate to his or her grade level, course, or level of education, as
applicable; and
Unsatisfactory – Student does not perform at least at the limited knowledge level.
To assist teachers and districts in teaching OAS and preparing students for the mandated
assessments, the Oklahoma State Department of Education (SDE) provides a variety of resources
on its website. These resources include the following:
OAS by subject and grade level;
test blueprints for each grade level and subject area test that show what percentage of the
test each skill will represent;
test/item specifications highlight important points about the items’ emphasis, stimulus
attributes, format, content limits, distracter domain, and sample test items;
released test questions;
writing samples;
a list of words, called the academic vocabulary that are used on each test; and
depth of knowledge (DOK) levels and percentage weights for all OCCT test questions in
test specifications.
Test Results
Exhibits 2-24 reflects five years (2011-12 to 2015-2016) of the State’s Average Math results on
the Oklahoma Core Curriculum Tests (OCCT). The 2016-17 assessments were not included
since the assessments were based on the new adopted Oklahoma Academic Standards. In review
of the five-year data chart, there were few changes in the percentage of students scoring
proficient from grade to grade. The only exception is seen in the percentage of students’ scoring
proficient in seventh grade Math as compared to how many of these students scored proficient in
during eighth grade. As noted in the table there was 10 to 12 percentage point decrease from
seventh grade to eighth grade math proficiency.
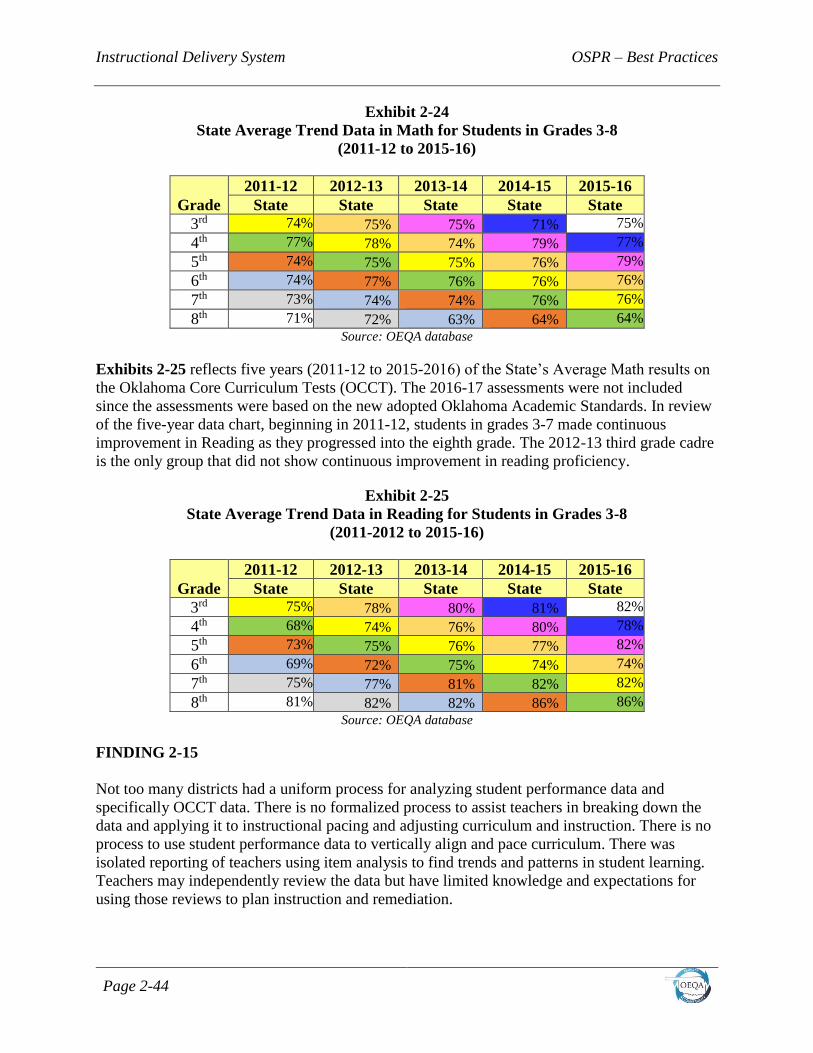
Instructional Delivery System OSPR – Best Practices
Page 2-44
Exhibit 2-24
State Average Trend Data in Math for Students in Grades 3-8
(2011-12 to 2015-16)
Grade
2011-12 2012-13 2013-14 2014-15 2015-16
State State State State State
3rd 74% 75% 75% 71% 75%
4th 77% 78% 74% 79% 77%
5th 74% 75% 75% 76% 79%
6th 74% 77% 76% 76% 76%
7th 73% 74% 74% 76% 76%
8th 71% 72% 63% 64% 64%
Source: OEQA database
Exhibits 2-25 reflects five years (2011-12 to 2015-2016) of the State’s Average Math results on
the Oklahoma Core Curriculum Tests (OCCT). The 2016-17 assessments were not included
since the assessments were based on the new adopted Oklahoma Academic Standards. In review
of the five-year data chart, beginning in 2011-12, students in grades 3-7 made continuous
improvement in Reading as they progressed into the eighth grade. The 2012-13 third grade cadre
is the only group that did not show continuous improvement in reading proficiency.
Exhibit 2-25
State Average Trend Data in Reading for Students in Grades 3-8
(2011-2012 to 2015-16)
Grade
2011-12 2012-13 2013-14 2014-15 2015-16
State State State State State
3rd 75% 78% 80% 81% 82%
4th 68% 74% 76% 80% 78%
5th 73% 75% 76% 77% 82%
6th 69% 72% 75% 74% 74%
7th 75% 77% 81% 82% 82%
8th 81% 82% 82% 86% 86%
Source: OEQA database
FINDING 2-15
Not too many districts had a uniform process for analyzing student performance data and
specifically OCCT data. There is no formalized process to assist teachers in breaking down the
data and applying it to instructional pacing and adjusting curriculum and instruction. There is no
process to use student performance data to vertically align and pace curriculum. There was
isolated reporting of teachers using item analysis to find trends and patterns in student learning.
Teachers may independently review the data but have limited knowledge and expectations for
using those reviews to plan instruction and remediation.
OSPR – Best Practices Instructional Delivery System
Page 2-45
There are no district-wide procedures or software to assist teachers in using OCCT data to
inform targeted instruction and form flex groups for targeted remedial instruction. There are no
standardized methodologies for disaggregation of data and looking for vertical learning gaps.
Random evidence was presented to indicate how student performance data collected at the end of
each grading period were used to plan re-teach, remediation, or maintaining mastery. There is no
district-wide use of student performance data to close skill gaps or reoccurring curricula
redundancies. Across the district, student performance data are not commonly used to plan,
adjust, pace, and design instruction and close skill gaps throughout the school year.
One of the longest-standing bodies of research is the “effective schools” research. One of the
original correlates of effective schools’ research is the “frequent monitoring of student progress.”
As stated by the University of Oklahoma’s research in effective schools:
The effective school frequently measures academic student progress through a variety of
assessment procedures. Assessment results are used to improve individual student
performance and improve instructional delivery. Assessment results will show that
alignment must exist between the intended, taught, and tested curriculum.50
More recently, effective schools research was conducted by the National Association of
Elementary School Principals (NAESP). NAESP published best practices for schools and
reported how the use of student achievement data must be included in instructional decision-
making. In a white paper, NAESP provided five recommendations to help principals put student
achievement data to the best possible use:
• make data part of the ongoing cycle of instructional improvement;
• teach students to examine their own data and set learning goals;
• establish a clear vision for school-wide data use;
• provide supports that foster a data-driven culture within the school; and
• develop and maintain a district-wide data system.22
RECOMMENDATION
Implement a district-wide process for analyzing student performance data throughout the
school year and use the analysis results to adjust curriculum and instruction.
The purpose of teachers analyzing classroom data is to determine what the students have learned,
what they need help to learn, and how teachers plan instruction to ensure that they all do learn.
The use of student performance data is essential to identify skill gaps in student learning. The
learning and skill gaps must be addressed through re-teaching or remediation. The use of data
also guides improvements in the rigor, pacing, and vertical articulation of curriculum and
instruction. As teachers monitor performance data, patterns of teaching and individual student
learning successes and challenges become evident. It is essential for teachers to have ongoing
formative data to measure learning at the end of each instructional segment. This allows teachers
to make informed, collaborative decisions to address potential problems.
50 http://ces.ou.edu/7_correlates_effectiveness.html

Instructional Delivery System OSPR – Best Practices
Page 2-46
Working with the teachers, the administration should develop a timeline that details which
student assessment data are required throughout the school year. Using this timeline, the
superintendent and principal should hold PLC meetings for analyzing data. Meetings should
focus on determining the strengths and weaknesses of the students and how the results impact the
district in pacing instruction. Reviewing formative benchmark test data throughout the school
year allows timely feedback on student performance, the effectiveness of teaching strategies, and
any needed adjustments and alignment to the curricula.
A helpful resource for administrators and teachers to use is found in an article published in
Educational Leadership, Developing Data Mentors. The authors say that “gathering student
assessment data is not enough. Administrators and teachers must learn to analyze the data and
apply this information in the classroom.”
The district process should examine classroom data and ask key questions;
• Which content standards is the teacher assessing?
• What percent of students demonstrated proficiency? • What implications does that have for
instruction?
• Which students have not demonstrated that they can master content standards?
• What diagnostic information did an examination of student work provide?
• Based on individual student performance, what do teachers need to do next to move the student
to proficiency?
• Based on the class performance, what re-teaching needs to be done?
• After re-assessing, did students demonstrate proficiency?
• Is re-teaching or other interventions resulting in improved student performance?
• When comparing performance by subgroups, are any groups not performing as well as the
whole group? If so, what’s being done about that?
• Are there students who are not attaining proficiency across standards?
• What diagnostic information do we have about them to inform instruction?
• What interventions have we tried? What interventions do we plan to try next?51
Superintendents, principals, and teachers should consider regularly graphing data. A visual
depiction of the information often yields additional insights. Another way for teachers to get a
quick visual picture of who needs additional support is to color code the data recorded in the
grading process. For example, if three categories are used to define student performance in the
grade book (e.g., basic - B, proficient - P, and advanced - A), each could be assigned a different
color. This would allow teachers to quickly determine who was progressing and who needed
additional support.52 Parents as well as students need consistent and clear communication
regarding ongoing student performance data. Through use of one-on-one conversation or
electronic communication, they can monitor daily assignments, homework, and student test data.
51 Nichols, B. W. & Singer K. P. (2000). Developing data mentors. Educational Leadership, 57(5). 52 http://mdk12.msde.maryland.gov/instruction/progress/using.html

OSPR – Best Practices Instructional Delivery System
Page 2-47
FISCAL IMPACT
This recommendation can be implemented with existing resources. However, if an external
consultant is needed there are consultants available to guide teachers through the data analysis
process. A short-term consulting engagement would cost approximately $3,000.
FINDING 2-16
There is no clearly defined early intervention system for struggling students. Teachers provide
interventions, but there are inconsistencies regarding appropriate strategies, how to differentiate
instruction, and determining the level and intensity of interventions.
The consulting team noted in focus group and interviews there was no clear understanding of the
implementation of tiered interventions. District administrators and teachers expressed awareness
of the need to address these concerns and refine procedures to more effectively meet the needs of
struggling learners.
Districts are committed to meeting the needs of all students but have no comprehensive
continuum of multi-layered or multi-tiered systems of prevention/intervention services. At the
elementary level, there is usually a reference to tiered intervention and flex grouping. The
consulting team found that some teachers were providing data based interventions. However,
others were vague and inconsistent in articulating how struggling learners are identified, how
intervention strategies and support structures are selected, and how the interventions are
evaluated as appropriate and helpful to meeting student need.
Several districts implement both the academic and behavioral components of Response to
Intervention (RtI) using the Oklahoma Tiered Intervention Support System (OTISS) model.
However, the consulting team found that many teachers did not have a clear understanding of
how the district envisions implementing RtI components. The teachers need clarification and
support in how to implement RtI with fidelity. Exhibit 2-26 provides the essential RtI
components.
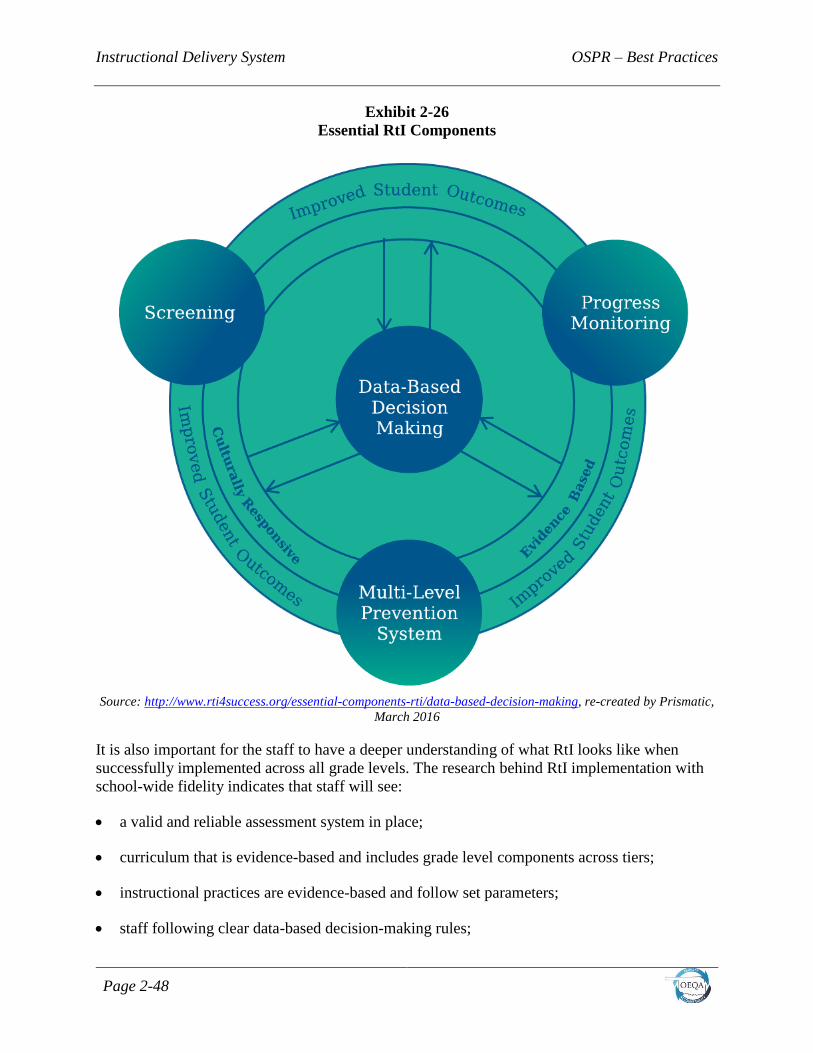
Instructional Delivery System OSPR – Best Practices
Page 2-48
Exhibit 2-26
Essential RtI Components
Source: http://www.rti4success.org/essential-components-rti/data-based-decision-making, re-created by Prismatic,
March 2016
It is also important for the staff to have a deeper understanding of what RtI looks like when
successfully implemented across all grade levels. The research behind RtI implementation with
school-wide fidelity indicates that staff will see:
a valid and reliable assessment system in place;
curriculum that is evidence-based and includes grade level components across tiers;
instructional practices are evidence-based and follow set parameters;
staff following clear data-based decision-making rules;

OSPR – Best Practices Instructional Delivery System
Page 2-49
predetermined fidelity checks are applied routinely;
integration and sustainability practices are followed, and
staff regularly communicate using the same vocabulary.53
A district implementing RtI successfully has clearly defined procedures, techniques, feedback
loops, and decision-making processes within each component. The district’s plan will:
clearly define responsibilities of specific persons (coaches, teachers, administration);
create a data system for measuring operations, techniques, and components;
link fidelity data to improved outcomes data;
approach instructor observation in a positive manner emphasizing problem-solving; and
create accountability measures for noncompliance.54
RtI provides structure for lesson planning and instructional delivery. Exhibit 2-27 summarizes
the essential questions teacher teams need to address in lesson planning and planning for
delivering instruction.
53 http://www.rti4success.org/sites/default/files/FidelityImplementation_10-20-09_FINAL.pdf 54 Johnson, Mellard, Fuchs, & McKnight, 2006; Pierangelo & Giuliani, 2008
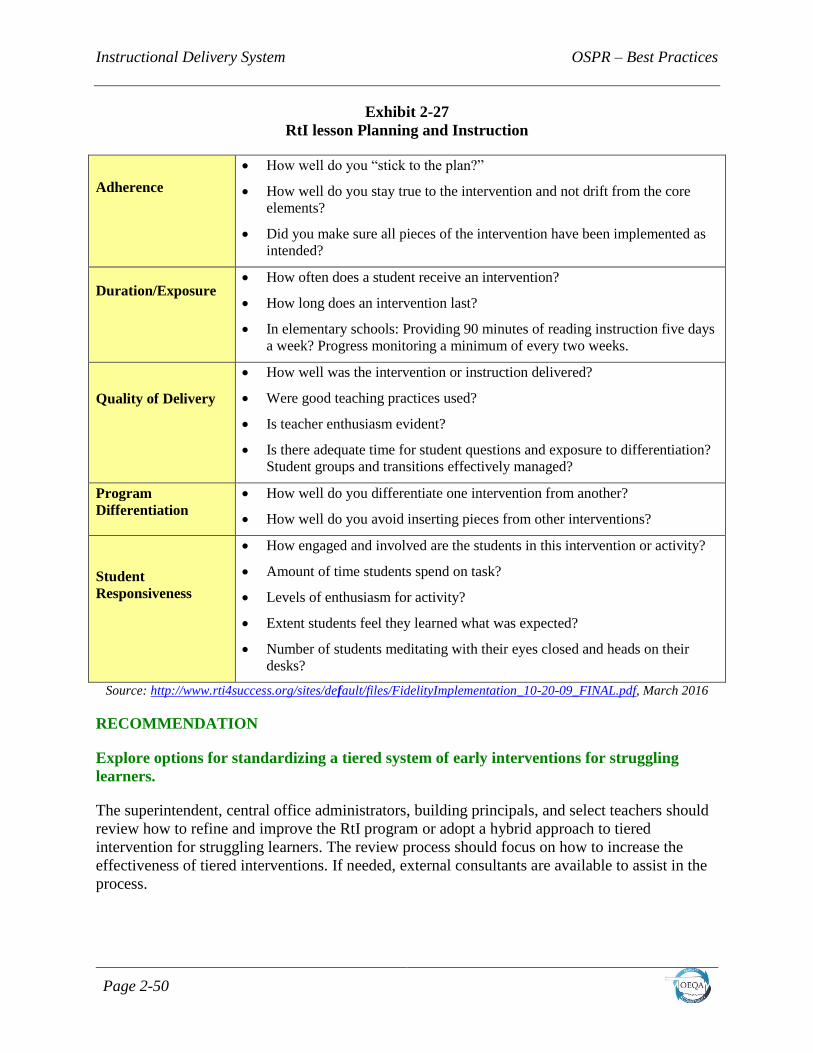
Instructional Delivery System OSPR – Best Practices
Page 2-50
Exhibit 2-27
RtI lesson Planning and Instruction
Adherence
How well do you “stick to the plan?”
How well do you stay true to the intervention and not drift from the core
elements?
Did you make sure all pieces of the intervention have been implemented as
intended?
Duration/Exposure
How often does a student receive an intervention?
How long does an intervention last?
In elementary schools: Providing 90 minutes of reading instruction five days
a week? Progress monitoring a minimum of every two weeks.
Quality of Delivery
How well was the intervention or instruction delivered?
Were good teaching practices used?
Is teacher enthusiasm evident?
Is there adequate time for student questions and exposure to differentiation?
Student groups and transitions effectively managed?
Program
Differentiation
How well do you differentiate one intervention from another?
How well do you avoid inserting pieces from other interventions?
Student
Responsiveness
How engaged and involved are the students in this intervention or activity?
Amount of time students spend on task?
Levels of enthusiasm for activity?
Extent students feel they learned what was expected?
Number of students meditating with their eyes closed and heads on their
desks?
Source: http://www.rti4success.org/sites/default/files/FidelityImplementation_10-20-09_FINAL.pdf, March 2016
RECOMMENDATION
Explore options for standardizing a tiered system of early interventions for struggling
learners.
The superintendent, central office administrators, building principals, and select teachers should
review how to refine and improve the RtI program or adopt a hybrid approach to tiered
intervention for struggling learners. The review process should focus on how to increase the
effectiveness of tiered interventions. If needed, external consultants are available to assist in the
process.
OSPR – Best Practices Instructional Delivery System
Page 2-51
The guide Considering Tier 3 Within a Response-to-Intervention Model can serve as a resource
to understand the RtI process.55The RtI Essential Components Integrity Rubric and the RtI
Essential Components Integrity Worksheet are useful appraisal tools.56
FISCAL IMPACT
This recommendation can be implemented with existing resources.
E. SPECIAL PROGRAMS
School districts offer educational services to students through a variety of programs including
regular education programs and special programs. Special programs are designed to provide
quality services for student populations such as those in Gifted and Talented Education and
Special Education programs.
Special Education
The Individuals with Disabilities Education Act (IDEA), Part B is the federal law that supports
special education and related service programming for children and youth with disabilities ages
three through 21. The major purposes of IDEA are:
to ensure that all children with disabilities have available to them a free, appropriate public
education that emphasizes special education and related services designed to meet their
unique needs and prepare them for employment and independent living;
to ensure that the rights of children and youth with disabilities and their parents are protected;
and
to assess and ensure the effectiveness of efforts to educate children with disabilities.
Oklahoma statutes require that each school district provide special education and related services
for all children with disabilities who reside in that district in accordance with IDEA. This duty
may be satisfied by:
directly providing special education for such children;
joining in a cooperative program with another district or districts to provide special education
for such children;
joining in a written agreement with a private or public institution, licensed residential child
care and treatment facility, or day treatment facility within such district to provide special
education for children who are deaf or hard-of-hearing, children who are blind or partially
blind, or other eligible children with disabilities; or
55 http://www.rtinetwork.org/essential/tieredinstruction/tier3/consideringtier3 56 http://www.rti4success.org/resource/essential-components-rti-integrity-rubric-and-worksheet

Instructional Delivery System OSPR – Best Practices
Page 2-52
transferring eligible children and youth with disabilities to other school districts pursuant to
the provisions of the Education Open Transfer Act.
Districts must develop an Individualized Education Plan (IEP) for each child receiving special
education services under IDEA. The IEP must include input from the parent and regular
education teachers and be aligned with education plans for children in regular education
classrooms.
IDEA requires districts to provide educational services in the “least restrictive environment” and
to include students with disabilities in state and district assessment programs. Instructional
arrangements for students may include:
all instruction and related services in a regular classroom in a mainstreamed setting;
a resource room where the student is removed from the regular classroom less than 50
percent of the day;
a self-contained classroom where the student is removed from the regular classroom more
than 50 percent of the day; or
a separate “self-contained” classroom for those whose disability is so severe that a
satisfactory education cannot take place for any part of the day in a regular classroom.
Under IDEA, a school district can only place a student in a more restrictive setting such as a day
treatment program or residential treatment placement if the student’s needs and educational
program cannot be satisfactorily provided in the regular classroom with supplementary aids and
services.
The reauthorization of IDEA in 2004, which went into effect in 2005, includes provisions
significantly changing the way learning-disabled students are identified. One change in the law
addresses early intervention services and creating opportunities to determine a student’s
Response to Intervention (RtI). This approach was adopted in 2010 by SDE. With RtI, schools
identify students at risk for poor learning outcomes; monitor student progress; provide evidence-
based interventions; and adjust the intensity and nature of those interventions depending on a
student’s responsiveness. Based upon the results of these interventions, the district may need a
referral for additional testing to determine if there is a specific learning disability.
IDEA now allows a school district to use up to 15 percent of its IDEA allocation to support
services to students who have not been identified as needing special education services, but who
need additional academic and behavioral support to succeed in a general education environment.
Funds may be used for professional development in scientific research-based interventions,
literacy instruction, and the use of adaptive or instructional technology. It also permits use of
funds for educational and behavioral assessments.
An effective special education program is defined by IDEA as having the following elements:
pre-referral intervention in regular education;
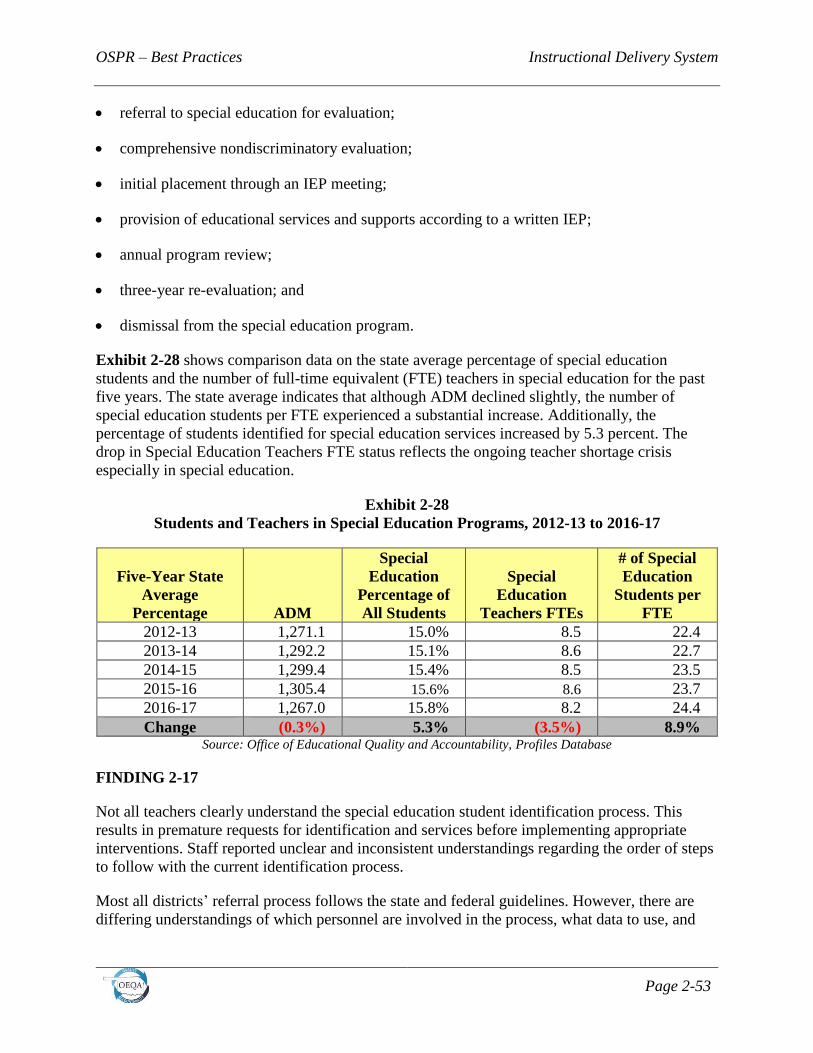
OSPR – Best Practices Instructional Delivery System
Page 2-53
referral to special education for evaluation;
comprehensive nondiscriminatory evaluation;
initial placement through an IEP meeting;
provision of educational services and supports according to a written IEP;
annual program review;
three-year re-evaluation; and
dismissal from the special education program.
Exhibit 2-28 shows comparison data on the state average percentage of special education
students and the number of full-time equivalent (FTE) teachers in special education for the past
five years. The state average indicates that although ADM declined slightly, the number of
special education students per FTE experienced a substantial increase. Additionally, the
percentage of students identified for special education services increased by 5.3 percent. The
drop in Special Education Teachers FTE status reflects the ongoing teacher shortage crisis
especially in special education.
Exhibit 2-28
Students and Teachers in Special Education Programs, 2012-13 to 2016-17
Five-Year State
Average
Percentage ADM
Special
Education
Percentage of
All Students
Special
Education
Teachers FTEs
# of Special
Education
Students per
FTE
2012-13 1,271.1 15.0% 8.5 22.4
2013-14 1,292.2 15.1% 8.6 22.7
2014-15 1,299.4 15.4% 8.5 23.5
2015-16 1,305.4 15.6% 8.6 23.7
2016-17 1,267.0 15.8% 8.2 24.4
Change (0.3%) 5.3% (3.5%) 8.9% Source: Office of Educational Quality and Accountability, Profiles Database
FINDING 2-17
Not all teachers clearly understand the special education student identification process. This
results in premature requests for identification and services before implementing appropriate
interventions. Staff reported unclear and inconsistent understandings regarding the order of steps
to follow with the current identification process.
Most all districts’ referral process follows the state and federal guidelines. However, there are
differing understandings of which personnel are involved in the process, what data to use, and
Instructional Delivery System OSPR – Best Practices
Page 2-54
timeframes for interventions. Across the district there is no clearly defined and understood pre-
referral process.
Oklahoma moved to a new special education data and eligibility/IEP process system beginning
July 1, 2015. Entitled the OK EdPlan™, the online system guides users through the identification
and referral process. The program assists special education staff and administration through the
latest changes to the eligibility and IEP process.57
RECOMMENDATION
Train all teachers in a clearly defined special education identification process.
District superintendents, central office administration, principals, director of special education,
and select special education and general education staff need to clearly outline the pre-referral
and referral process. The training should define each step in identifying students and the
qualifications for special education services. The director of special education and staff should
hold annual briefings with the principals and all teachers to review the referral process. This is
particularly important with the elementary principals and staff. These communications should
include IDEA changes and time for questions from current and new staff members.
FISCAL IMPACT
This recommendation can be implemented with existing resources.
FINDING 2-18
Special education teachers lack sufficient time to communicate and plan with general education
teachers. Districtwide, general education teachers lack a deep understanding of modifying and
adapting curriculum and instruction for students with disabilities. There is no scheduled time for
special education teachers and classroom teachers to plan and deliver instruction in concert.
There is no dedicated time for teachers to review the adaptations and modifications students
require. There is still a prevailing mindset for pull out and resource room services over
mainstreaming and inclusionary practices. There is apprehension among some general education
teachers about how to provide students with least restrictive environment (LRE) in the
classrooms.
The central office administration recognizes the importance for special education teachers to
meet with general education teachers and plan for instructional and curricular modifications.
Focus group and interview discussion also indicated it is difficult for teachers to begin to view
IEP students as “our” students. There is no process in place that gives teachers time to plan,
make shared instructional decisions, curriculum modifications, and how to assess student
learning.
Collaboration between special education and general education teachers calls for commitment by
the teachers who will be working together. They must have support from building administrators
57 http://ok.gov/sde/sites/ok.gov.sde/files/EdPlan%20Q%26A.pdf

OSPR – Best Practices Instructional Delivery System
Page 2-55
and central office staff. This involves allocating time, procuring resources, monitoring, and,
above all, persistence. The biggest issue is time – time for planning, time for curriculum and
instructional development, and time for evaluating.58 Collaborative planning is a responsibility at
the district, building and classroom level.
Walther-Thomas and her colleagues (1996) found that five planning themes were identified by
co-teachers who considered themselves to be effective co-planners:
confidence in partner’s skills;
design of learning environments for both the educators and students that require active
involvement;
creation of learning and teaching environments in which each person’s contributions are
valued;
development of effective routines to facilitate in-depth planning; and
increased productivity, creativity, and collaboration over time.
Participants in collaborative programs agreed that the time required for planning does not
decrease during the year, but the quality of instruction continues to improve.59
RECOMMENDATION
Implement ongoing, regularly scheduled times for teachers to corporately plan curriculum
and instruction based on student IEPs.
Although limited, research on the relationship of special education and PLCs reveals that special
education teachers’ classroom practices, like those of their general education counterparts, often
change in a positive direction as a result of their participation in PLCs. Research findings (Little,
2003) revealed that the interactions of members of the groups studied supported teacher learning
and improvement of practice as evidenced by allocating time to talk about problems in their
practice, revealing their dilemmas to each other, exploring their problems openly, and sharing
specific classroom materials, such as student work, to find solutions.43 Another important
implication of PLC research for special education is the natural occurrences of conflict, tension,
and disruptions. Successful PLCs go through cycles of learning and in doing so are able to repair
the problems the community experiences.
District superintendents, principals, and special education director need to schedule release time
for special education and general education teachers to work collaboratively. The administration
must establish guidelines and expectations for the planning sessions so times are viewed as
priority for both teachers. The teachers must determine or select the students who will be part of
the collaborative planning process. At all grade levels, the administrators and counselors must
58 Ibid 59 Ibid
Instructional Delivery System OSPR – Best Practices
Page 2-56
work with teachers to keep balanced proportions of regular students, at-risk students, and IEP
students.
Planning for secondary students is more difficult as required courses may dictate which class
students must attend. Ideally, weekly planning times work best. However, bi-weekly and
monthly can also serve the collaborative planning process. The purpose of the teacher
collaborative planning is to combine expertise and meet student needs with IEPs.
FISCAL IMPACT
This recommendation can be implemented with existing resources.
FINDING 2-19
Districts primarily serve special education students through a resource room. Students receive
initial instruction from the classroom teacher and then have the option of transitioning to the
resource room for additional help. Although transition times may appear orderly, the transition
time interrupts instructional learning time.
Some districts have several students with more complex needs, but most are categorized with
speech and specialized learning disabilities. There are no inclusionary classrooms where general
education and special education teachers work together in a co-teaching arrangement. Through
interviews, focus groups, and observations, consulting teams noted a high level of
professionalism among special education teachers and classroom teachers. Their informal
collaboration and focused intent to effectively serve students with IEPs was apparent.
The regular classroom teachers attend IEP meetings and implement the detailed student
modifications for learning. The special education teachers and regular classroom teachers work
collaboratively at serving the needs of identified students. Co-teaching instruction works well in
school cultures such districts. Co-teaching arrangements interface well with students identified
with specific learning disabilities. In What Every Principal Needs to Know to Create Equitable
and Excellent Schools, the writers contend: When co-teaching happens, it is most important that
all teachers involved utilize their strengths, share roles, and are both seen as leaders in the
classroom. Teachers should maximize the benefits of reducing the student-teacher ratio by using
co-teaching models, such as parallel instruction, station teaching, and teaming, and minimize the
one-teach one-assist model.37
One of the co-teaching benefits for the teachers is they acquire a greater understanding and
increased competence in their colleagues’ areas of expertise. Special education teachers expand
their content area knowledge when co-teaching, while regular education teachers learn new
behavior management techniques and ideas for curriculum adaptation. In co-teaching
classrooms where teachers share the role of circling around the room and assisting whoever
needs help, the support for all students is increased. Another benefit is that special education
teachers hear the regular education teachers explain content material. Subsequently, when the
special education teachers assist IEP students, they can reinforce the vocabulary and instructional
expectations required by regular education teachers.

OSPR – Best Practices Instructional Delivery System
Page 2-57
When teachers work together to establish equitable roles and duties, all students in a co-taught
classroom benefit from the presence of two teachers that can support their learning. Research
and educational literature speak of varying types, models, and approaches to coteaching. The
literature also addresses some specific requirements for successful co-teaching. Across 32
studies, teachers repeatedly stressed the importance of several elements in creating strong co-
teaching partnerships (Exhibit 2-29).
EXHIBIT 2–29
Research-Based Requirements for Successful Co-Teaching
Instructional Delivery System OSPR – Best Practices
Page 2-58
According to SDE, collaborative implementation for co-teaching includes regular and special
education teachers completing the following activities:
• participate in professional development regarding selecting appropriate approaches to
coteaching and applying them to classroom instruction;
• deliver co-taught lessons and assessments incorporating Universal Design for Learning and
differentiation strategies;
• ensure instruction and assessments provide access to general education curriculum with
appropriate accommodations to meet individual student needs;
• implement data collection procedures for established outcomes;
• address barriers to implementation;
• demonstrate shared accountability for planning, instruction, assessment, and progress of all
students that exhibits shared understandings of student instructional needs;
• document shared communications with parents; and
• integrate technology in instruction, progress monitoring, and assessment processes.38
RECOMMENDATION
Strengthen services to special education students through implementing more inclusionary
classrooms and co-teaching practices.
The superintendent, principal, special education teachers, and select classroom teachers should
pursue an in-depth study of the co-teaching process to determine implementation processes and
procedures. The following links provide additional information to assist in determining options
for expansion and improvement of their current practices. time should be spent in observation
and visiting schools successfully implementing co-teaching arrangements. Fiscal impact this
recommendation can be implemented with existing special education resources
FISCAL IMPACT
This recommendation can be implemented with existing special education resources.
FINDING 2-20
Districts strive to meet all state and federal requirements in the special education programs, but
there is room for improvement. Staffing loads, the identification process, and inclusionary and
least restrictive environment practices need review. In the recent past, there have been no in-
house quality control reviews or program evaluations.
In many districts, there is a need to profile the behavioral characteristics, examine the
distribution of categorical disabilities, assess instructional settings for effectiveness, and
OSPR – Best Practices Instructional Delivery System
Page 2-59
determine staffing needs. Discussions pointed out that student behaviors and discipline measures
need review. The district would also benefit from reviewing procedural safeguards, transitions,
and improving target percentages on the State’s Performance Indicators.
RECOMMENDATION
Evaluate the special education program.
Districts must review and refine all components of the special education program. As the state
continues to implement the OK EdPlan™, there are training sessions, webinars, and training
videos available for staff. In addition to participating in the OK EdPlan™ state efforts,
continuous dialog and discussion are needed to understand how the state information systems
translates locally to the IEP referral processes.
The director of special education, principals, and select teachers need to review all aspects of the
special education program for quality, consistency, and best practice. There are sources available
from the Oklahoma State Department of Education to support administrators and teachers. The
review process should examine such things as the policies to be followed and legal practices
required, the fundamental expectations for inclusionary classrooms, the pre-referral, referral, and
placement procedures. It is important to review discipline issues, and the suspension policies and
guidelines for students with disabilities.
The New Hampshire Department of Education has a special education program approval and
improvement process that might be a useful resource.60 Another resource to peruse is the
Virginia Department of Education self-assessment process for special education program
improvement.61
FISCAL IMPACT
This recommendation can be implemented with existing resources.
Gifted and Talented Education
Chapter 8 Article VII, Section 904 of the Oklahoma School Code (OSC) defines Gifted and
Talented children as “those children identified at the preschool, elementary, or secondary level as
having demonstrated potential abilities of high performance capabilities and needing
differentiated or accelerated educational services.” The definition includes students who scored
in the top three percent on any national standardized test of intellectual ability or who excel in
the areas of creative thinking ability, leadership ability, visual performing arts ability, and
specific academic ability.
OSC Section 910 requires each school district to provide Gifted and Talented educational
programs and to serve those identified students who reside within the school district boundaries.
The local School Board of each district is required to submit a plan for Gifted and Talented
60 http://education.nh.gov/instruction/special_ed/improvement_process.htm 61 http://www.doe.virginia.gov/special_ed/program_improvement/index.shtml

Instructional Delivery System OSPR – Best Practices
Page 2-60
programs to the State Board of Education and to provide annual program reports to the
Oklahoma State Department of Education (SDE).
Required components for Gifted and Talented education programs are as follows:
a written policy statement which specifies a consistent process for assessment and selection
of children for placement in Gifted and Talented programs in grades one through 12;
a description of curriculum for the Gifted and Talented educational program, demonstrating
that the curriculum is differentiated from the normal curriculum in pace and/or depth, and
that it has scope and sequence;
criteria for evaluation of the gifted child educational program;
evidence of participation by the local advisory committee on education for Gifted and
Talented children in planning, child identification, and program evaluation;
required competencies and duties of Gifted and Talented educational program staff;
number and percentage of students identified by the district as Gifted and Talented children
pursuant to “subparagraph g” of paragraph 2 of subsection B of Section 18-201 of this title;
and
a budget for the district’s Gifted and Talented educational programs.
Exhibit 2-30 shows the state average for gifted and talented identification rate. The National
Association for Gifted Children notes that between five and seven percent of students should be
identified. The state’s average was well above this standard for each of the five years examined.
However, overtime there has been a 2.0% decrease in the state average of G&T identification.
Exhibit 2-30
Trend in Percentage of Gifted and Talented Education Students
Entity 2012-13 2013-14 2014-15 2015-16 2016-17 Change
State 14.8% 14.2% 14.2% 14.2% 14.5% 2.0% Source: Office of Educational Quality and Accountability, Profiles Database
FINDING 2-21
Districts have developed a gifted plan, identified students, and designated teachers to work with
students. However, in many cases there is still a need for greater intentional and purposeful effort
to deliver enriched and challenging learning opportunities.
At the elementary level, the norm across districts is to provide differentiated instruction with
special activities or events for those who have been identified as gifted and talented. The middle
school counselor normally assists gifted students by enrolling them in Pre-AP classes. At the
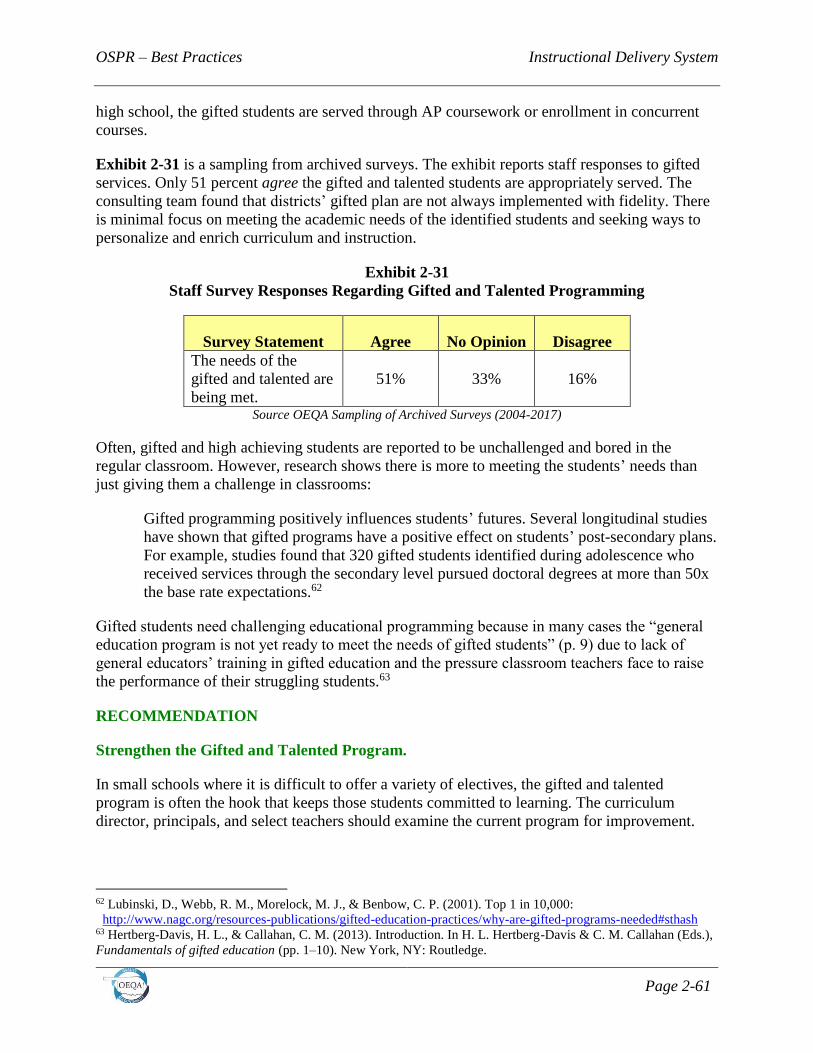
OSPR – Best Practices Instructional Delivery System
Page 2-61
high school, the gifted students are served through AP coursework or enrollment in concurrent
courses.
Exhibit 2-31 is a sampling from archived surveys. The exhibit reports staff responses to gifted
services. Only 51 percent agree the gifted and talented students are appropriately served. The
consulting team found that districts’ gifted plan are not always implemented with fidelity. There
is minimal focus on meeting the academic needs of the identified students and seeking ways to
personalize and enrich curriculum and instruction.
Exhibit 2-31
Staff Survey Responses Regarding Gifted and Talented Programming
Survey Statement Agree No Opinion Disagree
The needs of the
gifted and talented are
being met.
51% 33% 16%
Source OEQA Sampling of Archived Surveys (2004-2017)
Often, gifted and high achieving students are reported to be unchallenged and bored in the
regular classroom. However, research shows there is more to meeting the students’ needs than
just giving them a challenge in classrooms:
Gifted programming positively influences students’ futures. Several longitudinal studies
have shown that gifted programs have a positive effect on students’ post-secondary plans.
For example, studies found that 320 gifted students identified during adolescence who
received services through the secondary level pursued doctoral degrees at more than 50x
the base rate expectations.62
Gifted students need challenging educational programming because in many cases the “general
education program is not yet ready to meet the needs of gifted students” (p. 9) due to lack of
general educators’ training in gifted education and the pressure classroom teachers face to raise
the performance of their struggling students.63
RECOMMENDATION
Strengthen the Gifted and Talented Program.
In small schools where it is difficult to offer a variety of electives, the gifted and talented
program is often the hook that keeps those students committed to learning. The curriculum
director, principals, and select teachers should examine the current program for improvement.
62 Lubinski, D., Webb, R. M., Morelock, M. J., & Benbow, C. P. (2001). Top 1 in 10,000:
http://www.nagc.org/resources-publications/gifted-education-practices/why-are-gifted-programs-needed#sthash 63 Hertberg-Davis, H. L., & Callahan, C. M. (2013). Introduction. In H. L. Hertberg-Davis & C. M. Callahan (Eds.),
Fundamentals of gifted education (pp. 1–10). New York, NY: Routledge.

Instructional Delivery System OSPR – Best Practices
Page 2-62
The SDE offers ideas on its website that districts can explore to expand services to students
(Exhibit 2-32). Some of these ideas may already be in use, but they need to occur with more
frequency, intention, and design.
Exhibit 2-32
Oklahoma Public Schools Enrichment Programming Options for Services
Enrichment in the Regular Classroom: Experiences provided in regular classrooms that are
supplemental to the established curriculum and which are purposefully planned with the needs,
interests, and capabilities of particular students in mind. Appropriate enrichment experiences are
NOT a repetition of material.
Seminars/Convocations: Special short-term sessions where students focus on one area of study.
Mentorships: A program which pairs individual students with someone who has advanced skills
and experiences in a particular discipline and can serve as a guide, advisor, counselor, and role
model.
Summer Enrichment Programs: Enrichment classes or courses offered during the summer
months. Saturday Enrichment Programs: Enrichment classes or courses offered on Saturday.
Creative/Academic Competitions: Organized opportunities for students to enter local, regional,
state, or national contests in a variety of areas.
Differentiated Curriculum: Curriculum designed to meet the needs of high ability students and
differentiated according to content, process, and product.
Learning Centers: A designated area or portable center designed to enrich and/or accelerate
students’ interests in a given content area.
“Great Books” and “Junior Great Books”: Discussions of great literature led by an adult
discussion leader using a prepared question guide.
Source: http://sde.ok.gov/sde/gifted-and-talented-education-programming-options
FISCAL IMPACT
This recommendation can be implemented with existing resources.
D. STUDENT SERVICES
Student services are comprised of counseling, health services, and social services in most
Oklahoma districts. Services provided include:
college and career counseling;
health education and services;
OSPR – Best Practices Instructional Delivery System
Page 2-63
substance abuse and psychological counseling;
social services; and
graduate follow-up.
Student services are evolving into a more powerful tool to assist students who will continue to
grow. They are becoming increasingly more valuable in providing needed support and guidance
for students’ college questions, career options, and individual needs.
Guidance and Counseling
Oklahoma State Board of Education Accreditation Standards for guidance and counseling are:
Accreditation Standard 6.02. The counseling staff, parents, administrators, and others shall
provide guidance and counseling program direction through involvement in assessment and
identification of student needs.
Accreditation Standard 6.04. The school shall develop a written description of a guidance
and counseling program with special provisions for at-risk students. The program shall
address assessed needs of all students, including those who are identified as at-risk and shall
establish program goals, objectives, and evaluation.
Accreditation Standard 6.06. Each school shall provide an organized program of guidance
and counseling services that include: counseling services available to students; a planned
sequential program of guidance activities that enhance students’ development; appropriate
referrals to other specialized persons, clinics, or agencies in the community; and coordinated
services.
Accreditation Standard 6.08. Each counselor shall follow a planned calendar of activities
based upon established program goals and provide direct and indirect services to students,
teachers, and/or parents.
The SDE publishes The School Counselor’s Guide: Developing a Comprehensive School
Counseling Program Using Accreditation Standard VI. This publication is designed to assist
school districts in strengthening existing programs or developing new ones. The major
components of the defined guidance curriculum include Guidance Curriculum Domains
(Academic Development, Career Development, and Personal/Social Development); Student
Competencies; and Guidance Curriculum Delivery.
The American School Counselor Association (ASCA) states:
School counseling programs are collaborative efforts benefiting students, parents,
teachers, administrators, and the overall community. School counseling programs should
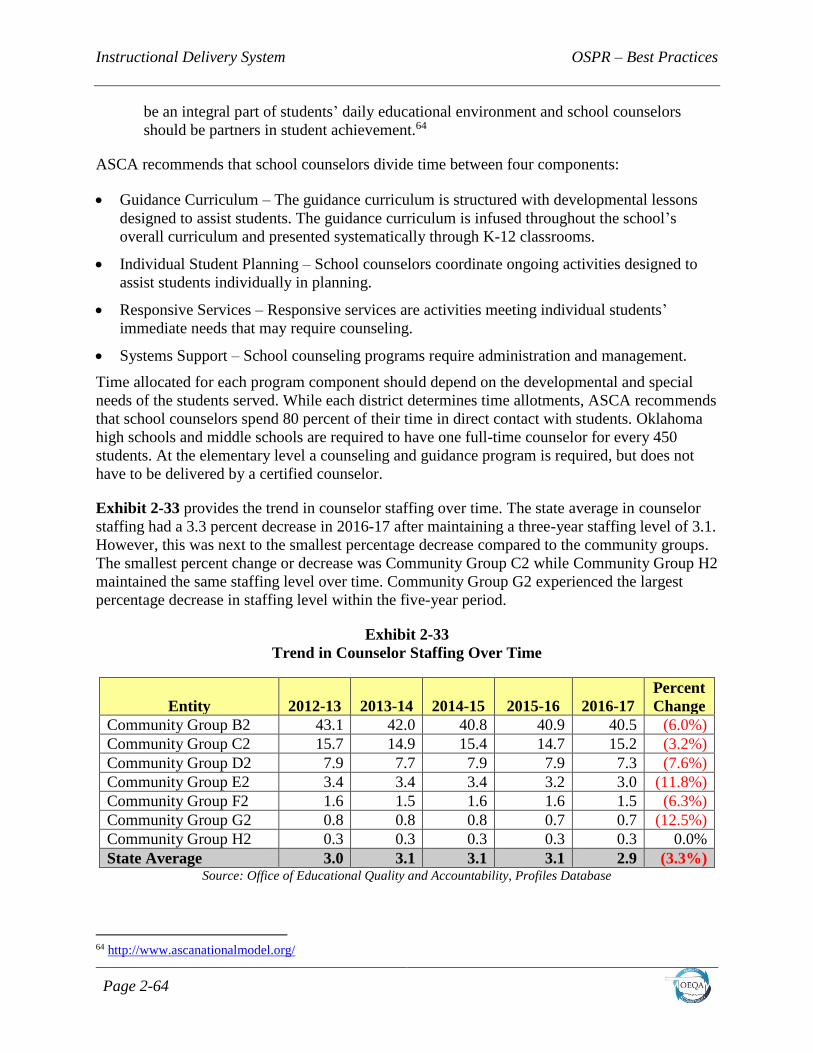
Instructional Delivery System OSPR – Best Practices
Page 2-64
be an integral part of students’ daily educational environment and school counselors
should be partners in student achievement.64
ASCA recommends that school counselors divide time between four components:
Guidance Curriculum – The guidance curriculum is structured with developmental lessons
designed to assist students. The guidance curriculum is infused throughout the school’s
overall curriculum and presented systematically through K-12 classrooms.
Individual Student Planning – School counselors coordinate ongoing activities designed to
assist students individually in planning.
Responsive Services – Responsive services are activities meeting individual students’
immediate needs that may require counseling.
Systems Support – School counseling programs require administration and management.
Time allocated for each program component should depend on the developmental and special
needs of the students served. While each district determines time allotments, ASCA recommends
that school counselors spend 80 percent of their time in direct contact with students. Oklahoma
high schools and middle schools are required to have one full-time counselor for every 450
students. At the elementary level a counseling and guidance program is required, but does not
have to be delivered by a certified counselor.
Exhibit 2-33 provides the trend in counselor staffing over time. The state average in counselor
staffing had a 3.3 percent decrease in 2016-17 after maintaining a three-year staffing level of 3.1.
However, this was next to the smallest percentage decrease compared to the community groups.
The smallest percent change or decrease was Community Group C2 while Community Group H2
maintained the same staffing level over time. Community Group G2 experienced the largest
percentage decrease in staffing level within the five-year period.
Exhibit 2-33
Trend in Counselor Staffing Over Time
Entity 2012-13 2013-14 2014-15 2015-16 2016-17
Percent
Change
Community Group B2 43.1 42.0 40.8 40.9 40.5 (6.0%)
Community Group C2 15.7 14.9 15.4 14.7 15.2 (3.2%)
Community Group D2 7.9 7.7 7.9 7.9 7.3 (7.6%)
Community Group E2 3.4 3.4 3.4 3.2 3.0 (11.8%)
Community Group F2 1.6 1.5 1.6 1.6 1.5 (6.3%)
Community Group G2 0.8 0.8 0.8 0.7 0.7 (12.5%)
Community Group H2 0.3 0.3 0.3 0.3 0.3 0.0%
State Average 3.0 3.1 3.1 3.1 2.9 (3.3%) Source: Office of Educational Quality and Accountability, Profiles Database
64 http://www.ascanationalmodel.org/
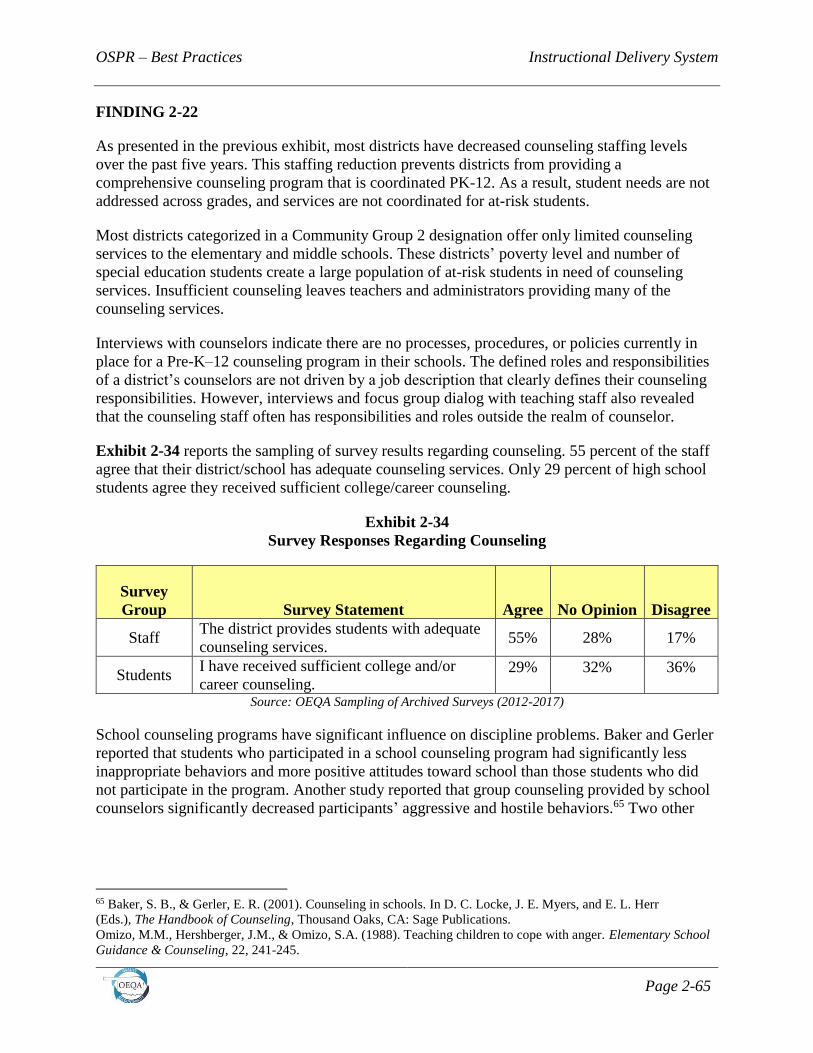
OSPR – Best Practices Instructional Delivery System
Page 2-65
FINDING 2-22
As presented in the previous exhibit, most districts have decreased counseling staffing levels
over the past five years. This staffing reduction prevents districts from providing a
comprehensive counseling program that is coordinated PK-12. As a result, student needs are not
addressed across grades, and services are not coordinated for at-risk students.
Most districts categorized in a Community Group 2 designation offer only limited counseling
services to the elementary and middle schools. These districts’ poverty level and number of
special education students create a large population of at-risk students in need of counseling
services. Insufficient counseling leaves teachers and administrators providing many of the
counseling services.
Interviews with counselors indicate there are no processes, procedures, or policies currently in
place for a Pre-K–12 counseling program in their schools. The defined roles and responsibilities
of a district’s counselors are not driven by a job description that clearly defines their counseling
responsibilities. However, interviews and focus group dialog with teaching staff also revealed
that the counseling staff often has responsibilities and roles outside the realm of counselor.
Exhibit 2-34 reports the sampling of survey results regarding counseling. 55 percent of the staff
agree that their district/school has adequate counseling services. Only 29 percent of high school
students agree they received sufficient college/career counseling.
Exhibit 2-34
Survey Responses Regarding Counseling
Survey
Group Survey Statement Agree No Opinion Disagree
Staff The district provides students with adequate
counseling services. 55% 28% 17%
Students I have received sufficient college and/or
career counseling. 29% 32% 36%
Source: OEQA Sampling of Archived Surveys (2012-2017)
School counseling programs have significant influence on discipline problems. Baker and Gerler
reported that students who participated in a school counseling program had significantly less
inappropriate behaviors and more positive attitudes toward school than those students who did
not participate in the program. Another study reported that group counseling provided by school
counselors significantly decreased participants’ aggressive and hostile behaviors.65 Two other
65 Baker, S. B., & Gerler, E. R. (2001). Counseling in schools. In D. C. Locke, J. E. Myers, and E. L. Herr
(Eds.), The Handbook of Counseling, Thousand Oaks, CA: Sage Publications.
Omizo, M.M., Hershberger, J.M., & Omizo, S.A. (1988). Teaching children to cope with anger. Elementary School
Guidance & Counseling, 22, 241-245.
Instructional Delivery System OSPR – Best Practices
Page 2-66
studies found that elementary guidance activities have a positive influence on elementary
students’ academic achievement.66
Comprehensive school counseling programs ensure equitable access to opportunities and
rigorous curriculum for all students to participate fully in the educational process.67 As defined
by ASCA, a comprehensive curriculum consists of K-12 “structured lessons designed to help
students attain the desired competencies and to provide all students with the knowledge,
attitudes, and skills appropriate for their developmental level”.68
RECOMMENDATION
Provide a comprehensive counseling program that is coordinated PK-12 and communicates
the role of the counselor to staff, students, and parents.
The school counselor’s primary role is to design and implement a comprehensive district-wide
program that promotes student achievement and personnel well-being. The program is preventive
in design and developmental in nature.
The ASCA framework identifies the four key components of an effective program:
foundations;
delivery;
management; and
accountability.
Effective counseling programs need measurable data to analyze and determine how students are
different because of counseling services. Student achievement in population subgroups and
genders needs focus and attention. Student attendance patterns, discipline and behavioral
referrals render data for program evaluation. Districts would benefit from a comprehensive
assessment and review of the existing counseling services. Based on input from all school staff,
administration, students, and parents, a Pre-K–12 program needs to be implemented.
Districts should define a program and plan for delivering counseling services to all students.
Through the development and implementation of comprehensive policies, procedures, and
processes that drive the counseling program counselors can increase their efficiency and
effectiveness. Board policy needs to articulate processes and procedures for the counseling plan.
The plan’s design should clearly outline the vision, scope, and job responsibilities of the
66 Hadley, H.R. (1988). Improving reading scores through a self-esteem prevention program. Elementary School
Guidance & Counseling, 22, 248-252. Lee, R.S. (1993). Effects of classroom guidance on student
achievement. Elementary School Guidance & Counseling, 27, 163-171. 67 http://www.schoolcounselor.org/ 68 Bowers, J., & Hatch, T. (2005). The ASCA national model: a framework for school counseling programs (3rd
ed.). Alexandria VA: American School Counselor Association.
OSPR – Best Practices Instructional Delivery System
Page 2-67
district’s counselors. The basis of the comprehensive plan should be driven by a focus to
promote and enhance learning for students.
District leaders may consider joining school administrators and counselors from across the state
who participate in the SDE Counseling Consortium. This group of educators focuses on
counseling programs and school issues that are related to students. The Consortium meets to
discuss issues regarding Achieving Classroom Excellence (ACE) implementation, standards-
based grading, use of technology to enhance instruction, the pyramid of behavioral and academic
interventions, professional learning communities, and more. Group members network with peers
to collaborate on what is working and what is not.
The superintendent, principals, and counselors should provide coordinated leadership. They
should take the lead in the planning process, communicating the program and services to
students, and ensuring the program is implemented across the district. They should consider the
following program components when developing a counseling program:
establishment of a teacher advisement program;
adoption of research-based, federally approved curriculums for bullying and drug use
prevention;
creation of a district-wide personal safety, social, and academic skill development program;
establishment of strands for crisis intervention and group and individual counseling for at-
risk students; and
adoption of a schedule for the principal and teachers to meet on a regular basis to evaluate
and refine the comprehensive counseling program and services.
As the comprehensive plan is implemented across all levels, the administrative staff should work
with all stakeholders to evaluate and refine the program components. The plan should be
published, adopted by the board of education, and shared with all faculty, parents, and students.
FISCAL IMPACT
This recommendation can be implemented with existing resources.